Abstract
Based on the assumption that citizens can participate in smart city development, this paper aims to capture the diversity of their profiles and their positioning towards smart city dynamics. The article starts with a literature review of some models of citizens to better understand how they could be portrayed in the smart city era. Considering that there is no “general citizen” and that usual typologies remain restrictive, we construct tailor-made personas, i.e., fictitious profiles based on real data. To this end, we present the results of a large-scale survey distributed to highly educated Walloon people in the framework of a general public exhibition. The profiling focuses on three aspects: (1) perception of smart city dimensions, (2) intended behavior regarding smart city solutions, and (3) favorite participatory methods. The collected answers were first analyzed with descriptive and nonparametric statistics, then classified with a k-means cluster analysis. The main results are five personas, which highlight the coexistence of different citizen groups that think and behave in a specific way. This process of profiling citizens’ priorities, behaviors, and participatory preferences can help professional designers and local governments to consider various citizens’ perspectives in the design of future smart solutions and participatory processes.
1. Introduction
Cities are continually welcoming new urban residents [1] who now represent more than one-half of the total world population [2]. Alongside this population growth, climatic changes and pollution [3] give rise to environmental awareness among governments and citizens [4]. City officials and professionals such as engineers, architects and planners are therefore looking for a new urban model that would ensure an effective city operation despite the demographic and environmental pressures [5]. In the current digital era, the smart city stands out as the next urban ideal [3,6]. Both in theory and practice, the place of the citizens in smart city dynamics is largely discussed. On the one hand, several authors attest that the citizens’ perspective has long been neglected in favor of technological, political, or academic perspectives [7,8,9]. This expert-led and technocentric approach quickly proved itself to be questionable, especially in Western cities, since citizens have the power to reject imposed solutions and technologies [4]. Some authors further argue that the lack of consideration for the inhabitants of smart cities jeopardizes the sustainability of this model, which can only endure if it is accepted and adopted by citizens [10]. On the other hand, other authors emphasize the importance of citizens’ social acceptance and active participation in order to ensure the viability of the smart city model [2,11]. The smart city vision thus progressively evolves towards more human cities, where citizens’ needs and preferences are taken into account in order to design relevant solutions adapted to each urban context [12]. Despite this resurgence in interest for citizen participation and everyday expertise, citizens are still poorly characterized and tend to be modeled in a simplistic and unrepresentative way [13,14]. Recent discourses linked to “smart citizenship” tend to paint a picture of very active, technophile citizens, whereas it is also vital to consider the needs of “real” citizens (the absent and average citizens) who are still excluded from smart city dynamics at present [15]. In general, the literature still contains some gaps regarding who those citizens are, how they perceive the smart city, and how they want to participate in its implementation [15,16,17].
Based on the assumption that citizens can participate in smart city development [4,10,18,19], the aim of this paper is to profile citizens according to their perceptions of the smart city and their participatory preferences. The main research questions are the following: How do citizens perceive the smart city according to its main concepts? How would they like to participate in the smart city context?
Witnessing the trend to reduce inhabitants of the smart city to one single general citizen [15], we explore their multiple perspectives and real attributes through a large-scale survey distributed to highly educated citizens in Wallonia, the French-speaking part of Belgium. Besides basic sociodemographic information, the questionnaire focuses on three elements characterizing citizens: their (1) perception of smart city concepts, (2) intended behavior regarding smart city solutions, and (3) favorite participatory methods. After data processing and analysis, we observe a huge generational effect and some surprising results emerge. In particular, older participants reveal themselves to be more technophilic than intuitively expected in terms of intended behaviors towards smart solutions. Moreover, citizens can, at the same time, place high importance on a smart city dimension and require no smart technology associated with this specific aspect. A cluster analysis is then conducted in order to build five personas of Walloon citizens. Those fictitious but data-driven, representative profiles constitute visual and playful facilitation tools that can be used by designers, city officials, and/or end users during (co)design and (co)decision-making processes. The original contribution of this paper, compared to other studies about citizens’ perceptions [20], mainly lies in its methodology, which can be replicated in other local contexts in order to reintegrate citizens’ perspectives into the development of each unique smart city.
The paper is structured as five sections. In Section 2, we present a literature review about how citizens are integrated and conceived in the smart city context. We identify issues of citizens’ standardization and reduction to the roles they can play in the smart city, rather than an integration of their multi-faceted characteristics such as priorities, behavioral intentions, and preferences. Section 3 then describes the questionnaire-based methodology used to collect 1804 valid answers from the general public of Wallonia. We also present the surveyed sample and detail data processing and analysis, which consists of descriptive and nonparametric statistics and k-means cluster analysis. Section 4 describes the results obtained concerning citizens’ perception of smart city dimensions (Section 4.1), their intended behavior regarding smart city solutions (Section 4.2), and their favorite participatory methods (Section 4.3). Section 4.4 then presents the five personas derived from the cluster analysis and how to use them. Section 5 discusses the results by comparing the obtained profiles with citizen typologies from the literature. Finally, Section 6 concludes this paper and makes final remarks concerning the potential of this research for reproducibility.
2. Theoretical Background
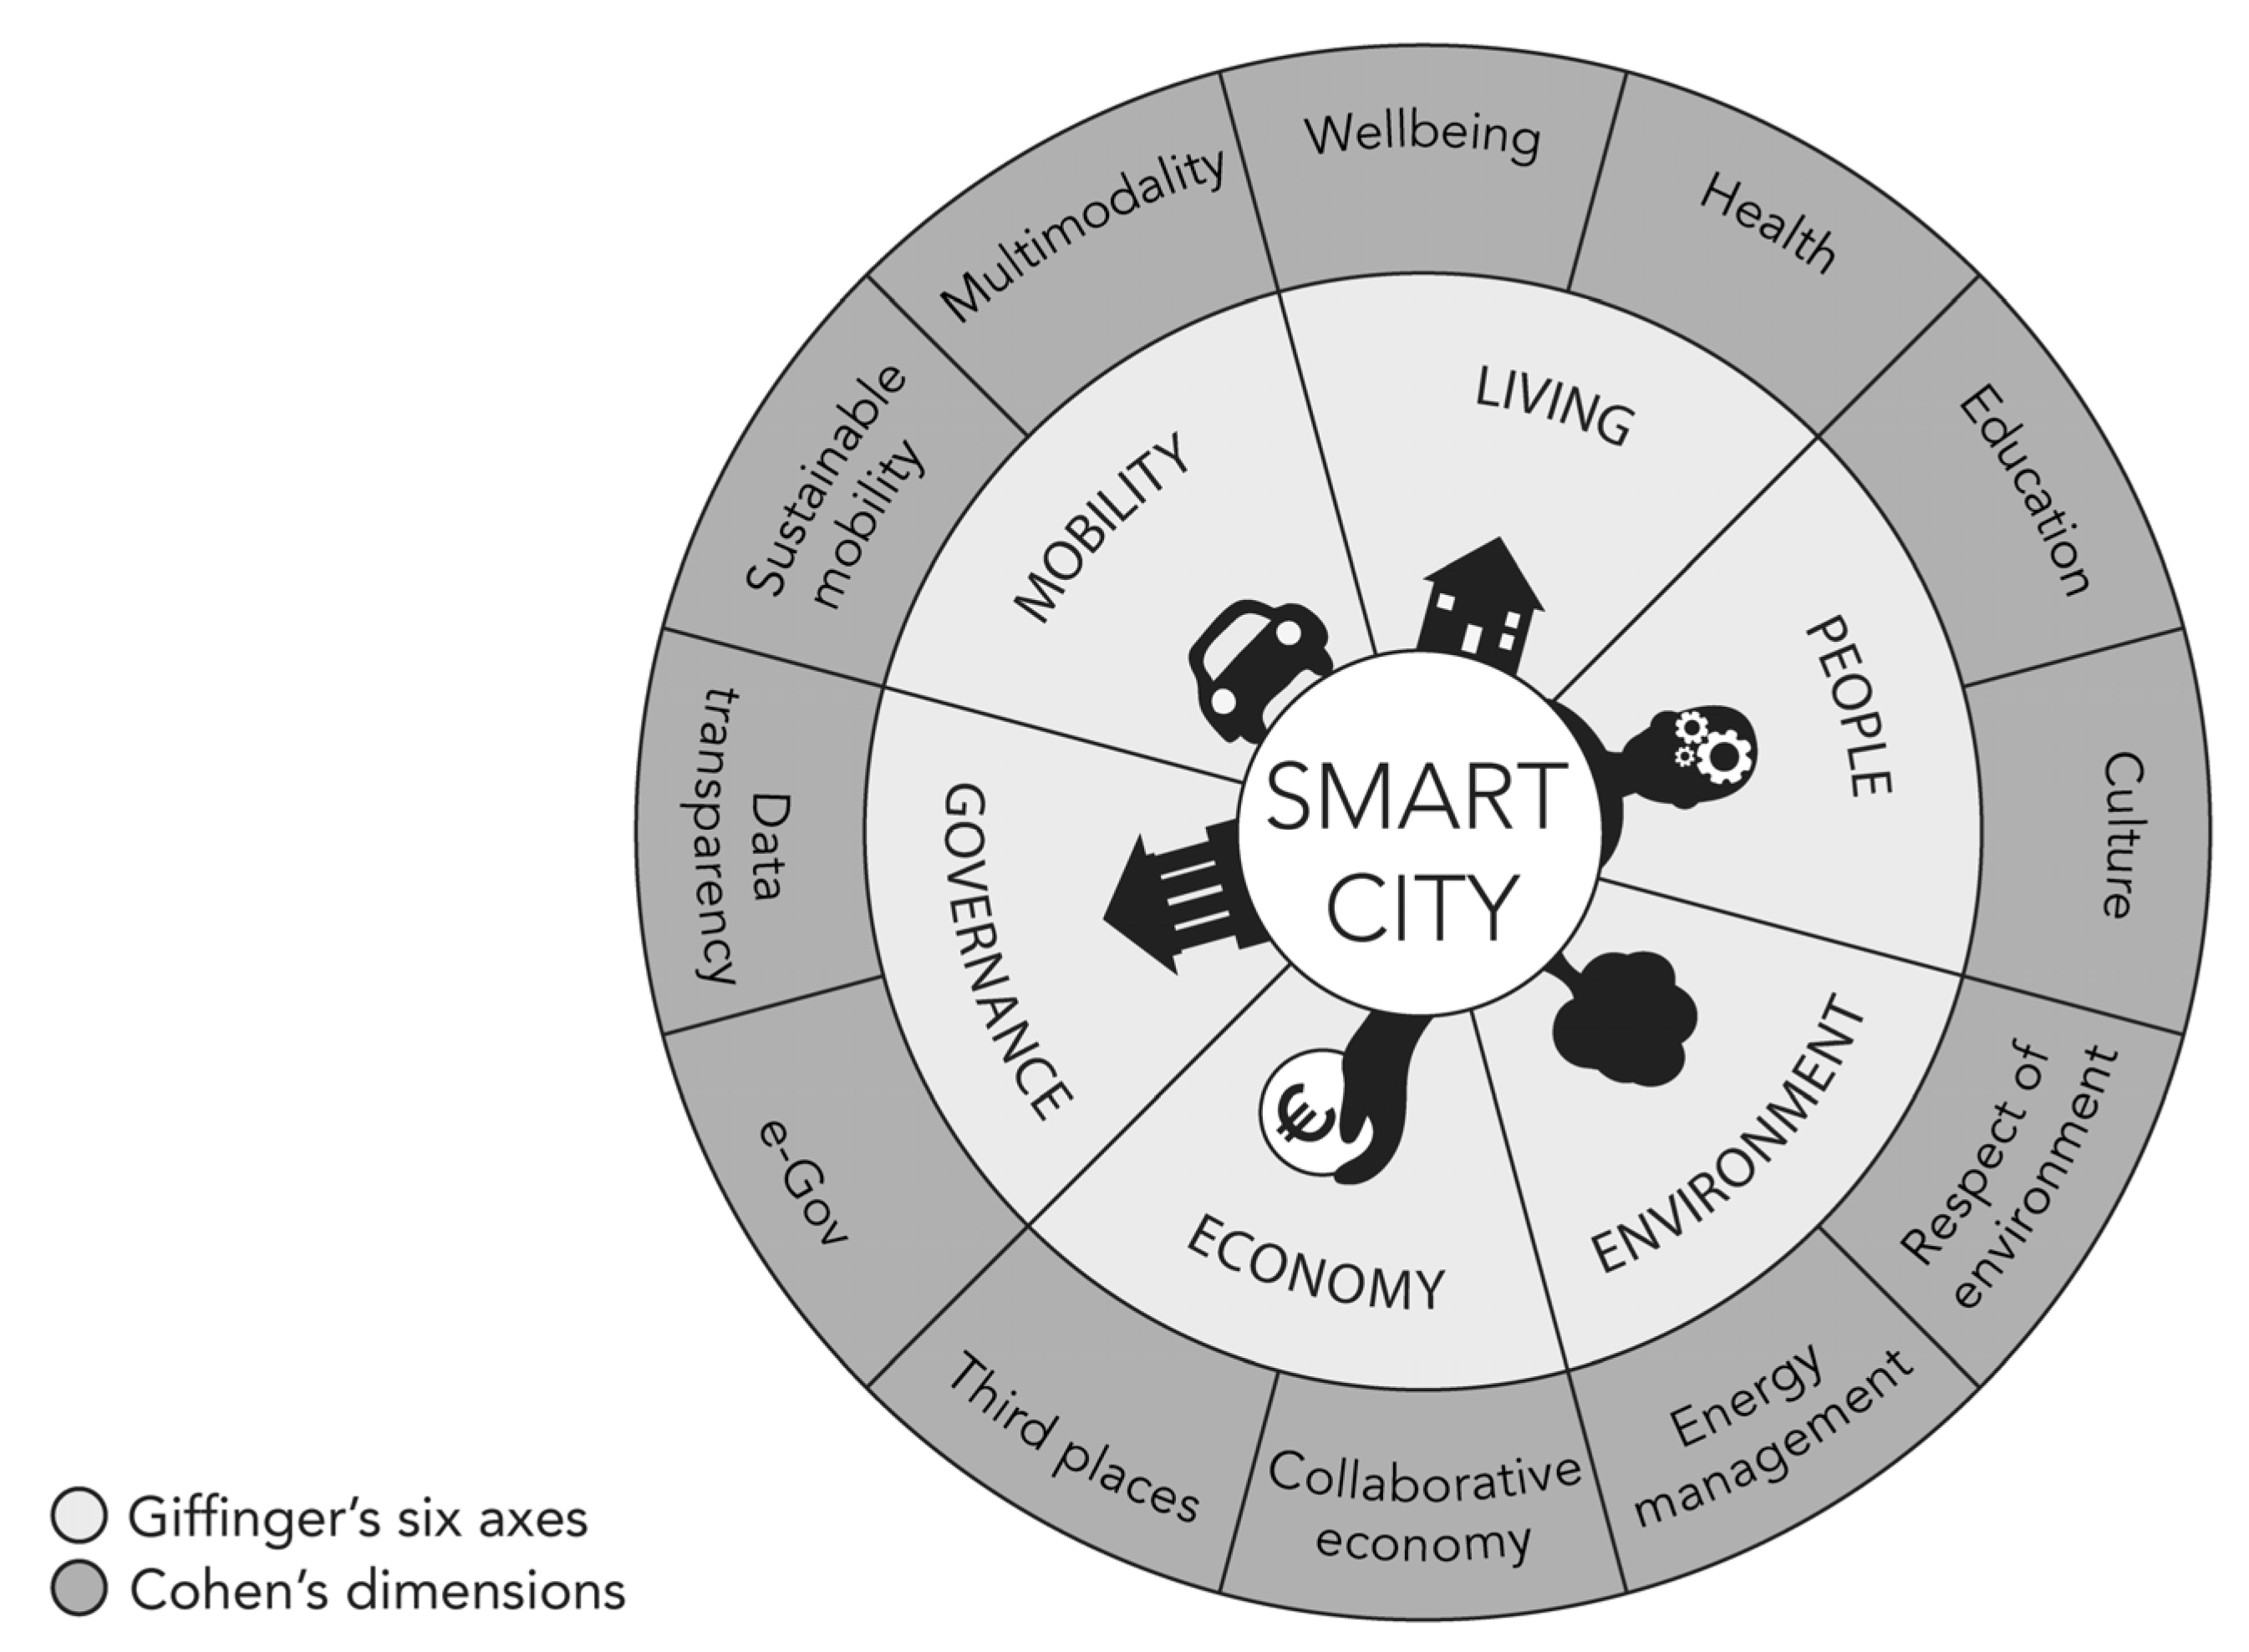
This research aims to profile citizens in the smart city context. Smart city definitions are plentiful [21], but most of them include technological components, while a smaller number focus on human and social dimensions [1]. A recent literature review proposes the following definition: “Smart cities use digital technologies, communication technologies, and data analytics, to create an efficient and effective service environment that improves urban quality of life and promotes sustainability” [22] (p. 1724). Many other interpretations are based on Giffinger’s model [23], which dissects the concept into six characteristics: economy, environment, governance, living, mobility, and people. Those six areas are also subdivided into more precise measurable dimensions assessing the performance of a smart city [24]; see for instance Cohen’s smart city wheel [25]. Some studies explore how the smart city phenomenon and dimensions are perceived by official and professional stakeholders [26,27], and recent research reviews several studies that use surveys to investigate citizens’ perceptions according to, inter alia, those smart city pillars and dimensions [20]. This literature review will rather focus on the profiling of citizens in the smart city. We will first focus on the place of citizens in the smart city model, which has an impact on how they are conceived. We will then explore the different conceptions of the citizens in this specific context.
2.1. The Place of Citizens in the Smart City
The place of citizens is largely discussed in the smart city literature. On the one hand, technocratic literature tends to exclude citizens from the smart city. According to several authors, smart technologies are sometimes imposed as ready-made solutions in a top-down manner and replicated in every urban context [5,28,29]. The city thus becomes a generic object where all local specificities and citizens’ real needs are ignored [30,31]. This technocratic and neoliberal approach envisions inhabitants as “passive consumers” or “recipients”, and runs the risk of not achieving enough social acceptance [32,33]. On the other hand, citizen-centered literature seeks to include citizens in the smart city. Some authors point out that citizens actually play a key role because they can choose to adopt or to reject smart city solutions, in turn either fostering or endangering the durability of the smart city model [10,34]. They argue that citizens are much more than “data points” or “walking sensors” and can instead be valued as “a source for ideas” through the co-design processes of smart urban environments [4,14,16].
Considering citizens’ undeniable influence on the success or failure of the smart city, this bottom-up model of the smart city is growing and conveys the idea of more-aware, active, and empowered citizens who can share their experience of their living environments and take part in the development process of their smart cities [4,35,36]. Nevertheless, the literature still highlights the lack of citizen perspective in past and ongoing smart initiatives, which remain essentially technology-focused and disconnected from citizens’ everyday concerns and perceptions [37,38,39]. Participatory and co-design processes can help to obtain a deeper understanding of citizens’ needs, priorities, lifestyles, and behaviors, and to develop relevant solutions adapted to each local urban context [10,12]. This increasing attention on citizen participation in the smart city, however, raises a question that is currently rarely addressed: who are those “citizens”? [16]. Indeed, compared to other smart city aspects, such as technical and economic development, little effort has so far been devoted to researching and understanding citizens’ perspectives in the smart city [7,9]. This issue is emphasized by the prevalence of simplistic models of citizens: the unrepresentative general citizen and other restrictive typologies, as further developed in the following subsections.
2.2. The General Citizen
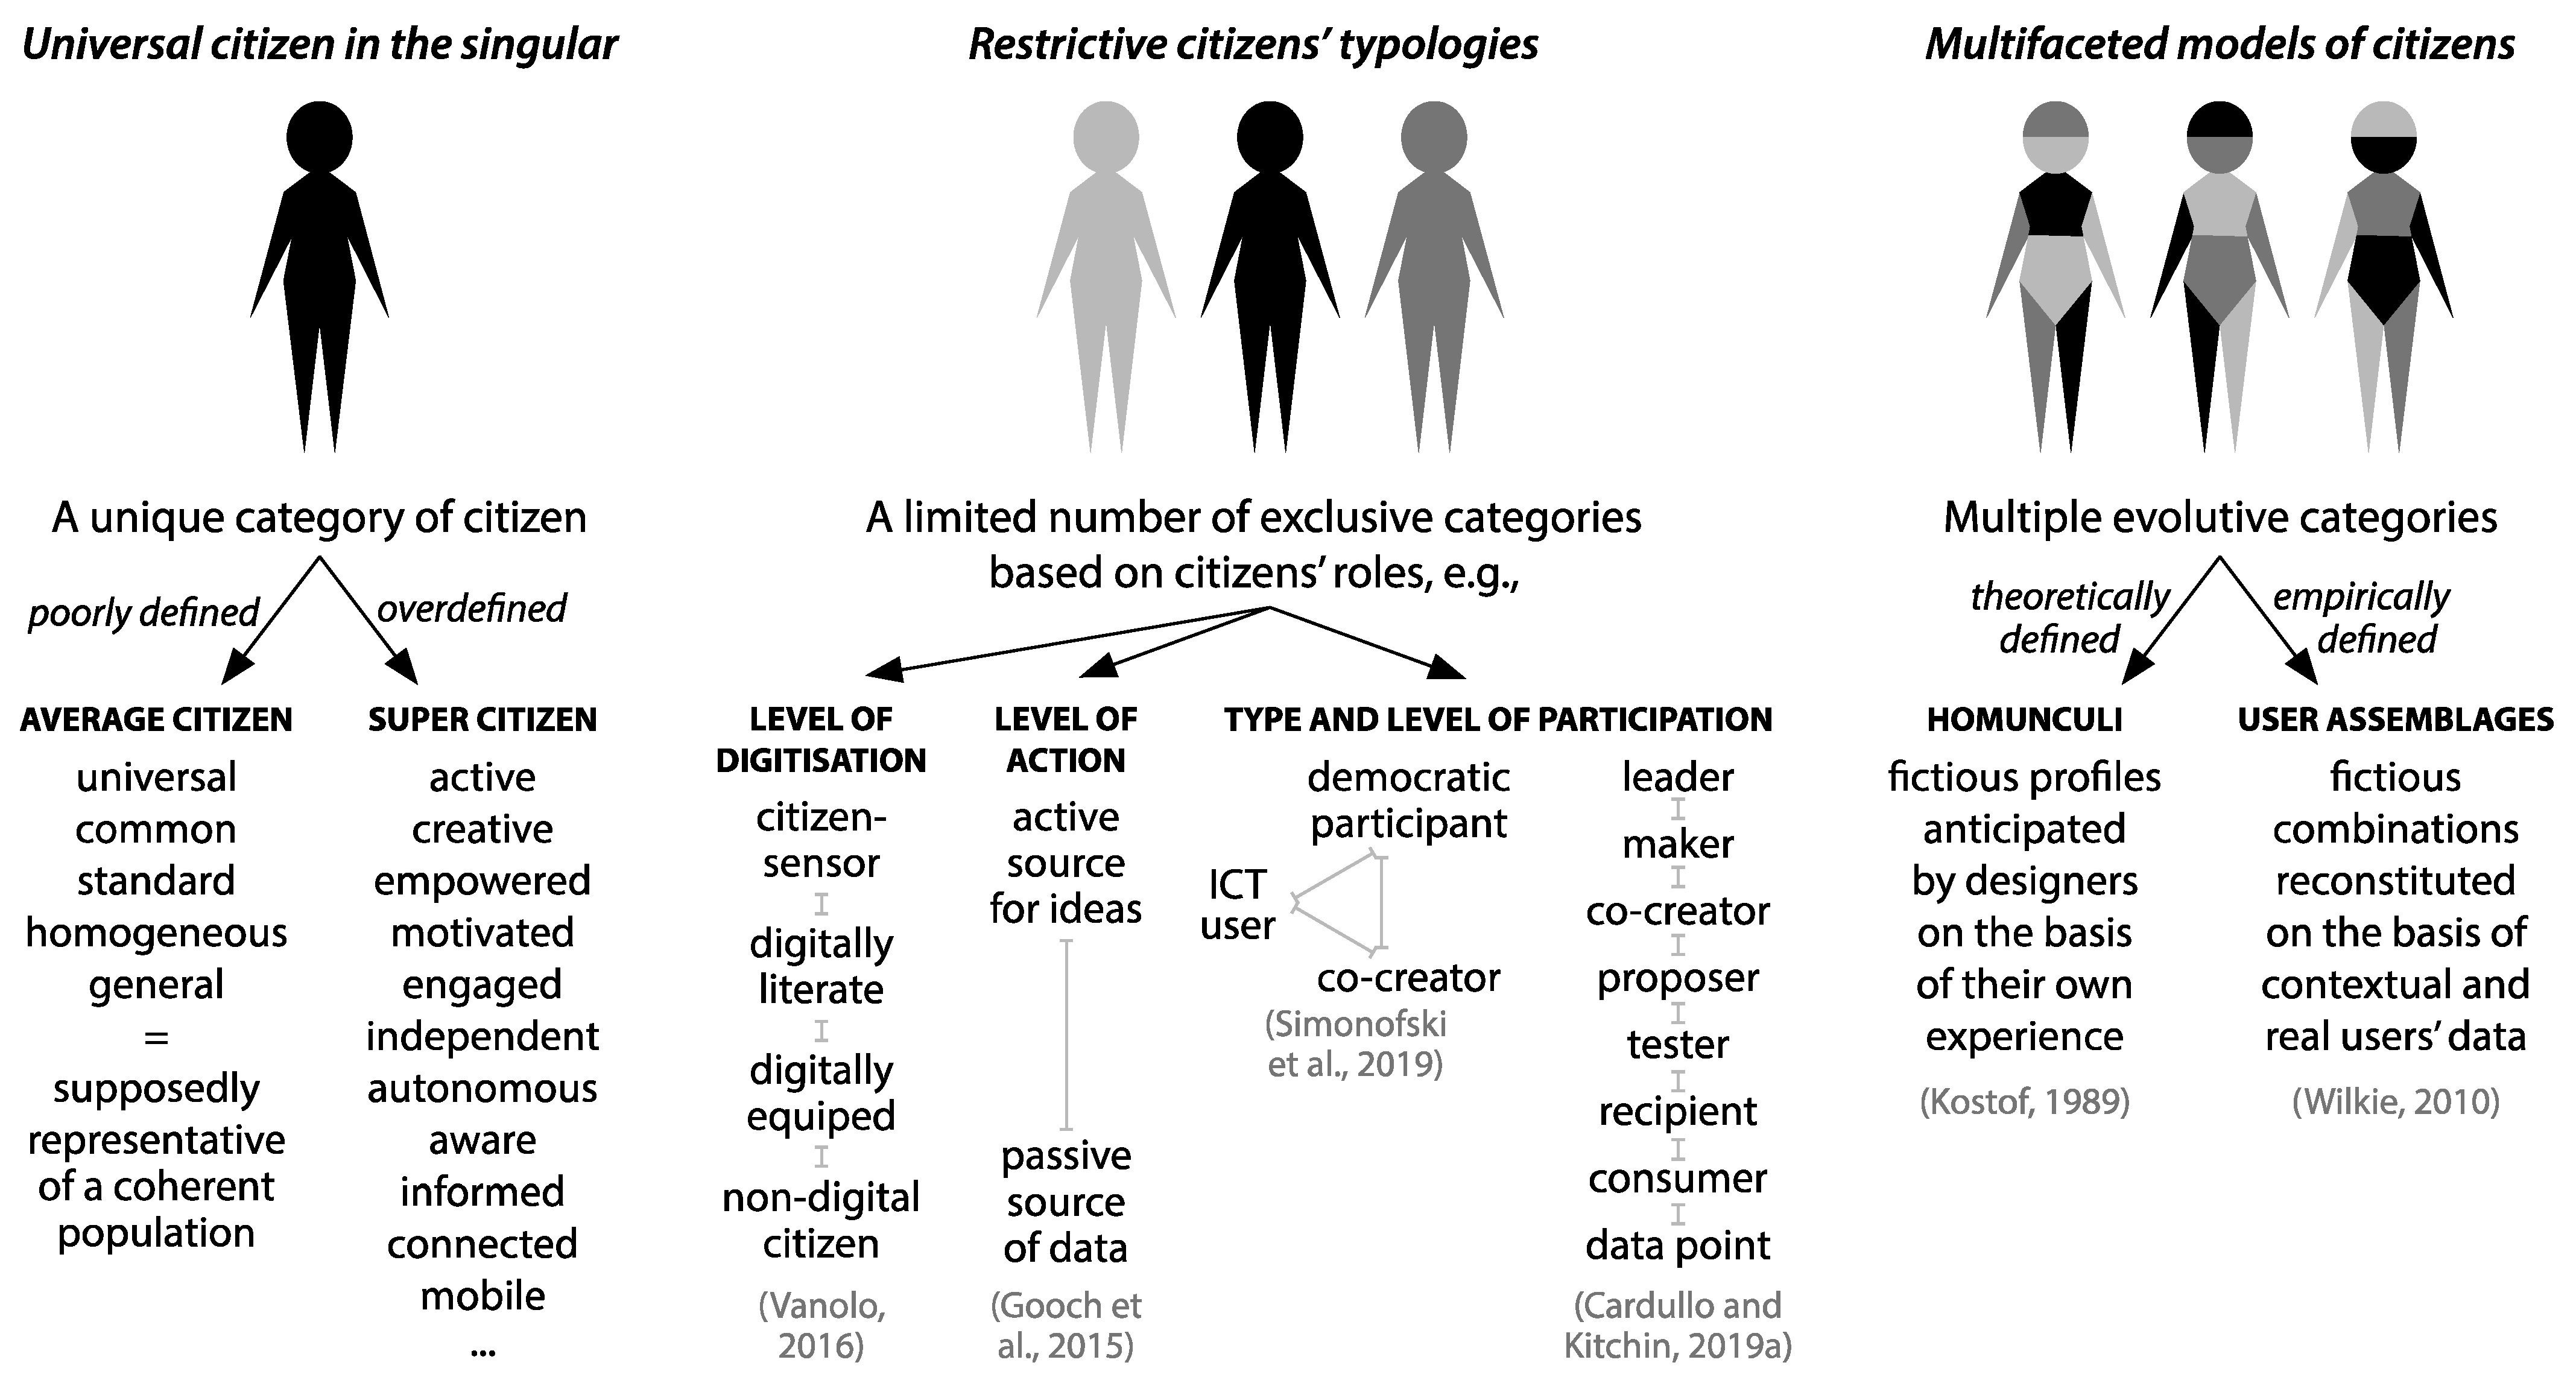
The smart city discourse is marked by the recurrent use of the term “citizen” in the singular as if there was “an” average citizen, representing the whole diversity of the urban population [15]. Consequently, inhabitants are envisioned as a homogeneous group with standard needs and common characteristics, rather than personal specificities and experiences [14]. This tendency towards end users’ universalization is frequent during innovation processes, and particularly significant in the smart city where citizens are kept at a distance [14,40]. This reduction of the population to a unique general user even becomes an opportunity for decision makers to claim the inclusive nature of their smart initiatives, since taking “everybody” into account excludes no one in particular [15].
Actually, the “general citizen” is far from being an inclusive conception and “is largely framed as white, male, heterosexual, ablebodied and middle class” [41]. In the design field, the figure of the general user is also given characteristics that are ultimately quite un-generalized, to the point that it becomes a kind of superuser: “a six-foot-tall, 20-year-old man with perfect vision and good grip” [42,43]. Yet, citizens should rather be considered as multiple, subjective, and composite beings [14]. This diversity is probably the greatest quality of collective intelligence, which can then claim to exceed individual intelligence [21]. The stereotype of a general citizen still dominates the smart city discourse, notably because it is easier for decision makers to justify their participatory actions if there is only one type of citizen to solicit, which is moreover undefined [15].
Current smart initiatives thus often fail to consider the great diversity among citizens, at the expense of the technologically illiterate or the elderly, for instance [44]. Nonetheless, there is no such average, universal, or general user of the smart city, and each one is, or will be, inhabited by multiple citizens with their own wants and preferences [45]. Beyond the idea of a connected and mobile population, citizens’ profiles and characteristics could determine the kind of smart city projects that should be prioritized to fit users’ specificities and meet their needs.
2.3. Restrictive Typologies of Citizens
Considering that citizens cannot be regarded as a single individual nor as a coherent and uniform population [14], some typologies are developed to better reflect citizens’ variety in the smart city. First, citizens can be qualified according to their level of implication, ranging from passive and subordinate subjects to active and involved stakeholders [4]. Then, citizens can be defined through the roles they can play in the smart city, such as democratic actors, co-creators, ICT users [46] or makers, testers, or consumers, for instance [16]. Finally, they can be characterized depending on their familiarity with technology, be they experienced hackers, basic users, or technological illiterates facing the digital divide [14]. Those various categorizations are originally well-intentioned and aim at integrating multiple citizens’ profiles into the smart city. However, those classifications remain quite restrictive since inhabitants are generally divided into a limited set of mutually exclusive categories. Moreover, these typologies tend to associate a positive or a negative connotation to the various roles and positions assumed by the inhabitants.
In this context, “being a citizen in a smart city does not necessarily make one a ‘smart citizen’” [15] and citizens are only called “smart” if they are “autonomous, independent, and aware” [23]. This image of an active, informed, motivated, responsible, hyperconnected, and creative citizen seems to be progressively prevailing for the participatory development of the smart city [24,47]. Despite the laudable intention to give citizens a real place in the smart ecosystem, not all citizens will fulfill all the qualities of this “super citizen”. This optimistic depiction of citizens thus tends to hold them accountable for the success of the smart city and, at the same time, relieves policymakers of some of their obligations [44,48]. This vision of a super smart citizen furthermore strengthens the idea of an unrepresentative citizen in the singular and calls for a more realistic and pluralistic vision of citizens [15]. It is crucial to broaden the spectrum of smart city citizens to include non-participants, digital illiterates, protesters, uninterested people, etc. (Vanolo, 2014). Therefore, our research does not focus on “smart citizens”, but considers citizens’ various needs as well as their possible willingness to be passive towards the decision-making mechanisms that are making the city of tomorrow. Indeed, citizen participation is a wide field offering endless possibilities using various methods and techniques [49,50] that participants can evaluate favorably, without interest or even negatively according to their personal preferences [51].
2.4. Multi-Faceted Models of Citizens
Citizens’ generalization is a common phenomenon in the fields of design and innovation, where proposed typologies are generally limited to theoretical models lacking concrete and contextual information about end users [40]. In the smart city context, we observe the same limitations about the aforementioned typologies and models of citizens. The figures of citizens as “co-creators”, “hackers”, or “consumers”, for example, are in reality roles that are assigned to them within the smart city. These are therefore fictitious images, anticipated by the city’s decision makers and designers, but which probably do not reflect the citizen reality, which is more multiple in its essence [34]. City users are not only defined by the status they are assigned to, but also by their identities, desires, wishes, and aspirations [14]. The vision of the citizens of the smart city is therefore, for the moment, essentially theoretical and lacks empirical material based on socio-demographic data.
Through the literature, we still identified two realistic models challenging citizens’ reduction to a general being. First, “homunculi” are ever-changing imaginary users, which are conceived from scratch by professional designers when they cannot gain access to real users [52]. This vision of citizens is still restrictive because it relies on designers’ own experiences and may overlook different perspectives, but it also demonstrates designers’ will to empathize with users who are attributed multiple and evolutive characteristics [43]. Second, “user assemblages” are sociotechnical combinations of users’ multifaceted qualities and particularities [53]. Each citizen is no longer considered as a fixed entity, but is decomposed into several characteristics that are then recombined in order to reconstitute other fictitious users [54]. In both cases, there is no a priori model or predefined categories of users, but successive dynamic models that are built on the basis of several profiles of real users and articulated according to the issue at stake.
Figure 1 summarizes the various citizens’ models presented through this literature review.
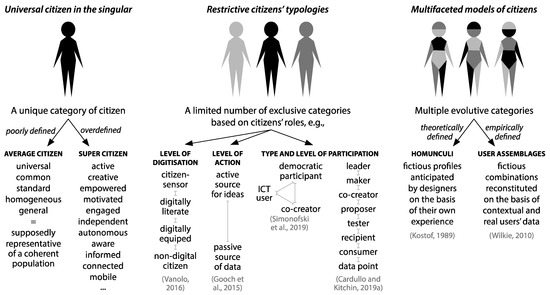
Figure 1.
Various possible conceptions of the citizens in the smart city [4,14,16,46,52,53].
3. Methodology
Considering the need to build representative citizens’ profiles, this research aims at developing personas, i.e., fictitious profiles based on real data. A questionnaire-based methodology was conducted to collect Walloon citizens’ data, which were analyzed through descriptive and nonparametric statistics. We finally conducted a cluster analysis to build five personas, considered as “user assemblages” of the whole surveyed sample.
3.1. Data Collection
The methodology used to conduct this research was a general public survey. The survey was distributed in the framework of an exhibition called “I will be 20 in 2030”, organized in Wallonia. This Belgian region is located in the center of Europe and established a program for the digital and sustainable transformation of cities in 2015. The exhibition, just like our data collection, lasted approximately 8 months from 2017 to 2018. This event was organized by a company called Europa Expo, which has presented a new exhibition, on average, each year or every two years for over 25 years. The theme of this edition was the “near future” and it invited the visitors to project themselves as they would be in 2030. The previous events were not necessarily technology-oriented but addressed various topics such as “Golden sixties”, “SOS planet”, or “14′18′′ (WWI). Those exhibitions generally attracted a large audience, especially of families and schools.
The survey was distributed via an interactive booth, which was situated in an exhibition room devoted to future urban design. In order to encourage the visitors to carefully answer the survey to the end, we organized a lottery among participants who correctly answered two additional questions. Moreover, the survey was designed in such a manner that the participants’ answers were directly processed to provide them with their “smart citizen profile”. Just like the personality tests in magazines, the respondents could immediately discover which profile they obtained among three main pre-defined attitudes: (i) techno, i.e., an attitude mobilizing the use of a technology; (ii) cautious, i.e., a more traditional attitude requiring no technology at all; or (iii) moderate, i.e., an intermediate behavior between the previous two, sometimes involving an eco-responsible attitude. Those three potential profiles were validated afterwards by the participants themselves through the last question of the survey. Our results show that 93% were convinced that the suggested profile suited them well. However, those three simplistic profiles should not be confused with the five personas formed from the survey results and developed at the end of this paper.
Since the goal of this paper is to profile citizens who are key participants in the development of the smart city, the survey includes four types of questions: (i) demographic questions (age, gender, living environment, professional status, professional field, and level of education); (ii) perception of smart city dimensions; (iii) intended behavior regarding digital/analog solutions; and (iv) favorite participatory methods.
Questions (ii) and (iii) are both based on Giffinger’s characteristics and Cohen’s dimensions. Cohen defines three factors according to Giffinger’s characteristics and the 18 factors are in turn characterized by a total of 62 indicators. Among all the possibilities, we selected two dimensions by characteristic while ensuring that they remained close to citizens’ daily life (Figure 2). This selection is based on an analysis of the keywords used among the factors and indicators formulated by Cohen on the basis of Giffinger’s characteristics. For instance, regarding the “environment” characteristic, we chose “respect of the environment”, i.e., individual eco-consciousness (cf. Cohen’s “carbon footprint”) and home “energy management” (cf. Cohen’s “residential energy use” and “homes with smart meters”), while we neglected aspects related to sustainable urban planning or commercial buildings, for instance.
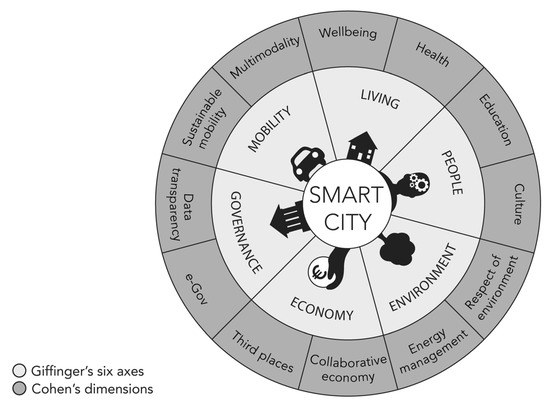
Figure 2.
Giffinger’s six characteristics and Cohen’s twelve dimensions studied in this research.
Type (iii) questions refer to smart solutions and technologies that are presented in the literature and associated with Giffinger’s and Cohen’s dimensions [12,55,56]. For our study, we only selected a limited number of smart solutions that are dedicated to citizens and we sometimes illustrated them with a local example that respondents could relate to. For the multimodal dimension of smart mobility, the chosen technology was the “journey planner” [55] or the “mobile app for multi-modal transport information” [12], and, more specifically, “NextRide” (renamed “SmartMobilityPlanner”), which is a mobile application to accompany Walloon public transport users.
Question (iv) focuses on respondents’ favorite participatory methods. Given the huge diversity of participatory methods [50], our selection was made on the basis of two criteria:
- The first criterion is the digital versus analog nature of the participation. We chose a mix of both analog and digital possibilities, the latter being more and more popular in the smart city era [57]. This information is available between brackets in Table 1.
 Table 1. Characterization of the selected participatory methods.
 - The second criterion is the level of citizen involvement. We ensured the covering of the whole IAP2 participatory spectrum, which provides different levels of citizen engagement [58]. This information is used to categorize the methods in Table 1.
Once the structure of the questionnaire was ready, we conducted pre-tests with twelve citizens (two per age group). The pre-testers’ feedback mainly highlighted some issues with wording and layout that were easily solved.
Despite these precautions, our study has several limitations. First, the theme of the exhibition has a futurist and techno-centric connotation, which potentially leads to an overrepresentation of technophilic people and an underrepresentation of people who are more reluctant regarding the adoption of smart technologies. Our results show that the respondents are indeed fairly favorable and optimistic towards smart city solutions. We are conscious that our sample is not fully representative, but the success of the previous editions and the general public orientation over time undoubtedly encouraged the presence of less-informed people or those less interested in this specific “smart” topic. Second, the exhibition was localized in the city of Liège, which could also have limited the representativeness of the sample. Even though we know that the event attracted people from all over Wallonia, there was still a large proportion of local visitors (46%). However, Liège is the largest Walloon conurbation in terms of inhabitants and is a medium-sized city with challenges that are similar to those of other central European cities. A third and last limit of our survey is the social desirability bias [59]. Despite our efforts to be neutral, the participants may perceive some answer options as more desirable than others. The risk is that respondents might refrain from choosing a solution that would be badly judged by their peers. Therefore, our results only present intended behaviors that participants would adopt in 2030, but do not (necessarily) reflect their real attitudes nor certify that they will eventually act as stated.
3.2. Sample Description
Among the 93,672 visitors of the exhibition, 2% answered the survey and 1804 valid answers were collected. The sample is representative of the Walloon adult population in terms of age, gender, living environment, and professional status. Some professional fields are, however, overrepresented, particularly computing and telecommunications. Moreover, the sample is characterized by an overrepresentation of people with a high level of education. This is a bias that we will keep in mind, considering our target population as highly educated Walloon people. Thus, people who completed the questionnaire are potentially better informed and more aware of environmental and technological issues, and may be more open to smart city solutions than the average population.
For more information, detailed demographic characteristics of the sample can be found in Appendix A.
3.3. Data Analysis
Data processing was carried out in Excel (version 16.76), followed by data analysis using STATISTICA (version 13.3) for non-parametric statistics and XLSTAT (version 2021.3.1) for k-means cluster analysis.
We first performed the Shapiro–Wilk test to assess the normality of the variables. None of our variables were normally distributed; hence, only nonparametric tests were used according to the nature of the variables as illustrated in Table 2. Each non-parametric test studied the relationships between two given categorical variables (Variable 1 and Variable 2 in Table 2), which could be of three different types: binary (e.g., gender), nominal (e.g., professional field), or ordinal (e.g., rank of one smart city dimension, from 0 “not important” to 3 “very important”). Note that two variables, age group and level of education, were considered both nominal and categorical.

Table 2.
Nonparametric tests used to provide statistical results.
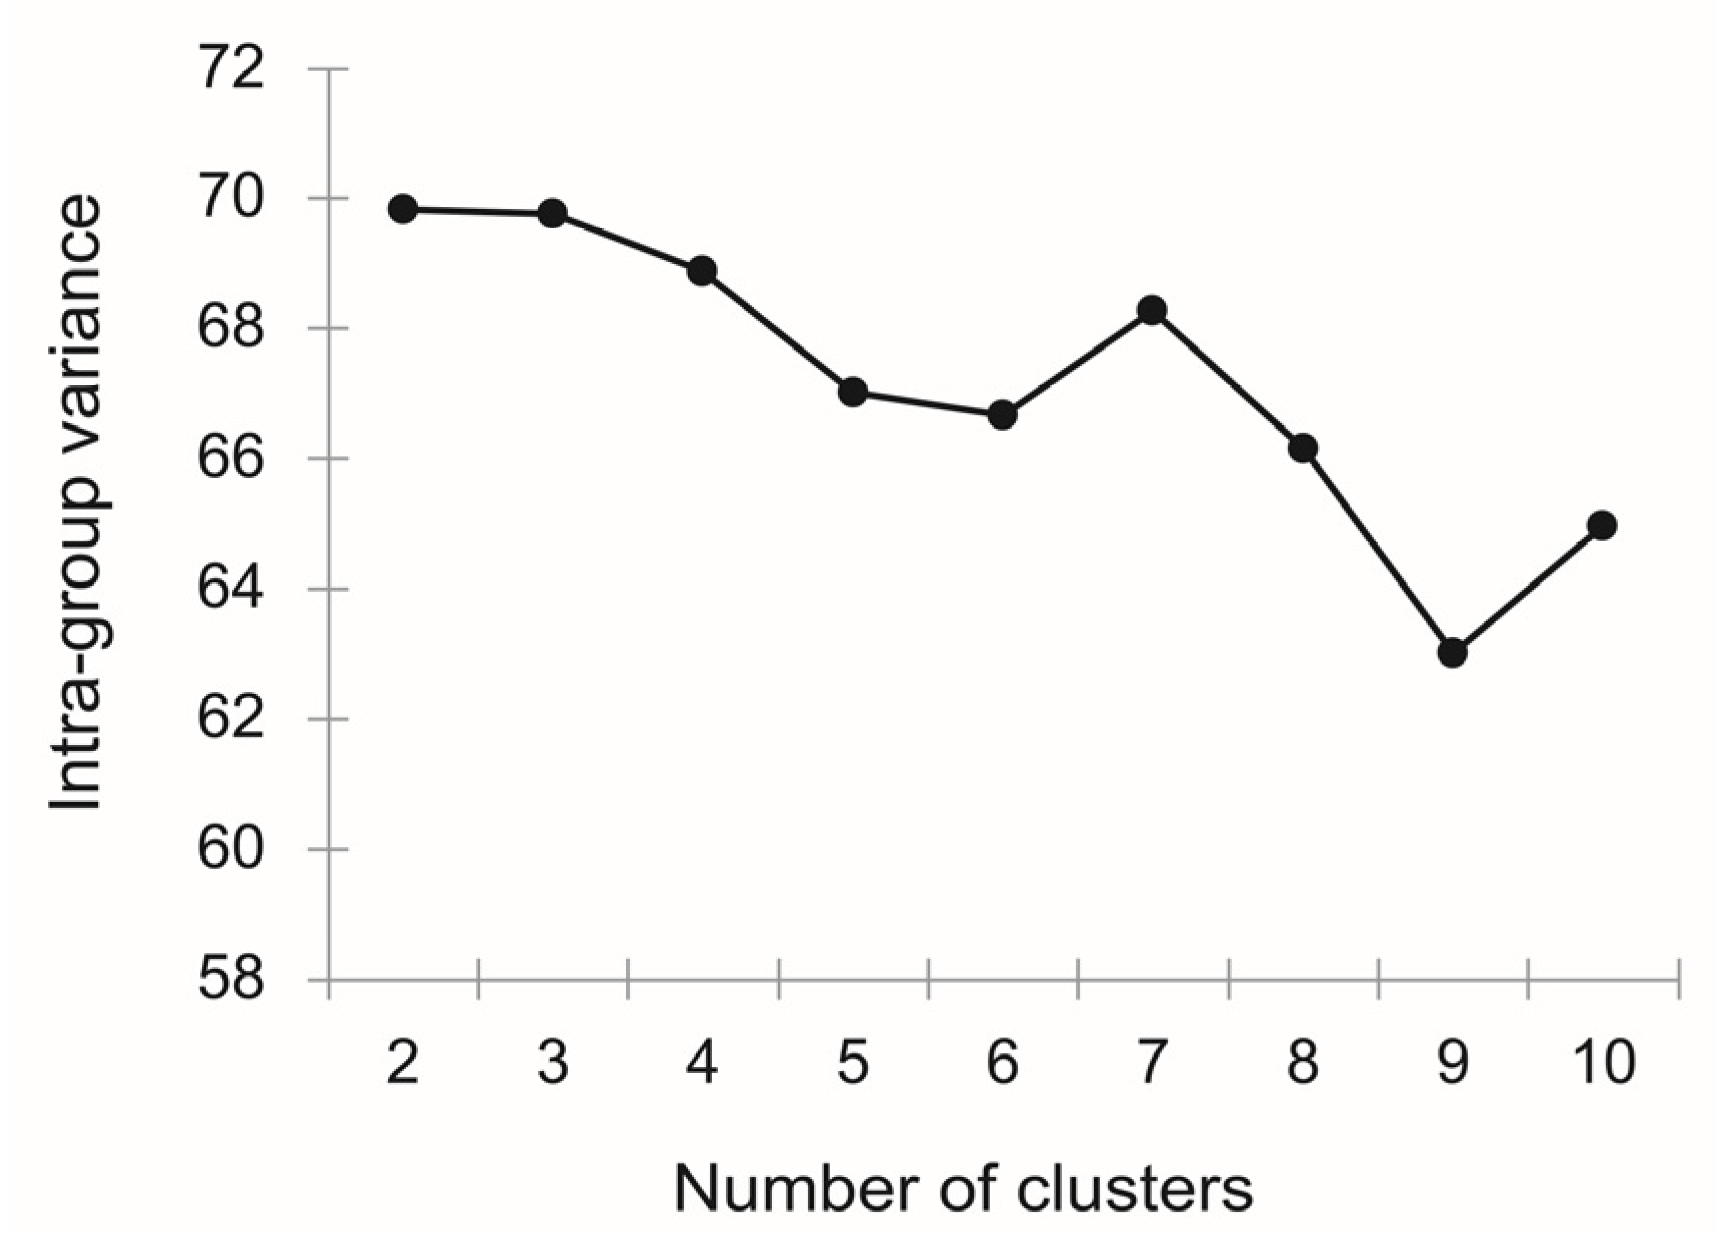
The next step of our data analysis was a k-means clustering to develop natural citizens’ profiles by minimizing the sum of the squared error of the distances inside each group [60]. We chose this non-supervised classification method because the number and the nature of the groups were initially unknown [61]. The dataset is smaller than before because we only analyzed the full answers (n = 850). We applied the k-means algorithm to all variables, which were normalized and weighted so that each question from the survey had the same impact on the analysis. As we had a mixed dataset, the nominal variables were converted into binary variables [62]. We used the “elbow method” to visually determine the number of clusters; Figure 3 shows a local minimum for five groups, which is the optimal number of clusters [63].
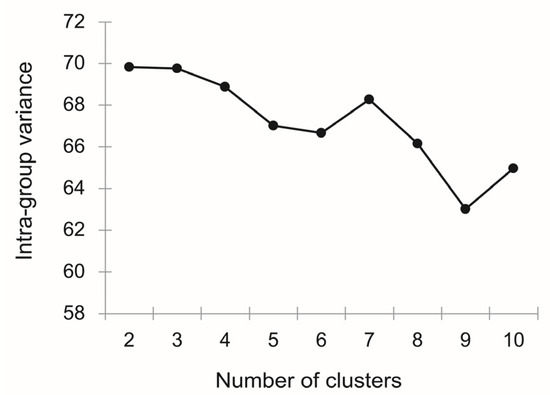
Figure 3.
Evolution of the intra-group variance according to the number of clusters.
Each cluster is defined by a centroid, which is a fictious point calculated as the center of the group. In our case, the five centroids are thus used to design and characterize our “personas”. A persona is a fictional and caricatural user profile elaborated from real data in order to capture the characteristics of a target group of users [64]. Following the k-means clustering analysis, each of the five clusters was used to build one persona, which was naturally derived from the data. Its attributes (socio-demographic profile, ranking of smart city dimensions, intended behaviors towards smart solutions, and favorite participatory methods) correspond to the centroid of the cluster.
The resulting descriptive card makes it possible to quickly visualize the main results of the survey and to present them in a playful and visual way. The design of visual artefacts has already proven to be useful in the smart city context, in order to understand the multiple perspectives of different stakeholders involved in complex urban projects [65]. We envision the personas will be efficient tools to help experts through the early phases of the design process of a smart solution and/or during participatory approaches with lay users.
4. Results
4.1. Perception of Giffinger’s and Cohen’s Smart City Dimensions
The literature review informed us that the smart city is commonly defined by six characteristics into which a form of intelligence (technological or collective) can be introduced. Those six areas of urban activity are theoretically on an equal footing, even if we can assume that each context, each city, and each population have their own priorities. Therefore, we are interested in participants’ ranking of smart city aspects.
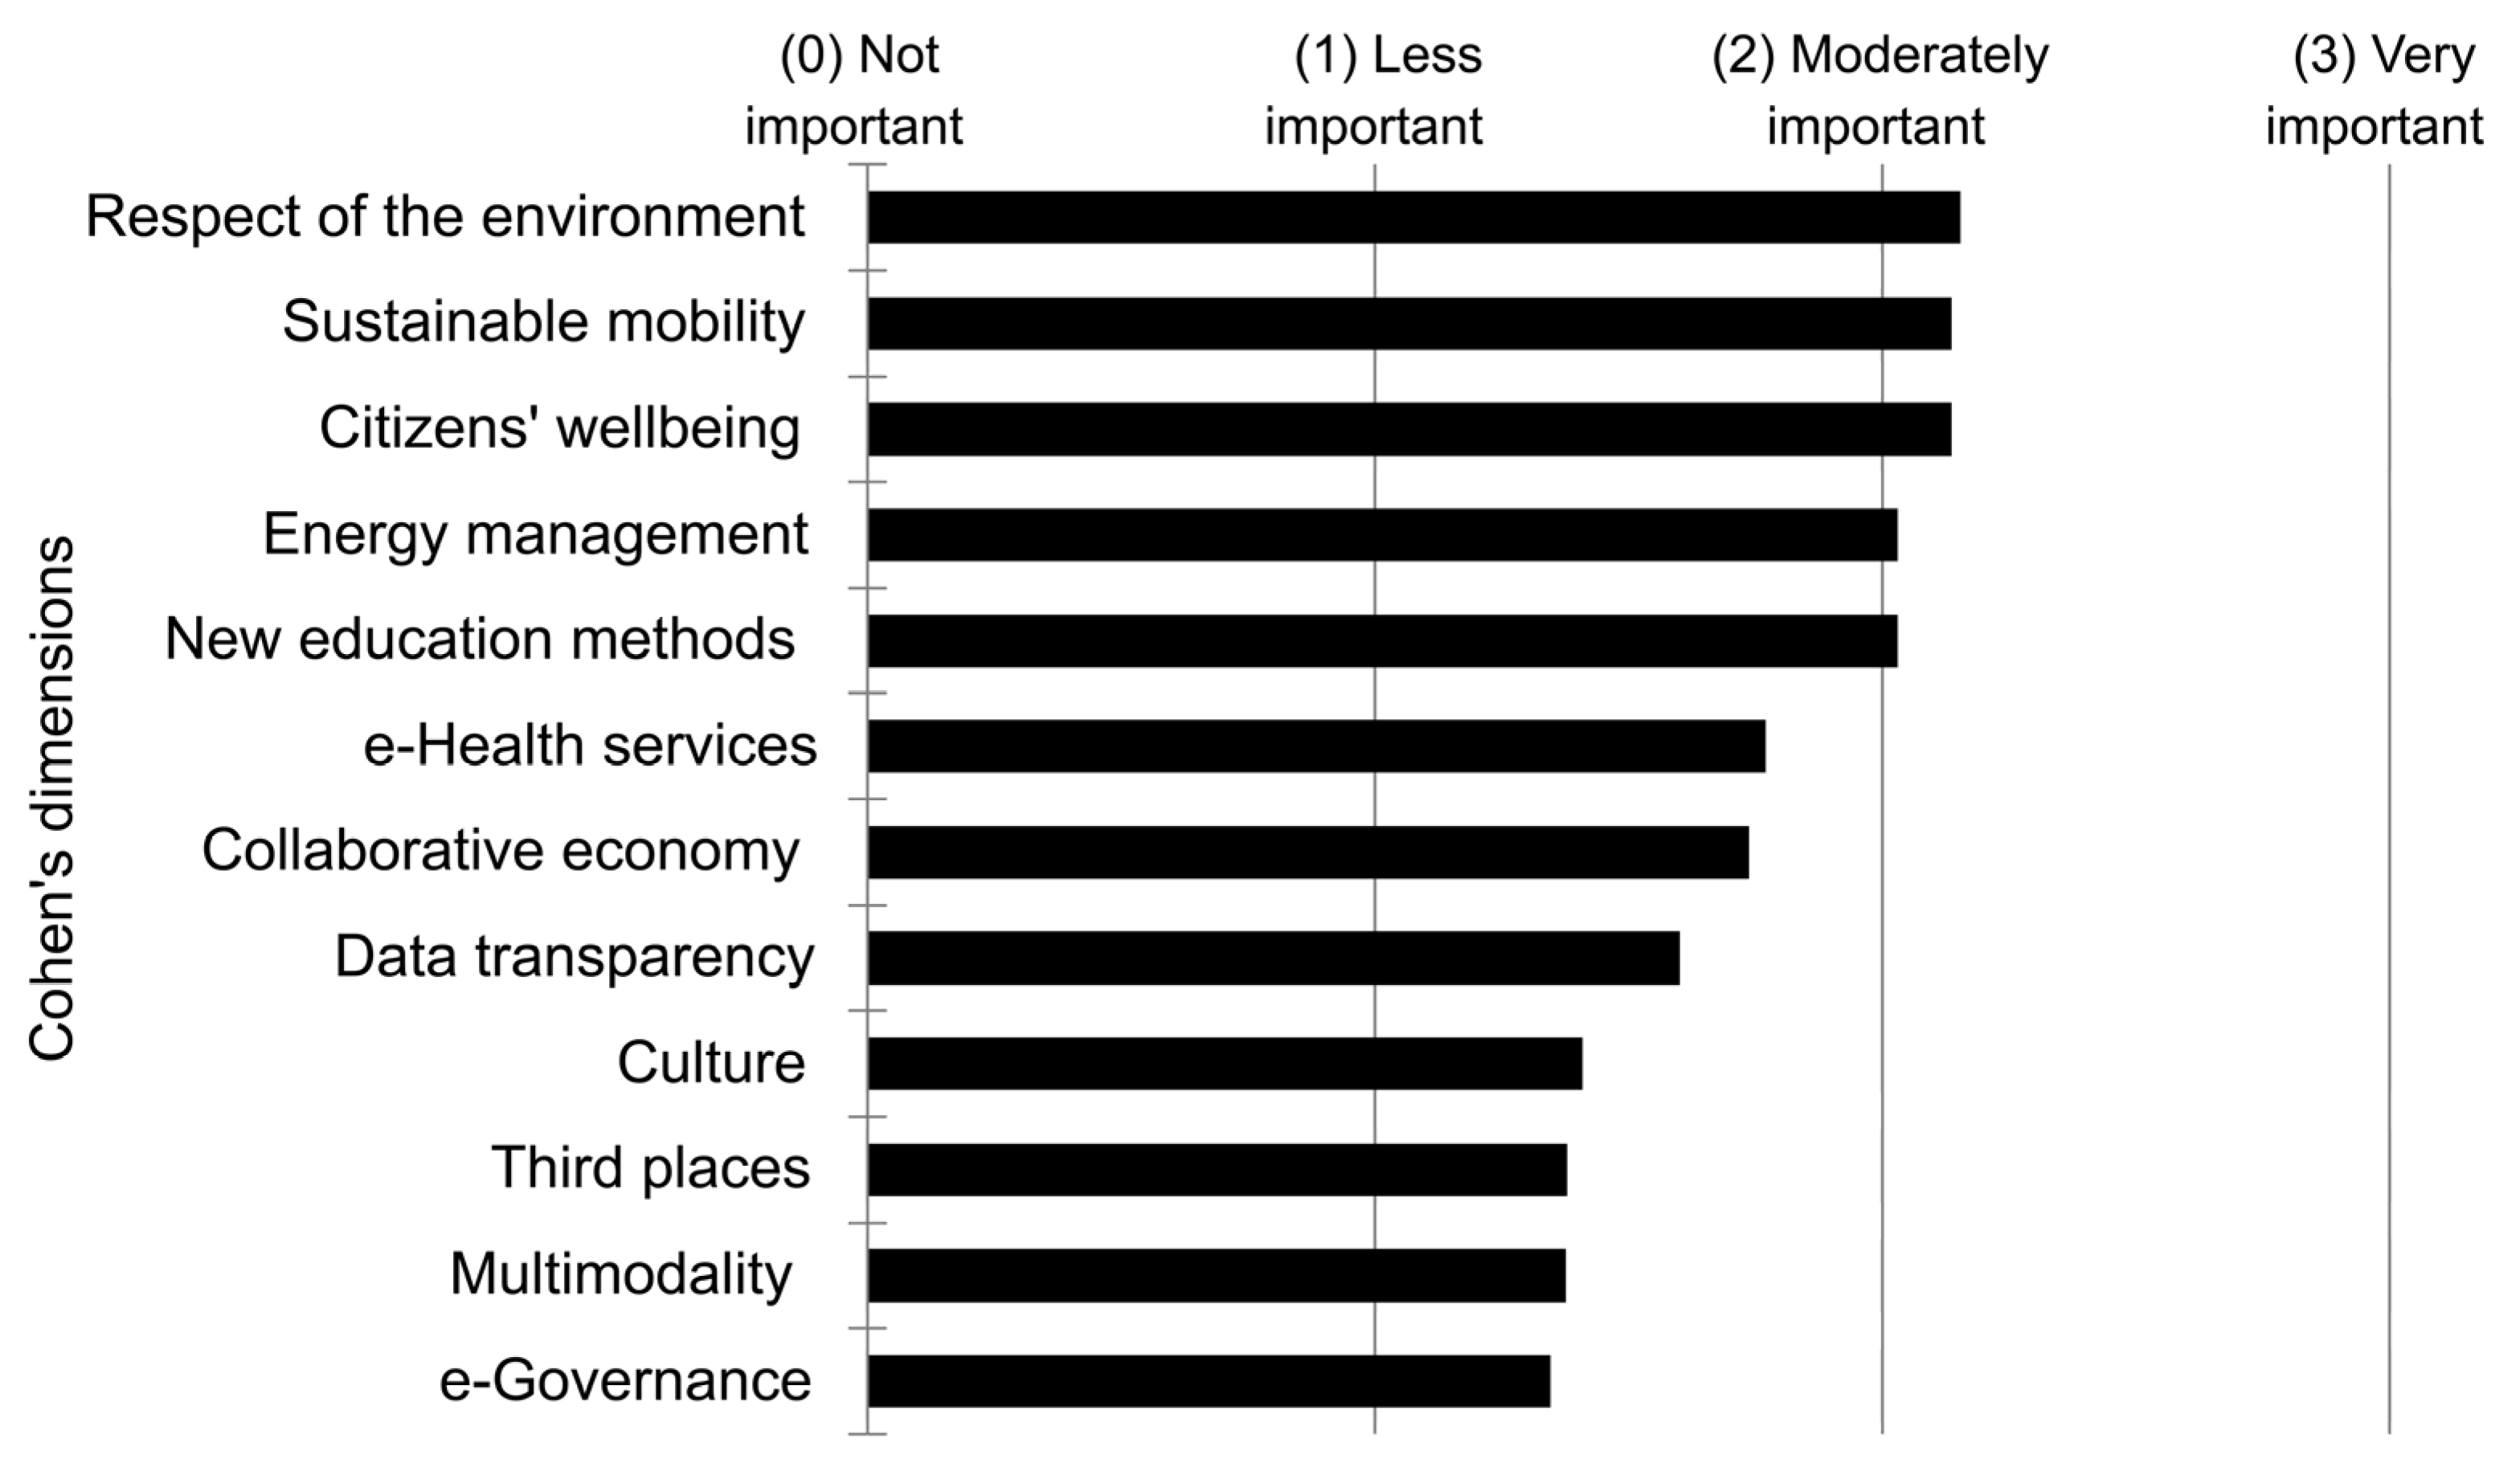
However, Giffinger’s characteristics remain somewhat generic and previous research demonstrated that citizens tend to understand and interpret them differently [66]. Consequently, we asked the respondents to rank more specific concepts, i.e., additional dimensions coming from Cohen’s smart city wheel. Surveyed people had to sort the twelve dimensions into four categories by order of importance.
Figure 4 shows that the environmental characteristic of a city is the most important according to the respondents, while the “governance” dimensions tend to have a low rank. The obtained ranking, moreover, reveals some variations inside each characteristic. For instance, the sustainable mobility is considered highly important while the multimodal mobility takes the second last place of the ranking.
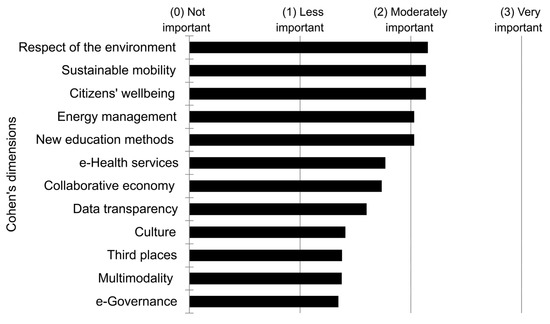
Figure 4.
Respondents’ ranking of 12 smart city dimensions (n = 979).
This average ranking is interesting because it can be used to illustrate the general trends and to set priorities when implementing a smart city approach in the Walloon context. The results show that some elements are very important for the citizens and should be addressed first. Given that citizen participation is a resource-consuming process, people should preferably be involved when the topic closely concerns and interests them. We therefore assume that citizens are more likely to engage in participatory processes dealing with the top-ranked topics. However, low-ranked dimensions are not necessarily insignificant; we believe instead that people expect them all to be “taken care of implicitly”, without any need for their input.
Moreover, the ranking varies with the respondents’ demographic profile, especially with their age. Therefore, citizens are not all concerned by the same issues and this diversity should be considered. For instance, the first-ranked characteristic, i.e., “environment”, is not as important for each age group.
The Kruskal–Wallis test indeed reveals that there are several statistically significant differences between the age groups: people aged over 45 place less importance on the environment than people aged from 18 to 45. Moreover, the Spearman correlations (p < 0.01) confirm that the older the people are, the lower the importance regarding energy management (Rs = −0.26) and respect for the environment (Rs = −0.27).
Our study shows that the ranking of the other dimensions (except for the multimodality) also varies according to the respondents’ age (see Appendix B for full results of non-parametric tests crossing age groups and ranking of smart city dimensions). Such results suggest that the participants’ priorities change throughout life, which strengthens the idea that there is no such thing as a “general citizen”.
4.2. Intended Behavior Regarding Digital/Analog Solutions
To assess the respondents’ intended behavior towards smart city solutions, we asked them twelve multiple-choice questions. The questions taken together formed a short story in which the participants were invited to look ahead to 2030 and to envision how they would react in several situations, assuming that all the mentioned technologies would be available and operational. Each question corresponds to one smart city dimension chosen as previously explained from Cohen’s smart city wheel. Moreover, each proposed answer matches one smart citizen profile (cautious, moderate, or techno) and attests to the respondents’ willingness or reluctance to use several smart solutions.
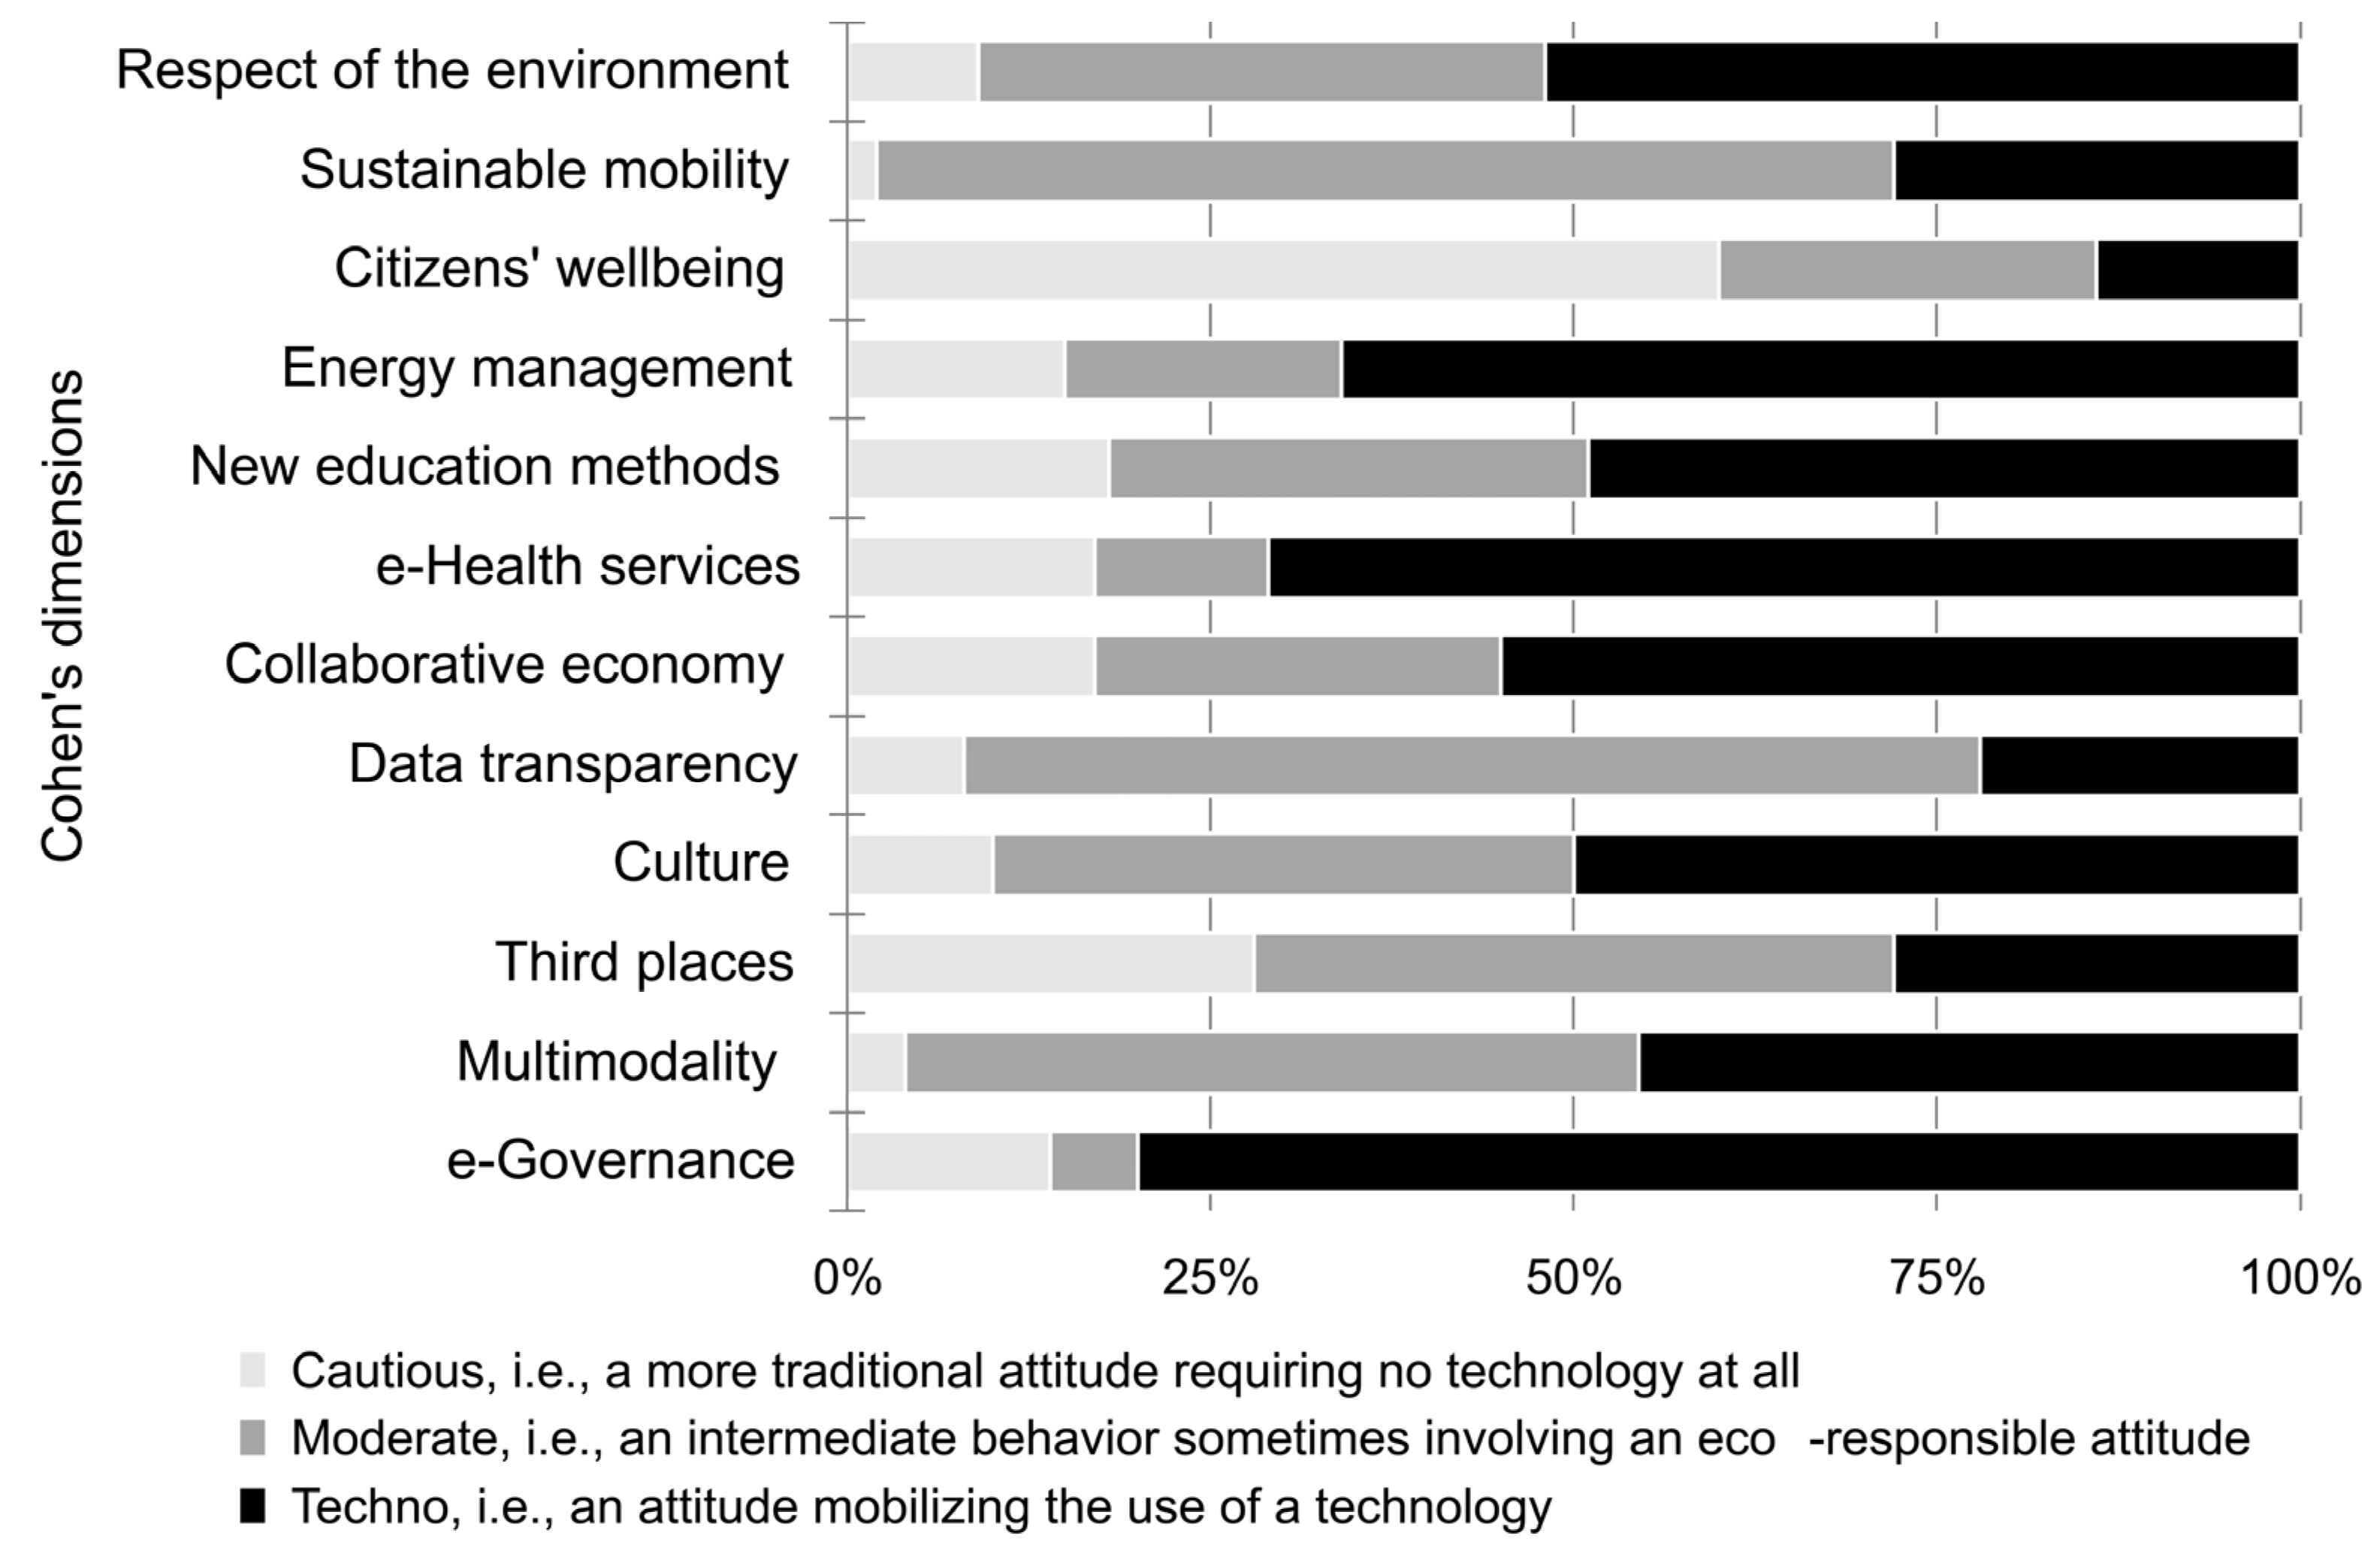
Figure 5 presents the attitude adopted by the respondents for each dimension (ranked in order of importance in accordance with Figure 4). The Walloon citizens that answered the questionnaire are generally very “techno” and thus quite enthusiastic about smart city solutions compared to analog solutions. However, every situation, i.e., every dimension, highlights a different behavioral pattern, underlining the importance of analyzing citizens’ behavior and acceptance level before undertaking any “smart” initiative.
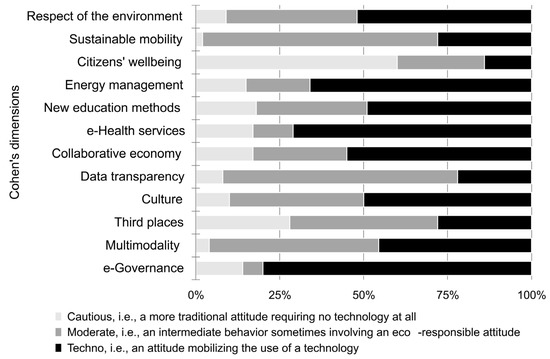
Figure 5.
Summary of respondents’ behavior regarding the 12 smart city dimensions.
Our study, moreover, shows that respondents are not always techno but sometimes behave more moderately, which indicates that they are aware of the issues associated with smart technologies, such as data privacy or anonymity. Among the twelve questions, one was about data transparency, which can be defined as “the ability of subjects to effectively gain access to all information related to data used in processes and decisions that affect the subjects” [67] (p. 67). The respondents had to imagine that they owned a smart meter. Through a short explanation, respondents were informed that one smart meter needs to access certain types of data to run effectively. They could choose one attitude among the following three:
- “No way! I don’t share my data” (cautious);
- “I’d share certain types of data, but not the data I consider too private” (moderate);
- “I’d share any type of data necessary for the system to run correctly” (techno).
In this specific situation, the respondents generally chose to share some data, i.e., the kind they do not find too private or too personal. These results can be nuanced by assessing the influence of demographic variables on the intended behavior (see Appendix B for the detailed results). The Kruskal–Wallis test reveals that there are statistically significant differences between the three behavioral attitudes. The multiple range tests (p < 0.05) show that:
- people who choose to share some data are more qualified than people who refuse to share them;
- people who choose to share any data are older than people who refuse to share them.
These results are very interesting because data sharing is a founding concept of the smart city model and data is seen as fueling such urban development [68]. However, such data sharing raises the issue of data transparency, which is one of the dimensions in which respondents are less “techno” according to Figure 5, meaning that they will think twice before sharing a specific dataset. Considering that Walloon citizens with higher levels of education are more prone to share some data, it is crucial to clearly inform them about the way such data will be used to encourage them to provide data that are useful for the city’s operational needs. More surprisingly, the average age of the citizens that share all their data is higher than that of the people who do not share it at all. One might have expected the opposite trend, which further justifies the importance of profiling the (Walloon) population when it comes to addressing smart city issues.
When we look at the twelve answers provided by each respondent, we can calculate his/her smart citizen profile by counting the scores obtained in each of the three pre-defined attitudes (cautious, moderate, and techno). On average, the Walloon participants achieved a higher “techno” score than their “moderate” score, which in turn was higher than their “cautious” score. Moreover, the three measured behaviors were influenced by the age (see Appendix B for the detailed results). According to the Spearman correlations (p < 0.01), the older the people, the lower their cautious behavior (Rs = −0.10), the lower their moderate attitude (Rs = −0.11), and the higher their techno attitude (Rs = 0.05). Such results challenge the generally accepted idea that older people are necessarily more traditional and less comfortable with technology.
4.3. Favorite Participatory Methods
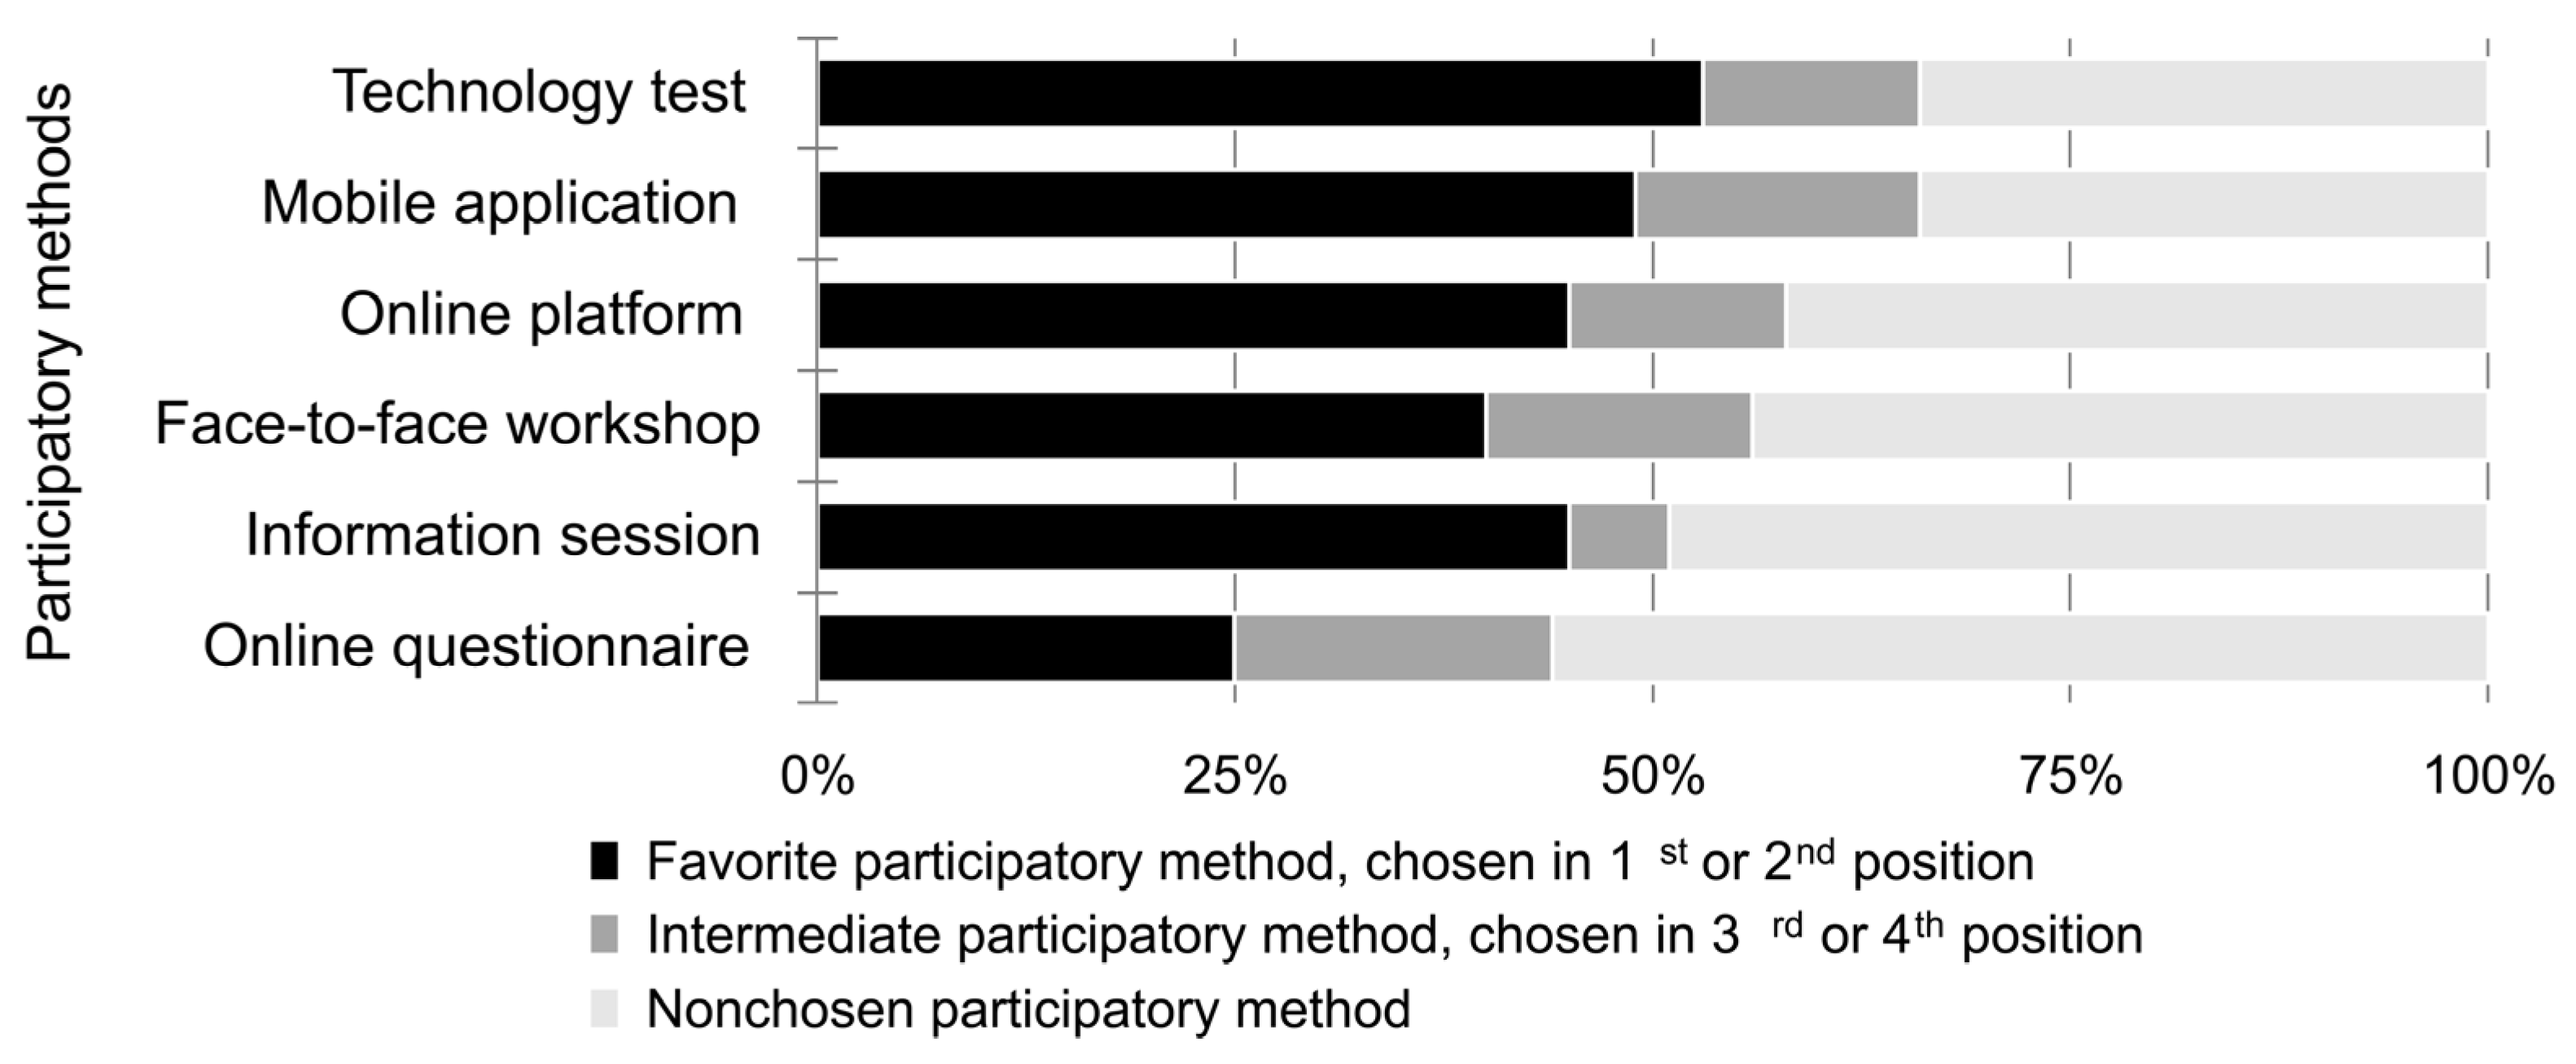
The results about citizens’ perception of smart city dimensions and intended behaviors regarding smart city solutions inform us about the potential topics that could be submitted to citizen participation. However, there is a large number of participatory methods, and citizens perceive them differently according to their demographic profile. Therefore, we asked the respondents to choose their favorite participatory methods among a set of proposals and to rank them by order of preference (Figure 6).
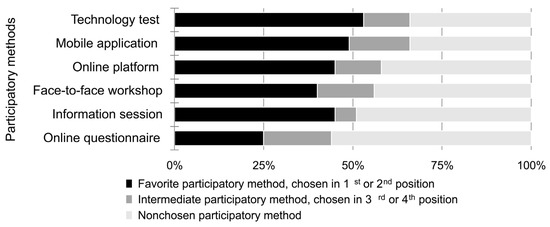
Figure 6.
Respondents’ favorite participatory methods (n = 1280).
The previous graph highlights two major results. First, the respondents’ favorite participatory method is the technology test, which demonstrates their willingness to take concrete actions and to physically experience new technologies. This observation totally contradicts the postulate of passive smart citizens conveyed by the technocratic smart city model. On the contrary, Walloon participants want to play an active role in the topics they consider as being especially important. Second, workshops and information sessions were chosen by more than half of those surveyed. We can therefore assume that citizen participation should not be confined to online methods, which are increasingly popular in the digital era at the expense of face-to-face methods. Online participation has proven to attract hard-to-reach citizens such as parents with young children, but this recruitment channel cannot be the only one without running the risk of setting aside other sections of the population, such as the digitally illiterate. Actually, all such participatory approaches are complementary and legitimate, as long as they are chosen carefully according to the preferences of the potential participants. The organizers just have to be fully conscious that each participatory strategy will attract a specific audience.
Indeed, the respondents’ demographic profile, especially their age, impacts their preferences (see Appendix B for the detailed results). Although the technology test is the most popular when considering the average preferences of the whole sample, this participatory method is not equally appreciated by every age group. The negative correlation shows that the older the people, the lower their level of preference (Rs = −0.19, p < 0.05). Similarly, older respondents generally rank the online questionnaire lower, which contributes to decreasing the average (Rs = −0.17, p < 0.05). In other words, the online questionnaire is not necessarily the least preferred for each age group, just as the technology test is not systematically the respondents’ first choice.
4.4. Personas
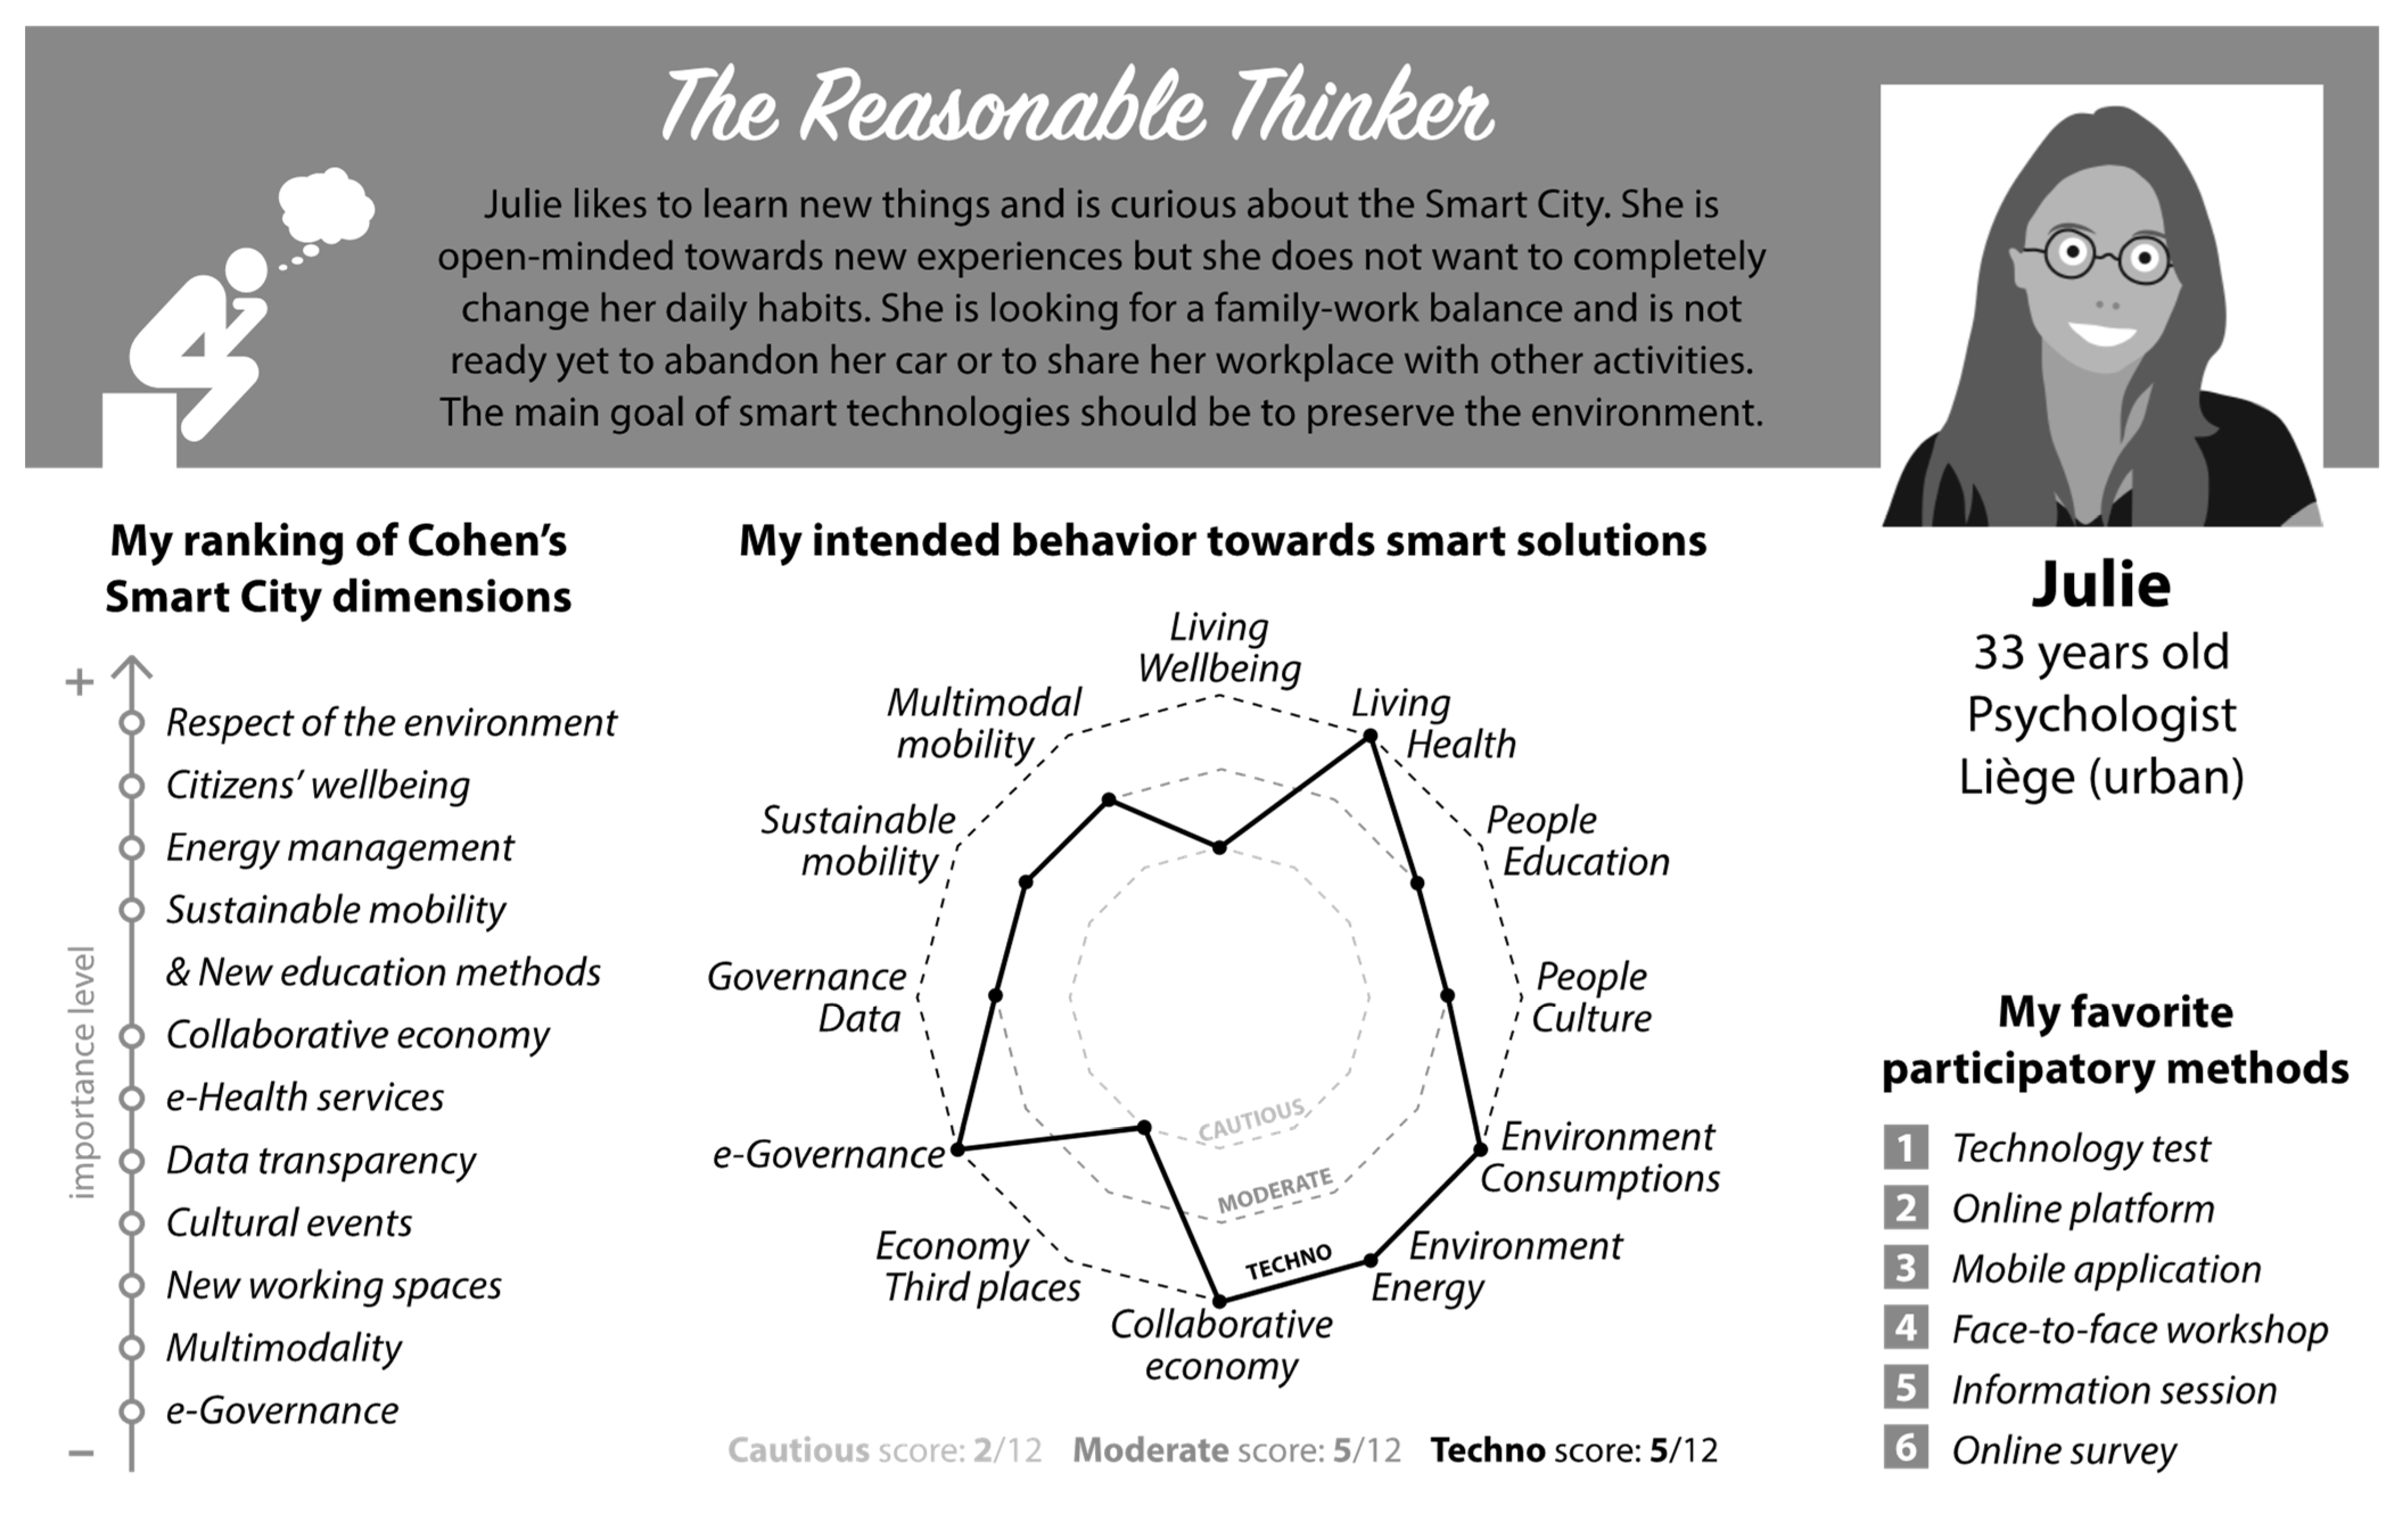
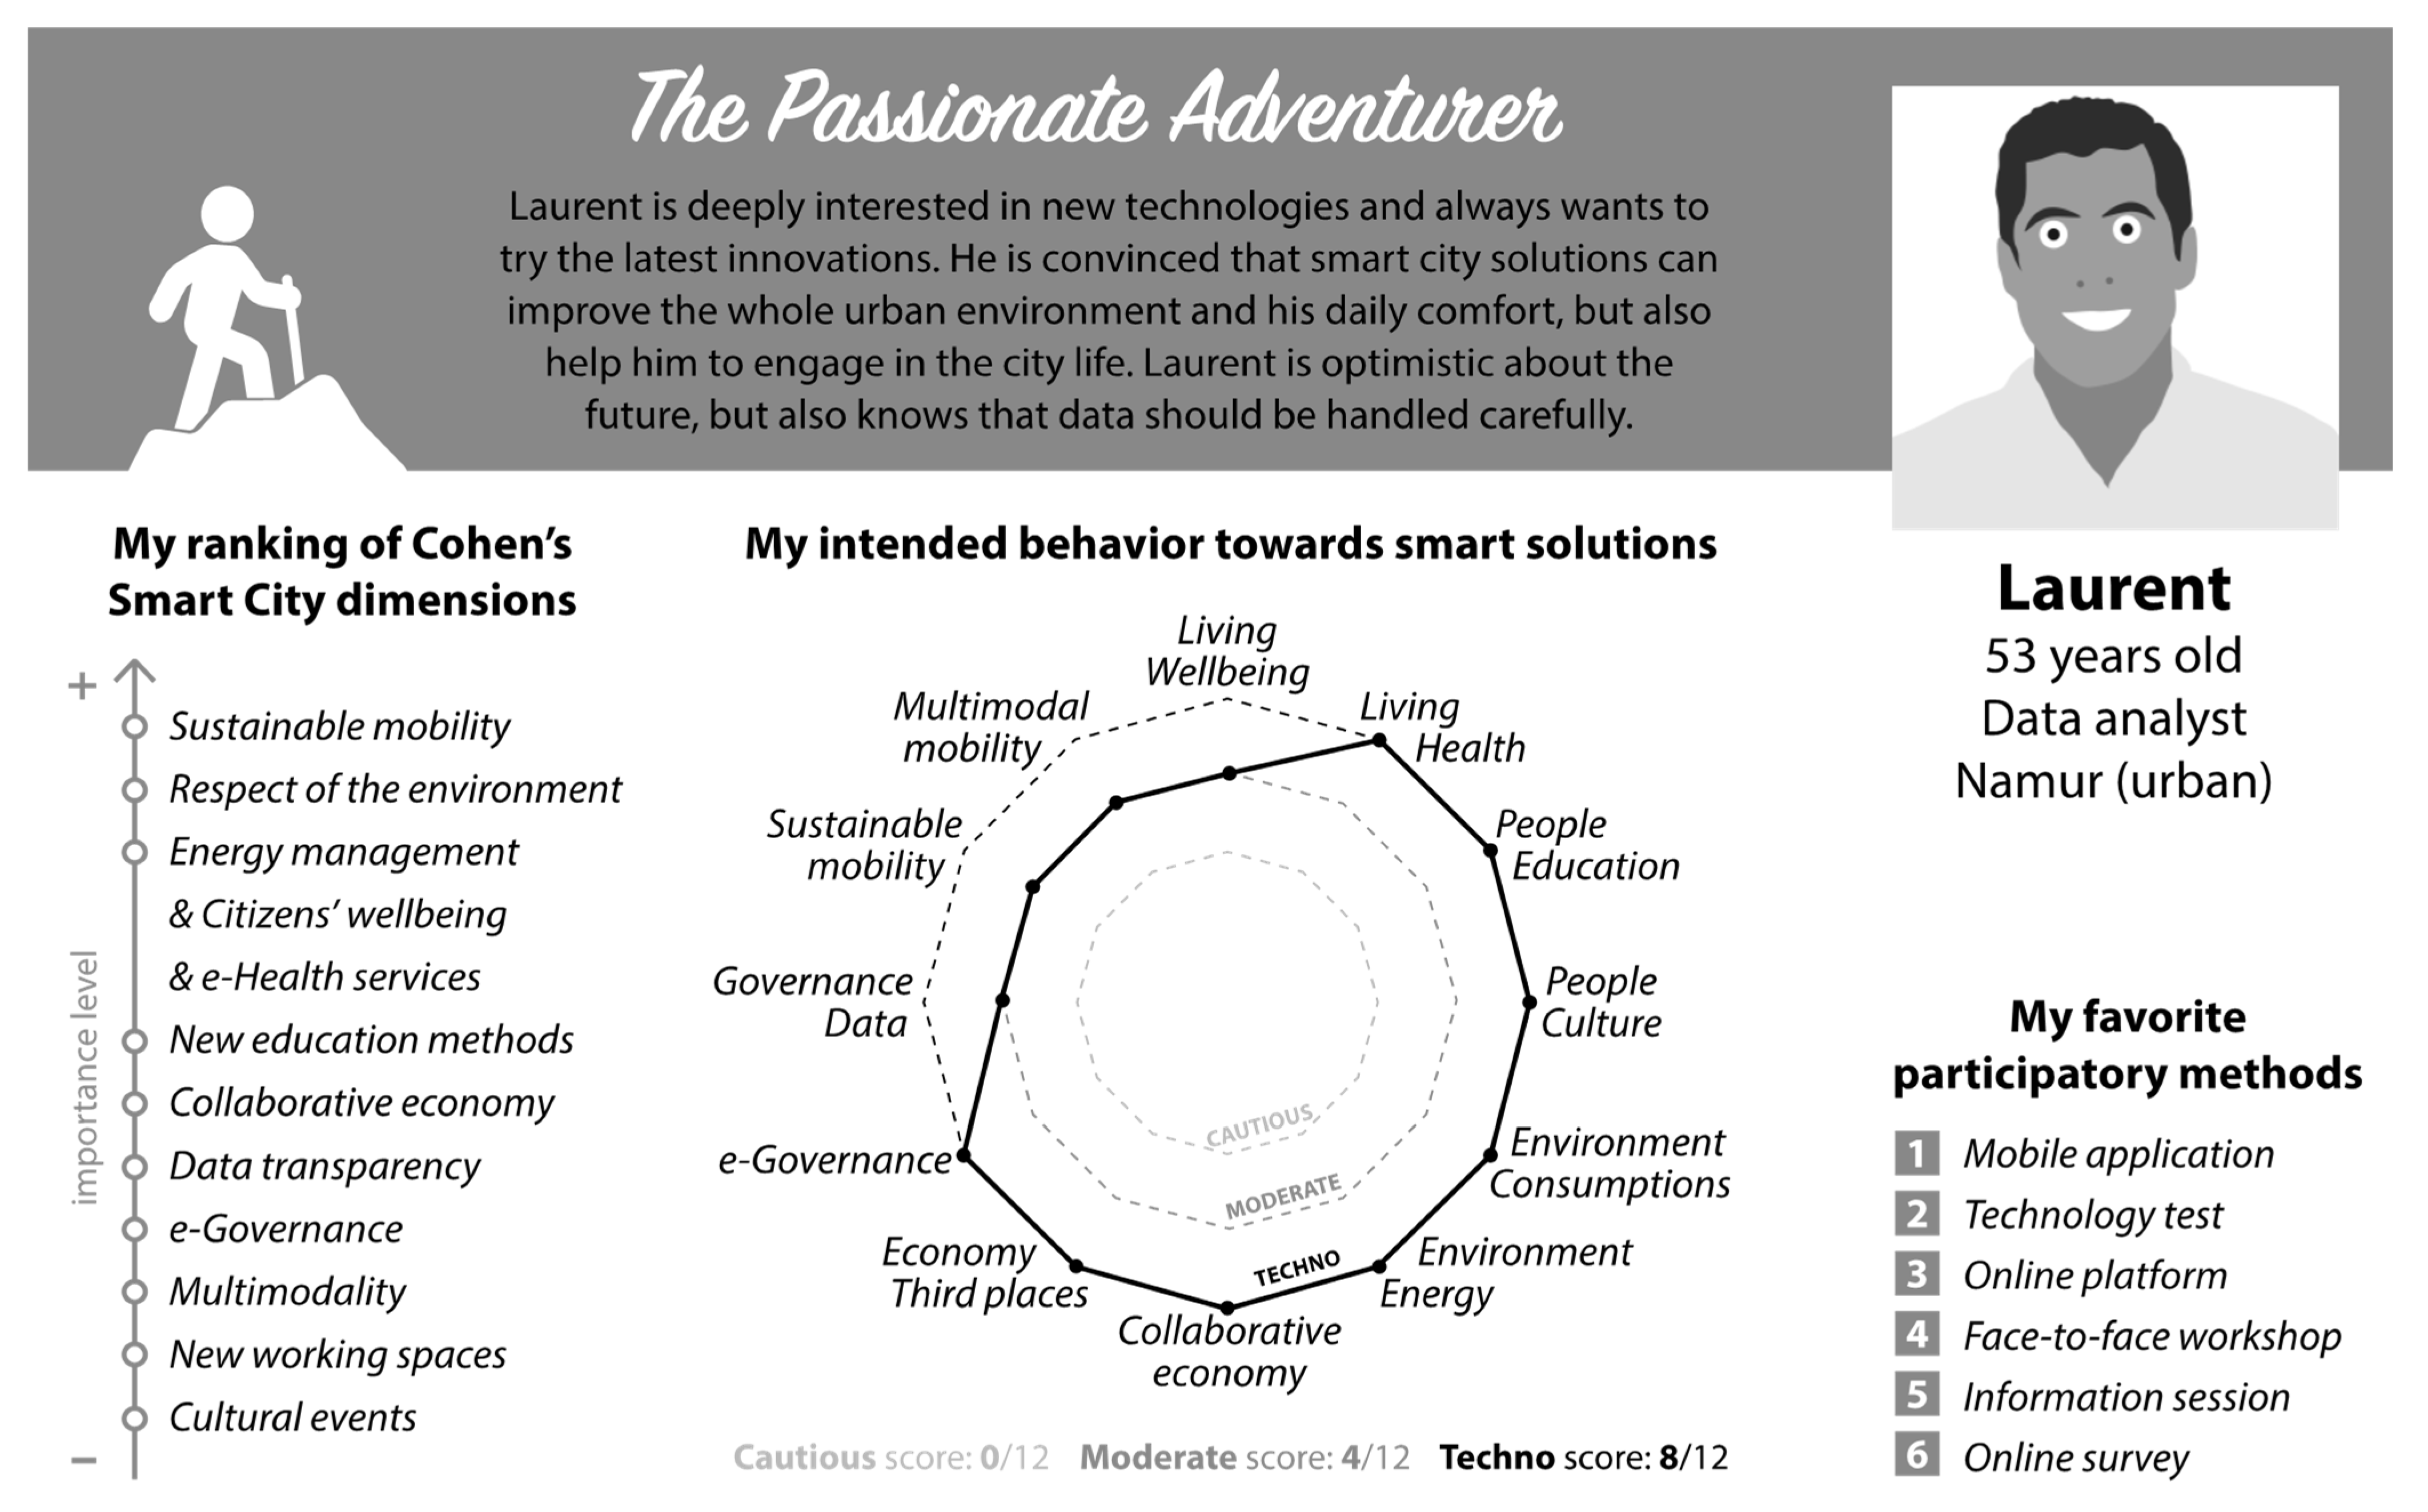
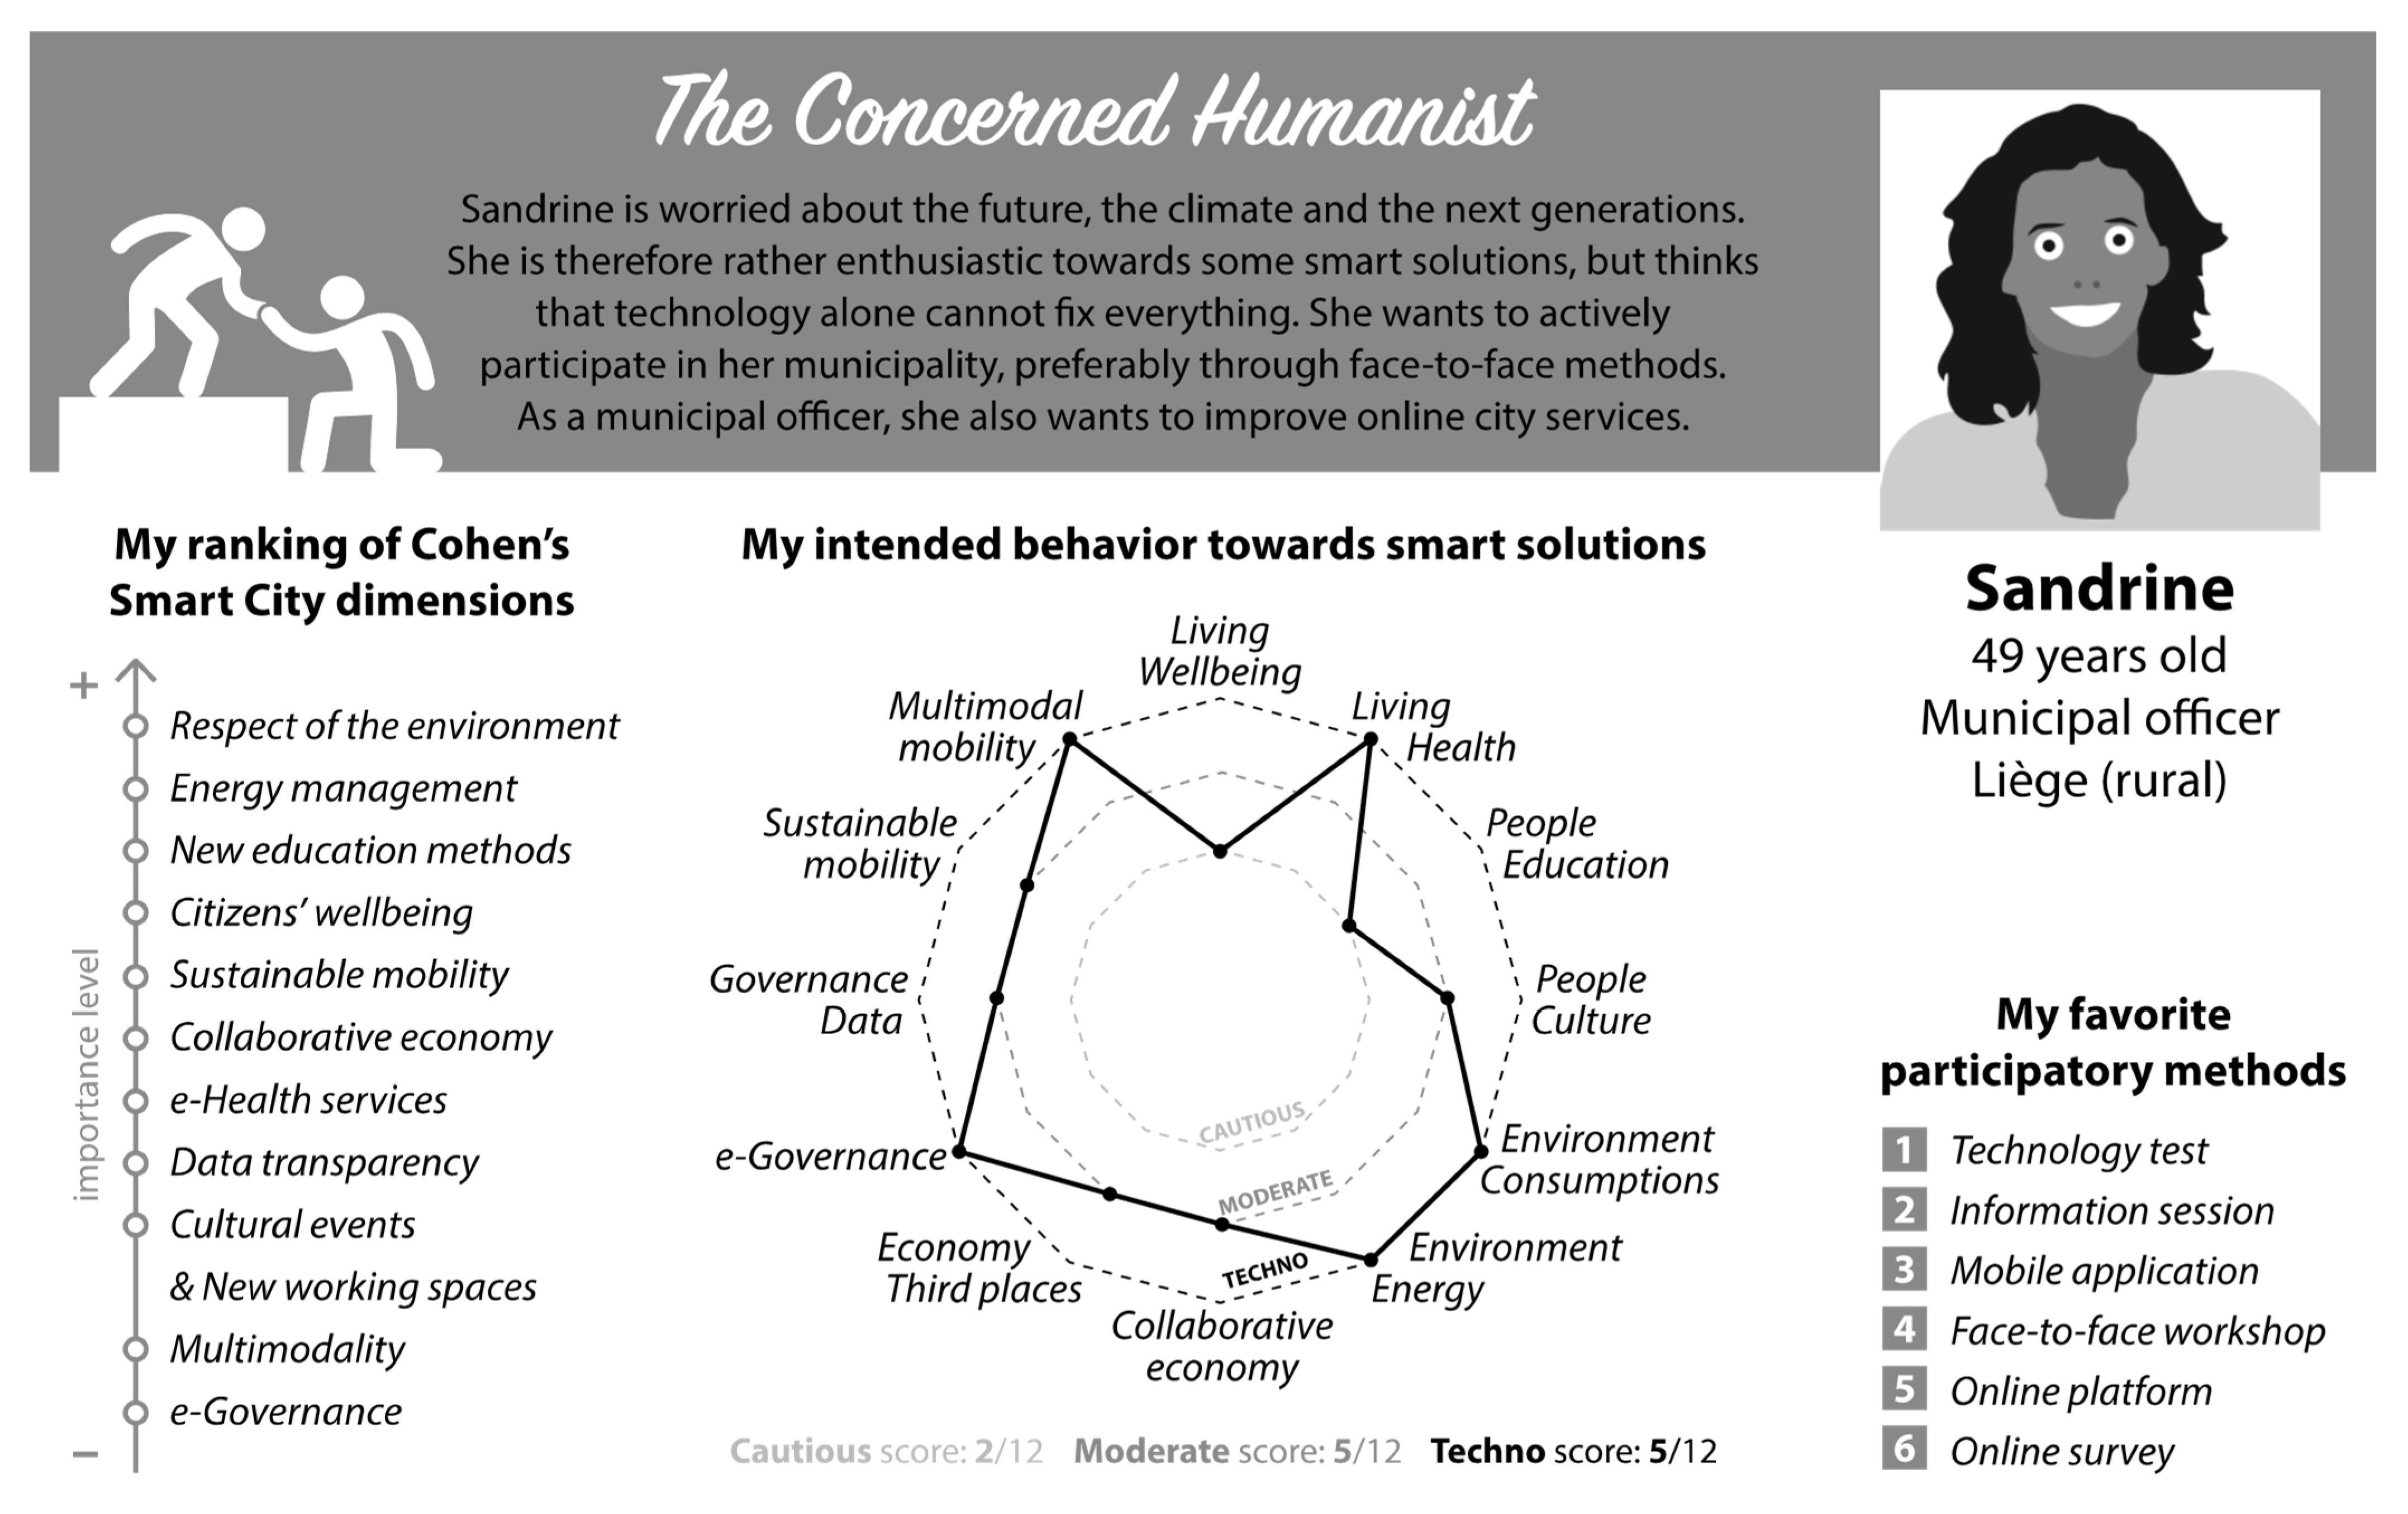
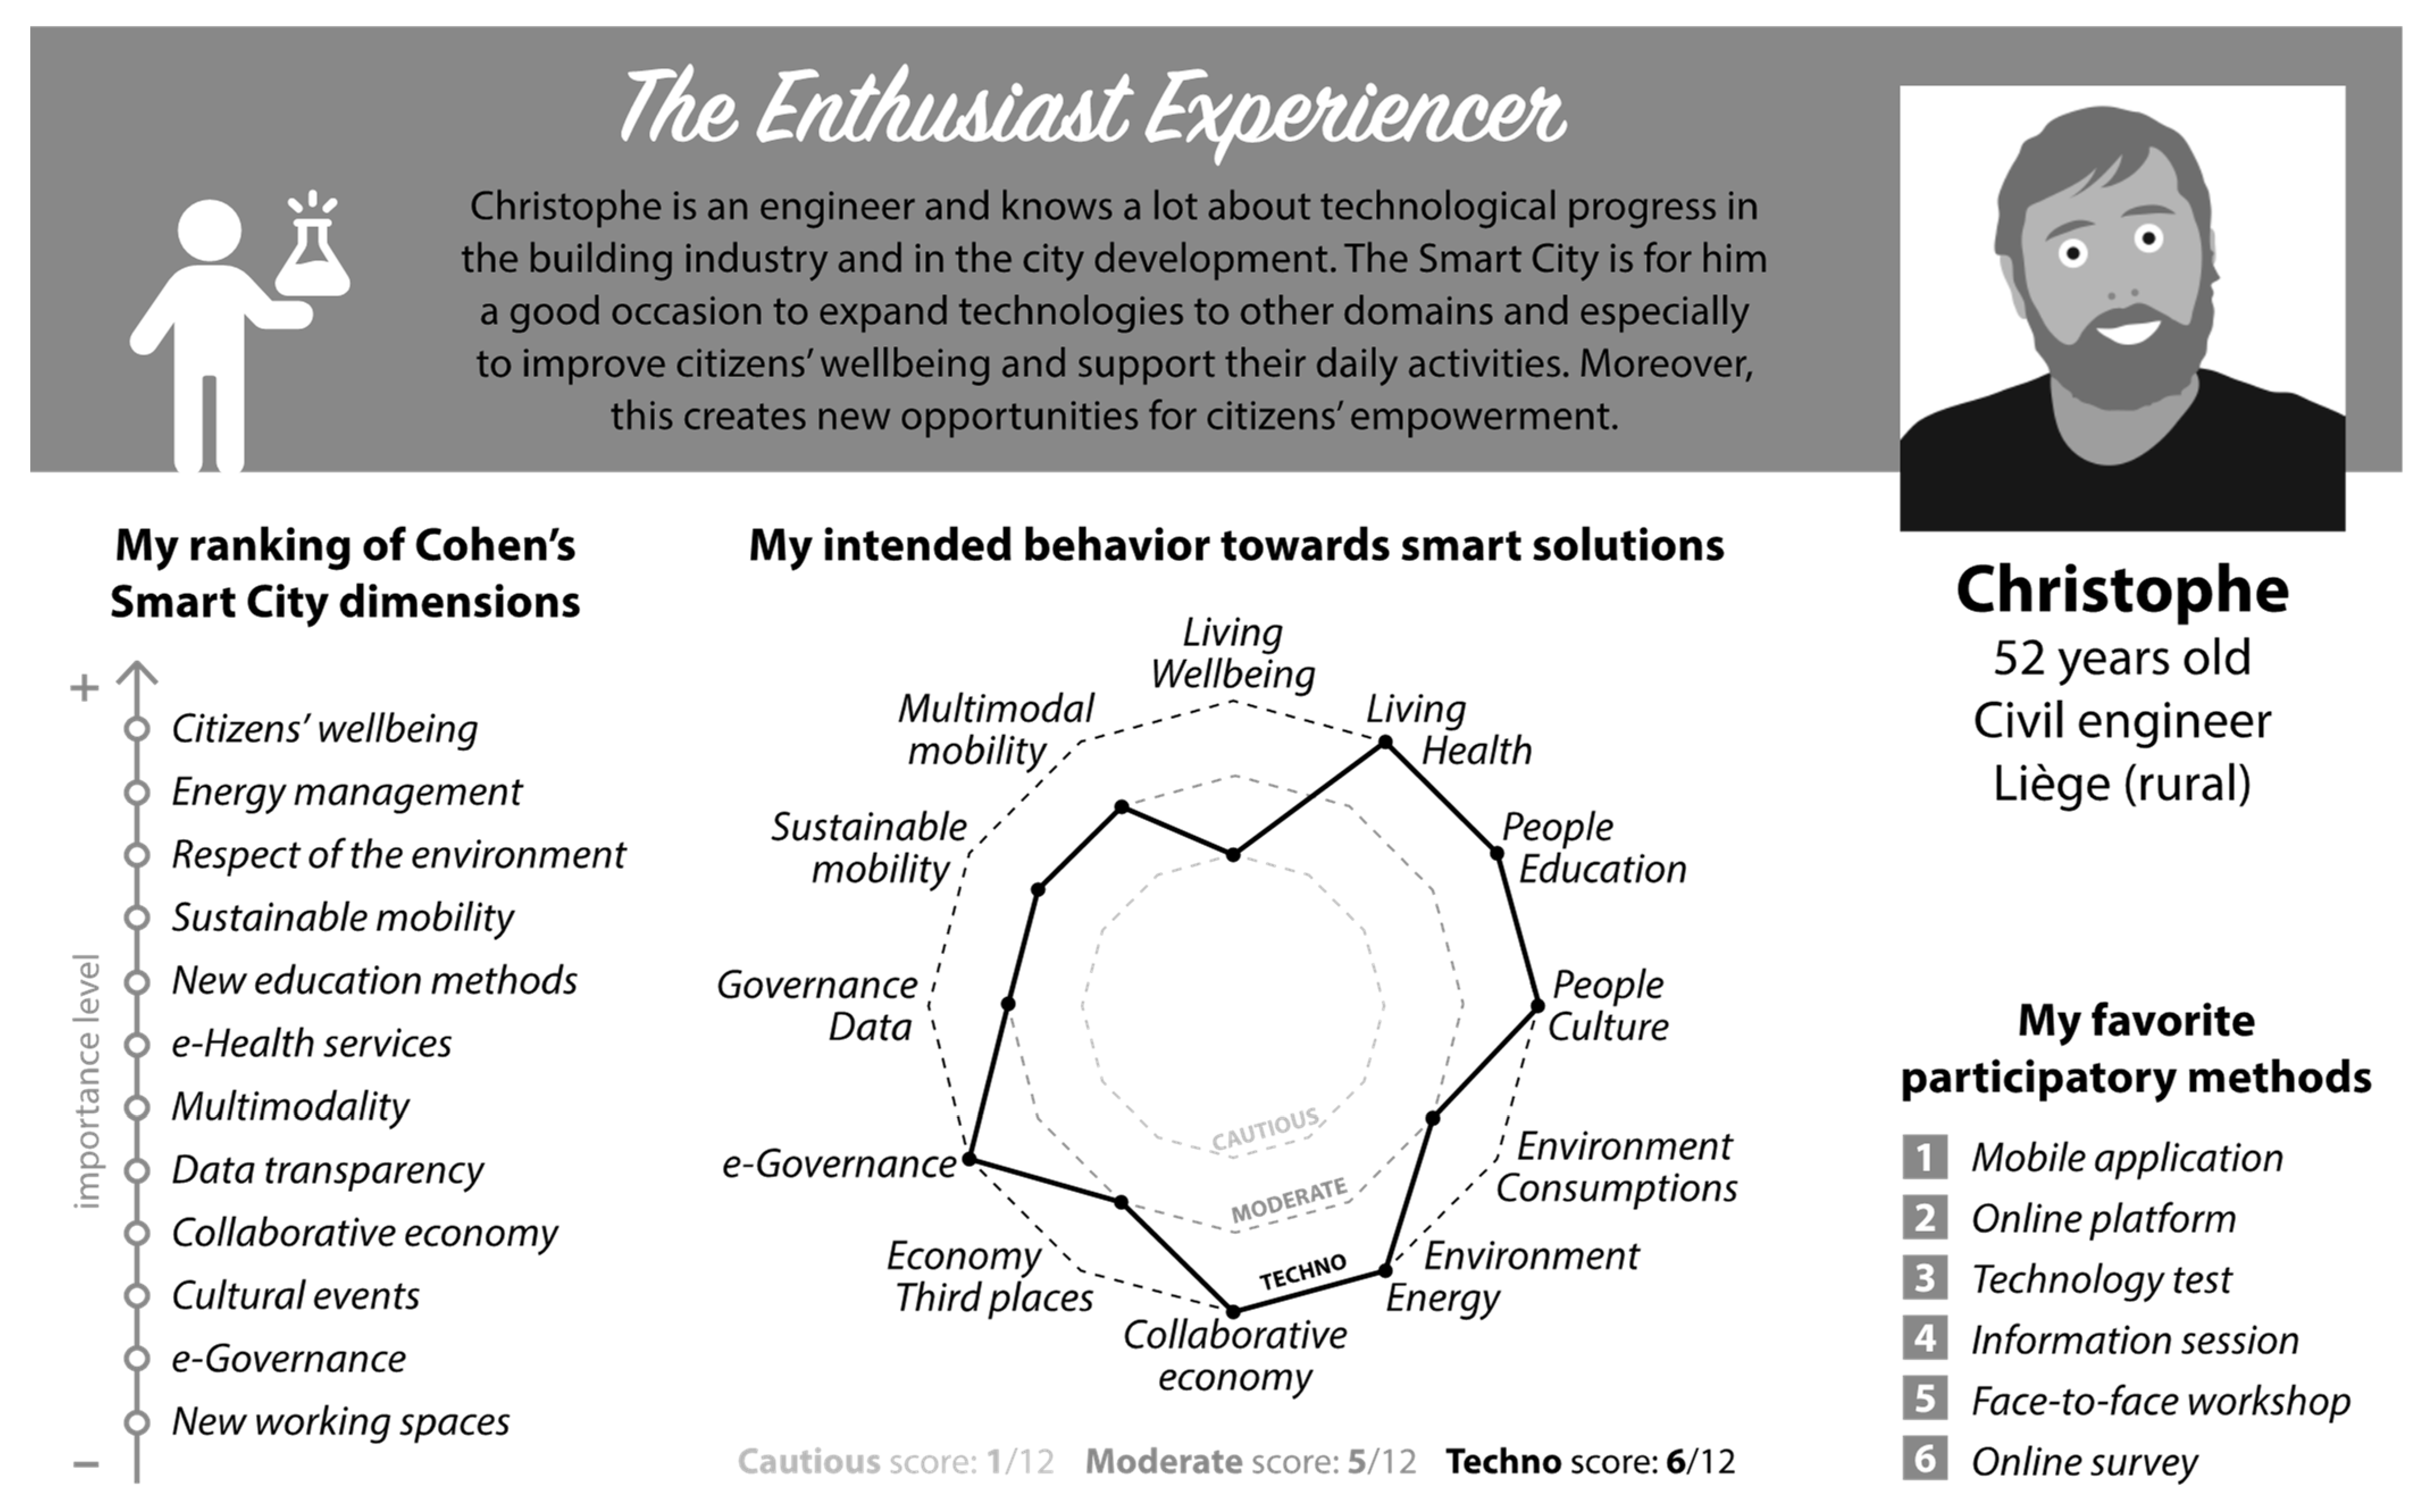
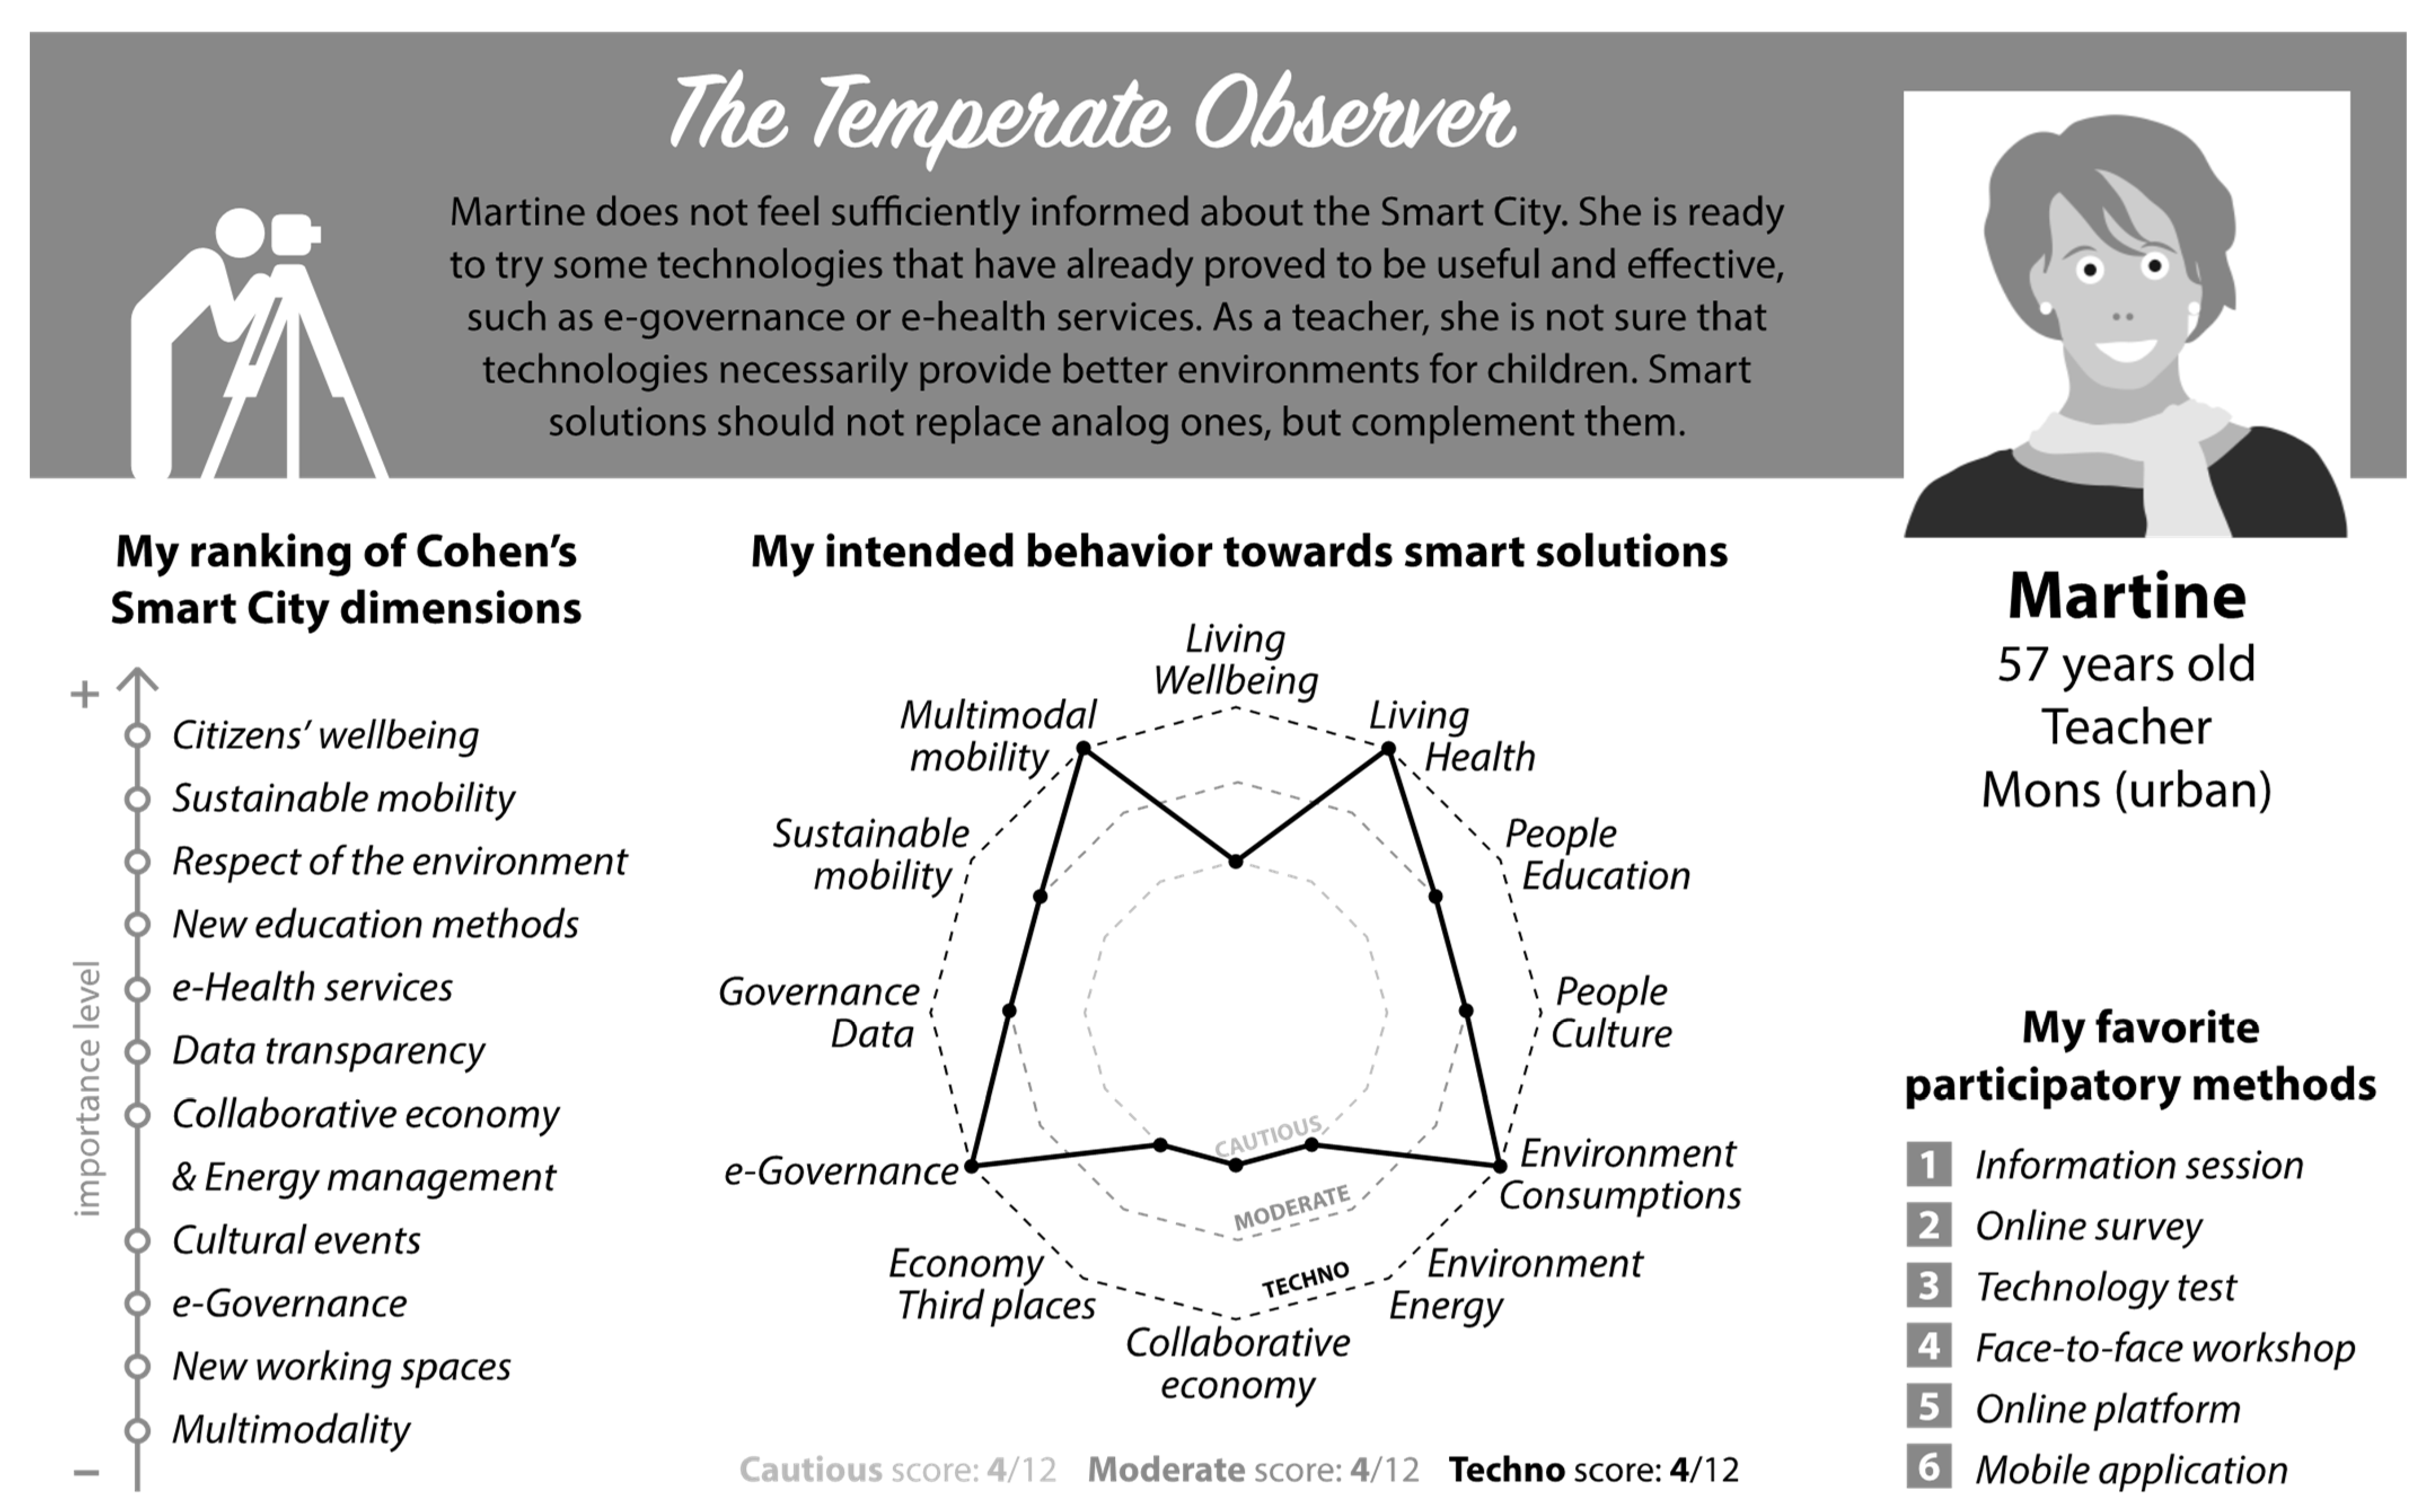
This subsection presents the five personas resulting from the k-means cluster analysis (Figure 7, Figure 8, Figure 9, Figure 10 and Figure 11). These caricatural profiles describe the citizens’ various characteristics in a playful and synthetic way, which provide an overview of the main results and a means to easily handle and communicate them.
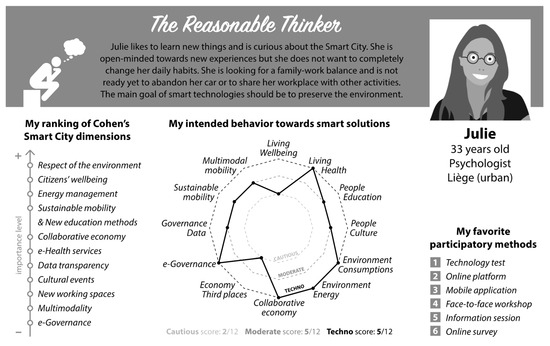
Figure 7.
The reasonable thinker.
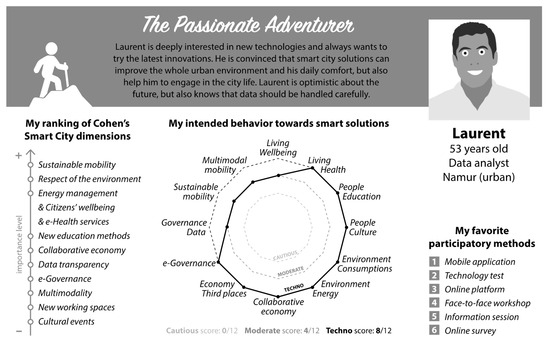
Figure 8.
The passionate adventurer.
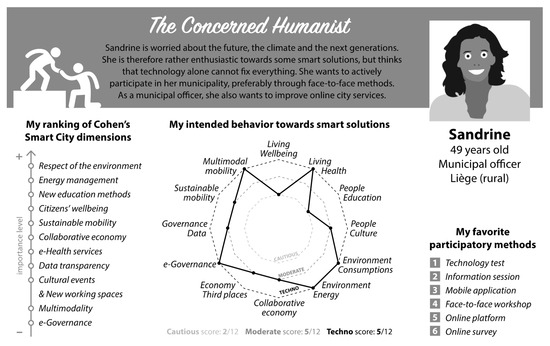
Figure 9.
The concerned humanist.
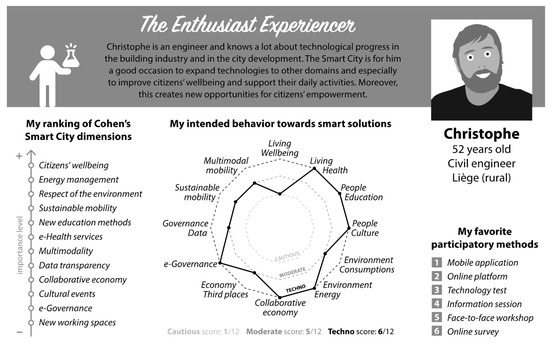
Figure 10.
The enthusiastic experiencer.
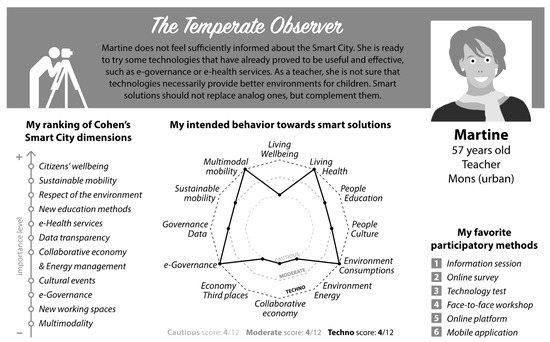
Figure 11.
The temperate observer.
Those profiles illustrate the properties of the five cluster centers, which summarize the thinking and behavioral patterns of each group. In addition to the strict answers to the survey, we added a small description characterizing the personas in more detail in the upper grey banner of the card. Therefore, some information is not directly provided by the cluster analysis, but rather complements it with our interpretation of the results, which humanizes the personas and gives them a personal history. Following the human-centered theory of personas, we also gave them French-speaking first names so that they can be imagined as real persons with whom users can identify and empathize [69].
5. Discussion
This study questions the positioning of Walloon (highly educated) citizens towards smart city dynamics. To this end, the data extracted from our general public survey were submitted to three levels of analysis: descriptive statistics, nonparametric statistics, and k-means clustering leading to five personas. This section discusses how the obtained results can be compared with the citizen models previously identified in the literature (Figure 1).
First, the description of the sample helps us to understand the general trends among the surveyed Walloon citizens. This initial step provides an overview of the perceptions, behaviors, and preferences of the majority. However, the obtained mean values lack nuance and smooth out the variations existing inside the surveyed sample. Those descriptive results are therefore close to the “general citizen” identified in the literature. Moreover, our average citizen would achieve a techno score of 6/12, place the environmental characteristic in first position, and favor digital participatory methods. This optimistic citizen portrait is reminiscent of the “super citizen”, who is simultaneously technophilic, eco-friendly, and digitally literate. Nonetheless, this unique profile represents none of the respondents who think and behave in a more complex way.
Second, the nonparametric tests highlight the relations between two statistical variables. More specifically, we studied the influence of the sociodemographic variables on the other variables. This article mainly presents tests that cross age groups with another variable, whose results are generally significant (see Appendix B for a summary of the main results), and does not detail all the other tests carried out on other socio-demographic variables, whose effect is more marginal. In general, the age group was indeed found to have a huge influence on the respondents’ answers. Besides this generational effect, the level of education and the professional status also provide some significant results, whereas gender, living environment, and professional field have little impact. The obtained results are sometimes surprising, especially regarding the priorities and behaviors of older participants, who are more technophilic than intuitively expected. This type of result could be used to develop several typologies of citizens defined by one parameter at a time (according to their perceptions, intended behaviors, or participatory preferences). Compared to the theoretical models found in the literature, such typologies would at least provide concrete sociodemographic information about each citizens’ category. However, the resulting categories would remain exclusive and could not really integrate citizens’ multiple positionings. Indeed, one person could be very interested in technologies in general, but reluctant to use a smart solution in one specific domain, just as another person could adopt a cautious behavior except when it comes to choose a participatory method.
Third, the k-means cluster analysis considers all variables together to constitute natural citizen groups. The five clusters generated are no longer categories of a typology, but distinct groups with close profiles. Inside each group, the centroid does not correspond to any particular respondent but is considered as the most representative point of the whole cluster. This fictious point is thus chosen to characterize each persona, which is a detailed profile based on real data. Those personas are “user assemblages” in the sense that they combine sociodemographic, behavioral, and opinion information in order to capture citizens’ multifaceted profiles. Moreover, those personas are not real users but share similar characteristics with those of the same target group. Such citizens’ profiles are very useful during co-design processes but are by no means a substitute for citizen participation and should not “become an excuse to dispense with the involvement of target users in the design process” [70]. On the contrary, the proposed personas are an incentive to further integrate end users and their complex, multiple, and intricated profiles into the design process of smart cities. In addition, they are not fixed but can be enriched with new information collected from real people during the design process [64], such as the dynamic “homunculi” introduced in the literature. The five proposed personas therefore contribute to the existing literature by increasing the understanding and modeling of citizens’ profiles in the smart city, and constitute concrete tools to consider their perspectives in the participatory development of the smart city.
6. Conclusions and Recommendations
This paper presents the results of a general public survey aimed at profiling Walloon citizens in smart city dynamics. Based on the assumption that citizens can participate in smart city development, three main issues were addressed: (1) citizens’ perception of smart city dimensions, (2) intended behaviors regarding existing smart solutions, and (3) favorite participatory methods. The collected data were first analyzed through descriptive and nonparametric statistics, and then submitted to a k-means clustering.
The main contribution of this research is the development of five personas that summarize and humanize our survey results. The empirically developed citizen profiles are more detailed and realistic than theoretical typologies found in the literature. Personas, as visual work tools, are easy to handle and to communicate when designing smart city solutions, or during participatory processes. Among the other main results, generational patterns are identified and contradict some popular preconceptions about citizen positionings, at least when it comes to the investigated sample. Moreover, it should be noted that an important urban dimension for respondents does not automatically induce the use of an associated technology. Therefore, citizens sometimes prefer innovative but analog solutions, reminding us that smartness does not always mean technology. Citizens’ preferences towards participatory methods also emphasize the complementarity of face-to-face and online solutions.
To the best of our knowledge, this work is the first mass statistical study that questions the positioning of citizens with regard to smart city dynamics. However, the current results should be handled carefully since the respondents are highly educated Walloon citizens who are potentially more concerned about the future and interested in the smart city topic than the average population. Moreover, although the data were collected in 2018, the results remain relevant today, as the time it takes for people to adopt technologies is slower than the time it takes to develop them. Even though Walloon cities are now equipped with more smart solutions, few of them aim at strengthening the relations with citizens [71], who therefore are not necessarily more aware of smart dynamics than five years ago. In addition, the majority of respondents was from Liège and this local context could have colored the results. Indeed, previous research showed that the urban or rural characteristics of a territory have an influence on the understanding, the interpretation, and the acceptance of the smart city model [72,73]. Nevertheless, the city of Liège remains representative of other central European cities that share similar challenges in terms of smart city development. Our results are therefore inspiring for other mid-sized cities in this part of the world. Beyond those local, sample-related specificities, our research paves the way for similar methodologies to be replicated elsewhere, because we argue a new understanding of local “user assemblages” is always a good starting point to involve citizens in smart city dynamics.
Despite the previous limits, such personas are thus useful, or even essential, for people who want to design smart city solutions and/or to involve the citizens during co-design and participatory processes. The personas can be used to achieve the following [70]:
- identify and recruit target groups of users for participatory events;
- consider their needs, preferences, and expectations to develop corresponding, relevant solutions;
- become aware of the sometimes-conflicting issues and viewpoints concerning a given project;
- empathize with ultimate users and put themselves in the shoes of other people (including the absent);
- support the brainstorming phase and facilitate face-to-face participatory and co-design workshops;
- act as mediators and improve communication between participants.
If correctly manipulated, such personas have the capacity in the long run to help designers, decision makers, and city officials in making their suggested smart solutions more acceptable, and hence more viable and sustainable.
As a path for future research, our study could be extended to younger people’s perspectives. During the exhibition, we collected data not only from adult respondents, but also from teens (n = 811) and children (n = 880). Those insights were not presented here because the questions were slightly different; nonetheless, the provided answers could be used to build additional personas. The readiness of young people regarding smart city dynamics is interesting because they are the adults of tomorrow. Now that we have a better understanding of “who” are the potential participants in the smart city, another avenue that could be further explored is “how” they can actually participate. Although citizens are now recognized as key participants in the smart city, few articles inform us about how to implement a participatory approach in this particular context [7,8,46]. Moreover, citizens are not yet sufficiently involved in the evaluation of participatory processes. However, their feedback can be valuable, especially in determining the strengths and weaknesses of new (digital) participatory methods emerging in the context of the smart city.
Author Contributions
Conceptualization, C.S. and C.E.; methodology, C.S.; formal analysis, C.S. and A.D.; data curation, C.S. and A.D.; writing—original draft preparation, C.S.; writing—review and editing, C.S. and C.E.; visualization, C.S.; supervision, C.E.; project administration, C.E.; funding acquisition, C.E. All authors have read and agreed to the published version of the manuscript.
Funding
This work was supported by the European Regional Development Fund (ERDF) and the Walloon Region under Grant number 224577-952620.
Data Availability Statement
The data presented in this study are available on request from the corresponding author. The data are not publicly available due to privacy and ethical restrictions. Anonymized raw results are available in French in an internal research report on the University of Liège’s institutional repository (Elsen and Schelings. 2019. https://hdl.handle.net/2268/231078).
Acknowledgments
This research is part of the “Wal-e-Cities” project, funded by the European Regional Development Fund (ERDF) and the Walloon region. The authors would like to thank the funding authorities, as well as all who contributed to this research, in particular the organizers and the visitors surveyed in the context of the exhibition “I will be 20 in 2030”.
Conflicts of Interest
The authors declare no conflict of interest.
Appendix A. Sociodemographic Description of the Sample
| Sociodemographic Variables | Walloon Population 2 | Sample 3 | |
| Age (n = 1804) | 18–25 (1) 1 | 11% | 11% |
| 26–35 (2) | 16% | 16% | |
| 36–45 (3) | 16% | 16% | |
| 46–55 (4) | 17% | 17% | |
| 56–65 (5) | 17% | 17% | |
| 65+ (6) | 23% | 23% | |
| Environment (n = 1761) | Urban | 49% | 51% |
| Rural | 51% | 49% | |
| Gender (n = 1797) | Male | 48% | 48% |
| Female | 52% | 52% | |
| Professional status (n = 1682) (18–65 only) | Worker | 65% | 63% |
| Unemployed | 8% | 6% | |
| Student | 12% | 10% | |
| Other (homemaker, incapacity, retired) | 15% | 21% | |
| Professional field (n = 1102) (workers only) | Health, wellbeing, human and social sciences | 52% | 20% |
| Education and research | 18% | ||
| Administration and public services | 18% | ||
| Technology, industry, building and construction | 18% | 14% | |
| Computing and (tele)communications | 2% | 10% | |
| Economics, business, law and legislation | 2% | 9% | |
| Other | 26% | 11% | |
| Level of education (n = 1798) | Primary school or without a degree (1) | 11% | 2% |
| Lower secondary education (2) | 19% | 6% | |
| Upper secondary education (3) | 35% | 19% | |
| Higher education (short type) (4) | 17% | 33% | |
| University-level higher education (5) | 18% | 40% | |
| 1: Values between brackets are attributed when considering the age and the level of education as ordinal variables. 2: Data based on Walloon and Belgian official statistical sources (iweps.be and statbel.fgov.be). 3: Data obtained after we used statistical weighting to improve the representativeness of the sample. | |||
Appendix B. Main Results of Non-Parametric Tests Identifying Relationships between Socio-Demographic Variables (in Particular Age Groups) and Research Variables (Ranking of Smart City Dimensions, Intended Behavior towards Smart Solutions, and Favorite Participatory Methods)
| Variable 1 | Variable 2 | Non-Parametric Test Results | |
| Relationships between age groups and ranking of smart city dimensions | |||
| Rank of Wellbeing (ordinal) | Age group (nominal) | Kruskal–Wallis test: H(5,N = 979) = 43.81 | p < 0.01 |
Significant differences according to the multiple range tests:
| |||
| Age group (ordinal) | Spearman correlation: Rs = −0.19 | p < 0.05 | |
| The older people are, the less importance they attach to wellbeing. | |||
| Rank of Health (ordinal) | Age group (nominal) | Kruskal–Wallis test: H(5,N = 979) = 23.07 | p < 0.01 |
| Significant differences: 18–25-year-olds (X = 2.10) attach more importance to health than 26–35-year-olds (X = 1.81), 36–45-year-olds (X = 1.74) and 46–55-year-olds (X = 1.72) (p < 0.05). | |||
| Age group (ordinal) | Spearman correlation: Rs = −0.13 | p < 0.05 | |
| The older people are, the less importance they attach to health. | |||
| Rank of Education (ordinal) | Age group (nominal) | Kruskal–Wallis test: H(5,N = 979) = 28.83 | p < 0.01 |
Significant differences:
| |||
| Age group (ordinal) | Spearman correlation: Rs = −0.13 | p < 0.01 | |
| The older people are, the less importance they attach to education. | |||
| Rank of Culture (ordinal) | Age group (nominal) | Kruskal–Wallis test: H(5,N = 979) = 69.08 | p < 0.01 |
Significant differences:
| |||
| Age group (ordinal) | Spearman correlation: Rs = −0.23 | p < 0.05 | |
| The older people are, the less importance they attach to culture. | |||
| Rank of Energy management (ordinal) | Age group (nominal) | Kruskal–Wallis test: H(5,N = 979) = 55.29 | p < 0.01 |
Significant differences:
| |||
| Age group (ordinal) | Spearman correlation: Rs = −0.26 | p < 0.01 | |
| The older people are, the less importance they attach to energy management. | |||
| Rank of Respect for the environment (ordinal) | Age group (nominal) | Kruskal–Wallis test: H(5,N = 979) = 58.79 | p < 0.01 |
Significant differences (p < 0.01):
| |||
| Age group (ordinal) | Spearman correlation: Rs = −0.27 | p < 0.01 | |
| The older people are, the less importance they attach to respect for the environment. | |||
| Rank of Collaborative economy (ordinal) | Age group (nominal) | Kruskal–Wallis test: H(5,N = 979) = 22.31 | p < 0.01 |
| Significant differences: over-65 s (X = 1.32) attach less importance to the collaborative economy than 18–25-year-olds (X = 1.92) (p < 0.05), 26–35-year-olds (X = 2.04) (p < 0.01) and 36–45-year-olds (X = 1.90) (p < 0.05). | |||
| Age group (ordinal) | Spearman correlation: Rs = −0.10 | p < 0.05 | |
| The older people are, the less importance they attach to collaborative economy. | |||
| Rank of Third places (ordinal) | Age group (nominal) | Kruskal–Wallis test: H(5,N = 979) = 42.85 | p < 0.01 |
Significant differences:
| |||
| Age group (ordinal) | Spearman correlation: Rs = −0.20 | p < 0.05 | |
| The older people are, the less importance they attach to third places. | |||
| Rank of e-Gov (ordinal) | Age group (nominal) | Kruskal–Wallis test: H(5,N = 979) = 14.76 | p < 0.05 |
| Although the Kruskal–Wallis test is significant, the multiple range tests reveal no significant difference between the different age groups. | |||
| Age group (ordinal) | Spearman correlation: Rs = −0.11 | p < 0.05 | |
| The older people are, the less importance they attach to e-governance. | |||
| Rank of Data transparency (ordinal) | Age group (nominal) | Kruskal–Wallis test: H(5,N = 979) = 27.38 | p < 0.01 |
| Significant differences: 18–25-year-olds (X = 1.89) and 26–35-year-olds (X = 1.90) attach more importance to data transparency than 46–55-year-olds (X = 1.51) (p < 0.05) and over-65 s (X = 1.27) (p < 0.01). | |||
| Age group (ordinal) | Spearman correlation: Rs = −0.14 | p < 0.05 | |
| The older people are, the less importance they attach to data transparency. | |||
| Rank of Sustainable mobility (ordinal) | Age group (nominal) | Kruskal–Wallis test: H(5,N = 979) = 7.17 | p > 0.05 |
| There is no significant difference between the different age groups for this variable. | |||
| Age group (ordinal) | Spearman correlation: Rs = 0.02 | p > 0.05 | |
| There is no linear relation between age and the importance attached to sustainable mobility. | |||
| Rank of Multimodality (ordinal) | Age group (nominal) | Kruskal–Wallis test: H(5,N = 979) = 26.68 | p < 0.01 |
| Significant differences (p < 0.01): over-65 s (X = 0.97) give less importance to multimodality than 18–25-year-olds (X = 1.57) and 26–35-year-olds (X = 1.66). | |||
| Age group (ordinal) | Spearman correlation: Rs = −0.13 | p < 0.05 | |
| The older people are, the less importance they attach to multimodality. | |||
| Relationships between socio-demographic variables and intended behavior towards smart solutions | |||
| Intended behavior regarding Data transparency (nominal) | Age group (nominal) | Chi-square test: Chi2 = 20.44; dl = 10; Cramer’s V = 0.09 | p < 0.05 |
| Age and data-transparency-related behavior are not independent. There is an under-representation of 56–65-year-olds who refuse to share their data. | |||
| Age group (ordinal) | Kruskal–Wallis test: H(2,N = 1385) = 6.49 | p < 0.05 | |
| Significant difference (p < 0.05): people who choose to share all their data (X = 2.88) are older than those who refuse to share (X = 2.44). | |||
| Level of education (nominal) | Chi-square test: Chi2 = 15.67; dl = 8; Cramer’s V = 0.08 | p < 0.05 | |
| Level of education and data-transparency-related behavior are not independent. Primary school graduates and those without a degree are over-represented in refusing to share. | |||
| Level of education (ordinal) | Kruskal–Wallis test: H(2,N = 1381) = 11.61 | p < 0.01 | |
| Significant difference (p < 0.05): people who choose to share certain data (X = 4.07) are more highly educated than those who refuse to share (X = 3.74). | |||
| Techno behavior (ordinal) | Age group (nominal) | Kruskal–Wallis test: H(5,N = 1061) = 23.44 | p < 0.01 |
| Significant differences: 18–25-year-olds (X = 5.16) are less techno-savvy than 36–45-year-olds (X = 5.73) (p < 0.05) and 46–55-year-olds (X = 6.05) (p < 0.01). | |||
| Age group (ordinal) | Spearman correlation: Rs = 0.05 | p < 0.01 | |
| The older people are, the more techno-savvy their behavior. | |||
| Moderate behavior (ordinal) | Age group (nominal) | Kruskal–Wallis test: H(5,N = 1061) = 15.00 | p < 0.01 |
| Significant difference (p < 0.05): 18–25-year-olds (X = 4.72) are more moderate than over-65 s (X = 4.05). | |||
| Age group (ordinal) | Spearman correlation: Rs = −0.11 | p < 0.01 | |
| The older people are, the less moderate their behavior. | |||
| Cautious behavior (ordinal) | Age group (nominal) | Kruskal–Wallis test: H(5,N = 1061) = 22.26 | p < 0.01 |
| Significant differences: 18–25-year-olds (X = 2.12) are more cautious than 46–55-year-olds (X = 1.64) (p < 0.01) and 56–65-year-olds (X = 1.63) (p < 0.05). | |||
| Age group (ordinal) | Spearman correlation: Rs = −0.10 | p < 0.01 | |
| The older people are, the less cautious their behavior. | |||
| Correlations between age groups and favorite participatory methods | |||
| Rank of Technology test (ordinal) | Age group (ordinal) | Spearman correlation: Rs = −0.19 | p < 0.05 |
| The older people are, the less preferred the technology test. | |||
| Rank of Mobile application (ordinal) | Spearman correlation: Rs = −0.02 | p > 0.05 | |
| There is no linear relation between age and the preference for mobile application. | |||
| Rank of Online platform (ordinal) | Spearman correlation: Rs = −0.10 | p < 0.05 | |
| The older people are, the less preferred the online platform. | |||
| Rank of Face-to-face workshop (ordinal) | Spearman correlation: Rs = −0.06 | p < 0.05 | |
| The older people are, the less preferred the face-to-face workshop. | |||
| Rank of Information session (ordinal) | Spearman correlation: Rs = −0.03 | p > 0.05 | |
| There is no linear relation between age and the preference for information session. | |||
| Rank of Online questionnaire (ordinal) | Spearman correlation: Rs = −0.17 | p < 0.05 | |
| The older people are, the less preferred the online questionnaire. | |||
References
- Nam, T.; Pardo, T.A. Conceptualizing smart city with dimensions of technology, people, and institutions. In Proceedings of the 12th Annual International Digital Government Research Conference: Digital Government Innovation in Challenging Times, New York, NY, USA, 12–15 June 2011; pp. 282–291. [Google Scholar]
- Chourabi, H.; Nam, T.; Walker, S.; Gil-Garcia, J.R.; Mellouli, S.; Nahon, K.; Pardo, T.A.; Scholl, H.J. Understanding smart cities: An integrative framework. In Proceedings of the 45th Annual Hawaii International Conference on System Sciences, Maui, HI, USA, 4–7 January 2012; IEEE Computer Society: Washington, DC, USA, 2012; pp. 2289–2297. [Google Scholar]
- Angelidou, M. Smart cities: A conjuncture of four forces. Cities 2015, 47, 95–106. [Google Scholar] [CrossRef]
- Gooch, D.; Wolff, A.; Kortuem, G.; Brown, R. Reimagining the role of citizens in smart city projects. In Proceedings of the 2015 ACM International Joint Conference on Pervasive and Ubiquitous Computing, Osaka, Japan, 7–11 September 2015; pp. 1587–1594. [Google Scholar]
- Bulu, M. Upgrading a city via technology. Technol. Forecast. Soc. Chang. 2014, 89, 63–67. [Google Scholar] [CrossRef]
- Dameri, R.P. Searching for Smart City definition: A comprehensive proposal. Int. J. Comput. Tech. 2013, 5, 2544–2551. [Google Scholar] [CrossRef]
- Granier, B.; Kudo, H. How are citizens involved in smart cities? Analysing citizen participation in Japanese “smart Communities”. Inf. Polity 2016, 21, 61–76. [Google Scholar] [CrossRef]
- Fehér, K. Contemporary Smart Cities: Key Issues and Best Practices. In Proceedings of the SMART 2018: The Seventh International Conference on Smart Cities, Systems, Devices and Technologies Contemporary, Barcelona, Spain, 22–26 July 2018; pp. 5–10. [Google Scholar]
- Engelbert, J.; van Zoonen, L.; Hirzalla, F. Excluding citizens from the European smart city: The discourse practices of pursuing and granting smartness. Technol. Forecast. Soc. Chang. 2018, 142, 347–353. [Google Scholar] [CrossRef]
- Monfaredzadeh, T.; Krueger, R. Investigating Social Factors of Sustainability in a Smart City. Procedia Eng. 2015, 118, 1112–1118. [Google Scholar] [CrossRef]
- Szarek-Iwaniuk, P.; Senetra, A. Access to ICT in Poland and the co-creation of Urban space in the process of modern social participation in a smart city—A case study. Sustainability 2020, 12, 2136. [Google Scholar] [CrossRef]
- Kumar, H.; Singh, M.K.; Gupta, M.P.; Madaan, J. Moving towards smart cities: Solutions that lead to the Smart City Transformation Framework. Technol. Forecast. Soc. Chang. 2017, 153, 119281. [Google Scholar] [CrossRef]
- Schuurman, D.; Baccarne, B.; De Marez, L.; Mechant, P. Smart ideas for smart cities: Investigating crowdsourcing for generating and selecting ideas for ICT innovation in a city context. J. Theor. Appl. Electron. Commer. Res. 2012, 7, 49–62. [Google Scholar] [CrossRef]
- Vanolo, A. Is there anybody out there? The place and role of citizens in tomorrow’s smart cities. Futures 2016, 82, 26–36. [Google Scholar] [CrossRef]
- Shelton, T.; Lodato, T. Actually existing smart citizens. City 2019, 23, 35–52. [Google Scholar] [CrossRef]
- Cardullo, P.; Kitchin, R. Being a ‘citizen’ in the smart city: Up and down the scaffold of smart citizen participation. GeoJournal 2019, 84, 1–13. [Google Scholar] [CrossRef]
- Cortés-Cediel, M.E.; Cantador, I.; Bolívar, M.P.R. Analyzing citizen participation and engagement in European smart cities. Social Science Computer Review 2019, 39, 592–626. [Google Scholar] [CrossRef]
- Manfreda, A.; Ekart, N.; Mori, M.; Groznik, A. Citizens’ Participation as an Important Element for Smart City Development. IFIP Adv. Inf. Commun. Tech. 2020, 618, 274–284. [Google Scholar] [CrossRef]
- Castelnovo, W. Co-production Makes Cities Smarter: Citizens’ Participation in Smart City Initiatives. In Co-Production in the Public Sector; Fugini, M., Bracci, E., Sicilia, M., Eds.; Springer Briefs in Applied Sciences and Technology: Berlin/Heidelberg, Germany, 2016; pp. 97–117. [Google Scholar] [CrossRef]
- Georgiadis, A.; Christodoulou, P.; Zinonos, Z. Citizens’ perception of smart cities: A case study. Appl. Sci. 2021, 11, 2517. [Google Scholar] [CrossRef]
- Angelidou, M. Smart city policies: A spatial approach. Cities 2014, 41, S3–S11. [Google Scholar] [CrossRef]
- Gracias, J.S.; Parnell, G.S.; Specking, E.; Pohl, E.A.; Buchanan, R. Smart Cities—A Structured Literature Review. Smart Cities 2023, 6, 1719–1743. [Google Scholar] [CrossRef]
- Giffinger, R. Smart Cities: Ranking of European Medium-Sized Cities; Vienna University of Technology: Vienna, Austria, 2007. [Google Scholar]
- Greco, I.; Bencardino, M. The Paradigm of the Modern City: SMART and SENSEable Cities for Smart. Incl. Sustain. Growth 2014, 8580, 579–597. [Google Scholar]
- Cohen, B. The Smartest Cities in the World. Available online: https://www.fastcompany.com/3038765/the-smartest-cities-in-the-world (accessed on 7 August 2023).
- Bounazef Vanmarsenille, D.; Desdemoustier, J. Smart Cities, Baromètre Belge 2018. Stratégies et Projets Smart City en Belgique; Smart City Institute HEC Liège: Liège, Belgium, 2018; pp. 1–41. [Google Scholar]
- Desdemoustier, J.; Crutzen, N.; Cools, M.; Teller, J. Smart City appropriation by local actors: An instrument in the making. Cities 2019, 92, 175–185. [Google Scholar] [CrossRef]
- Greenfield, A. Practices of the minimum viable Utopia. Archit. Des. 2017, 87, 16–25. [Google Scholar] [CrossRef]
- Kummitha, R.K.R.; Crutzen, N. How do we understand smart cities? An evolutionary perspective. Cities 2017, 67, 43–52. [Google Scholar] [CrossRef]
- Shelton, T.; Zook, M.; Wiig, A. The “actually existing smart city”. Camb. J. Reg. Econ. Soc. 2015, 8, 13–25. [Google Scholar] [CrossRef]
- Salim, F.; Haque, U. Urban computing in the wild: A survey on large scale participation and citizen engagement with ubiquitous computing, cyber physical systems, and Internet of Things. Int. J. Hum. Comput. Stud. 2015, 81, 31–48. [Google Scholar] [CrossRef]
- Sepasgozar, S.M.E.; Hawken, S.; Sargolzaei, S.; Foroozanfa, M. Implementing citizen centric technology in developing smart cities: A model for predicting the acceptance of urban technologies. Technol. Forecast. Soc. Chang. 2017, 142, 105–116. [Google Scholar] [CrossRef]
- Cardullo, P.; Kitchin, R. Smart urbanism and smart citizenship: The neoliberal logic of ‘citizen-focused’ smart cities in Europe. Environ. Plan. C Polit. Space 2019, 37, 813–830. [Google Scholar] [CrossRef]
- Bertoldo, R.; Poumadère, M.; Rodrigues, L.C. When meters start to talk: The public’s encounter with smart meters in France. Energy Res. Soc. Sci. 2015, 9, 146–156. [Google Scholar] [CrossRef]
- Wolff, A.; Barker, M.; Hudson, L.; Seffah, A. Supporting smart citizens: Design templates for co-designing data-intensive technologies. Cities 2020, 101, 102695. [Google Scholar] [CrossRef]
- Ben Letaifa, S. How to strategize smart cities: Revealing the SMART model. J. Bus. Res. 2015, 68, 1414–1419. [Google Scholar] [CrossRef]
- Thomas, V.; Wang, D.; Mullagh, L.; Dunn, N. Where’s wally? In search of citizen perspectives on the smart city. Sustainability 2016, 8, 207. [Google Scholar] [CrossRef]
- Kummitha, R.K.R. Why distance matters: The relatedness between technology development and its appropriation in smart cities. Technol. Forecast. Soc. Chang. 2020, 157, 120087. [Google Scholar] [CrossRef]
- Marsal-Llacuna, M.L.; Segal, M.E. The Intelligenter Method (I) for making “smarter” city projects and plans. Cities 2016, 55, 127–138. [Google Scholar] [CrossRef]
- Schuurman, D.; De Moor, K.; De Marez, L.; Evens, T. Investigating user typologies and their relevance within a living lab-research approach for ICT-innovation. In Proceedings of the 2010 43rd Hawaii International Conference on System Sciences, Honolulu, HI, USA, 5–8 January 2010; pp. 1–10. [Google Scholar] [CrossRef]
- Kitchin, R.; Cardullo, P.; Di Feliciantonio, C. Citizenship, Justice, and the Right to the Smart City. In Right Smart City; Emerald Publishing Limited: Bingley, UK, 2019; pp. 1–24. [Google Scholar] [CrossRef]
- Fletcher, V. A neighborhood fit for people. In Universal Design Handbook; Preiser, W., Ostroff, E., Eds.; McGraw-Hil: New York, NY, USA, 2001; pp. 60.1–60.15. [Google Scholar]
- Verhulst, L.; Elsen, C.; Heylighen, A. Whom do architects have in mind during design when users are absent? Observations from a design competition. J. Des. Res. 2016, 14, 19. [Google Scholar] [CrossRef]
- Vanolo, A. Smartmentality: The Smart City as Disciplinary Strategy. Urban Stud. 2014, 51, 883–898. [Google Scholar] [CrossRef]
- Harrison, K. Who is the assumed user in the Smart City? In Designing, Developing, and Facilitating Smart Cities; Angelakis, V., Ed.; Springer: Berlin/Heidelberg, Germany, 2017; pp. 17–32. [Google Scholar] [CrossRef]
- Simonofski, A.; Serral Asensio, E.; Wautelet, Y. Citizen participation in the design of smart cities: Methods and management framework. Smart Cities Issues Chall. Mapp. Polit. Soc. Econ. Risks Threats 2019, 2019, 47–62. [Google Scholar] [CrossRef]
- Andone, D.; Holotescu, C.; Grosseck, G. Learning communities in smart cities. Case studies. In Proceedings of the 2014 International Conference on Web and Open Access to Learning (ICWOAL) 2014, Dubai, United Arab Emirates, 25–27 November 2015. [Google Scholar] [CrossRef]
- Buchanan, K.; Banks, N.; Preston, I.; Russo, R. The British public’s perception of the UK smart metering initiative: Threats and opportunities. Energy Policy 2016, 91, 87–97. [Google Scholar] [CrossRef]
- Binder, T.; Brandt, E.; Gregory, J. Design participation(-s). CoDesign 2008, 4, 1–3. [Google Scholar] [CrossRef]
- Luck, R. Participatory design in architectural practice: Changing practices in future making in uncertain times. Des. Stud. 2018, 59, 139–157. [Google Scholar] [CrossRef]
- Simonofski, A.; Asensio, E.S.; De Smedt, J.; Snoeck, M. Hearing the Voice of Citizens in Smart City Design: The CitiVoice Framework. Bus. Inf. Syst. Eng. 2019, 61, 665–678. [Google Scholar] [CrossRef]
- Kostof, S. Foreword. Architects’ People; Ellis, R., Cuff, D., Eds.; OUP: New York, NY, USA, 1989; pp. ix–xx. [Google Scholar]
- Wilkie, A. Regimes of design, logics of users. Athenea Digit. 2011, 11, 317–334. [Google Scholar] [CrossRef]
- Wilkie, A. User Assemblages in Design: An Ethnographic Study. Ph.D. Thesis, Goldsmiths, University of London, London, UK, 2010. [Google Scholar]
- Hoffman, M.C. Smart Cities: A Review of the Most Recent Literature. Informatiz. Policy 2020, 27, 3–35. [Google Scholar]
- Lee, R.S.T. Chapter 12—Smart City. In Artificial Intelligence in Daily Life; Springer: Singapore, 2020; pp. 321–345. [Google Scholar] [CrossRef]
- Hasler, S.; Chenal, J.; Soutter, M. Digital tools and citizen participation. In Proceedings of the 3rd Annual International Conference on Urban Planning and Property Development (UPPD2017), Singapore, 9–10 October 2017. [Google Scholar]
- International Association for Public Participation IAP2 IAP2’s Spectrum of Public Participation. 2018. Available online: https://www.iap2canada.ca/resources/FR/Documents/AIP2Canada-Spectrum-FINAL-2016.pdf (accessed on 7 August 2023).
- Edwards, A.L. The relationship between the judged desirability of a trait and the probability that the trait will be endorsed. J. Appl. Psychol. 1953, 37, 90–93. [Google Scholar] [CrossRef]
- Jain, A.K. Data clustering: 50 years beyond K-means. Pattern Recognit. Lett. 2010, 31, 651–666. [Google Scholar] [CrossRef]
- Laere, S.; Buyl, R.; Nyssen, M. A method for detecting behavior-based user profiles in collaborative ontology engineering. In Proceedings of the On the Move to Meaningful Internet Systems: OTM 2014 Conferences, Amantea, Italy, 27–31 October 2014; pp. 657–673. [Google Scholar]
- Ben Salem, S.; Naouali, S.; Sallami, M. Clustering Categorical Data Using the K-Means Algorithm and the Attribute’s Relative Frequency. Int. J. Comput. Electr. Autom. Control Inf. Eng. 2017, 11, 657–662. [Google Scholar]
- Kodinariya, T.M.; Makwana, P.R. Review on determining number of Cluster in K-Means Clustering. Int. J. Adv. Res. Comput. Sci. Manag. Stud. 2013, 1, 90–95. [Google Scholar]
- Grudin, J.; Pruitt, J. Personas, Participatory Design and Product Development: An Infrastructure for Engagement. Proc. Pdc 2002, 2, 144–152. [Google Scholar]
- Tompson, T. Understanding the Contextual Development of Smart City Initiatives: A Pragmatist Methodology. She Ji 2017, 3, 210–228. [Google Scholar] [CrossRef]
- Schelings, C.; Elsen, C. Smart City concepts: From perception to acceptability. In Proceedings of the 21th Conference of the Environmental and Sustainability Management Accounting Network (EMAN), HEC Liège, Liège, Belgium, 27–29 June 2017; p. 3. [Google Scholar]
- Bertino, E. The Quest for Data Transparency. IEEE Secur. Priv. 2020, 18, 67–68. [Google Scholar] [CrossRef]
- Kitchin, R. The real-time city? Big data and smart urbanism. GeoJournal 2014, 79, 1–14. [Google Scholar] [CrossRef]
- So, C.; Joo, J. Does a Persona Improve Creativity? Des. J. 2017, 20, 459–475. [Google Scholar] [CrossRef]
- Lallemand, C.; Gronier, G. Méthodes de Design UX: 30 Méthodes Fondamentales pour Concevoir et Évaluer les Systèmes Interactifs; Eyrolles: Paris, France, 2015. [Google Scholar]
- Esposito, G.; Terlizzi, A.; Guarino, M.; Crutzen, N. Interpreting digital governance at the municipal level: Evidence from smart city projects in Belgium. Int. Rev. Adm. Sci. 2023. [Google Scholar] [CrossRef]
- Desdemoustier, J.; Crutzen, N.; Giffinger, R. Municipalities’ understanding of the Smart City concept: An exploratory analysis in Belgium. Technol. Forecast. Soc. Chang. 2019, 142, 129–141. [Google Scholar] [CrossRef]
- Esposito, G.; Clement, J.; Mora, L.; Crutzen, N. One size does not fit all: Framing smart city policy narratives within regional socio-economic contexts in Brussels and Wallonia. Cities 2021, 118, 103329. [Google Scholar] [CrossRef]
Disclaimer/Publisher’s Note: The statements, opinions and data contained in all publications are solely those of the individual author(s) and contributor(s) and not of MDPI and/or the editor(s). MDPI and/or the editor(s) disclaim responsibility for any injury to people or property resulting from any ideas, methods, instructions or products referred to in the content. |
© 2023 by the authors. Licensee MDPI, Basel, Switzerland. This article is an open access article distributed under the terms and conditions of the Creative Commons Attribution (CC BY) license (https://creativecommons.org/licenses/by/4.0/).

