Article

Data-Driven Approach for Urban Micromobility Enhancement through Safety Mapping and Intelligent Route Planning

1
CITTA—Research Centre for Territory, Transports and Environment, Department of Civil Engineering, University of Coimbra, 3030-790 Coimbra, Portugal
2
CycleAI, 1800-359 Lisbon, Portugal
3
Division of Cancer, Department of Surgery and Cancer, Faculty of Medicine, Imperial College London, London SW7 2AZ, UK
4
Faculty of Sciences, University of Porto, 4169-007 Porto, Portugal
5
Faculty of Engineering, University of Porto, 4200-465 Porto, Portugal
*
Author to whom correspondence should be addressed.
Smart Cities 2023, 6(4), 2035-2056; https://doi.org/10.3390/smartcities6040094
Submission received: 19 July 2023 / Revised: 14 August 2023 / Accepted: 14 August 2023 / Published: 17 August 2023
(This article belongs to the Section Smart Transportation)

Abstract

:
Micromobility responds to urban transport challenges by reducing emissions, mitigating traffic, and improving accessibility. Nevertheless, the safety of micromobility users, particularly cyclists, remains a concern in urban environments. This study aims to construct a safety map and a risk-averse routing system for micromobility users in diverse urban environments, as exemplified by a case study in Lisbon. A data-driven methodology uses object detection algorithms and image segmentation techniques to identify potential risk factors on cycling routes from Google Street View images. The ‘Bikeable’ Multilayer Perceptron neural network measures these risks, assigning safety scores to each image. The method analyzed 5321 points across 24 parishes in Lisbon, with an average safety score of 4.5, indicating a generally safe environment for cyclists. Carnide emerged as the safest area, while Alcântara exhibited a higher level of potential risks. Additionally, an equation is proposed to compute route efficiency, enabling comparisons between different routes for identical origin-destination pairs. Preliminary findings suggest that the presented routing solution exhibits higher efficiency than the commercial routing benchmark. Risk-averse routes did not result in a substantial rise in travel distance or time, with increments of 7% on average. The study also contributed to increasing the existing amount of cycle path data in Lisbon by 12%, correcting inaccuracies, and updating the network in OpenStreetMap, providing access to more precise information and, consequently, more routes. The key contributions of this study, such as the safety map and risk-averse router, underscore the potential of data-driven tools for boosting urban micromobility. The solutions proposed demonstrate modularity and adaptability, making them fit for a range of urban scenarios and highlighting their value for cities prioritizing safe, sustainable urban mobility.

1. Introduction

Growing demands for accessibility, speed, and efficiency in transportation, due to a rapid increase in population and urbanization in recent decades, impose significant challenges on urban transportation [1,2,3]. Micromobility presents an opportunity to redesign cities for people, offering complementary alternatives to traditional transport and making it possible to improve the accessibility of cities, especially for the first-and-last-mile [4,5]. Transportation infrastructure is crucial for urban areas to promote a thriving economy and quality of life. Effective systems can mitigate congestion and pollution, enhance social equity, and stimulate economic development [6,7]. Inadequate infrastructure can reduce productivity and perpetuate inequality, underscoring the need for accessible and efficient solutions that meet the diverse requirements of urban inhabitants [8,9].
To address these challenges, cities are adopting innovative transportation solutions like bike-sharing, electric vehicles, and digital technologies to improve transportation efficiency and accessibility. However, ensuring equitable access to transportation requires a multifaceted approach involving infrastructure investment, policy changes, and community engagement [10,11]. To make cities more livable, sustainable, and equitable, there is a growing movement to prioritize pedestrians, cyclists, and public transit [12,13,14]. This includes investing in safe and accessible pedestrian and cycling infrastructure, focusing on public transport, and promoting social interaction and a sense of community. Redesigning cities for people also has significant health benefits, such as reducing rates of obesity and related health problems, improving mental health, and reducing air pollution [15,16].
Despite the well-documented benefits of cycling, its adoption as a primary mode of transport remains limited due to various challenges, as outlined by studies from Kaltenbrunner et al. [17] and Félix et al. [18]. Different studies indicate that usage patterns can significantly vary based on factors like commuting, leisure, and shopping [17]. Predictive models can improve efficient planning and bike redistribution [17]. Additionally, barriers such as safety concerns, a lack of robust cycling infrastructure, and issues around bicycle ownership need to be addressed [18]. It is also essential to align the motivations of potential and existing cyclists, considering both improvements to infrastructure and personal or environmental reasons [18].
On the other hand, there is evidence that replacing short car trips with cycling can improve health, air quality, and the environment [19,20,21,22]. The application of deep learning to road safety carries transformative potential, as previously explored by various researchers [23,24,25,26,27,28]. It introduces a level of sophistication and precision to safety measures that were previously unattainable. By leveraging advanced technology, it becomes possible to identify hazards, plan routes, and anticipate potential risks in real-time.
Incorporating micromobility into urban transport can significantly improve mobility, but challenges persist. Blending micromobility and public transport can enhance accessibility and decrease private car usage, as suggested by Oeschger et al. [29]. Moreover, the popularity of e-micromobility vehicles, such as e-scooters and e-bikes, is rapidly growing and plays a meaningful role in promoting sustainability in cities, as stated by Sengül and Mostofi [30]. However, questions remain about optimal practices for using, parking, storing, and operating these vehicles, as noted by Tice [31]. McQueen et al. [32] underscore that the impact of micromobility on sustainability is varied and that more focused strategies are required to ensure its continued expansion.
In the wake of the COVID-19 pandemic, governments worldwide are promoting micromobility as a sustainable and resilient transportation option [33]. This trend aligns with a broader commitment to eco-friendly urban practices and public health risk mitigation. Since 2020, people’s mobility patterns have been transformed with changes in commuting habits and the accelerated adoption of sustainable transport modes [34]. These changes underscore the need to advance urban micromobility through safety mapping and intelligent route planning.
This paper introduces a comprehensive and modular approach to tackle urban transportation challenges by promoting micromobility as a viable, safe, and sustainable alternative. The goal is to offer safe routes for micromobility users in Lisbon, Portugal. The method utilizes Google Street View (GSV) images as a data source and combines object detection, semantic image segmentation, and a proprietary neural network called Bikeable [35]. By employing advanced computer vision and deep learning techniques, images of Lisbon are processed to create a safety map and a smart route planner for the city’s micromobility users. A similar approach was developed for the City of London in 2020 by Rita et al. [36], in which the objective was to identify risk factors for cyclists.
Figure 1 briefly describes the framework configuration adopted in this study. The procedure initiates with the input of images captured from randomly chosen locations within the study area. Four images are collected for each point, taken at 90, 180, 270, and 360 degrees. These images undergo object detection and image segmentation algorithms for analysis. Following this step, the processed images are evaluated using Bikeable [35], which ranks them on a safety scale from 1 (least safe) to 10 (safest). In the safety map output, orange points denote areas with identified risk factors. The deeper the orange hue, the higher the associated risk. For safety routing, the orange line represents a path determined by the developed routing system.
Consequently, the output includes a detailed safety map and an intelligent route planner that generates paths circumventing the detected risk points. This planner provides three routing options: shortest (avoids risk points less than three), balanced (avoids risk points less than four), and safest (avoids risk points less than five). This paper seeks to improve user safety by leveraging computer vision, machine learning, and deep learning techniques. It achieves this by integrating these technologies into a coherent system that produces a comprehensive visualization of safety levels across the city and a practical tool that enables cyclists and other micro-mobility users to plan safe routes.
This study centers on image analysis to assess the safety of specific locations in an urban environment. By recognizing and analyzing objects and their contexts, the research aims to offer a holistic insight into the elements impacting road safety for micromobility users. This approach prioritizes environmental factors without directly considering aspects such as fatalities, severe injuries, or individual cycling comfort.
This study is structured across six chapters. Section 2 elucidates key concepts and tools such as object detection and semantic segmentation, underscoring their importance for micromobility user safety. Section 3 lays out the methodologies adopted to construct a safety map and routing system for micromobility. The application of these methodologies to a case study in Lisbon is detailed in Section 4. Section 5 delves into the study’s findings, including a discussion of associated challenges and limitations. The paper concludes with Section 6, which encapsulates the primary insights gained from the research.

2. Background

Object detection has been widely researched and applied to various fields, including urban transportation and micromobility. Using GSV images, object detection can identify multiple objects of interest in urban areas, such as recurring stationary objects, signs, and obstacles [37,38,39]. GSV images are a valuable big data source for predicting urban mobility patterns [40] and evaluating the safety and accessibility of micromobility options in cities [41]. Additionally, in order to assess bikeability, many methods have been used [42], including street-view images [41,43]. Object detection has been used in the context of micromobility to extract road information and detect cyclists from GSV images, enriching existing data [44]. Cyclist detection has been the subject of active research in object detection, with promising results [45,46]. These studies demonstrate the versatility and potential of object detection in urban transportation, particularly in the rapidly evolving field of micromobility.
Semantic segmentation, proven to effectively segment roads from street-view images [47,48], is also adept at extracting valuable information from these images [49]. This research blends image segmentation techniques with object detection algorithms to enable safe, quick, and cost-effective journeys for micromobility users. This novel approach addresses the burgeoning presence of micromobility in urban spaces and associated safety concerns. The overarching goal of such an initiative is to contribute to creating more sustainable and people-centric urban environments.

2.1. Micromobility Expansion in Cities

The rapid growth of urban populations has led to increased demands for transportation options that are efficient, affordable, and sustainable [31,50,51]. In response, micromobility has emerged as an alternative solution, offering new ways for people to move within urban areas [31,32,52,53]. Micromobility is a new umbrella term that encompasses a range of small, lightweight vehicles such as bicycles, e-bikes, e-scooters, and shared mobility devices typically suited for short-distance trips [53]. This mode of transportation comprises various options, such as walking, cycling (traditional), e-bikes, and e-scooters (emerging), among others [54].
Technological advances, the rise of the sharing economy, and the shift in public attitudes towards sustainable transportation have all contributed to the increased prominence of micromobility [53]. This form of transportation offers many benefits, including reduced traffic congestion, decreased carbon emissions, enhanced accessibility, and improved health and well-being for urban residents [55].
As urban landscapes evolve, cities are evolving to become more people-friendly by promoting diversity and mobility options. It is within this context that micromobility has emerged as an important component in reshaping urban transportation systems [32,56]. Not only does micromobility mitigate emissions and reduce individual car use, but it also addresses social inequalities by providing a more affordable and egalitarian solution [32].
However, the integration of micromobility into existing urban systems comes with challenges. The primary issues revolve around user safety and the conflicts arising from sharing space with established modes of mobility, such as pedestrians and traditional cyclists. While these problems are recognized, research and development in this field continue to seek ways to mitigate risks and improve the harmonious coexistence of various mobility options within the urban landscape.

2.2. Micromobility Safety Issues

Despite the advantages of micromobility, addressing safety concerns is essential for its continued growth and acceptance in urban environments [57,58]. Micromobility users face various risks, including accidents, inadequate infrastructure, conflicts with other road users, and irresponsible behavior. In 2018, approximately 41,000 cyclists lost their lives, representing 3% of traffic-related deaths, with potentially even more fatalities among other micromobility users [59]. These users are particularly vulnerable, as they have limited protection against cars in the event of an accident [55].
Collisions that involve motor vehicles, cyclists, and pedestrians can lead to serious injuries or fatalities. On the other hand, accidents involving cyclists and pedestrians, excluding motor vehicles, seldom result in death or significant harm [55]. So, by taking automobiles out of the equation, lives are saved. Likewise, contributing factors to accidents can include inadequate infrastructure, user behavior, and visibility issues [58]. Many cities lack the necessary infrastructure to support safe micromobility usage, such as dedicated bike lanes, safe intersections, and secure parking facilities [60]. Poorly maintained roads and pathways, particularly those with defects like potholes, can significantly hinder micromobility. These defects not only increase transportation operating costs [61], but also present potential safety hazards for micromobility users. Abrupt changes in road surfaces can cause accidents, especially for those on small, lightweight vehicles like bicycles and e-scooters, where stability is crucial.
Conflicts between micromobility users, pedestrians, and motor vehicles can arise due to a lack of clear guidelines and regulations governing their interactions, as well as misunderstandings about the rights and responsibilities of each group [58]. Inexperienced or irresponsible micromobility users can put themselves and others at risk by not following traffic rules, riding under the influence of alcohol or drugs, or misusing devices, such as riding e-scooters on sidewalks [57]. E-scooter regulations vary widely among jurisdictions, impacting the extent and nature of safety issues [57]. The lack of consistency in the law has already led to differing road rules for powered micro-vehicles in different jurisdictions [58]. Existing road safety measures were primarily designed to evaluate motor vehicle crashes and must be better suited for alternate or emerging modes of micromobility transportation, particularly e-scooters [62].

2.3. NVIDIA Semantic Segmentation

The NVIDIA Semantic Segmentation algorithm uses a deep learning-based approach to semantic image segmentation. This method assigns semantic labels to each pixel in an image using convolutional neural networks, multi-scale inference, and hierarchical attention mechanisms for improved accuracy. The implementation of this algorithm by NVIDIA has achieved state-of-the-art performance on benchmark datasets such as Cityscapes and Mapillary Vistas [63].

2.4. YOLOv5

In 2015, Redmon et al. [64] introduced YOLO (You Only Look Once), a new approach to object detection, in their publication “You Only Look Once: Unified, Real-Time Object Detection”. At the time, the dominant method for object detection was Region-based Convolutional Neural Networks (RCNN), which were accurate but slow due to their multi-step process. YOLO aimed to improve speed by detecting objects in a single shot, using a single convolutional neural network to process the entire image.
Redmon et al. [64] developed the first three versions of YOLO (v1–v3), with later versions developed by other authors. The version used in this work is YOLOv5, which was released for the first time in May 2020; since then, it has been constantly updated. The latest release (YOLOv5 v7.0) is dated November 2022 [65] and is a cutting-edge object detection algorithm known for its high accuracy [66]. It is widely used in computer vision applications such as autonomous vehicles, robotics, industrial automation, medical applications, and video surveillance.
The YOLOv5 architecture comprises three main parts: Backbone, Neck, and Head. Backbone takes the imputed images and forms features at different levels of granularity. The Neck brings these features together and transfers them to the prediction layer. Finally, the Head component predicts features and generates bounding boxes and classifications for each object [65].

2.5. Bikeable

A new approach to urban mobility and safety for micromobility users has been developed by implementing a unique neural network called Bikeable. This neural network is designed to predict safety scores from images using a combination of inputs, including object detection and image semantic segmentation. Training for the Bikeable network was based on data obtained through crowdsourcing, where participants were requested to select the safer image from a pair of options. The output of this neural network consists of safety scores for each image, and, after cross-validation, it exhibited an accuracy of 70% [35].
Therefore, the image semantic segmentation algorithm discerns the overall context within the images, whereas the object detection algorithm precisely identifies individual objects. With this combined information, Bikeable assesses and allocates a safety score to every image.
A pipeline that processes input data from YOLOv5x6 object detection and NVIDIA image semantic segmentation has been established. The data are then passed through the Bikeable neural network to generate safety scores as an output. These safety scores are now employed to generate high-resolution safety maps, leveraging GSV imagery.

2.6. OpenRouteService and OpenStreetMap

After generating the safety points in a given city, routing is provided by OpenRouteService, an open-source routing platform developed by the Heidelberg Institute for Geoinformation Technology (HeiGIT) [67], using data from OpenStreetMap (OSM).
OpenStreetMap is an open-source map database that provides users with detailed information about streets, buildings, landmarks, and other features of the physical world. Using OSM instead of traditional map services such as Google Maps or TomTom has some advantages. First, given that OSM relies on contributions from millions of volunteers around the globe who update the maps regularly, the maps are updated and provided in real-time. In contrast, proprietary data sources are often updated infrequently. Additionally, because OpenStreetMap is free to use and share under an open license agreement, developers have access to all the necessary tools they need to build custom routing applications tailored to their specific needs without worrying about licensing fees or restrictions, which is the case for this work (routes that should avoid danger spots).

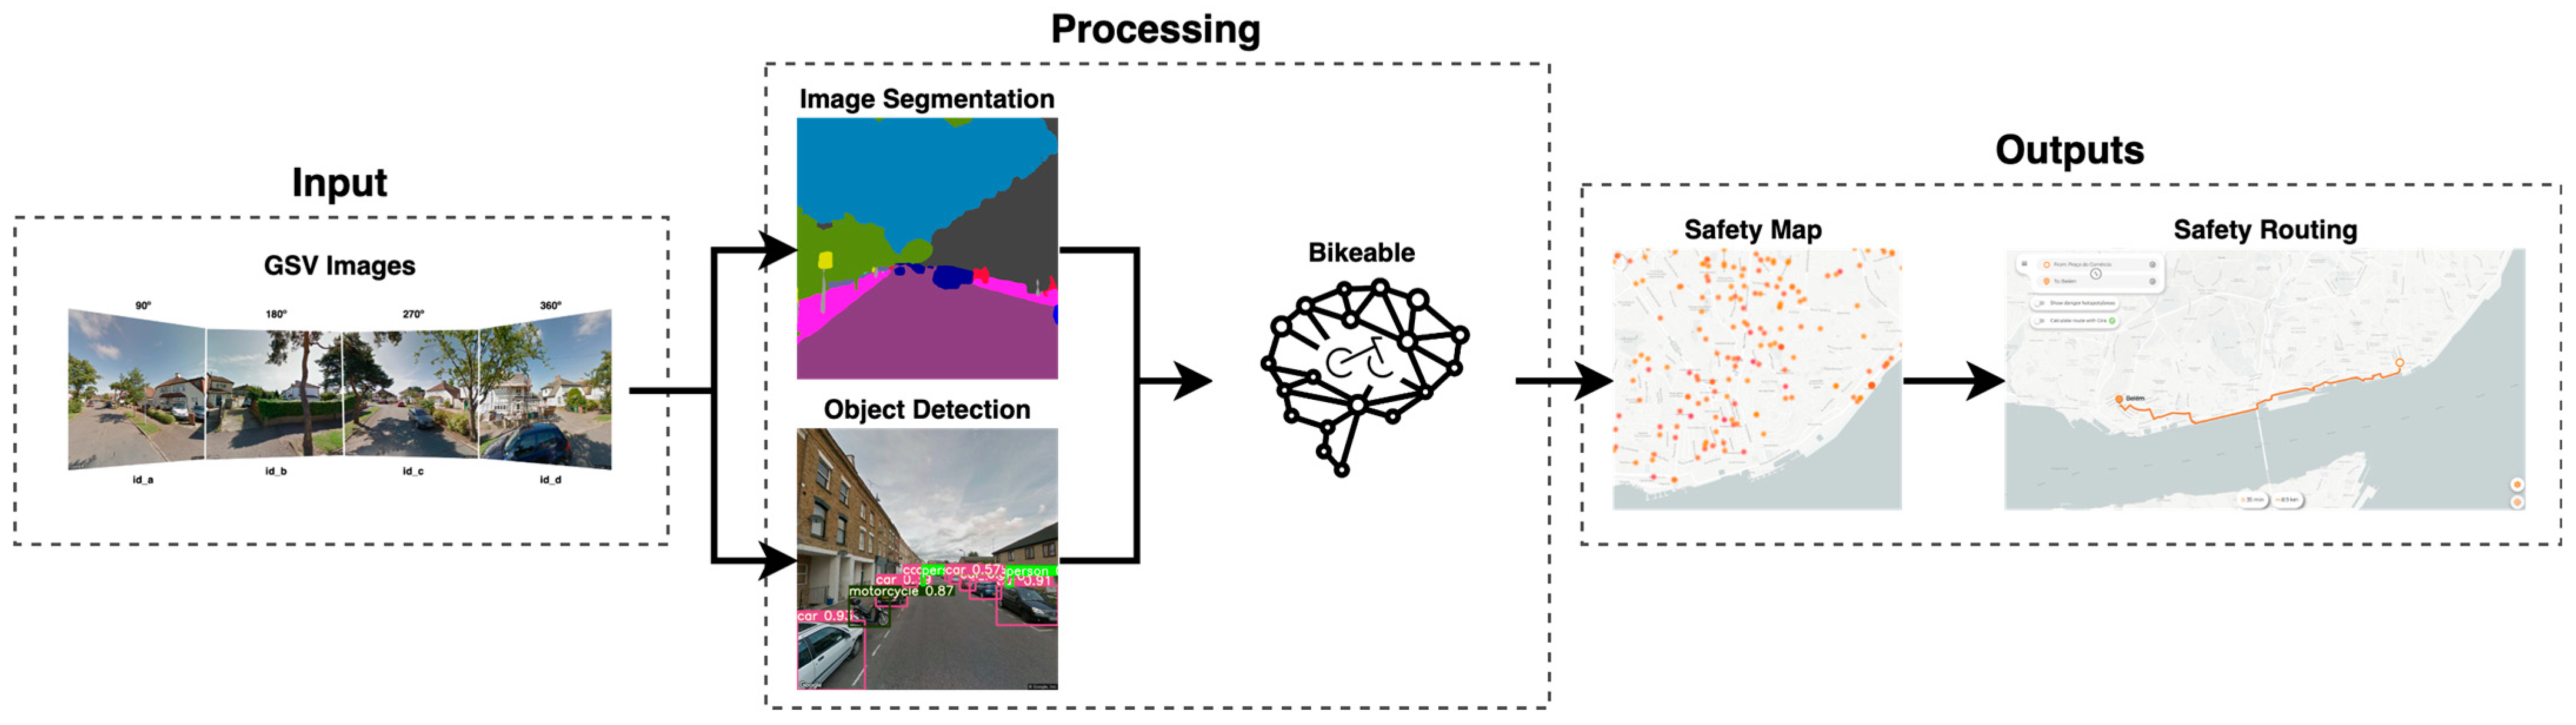
3. Materials and Methods

This section may be divided by subheadings. It should provide a concise and precise description of the experimental results, their interpretation, as well as the experimental conclusions that can be drawn.
The primary objective of this study centers on devising safe and efficient travel alternatives for micromobility users. To this end, a safety map delineating high-risk points was developed, and a routing system was constructed to facilitate effective travel by circumventing these points. This section offers a comprehensive overview of the methodology employed to achieve these objectives, harnessing GSV and AI techniques in the established framework. The procedure is based on object detection via YOLOv5x6, image semantic segmentation using NVIDIA’s model, and a bikeable neural network. Moreover, a case study was undertaken to illustrate the practical application of this solution, with the efficiency of the developed router factor evaluated in a real-world context. This case study will be further elaborated upon in the following chapter.
The GSV imagery serves as the data source for evaluating the safety of various locations. Google Street View, a widely used platform, offers panoramic images of streets and urban areas captured by GSV’s vehicles. The extensive coverage and availability of these images make them a valuable resource for analyzing urban environments and infrastructure.
The proposed framework, as illustrated in Figure 2, consists of four main stages: preparation, data collection, processing, and outputs. These steps work together to create the pipeline.
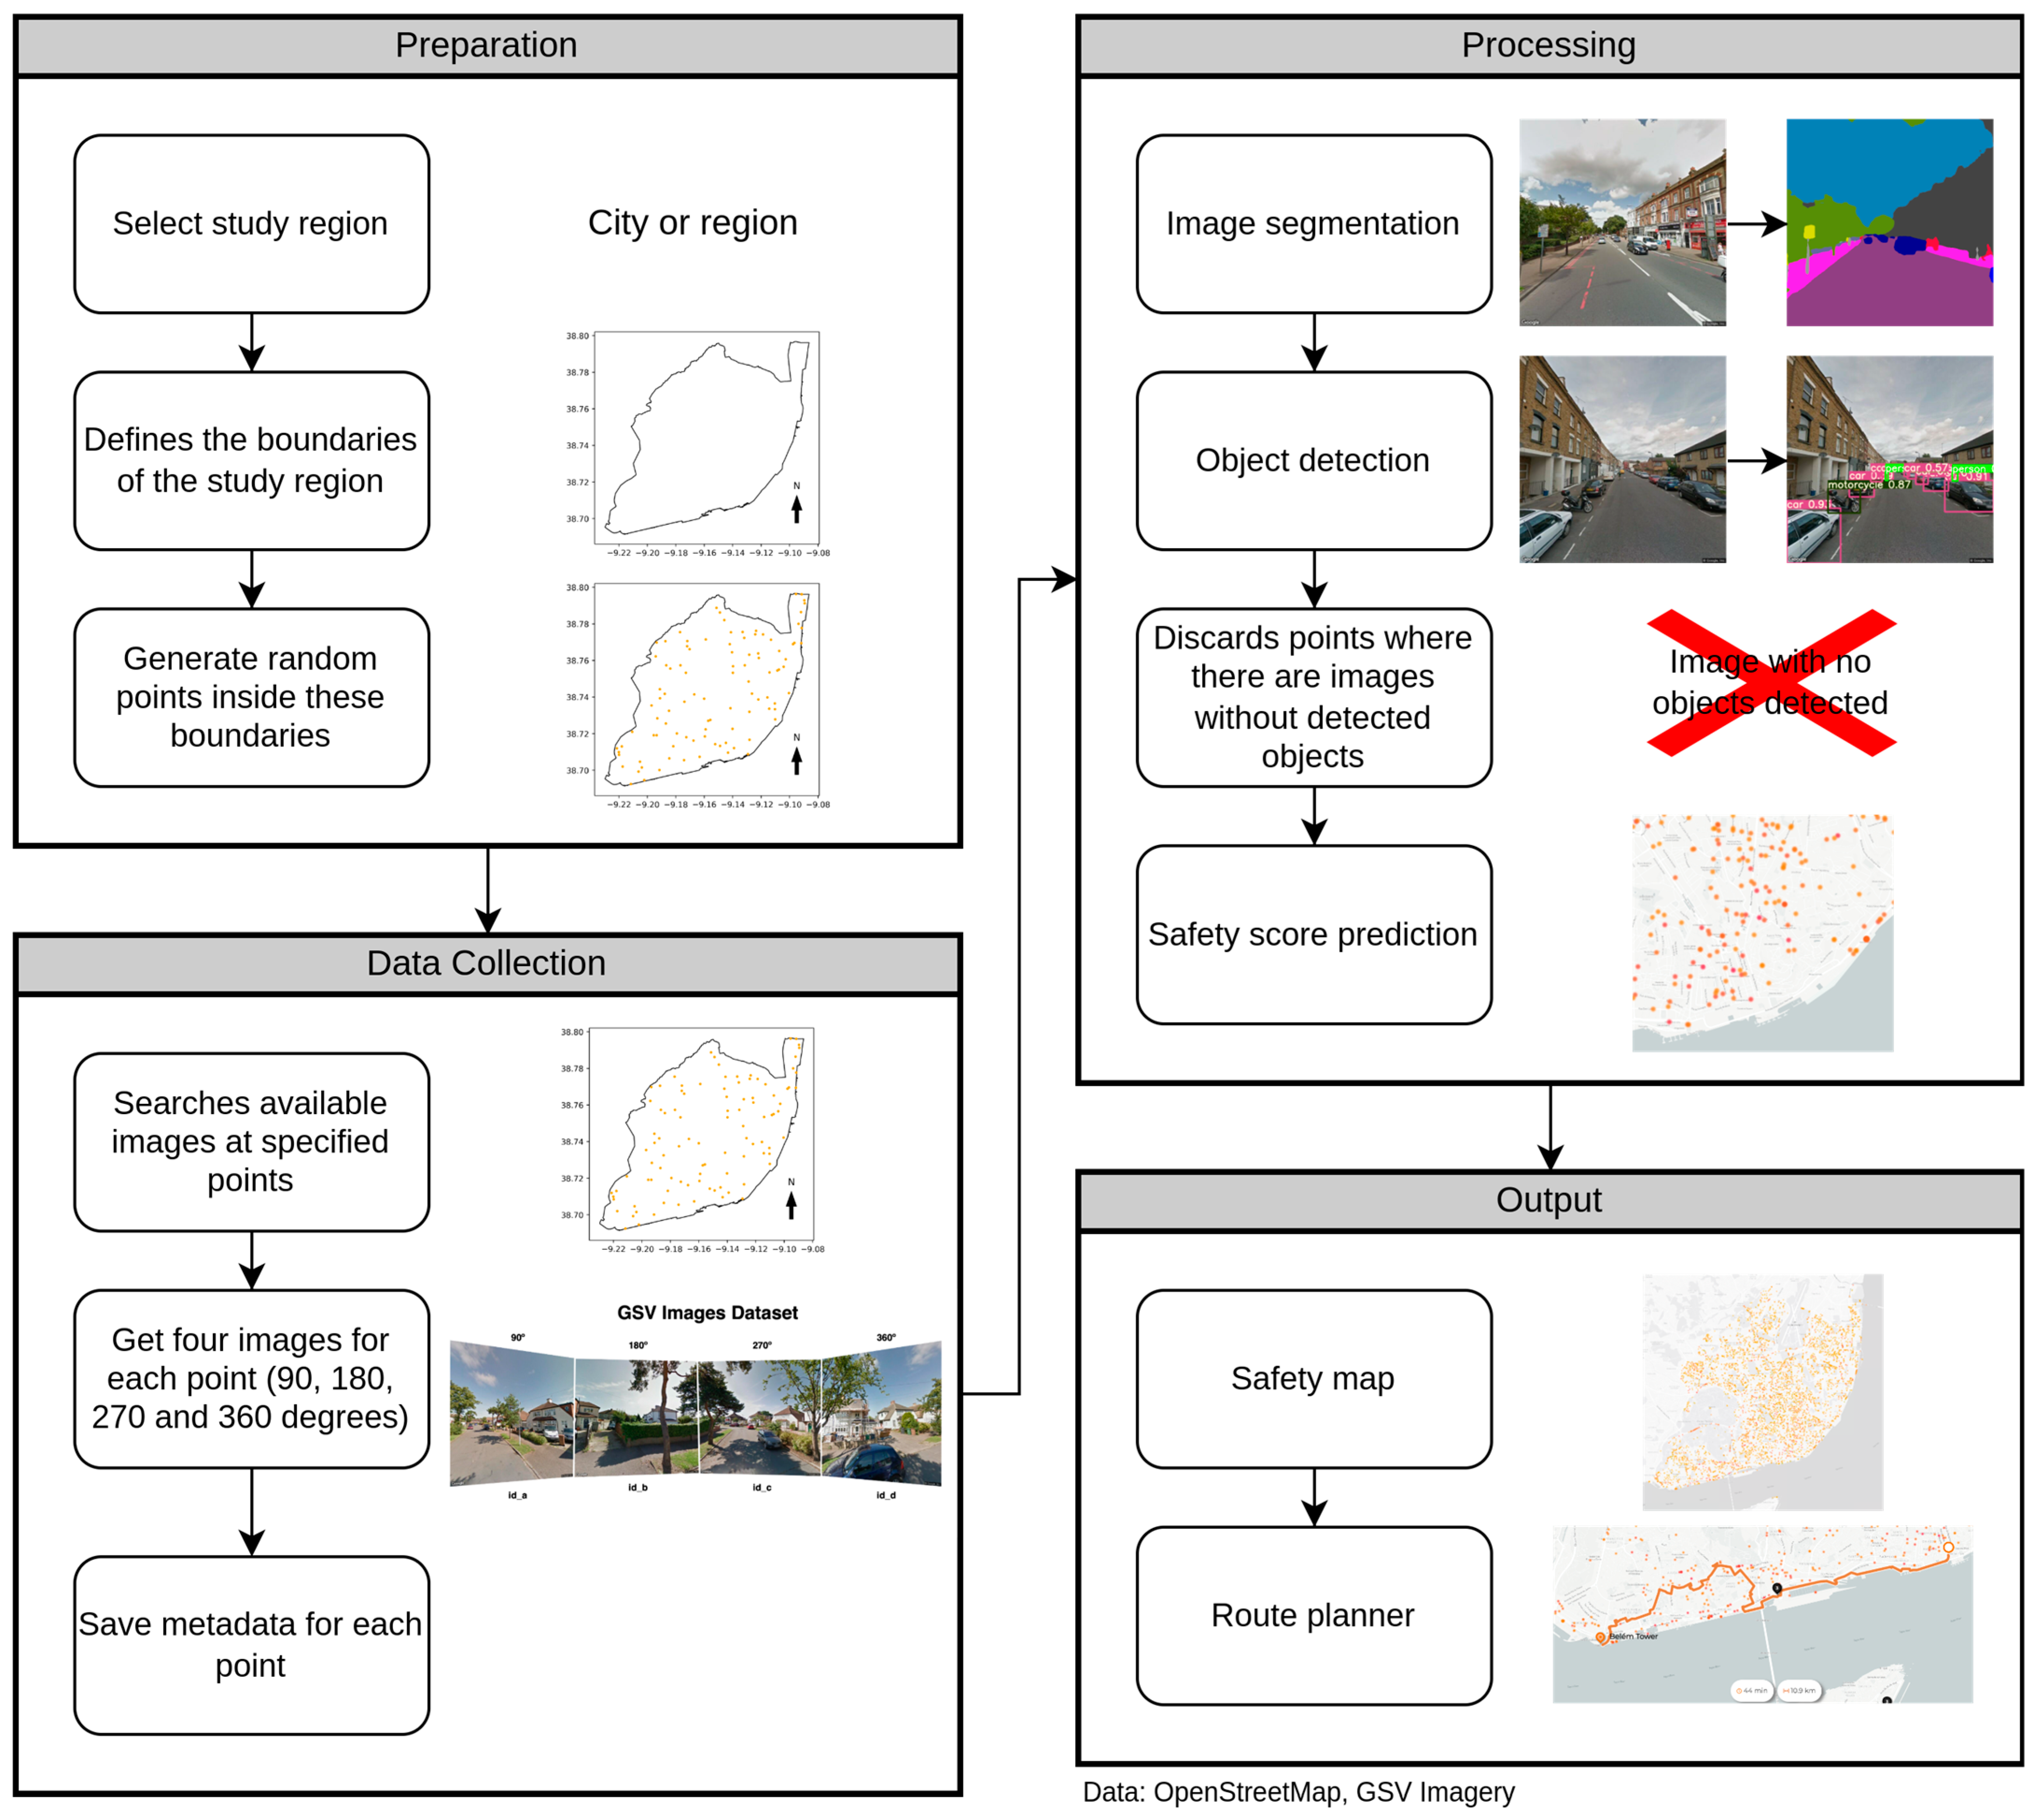
  • Preparation: The study zone was selected in this stage, and boundaries are defined based on the geographic data of the region under analysis. Random latitude and longitude coordinates were generated using a uniform distribution.
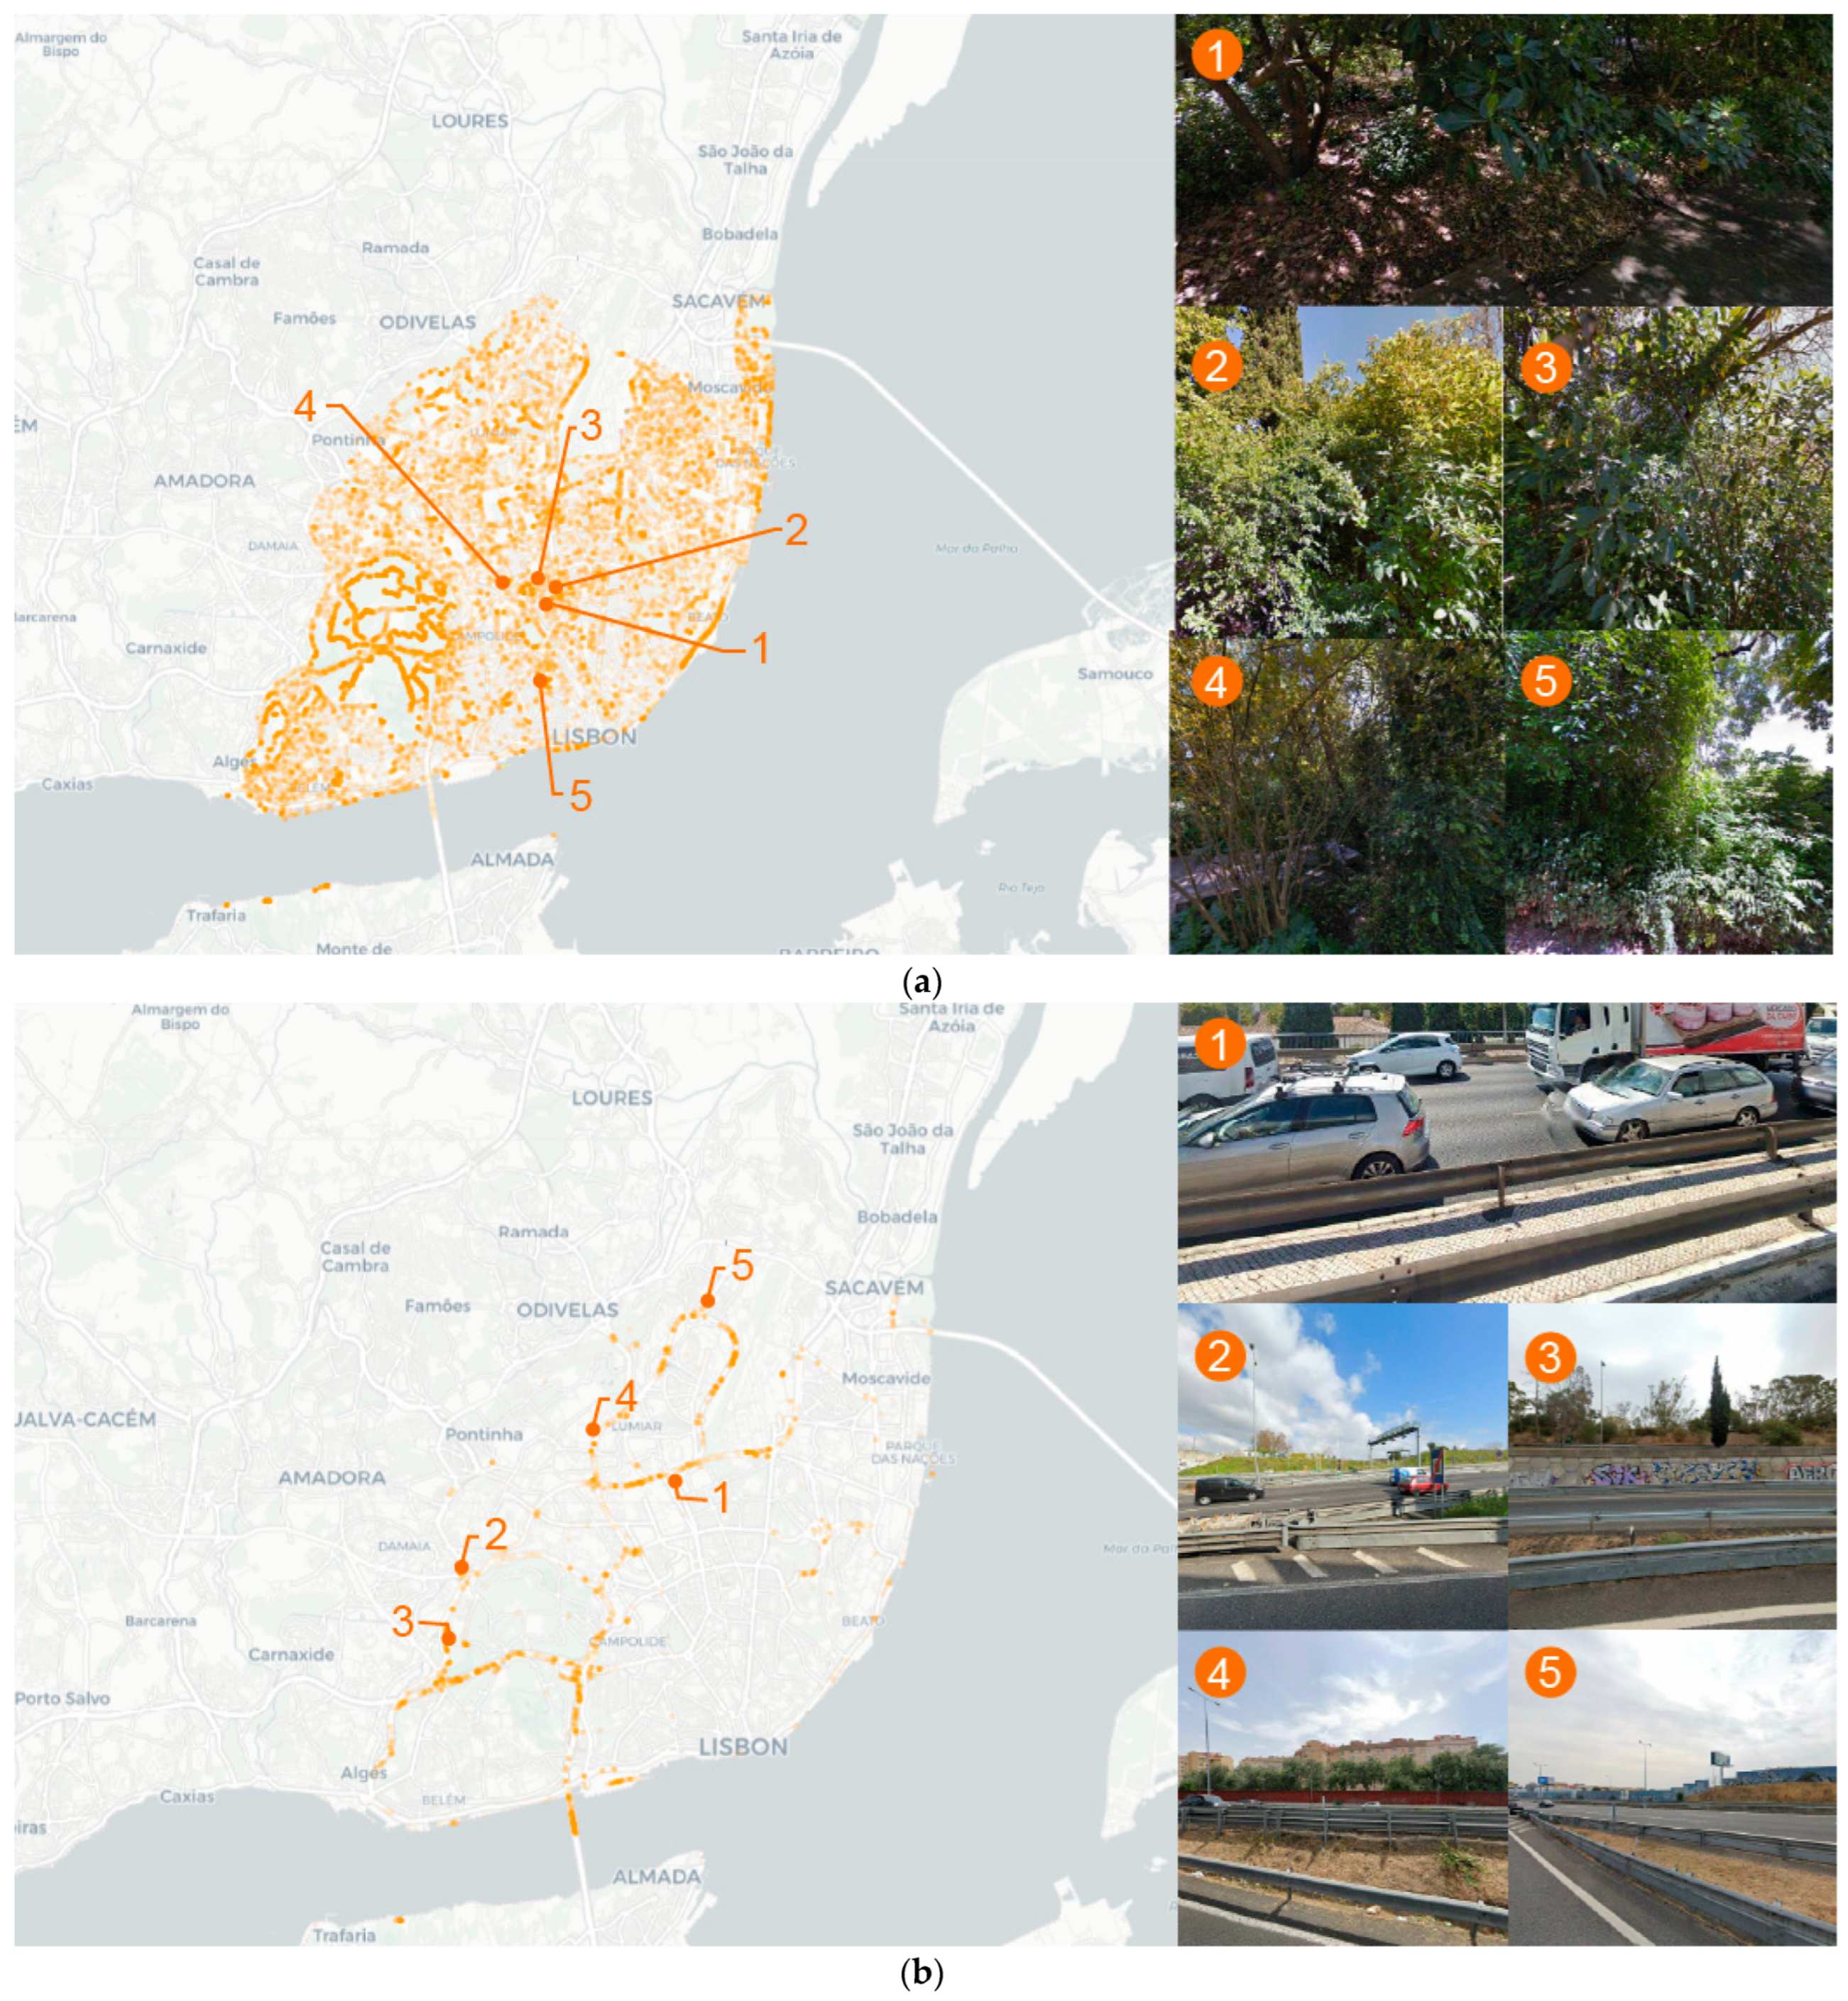
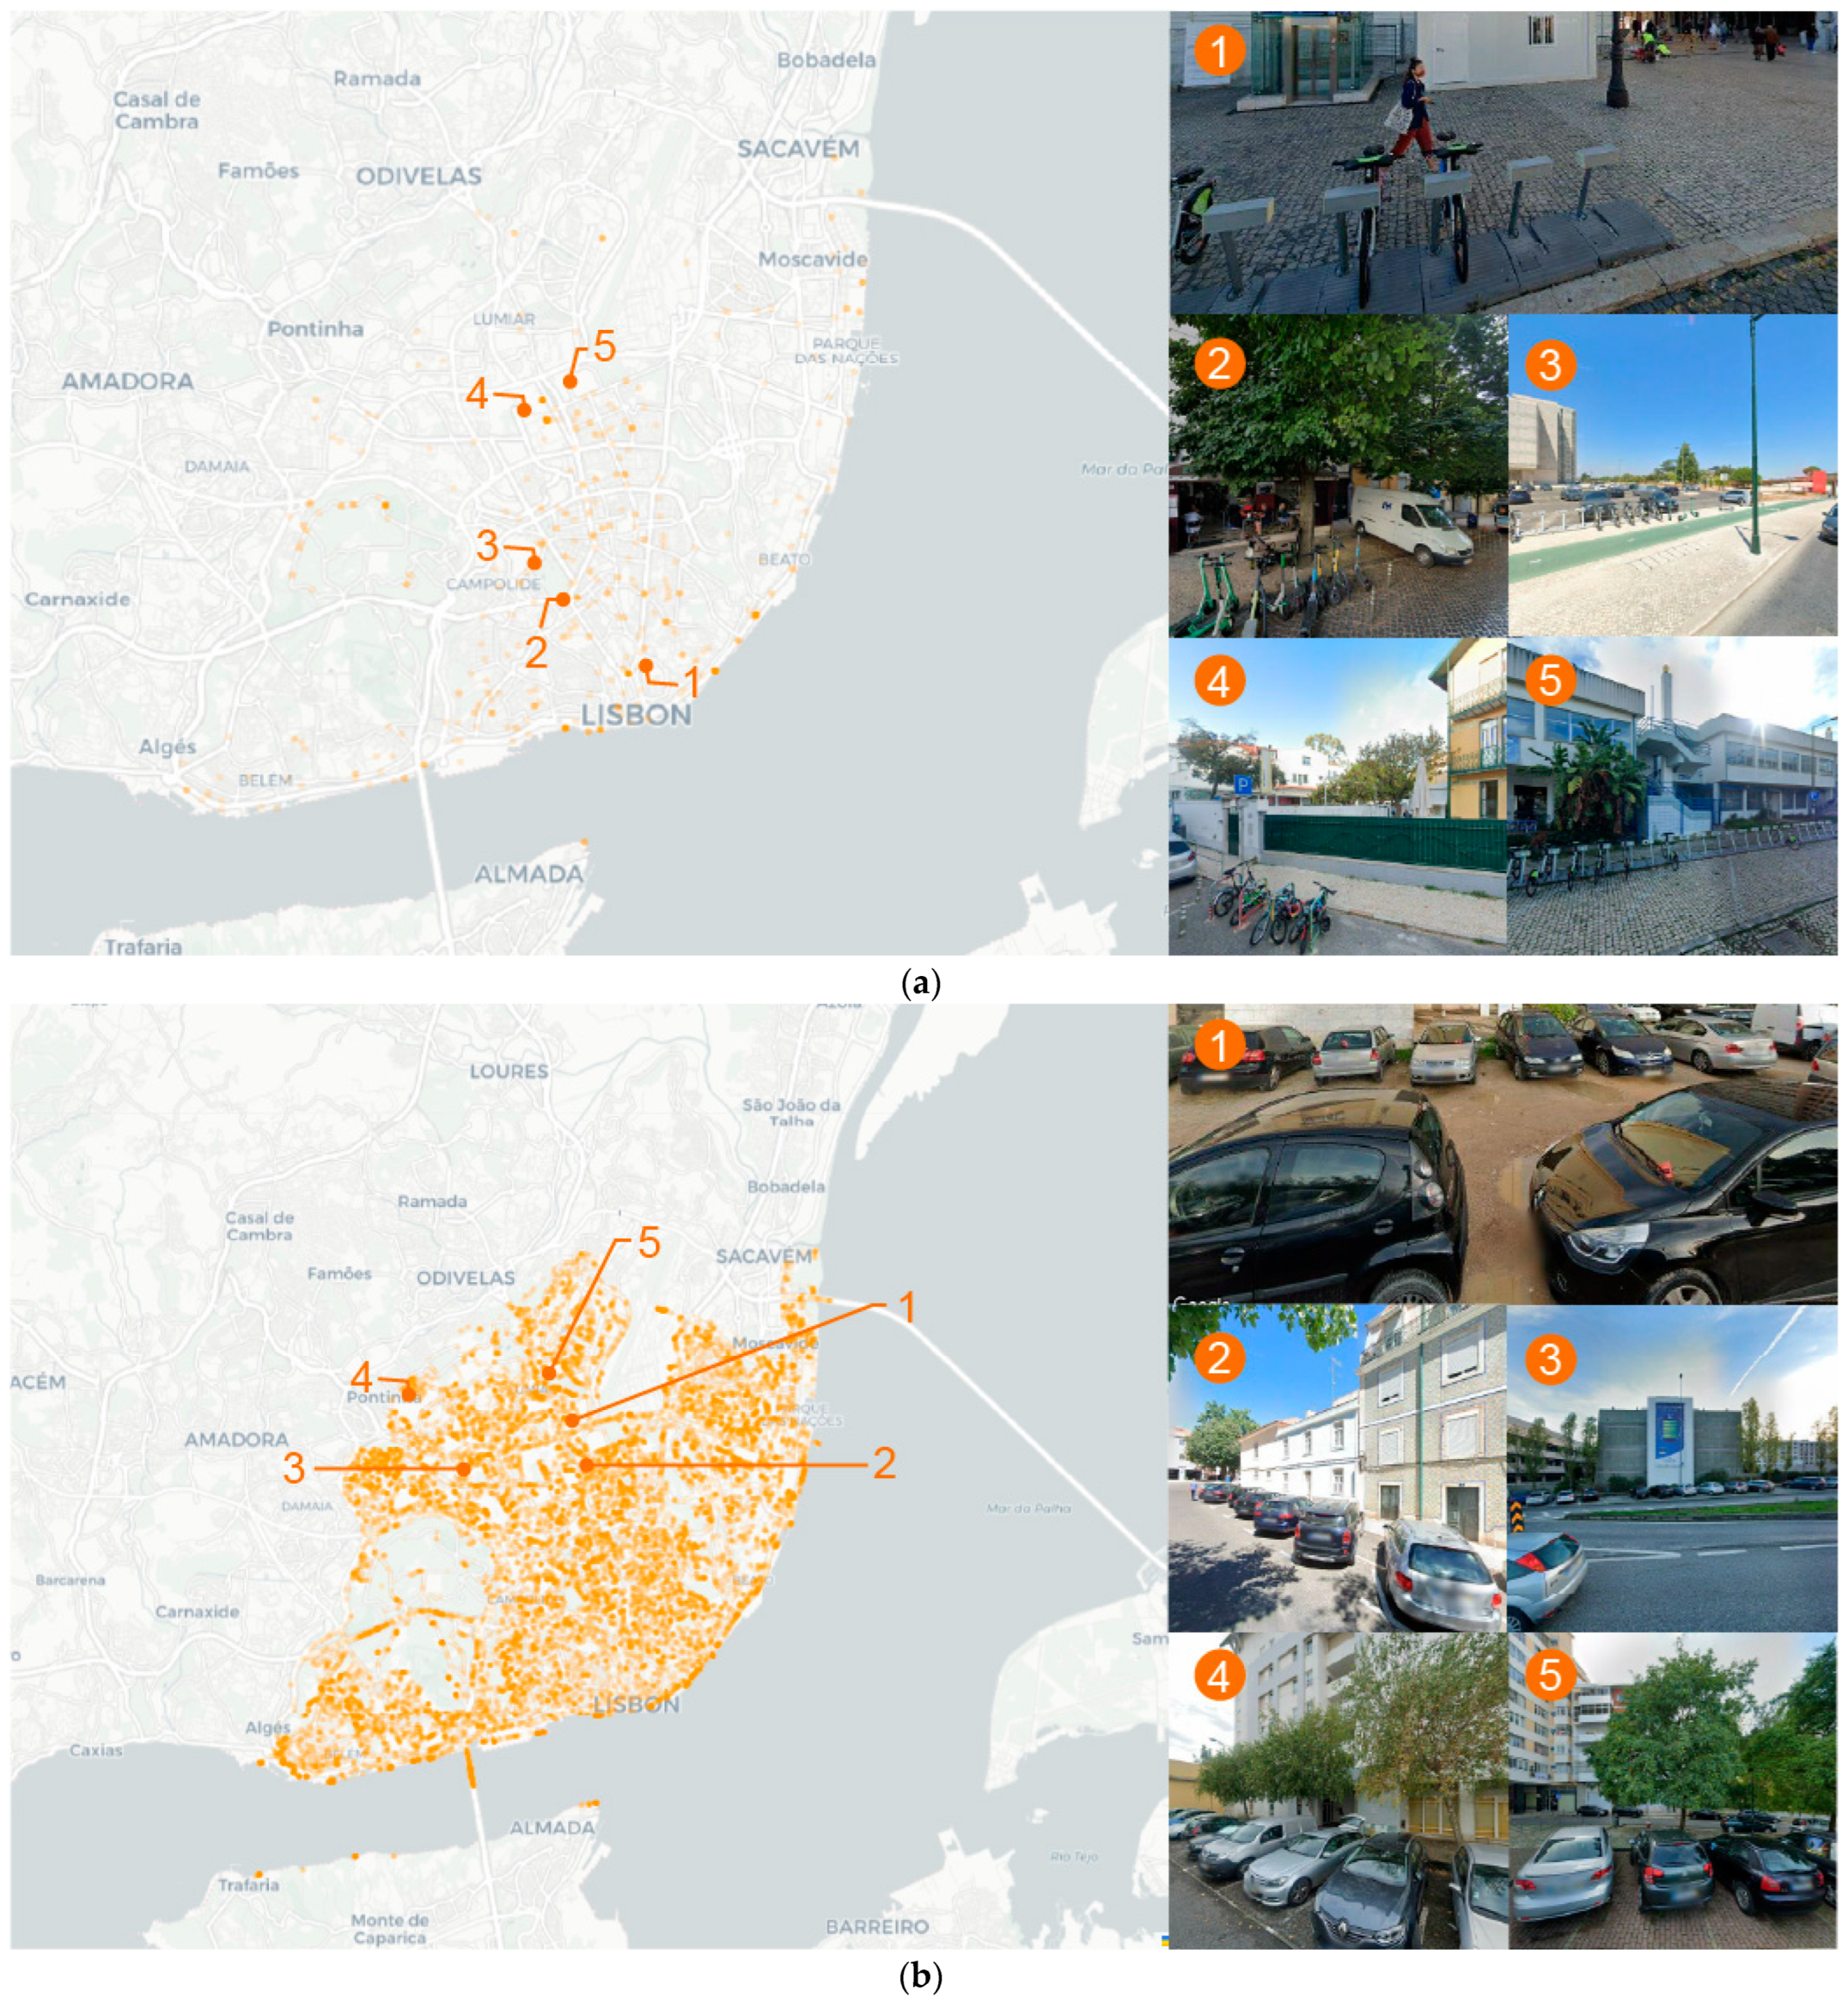
  • Data Collection: Using the GSV API, the data (images) necessary for processing were collected. The API retrieved four images for each generated location, capturing the full surroundings at 90, 180, 270, and 360 degrees. The API was specified to retrieve outdoor images only. Metadata, such as coordinates and the date of the image, was extracted, and metadata and images were saved for further processing.
  • Processing: This stage involved applying image semantic segmentation (NVIDIA Image Semantic Segmentation) and object detection (YOLOv5x6) techniques to identify and classify structures and objects within the images. This information was crucial for determining potential safety risks in the urban environment. Points where no objects were detected in any of the images from the four different angles were discarded. The list of segmented classes is in Appendix A. Additionally, a list of detected objects can be found in Appendix B.
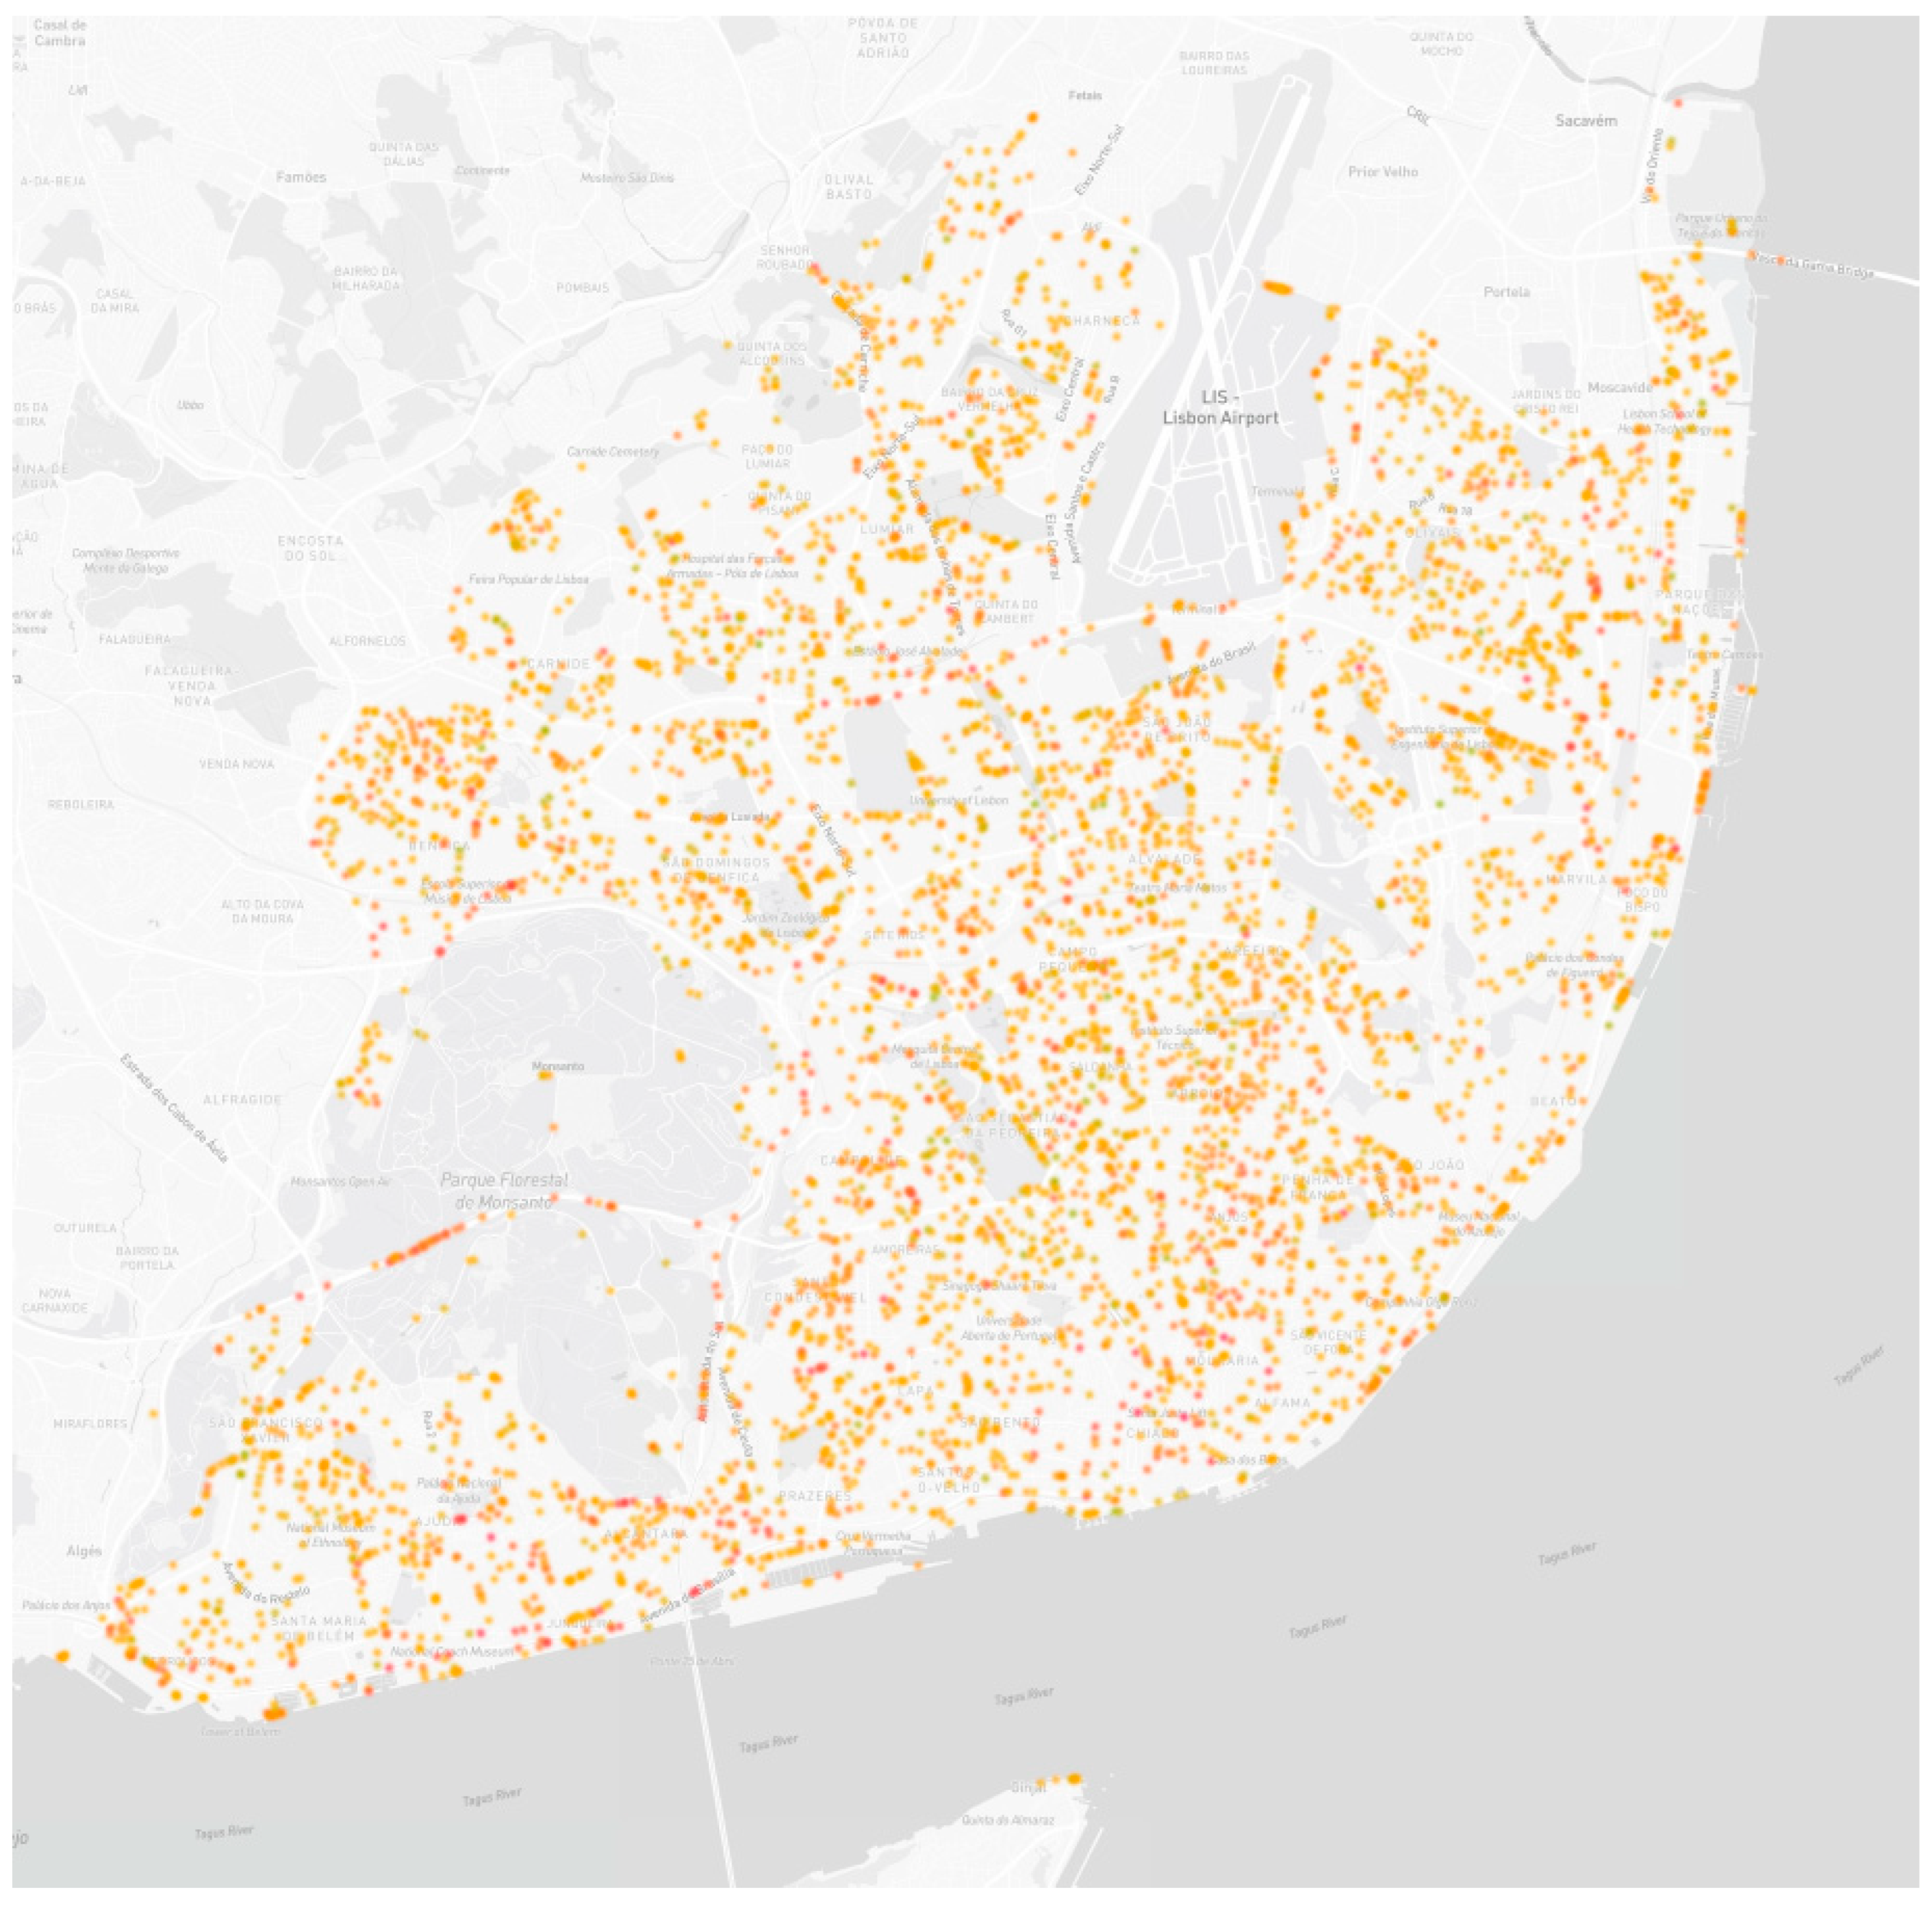
  • Outputs: A safety map was created at this stage, which served as the basis for the safe route planner and was designed to help users easily understand the safety levels of different areas in the city. Additionally, a safe route generator was developed and made available for users. The generator avoids locations based on the user’s selected safety options when routing.

3.1. Safety Score

The Bikeable Neural Network [35] generates unique safety scores for each location in any given city, using object detection and image segmentation results as inputs. The methodology entails an evaluation of four images per location. Each image undergoes object detection and image segmentation, subsequently feeding into the Bikeable algorithm.
The final safety score for a location is an average derived from processing these four images. If any of these images depict risks identified by object detection or image segmentation, it proportionately reduces the safety score of that location.
This methodology can be applied across various locations within a city, generating safety scores for numerous points. These scores, ranging from 1 (least safe) to 10 (safest), provide a user-friendly overview of safety levels across different locations. Additionally, an average safety score for each area can be calculated by aggregating all the points within each administrative division, such as districts or parishes.

3.2. Routing

After generating the safety points, routing is provided while trying to avoid these points. Routes are generated using the OpenRouteService API. It is given the start and end points, the safety scores (provided by us), and the updated cycling network (provided by OSM). Finally, as explained before, three routes are provided: shortest, safest, and balanced. On a scale of 1–10, the shortest route avoids points with a safety score lower than 3, the balanced route avoids points lower than 4, and the safest route avoids all points with a score lower than 5.

4. Case Study

The solution proposed in this study was evaluated in a real-world case in Lisbon, Portugal. With a population of about 550,000 in an area of 86 km2, Lisbon’s diverse landscape offers both challenges and opportunities for micromobility. The city has 24 parishes and provides varied non-motorized transportation infrastructure. Despite a high urban density of 6346 individuals per km2 and an array of public transport options, private vehicle usage remains high at 61% of work or school commutes. In contrast, bicycle usage is minimal, accounting for merely 0.6% of such trips [68]. This highlights significant challenges, including safety and the requirement for more dedicated bike lanes. The aim of this study is to tackle these issues by utilizing data-driven insights to foster safer and more sustainable urban transport in Lisbon.

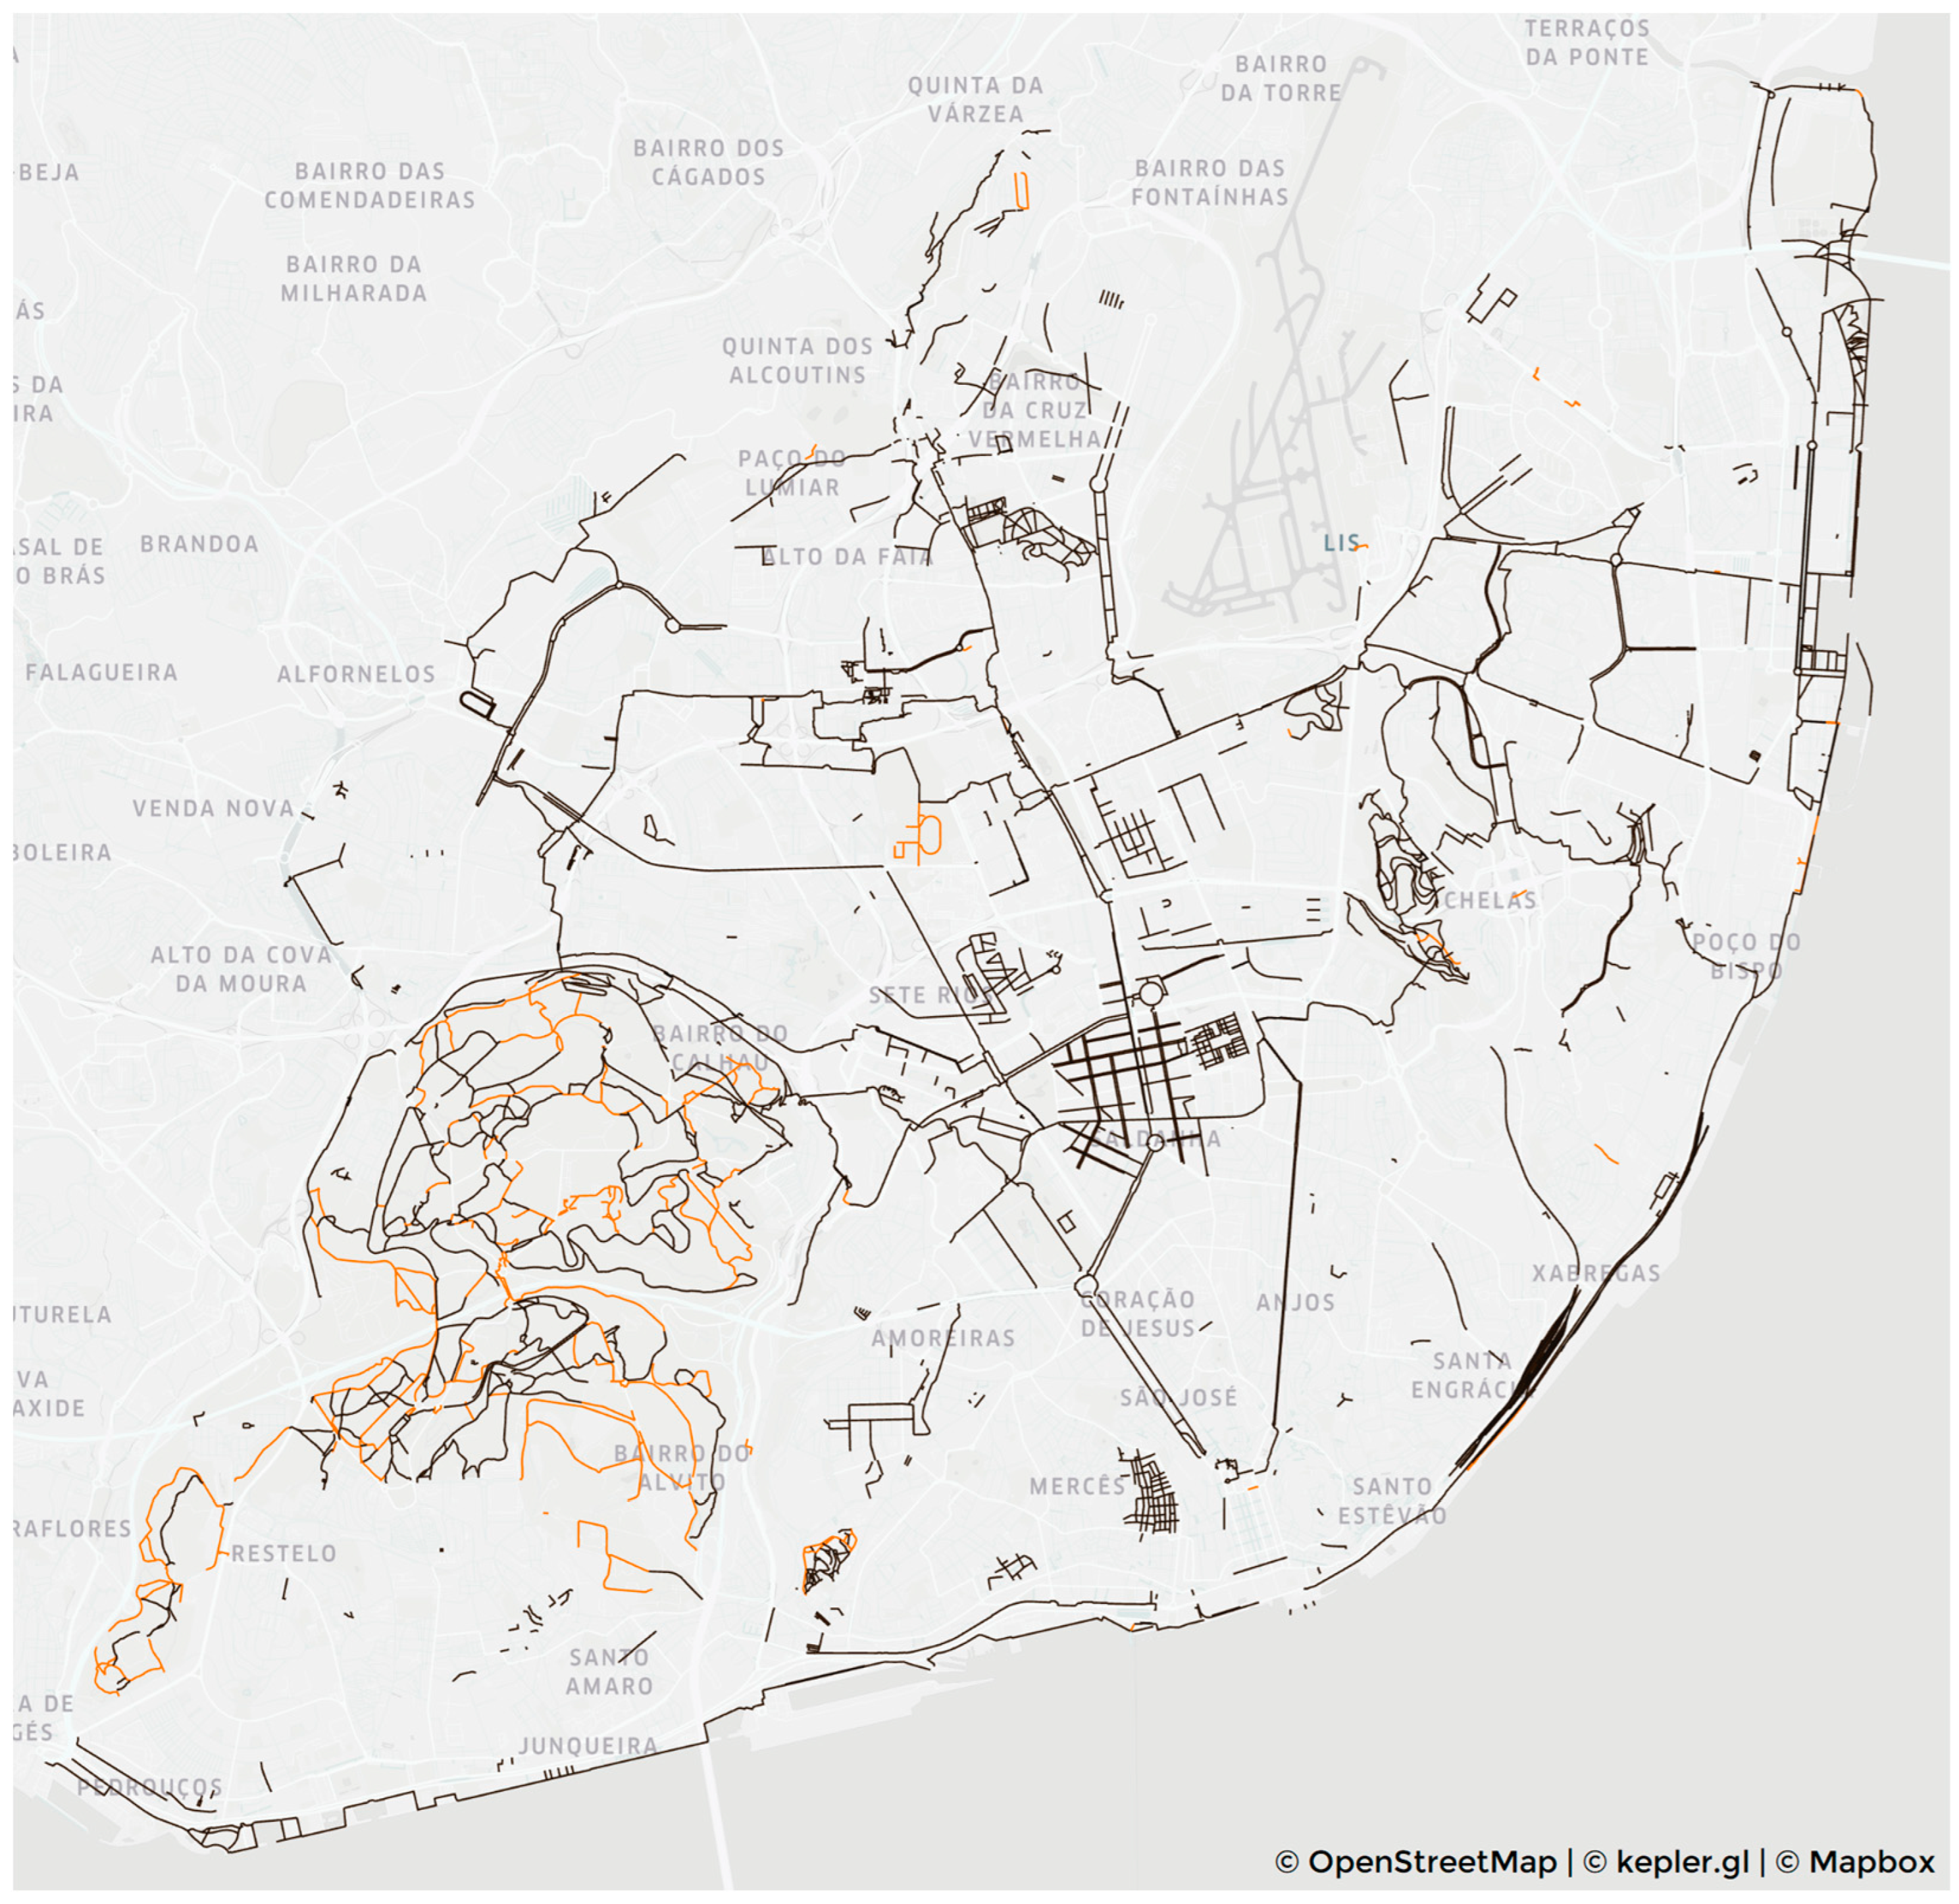
4.1. Cycling Infrastructure Improvement

Open data and collaborative mapping, such as OSM, are very valuable tools supporting global mobility studies. However, data quality can vary, and in some cases, as we experienced in our study of Lisbon, additional updates and supplements were required, particularly regarding cycling infrastructure. Since it is crucial to have the most updated cycle infrastructure available to generate good routes, we first analyzed the available cycling data on OSM. In Lisbon, we noticed discrepancies in the data related to cycle lanes compared to the data provided by the City of Lisbon. To address this, we manually updated Lisbon’s cycle network data into OSM up to April 2023.
In Figure 3, which shows the map of cycle lanes in Lisbon, the updates we made to the OSM database are distinctly marked in orange, increasing the cycling network by about 12%. With the cycling infrastructure updated for Lisbon, we can now provide more accurate routes for cyclists, considering the safety scores previously obtained.

4.2. Safety Score Prediction

Applying the Bikeable Neural Network methodology, as described earlier, a comprehensive safety analysis of Lisbon was performed. Four images were analyzed for each point within the city with the processes of object detection, image segmentation, and the application of the Bikeable algorithm. Safety scores were generated and calculated for 5321 individual points throughout Lisbon. An average safety score was calculated for each parish in Lisbon to give a broad view of safety levels. This was achieved by aggregating the scores of all the points within every parish.
Table 1 provides a snapshot of safety scores for various parishes in Lisbon regarding micromobility, while Figure 4 displays them on a map across Lisbon parishes. These scores, ranging from 1 (least safe) to 10 (safest), are derived using Bikeable’s Neural Network. The table allows us to compare the safety scores of the parishes, observing the diverse areas and point density. Regarding density, although point selection was completely random across Lisbon, maintaining constant density, only some points were considered in the safety map, which was then used to evaluate neighborhoods. This is due to the fact that Bikeable was seen to be more accurate when objects were present in the images, so points where images were missing objects were discarded, as seen in the Processing section of Figure 2.
Carnide is recognized as the safest parish for micromobility in Lisbon, with a safety score of 4.8 and 46 processed risk points per square kilometer. However, the relationship between risk point density and safety across different parishes is complex and not directly correlated. For example, Ajuda and Alcântara have a density well below average, while Campo de Ourique and Campolide are above average, yet all have safety scores of 4.3 or lower.
This may suggest that increasing the number of images will not guarantee better or worse scores; however, it should make the results more representative. So, in the future, the aim should be to increase the density of points processed. The complexity of the relationship between safety and density emphasizes the need for more comprehensive investigation and understanding. This insight can help guide more targeted interventions to improve safety across various locations within Lisbon.

4.3. Router Factor

The routing efficiency factor is introduced to compare different routes based on their travel time and distance. Taking inspiration from the ‘15 Minute City’ concept [70], the focus is on journeys of approximately 5 km lasting about 15 min. The procedure for calculating this routing factor is as follows:
  • A total of 100 pairs of random points are generated, each 5 km apart when measured in a straight line. The methodology for generating these pairs is described in detail in the subsequent sub-chapter;
  • Routes are calculated for origin and destination pairs based on time and distance;
  • Following this, the routing factor for each route is computed.
We employed a weighting scheme in our route factor calculation, with a weighting of 60% for time and 40% for distance. This approach shaped our route factor equation as follows:
Route   factor = 1 k × i = 1 k 0.6 × TravelTime 15   min + i = 1 k 0.4 × TotalDistance 5   km
  • s.t.
  • TravelTime ≈ 15 min
  • TotalDistance ≥ 5 km
  • where k is the total routes (100 random routes), TravelTime is the duration of the route calculated by the router, and TotalDistance is the distance calculated by the router.
Equation (1) above calculates the “Route factor”, which is a measure of the efficiency and usability of a selected route, taking into consideration both the distance traveled and the time taken. The equation involves two key factors: TravelTime and TotalDistance, represented by the duration and distance of the route calculated by the router, respectively. In an ideal scenario where a 5 km route is covered in exactly 15 min, the route factor would equal 1. The route factor will also increase as the travel time increases or the route becomes longer. This study expects these values to be greater than 1, with values between 1 and 1.5 being considered acceptable for an urban commute.
The selected parameters align with the principles of the ‘15-Minute City’ design [70], underlining a commitment to developing a sustainable urban model to curb greenhouse gas emissions and consumption [71].

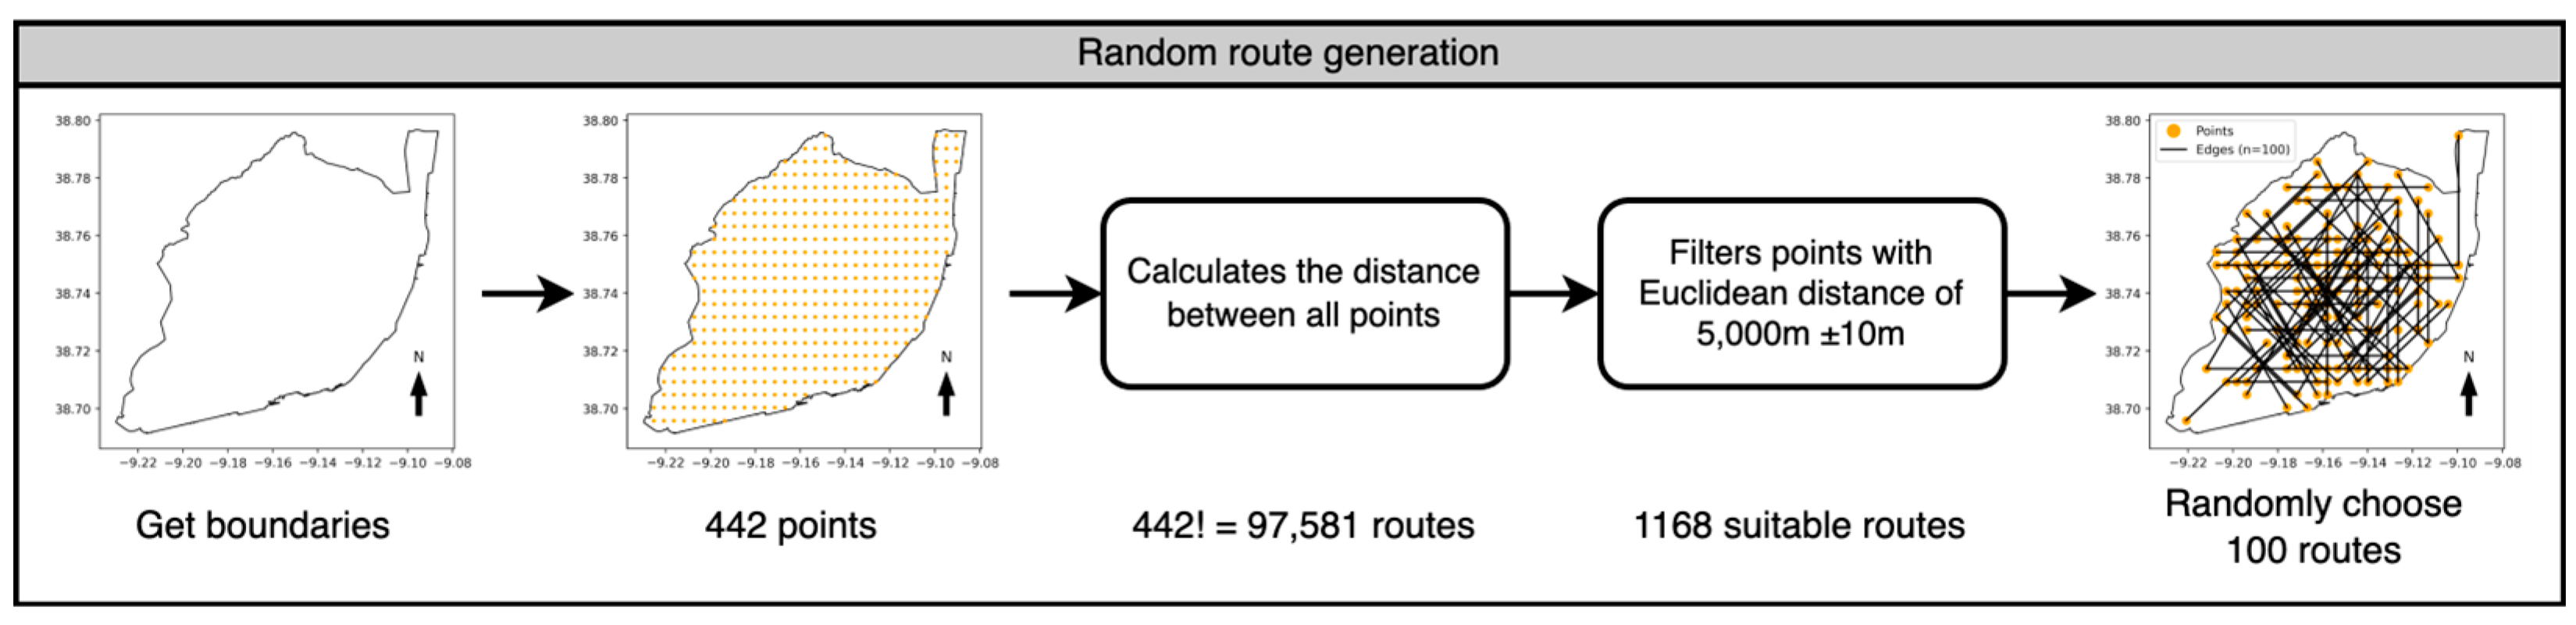
4.4. Random Route Generation

To compare the proposed routing approach to commercial solutions, a set of random routes was generated to eliminate any bias. These routes were designed to approximate a straight-line distance of 5 km. The generation of these random routes within a specific study area required a systematic approach to ensure the routes were representative. The five-step process, illustrated in Figure 5, is elaborated further below:
  • Determine the study area: The initial step involves defining the boundaries of the study area, which is Lisbon, Portugal in this case.
  • Create a grid of points: Using these boundaries, a grid is constructed consisting of points that are spaced every 500 m. The grid is confined within the previously established boundaries, resulting in a total of 442 points distributed throughout the study area.
  • Calculate distances between all points: Subsequent to the grid’s creation, the distances between each point and every other point on the grid are calculated. Applying the mathematical concept of combinations, all unique pairings of points are determined, leading to a total of 97,581 routes.
  • Filtering routes: Given the aim of generating routes with a specific distance, pairs of points where the Euclidean distance between them is approximately 5 km, with a tolerance of ±10 m, are filtered out. This step narrows down the number of suitable routes to 1168. Routes with routing errors have been excluded. Additionally, routes for which the safest path could not be computed due to an excessive number of risk points were excluded from the analysis.
  • Randomly choose routes: Finally, 100 routes are randomly selected from the list of suitable ones. This random selection ensures a diverse set of routes distributed throughout the study area.

5. Results and Discussion

5.1. Safety Score Prediction

Figure 6 shows the outcomes of image segmentations, reflecting risk factors discerned in the examined images. The intensity of the orange color corresponds to the density of these risk factors, with each coordinate point deploying four images for an all-encompassing 360-degree view. The random distribution of points broadly covered Lisbon, with fewer processed risk points in some areas due to features like parks or the Lisbon airport. Positive elements such as vegetation, suggesting safer spaces for micromobility users, are emphasized in Figure 6a. Conversely, Figure 6b reveals guard rails as a potential risk factor, which might reduce safety.
After image segmentation, object detection was performed. Once more, the intensity of color represents the density of these factors, with four images processed for each point. Figure 7a shows identified bicycles, while Figure 7b discloses cars, being those objects positive and negative factors, respectively.
A comprehensive map pinpointing risk spots across Lisbon, created from the analysis of images from 5321 randomly distributed points across the city, is presented in Figure 8. Each point employed four images, culminating in 21,284 processed images. We used a green-red scale from the safest to the most dangerous location, highlighting potential challenges for cyclists. More images showing the detection of bicycles, bike lanes, buses, cars, people, poles, potholes, rail tracks, streetlights, and trucks during the image segmentation process can be found in our repository.

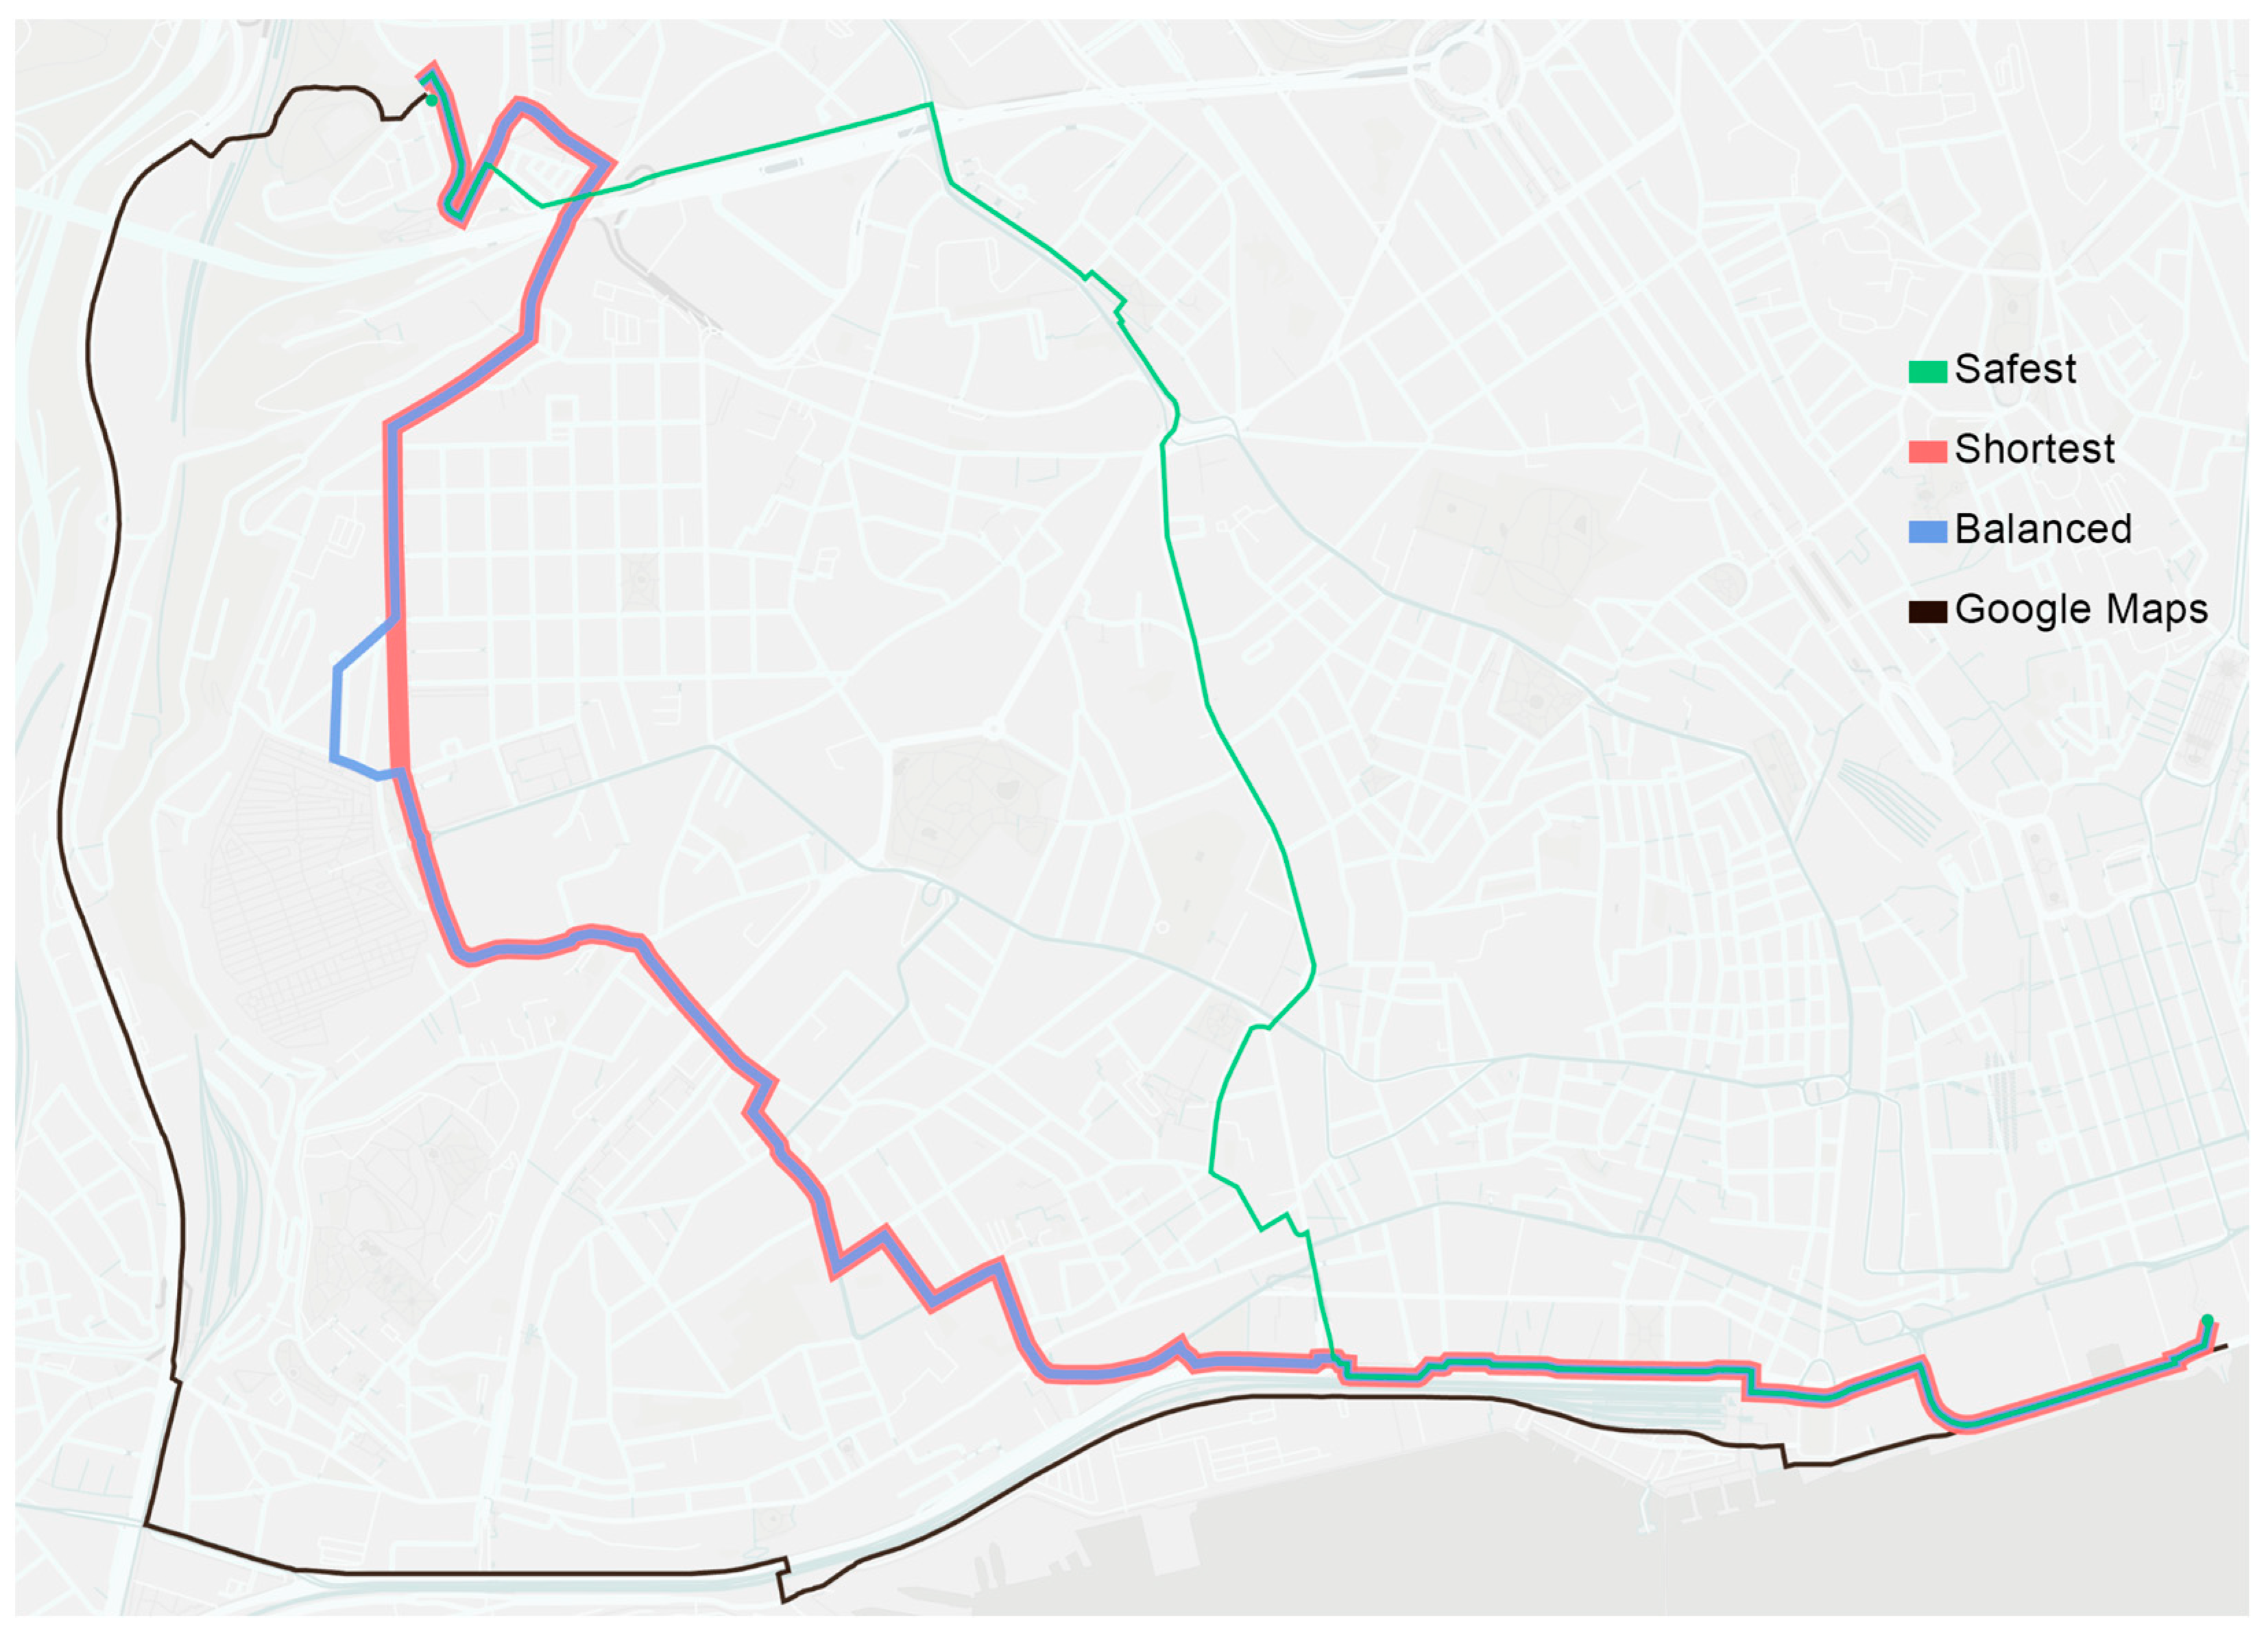
5.2. Route Planning and Comparative Analysis

The creation of the safety map enabled the design of a route planner intended to navigate around identified risk points. This tool calculates trip routes based on three different criteria: shortest, balanced, and safest. Figure 9 presents an example of a route using the three options provided by our router, along with a benchmark route (Google Maps). Although the route shown was randomly selected, distinct differences between the benchmark route and the other three can be seen. The benchmark route, for instance, sometimes prioritizes high-speed paths or necessitates navigating over level crossings. While the three proposed routes exhibit minimal variation in terms of time and distance, the benchmark route is notably slower and longer. This pattern is consistent across the other 100 randomly generated routes.
The average values detailed in Table 2 are computed from 100 routes with an approximate Euclidean distance of 5 km. These computations were achieved using a proprietary router to determine the shortest route (avoiding risk points less than 3), a balanced route (avoiding risk points less than 4), and the safest route (avoiding risk points less than 5). Importantly, in 12.4% of the calculated routes, the generation of a “safest” route was not feasible due to an abundance of risk points that could not be circumvented while preserving a viable route. Consequently, the “balanced” route was adopted as an alternative for these scenarios. Those routes for which routing was not possible were excluded from the final dataset of this study. Consequently, the set of 100 routes only contains instances where successful routing was achieved.
For comparative purposes, measurements were also obtained via the Google Maps Distance Matrix API for bicycle routing as of 27 June 2023, 07:41:07 GMT + 1. This benchmark provides an industry-standard benchmark for gauging the effectiveness and validity of our proprietary routing methodologies.
Table 2 provides a comparative analysis of different routing options, including the shortest, most balanced, and safest paths, all contrasted against a defined benchmark. The metrics considered for this comparison encompass time, distance, and route efficacy. These values correspond to the change in time and distance relative to the benchmark. Data collected from 100 distinct routes, each approximately 5 km in Euclidean distance, display minor variations in time and distance between the shortest and most balanced routes. A slightly larger increase is noted when shifting to the safest route.
The time duration varies from about 21.77 min on the shortest route to around 23.47 min on the safest route. These data imply a minor time extension when safety factors are prioritized in route selection. In the same vein, distances register a marginal increase, ranging from approximately 6.29 km for the shortest path to 6.7 km for the safest path. When considering the route factor—an index of travel efficiency—a slight improvement from 1.37 (shortest route) to 1.47 (safest route) is considered negligible. Consequently, the results suggest that integrating safety considerations into micromobility route planning may have only a minimal effect on time and distance.
It is important to note that these routing computations were carried out with the provision of incorporating the cycling network wherever feasible. Consequently, the outcomes would likely be altered if the routing was conducted without this constraint. This study presents a novel routing solution that outperforms the benchmark in almost all metrics. The router uses an updated OSM database that reflects Lisbon’s cycling network data accurately and comprehensively. This may have been one of the determining factors for these results.
Finally, the findings of this research are accessible online via the dedicated route planning website, available at routeplanner.cycleai.net (accessed on 12 August 2023). All data employed and produced during this study are openly accessible and can be retrieved from the designated data repository at routeplanner.cycleai.net/#/data (accessed on 12 August 2023).

5.3. Limitations

While the solution proposed in this study to promote cycling and micromobility in urban environments shows good potential, it also encounters certain limitations and challenges. Acknowledging these areas of concern not only underlines the practical implications of implementing the solution but also suggests avenues for future research.
The success of the proposed solution, which combines object detection (YOLOv5), semantic segmentation (NVIDIA Image Semantic Segmentation), and a multilayer perceptron neural network (Bikeable), significantly depends on the quality and comprehensiveness of the input images. If these images are outdated or certain areas are undocumented, the accuracy of safety scores and route recommendations may be compromised. Also, it is crucial to note that static data sources like GSV images and OSM data fail to capture real-time changes in urban environments, such as temporary obstructions or evolving traffic patterns.
Further, potential errors with machine learning models like YOLOv5x6 and NVIDIA’s semantic segmentation models, compounded by variations in lighting, image quality, and resolution, may introduce inconsistencies in image analysis. These inconsistencies could impact the overall accuracy of the models. Moreover, while the Bikeable tool is effective, it cannot account for certain variables such as individual cyclist behavior or personal route preferences.
The success of this solution also relies heavily on robust policy backing, investment in micromobility infrastructure, and acceptance by the general public. Particularly in regions where micromobility modes are less established, securing the necessary funding, fostering public support, and addressing resistance from car users may pose significant challenges. In addition, nurturing crowdsourcing support is pivotal for improving the predictive capabilities of the Bikeable neural network and enhancing the accuracy of outcomes.
Despite its limitations and challenges, the proposed solution opens several opportunities. Its modular design ensures adaptability across diverse urban contexts, thereby broadening its impact on urban mobility. By endorsing micromobility, it helps reduce traffic congestion and greenhouse gas emissions, which therefore improves public health and the environment. Furthermore, it can save costs by decreasing our reliance on private vehicles and optimizing transportation systems. Collaborations with local governments, transportation agencies, and community organizations can also foster innovation and facilitate implementation.
Finally, the results of this study, which primarily focuses on Lisbon, Portugal, may not directly apply to other regions due to variations in urban layouts, infrastructure quality, and cycling cultures. This indicates that the suitability of the proposed solution might vary in different contexts.

6. Conclusions

This research puts forward a feasible progression towards safer pathways in the urban micromobility environment, using Lisbon as a successful test case. Our innovative, data-driven strategy is a major contribution to urban transport solutions, with a unique amalgamation of YOLOv5x6 object detection, NVIDIA Image Semantic Segmentation, and the Bikeable neural network. This integration has targeted establishing safe, efficient, and customizable routes for cyclists and other micromobility users.
The key attributes of our approach are its modularity and adaptability. This facilitates a straightforward deployment in cities around the world that are striving to adopt safe and sustainable modes of transportation. A notable aspect of our methodology is the underexploited use of GSV images for assessing cycling safety and infrastructure. Furthermore, our collaboration with OpenStreetMap enhances the richness of our data sources and strengthens our approach.
Object detection and semantic segmentation technologies have effectively extracted crucial safety information from GSV images. The Bikeable Neural Network then processes this information to assign safety scores to various locations. Thus, it was possible to create a router that calculates three distinct routing types according to safety degrees: shortest, balanced, and safest. We also propose a router factor, allowing a more nuanced comparison of created routes with widely used benchmark routing.
This successful implementation and adaptability of the solution mark significant advancements in urban mobility and environmental conservation. They can enhance the overall quality of urban life, making our solution compelling for urban planners, stakeholders, and policymakers committed to fostering inclusive, accessible, and sustainable transport systems.
In conclusion, our study underlines the crucial significance of data-driven methodologies in reshaping urban transport systems. It provides an adaptable framework that can serve as a point of reference for cities striving to cater to the transport needs of residents while linking theory and real-world application. Future research would benefit from focusing on the further refinement of this methodology and its implementation in a variety of urban contexts.

Author Contributions

Conceptualization, T.T., M.G.C. and L.R.; methodology, T.T., L.R. and A.F.; software, L.R. and T.-C.B.; validation, T.T., M.G.C., L.R., T.-C.B. and A.F.; formal analysis, T.T. and M.G.C.; investigation, T.T., M.G.C. and L.R.; resources, L.R., T.-C.B. and M.P.; data curation, T.T., M.G.C., L.R. and T.-C.B.; writing—original draft preparation, T.T., M.G.C., L.R., T.-C.B. and A.F.; writing—review and editing, T.T., M.G.C. and A.F.; visualization, T.T., M.G.C., R.M. and L.S.; supervision, A.F.; project administration, M.P. and A.F.; funding acquisition, M.P. and A.F. All authors have read and agreed to the published version of the manuscript.

Funding

This project was co-financed by the European Regional Development Fund through the Urban Innovative Actions Initiative. Additionally, the authors are grateful to the Research Center for Territory, Transports and Environment—CITTA (UIDP/04427/2020) for the financial support.

Data Availability Statement

The codes, data, and information are available at https://github.com/CycleAI/LisbonHUB (accessed on 12 August 2023). Map data are from OpenStreetMap.

Acknowledgments

Tiago Tamagusko gratefully acknowledges the support provided by the Portuguese Foundation for Science and Technology (FCT), which awarded him the Ph.D. scholarship grant 2020.09565.BD. Similarly, Matheus Gomes Correia was supported by the doctoral grant PRT/BD/152842/2021, financed by the FCT under the MIT Portugal Program. We also gratefully acknowledge the feedback from anonymous referees, which allowed us to improve the manuscript.

Conflicts of Interest

The authors declare no conflict of interest.

Appendix A. List of Segmented Classes

1. Bicycle24. Curb47. Rail Track
2. Bicyclist25. Curb Cut48. Road
3. Bike Lane26. Crosswalk—Plain49. Sand
4. Bike Rack27. Ego Vehicle50. Service Lane
5. Billboard28. Fence51. Sidewalk
6. Bird29. Fire Hydrant52. Sky
7. Boat30. Guard Rail53. Snow
8. Boat Mount31. Junction Box54. Street Light
9. Brid32. Lane Marking—Crosswalk55. Terrain
10. Bridge33. Lane Marking—General56. Traffic Light
11. Building34. Mailbox57. Traffic Sign (Back)
12. Bus35. Manhole58. Traffic Sign (Front)
13. Banner36. Mountain59. Traffic Sign Frame
14. Barrier37. Motorcycle60. Trailer
15. Bench38. Motorcyclist61. Trash Can
16. Bicycle39. On Rails62. Truck
17. Boat40. Other Rider63. Tunnel
18. Bus41. Other Vehicle64. Unlabeled
19. Car42. Parking65. Utility Pole
20. Car Mount43. Pedestrian Area66. Vegetation
21. Caravan44. Phone Booth67. Water
22. Catch Basin45. Pole68. Wheeled Slow
23. CCTV Camera46. Pothole

Appendix B. List of Detected Objects

1. Airplane24. Donut47. Sink
2. Apple25. Elephant48. Skateboard
3. Backpack26. Fire Hydrant49. Skis
4. Banana27. Frisbee50. Snowboard
5. Baseball Bat28. Hair Drier51. Spoon
6. Baseball Glove29. Handbag52. Sports Ball
7. Bear30. Horse53. Stop Sign
8. Bed31. Hot Dog54. Suitcase
9. Bird32. Keyboard55. Surfboard
10. Boat33. Kite56. Teddy Bear
11. Book34. Knife57. Television
12. Bottle35. Laptop58. Tennis Racket
13. Bowl36. Microwave59. Toaster
14. Broccoli37. Motorcycle60. Toilet
15. Cell Phone38. Mouse61. Toothbrush
16. Chair39. Oven62. Tie
17. Cat40. Parking Meter63. Toilet
18. Clock41. Person64. Traffic Light
19. Couch42. Potted Plant65. Train
20. Cow43. Remote66. Truck
21. Cup44. Sandwich67. Umbrella
22. Dining Table45. Scissors68. Vase
23. Dog46. Sheep69. Wine Glass

References

  1. Bettencourt, L.M.A.; Lobo, J.; Helbing, D.; Kühnert, C.; West, G.B. Growth, Innovation, Scaling, and the Pace of Life in Cities. Proc. Natl. Acad. Sci. USA 2007, 104, 7301–7306. [Google Scholar] [CrossRef]
  2. Batty, M. The Size, Scale, and Shape of Cities. Science 2008, 319, 769–771. [Google Scholar] [CrossRef]
  3. Diao, M.; Kong, H.; Zhao, J. Impacts of Transportation Network Companies on Urban Mobility. Nat. Sustain. 2021, 4, 494–500. [Google Scholar] [CrossRef]
  4. Zuo, T.; Wei, H.; Chen, N.; Zhang, C. First-and-Last Mile Solution via Bicycling to Improving Transit Accessibility and Advancing Transportation Equity. Cities 2020, 99, 102614. [Google Scholar] [CrossRef]
  5. Zuo, T.; Wei, H.; Chen, N. Promote Transit via Hardening First-and-Last-Mile Accessibility: Learned from Modeling Commuters’ Transit Use. Transp. Res. Part D Transp. Environ. 2020, 86, 102446. [Google Scholar] [CrossRef]
  6. Amiril, A.; Nawawi, A.H.; Takim, R.; Latif, S.N.F.A. Transportation Infrastructure Project Sustainability Factors and Performance. Procedia Soc. Behav. Sci. 2014, 153, 90–98. [Google Scholar] [CrossRef]
  7. Martens, K. The Bicycle as a Feedering Mode: Experiences from Three European Countries. Transp. Res. Part D Transp. Environ. 2004, 9, 281–294. [Google Scholar] [CrossRef]
  8. Sun, J.; Chow, A.C.H.; Michel Madanat, S. Tradeoffs between Optimality and Equity in Transportation Network Protection against Sea Level Rise. Transp. Res. Part A Policy Pract. 2022, 163, 195–208. [Google Scholar] [CrossRef]
  9. Bills, T.S.; Walker, J.L. Looking beyond the Mean for Equity Analysis: Examining Distributional Impacts of Transportation Improvements. Transp. Policy 2017, 54, 61–69. [Google Scholar] [CrossRef]
  10. Zhang, Y.; Mi, Z. Environmental Benefits of Bike Sharing: A Big Data-Based Analysis. Appl. Energy 2018, 220, 296–301. [Google Scholar] [CrossRef]
  11. Caulfield, B.; O’Mahony, M.; Brazil, W.; Weldon, P. Examining Usage Patterns of a Bike-Sharing Scheme in a Medium Sized City. Transp. Res. Part A Policy Pract. 2017, 100, 152–161. [Google Scholar] [CrossRef]
  12. Cervero, R.; Sarmiento, O.L.; Jacoby, E.; Gomez, L.F.; Neiman, A. Influences of Built Environments on Walking and Cycling: Lessons from Bogotá. Int. J. Sustain. Transp. 2009, 3, 203–226. [Google Scholar] [CrossRef]
  13. Heinen, E.; van Wee, B.; Maat, K. Commuting by Bicycle: An Overview of the Literature. Transp. Rev. 2010, 30, 59–96. [Google Scholar] [CrossRef]
  14. Ewing, R.; Handy, S. Measuring the Unmeasurable: Urban Design Qualities Related to Walkability. J. Urban Des. 2009, 14, 65–84. [Google Scholar] [CrossRef]
  15. Pérez, K.; Olabarria, M.; Rojas-Rueda, D.; Santamariña-Rubio, E.; Borrell, C.; Nieuwenhuijsen, M. The Health and Economic Benefits of Active Transport Policies in Barcelona. J. Transp. Health 2017, 4, 316–324. [Google Scholar] [CrossRef]
  16. Sallis, J.F.; Frank, L.D.; Saelens, B.E.; Kraft, M.K. Active Transportation and Physical Activity: Opportunities for Collaboration on Transportation and Public Health Research. Transp. Res. Part A Policy Pract. 2004, 38, 249–268. [Google Scholar] [CrossRef]
  17. Kaltenbrunner, A.; Meza, R.; Grivolla, J.; Codina, J.; Banchs, R. Urban Cycles and Mobility Patterns: Exploring and Predicting Trends in a Bicycle-Based Public Transport System. Pervasive Mob. Comput. 2010, 6, 455–466. [Google Scholar] [CrossRef]
  18. Félix, R.; Moura, F.; Clifton, K.J. Maturing Urban Cycling: Comparing Barriers and Motivators to Bicycle of Cyclists and Non-Cyclists in Lisbon, Portugal. J. Transp. Health 2019, 15, 100628. [Google Scholar] [CrossRef]
  19. Lindsay, G.; Macmillan, A.; Woodward, A. Moving Urban Trips from Cars to Bicycles: Impact on Health and Emissions. Aust. N. Z. J. Public Health 2011, 35, 54–60. [Google Scholar] [CrossRef]
  20. De Hartog, J.J.; Boogaard, H.; Nijland, H.; Hoek, G. Do the Health Benefits of Cycling Outweigh the Risks? Environ. Health Perspect. 2010, 118, 1109–1116. [Google Scholar] [CrossRef]
  21. Rojas-Rueda, D.; de Nazelle, A.; Teixidó, O.; Nieuwenhuijsen, M.J. Replacing Car Trips by Increasing Bike and Public Transport in the Greater Barcelona Metropolitan Area: A Health Impact Assessment Study. Environ. Int. 2012, 49, 100–109. [Google Scholar] [CrossRef] [PubMed]
  22. Pucher, J.; Buehler, R. Cycling towards a More Sustainable Transport Future. Transp. Rev. 2017, 37, 689–694. [Google Scholar] [CrossRef]
  23. Yuan, Z.; Zhou, X.; Yang, T. Hetero-ConvLSTM. In Proceedings of the 24th ACM SIGKDD International Conference on Knowledge Discovery & Data Mining, London, UK, 19–23 August 2018; ACM: New York, NY, USA, 2018; pp. 984–992. [Google Scholar]
  24. Jabbar, R.; Al-Khalifa, K.; Kharbeche, M.; Alhajyaseen, W.; Jafari, M.; Jiang, S. Real-Time Driver Drowsiness Detection for Android Application Using Deep Neural Networks Techniques. Procedia Comput. Sci. 2018, 130, 400–407. [Google Scholar] [CrossRef]
  25. Tran, D.; Manh Do, H.; Sheng, W.; Bai, H.; Chowdhary, G. Real-time Detection of Distracted Driving Based on Deep Learning. IET Intell. Transp. Syst. 2018, 12, 1210–1219. [Google Scholar] [CrossRef]
  26. Fayyaz, M.A.B.; Johnson, C. Object Detection at Level Crossing Using Deep Learning. Micromachines 2020, 11, 1055. [Google Scholar] [CrossRef]
  27. Formosa, N.; Quddus, M.; Ison, S.; Abdel-Aty, M.; Yuan, J. Predicting Real-Time Traffic Conflicts Using Deep Learning. Accid. Anal. Prev. 2020, 136, 105429. [Google Scholar] [CrossRef]
  28. Tamagusko, T.; Gomes Correia, M.; Huynh, M.A.; Ferreira, A. Deep Learning Applied to Road Accident Detection with Transfer Learning and Synthetic Images. Transp. Res. Procedia 2022, 64, 90–97. [Google Scholar] [CrossRef]
  29. Oeschger, G.; Carroll, P.; Caulfield, B. Micromobility and Public Transport Integration: The Current State of Knowledge. Transp. Res. Part D Transp. Environ. 2020, 89, 102628. [Google Scholar] [CrossRef]
  30. Şengül, B.; Mostofi, H. Impacts of E-Micromobility on the Sustainability of Urban Transportation—A Systematic Review. Appl. Sci. 2021, 11, 5851. [Google Scholar] [CrossRef]
  31. Tice, P.C. Micromobility and the Built Environment. Proc. Hum. Factors Ergon. Soc. Annu. Meet. 2019, 63, 929–932. [Google Scholar] [CrossRef]
  32. McQueen, M.; Abou-Zeid, G.; MacArthur, J.; Clifton, K. Transportation Transformation: Is Micromobility Making a Macro Impact on Sustainability? J. Plan. Lit. 2021, 36, 46–61. [Google Scholar] [CrossRef]
  33. Hasselwander, M.; Tamagusko, T.; Bigotte, J.F.; Ferreira, A.; Mejia, A.; Ferranti, E.J.S. Building Back Better: The COVID-19 Pandemic and Transport Policy Implications for a Developing Megacity. Sustain. Cities Soc. 2021, 69, 102864. [Google Scholar] [CrossRef] [PubMed]
  34. Tamagusko, T.; Ferreira, A. Data-Driven Approach to Understand the Mobility Patterns of the Portuguese Population during the COVID-19 Pandemic. Sustainability 2020, 12, 9775. [Google Scholar] [CrossRef]
  35. Bikeable. CycleAI Bikeable Neural Network. Available online: https://cycleai.net/bikeable/ (accessed on 12 August 2023).
  36. Rita, L.; Peliteiro, M.; Bostan, T.-C.; Tamagusko, T.; Ferreira, A. Using Deep Learning and Google Street View Imagery to Assess and Improve Cyclist Safety in London. Sustainability 2023, 15, 10270. [Google Scholar] [CrossRef]
  37. Krylov, V.; Kenny, E.; Dahyot, R. Automatic Discovery and Geotagging of Objects from Street View Imagery. Remote Sens. 2018, 10, 661. [Google Scholar] [CrossRef]
  38. Campbell, A.; Both, A.; Sun, Q.C. Detecting and Mapping Traffic Signs from Google Street View Images Using Deep Learning and GIS. Comput. Environ. Urban Syst. 2019, 77, 101350. [Google Scholar] [CrossRef]
  39. Sukel, M.; Rudinac, S.; Worring, M. Urban Object Detection Kit: A System for Collection and Analysis of Street-Level Imagery. In Proceedings of the 2020 International Conference on Multimedia Retrieval, Dublin, Ireland, 8–11 June 2020; ACM: New York, NY, USA, 2020; pp. 509–516. [Google Scholar]
  40. Goel, R.; Garcia, L.M.T.; Goodman, A.; Johnson, R.; Aldred, R.; Murugesan, M.; Brage, S.; Bhalla, K.; Woodcock, J. Estimating City-Level Travel Patterns Using Street Imagery: A Case Study of Using Google Street View in Britain. PLoS ONE 2018, 13, e0196521. [Google Scholar] [CrossRef]
  41. Ito, K.; Biljecki, F. Assessing Bikeability with Street View Imagery and Computer Vision. Transp. Res. Part C Emerg. Technol. 2021, 132, 103371. [Google Scholar] [CrossRef]
  42. Kellstedt, D.K.; Spengler, J.O.; Foster, M.; Lee, C.; Maddock, J.E. A Scoping Review of Bikeability Assessment Methods. J. Community Health 2021, 46, 211–224. [Google Scholar] [CrossRef]
  43. Gu, P.; Han, Z.; Cao, Z.; Chen, Y.; Jiang, Y. Using Open Source Data to Measure Street Walkability and Bikeability in China: A Case of Four Cities. Transp. Res. Rec. J. Transp. Res. Board 2018, 2672, 63–75. [Google Scholar] [CrossRef]
  44. Ding, X.; Fan, H.; Gong, J. Towards Generating Network of Bikeways from Mapillary Data. Comput. Environ. Urban Syst. 2021, 88, 101632. [Google Scholar] [CrossRef]
  45. Li, X.; Flohr, F.; Yang, Y.; Xiong, H.; Braun, M.; Pan, S.; Li, K.; Gavrila, D.M. A New Benchmark for Vision-Based Cyclist Detection. In Proceedings of the 2016 IEEE Intelligent Vehicles Symposium (IV), Gotenburg, Sweden, 19–22 June 2016; IEEE: New York, NY, USA, 2016; pp. 1028–1033. [Google Scholar]
  46. Rajeshwari, P.; Abhishek, P.; Srikanth, P.; Vinod, T. Object Detection: An Overview. Int. J. Trend Sci. Res. Dev. 2019, 3, 1663–1665. [Google Scholar] [CrossRef]
  47. Xiao, J.; Quan, L. Multiple View Semantic Segmentation for Street View Images. In Proceedings of the 2009 IEEE 12th International Conference on Computer Vision, Kyoto, Japan, 29 September–2 October 2009; IEEE: New York, NY, USA, 2009; pp. 686–693. [Google Scholar]
  48. Chacra, D.A.; Zelek, J. Road Segmentation in Street View Images Using Texture Information. In Proceedings of the 2016 13th Conference on Computer and Robot Vision (CRV), Victoria, BC, Canada, 1–3 June 2016; IEEE: New York, NY, USA, 2016; pp. 424–431. [Google Scholar]
  49. Minaee, S.; Boykov, Y.Y.; Porikli, F.; Plaza, A.J.; Kehtarnavaz, N.; Terzopoulos, D. Image Segmentation Using Deep Learning: A Survey. IEEE Trans. Pattern Anal. Mach. Intell. 2021, 44, 3523–3542. [Google Scholar] [CrossRef]
  50. Cavoli, C. Accelerating Sustainable Mobility and Land-Use Transitions in Rapidly Growing Cities: Identifying Common Patterns and Enabling Factors. J. Transp. Geogr. 2021, 94, 103093. [Google Scholar] [CrossRef]
  51. Makarova, I.; Pashkevich, A.; Shubenkova, K.; Mukhametdinov, E. Ways to Increase Population Mobility through the Transition to Sustainable Transport. Procedia Eng. 2017, 187, 756–762. [Google Scholar] [CrossRef]
  52. Yang, H.; Ma, Q.; Wang, Z.; Cai, Q.; Xie, K.; Yang, D. Safety of Micro-Mobility: Analysis of E-Scooter Crashes by Mining News Reports. Accid. Anal. Prev. 2020, 143, 105608. [Google Scholar] [CrossRef]
  53. Latinopoulos, C.; Patrier, A.; Sivakumar, A. Planning for E-Scooter Use in Metropolitan Cities: A Case Study for Paris. Transp. Res. Part D Transp. Environ. 2021, 100, 103037. [Google Scholar] [CrossRef]
  54. Davies, N.; Blazejewski, L.; Sherriff, G. The Rise of Micromobilities at Tourism Destinations. J. Tour. Futur. 2020, 6, 209–212. [Google Scholar] [CrossRef]
  55. World Health Organization. World Health Organization Cyclist Safety: An Information Resource for Decision-Makers and Practitioners; World Health Organization: Geneva, Switzerland, 2020.
  56. Prencipe, L.P.; Colovic, A.; De Bartolomeo, S.; Caggiani, L.; Ottomanelli, M. An Efficiency Indicator for Micromobility Safety Assessment. In Proceedings of the 2022 IEEE International Conference on Environment and Electrical Engineering and 2022 IEEE Industrial and Commercial Power Systems Europe (EEEIC/I&CPS Europe), Prague, Czech Republic, 28 June–1 July 2022; IEEE: New York, NY, USA, 2022; pp. 1–6. [Google Scholar]
  57. Haworth, N.; Schramm, A.; Twisk, D. Comparing the Risky Behaviours of Shared and Private E-Scooter and Bicycle Riders in Downtown Brisbane, Australia. Accid. Anal. Prev. 2021, 152, 105981. [Google Scholar] [CrossRef]
  58. O’Hern, S.; Estgfaeller, N. A Scientometric Review of Powered Micromobility. Sustainability 2020, 12, 9505. [Google Scholar] [CrossRef]
  59. World Health Organization. Global Status Report on Road Safety 2018; World Health Organization: Geneva, Switzerland, 2018.
  60. Folco, P.; Gauvin, L.; Tizzoni, M.; Szell, M. Data-Driven Micromobility Network Planning for Demand and Safety. Environ. Plan. B Urban Anal. City Sci. 2022, 239980832211356. [Google Scholar] [CrossRef]
  61. Gomes Correia, M.; Bonates, T.D.O.E.; Prata, B.D.A.; Nobre Júnior, E.F. An Integer Linear Programming Approach for Pavement Maintenance and Rehabilitation Optimization. Int. J. Pavement Eng. 2022, 23, 2710–2727. [Google Scholar] [CrossRef]
  62. Karpinski, E.; Bayles, E.; Sanders, T. Safety Analysis for Micromobility: Recommendations on Risk Metrics and Data Collection. Transp. Res. Rec. J. Transp. Res. Board 2022, 2676, 420–435. [Google Scholar] [CrossRef]
  63. Tao, A.; Sapra, K.; Catanzaro, B. Hierarchical Multi-Scale Attention for Semantic Segmentation. arXiv 2020, arXiv:2005.10821. [Google Scholar] [CrossRef]
  64. Redmon, J.; Divvala, S.; Girshick, R.; Farhadi, A. You Only Look Once: Unified, Real-Time Object Detection. arXiv 2015, arXiv:1506.02640. [Google Scholar] [CrossRef]
  65. Ultralytics YOLOv5. Available online: https://github.com/ultralytics/yolov5 (accessed on 3 February 2023).
  66. Tamagusko, T.; Ferreira, A. Optimizing Pothole Detection in Pavements: A Comparative Analysis of Deep Learning Models. Eng. Proc. 2023, 36, 11. [Google Scholar]
  67. Neis, P.; Zipf, A. Zur Kopplung von OpenSource, OpenLS und OpenStreetMaps in OpenRouteService.Org. Available online: https://www.geog.uni-heidelberg.de/md/chemgeo/geog/gis/agit2008.openrouteservice.fullpaper.pdf (accessed on 12 July 2023).
  68. Instituto Nacional de Estatística Censos 2021. O Que nos Dizem os Censos Sobre Dinâmicas Territoriais. Available online: https://www.ine.pt/xurl/pub/66320870p (accessed on 12 July 2023).
  69. Câmara Municipal de Lisboa Câmara de Lisboa. Available online: https://www.lisboa.pt/municipio/freguesias (accessed on 21 April 2023).
  70. Moreno, C.; Allam, Z.; Chabaud, D.; Gall, C.; Pratlong, F. Introducing the “15-Minute City”: Sustainability, Resilience and Place Identity in Future Post-Pandemic Cities. Smart Cities 2021, 4, 93–111. [Google Scholar] [CrossRef]
  71. Allam, Z.; Bibri, S.E.; Chabaud, D.; Moreno, C. The ‘15-Minute City’ Concept Can Shape a Net-Zero Urban Future. Humanit. Soc. Sci. Commun. 2022, 9, 126. [Google Scholar] [CrossRef]
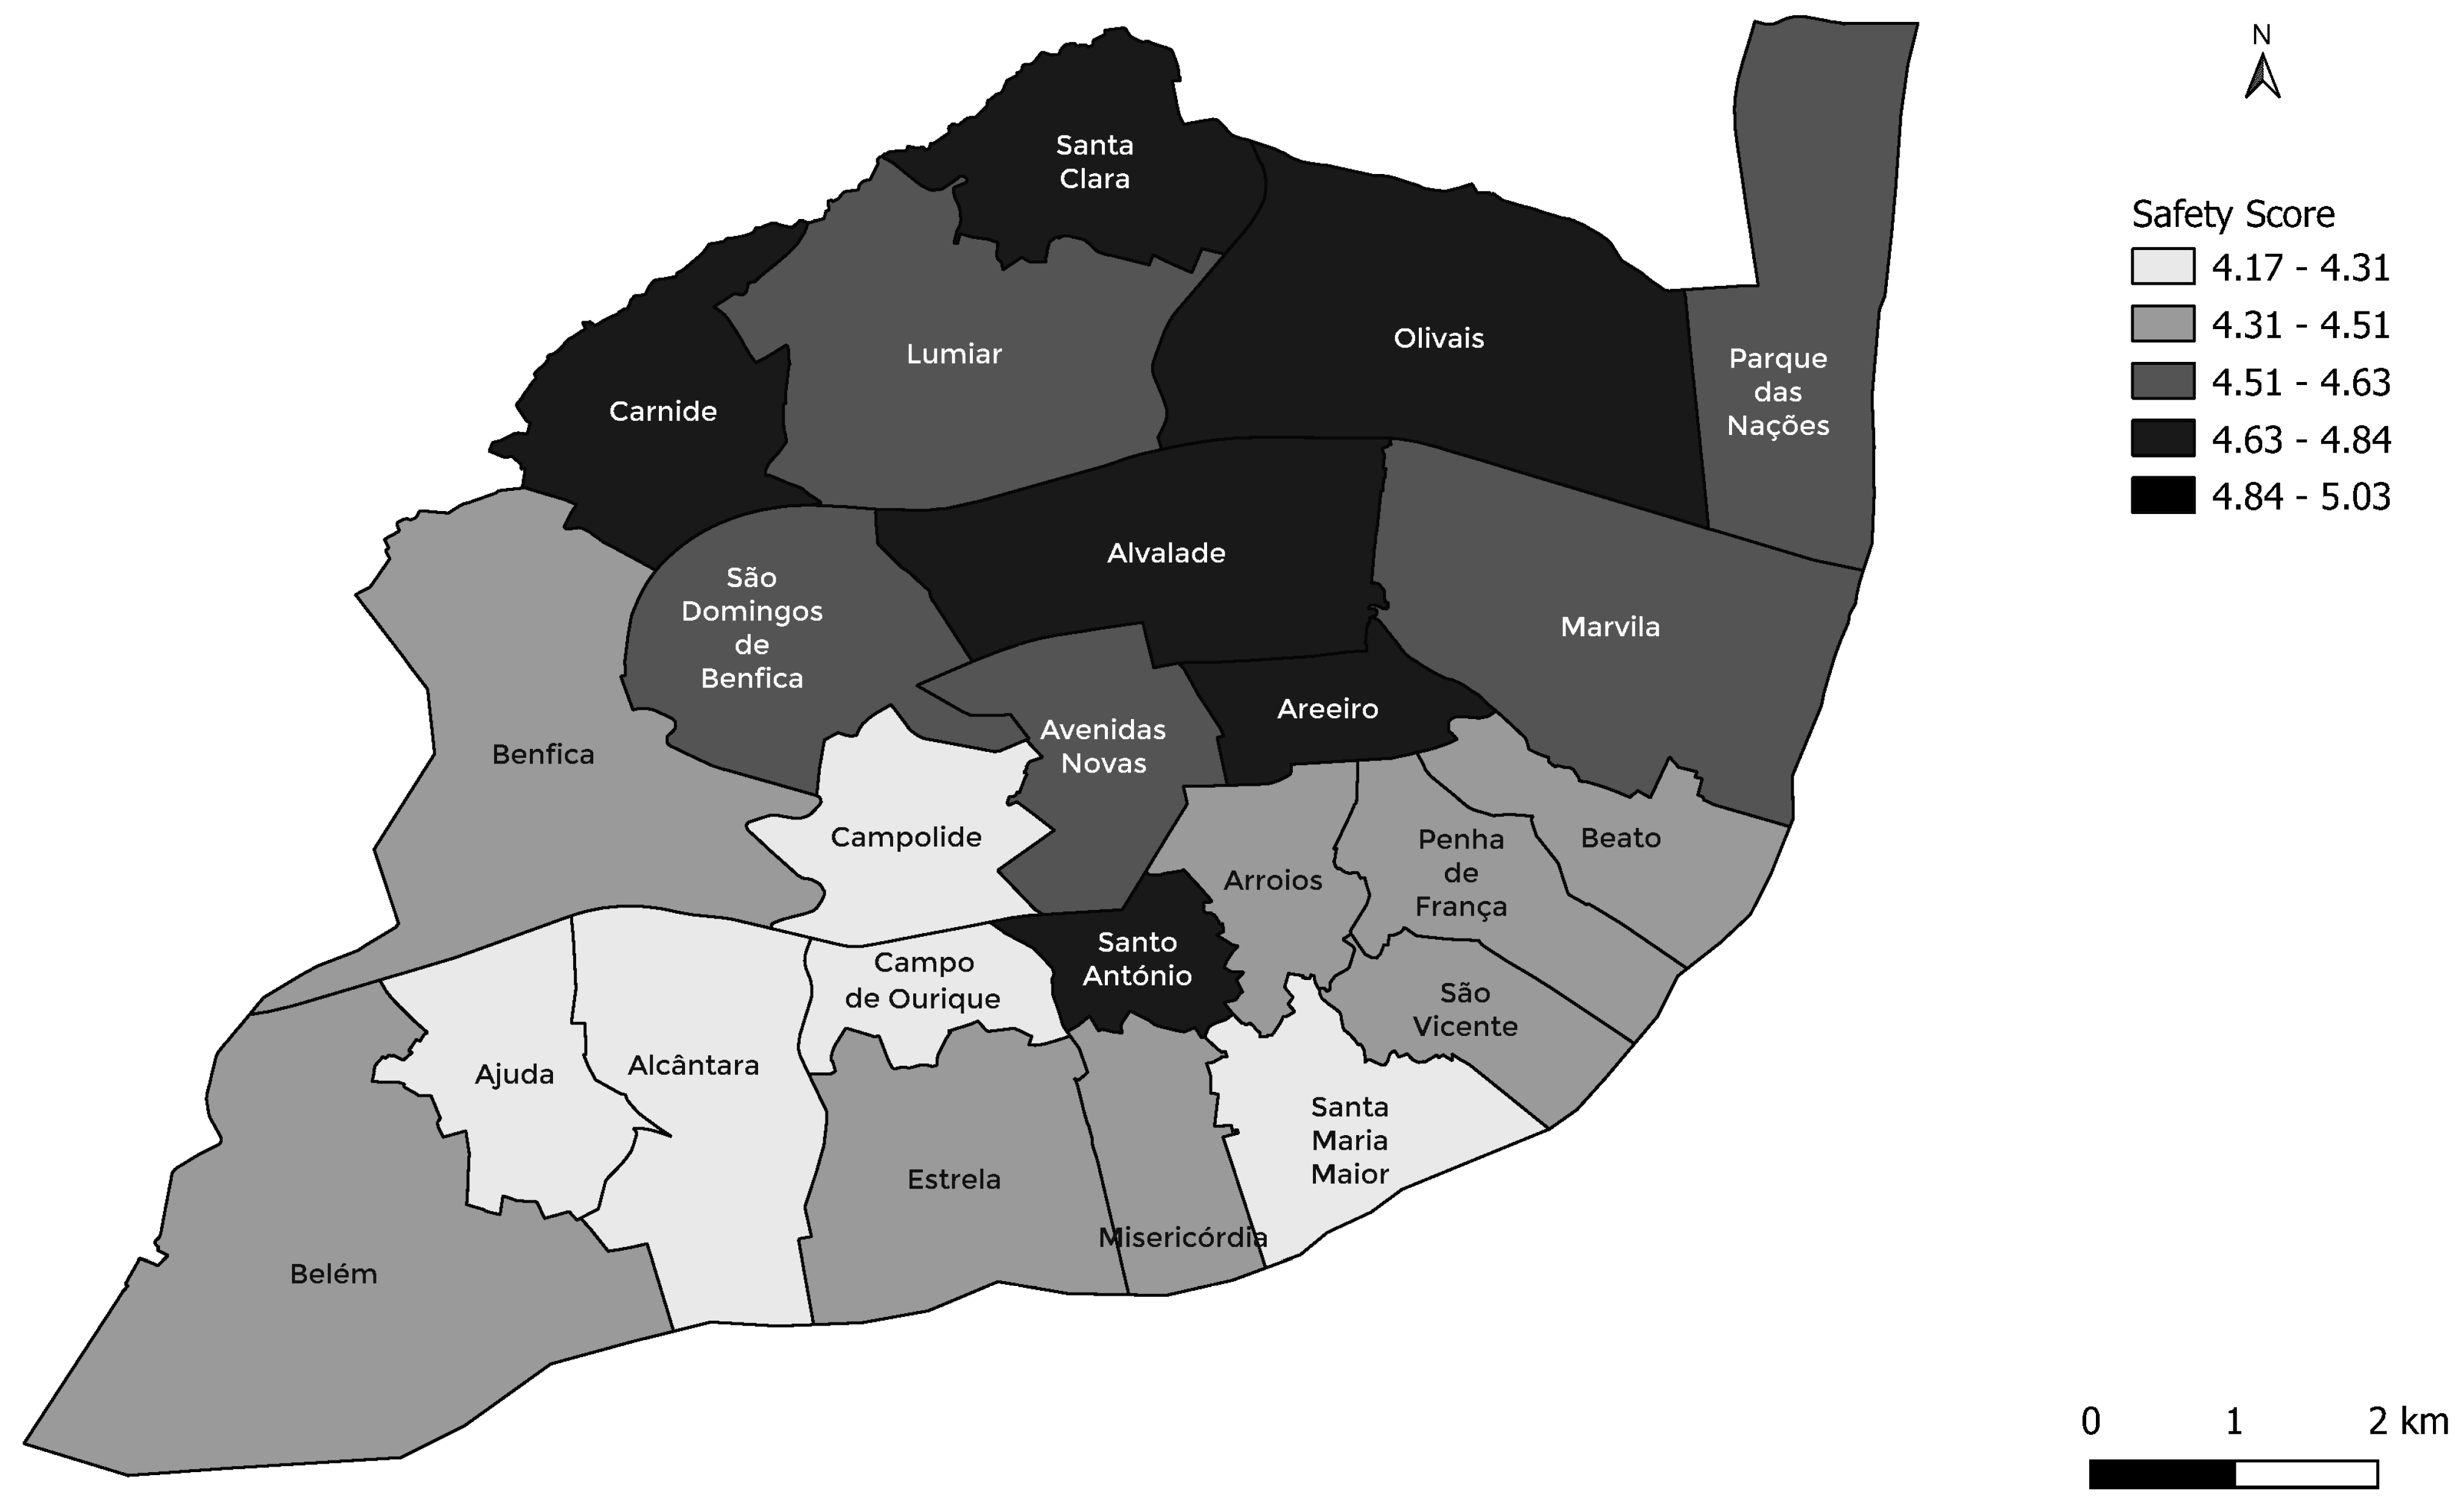
Figure 1. Summary of the implemented framework. Input: GSV images; processing: image segmentation and object detection from GSV images, assessed using the Bikeable neural network; and outputs: a safety map created from the safety score provided by Bikeable, and safety routes avoiding dangerous points.
Smartcities 06 00094 g001
Figure 2. Applied methodology in this research.
Smartcities 06 00094 g002
Figure 3. Lisbon’s cycling network updated to April 2023.
Smartcities 06 00094 g003
Figure 4. Safety scores across Lisbon parishes.
Smartcities 06 00094 g004
Figure 5. Random route generation.
Smartcities 06 00094 g005
Figure 6. Pixel-level segmentation concentration of detected positive and negative risk factors in Lisbon: selected examples of (a) vegetation; (b) guardrail.
Smartcities 06 00094 g006
Figure 7. Objects detected: selected examples of (a) bicycles; (b) cars.
Smartcities 06 00094 g007
Figure 8. Safety map of Lisbon.
Smartcities 06 00094 g008
Figure 9. Comparison of routes between two random points.
Smartcities 06 00094 g009
Table 1. Parish safety scores.
ParishArea (km2)Number of PointsPoints/km2Safety Score
Ajuda2.88114404.3
Alcântara5.07170344.2
Alvalade5.34397744.7
Areeiro1.72155904.7
Arroios2.132771304.5
Avenidas Novas2.99296994.6
Beato2.4884344.5
Belém10.43350344.5
Benfica8.02294374.4
Campo de Ourique1.65125764.3
Campolide2.77143524.3
Carnide3.69168464.8
Estrela4.60194424.5
Lumiar6.57385594.6
Marvila7.12359504.6
Misericórdia2.1966304.4
Olivais8.09405504.7
Parque das Nações5.43240444.6
Penha de França2.71168624.5
Santa Clara3.36143434.7
Santa Maria Maior3.01114384.3
Santo António1.49134904.7
São Domingos de Benfica4.29255594.6
São Vicente1.9996484.5
Average 216604.5
Source: Area [69].
Table 2. Comparing routes between different routing options (n = 100 and a Euclidean distance of 5 km).
VariableBenchmarkShortestBalancedSafest
Time (min)25.25 ± 4.3021.77 ± 2.5821.94 ± 2.6223.47 ± 3.10
Distance (km)6.62 ± 1.046.29 ± 0.716.33 ± 0.716.70 ± 0.81
Route factor1.54 ± 0.251.37 ± 0.161.38 ± 0.161.47 ± 0.19
% change in time-−13.7%−13.1%−7.1%
% change in distance-−5.0%−4.4%1.2%
Disclaimer/Publisher’s Note: The statements, opinions and data contained in all publications are solely those of the individual author(s) and contributor(s) and not of MDPI and/or the editor(s). MDPI and/or the editor(s) disclaim responsibility for any injury to people or property resulting from any ideas, methods, instructions or products referred to in the content.

