Article

Renovation or Redevelopment: The Case of Smart Decision-Support in Aging Buildings

Department of Digital Engineering and Construction, Karlsruhe Institute of Technology, 76131 Karlsruhe, Germany
*
Author to whom correspondence should be addressed.
Smart Cities 2023, 6(4), 1922-1936; https://doi.org/10.3390/smartcities6040089
Submission received: 10 July 2023 / Revised: 25 July 2023 / Accepted: 8 August 2023 / Published: 10 August 2023
(This article belongs to the Section Energy and ICT)

Abstract

:
In Germany, as in many developed countries, over 60% of buildings were constructed before 1978, where most are in critical condition, requiring either demolition with plans for redevelopment or renovation and rehabilitation. Given the urgency of climate action and relevant sustainable development goals set by the United Nations, more attention must be shifted toward the various sustainability aspects when deciding on a strategy for the renovation or redevelopment of existing buildings. To this end, this study focused on developing a smart decision support framework for aging buildings based on lifecycle sustainability considerations. The framework integrated digital technological advancements, such as building information modeling (BIM), point clouds processing with field information modeling (FIM)®, and structural optimization, together with lifecycle assessment to evaluate and rate the environmental impact of different solutions. Three sustainability aspects, namely, cost, energy consumption, and carbon emissions, were quantitatively evaluated and compared in two scenarios, namely, renovation, and demolition or deconstruction combined with redevelopment. A real building constructed in 1961 was the subject of the experiments to validate the framework. The result outlined the limitations and advantages of each method in terms of economics and sustainability. It was further observed that optimizing the building design with the goal of reducing embodied energy and carbon in compliance with modern energy standards was crucial to improving overall energy performance. This work demonstrated that the BIM-based framework developed to assess the environmental impact of rehabilitation work in aging buildings can provide effective ratings to guide decision-making in real-world projects.

1. Introduction

The preservation of the structural integrity of aging and historic buildings is a crucial step towards ensuring their lasting conservation [1]. To this end, temporal destructive and non-destructive testing is performed to predict the material properties of structural components, and determine the structural response and consequentially their effective lifecycle [2,3]. In the extreme cases, a complete demolition of the structural systems, followed by a preservation of the envelop (and interior architectural components) may be the only possible option. The environmental impact of construction and demolition waste (CDW) is, however, significant. In the European Union, the construction sector produces 839 million tons of waste annually, with 281 million tons of Construction and Demolition waste (CDW), contributing to 33% of the total waste from all sectors [4]. In addition, CDW contributes to 10–30% of all landfilled waste [5]. As a result, in recent years, more attention has been focused on reusing and recycling strategies to manage CDW and reduce machine demolition and landfill. A study conducted by Marzouk and Azab [6] shows that recycling CDW reduces emissions, energy use, and global warming potential (GWP) significantly, while preserving landfill space. In addition, increasing the prices and shortages of building materials compel the construction industry to find new, affordable, and sustainable material sources. In this case, the considerable amount of CDW allows them to obtain building materials.
As such, this study aims to evaluate the environmental impact of two different development strategies for existing aging buildings (i.e., older than 60 years), namely, (i) deconstructing or demolishing (both separately) the existing building and erecting a new building with optimized and up-to-date properties; and (ii) renovating the existing building twice during its lifespan. In the former case, a considerable amount of CDW can be repurposed to allow reuse of the existing building materials that still comply with local code standards. In the latter strategy, the building is planned for renovation every thirty years (twice in a 60 year lifespan). The total cost, energy consumption, and carbon emission generated in the considered scenarios were compared to choose the best option for the existing building.
To achieve the goals of this manuscript, the remainder of this section provides an overview of the state-of-the-art for challenges in the BIM-based sustainability assessment of existing buildings, and the state of design optimization for sustainability.

1.1. Challenges in BIM-Based Sustainability Assessment of Existing Buildings

Typical metrics to quantify sustainability aspects, such as embodied energy and carbon, report the cradle-to-gate or cradle-to-grave values in unit weight of material consumed (e.g., the Inventory of Carbon and Energy (ICE) [7,8]). As such, once the inventory of material consumed in a building is determined (through quantity-surveying), the embodied energy and carbon of the whole building can be determined. Given that BIM is the process of modeling intelligent graphical and non-graphical data related to building construction projects within a unified model [9,10,11], the quantity of material can be automatically extracted from the BIM. In fact, most BIM software platforms, such as Revit [12], provide this opportunity. For instance, the effectiveness of a BIM-based system for estimating and planning demolition and renovation wastes was evaluated in [13]. The study extracted material and corresponding volume information from the BIM model, which was then used to predict the required dump truck capacities, including number of rounds for off-loading, and total costs for waste disposal.
However, a BIM model is not always available, especially for historic and aging buildings. The geometry of the visible structural elements of a building can be determined using optical metrology tools, such as laser scanners and cameras. To generate a semantic BIM from the acquired point clouds, the Field Information Modeling (FIM)® framework [14] can be utilized, which has been shown effective in automatic semantic BIM generation of oil and gas pipes [15], mechanical residential pipes [16,17], reinforced concrete structures [18], and cultural heritage domes [1]. The BIM model generated using only visual digital information, such as point clouds, will contain information about building construction, boundaries and relationship between elements (e.g., partition walls, beams and building envelopes), and the quantities and types of building materials. This is a precondition for producing a material inventory.
However, in order to create a detailed material inventory for lifecycle analysis, the FIM® framework requires additional information regarding the inherent and hidden material within the visible elements of the building. These include concrete reinforcement steel, exact concrete composition, types and thickness of insulations, and many more factors. Some inherent mechanical and material properties can be identified automatically using non-destructive testing methods, such as ultrasonic pulse velocity test [19], concrete tomography [20] and ferro-scanning [21]. Others can be determined through available textual documents, such as building permits and technical specifications, and automatically determined using natural language processing [22,23]. Despite such advancements and developments, many old buildings lack up-to-date and accurate information. As such, in this study an informed assumption about the unknown internal characteristics of the building, such as weight of steel and concrete volume ratio, was made (see Table 1; raw data adopted from [24]).
In terms of material classification, two systems were utilized, namely, the directive 2008/98/EC of the European Parliament, and the ASTM Uniformat II [25]. The former provided relevant information regarding common material types and their characteristics (e.g., hazardous vs. non-hazardous) [24], whereas the latter provided a hierarchical classification of different element groups [26] (recommended in quantity surveying and sustainability evaluation [27]).
Finally, it is worth noting that many factors influence the embodied energy and carbon depending on the type of analysis (e.g., 50-50 [7,8]), even for the same material type. For example, the embodied energy and carbon of sand imported from abroad greatly differ from these values in sand obtained through domestic sources. This study refers to the ICE database [7,8], which adopts the EU-wide standard 15,804 EPDs (i.e., Environmental Product Declarations), for embodied energy calculations, and the possible effects of idealizations have been disregarded.

1.2. Design Optimization for Sustainability

Generative design (GD) [28,29,30,31] is the process of utilizing artificial intelligence (AI) to generate meaningful heuristic results when either traditional methods fail, or a single solution cannot be obtained (e.g., no single solution exists that satisfies all objectives simultaneously). In such cases, many good solutions (in the case of multi-objective optimization, Pareto front) are generated to solve the optimization problem [32,33]. In terms of building design, the integration of visual programming [34], BIM and GD has been shown effective, particularly to enhance lifecycle sustainability. Some examples of successful BIM and GD integration with sustainability considerations include the construction feasibility of underground infrastructures [35]; drywall installation planning in prefabricated construction [36]; the design of connections to code regulatory standards [37]; cloud-based solutions for energy performance simulation, such as daylight analysis [38]; lay-out of steel frame components [39,40]; spatial planning for residential blocks [41] together with integration of dynamic and complex policy frameworks for obsolescence buildings [42]; and topology optimization [43,44].
Despite considerable efforts made by the academic community in the area of GD for building and process optimization, a considerable gap between academic research and industry in structural optimization exists. This discrepancy is attributed to the lack of robust intermediary and interoperable frameworks to effectively transfer the necessary information from the BIM software for generative optimization. To address this issue, a workflow for automated structural optimization using architectural designs generated through BIM-based software was proposed [45]. This approach used a BIM software package, including Revit, the Dynamo plugin [34], and Robot Structural Analysis (RSA), to merge the architectural design and structural design phases. In this study, this framework together with a genetic algorithm [46] will be utilized to optimally design new structures.

2. Materials and Methods

The methodology consists of the following steps (summarized in Figure 1):
  • Point cloud collection—Collection of point clouds through Structure-from-Motion (SfM) and Laser Scanner using smartphones from an existing building;
  • BIM generation—Creating a BIM model of the point cloud;
  • Lifecycle assessment—Calculate the embodied energy and carbon for the material and construction processes, along with energy demand during operation.
    • Optimal redevelopment with demolition or deconstruction:
      • Apply loads and boundary conditions to the generated model;
      • Find the optimal size, shape and location of main structural components (e.g., column, beam, slabs) through topology optimization procedures;
      • Demolition and redevelopment sustainability assessment of the project.
    • Renovation sustainability assessment;
  • Decision-support—Provide systematic recommendations and strategies for reductions in the carbon footprint of the project.

2.1. Point Cloud Collection

Two different strategies were employed to collect point clouds from the indoor and outdoor scene. The outdoor point cloud was collected using smartphone videos, and it was then processed and automatically scaled [16] to generate the point cloud (more details below). The indoor point cloud was collected using smartphone LiDAR instrument. The strategies for indoor and outdoor were deferred due to: (i) requirements for convergent imagery [47]; and (ii) the need for metric scale definition [16]. In indoor rooms, by virtue of its nature, convergent imagery cannot be maintained, and hence the process may fail to converge or provide accurate results (see Figure 2a of [16]). In indoor settings, due to the presence of many rooms, target-based automatic scale definition must be carried out such that each target field is at least observed by five convergent images (see Figure 8 of [16]), which cannot be guaranteed. To this end, a point cloud of indoor scenes was collected using a LiDAR-based smart device, the iPad Pro. The process of generating a complete point cloud model for a building is explained in more detail in the following.
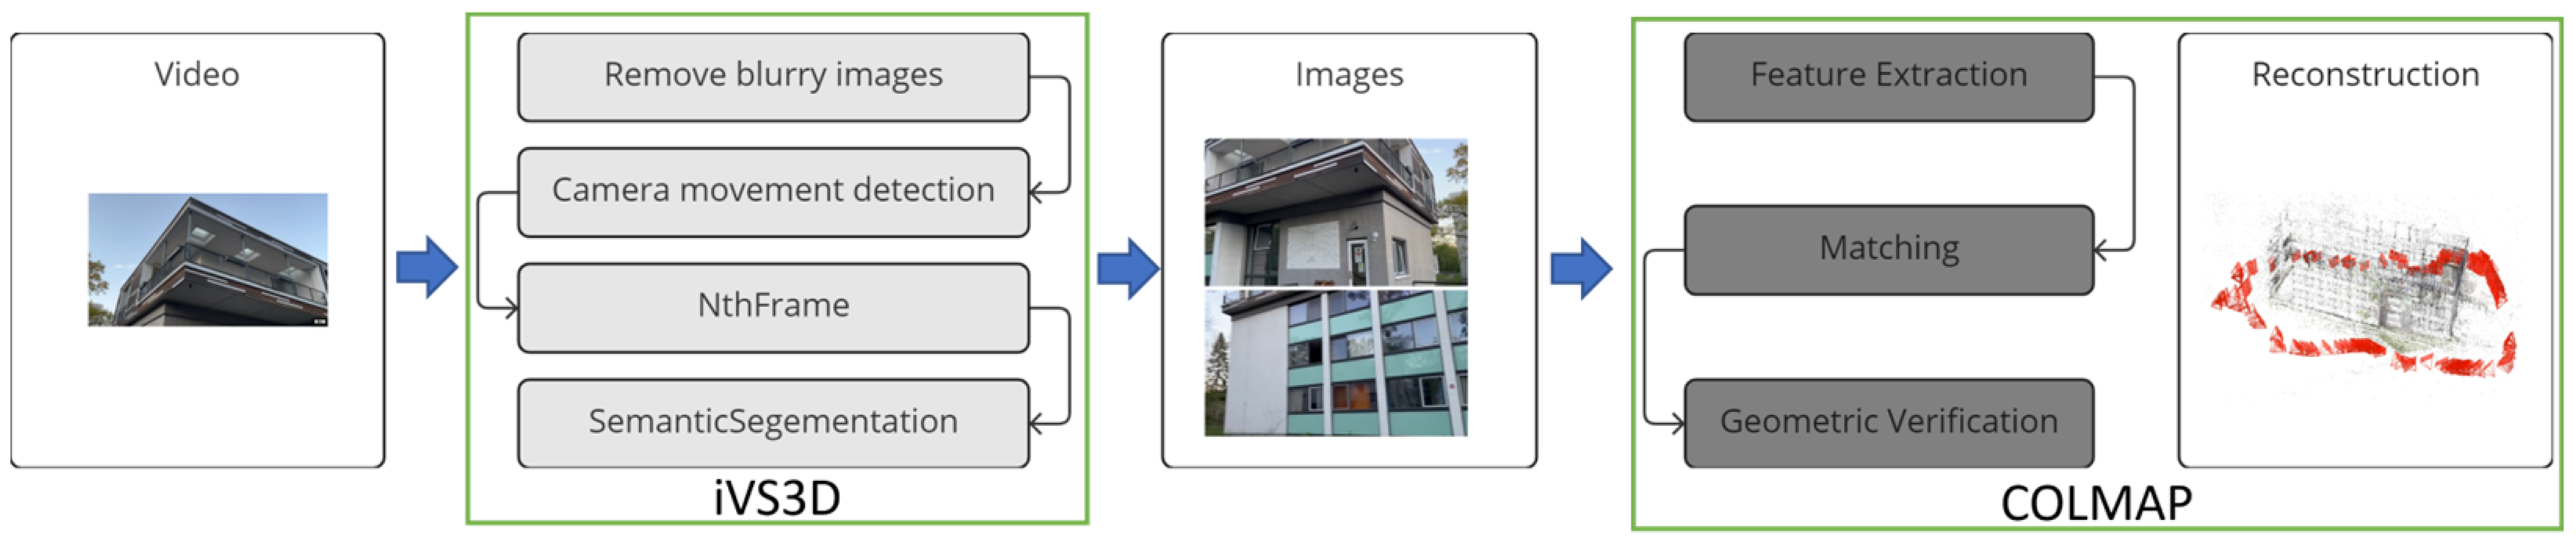
  • SfM façade monitoring: Create a point cloud of the facades using smartphone videos and the Structure-from-Motion process (SfM) [16] with COLMAP v.3.7 [48,49]. Due to the requirement for convergence imagery [47] and high network overlap [16], prior to data collection a path was designed using Google Maps. An Apple iPhone 13 mini (German version) was used for video recording, which can acquire 4k video recording at 30 and 60 frames-per-second (fps). To maintain high image overlap and quality, the iVS3D method was utilized to sample and pre-process videos to increase 3D reconstruction speed and quality by eliminating images with low content [50]. Summary of the SfM is shown in Figure 2.
  • LiDAR interior scanning: Scan of the interior of the building with the light detection and ranging (LiDAR) scanning smartphone app, SiteScape. The LiDAR data were collected using the Apple iPad Pro (German version). Point density and point sizes in the app were set to medium with slow movement during scanning (i.e., left-to-right rotations of more than around 15° were avoided). To ensure consistent data quality, all data were collected while maintaining at least 50% of battery and cooled down to room temperature before starting the next scanning.
  • Registration: Registration of the collected point clouds in the opensource point cloud processing software, CloudCompare v.2.12.4 [51]. After the scaling of the SfM point cloud, both were taken to CloudCompare where floor detection using the method of [52] was used to orient both point clouds such that the z-axis was parallel to the plane normal. A translation is used to level the two planes of the floors. Using this, the problem of 3D registration was reduced to the 2D alignment of the exterior and interior walls in the x–y plane.
  • Scan vs. BIM: Alignment and point cloud object detection using the scan vs. BIM framework [14,53]. Using the blueprints and technical specifications, a BIM model was generated (manually using Autodesk Revit 2023), and aligned to the registered point cloud. Iterative closest point (ICP) registration between the point cloud and model was performed to determine compliance with the generated model and to correct the model if required [54]. The final volumetric corrections to the original blueprint BIM were performed manually from the automatically extracted floors, ceilings and building boundary/envelop as explained in the following section.

2.2. BIM from Point Cloud

The point cloud must be converted into a Recap (.rcp) file in Autodesk Recap Pro 2023 and imported into Autodesk Revit 2023. To this end, a workflow was organized (shown in Figure 3a) as follows: (i) set the registered origin for the point cloud; (ii) set the scan location for the ceiling; (iii) set the scan location for the floor; and (iv) create a view state for the floor plan. The automatically detected floor and ceiling panels [14,52] were used in Revit to define the levels. Finally, a view state of the floor plan was generated using a bounding box with automatically highlighted boundary edges from step 4 above.
Next, a new metric architectural project with defined units was created in Revit. The levels were defined using the point cloud floors, and the main grids were drawn (center-on-center) according to the positions of the columns and walls. In level 1, the view range is defined to provide a clear floor plan. Exterior and interior walls are drawn based on this floor plan, slab, and foundations, followed by drawing windows, doors, and curtain walls. All objects are then selected and copied to levels 2 and 3. Stairs and railings are added. Finally, the functions of all rooms are defined, and their areas are calculated. The BIM model consists of 3D parametric objects, allowing for the modification of the dimensions and positions of these objects. The CADMapper website was then utilized to generate a 3D site plan in Revit for the generate building. This map enabled the generation of realistic scenarios for the calculation of embodied energy and carbon within the case studies (Figure 3b).

2.3. Embodied Energy and Carbon Calculation

The object-oriented building information was classified into four hierarchical levels: (i) the top level representing the entire building; (ii) the second level comprising groups of structural and non-structural components; (iii) the third level denoting individual building elements, such as walls and floors; (iv) and the lowest level encompassing materials and products. The data on materials, such as densities, volume, length, and weight, were extracted from the BIM model, and subsequently listed in the material inventory.
The embodied energy and carbon of the study building were calculated based on this inventory through the following idealizations:
  • The primary building components, excluding finishing materials, furniture, and services (e.g., steel, timber, concrete, and glass) were extracted;
  • The materials’ type, volume information, density, and quantity were extracted;
  • The ICE database [7,8] was then adopted to calculate embodied energy and carbon;
  • The embodied energy and carbon were calculated by multiplying material weight with ICE coefficients.

2.4. Design Optimization Framework

Structural optimization was performed to evaluate the true benefits of a new design with similar properties as the existing building (e.g., floor plan area, and number of rooms). Based on the locations of the columns, beams, and slabs, a parametric modeling framework was created in Dynamo (Figure 4). The objective was to find the design that minimizes the overall weight of concrete, subject to code specific constrains on load (live and dead), displacement, slenderness, and compressive strength. Here, the decision variables were the locations and numbers of columns and beams, along with the thickness of the slab. The structural loadings were prepared based on the relevant DIN standard and the finite element analysis was carried out using RSA and structural analysis integration with Dynamo visual programming. The Dynamo script was generated and integrated with RSA using the genetic algorithm framework presented in [55]. The general steps of the newly generated Dynamo script are shown in Figure 4. The combination receiving the least weight, while satisfying code specific standards on slenderness, displacement, and stress, was considered as the optimal structure.

2.5. Deconstruction vs. Demolition

The energy consumption required for the deconstruction and demolition have been calculated using the following formula:
P = P D c + P T r + P R c + P R e , D e c o n s t r u c t i o n P D m + P T r D e m o l i t i o n ,
where P D c , P T r , P R c , P R e and P D m are the energy consumption related to the deconstruction, transportation, recycling, recovered energy during recycling, and demolition processes, respectively. The workflow for deconstruction and demolition can be summarized as below.
  • Plan deconstruction/demolition work;
    • Define deconstruction groups;
    • Plan the sequence of deconstruction work;
    • Calculate the duration for each deconstruction task;
    • Analyze each deconstruction work, choosing the proper tools and machines for each group.
  • Plan recycling workflow and transportation:
    • Quantify the deconstructed building material;
    • Reuse building materials;
    • Recycle building materials;
    • Dispose of non-recyclable materials.
  • Conduct quantitative evaluation:
    • Estimate duration and cost for deconstruction and demolition;
    • Calculate energy costs and carbon emissions caused during demolition or deconstruction work;
    • Calculate energy cost and carbon emission in transportation;
    • Calculate recovered energy and saved carbon emissions from recycled and reused building materials and products.

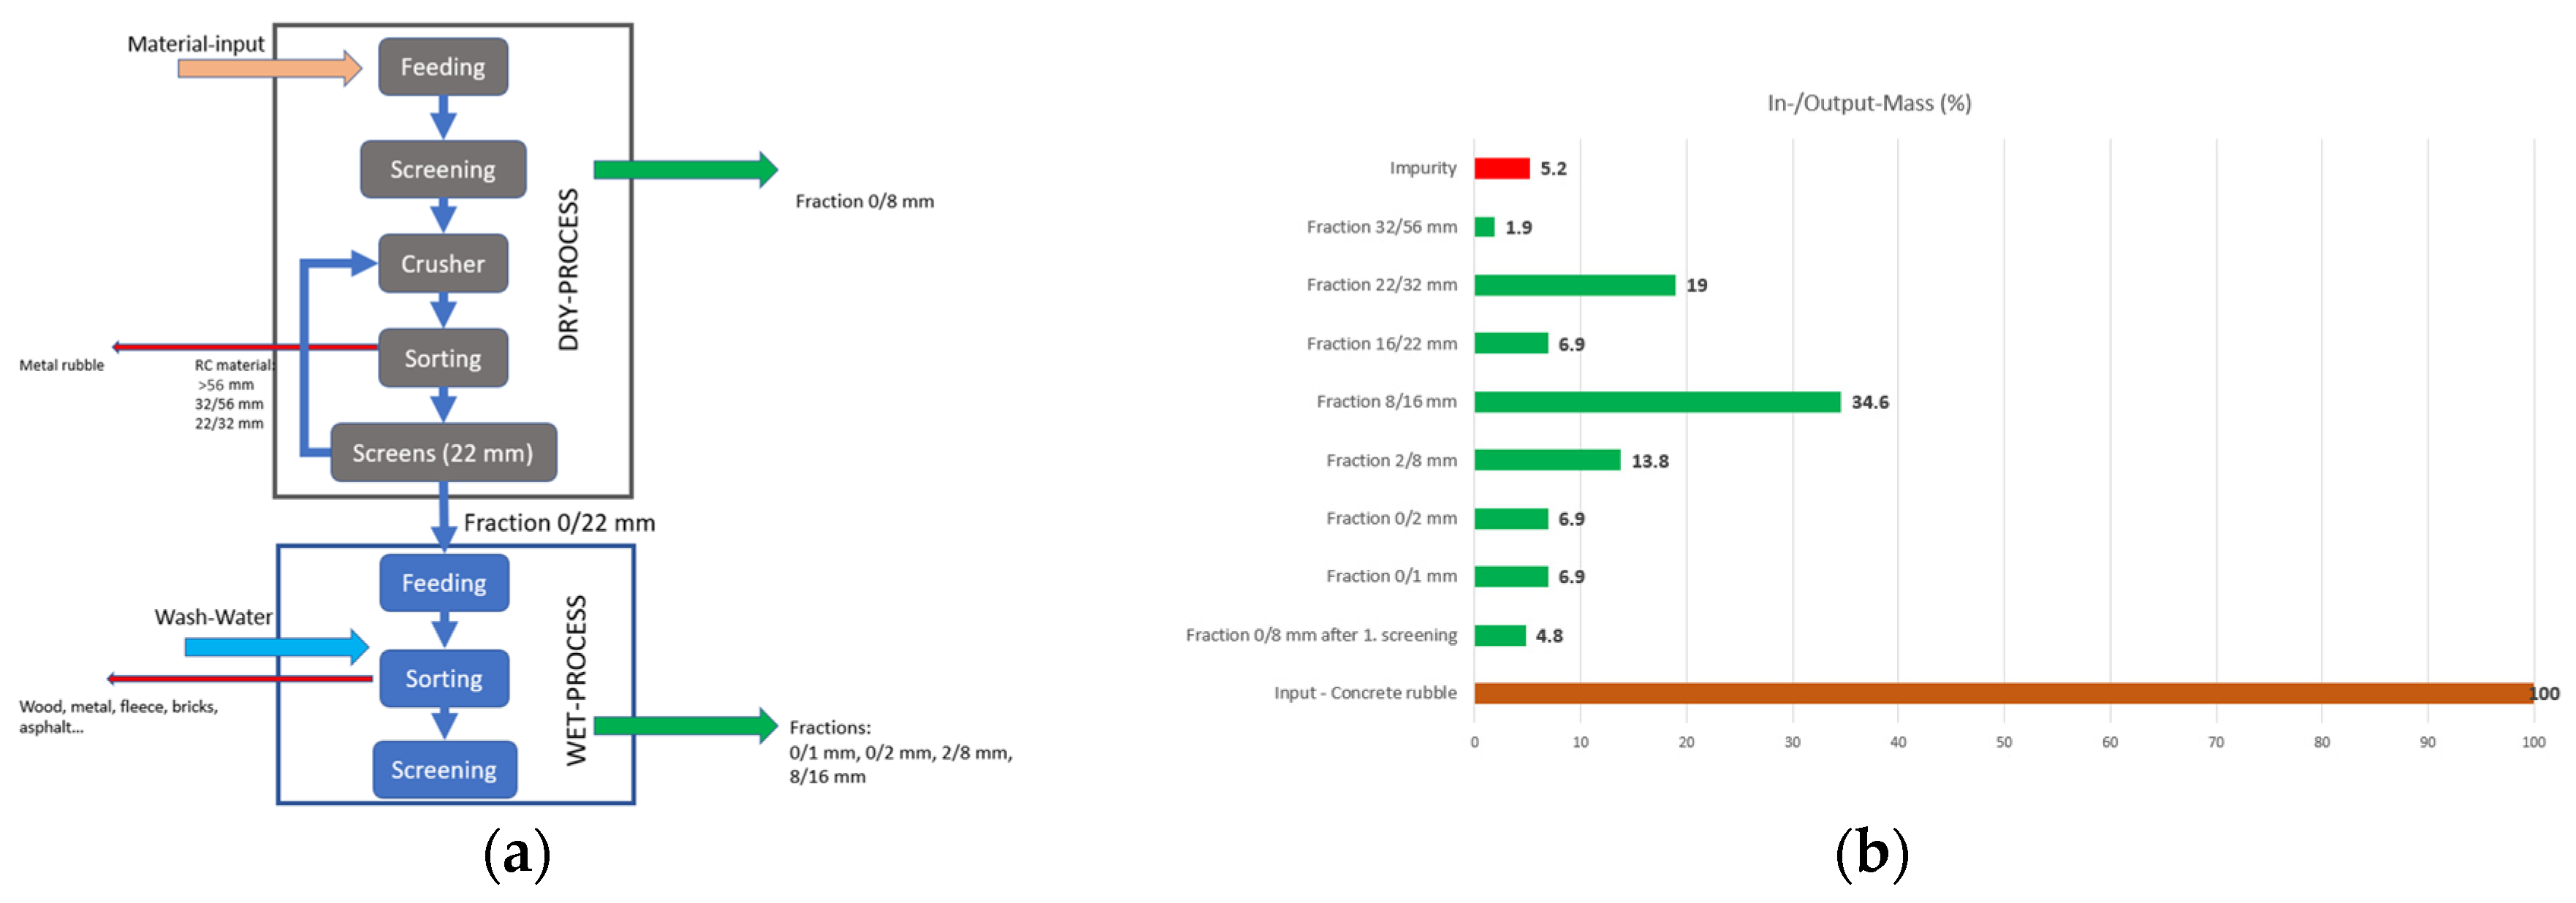
2.5.1. Recycling Workflow

An advanced recycling workflow for concrete rubble was adopted here. The workflow can be divided into two stages (i.e., dry process and wet process). In the dry process, the concrete rubble is crushed in a jaw crusher, sorted, and screened in a dry process. The crushed materials are sieved through a 22 mm sieve to obtain a fraction of 0/22 in size. The fractions of >22 mm are collected and placed in the jaw crusher again. Meanwhile, the metal rubble is separated in this process. Afterward, a fraction of 0/22 is transported to the next stage—the wet process. In this stage, further sorting and screening processes occur, and the aggregates are divided into fractions of 0/2 mm, 0/1 mm, 2/8 mm, and 8/16 mm [56]. The process is summarized in Figure 5a.
Figure 5b shows the mass balance of recycled materials adopted from [56]. This study extracted the concrete rubble from a reinforced concrete assembly construction. After removing harmful materials and impurities, 83% of the demolition waste was concrete rubble, 9% was mortar, and the rest was impurities (i.e., plastics, glass, wood). The production efficiency of this study is adopted in the analysis of the deconstruction scenario (Figure 5a). Other than proportions of materials, the energy cost of recycling [56], shown in Table 2, is utilized.
Finally, using the proposed recycling process, a material and energy flow diagram was generated. Figure 6 shows the material and energy flow diagram for the case study used in this manuscript. The input included 408 tons of concrete rubble, 48.4 tons of mixed broken bricks and tiles, and 10.6 tons of steel in concrete.

2.5.2. Criteria for Evaluation

Finally, a set of relevant criteria was devised to evaluate the advantages and disadvantages of utilizing demolition vs. deconstruction. Table 3 shows the criteria and the corresponding points associated with each factor. These factors include economics (e.g., cost), sustainability (e.g., embodied carbon), and social issues (e.g., noise and disruption to the neighbors as a function of operation time of machinery).

2.6. Renovation

The process of computing the embodied energy and carbon for renovation is similar to that presented in Section 2.3. Here, it is important to describe the process by which the cost of renovation was calculated. The present value of future renovations was determined using the construction price escalation index, along with the cost of restoration, obtained from the official German statistics office [57].
The final energy consumption was calculated by incorporating the ratio of usable area with the electricity price, which employed an electricity price of 0.38 €/kWh for 2022. Additionally, several assumptions were made to approximate the operation cost, energy consumption, and carbon emissions, outlined as follows:
  • Energy consumption amounted to 88 kWhm−2 year−1 (the model also accommodated for an improved energy efficiency of around 25% after each renovation to account for the required energy consumption reduction in the EU [58]);
  • A new building energy consumption was set to 62 kWhm−2 year−1;
  • Electricity price escalation was assumed at 0.38%;
  • Electricity was the only form of energy utilized, with 1 MJ of energy from electricity resulting in 177 g of CO2 emissions according to [7,8];
  • The renovation period was considered as every 30 years.

3. Results and Discussion

3.1. Case Study

A three-story residential building was selected as the subject of this investigation. The original plans and other documents related to the renovation conducted in 2011, along with the site plan and floor plans, were available and utilized for this study. The main features of the study building are presented in Table 4.

3.2. Point Cloud Collection and Processing

The walking path shown in Figure 7a was planned for use in data collection using the Apple iPhone 13 mini (German version) with 4K video resolution at 60 fps. Using the iVS3D [50] framework, 248 images were generated and selected for SfM using COLMAP (Figure 7b). Finally, the Apple iPad Pro (German version) together with the SiteScape app were utilized for data collection of the interior of the building (Figure 7c; each floor was scanned separately). The final point cloud of the registered interior and exterior using CloudCompare is shown in Figure 7d.

3.3. BIM-Based Bill of Quantities and Sustainability Evaluation

Based on the BIM model generated from the point cloud, the bill of quantities was determined and utilized to determine the sustainability factors of the project material, which will then be used to determine the sustainability factors in case of demolition and deconstruction. The results of the BIM-based analysis are provided in Table 5. It was observed that bricks and concrete as the main construction materials contributed to around 46% of embodied energy and over 60% of carbon emission. Furthermore, 8.5 tons of plastic contributed to 18% of the embodied energy and 8% of carbon emissions. It can be inferred that reducing the weight of the main structural materials (e.g., concrete and brick) by design (e.g., through effective optimization strategies) together with the utilization of sustainable circular materials to replace plastic waste were crucial for decreasing embodied energy and carbon in buildings, particularly when demolished.

3.4. Deconstruction vs. Demolition

A logistical assumption regarding the distances between the old building, new building development, landfill, recycling plant, storage and sand supply was made (Figure 8). As shown, the distance between the old and new buildings was assumed to be 2 km. It was assumed that 85% of bricks were preserved and reused, and the rest were mixed with concrete rubble. The reusable bricks were transported to the storage facility with a transport distance of 10 km. Concrete, bitumen, and insulation were delivered to the recycling plant, which was considered 15 km from the deconstruction site. Carpet and frames were disposed of in a landfill. The distance to the landfill was assumed to be 35 km. In the demolition scenario, after removing bitumen, insulation, carpet, windows, and doors, the whole building was demolished, and all construction wastes were disposed of.
Based on the provided assumptions and with due consideration of Equation (1), the results of the choice between deconstruction and demolition (as proposed in Section 2.5.2) are presented in Table 6. It was observed that the deconstruction, due to the possible repurposing of more material, achieved a better overall score of 85 compared to the score of 43 received using demolition. The deconstruction together with optimized structural design for a new building will be adopted for comparison with the renovation.

3.5. Comparison of Results with Renovation

The selected strategy of deconstruction together with the optimized design of a new building was compared to the renovation of the existing facility. In the case of the present study, cost, total energy consumption and carbon footprint are used for comparison. The results are shown in Table 7. It was observed that the deconstruction and new development exceeded the cost and embodied energy consumption for two renovations by around 10.5% and 7.8%, while improving embodied carbon by roughly 9.6%. At this stage, the project team must decide on the relative importance between different criteria to make a final decision. For instance, if cost and embodied energy are deemed more important by the project team, renovation will be considered the better solution. The results of this case study reveal the need for such lifecycle analysis in decisions pertaining to deep renovations or deconstruction.

4. Conclusions

This study investigated the environmental impact of two distinct scenarios in building rehabilitation work, namely, the renovation of an existing building, and deconstruction or demolition followed by construction of a newly optimized building. The analysis was conducted through developing a digital model of the existing building and converting it to a semantic BIM, which can then be utilized as a valuable tool to assess the sustainability aspects of a building. Although BIM offers significant advantages in data management and visualization, it is important to note that substantial manual efforts remain necessary for accurate calculations and the overall assessment process.
This research investigates various aspects of the building development process, including integrating BIM with reliable databases for material quantity-takeoff, applying generative design techniques, incorporating parametric design methodologies, and assessing the long-term energy performance of buildings. These components are crucial for a comprehensive understanding of the environmental impact of aging buildings in need of rehabilitation. To this end, the study proposed a formal framework to assess the sustainability aspects pertaining to the two possible separate scenarios of renovation and deconstruction/demolition. The framework encompasses several stages, including FIM®-inspired digital documentation, BIM model recreation, deconstruction and demolition planning, material recycling, building material weight optimization, cost estimation, and energy performance analysis. A real building was used as a case study to evaluate the framework’s effectiveness and applicability.
In the present study, it was observed that deconstruction was more environmentally friendly and economical than demolition. However, despite generative design optimization efforts to minimize the weight of a new building, the cost and embodied energy were found to be 10.5% and 7.8% worse than renovation, respectively. The deconstruction with new development, on the other hand, gained 9.6% in embodied carbon compared to renovation. Considering all three criteria with equal weight, the renovation scenario was found to be more favorable, as it offered a more cost-effective solution with a lower embodied energy. These results suggest that a formal lifecycle analysis that incorporates all aspects of sustainability, digitization, optimization and rehabilitation can provide valuable decision-support information.

Author Contributions

Conceptualization, R.M.; methodology, R.M. and B.W.; software, B.W.; validation, B.W.; formal analysis, B.W.; investigation, B.W. and R.M.; resources, R.M.; data curation, B.W.; writing—original draft preparation, B.W.; writing—review and editing, R.M.; visualization, B.W.; supervision, R.M.; project administration, R.M.; funding acquisition, R.M. All authors have read and agreed to the published version of the manuscript.

Funding

The study was funded through the personal research fund of Jun. Reza Maalek, at the Department of Digital Engineering and Construction, partially endowed by GOLDBECK GmbH. The authors wish to acknowledge the support provided by the KIT Publication Fund of the Karlsruhe Institute of Technology in supplying the APC.

Data Availability Statement

The data is accessible from the corresponding author upon reasonable request.

Conflicts of Interest

The authors declare no conflict of interest.

References

  1. Maalek, R.; Maalek, S. Automatic Recognition and Digital Documentation of Cultural Heritage Hemispherical Domes Using Images. J. Comput. Cult. Herit. 2023, 16, 1–21. [Google Scholar] [CrossRef]
  2. Akbari, R.; Maalek, S.; Ashayeri, H. Modal Analysis and Step-by-Step Repair Operation of a Two Span Concrete Skew Bridge to Replacement of Its Elastomeric Bearings. In Bridge Maintenance, Safety, Management, Health Monitoring and Informatics, Proceedings of the 4th International Conference on Bridge Maintenance, Safety and Management, Seoul, Republic of Korea, 13–17 July 2008; CRC Press: London, UK, 2008. [Google Scholar]
  3. Maalek, S.; Akbari, R. Distribution of Demand in Single-Column-Bent Viaducts with Irregular Configuration in Longitudinal Direction. In Bridge Maintenance, Safety, Management, Health Monitoring and Informatics, Proceedings of the 4th International Conference on Bridge Maintenance, Safety and Management, Seoul, Republic of Korea, 13–17 July 2008; CRC Press: London, UK, 2008. [Google Scholar]
  4. Eurostat. Generation of Waste by Waste Category, Hazardousness and NACE Rev. 2 Activity; Eurostat: Luxembourg, 2023. [Google Scholar]
  5. Agamuthu, P. Challenges in Sustainable Management of Construction and Demolition Waste. Waste Manag. Res. 2008, 26, 491–492. [Google Scholar] [CrossRef] [PubMed] [Green Version]
  6. Marzouk, M.; Azab, S. Environmental and Economic Impact Assessment of Construction and Demolition Waste Disposal Using System Dynamics. Resour. Conserv. Recycl. 2014, 82, 41–49. [Google Scholar] [CrossRef]
  7. Hammond, G.; Jones, C. Embodied Carbon: The Inventory of Carbon and Energy (ICE); BSRIA: Bracknell, UK, 2011. [Google Scholar]
  8. Jones, C.; Hammond, G. Inventory of Carbon and Energy (ICE Database); University of Bath: Bath, UK, 2019. [Google Scholar]
  9. Jung, Y.; Joo, M. Building Information Modelling (BIM) Framework for Practical Implementation. Autom. Constr. 2011, 20, 126–133. [Google Scholar] [CrossRef]
  10. Eastman, C.; Teicholz, P.; Sacks, R.; Liston, K. BIM Handbook—A Guide to Building Information Modelling for Owners, Designers, Engineers, Contractors, and Facility Managers; Jonh Wiley & Sons, Inc.: Hoboken, NJ, USA, 2018. [Google Scholar]
  11. AGC. The Contractors’ Guide to BIM; Associated General Contractors of America: Arlington, VA, USA, 2013. [Google Scholar]
  12. Autodesk. Revit IFC Manual: Detailed Instructions for Handling IFC Files; Autodesk: San Francisco, CA, USA, 2018. [Google Scholar]
  13. Cheng, J.C.P.; Ma, L.Y.H. A BIM-Based System for Demolition and Renovation Waste Estimation and Planning. Waste Manag. 2013, 33, 1539–1551. [Google Scholar] [CrossRef]
  14. Maalek, R. Field Information Modeling (FIM)TM: Best Practices Using Point Clouds. Remote Sens. 2021, 13, 967. [Google Scholar] [CrossRef]
  15. Maalek, R.; Lichti, D.D.; Walker, R.; Bhavnani, A.; Ruwanpura, J.Y. Extraction of Pipes and Flanges from Point Clouds for Automated Verification of Pre-Fabricated Modules in Oil and Gas Refinery Projects. Autom. Constr. 2019, 103, 150–167. [Google Scholar] [CrossRef]
  16. Maalek, R.; Lichti, D.D.; Maalek, S. Towards Automatic Digital Documentation and Progress Reporting of Mechanical Construction Pipes Using Smartphones. Autom. Constr. 2021, 127, 103735. [Google Scholar] [CrossRef]
  17. Maalek, R.; Lichti, D.D. Robust Detection of Non-Overlapping Ellipses from Points with Applications to Circular Target Extraction in Images and Cylinder Detection in Point Clouds. ISPRS J. Photogramm. Remote Sens. 2021, 176, 83–108. [Google Scholar] [CrossRef]
  18. Maalek, R.; Lichti, D.D.; Ruwanpura, J.Y. Automatic Recognition of Common Structural Elements from Point Clouds for Automated Progress Monitoring and Dimensional Quality Control in Reinforced Concrete Construction. Remote Sens. 2019, 11, 1102. [Google Scholar] [CrossRef] [Green Version]
  19. Hong, S.; Yoon, S.; Kim, J.; Lee, C.; Kim, S.; Lee, Y. Evaluation of Condition of Concrete Structures Using Ultrasonic Pulse Velocity Method. Appl. Sci. 2020, 10, 706. [Google Scholar] [CrossRef] [Green Version]
  20. Słoński, M.; Schabowicz, K.; Krawczyk, E. Detection of Flaws in Concrete Using Ultrasonic Tomography and Convolutional Neural Networks. Materials 2020, 13, 1557. [Google Scholar] [CrossRef] [PubMed] [Green Version]
  21. Korl, S.; Wuersch, C.; Zanona, J. Innovative Sensor Technologies for Nondestructive Imaging of Concrete Structures: Novel Tools Utilising Radar and Induction Technologies. In Nondestructive Testing of Materials and Structures; RILEM Bookseries; Springer: Dordrecht, The Netherlands, 2012; Volume 6, pp. 131–136. [Google Scholar] [CrossRef]
  22. Amer, F.; Golparvar-Fard, M. Modeling Dynamic Construction Work Template from Existing Scheduling Records via Sequential Machine Learning. Adv. Eng. Inform. 2021, 47, 101198. [Google Scholar] [CrossRef]
  23. Khurana, D.; Koli, A.; Khatter, K.; Singh, S. Natural Language Processing: State of the Art, Current Trends and Challenges. Multimed. Tools Appl. 2023, 82, 3713–3744. [Google Scholar] [CrossRef]
  24. Hofstadler, C. Bauablaufplanung Und Logistik Im Baubetrieb; Springer: Berlin/Heidelberg, Germany, 2007. [Google Scholar]
  25. ASTM E1557-09(2020)E1; Standard Classification for Building Elements and Related Sitework-UNIFORMAT II. ASTM International: West Conshohocken, PA, USA, 2020.
  26. STP158620140037; The Philosophy and Logic within UNIFORMAT II Classifications. ASTM Special Technical Publication: West Conshohocken, PA, USA, 2014. [CrossRef]
  27. STP47519S; Evaluating Sustainability Using Standard Approaches: The BEES Tool. ASTM Special Technical Publication: West Conshohocken, PA, USA, 2009. [CrossRef]
  28. Ramu, P.; Thananjayan, P.; Acar, E.; Bayrak, G.; Park, J.W.; Lee, I. A Survey of Machine Learning Techniques in Structural and Multidisciplinary Optimization; Springer: Berlin/Heidelberg, Germany, 2022; Volume 65, ISBN 0123456789. [Google Scholar]
  29. Watson, M.; Leary, M.; Brandt, M. Generative Design of Truss Systems by the Integration of Topology and Shape Optimisation. Int. J. Adv. Manuf. Technol. 2022, 118, 1165–1182. [Google Scholar] [CrossRef]
  30. Du, W.F.; Wang, Y.Q.; Wang, H.; Zhao, Y.N. Intelligent Generation Method for Innovative Structures of the Main Truss in a Steel Bridge. Soft Comput. 2023, 27, 5587–5601. [Google Scholar] [CrossRef]
  31. Peng, J.; Feng, Y.; Zhang, Q.; Liu, X. Multi-Objective Integrated Optimization Study of Prefabricated Building Projects Introducing Sustainable Levels. Sci. Rep. 2023, 13, 2821. [Google Scholar] [CrossRef] [PubMed]
  32. Mccormack, J.; Dorin, A.; Innocent, T. Generative Design: A Paradigm for Design Research. In Proceedings of the Futureground—DRS International Conference, Melbourne, Australia, 17–21 November 2004. [Google Scholar]
  33. Oxman, R. Thinking Difference: Theories and Models of Parametric Design Thinking. Des. Stud. 2017, 52, 4–39. [Google Scholar] [CrossRef]
  34. Ravshanovich, K.S. REVIT+DYNAMO. Pindus J. Cult. Lit. ELT 2022, 2, 57–63. Available online: https://literature.academicjournal.io/index.php/literature/article/view/215 (accessed on 9 July 2023).
  35. Huang, M.Q.; Chen, X.L.; Ninić, J.; Bai, Y.; Zhang, Q.B. A Framework for Integrating Embodied Carbon Assessment and Construction Feasibility in Prefabricated Stations. Tunn. Undergr. Sp. Technol. 2023, 132, 104920. [Google Scholar] [CrossRef]
  36. Cuellar Lobo, J.D.; Lei, Z.; Liu, H.; Li, H.X.; Han, S. Building Information Modelling- (BIM-) Based Generative Design for Drywall Installation Planning in Prefabricated Construction. Adv. Civ. Eng. 2021, 2021, 6638236. [Google Scholar] [CrossRef]
  37. Henríquez, D.; Herrera, R.F.; Vielma, J.C. Method for Designing Prequalified Connections Using Generative Design. Buildings 2022, 12, 1579. [Google Scholar] [CrossRef]
  38. Asl, M.R.; Bergin, M.; Menter, A.; Yan, W. BIM-Based Parametric Building Energy Performance Multi-Objective Optimization. In Proceedings of the International Conference on Education and Research in Computer Aided Architectural Design in Europe, Newcastle, UK, 10–12 September 2014; Volume 2. [Google Scholar]
  39. Fu, B.; Gao, Y.; Wang, W. Dual Generative Adversarial Networks for Automated Component Layout Design of Steel Frame-Brace Structures. Autom. Constr. 2023, 146, 104661. [Google Scholar] [CrossRef]
  40. Elsayed, A.M.; Elanwar, H.H.; Marzouk, M.; Safar, S.S. Sustainable Layout Design of Steel Buildings through Embodied Energy and Costs Optimization. Clean. Eng. Technol. 2021, 5, 100308. [Google Scholar] [CrossRef]
  41. Mukkavaara, J.; Sandberg, M. Architectural Design Exploration Using Generative Design: Framework Development and Case Study of a Residential Block. Buildings 2020, 10, 201. [Google Scholar] [CrossRef]
  42. Buitelaar, E.; Moroni, S.; De Franco, A. Building Obsolescence in the Evolving City. Reframing Property Vacancy and Abandonment in the Light of Urban Dynamics and Complexity. Cities 2021, 108, 102964. [Google Scholar] [CrossRef]
  43. Rong, Y.; Zhao, Z.L.; Feng, X.Q.; Xie, Y.M. Structural Topology Optimization with an Adaptive Design Domain. Comput. Methods Appl. Mech. Eng. 2022, 389, 114382. [Google Scholar] [CrossRef]
  44. Ching, E.; Carstensen, J.V. Truss Topology Optimization of Timber–Steel Structures for Reduced Embodied Carbon Design. Eng. Struct. 2022, 252, 113540. [Google Scholar] [CrossRef]
  45. Hamidavi, T.; Abrishami, S.; Hosseini, M.R. Towards Intelligent Structural Design of Buildings: A BIM-Based Solution. J. Build. Eng. 2020, 32, 101685. [Google Scholar] [CrossRef]
  46. Deb, K.; Pratap, A.; Agarwal, S.; Meyarivan, T. A Fast and Elitist Multiobjective Genetic Algorithm: NSGA-II. IEEE Trans. Evol. Comput. 2002, 6, 182–197. [Google Scholar] [CrossRef] [Green Version]
  47. Maalek, R.; Lichti, D.D. Automated Calibration of Smartphone Cameras for 3D Reconstruction of Mechanical Pipes. Photogramm. Rec. 2021, 36, 124–146. [Google Scholar] [CrossRef]
  48. Schönberger, J.L. Robust Methods for Accurate and Efficient 3D Modeling from Unstructured Imagery. Ph.D. Thesis, ETH Zurich, Zürich, Switzerland, 2018. [Google Scholar]
  49. Schonberger, J.L.; Frahm, J.M. Structure-from-Motion Revisited. In Proceedings of the IEEE Computer Society Conference on Computer Vision and Pattern Recognition, Las Vegas, NV, USA, 27–30 June 2016. [Google Scholar]
  50. Hermann, M.; Pollok, T.; Brommer, D.; Zahn, D. IVS3D: An Open Source Framework for Intelligent Video Sampling and Preprocessing to Facilitate 3D Reconstruction. In Advances in Visual Computing, Proceedings of the 16th International Symposium, ISVC 2021, Virtual Event, 4–6 October 2021; Lecture Notes in Computer Science (including Subseries Lecture Notes in Artificial Intelligence and Lecture Notes in Bioinformatics); Springer: Cham, Switzerland, 2021; Volume 13017. [Google Scholar]
  51. Girardeau-Montaut, D. CloudCompare—User Manual. 2015. Available online: http://www.cloudcompare.org (accessed on 9 July 2023).
  52. Maalek, R.; Lichti, D.D.; Ruwanpura, J.Y. Robust Segmentation of Planar and Linear Features of Terrestrial Laser Scanner Point Clouds Acquired from Construction Sites. Sensors 2018, 18, 819. [Google Scholar] [CrossRef] [PubMed]
  53. Bosché, F. Automated Recognition of 3D CAD Model Objects in Laser Scans and Calculation of As-Built Dimensions for Dimensional Compliance Control in Construction. Adv. Eng. Inform. 2010, 24, 107–118. [Google Scholar] [CrossRef]
  54. Rausch, C.; Haas, C. Automated Shape and Pose Updating of Building Information Model Elements from 3D Point Clouds. Autom. Constr. 2021, 124, 103561. [Google Scholar] [CrossRef]
  55. Vermeulen, D. Structural Dynam(o)Ite: Optimized Design and Fabrication Workflows with Dynamo; Autodesk: San Francisco, CA, USA, 2018. [Google Scholar]
  56. Heyn, S.; Mettke, A. Ökologische Prozessbetrachtungen—RC-Beton (Stofffluss, Energieaufwand, Emissionen); Brandenburg University of Technology: Cottbus, Germany, 2010. [Google Scholar]
  57. DeStatis—Price Indices and Restoration Costs. Available online: https://www-genesis.destatis.de/genesis/online?operation=statistic&levelindex=0&levelid=1688985184866&code=61262#abreadcrumb (accessed on 9 July 2023).
  58. European Commission. COM/2020/662 Final A Renovation Wave for Europe—Greening Our Buildings, Creating Jobs, Improving Lives; European Commission: Brussels, Belgium, 2020. [Google Scholar]
Figure 1. Schematic representation of the framework to compare renovation (scenario A) and demolition with redevelopment (scenario B) for an aging building.
Smartcities 06 00089 g001
Figure 2. Process of Structure-from-Motion with iV3D and COLMAP.
Smartcities 06 00089 g002
Figure 3. Pre-processing: (a) point cloud in Recap Pro before importing to Revit; (b) 3D site plan model.
Smartcities 06 00089 g003
Figure 4. Developed Dynamo script and workflow adopted from [55]-the particulars of the functions can be requested from the authors.
Smartcities 06 00089 g004
Figure 5. (a) Process of producing recycling materials from concrete rubble; (b) mass proportions’ productivity (input vs. output) of the recycling process.
Smartcities 06 00089 g005
Figure 6. Material and energy flow of the proposed recycling process.
Smartcities 06 00089 g006
Figure 7. Collected point clouds: (a) planned walking path for video recording; (b) dense 3D reconstruction using COLMAP; (c) LiDAR point cloud generated using SiteScape; and (d) final registered point cloud.
Smartcities 06 00089 g007
Figure 8. Logistical planning for the existing building, new development, landfill, and the recycling facilities.
Smartcities 06 00089 g008
Table 1. Rate of assumed steel reinforcement based on standard structural components [24].
Structure ComponentRate of Steel Reinforcement
(kg/m3)
Foundation30–60
Walls20–60
Slabs50–80
Beams80–100
Columns100–130
Table 2. Energy consumption in dry and wet recycling processes.
Dry ProcessEnergyWet ProcessEnergy
MJ/t MJ/t
Crushing6.1
Screening1.8Screening2.4
Separation0.5Separation8.7
Transportation (conveyor belt)10.9Transportation (conveyor belt)9.2
Table 3. Evaluation criteria for demolition vs. deconstruction.
FactorsPoints
EconomyCost20
Time20
EnvironmentEnergy consumption20
Carbon Emission20
SocietyOperation time of machines10
Table 4. Characteristics of the case study.
TypeDormitory Dwelling
Year of construction1961
Number of floors3
Number of rooms45
Elevation per floor2.38 m
StructureMasonry walls, reinforced slabs
Net heated volume1825 m3
Gross room volume2612 m3
Usable floor area859.94 m2 external walls
Basic wallsbrick 365
SlabReinforced concrete
WindowsDouble glassing, wood frame
RoofFlat insulated
Table 5. BIM-based sustainability assessment of case study.
MaterialWeight
(kg)
ICE MaterialEmbodied Energy
(MJ)
Embodied Carbon
(kg CO2)
Brick463,128General bricks1,389,384101,888
Bitumen6657General bitumen312,8793195
Tiles21,111General ceramic190,00312,455
Carpet1423General carpet105,8715535
Screed124,646Mortar (1:3 cement: sand mix)174,50426,549
Concrete408,084Concrete, general387,67953,050
Glass16,870Glass, glazing, double253,05014,339
Insulation1362General insulation61,3302534
Paint1232General paint83,7764385
Plastic8563General plastic689,32121,664
Gravel and sand74,677Aggregates and sand,7467373
Steel10,610Steel, rebar100,7964562
Stainless Steel154Steel, stainless8731947
Stone2951General2951165
Travertine3840limestone115265
Wood6345Timber—average of all data53,9322918
Total (tons)1151 3,822,832254,632
Table 6. Criteria for evaluating deconstruction and demolition.
CriteriaPoints
(Max)
DeconstructionDemolition
QuantityScoreQuantityScore
EconomyCost20342,94820396,13917
Time20110158720
EnvironmentEnergy consumption20−2,104,20520412,9590
Carbon emission20−13,1642055,9360
SocietyOperation time of machines104910706
Total908543
Table 7. Results of the final evaluation between the options to renovate or deconstruct with new development.
Criteria for EvaluationRenovationDeconstruction with Optimized Building
Cost (€)4,686,8565,177,096
Energy consumption (MJ)17,515,95716,152,000
Carbon emission (Kg CO2)2,584,5462,859,000
Disclaimer/Publisher’s Note: The statements, opinions and data contained in all publications are solely those of the individual author(s) and contributor(s) and not of MDPI and/or the editor(s). MDPI and/or the editor(s) disclaim responsibility for any injury to people or property resulting from any ideas, methods, instructions or products referred to in the content.

