1. Introduction
A floor plan is one of the basic elements of architectural design. It is a scaled technical drawing that shows the layout of the rooms of a building, as seen from above. Floor plans illustrate walls, windows, doors, stairs, appliances, furniture and outdoor spaces and may contain dimensions, notes and legends. Real estate agents also use them to help their clients visualize the interior of a house.
Professional designers and architects use special software to create floor plans in a vectorized format, but these plans are usually transformed into raster images for visualization. Therefore, all the structural, geometric and semantic information is lost, restricting further analysis, synthesis and processing.
Retrieving lost information from floor-plan pixel images is a very challenging problem. Classic techniques are based on image processing methods that use heuristics. Techniques using hand-crafted features for information extraction from floor-plan images are inferior to deep learning techniques, which provide more general solutions and can handle various cases.
In an emergency, people must follow an optimal path for fast evacuation of a building. Usually, exit signs and light indicators show the direction tenants should follow to reach the exits safely. However, these indicators are static, and as a result, the dynamic characteristics of each emergency case are not taken into account. Our goal is to create an automated system that identifies the basic elements in a floor-plan image and creates a graph that a dynamic evacuation system of buildings can use. This system directs the tenants towards the exits by considering various types of information, like which rooms and doors are safe to use.
We developed an application that uses a deep neural network to identify the floor-plan elements and automatically generates a graph showing how rooms and doors are connected. Therefore, the user does not have to create the graph from scratch. Furthermore, in case of errors, the user can edit the graph using the desktop application developed. Lastly, after setting which nodes of the graph are the exits, the shortest path from each room to the nearest exit can be calculated. We designed this functionality as a proof of concept for evacuation. In the future, it could be used as the primary component of a dynamic evacuation system of buildings.
Our proposal aims to bridge the gap among floor-plan detection approaches, graph traversal algorithms and real-life applications. Floor plans can be loaded on the application, and users, with minimal training, can utilize the desktop application to create a graph. Since our proposal is designed as a horizontal solution, the need for customized solutions is minimized. Furthermore, several panoptic floor-plan detection methods were evaluated and compared, providing a baseline for future research. Finally, in our work, a complete system responsible not only for floor-plan detection but also for graph generation and route planning using graph traversal algorithms is proposed. While integrating our proposed system with a real-world evacuation system is our future goal, this study is focused on route planning for emergency evacuation. Hardware and physical devices do not fall within the established scope of the study.
The paper is organized as follows:
Section 2 provides a presentation of related work in the field of floor-plan detection.
Section 3 presents our approach to the problem. Experiments are thoroughly presented in
Section 4, followed by the results in
Section 5. Finally, the paper concludes with a summary and the presentation of future work in
Section 6, followed by the references.
2. Related Work
Panoptic segmentation [
1] is an important task in computer vision that aims to unify two distinct tasks: semantic and instance segmentation tasks. The objects in the image are firstly separated into individual parts, independent of each other. Then, each of these parts is labeled, and the object is classified. Cheng et al. [
2] proposed Panoptic-DeepLab, establishing a baseline for similar methods. The proposed solution uses DeepLab [
3] for semantic segmentation and a class agnostic approach for the instance-segmentation branch.
Early systems use traditional approaches to recognize elements in a floor plan using low-level image processing and heuristics. Macé et al. [
4] proposed a system that uses line detection by applying the Hough transform and image vectorization to detect the walls. Next, the doors are identified using arc extraction. Finally, a room segmentation strategy uses walls and doors in order to decompose the image recursively until nearly convex regions are obtained. The output is mainly rectangular rooms. Heras et al. [
5] used a statistical method named Bag of Visual Words (BoVW) to detect basic building blocks, i.e., walls, doors and windows. The rooms are detected as the cycles in the entity plane graph of these elements.
An approach based on pixel analysis and image processing techniques was proposed by Pan et al. [
6]. The detection of bearing walls is performed by traversing the pixels of the image and evaluating them using a pre-defined rule set. Similarly, using a different set of rules, the contours of non-bearing and bearing walls, as well as the rest of the walls, are detected. Finally, the walls are disassembled into rectangles, and the center line is marked in these rectangles. While the results were promising, the authors identified several drawbacks in their approach. High-resolution images are needed for the system to work; no room labeling is performed; and only the walls are detected.
Machine learning approaches and, more specifically, deep learning techniques have dominated the automated floor-plan detection field over the last decade [
7]. Dodge et al. [
8] introduced a new dataset, R-FP, of 500 images and used fully convolutional networks (FCNs) for wall segmentation. Rooms are delimited by walls, doors and windows. The size of the rooms is predicted using optical character recognition (OCR) and object detection with Faster R-CNN. Liu et al. [
9] used a convolutional neural network (CNN) to transform a rasterized image into a set of junctions (e.g., wall corners or door end-points), aggregate these junctions into a set of simple primitives (e.g., wall lines or door lines) and produce a vectorized floor plan. Kalervo et al. [
10] presented a new image dataset, CubiCasa5K, of 5000 floor plans annotated into over 80 floor-plan object categories. Floor-plan elements are detected using a multi-task CNN. Zeng et al. [
11] designed a multi-task neural network with two tasks: the prediction of room-boundary elements and rooms with types. A room-boundary-guided attention mechanism considers room-boundary features to enhance the room-type predictions. Lu et al. [
12] introduced a new dataset called RuralHomeData, which contains 800 rural residence floor plans. They used a joint neural network to detect geometric elements and text information in floor-plan images. Room regions are obtained as closed loops of walls and openings. Then, a post-processing operation based on mixed-integer quadratic programming (MIQP) divides these regions into multiple rooms. Lv et al. [
13] introduced a new dataset of 7000 images. They proposed an automatic framework that recognizes the structure, type and size of the rooms. They used deep neural networks for segmentation and detection to extract room structural information. The main network is DeepLabv3+ [
14].
Generative adversarial networks [
15] and generative-based models are also used in the domain of floor-plan detection. Huang and Zheng [
16] proposed an application of Pix2PixHD [
17] that is able to detect eight different rooms and color them, producing a new image. The authors used generative adversarial networks to classify each pixel of the image without losing the underlying structure of the image. Pix2Pix [
18] was also employed by Kim et al. [
19] for the transformation of plans into a unified format. The authors proposed a multi-task deep network that not only extracts wall junction features but transfers the style at the same time. Pix2Pix is also used in EdgeGAN [
20], an edge-extraction GAN, to detect walls. EdgeGAN uses two modules to check the consistency and connectivity of the feature map. The former module uses four distinct criteria that correspond to the conditions of a fully connected graph, while the latter is responsible for classifying the category of all sub-spaces using a single graph network.
3. Our Approach
Floor-plan elements are detected using Panoptic-Deeplab [
2], a deep neural network that performs panoptic segmentation. Panoptic segmentation [
1], as already mentioned, unifies semantic and instance segmentation tasks. Semantic segmentation recognizes stuff, which is amorphous and uncountable, such as grass, the sky or the road. On the other hand, instance segmentation recognizes things, which are countable objects, such as people, animals and vehicles.
The metric used in semantic segmentation is intersection over union (
).
is defined as the area of the intersection of the target and prediction masks over the area of their union:
The metric used in instance segmentation is
as proposed for the evaluation of the COCO dataset [
21]:
The metric used in panoptic segmentation is panoptic quality (
).
can be seen as the multiplication of a segmentation-quality (
) term and a recognition-quality (
) term:
is the familiar score, and is the average of matched segments.
Panoptic segmentation is used to predict four classes: background, wall, door and room. The classes background and wall are of the stuff type, and the classes door and room are of the thing type. The class wall also contains windows and railings, as they are considered obstacles in an evacuation scenario. Doors and rooms are considered things, because it is necessary to recognize them as separate entities for them to become graph nodes. Panoptic segmentation also predicts their center, which becomes the node’s position.
Panoptic-Deeplab was trained on CubiCasa5K, which is already split into train, validation and test sets of sizes 4200, 400 and 400, respectively. The neural network was trained using different backbone networks and parameters. The models were evaluated on the validation set, and the model that achieved the highest PQ value was exported to be used in the application. A final evaluation of the best model of each backbone was made on the test set.
The user can open a floor-plan image with the application and perform floor-plan-element recognition using the best model. As a result, each pixel is predicted to belong to one of the classes, i.e., background, wall, door or room. Additionally, the instances of the classes door and room are predicted. Next, the user can create the graph that is drawn on the image. A node is created for each instance at the predicted center. Two nodes are connected with an edge if adjacent pixels exist between the corresponding instances. The user can then edit the graph by creating new nodes or edges, deleting existing nodes or edges and moving nodes. Next, one or more nodes can be marked as exits, and the shortest path is calculated from each exit to each node using Dijkstra’s algorithm [
22]. The one with the smallest distance is the shortest path from the node to the nearest exit, which is drawn on the image. The weight of each edge is the Euclidean distance between the two nodes. Lastly, the user can save the graph as an XML file.
3.1. Graph Editing Tool
The desktop application was developed in Python using PyQt6 (
Figure 1).
3.1.1. User Interface
The standard File and View menus are at the top. The File menu contains New, Open, Save graph and Exit. New clears the current data; Open opens a new file image; Save graph saves the graph to an XML file; and Exit closes the window. The View menu contains Zoom to fit, Show 100%, Zoom in and Zoom out. Zoom to fit resizes the image to fit the viewing area, and Show 100% shows the image in its original size. Zooming in and zooming out are also available by scrolling. The image can be moved by pressing Shift + Left Click on the image.
The hierarchical list on the left shows the identified floor-plan elements, such as walls, rooms and doors. It also contains a list of the graph nodes and whether they have been marked as exits. By right-clicking on the node items on the list, a context menu appears with the actions New node, Delete node, Mark as exit and Clear mark.
The tool buttons at the top (
Figure 2) offer an alternative way of executing the actions mentioned above and offer a few more actions, like New edge and Delete. New edge creates a new edge between selected nodes, and Delete deletes selected nodes or edges.
The buttons at the bottom are Detect elements, Create graph and Calculate paths. Detect elements identifies the floor-plan elements using the exported network; Create graph creates the graph; and Calculate paths calculates the shortest path from each node to the nearest exit node.
3.1.2. Usage
First, the user opens a floor-plan image. Afterwards, its elements can be identified by pressing Detect elements. The previously exported model performs panoptic segmentation, and the walls, rooms and doors appear on the list. The background class is omitted. Every element acquires a unique color and is transparently drawn on the image when the corresponding list item is selected.
Next, the graph can be automatically generated by pressing Create graph. A node is created for every room and door instance. An edge is created between adjacent instances. Finally, the nodes appear on the list, and the graph is drawn on the image.
If any errors occur, the graph can be edited. New nodes or edges can be created by pressing New node or New edge. Existing nodes or edges can be deleted by pressing Delete or the Del key. Finally, nodes can be moved with Shift + Left Click. The picking functionality facilitates these actions; nodes or edges can be selected directly from the image with Left Click, and the corresponding list items are highlighted. Multiple-node or -edge selection is possible by pressing Ctrl.
Then, the exits can be set by selecting one or more nodes and pressing Mark as exit. By pressing Calculate paths, the shortest path from each node to the nearest exit is calculated and drawn on the image in cyan color. If any modifications are made, the paths must be recalculated.
Finally, the graph and the calculated paths can be saved to an XML file by pressing Save graph.
4. Experiments
Experiments were performed on a PC equipped with Intel i9 CPU, 64 GB RAM and Nvidia Titan XP GPU running Ubuntu. The elements of floor-plan images were recognized using Panoptic-Deeplab, available from Deeplab2 [
23]. Deeplab2 is a Tensorflow library that provides a unified and state-of-the-art codebase for dense-pixel-labeling tasks.
4.1. Dataset Preparation
Each floor plan in CubiCasa5K has an image file in PNG format and a label file in SVG format. The SVG file contains information about the floor-plan elements, like their semantic label and their position in the image given as a polygon. The dataset was converted to a suitable format for DeepLab2. The label file was converted to a PNG file with the following RGB channels:
Then, the panoptic label can be calculated as
where
is an integer larger than the maximum number of instances per image. This was set to 256. The semantic labels of CubiCasa5K were converted to our labels as seen in
Table 1. Finally, an index per class was set as the
.
Due to GPU memory constraints, we resized the images so that their maximum dimension did not exceed 1024 pixels while maintaining their aspect ratio. We used bilinear interpolation for the images and the nearest neighbor method for the labels. Finally, we converted the dataset into TFRecord files by dividing it into 100, 10 and 10 shards for the training, validation and test sets, respectively. TFRecord files take up less space and allow parallel reading to be performed by the GPU.
4.2. Training
We tried four backbones pre-trained on ImageNet [
24]: ResNet-50 [
25], ResNet-50-Beta, Wide-ResNet-41 [
26] and SWideRNet-SAC-(1, 1, 1) [
27]. All the hyperparameters are listed in
Table 2. First, the models of each backbone were trained for 10,000 steps and evaluated on the validation set. Then, for each backbone, we used the hyperparameters of the model with the highest
to train a new model for 40,000 steps. These four final models were once again evaluated on the validation set. The most important parameters that were used to train Panoptic-Deeplab are in
Table 3.
5. Results
5.1. Validation Results
The scores of the best model per backbone on the validation set can be seen in
Table 4. These models were trained for 40,000 steps. Although the results of the models were on par with each other, Wide-ResNet-41 achieved the best scores, with
.
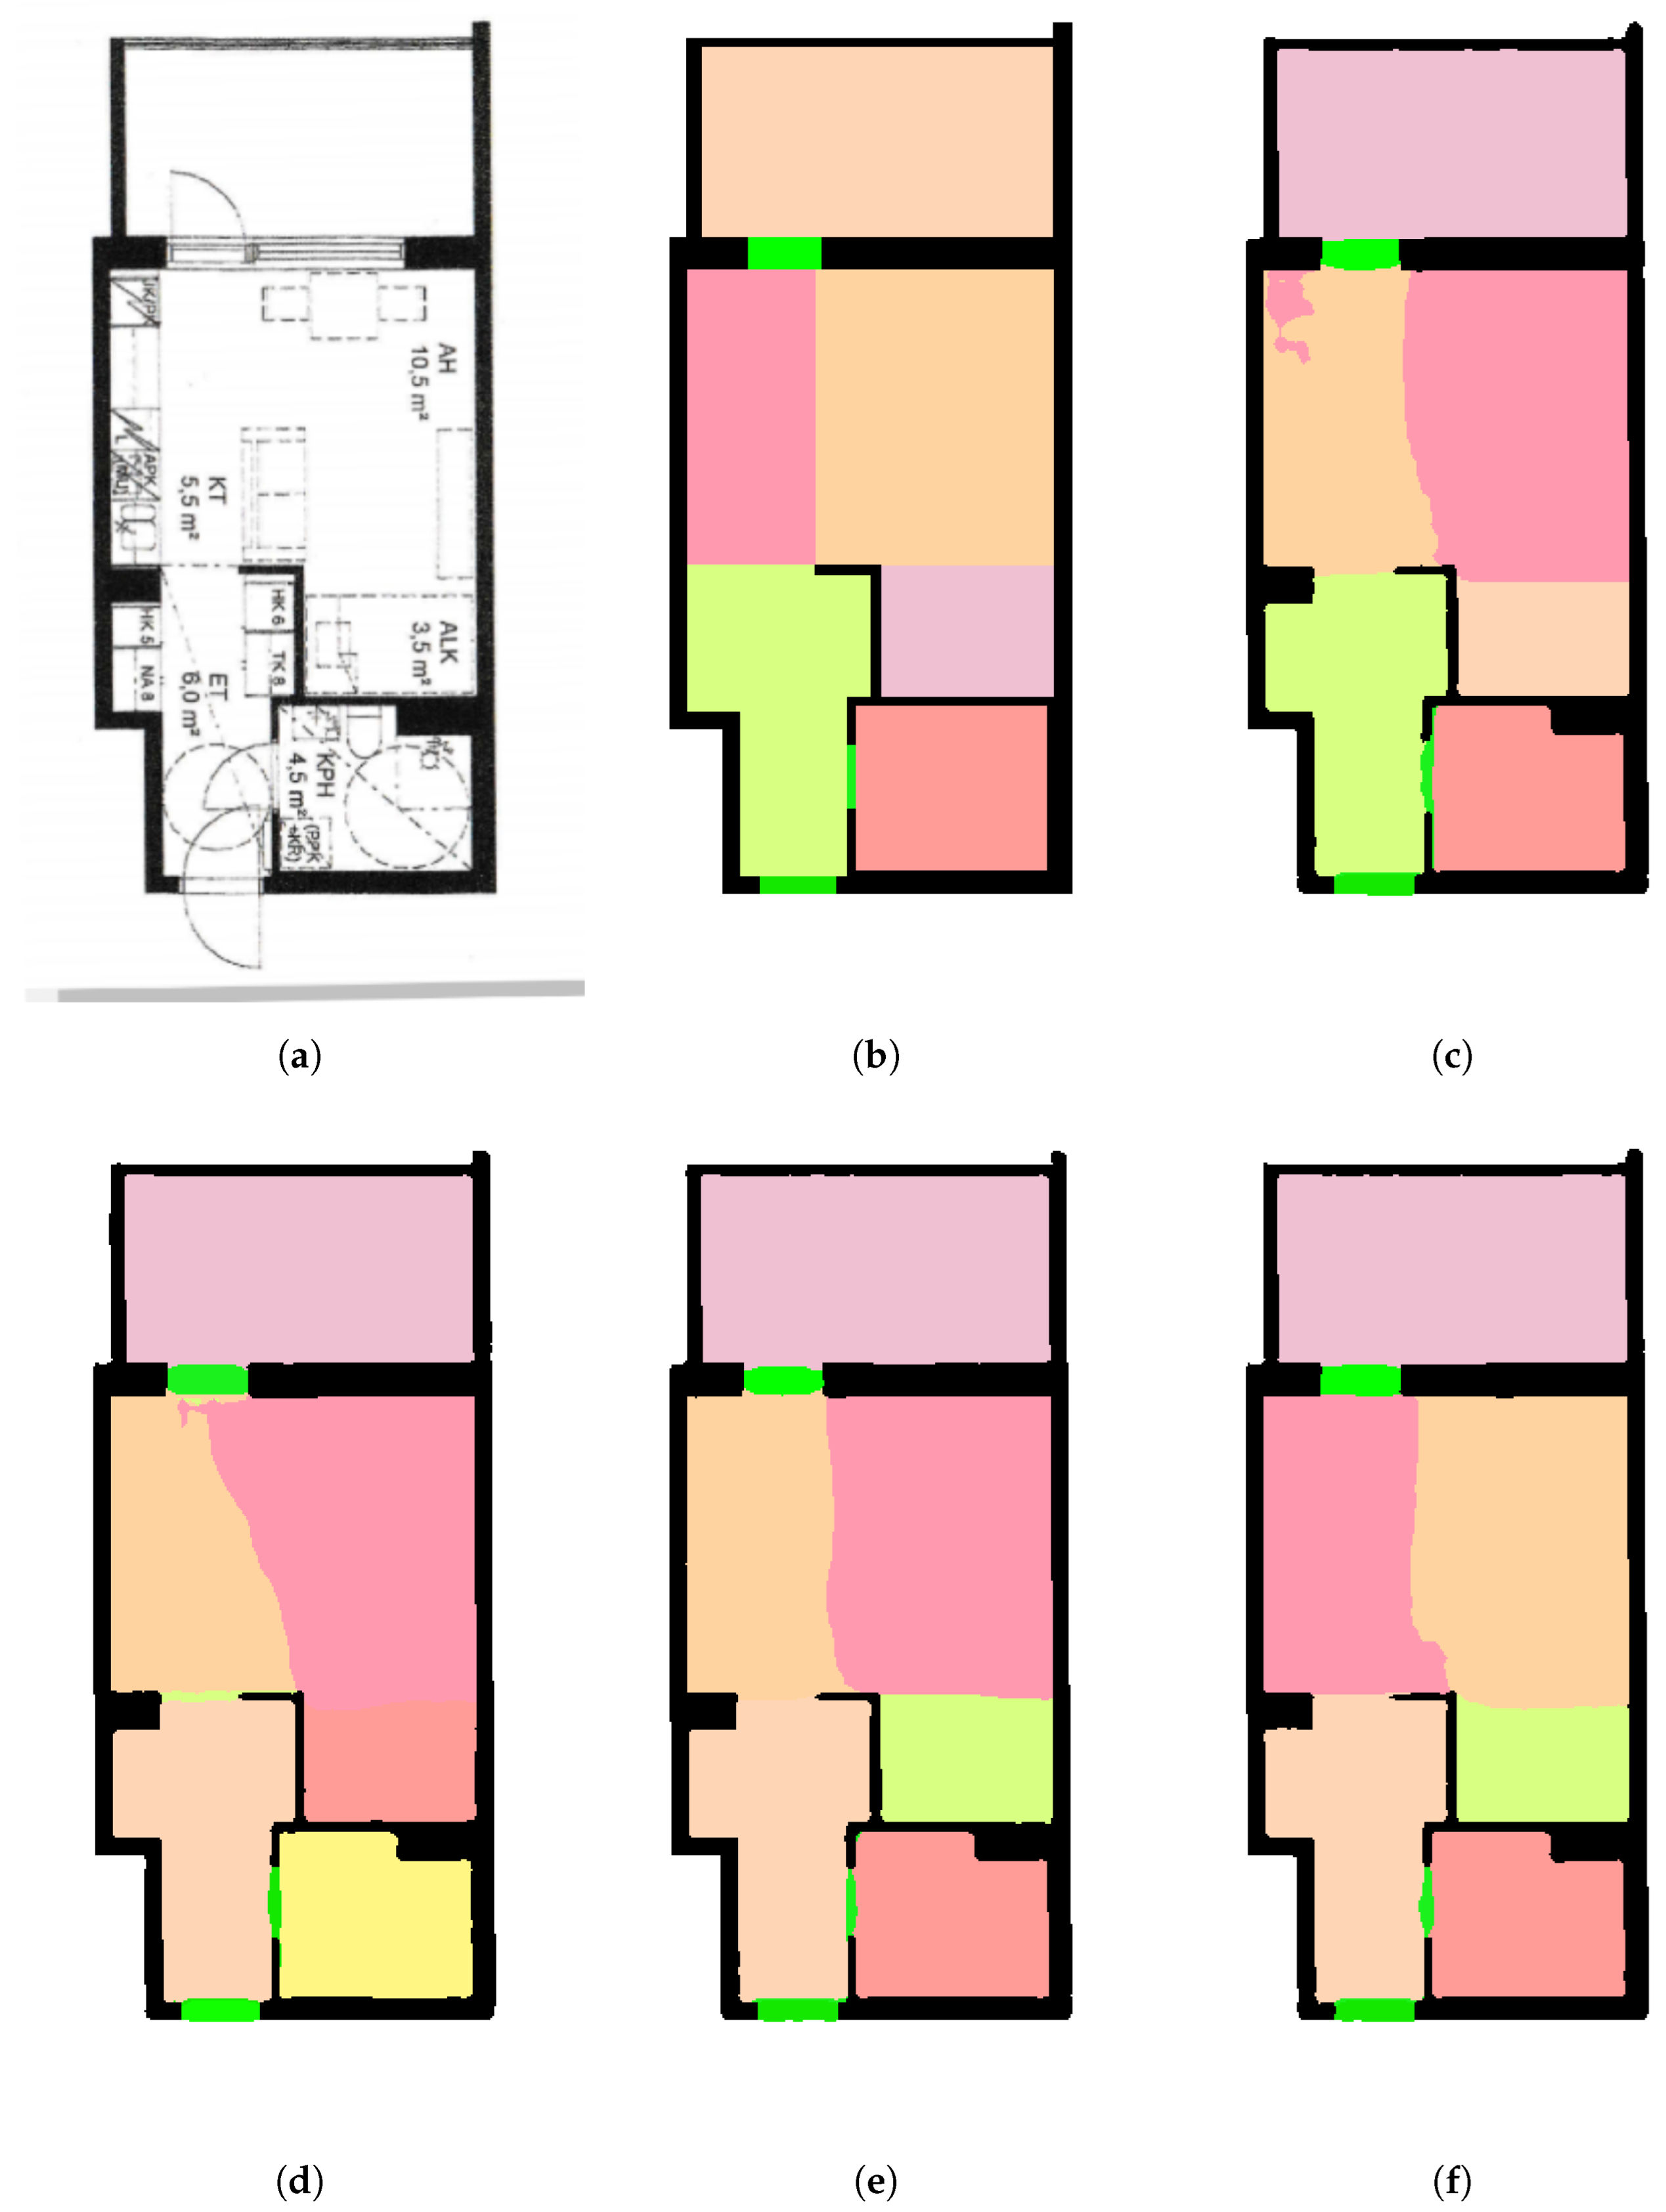
The following comparison shows the panoptic segmentation results of these models for four floor plans in the validation set.
In floor plan 1 (
Figure 3), ResNet-50 identified a small area of the kitchen as part of the living room. According to ResNet-50-Beta’s prediction, the living room erroneously extended to the kitchen, and there was a thin room between the kitchen and the hall. Wide-ResNet-41 and SWideRNet-SAC-(1, 1, 1) achieved satisfactory results. As there were no walls separating the kitchen and the living room, it was harder for the model to create a distinct boundary between the two rooms. The two models with the best performance, as seen in
Table 4, were closer to the original floor plan.
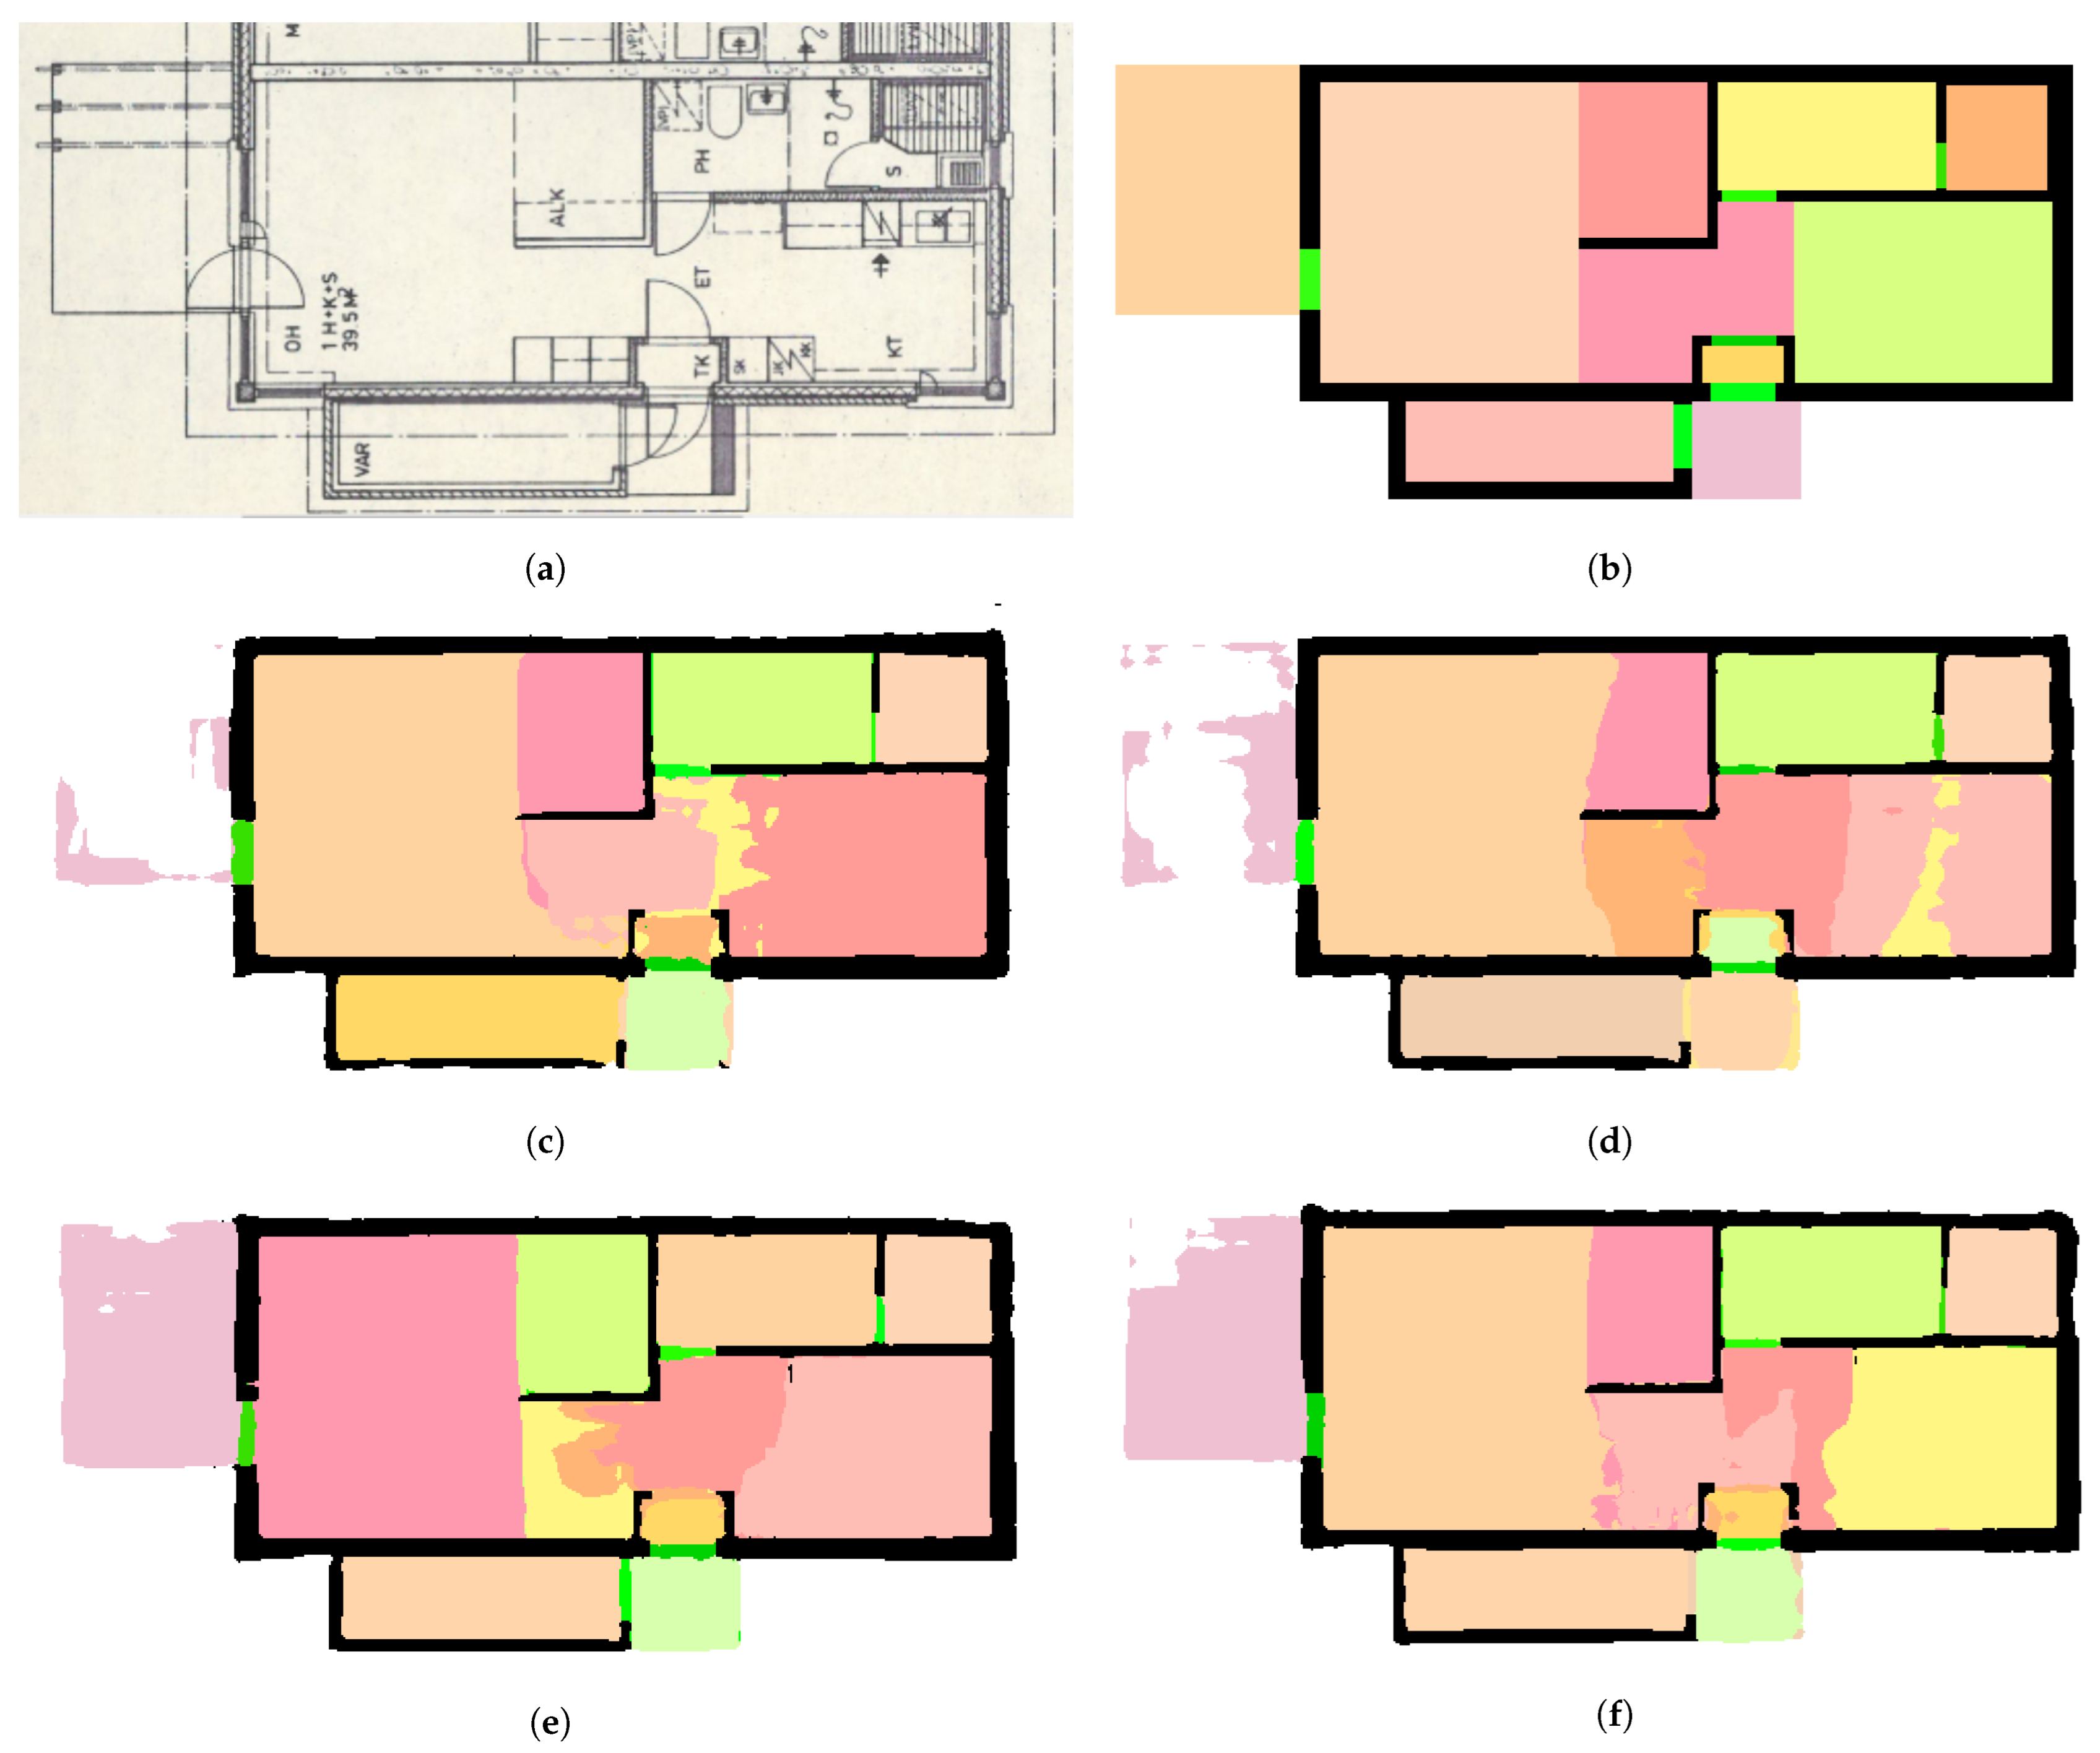
On floor plan 2 (
Figure 4), ResNet-50-Beta and Wide-ResNet-41 achieved better results. ResNet-50 and SWideRNet-SAC-(1, 1, 1) erroneously divided the living room and the corridor, respectively, into multiple rooms. This floor plan used a different background color and wall representation compared with the previous example. Observing the original image, one can see that the kitchen counter may be easily mistaken for a wall. Wide-ResNet-41 along with ResNet-50 (both versions) were the models that were less likely to identify the kitchen counter as a wall.
In floor plan 3 (
Figure 5), all models identified the hall incorrectly. However, Wide-ResNet-41 managed to identify four out of five doors, in contrast to the other models, which identified only three. Additionally, Wide-ResNet-41 identified the living room correctly. The original image of this floor plan had a balcony, and the image boundaries expanded further than the walls. All of the models except Wide-ResNet-41 could not identify the balcony, as it was not surrounded by walls. Furthermore, the hallway was difficult to identify mainly because the area was obstructed by doors and obstacles (i.e., furniture, counters, etc.).
On floor plan 4 (
Figure 6), Wide-ResNet-41 achieved better segmentation, with the exception of misidentifying a small room in the left corner. ResNet-50-Beta identified a non-existing door, and SWideRNet-SAC-(1, 1, 1) erroneously identified multiple small room regions. This floor plan was characterized by distinct outer walls that all the models could recognize without issues.
5.2. Test Results
As a final step, we performed an evaluation of the best models on the test set, whose results can be seen in
Table 5 and
Figure 7. The model with Wide-ResNet-41 achieved the best scores, with
. The scores were not so different from the ones for the validation set, which indicates that there was no overfitting.
The following images show the panoptic segmentation results for four floor plans in the test set using the Wide-ResNet-41 model. In addition, we present the generated graph, the final graph after the necessary modifications and an arbitrary shortest path from a room to the nearest exit. As one can see, the generated graph used the center of each room to place the nodes. Additionally, a node was placed on doors and hallways to correctly place the edges, without having them pass through walls.
Although the floor plan (
Figure 8) was correctly identified, we can observe that a node remained unconnected and that an edge passed through a wall. These errors were corrected before finalizing the graph. The path to evacuate the apartment is highlighted.
Floor plan 6 (
Figure 9) is another example of graph correction. By observing the image, we can see that the exit was connected to a nearby door node instead of the main hall node. This had to be manually corrected, as in order to leave the apartment, one would have to pass through the hall. It is worth mentioning that although the node is placed in the middle of the room, the exit path just notifies the user of the order of the rooms they have to visit to exit the area. Manually updating the graph using the tool provided resulted in the final graph.
Floor plan 7 (
Figure 10) is an example of a fully correctly identified floor plan, which resulted in a graph without errors. The original floor-plan image was less noisy as it was not full of irrelevant information (i.e., measurements, kitchen counter, furniture, etc.). The generated graph depicts all the possible paths to the exit, and the shortest path is highlighted.
In some cases, like in floor plan 8 (
Figure 11), the panoptic segmentation results are not good. These are cases of floor plans that contain very thin walls or cases in which the floor-plan image is full of irrelevant information. In this example, the thin walls were not identified correctly, and as a result, the generated graph connected some rooms that were separated by walls. The generated graph may contain a lot of errors, but users can edit it using the provided tool. In extreme cases, users can create the graph from scratch, although that was never the case during our experiments.
6. Conclusions and Future Work
In this work, we present a method for the automatic recognition of various design elements in floor-plan images in order to construct a graph showing how doors and rooms are connected. In addition, we developed an application that facilitates the editing of the graph and provides the capability of calculating the shortest path from each node to the nearest exit as a proof of concept.
We applied panoptic segmentation in order to identify the floor-plan elements by using Panoptic-Deeplab, which is available from the Deeplab2 library. The neural network was trained on the CubiCasa5K dataset, and the best model achieved on the validation set and on the test set. Furthermore, we present examples of automatic graph generation from test-set images. In case of errors, editing the graph using the application proved to be effortless. To the best of our knowledge, Panoptic-Deeplab has never been used for segmenting floor-plan images, so this work can be used as a baseline for future works.
In the future, the proposed method could be enhanced in order to minimize or even eliminate the need to edit the graph. This could be achieved by trying different backbones, employing more training steps or using a post-processing method. Our goal is to integrate the generated graph into an automated system for the dynamic evacuation of buildings. When integrating our solution into an automated evacuation system, there are several hardware limitations and standards that should be considered.
Some nodes could be marked as inaccessible due to an emergency like a fire. More intelligent methods for calculating the weight of the edges need to be designed. Further expansion of our research will include a dynamically calculated evacuation path based on the input of various fire hazard sensors. Finally, it would be useful to calculate different paths for people with disabilities or the elderly.
Author Contributions
Conceptualization, A.L., G.T. and D.V.; Data curation, A.G.; Formal analysis, A.G.; Funding acquisition, D.V.; Investigation, A.G.; Methodology, A.G. and A.L.; Project administration, A.L. and D.V.; Resources, A.G.; Software, A.G.; Supervision, A.L., G.T. and D.V.; Validation, A.G.; Visualization, A.G.; Writing—original draft, A.G.; Writing—review and editing, A.L., G.T. and D.V. All authors have read and agreed to the published version of the manuscript.
Funding
This research was carried out as part of the project «Beacon: An Intelligent Dynamic Signage System for Emergency Situations» (Project code: KMP6-0094837) under the framework of the Action «Investment Plans of Innovation» of the Operational Program «Central Macedonia 2014 2020», which is co-funded by the European Regional Development Fund and Greece.
Data Availability Statement
Conflicts of Interest
The authors declare no conflict of interest. The funders had no role in the design of the study; in the collection, analyses, or interpretation of data; in the writing of the manuscript; or in the decision to publish the results.
Abbreviations
The following abbreviations are used in this manuscript:
| BoVW | Bag of Visual Words |
| CNN | Convolutional neural network |
| CPU | Central processing unit |
| FCN | Fully convolutional networks |
| GPU | Graphics processing unit |
| IoU | Intersection over union |
| MIQP | Mixed-integer quadratic programming |
| OCR | Optical character recognition |
| PC | Personal computer |
| PQ | Panoptic quality |
| RAM | Random access memory |
| RQ | Recognition quality |
| SQ | Segmentation quality |
References
- Kirillov, A.; He, K.; Girshick, R.B.; Rother, C.; Dollár, P. Panoptic Segmentation. In Proceedings of the IEEE/CVF Conference on Computer Vision and Pattern Recognition (CVPR), Long Beach, CA, USA, 15–20 June 2019; pp. 9404–9413. [Google Scholar]
- Cheng, B.; Collins, M.D.; Zhu, Y.; Liu, T.; Huang, T.S.; Adam, H.; Chen, L. Panoptic-DeepLab: A Simple, Strong, and Fast Baseline for Bottom-Up Panoptic Segmentation. In Proceedings of the IEEE/CVF Conference on Computer Vision and Pattern Recognition (CVPR), Seattle, WA, USA, 14–19 June 2020; pp. 12475–12485. [Google Scholar]
- Chen, L.C.; Papandreou, G.; Kokkinos, I.; Murphy, K.; Yuille, A.L. DeepLab: Semantic Image Segmentation with Deep Convolutional Nets, Atrous Convolution, and Fully Connected CRFs. IEEE Trans. Pattern Anal. Mach. Intell. 2018, 40, 834–848. [Google Scholar] [CrossRef] [PubMed]
- Macé, S.; Locteau, H.; Valveny, E.; Tabbone, S. A System to Detect Rooms in Architectural Floor Plan Images. In Proceedings of the 9th IAPR International Workshop on Document Analysis Systems, Boston, MA, USA, 9–11 June 2010; pp. 167–174. [Google Scholar] [CrossRef]
- Heras, L.P.; Ahmed, S.; Liwicki, M.; Valveny, E.; Sánchez, G. Statistical segmentation and structural recognition for floor plan interpretation. Int. J. Doc. Anal. Recognit. IJDAR 2013, 17, 221–237. [Google Scholar] [CrossRef]
- Pan, G.; He, J.; Fang, R. Automatic floor plan detection and recognition. In Proceedings of the 2017 2nd International Conference on Image, Vision and Computing (ICIVC), Chengdu, China, 2–4 June 2017; pp. 201–205. [Google Scholar] [CrossRef]
- Pizarro, P.N.; Hitschfeld, N.; Sipiran, I.; Saavedra, J.M. Automatic floor plan analysis and recognition. Autom. Constr. 2022, 140, 104348. [Google Scholar] [CrossRef]
- Dodge, S.; Xu, J.; Stenger, B. Parsing floor plan images. In Proceedings of the 2017 Fifteenth IAPR International Conference on Machine Vision Applications (MVA), Nagoya, Japan, 8–12 May 2017; pp. 358–361. [Google Scholar] [CrossRef]
- Liu, C.; Wu, J.; Kohli, P.; Furukawa, Y. Raster-to-Vector: Revisiting Floorplan Transformation. In Proceedings of the 2017 IEEE International Conference on Computer Vision (ICCV), Venice, Italy, 22–29 October 2017; pp. 2214–2222. [Google Scholar] [CrossRef]
- Kalervo, A.; Ylioinas, J.; Häikiö, M.; Karhu, A.; Kannala, J. CubiCasa5K: A Dataset and an Improved Multi-Task Model for Floorplan Image Analysis. In Image Analysis: Proceedings of the 21st Scandinavian Conference, SCIA 2019, Norrköping, Sweden, 11–13 June 2019, Proceedings 21; Felsberg, M., Forssén, P.E., Sintorn, I.M., Unger, J., Eds.; Lecture Notes in Computer Science; Springer: Cham, Switzerland, 2019; Volume 11482, p. 11482. [Google Scholar] [CrossRef]
- Zeng, Z.; Li, X.; Yu, Y.K.; Fu, C. Deep Floor Plan Recognition Using a Multi-Task Network with Room-Boundary-Guided Attention. In Proceedings of the IEEE/CVF International Conference on Computer Vision (ICCV), Seoul, Republic of Korea, 27 October–2 November 2019; pp. 9096–9104. [Google Scholar]
- Lu, Z.; Wang, T.; Guo, J.; Meng, W.; Xiao, J.; Zhang, W.; Zhang, X. Data-driven Floor Plan Understanding in Rural Residential Buildings via Deep Recognition. Inf. Sci. 2021, 567, 58–74. [Google Scholar] [CrossRef]
- Lv, X.; Zhao, S.; Yu, X.; Zhao, B. Residential floor plan recognition and reconstruction. In Proceedings of the 2021 IEEE/CVF Conference on Computer Vision and Pattern Recognition (CVPR), Virtual, 19–25 June 2021; pp. 16712–16721. [Google Scholar] [CrossRef]
- Chen, L.; Zhu, Y.; Papandreou, G.; Schroff, F.; Adam, H. Encoder-Decoder with Atrous Separable Convolution for Semantic Image Segmentation. In Proceedings of the European Conference on Computer Vision (ECCV), Munich, Germany, 8–14 September 2018; pp. 801–818. [Google Scholar]
- Goodfellow, I.; Pouget-Abadie, J.; Mirza, M.; Xu, B.; Warde-Farley, D.; Ozair, S.; Courville, A.; Bengio, Y. Generative Adversarial Nets. Available online: https://proceedings.neurips.cc/paper_files/paper/2014/file/5ca3e9b122f61f8f06494c97b1afccf3-Paper.pdf (accessed on 23 May 2023).
- Huang, W.; Zheng, H. Architectural Drawings Recognition and Generation through Machine Learning. In Proceedings of the 38th Annual Conference of the Association for Computer Aided Design in Architecture, Mexico City, Mexico, 18–20 October 2018. [Google Scholar] [CrossRef]
- Wang, T.C.; Liu, M.Y.; Zhu, J.Y.; Tao, A.; Kautz, J.; Catanzaro, B. High-Resolution Image Synthesis and Semantic Manipulation with Conditional GANs. In Proceedings of the 2018 IEEE/CVF Conference on Computer Vision and Pattern Recognition, Salt Lake City, UT, USA, 18–22 June 2018; pp. 8798–8807. [Google Scholar] [CrossRef]
- Isola, P.; Zhu, J.Y.; Zhou, T.; Efros, A.A. Image-to-Image Translation with Conditional Adversarial Networks. In Proceedings of the 2017 IEEE Conference on Computer Vision and Pattern Recognition (CVPR), Honolulu, HI, USA, 21–26 July 2017; pp. 5967–5976. [Google Scholar] [CrossRef]
- Kim, S.; Park, S.; Kim, H.; Yu, K. Deep floor plan analysis for complicated drawings based on style transfer. J. Comput. Civ. Eng. 2021, 35, 04020066. [Google Scholar] [CrossRef]
- Dong, S.; Wang, W.; Li, W.; Zou, K. Vectorization of Floor Plans Based on EdgeGAN. Information 2021, 12, 206. [Google Scholar] [CrossRef]
- Lin, T.; Maire, M.; Belongie, S.J.; Bourdev, L.D.; Girshick, R.B.; Hays, J.; Perona, P.; Ramanan, D.; Dollár, P.; Zitnick, C.L. Microsoft COCO: Common Objects in Context. In Computer Vision—Proceedings of the ECCV 2014: 13th European Conference, Zurich, Switzerland, 6–12 September 2014; Tuytelaars, T., Ed.; Lecture Notes in Computer Science; Springer: Cham, Switzerland, 2014; Volume 8693. [Google Scholar] [CrossRef]
- Dijkstra, E.W. A note on two problems in connexion with graphs. Numer. Math. 1959, 1, 269–271. [Google Scholar] [CrossRef]
- Weber, M.; Wang, H.; Qiao, S.; Xie, J.; Collins, M.D.; Zhu, Y.; Yuan, L.; Kim, D.; Yu, Q.; Cremers, D.; et al. DeepLab2: A TensorFlow Library for Deep Labeling. arXiv 2021, arXiv:2106.09748. [Google Scholar]
- Deng, J.; Dong, W.; Socher, R.; Li, L.J.; Li, K.; Li, F.-F. Imagenet: A large-scale hierarchical image database. In Proceedings of the 2009 IEEE Conference on Computer Vision and Pattern Recognition, Miami, FL, USA, 20–25 June 2009; pp. 248–255. [Google Scholar]
- He, K.; Zhang, X.; Ren, S.; Sun, J. Deep Residual Learning for Image Recognition. In Proceedings of the IEEE Conference on Computer Vision and Pattern Recognition (CVPR), Las Vegas, NV, USA, 27–30 June 2016; pp. 770–778. [Google Scholar]
- Zagoruyko, S.; Komodakis, N. Wide Residual Networks. arXiv 2016, arXiv:1605.07146. [Google Scholar]
- Chen, L.; Wang, H.; Qiao, S. Scaling Wide Residual Networks for Panoptic Segmentation. arXiv 2020, arXiv:2011.11675. [Google Scholar]
Figure 1.
Graph editing tool: In this example, the graph and the shortest path from Room 8 to Door 4 were calculated.
Figure 1.
Graph editing tool: In this example, the graph and the shortest path from Room 8 to Door 4 were calculated.
Figure 2.
Tool buttons from left to right: New, Open, Save graph, Zoom to fit, Show 100%, Zoom in, Zoom out, New node, New edge, Delete, Mark as exit, Clear mark.
Figure 2.
Tool buttons from left to right: New, Open, Save graph, Zoom to fit, Show 100%, Zoom in, Zoom out, New node, New edge, Delete, Mark as exit, Clear mark.
Figure 3.
Floor plan 1: (a) Original image. (b) Panoptic label. (c) ResNet-50’s prediction. (d) ResNet-50-Beta’s prediction. (e) Wide-ResNet-41’s prediction. (f) SWideRNet-SAC-(1, 1, 1)’s prediction.
Figure 3.
Floor plan 1: (a) Original image. (b) Panoptic label. (c) ResNet-50’s prediction. (d) ResNet-50-Beta’s prediction. (e) Wide-ResNet-41’s prediction. (f) SWideRNet-SAC-(1, 1, 1)’s prediction.
Figure 4.
Floor plan 2: (a) Original image. (b) Panoptic label. (c) ResNet-50 prediction. (d) ResNet-50-Beta prediction. (e) Wide-ResNet-41 prediction. (f) SWideRNet-SAC-(1, 1, 1) prediction.
Figure 4.
Floor plan 2: (a) Original image. (b) Panoptic label. (c) ResNet-50 prediction. (d) ResNet-50-Beta prediction. (e) Wide-ResNet-41 prediction. (f) SWideRNet-SAC-(1, 1, 1) prediction.
Figure 5.
Floor plan 3: (a) Original image. (b) Panoptic label. (c) ResNet-50’s prediction. (d) ResNet-50-Beta’s prediction. (e) Wide-ResNet-41’s prediction. (f) SWideRNet-SAC-(1, 1, 1)’s prediction.
Figure 5.
Floor plan 3: (a) Original image. (b) Panoptic label. (c) ResNet-50’s prediction. (d) ResNet-50-Beta’s prediction. (e) Wide-ResNet-41’s prediction. (f) SWideRNet-SAC-(1, 1, 1)’s prediction.
Figure 6.
Floor plan 4: (a) Original image. (b) Panoptic label. (c) ResNet-50’s prediction. (d) ResNet-50-Beta’s prediction. (e) Wide-ResNet-41’s prediction. (f) SWideRNet-SAC-(1, 1, 1)’s prediction.
Figure 6.
Floor plan 4: (a) Original image. (b) Panoptic label. (c) ResNet-50’s prediction. (d) ResNet-50-Beta’s prediction. (e) Wide-ResNet-41’s prediction. (f) SWideRNet-SAC-(1, 1, 1)’s prediction.
Figure 7.
Scores per model on test set.
Figure 7.
Scores per model on test set.
Figure 8.
Floor plan 5: (a) Original image. (b) Panoptic label. (c) Panoptic prediction. (d) Graph. (e) Final graph and path.
Figure 8.
Floor plan 5: (a) Original image. (b) Panoptic label. (c) Panoptic prediction. (d) Graph. (e) Final graph and path.
Figure 9.
Floorplan 6: (a) Original image. (b) Panoptic label. (c) Panoptic prediction. (d) Graph. (e) Final graph and path. Highlighted is the returned path.
Figure 9.
Floorplan 6: (a) Original image. (b) Panoptic label. (c) Panoptic prediction. (d) Graph. (e) Final graph and path. Highlighted is the returned path.
Figure 10.
Floor plan 7: (a) Original image. (b) Panoptic label. (c) Panoptic prediction. (d) Graph. (e) Final graph and path.
Figure 10.
Floor plan 7: (a) Original image. (b) Panoptic label. (c) Panoptic prediction. (d) Graph. (e) Final graph and path.
Figure 11.
Floor plan 8: (a) Original image. (b) Panoptic label. (c) Panoptic prediction. (d) Graph. (e) Final graph and path.
Figure 11.
Floor plan 8: (a) Original image. (b) Panoptic label. (c) Panoptic prediction. (d) Graph. (e) Final graph and path.
Table 1.
Conversion of CubiCasa5K semantic labels.
Table 1.
Conversion of CubiCasa5K semantic labels.
| CubiCasa5K | Our Label | Semantic_Label | Type |
|---|
| Unlabeled pixels | Background | 0 | Stuff |
| Wall, railing, window | Wall | 1 | Stuff |
| Door | Door | 2 | Thing |
| All room types | Room | 3 | Thing |
Table 2.
Hyperparameters.
Table 2.
Hyperparameters.
| Hyperparameter | Value |
|---|
| initial_checkpoint | ResNet-50 |
| ResNet-50-Beta |
| Wide-ResNet-41 |
| SWideRNet-SAC-(1, 1, 1) |
| output_stride | 32, 16 |
| atrous_rates | (3, 6, 9), (6, 12, 18) |
| base_learning_rate | [0.0002, 0.02] |
Table 3.
Training parameters.
Table 3.
Training parameters.
| Parameter | Value |
|---|
| output_channels | 4 |
| semantic_loss | softmax_cross_entropy |
| center_loss | mse |
| regression_loss | l1 |
| training_number_of_steps | 10,000, 40,000 |
| batch_size | 8 |
| crop_size | |
| min_resize_value | 0 |
| max_resize_value | 512 |
| min_scale_factor | 0.5 |
| max_scale_factor | 2.0 |
| scale_factor_step_size | 0.1 |
Table 4.
Validation results.
Table 4.
Validation results.
| Backbone | Output Stride | Atrous Rates | Base Learning Rate | IoU | AP Mask | SQ | RQ | PQ |
|---|
| Resnet-50 | 16 | 6, 12, 18 | 0.01 | 0.82 | 0.388 | 0.815 | 0.787 | 0.659 |
| Resnet-50-Beta | 16 | 6, 12, 18 | 0.002 | 0.823 | 0.392 | 0.815 | 0.791 | 0.662 |
| Wide-ResNet-41 | 16 | 6, 12, 18 | 0.002 | 0.827 | 0.42 | 0.822 | 0.802 | 0.676 |
| SWideRNet-SAC-(1, 1, 1) | 16 | 6, 12, 18 | 0.02 | 0.822 | 0.412 | 0.819 | 0.798 | 0.671 |
Table 5.
Test results.
| Backbone | Output Stride | Atrous Rates | Base Learning Rate | IoU | AP Mask | SQ | RQ | PQ |
|---|
| Resnet-50 | 16 | 6, 12, 18 | 0.01 | 0.817 | 0.371 | 0.809 | 0.776 | 0.646 |
| Resnet-50-Beta | 16 | 6, 12, 18 | 0.002 | 0.824 | 0.376 | 0.811 | 0.777 | 0.649 |
| Wide-ResNet-41 | 16 | 6, 12, 18 | 0.002 | 0.828 | 0.401 | 0.816 | 0.795 | 0.666 |
| SWideRNet-SAC-(1, 1, 1) | 16 | 6, 12, 18 | 0.02 | 0.826 | 0.397 | 0.817 | 0.788 | 0.661 |
| Disclaimer/Publisher’s Note: The statements, opinions and data contained in all publications are solely those of the individual author(s) and contributor(s) and not of MDPI and/or the editor(s). MDPI and/or the editor(s) disclaim responsibility for any injury to people or property resulting from any ideas, methods, instructions or products referred to in the content. |
© 2023 by the authors. Licensee MDPI, Basel, Switzerland. This article is an open access article distributed under the terms and conditions of the Creative Commons Attribution (CC BY) license (https://creativecommons.org/licenses/by/4.0/).


