1. Introduction
A smart city is a complex concept that embodies the ability to build a sustainable, environmentally friendly and inclusive socio-technological environment using digital technologies [
1,
2,
3]. A smart city can be analyzed in different directions, and e-governance is only one of many. In general, e-government issues receive considerable attention at national levels [
4,
5]. Most countries have developed digitization strategies that extend to the public administration system. To a significant extent, the possibilities of developing e-government at the level of municipalities depend on the state policy in this area, at least on the level of development of digital infrastructure and the digital culture of citizens. However, the opposite situation is also possible when a smart city is far ahead of national achievements in terms of the level of application of digital technologies and opportunities for the digital participation of citizens.
The smart city concept itself is relatively young. In the Scopus database, publications in the field of smart city governance have been available since 2011. The most cited works in this area as of the end of 2022 are presented in
Table 1. Note that publications were selected using the keywords “smart city” and “governance” in the “Title, abstract, keywords” field. The search results were narrowed down to articles, conference papers, books and book chapters in English for the period of 2011–2022.
The vast majority of top-cited works are relatively early works (2011–2015) that are conceptual in nature. In these works, the authors explore the essence of a smart city, the criteria for classifying a city as smart and offer their approaches to the types of initiatives, goals and tasks of a smart city. In addition, in these works, the authors identify challenges and problems associated with the intensive implementation of digital technologies in cities, the impact of such technologies on the quality of life of citizens, discuss the real benefits of technologies for the sustainable development of cities and the possibility of meeting the needs of all citizens. In particular, Chourabi et al. [
6] consider governance as one of the eight critical factors of smart city initiatives that form the basis of its integrative framework. Nam and Pardo [
8] studied the concept of a smart city and the strategic principles of its development in terms of three dimensions—technology, people and institutions—and suggested considering governance for institutional improvement and citizen involvement as one of the strategic principles of a smart city. Batty et al. [
9] outlined their vision of a smart city, identified several scenarios for the development of smart cities and proposed project areas for smart technologies in cities. Among the goals of their research, the authors identified the development of new forms of city governance and organization.
Kitchin [
7] focused on the problematic aspects of digitization in smart cities, in particular with regard to big data: the politics of urban big data, technocratic governance and urban development, the corporatization of urban governance, hackable cities and the panoptic city. The problem of the growing influence of global high-technology companies, and the corporate version of city governance is explored in more detail by Hollands [
13]. Meijer and Bolívar [
10] focus specifically on the issues of smart city governance and emphasize that technologies alone will not make the city smarter, but what is necessary is an understanding of these technologies and the application of a process approach to smart city governance, taking into account both economic benefits and other public values. Shelton et al. [
14] criticize the smart city paradigm by showing the unevenness of the impact of smart city policies in real cities using the cases of Louisville and Philadelphia.
Others in the top 10 cited publications in Scopus focus on a narrower aspect of governance in smart cities. In particular, Perera et al. [
11] consider exclusively the application of Internet of Things technology as a service model for smart cities. Bakıcı et al. [
12] took the case of Barcelona as an example and investigated various initiatives of the city’s transition to a smart model, taking into account the aspects of Smart districts, living labs, initiatives, e-Services, infrastructures and Open Data. Gabrys [
15] delved into the environmental aspects of smart cities. The author used the term ‘environmentality’ to characterize contemporary urban transformations arising under the influence of digitalization and sustainable development proposals.
In addition to the mentioned works, the authors of many modern studies try to give a critical assessment of the smart city concept, examining not only the advantages, but also controversial issues, possible disadvantages, barriers and risks, as well as social disparities and digital divide issues [
16,
17,
18,
19,
20,
21,
22,
23,
24,
25].
In recent years, the number of publications dedicated to the study of the practical implementation and application of specific digital technologies (artificial intelligence, Internet of Things, Big Data, blockchain, mobile technologies, etc.) in urban governance has been increasing [
26,
27,
28,
29,
30,
31,
32,
33,
34].
The issue of digitalization in general, the formation of a digital society and the impact of digital technologies on the transformation of approaches to management at various levels are considered by scientists in works [
35,
36,
37,
38,
39,
40,
41,
42,
43,
44,
45,
46,
47,
48]. Among these studies, it is necessary to single out publications devoted to the problems of security, privacy, data protection and cyber security in smart cities [
49,
50,
51,
52,
53,
54,
55,
56,
57]. These problematic areas are most often used as an argument against the uncontrolled expansion of digital technologies.
At the current stage, a significant number of large cities around the world have already implemented elements of smart technologies or a comprehensive strategy of smart development. Electronic governance has also developed. E-government refers to the use of electronic and digital technologies in the delivery of public services, communication between the government and citizens and internal government operations. E-governance, on the other hand, encompasses the broader concept of using ICT and digital tools to transform the overall governance processes and structures.
There are several different indices for evaluating smart cities and in particular e-governance, but there is no unified approach [
58]. In the scientific literature, the issues of comparative assessment of electronic governance of smart cities from the point of view of increasing citizen participation, the convenience of providing administrative services, reducing corruption, etc., are insufficiently researched. The factors that influenced the indicators of achieving the specified advantages of e-government in different cities are also insufficiently studied [
59].
Researchers use different determinants to study e-governance adoption. Choudhuri et al. [
60] singled out technological and non-technological determinants of smart digital infrastructure diffusion in urban services. The authors included technology cost, digital literacy and sustainable innovation as non-technological determinants. Ramdhani et al. [
61] consider the effectiveness of e-government implementation from the point of view of the use of digital technologies and determine that the most important things in the implementation of e-government are criteria such as function, system security, user-friendliness and application menu display. Defitri et al. [
62] applied the TEO Framework and investigated the impact on e-government of the following three factors: ICT infrastructure (technology context), human resource (organizational context) and organizational culture (environmental context). Lozynskyy et al. [
63] focused on the study of city size and functional specialization as factors in the implementation of smart technologies in cities.
Dias G.P. [
64] notes that the set of determinants for the analysis of e-government implementation differs significantly in various scientific studies and is determined by the choice of the studied concepts related to e-government such as e-government readiness, e-government adoption, e-government diffusion or e-government institutionalization. For example, Kim C. and Kim K.-a. [
65] focused on such an aspect of e-government implementation as e-government success factors. Based on the systematization of scientific publications, the authors formed a list of possible success factors, which includes political background, economic and technical environment, political leadership, vision and policy goals, strategic priorities, role performers and stakeholders, customers (accessibility, governance participation, privacy protection), resource allocation (budget, project management), common framework cooperation and information technology level. Based on the case study of institutional change from e-government toward smarter cities in the UK and South Korea, the authors determined the significance of the influence of socio-cultural factors.
Based on the bibliometric analysis of the determinants of local e-government implementation, Dias G.P. [
64] determined that the factors of demography and socioeconomic dynamics (percentage of educated people, human development, average income, level of social welfare, employment rate, etc.) are most often studied in this context. Political factors (political environment, citizens’ participation, laws and regulations) are studied relatively less frequently. The purpose of the article is the clustering of smart cities according to the level of e-governance and the study of key enablers of e-governance within each cluster according to indicators of economic, social, political, information and technological development of cities and relevant countries. The first part contains the results of the cluster analysis and division of smart cities according to e-governance indicators. The second part is devoted to the calculation of the Smart City Governance Index to provide a general assessment of e-governance in smart cities. The last part of the study is devoted to the identification of key enablers of e-governance in smart cities of each of the clusters. At this stage, four hypotheses were put forward: (1) the development of e-governance directly depends on the level of ICT development; (2) the development of e-governance directly depends on the level of economic development; (3) the development of e-governance directly depends on the level of human development (in particular, the level of education and welfare of the population); (4) the development of e-governance directly depends on political factors, in particular the level of democracy. The value of the work lay in the identification and assessment of the impact of key factors on e-governance indicators in smart cities using VAR/VEC modeling.
2. Materials and Methods
To achieve the objectives of the research, the methods of cluster analysis, construction of an integral indicator and VAR/VEC modeling were used in the paper.
Cluster analysis was used to identify the common characteristics of smart cities from the point of view of the development of e-governance and to divide these cities into appropriate groups—clusters. Cluster analysis provides the possibility of using different approaches: tree clustering, two-way clustering and k-means clustering. The k-means clustering method was used since it allows you to adjust the number of formed clusters, ensures the clarity of assigning each research object to a certain cluster and allows you to calculate cluster means and Euclidean distances of objects that fall into the corresponding cluster. This enables further analysis of the composition of clusters and identification of key variables on the basis of which clusters are formed.
Cluster analysis was conducted for 68 smart cities from 68 different countries. The countries included in the analysis have different regional affiliations and different levels of economic, social and ICT development.
The information base for cluster analysis is data from the IMD Smart City Index Report 2023 [
66]. This choice was due to the following reasons. First, the most open, reliable databases summarize information by country, not by city. On the other hand, access to city performance indicators is limited. Secondly, there are a sufficient number of methods for calculating smart city indices. Most of them have an established thematic focus on sustainability, innovation, environmental problems, etc. and do not always take into account aspects of e-governance. The IMD Smart City index includes indicators that directly characterize the governance of smart cities, which is the main focus of this article. In addition, the IMD Smart City Index data is open; the index is calculated regularly on an annual basis; the sample covers a large number of smart cities with maximum geographical coverage; the methodology is clear and suitable for the purposes of this study.
The Smart City index summarizes the evaluations of the indicators of five key areas (Health and safety, Mobility, Activities, Opportunities and Governance) divided into two pillars: Structures and Technologies. In general, the Smart City Index methodology provides 8 criteria for e-governance of smart cities and 4 in each of the pillars Structures and Technologies. The article adopts the following notations for e-governance indicators: S1, S2, S3, S4, T1, T2, T3 and T4.
Governance indicators from the Structures pillar include
S1—Information on local government decisions are easily accessible;
S2—Corruption of city officials is not an issue of concern;
S3—Residents contribute to decision making of local government;
S4—Residents provide feedback on local government projects.
In turn, governance indicators from the Technologies pillar include
T1—Online public access to city finances has reduced corruption;
T2—Online voting has increased participation;
T3—An online platform where residents can propose ideas has improved city life;
T4—Processing Identification Documents online has reduced waiting times.
Each of the above-mentioned indicators reflects a certain aspect of the effectiveness of structures and the use of technologies at the municipal level in ensuring interaction between the city population and local government bodies and providing administrative services.
The cluster analysis is based on data from the IMD Smart City Index Report 2023, which reflects the results of the 2022 study. This report presents 118 cities, out of which 68 cities were selected for the study in such a way that only one city was selected for each country. If data on several smart cities were available for one country, then the city that occupies the highest position according to the Smart City Index 2023 was chosen. The reduction of the number of smart cities included in the cluster analysis to 68 is due to the needs of the last stage of the research—VAR/VEC modeling. This stage uses some country-level data (such as the Digital Quality of Life Index, GNI per capita and Democracy Index) that are the same for smart cities in the same country. If using the original sample of 118 cities from the IMD Smart City Index Report, where some countries are represented by only one city and others—by several cities (e.g., 10 US cities), this would significantly distort the final results.
A general indicator of the level of e-government of the city (Smart City Governance Index—SCGI) is formed based on a linear mathematical model with the inclusion of eight variables related to governance from the IMD Smart City Index Report (Formula (1)).
where w
i is a weighting coefficient of i-indicator of e-governance.
Weighting coefficients for variables are determined using the Fishburn formula (Formula (2)):
where n—the total number of indicators in the calculation of SCGI; i—the rank of an indicator.
The advantage of using the Fishburn formula is the ability to prioritize different weighting coefficients and calculate their rank and value accordingly. The priority of the weighting coefficients is determined based on the results of the cluster analysis and expert assessment.
At the next stage, the obtained values of the Smart City Governance Index are compared with the indicators of social, economic, political and information technology development of the respective cities (or in the absence of data—countries) in order to determine the key enablers of e-governance. Human Development Index, Digital Quality of Life Index, GNI per capita and Democracy Index were chosen as relevant indicators. Data on the selected indicators are contained in open databases, the values for 2022 are available, which allows you to compare them with the calculated values of the Smart City Governance Index. For GNI per capita, Digital Quality of Life Index and Democracy Index, country-level data is used for all smart cities in the sample. For other indicators (Human Development Index and Smart City Governance Index), city-level data is used.
The Human Development Index (HDI) gives a general assessment of both economic and socio-demographic factors of the quality of human life. It is calculated in terms of three key dimensions: a long and healthy life, being knowledgeable and having a decent standard of living [
67]. GNI per capita (PPP
$) is taken into account among the economic indicators in the HDI. However, given the importance of analyzing the impact of the economic component on e-governance, this indicator is used in the analysis as a separate one as well. The Digital Quality of Life Index (DQL) is calculated by the cybersecurity company Surfshark. The structure of the DQL index includes 5 pillars: Internet affordability, Internet quality, electronic infrastructure, electronic security and electronic government [
68]. The Democracy Index is formed by the Economist Intelligence Unit (EIU) based on the results of surveys in the following five categories: electoral process and pluralism; civil liberties; functioning of government; political participation; political culture [
69].
The established hypotheses about the influence of indicators characterizing the social (HDIcity), economic (GNI per capita), political (DemI) and information technology (DQL) on the Smart City Governance Index were verified using VAR/VEC modeling.
The choice of the model that most fully describes the dependence between the indicators is carried out on the basis of the results of checking the data for stationarity and cointegration as follows:
- (1)
the data are non-stationary and there is co-integration between the indicators—a VAR model of the following form (3):
where
a0 is the vector average of the series;
Am, matrices of coefficients for each lag; ΕT is a multivariate zero-mean Gaussian noise term.
- (2)
the data are non-stationary and there is no co-integration between the indicators—a VEC model of the following form (4):
where
—distinction operator;
- (3)
the data are stationary—VAR model.
The reliability of the obtained results is checked using fixed- and random-effects models. The parameters of the regression model are estimated using the random-effects model as follows (5):
where
Yij is the observed effect;
μ is the true common mean effect;
Ui is the deviation of the true mean for study from the common mean;
Wij is the individual-specific random effect;
ϵij is the within-study error observed for study.
The formalization of the relationship between indicators based on the fixed-effects model is carried out as follows (6):
where
Yij is the observed effect;
ai are entity-specific intercepts that capture heterogeneities across entities;
Xk,it are unobserved time-invariant heterogeneities across the entities
i = 1, …,
n.
The Hausman test is used as a criterion for choosing a model that most accurately formalizes the relationship between indicators:
where
ϵ—error.
The value of the Hausman statistic is estimated using the Formula (8):
where
β0 and
β1 are models with fixed and random effects.
3. Results
3.1. Cluster Analysis Results
The article provides a cluster analysis of smart cities using data from the IMD Smart City Index Report 2023 and Statistica 10 software. The applied method of k-means clustering made it possible to form four clusters of smart cities.
The chosen division into four clusters made it possible to form relatively equal-sized clusters balanced by the number of cases. A larger number of clusters turned out to be impractical due to the significantly uneven distribution of cities between clusters. The division into three clusters turned out to be insufficient, it did not reflect all the important differences in e-governance of the analyzed cities.
Figure 1 shows a plot of means for variables across clusters.
The plot of means shows that the smart cities were distributed by clusters according to the values of all variables with minor exceptions. There is a significant gap between the cluster means for almost all variables. Close values of cluster means are characteristic only of variables S3 and S4 of clusters 1 and 2 and variable T4 of clusters 2 and 3. In other words, the clustering of smart cities is based on the feature of the general level of e-government. For example, the first cluster includes smart cities with the highest average values for all variables. The second cluster also includes smart cities with high values of all variables, but they are lower than the average values of the first cluster except for variable S2. Smart cities included in the third cluster show medium values for all variables, except for variable T4, which has a high value and is higher than the average for the second cluster. Cities of the fourth cluster are cities with low values of all analyzed variables, which are lower than in all three other clusters.
Specific values of cluster means are given in
Table 2. According to
Table 2, the means of variables in cluster 1 exceed 50%, with the exception of the mean value of variable S2, for which it is 41.7%. In cluster 2, most variables have mean values above 50%, except for variables T1, T2 and T3, which are between 40% and 50%. In cluster 3, the means of most variables range from 30% to 50%, with the exception of variable S2, which has an extremely low mean value of 25.0% and variable T4, which, on the contrary, has a relatively high mean value of 61.7%. In cluster 4, the mean values range from 15% to 40%, with the exception of variable T4, which has a mean value of 49.5%.
To visualize the distribution of smart cities by clusters,
Figure 2 shows a map on which the corresponding countries are marked according to the affiliation of smart cities in the color corresponding to the cluster number.
Analyzing the components of the formed clusters, it is possible to reveal the regularities of combining smart cities into clusters according to regional affiliation, level of economic development, socio-political parameters, etc. However, these criteria are not applicable to all clusters. For example, the basis of the second cluster (15 out of 18 cities) is the smart cities of high-income countries of the European region. This cluster also includes cities of such high-income countries as Canada, Australia and New Zealand.
The third cluster unites smart cities of the American, European and African regions and it also includes Tokyo (Japan). Half of this cluster consists of smart cities of European countries with a lower overall level of economic development, compared to the second cluster. The fourth cluster is formed primarily of smart cities representing countries with the lowest indicators of socio-economic development compared to other clusters. However, this cluster also includes cities representing high-income countries: Riga (Latvia), Bucharest (Romania). In terms of geographical representation, cluster 4 is mainly the cities of Latin America, the Caribbean, the Middle East and Africa.
The basis of the first cluster is the smart cities of the Middle East, East Asia and the Pacific. It also includes New York (USA) and two European cities—Tallinn (Estonia) and Warsaw (Poland). According to the parameters of economic, social development and political system, cluster 1 is the most heterogeneous. It is impossible to identify the common features of smart cities of the first cluster, apart from high e-governance indicators, without conducting an in-depth analysis.
Such a spread of smart city indicator values, as in the first cluster, is not observed in other clusters. Smart cities of clusters 2, 3 and 4 are more similar in basic characteristics. This conclusion is confirmed by the values of Euclidean distances to the center of the cluster for each case (smart city) included in the study.
Table 3 lists the cities of each cluster and the Euclidean distances to the center of the cluster, which are indicated in parentheses.
In clusters 2, 3 and 4, there are slight deviations of the values of smart city indicators from the cluster means (with isolated exceptions), which indicates a rather dense location of cases in the cluster, and the closeness of the values of the variables by which smart cities are grouped. Instead, in the first cluster, the spread of Euclidean distance values varies in a much wider range (from 4.33 to 14.12).
For each pair of clusters, it is possible to single out important and unimportant variables by which these clusters differ. The most interesting is the comparative analysis of clusters 1 and 2. The smart cities included in the first cluster significantly outperform the smart cities of the second cluster in terms of technological indicators T1, T2, T3 and T4. The difference in S3 and S4 indicators is minimal. So, smart cities of the first and second clusters are characterized by the same level of involvement of residents in decision making of local government and providing feedback on local government projects. And according to indicator S2, which refers to “Corruption of city officials is not an issue of concern”, on the contrary, smart cities of cluster 2 significantly outperform smart cities of cluster 1. The specificity of cluster 1 is that it includes many cities in the Middle East, East Asia and the Pacific, which are characterized by a low level of development of democratic mechanisms and a high level of corruption. A number of smart cities, which are really not a model of democratic institutions, economic well-being and equality of their citizens, due to the intensive implementation of smart technologies were able to become leaders in terms of e-government indicators.
As mentioned above, cluster 1 is the most heterogeneous. This heterogeneity is manifested in terms of economic and social parameters, as well as the regional affiliation of cities. Most of the cities in the first cluster belong to the Middle East and Asia-Pacific regions. For these cities, along with a high level of adaptation of digital technologies and implementation of e-government initiatives, there are problems of inclusion and equality of access to digital services among residents. For example, in one of the leaders of the region, Singapore, the mentioned shortcomings were clearly manifested during the pandemic, revealing a significant gap in the standard of living of different groups of residents and unequal access to technology. Migrant workers and the elderly were the most at risk [
70].
The first cluster includes several cities that have completely different characteristics of economic and social development and are more sustainable, e.g., two European cities—Warsaw and Tallinn. Their positions in cluster 1 are due to high e-governance indicators. Warsaw occupies a high position in the rating of Smart cities according to indicators S3, S4, T2 and T3, and in general, the values of the indicators for Warsaw are close to the means for this cluster. Although Tallinn occupies a mediocre position according to most indicators, it has the third place according to the T2 indicator and is in the top ten smart cities according to the T4 indicator.
3.2. Smart City Governance Index
To calculate the integral index of Smart City Governance according to Formula (1), it is necessary to establish priority and determine the values of the weighting coefficients. Among the variables included in the Smart City Index, it is possible to single out pairs of indicators that characterize the common aspect of e-governance quality. It is advisable to set the same priority to these pairs of variables. These are pairs S2–T1 (Corruption of city officials is not an issue of concern; Online public access to city finances has reduced corruption), S3–T2 (Residents contribute to decision making of local government; Online voting has increased participation) and S4–T3 (Residents provide feedback on local government projects; An online platform where residents can propose ideas that have improved city life). The last pair of variables S1–T4 (Information on local government decisions is easily accessible; Processing Identification Documents online has reduced waiting times) is also given the same priority.
Among the defined pairs of variables, those that relate to the quality of interaction between authorities and citizens have the highest priority. The pair of variables S3 and T2, which reflect the active participation of citizens in the political life of the city—contribution to decision making and online voting—have the highest priority. The second priority is variables S4 and T3. These variables are also related to the involvement of citizens in city management, but in a somewhat more passive way—in the form of feedback on local government projects and posting of proposals and petitions. The third priority should be given to the pair of variables S2 and T1, related to the minimization of manifestations of corruption due to the use of digital technologies. The pair of variables S1 and T4 has the last priority. The established relations between the weighting coefficients of the variables can be represented by the Formula (9):
Since the same priority is set for some weighting coefficients, the same rank is also set for them as the average of their rank positions, which they would occupy in the case of different priorities. The Fishburn formula (Formula (2)) is used to calculate the values of the weighting coefficients. The results of establishing priorities, ranks and calculating the values of weighting coefficients are presented in
Table 4.
The next step is the calculation of the Smart City Governance Index using Formula (1).
The obtained results show that the positions of the cities in the ranking according to the Smart City Governance Index were actually distributed in accordance with their assignment to a certain cluster. The only crossover in values exists between the smart cities of the first and second clusters when some cities from the second cluster received higher Smart City Governance Index values than some cities from the first cluster.
The leaders of the Smart City Governance Index rating are Beijing (China)—73.77; Abu Dhabi (United Arab Emirates)—70.05; Riyadh (Saudi Arabia)—68.75; Hanoi (Vietnam)—67.94; Delhi (India)—64.36, all of which belong to the first cluster. The lowest in the rating are Sana’a (Yemen)—25.79; Lima (Peru)—25.75; Nicosia (Cyprus)—25.42; Accra (Ghana)—23.56; Guatemala City (Guatemala)—16.28, all of them belong to the fourth cluster.
In general, the distribution of index values within each cluster is as follows. Smart cities of cluster 1 have SCGI values ranging from 48.80 to 73.77, cities of cluster 2—from 46.01 to 59.48, cities of cluster 3—from 32.74 to 42.42 and cities of cluster 4—from 16.28 to 32.03 (
Table 5).
Thus, smart cities of clusters 3 and 4 do not overlap within the index values. The first and second clusters have a slight overlap. But in general, this does not affect the quality of the conducted cluster analysis and indicates that for further research of the relationships between the Smart City Governance Index and indicators of social, economic, political, information and technological development of smart cities, it is possible to use the division of smart cities according to the defined clusters.
3.3. VAR/VEC Modeling Results
The article formulated four hypotheses regarding the key enablers of e-governance:
A higher level of economic development has a strong positive impact on e-governance. We assume that economically developed countries have more resources for innovative activities and implementation of electronic government technologies;
A higher level of ICT development has a strong positive impact on e-governance. This connection is due to the impossibility of implementing e-government without the availability of appropriate information technologies. The development of e-government depends on the quality of the digital infrastructure and the ability of citizens to use the advantages of e-governance;
A higher level of human development has a strong positive impact on e-governance. The level of human development and above all the level of education and well-being of citizens, affect the level of civic consciousness and the desire and ability to participate in decision making regarding one’s city.
A higher level of democracy has a strong positive effect on e-governance. The democracy of society determines the ability of citizens to have access to information about the activities of local self-government, to influence and actively participate in public discussions, budget planning, etc.
At the first stage, based on descriptive statistics, we conduct an analysis of stability indicators that characterize the management of a smart city: standard deviation, coefficient of variation and maximum and minimum values. The results of the calculations (
Table 6) indicate their insignificant variability within one cluster. Cross-cluster analysis of indicators confirms the significant differences in the values of these indicators. Thus, the average value of the Human Development Index for smart cities of the first cluster is 0.845, for smart cities of the second cluster—0.958, for the third cluster—0.852 and for the fourth cluster—0.790. A similar situation is typical for other indicators. The value of the Smart City Governance Index is the most minimal (standard deviation ranges from 2.989 to 6.892). The values of the Human Development Index (0.019–0.118) and the Digital Quality of Life Index (0.044–0.133) are characterized by the smallest variability. The analysis of the minimum and maximum values of the factor indicators indicates slight differences in their values between the clusters. Only the value of GNI per capita varies significantly between different clusters (cluster 4—1,314,000; cluster 2—19,974).
The prerequisite for choosing a model that most accurately describes the dependence of the Smart City Governance Index on social, economic, political and information technology determinants is the verification of data series for stationarity (using the Dickey–Fuller test and the Philips Perron Test) and cointegration (Johansen tests for cointegration). The results of the Dickey–Fuller test calculation shown in
Table 7 prove that only half of the indicators are non-stationary (their calculated value is greater than the critical value at the significance levels of 1%, 5% and 10% and the probability indicators do not exceed 0.05). Thus, the value of the test statistics for the Dickey–Fuller test for the City HDI for the first-third clusters is less than the critical value, for the countries of the fourth cluster it is much higher. Similar results were obtained for the Philips Perron Test Statistics.
The heterogeneity of the obtained results does not allow us to draw a conclusion about the stationarity or non-stationarity of the data array and proves the need to calculate their first differences. Calculation of first differences is the most common means of bringing a non-stationary time series to a stationary one. The results of the Dickey–Fuller test calculations (
Table 8) show that all of them are integral with degree 1 (I(1)). At the same time, the calculated values of the t-statistics exceed the critical values for the significance level of 1%, 5% and 10%, and the probability indicators are less than 5%. Thus, the first differences in the data are stationary. This indicates that the analyzed data array does not change its characteristics over time.
At the next stage, we analyze the data for the presence of strong long-term relationships between them. Cointegration of variables consists in the existence of their stationary linear combination. Thus, it can be argued that the change in their values occurs synchronously, and the connections between them are maintained over time. We check the data for cointegration using Johansen tests for cointegration. The calculation results shown in
Table 9 indicate the cointegration of data for the countries of the first cluster (the value of the trace statistic exceeds the critical 5% and 1% critical value) and non-cointegration for the data of clusters 2–4.
Thus, the stationarity of the first differences of the data and their partial cointegration allow us to conclude that the best impact of social, economic, political and information technology determinants on the Smart City Governance Index can be formalized using VAR modeling.
It is important to take into account the time lags during which the link between the analyzed indicators is the strongest. This will be conducted using Akaike’s Final Prediction Error (FPE), the Akaike information criterion (AIC), Hannan-Quinn (HQOC) and Schwarz Bayesian criteria (SBIC) (
Table 10).
The results show that for smart cities of the first and second clusters, the maximum time lag is three years and for clusters 3 and 4—1 year. These results are confirmed by the best values according to the criteria of Akaike’s Final Prediction Error (FPE), the Akaike information criterion (AIC), Hannan-Quinn (HQOC) and Schwarz Bayesian criteria (SBIC). The obtained values are taken into account in the VAR modeling of the dependence between indicators.
The obtained results make it possible to determine the specification of the model, which formalizes the dependence on social, economic, political and information-technological determinants.
The VAR model formalizing the dependence of the first differences of the Smart City Governance Index data series on GNI per capita, Democracy Index, Human Development Index and Digital Quality of Life Index have the following form:
where
D(
SCGI)—Smart City Governance Index;
D(
SCGI(
L))—the lag differences of the Smart City Governance Index series;
D(
HDIcity(
L))—the lag differences of the Human Development Index series;
D(
DQL(
L))—the lag differences of the Digital Quality of Life Index series;
D(
GNI(
L))—the lag differences of GNI per capita series;
D(
DemI(
L))—the lag differences of the Democracy Index series.
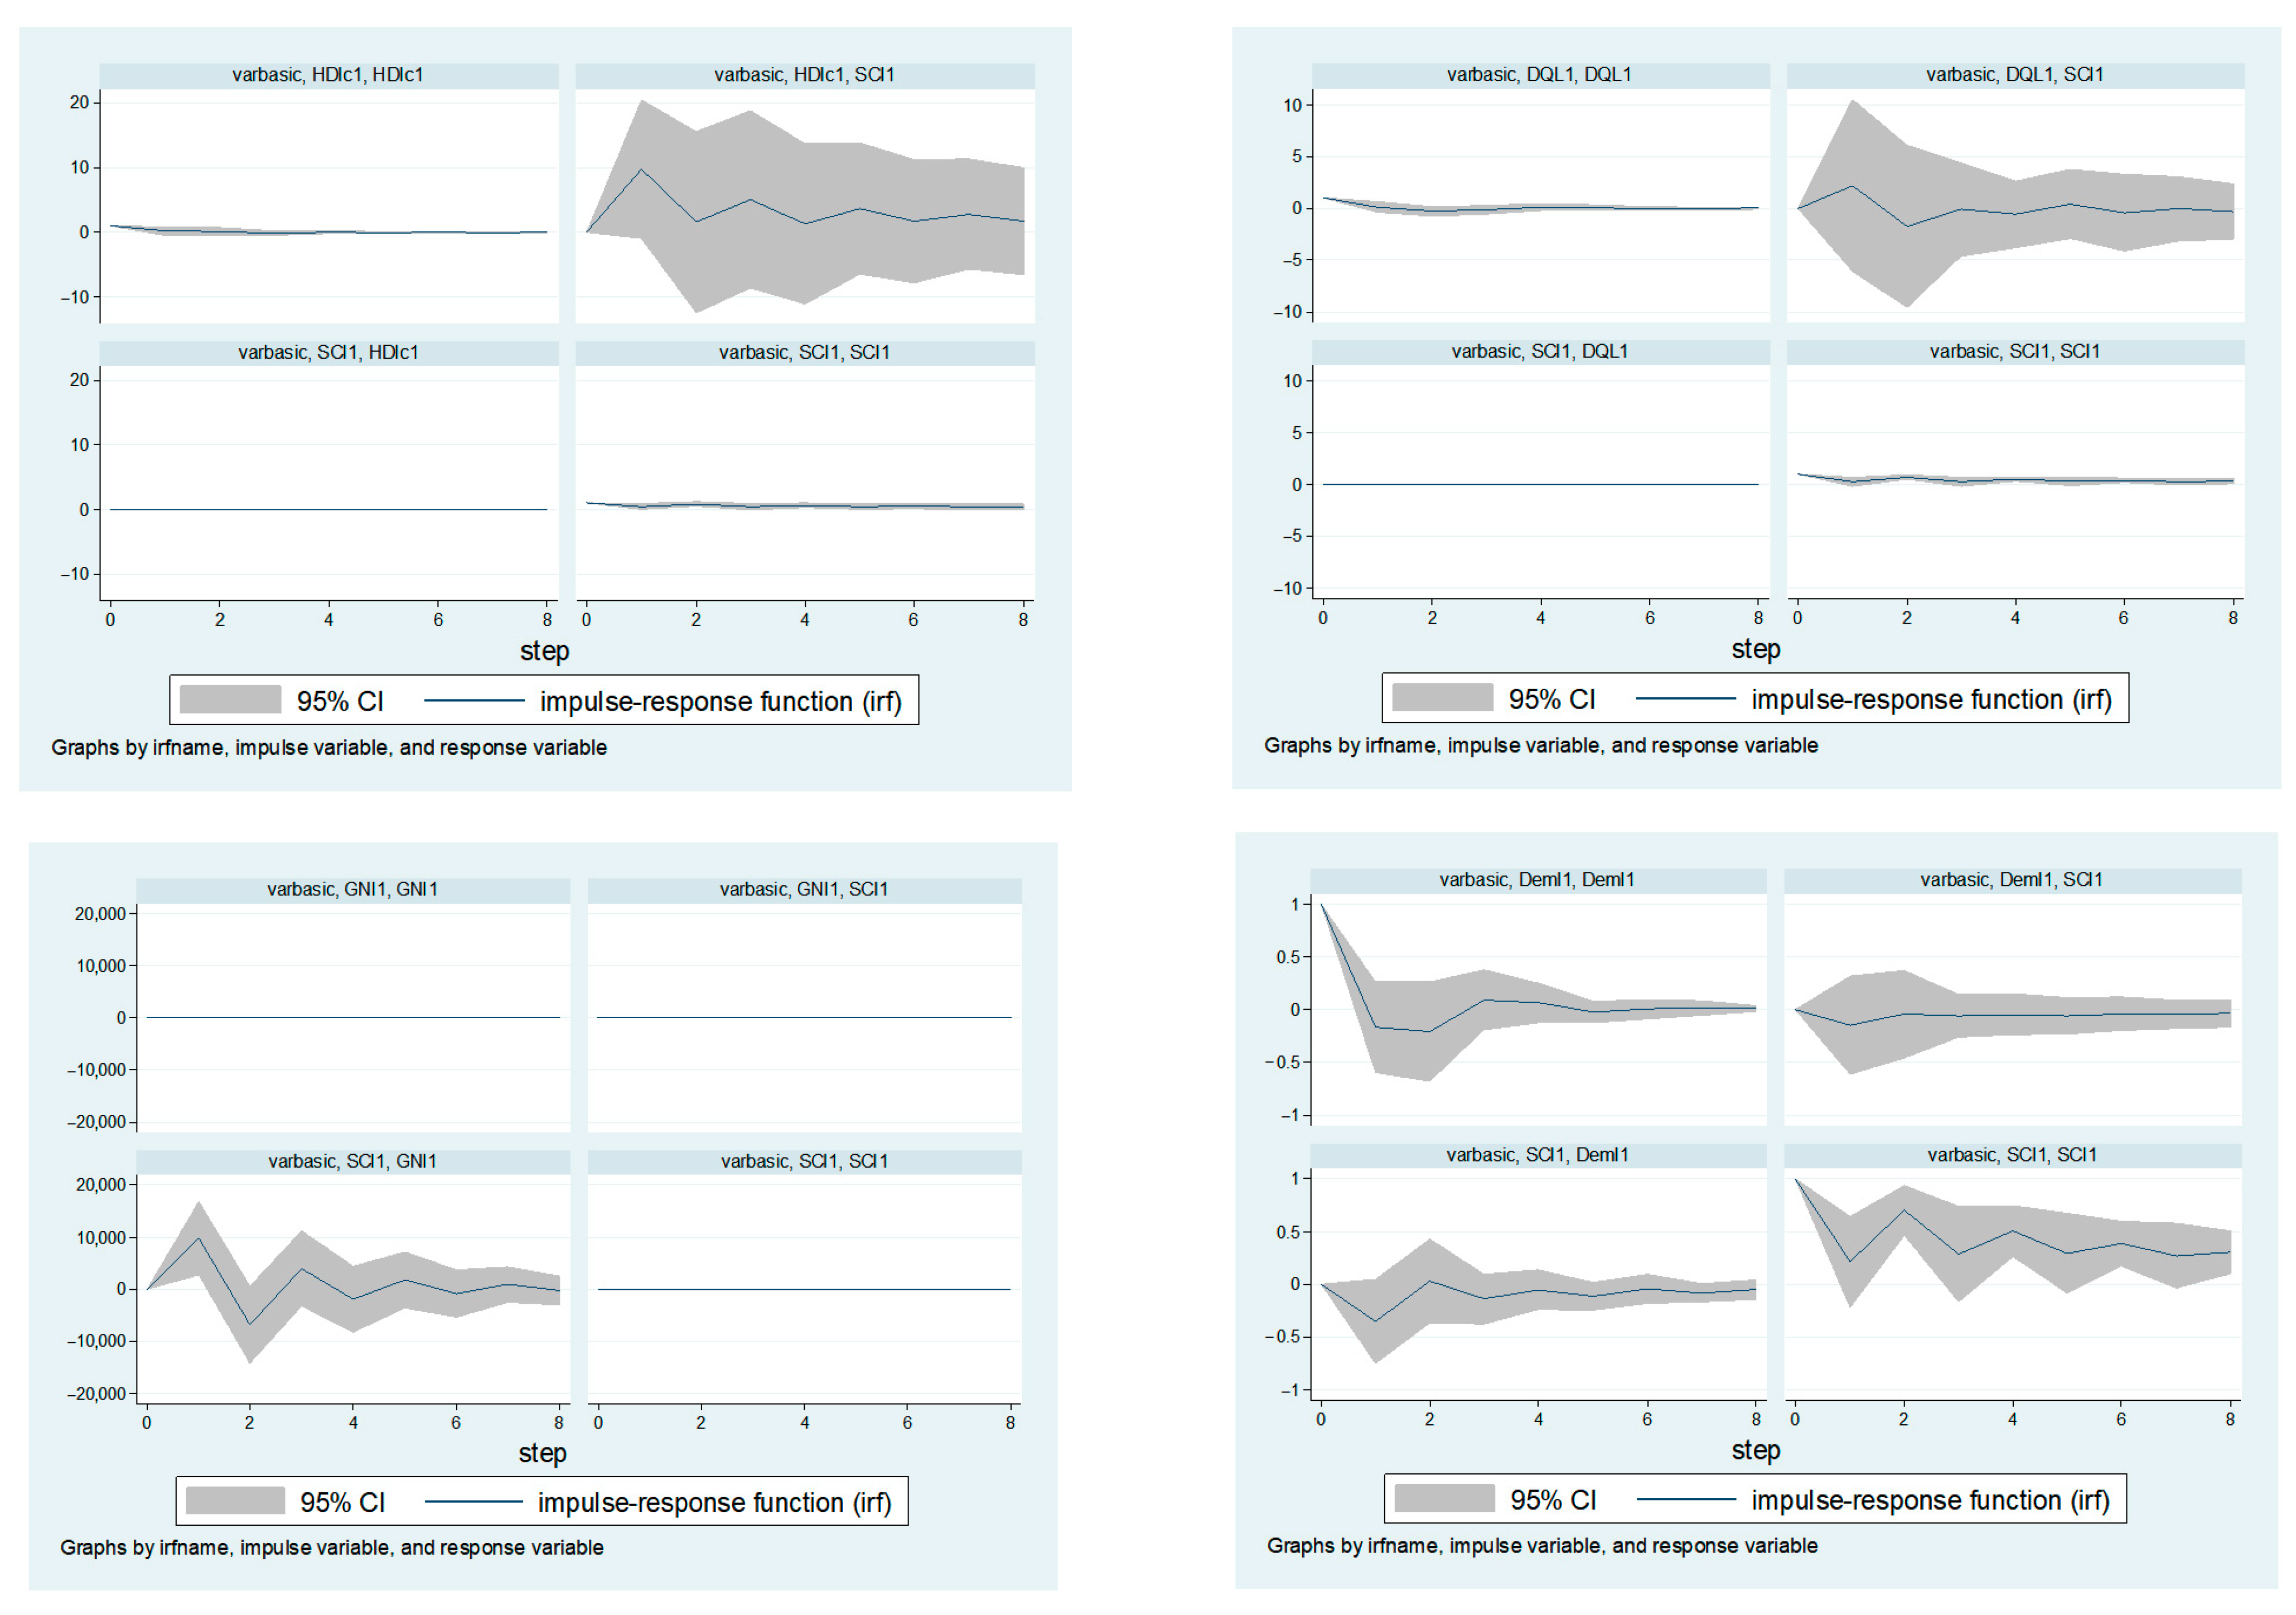
With the help of the impulse function, we carry out a graphical interpretation of the reaction of the Smart City Governance Index to single and accumulated shocks of factor indicators. In the process of modeling, other parameters of the model are assumed to remain unchanged. The visualization results presented in
Figure 3 prove that the Human Development Index exerts the greatest influence on the Smart City Governance Index, and the strength of this relationship is constantly changing and gradually decreasing. At the same time, GNI per capita is not affected by the resulting indicator. The Democracy Index initially has a negative effect on the resulting indicator, and after it exceeds 0.5, it has a positive effect on the Smart City Governance Index. In addition, the simulation results proved the presence of a two-way relationship between the Smart City Governance Index and the GNI per capita series and the Democracy Index, the nature of which constantly changes (from negative to positive) depending on the value of this indicator.
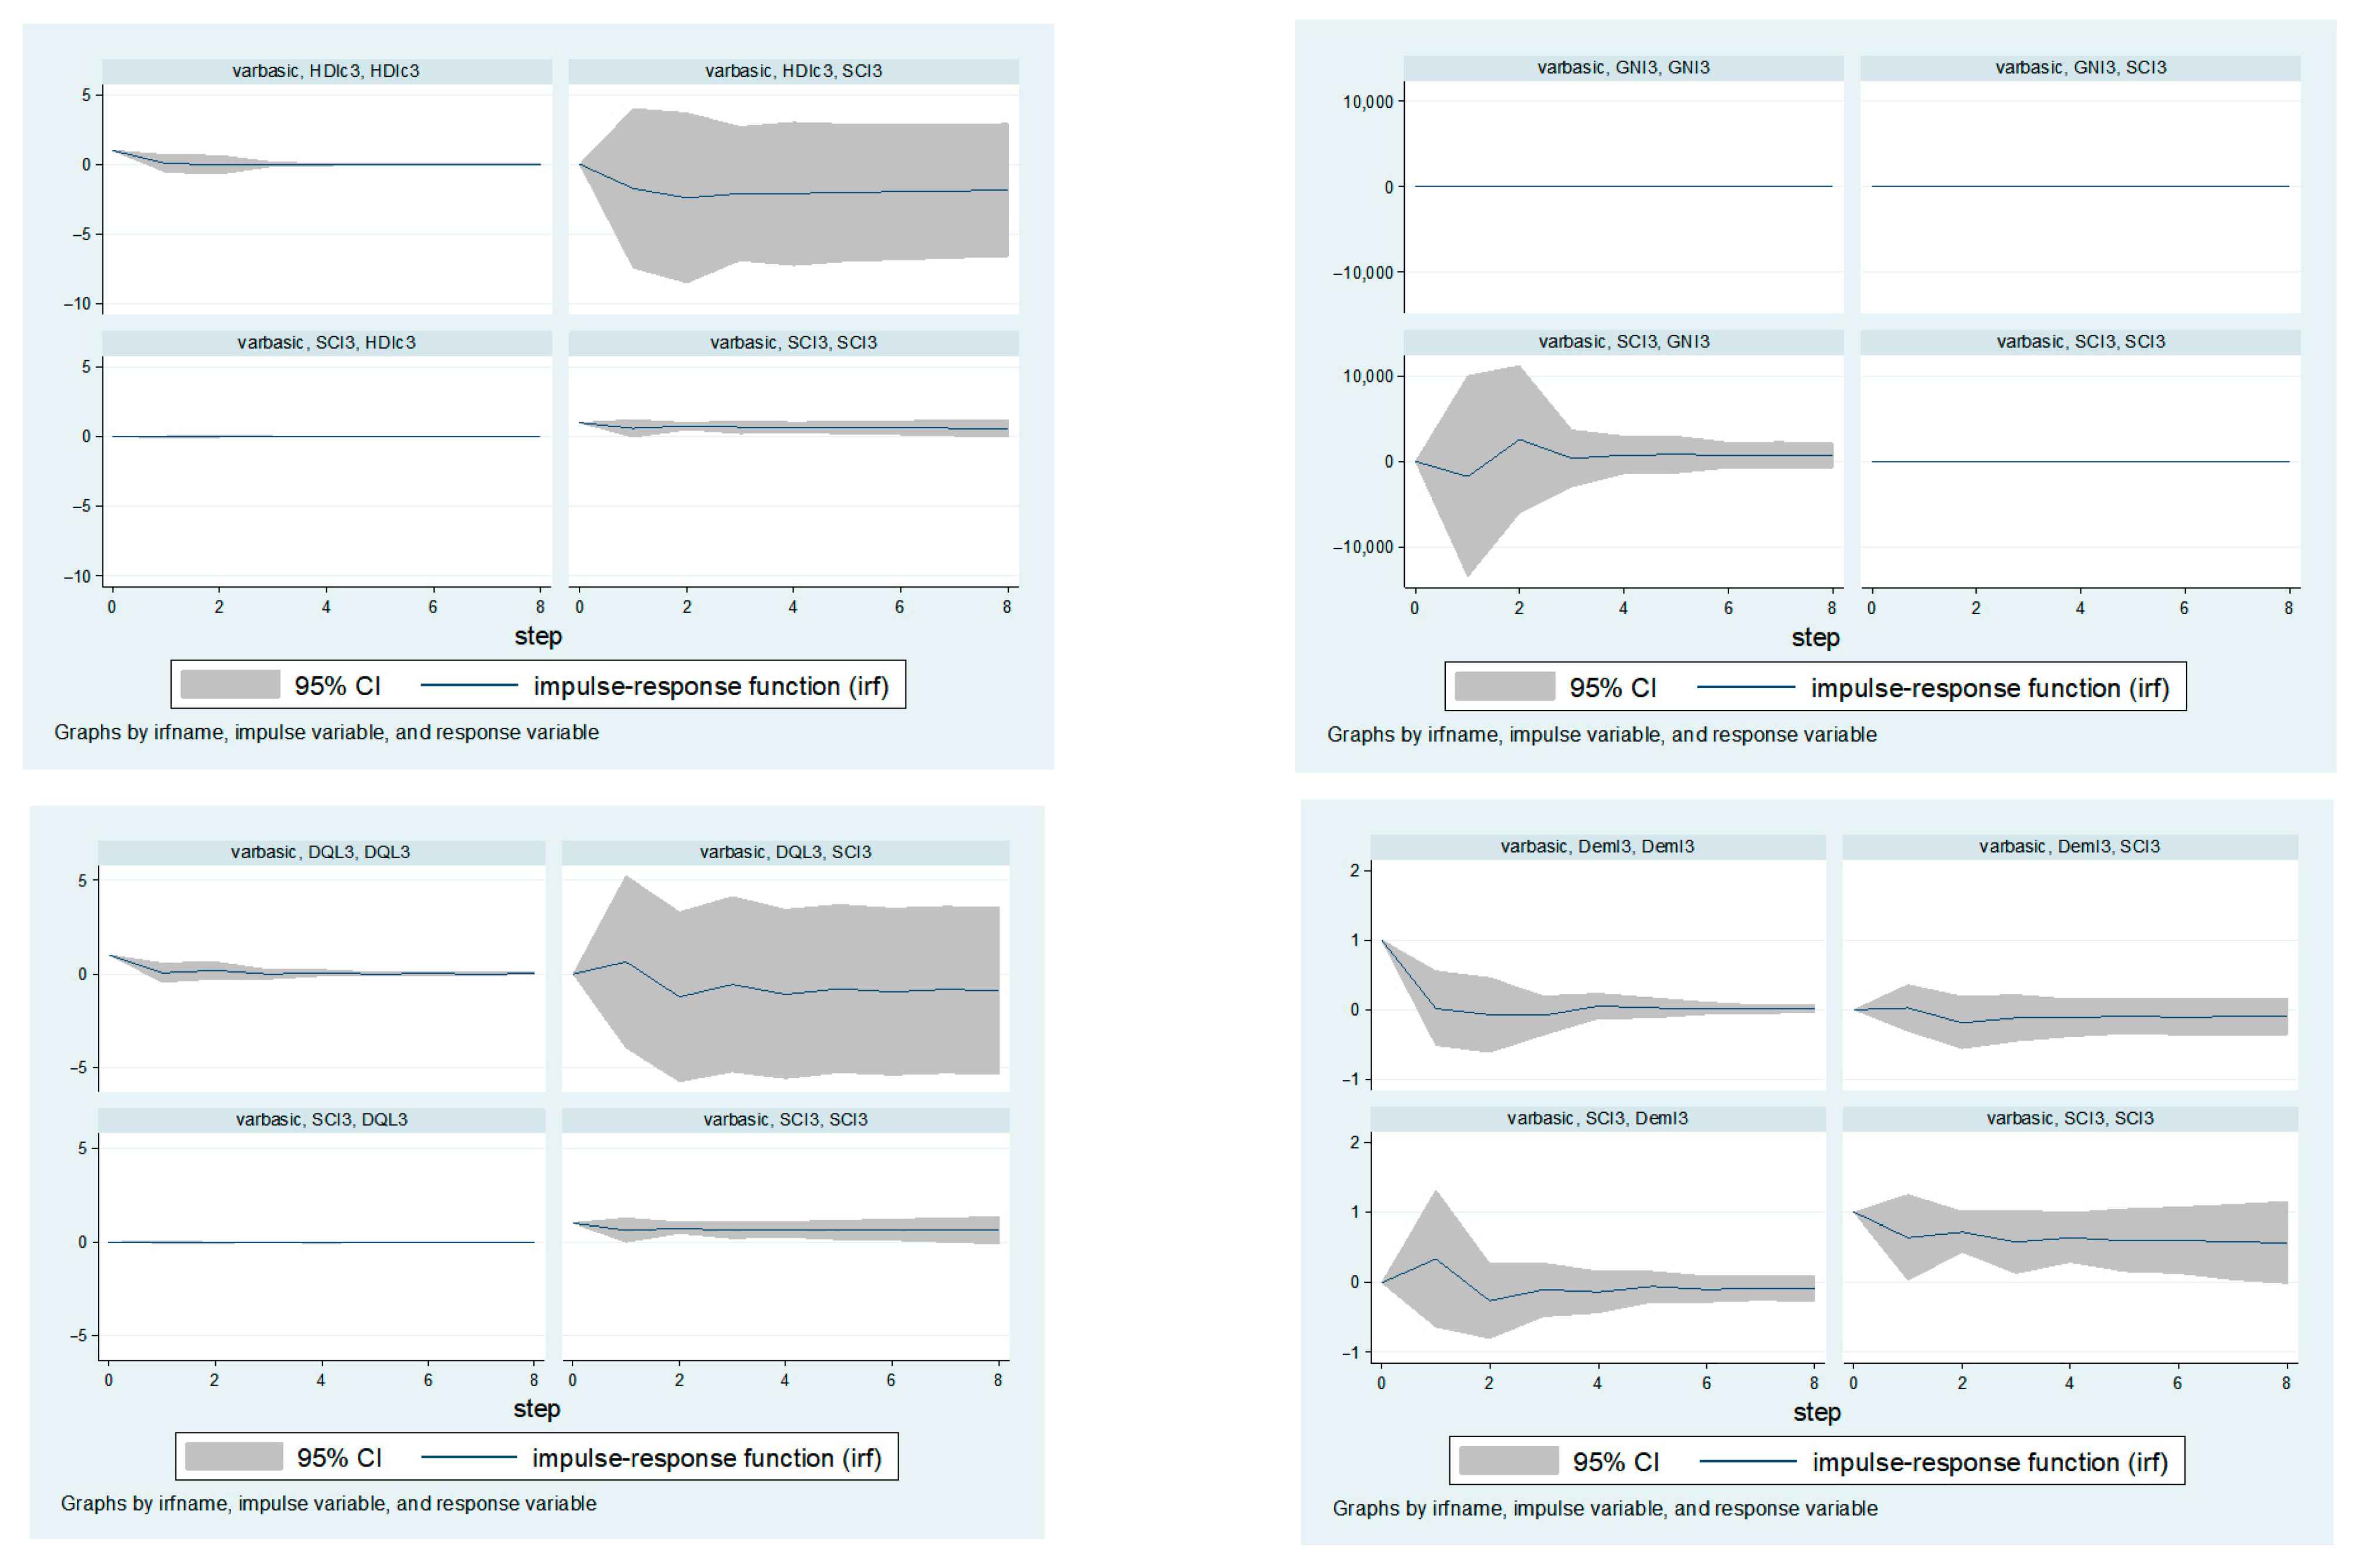
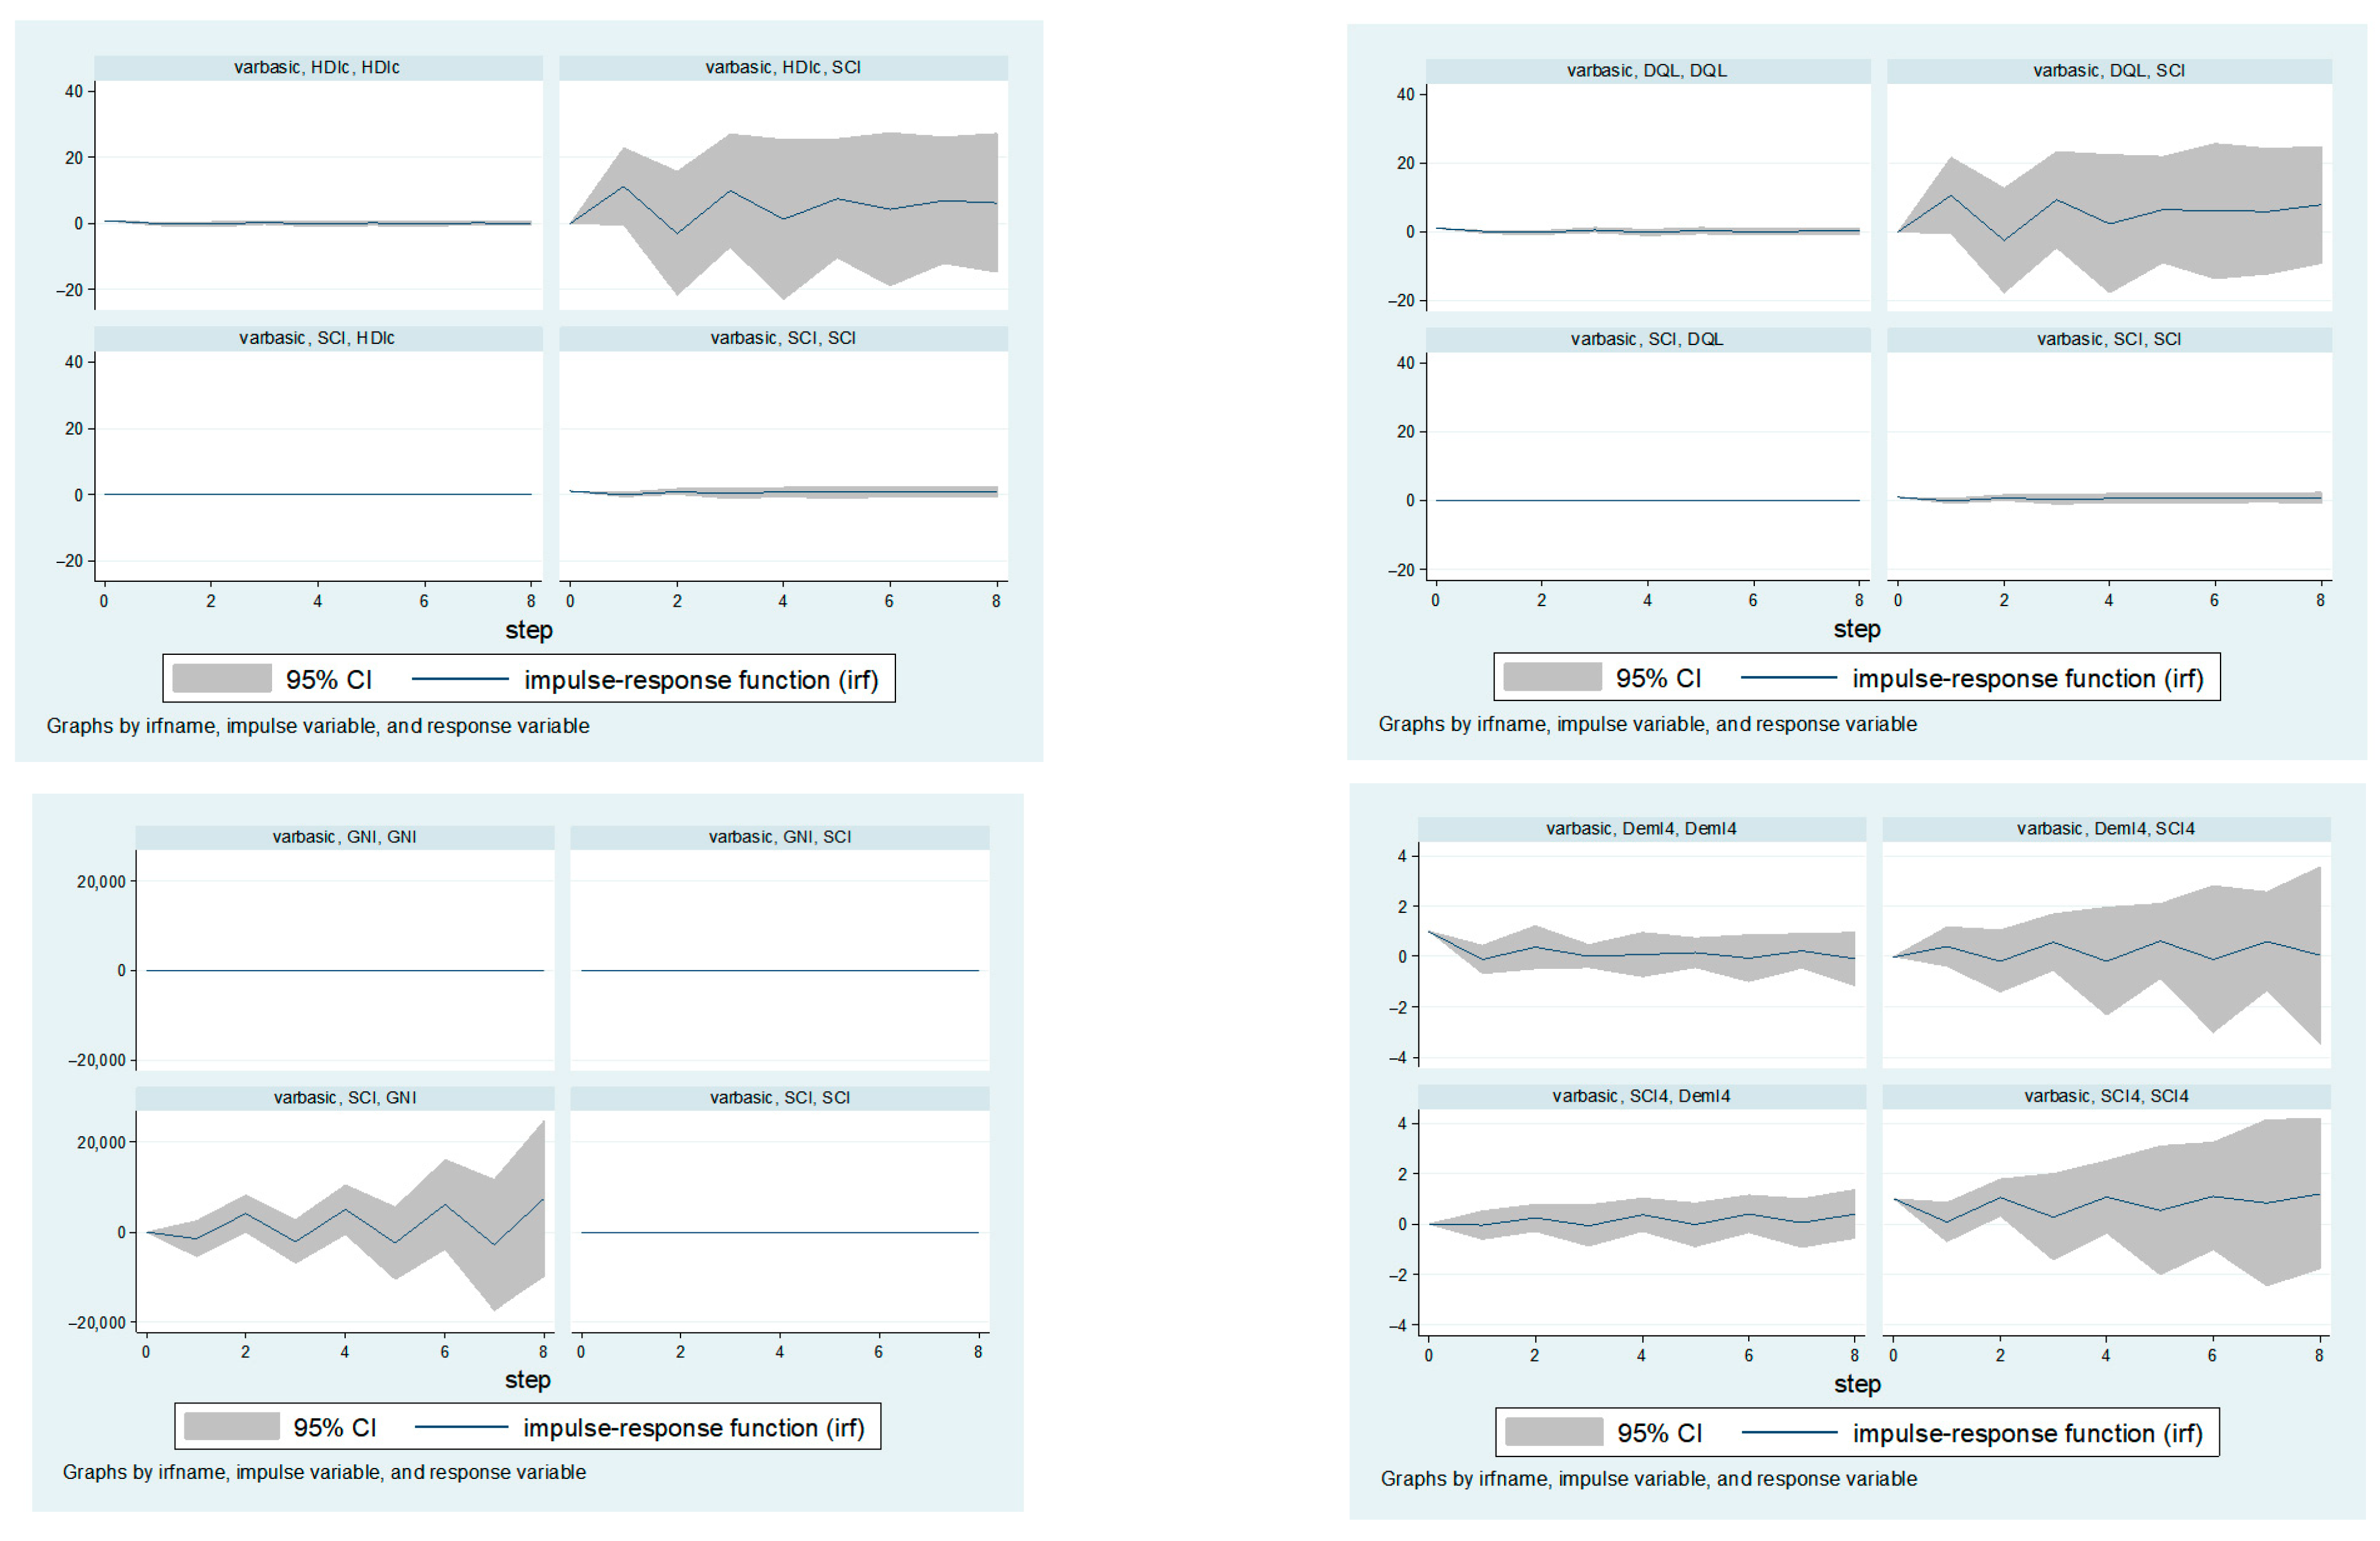
The results for the second-fourth clusters presented in
Appendix A allow us to draw the following conclusions:
in the smart cities of the second cluster, a change in the level of the Human Development Index and the Digital Quality of Life Index has a negative impact on the Smart City Governance Index series, the strength of which gradually decreases with the growth of factor indicators. GNI per capita shocks do not affect the level of the Smart City Governance Index, while a change in the level of the Human Development Index has a slight positive effect on its volume. The growth of the Democracy Index initially has a significant impact on the Smart City Governance Index, but gradually the strength of the connection between the indicators decreases;
in the smart cities of the third cluster, the shocks of the Human Development Index and the Digital Quality of Life Index have a significant negative impact on the Smart City Governance Index, the shocks of the Democracy Index practically do not affect the resulting indicator. Smart City Governance Index values do not depend on changes in GNI per capita;
for the smart cities of the fourth cluster, a significant reaction of the Smart City Governance Index to shocks of the Human Development Index, Digital Quality of Life Index and Democracy Index is characteristic. Depending on the values of these indicators, there is a constant change in the nature of the influence of these indicators (from positive to negative) on the Smart City Governance Index. As in other clusters, the change in GNI per capita does not affect the level of the Smart City Governance Index.
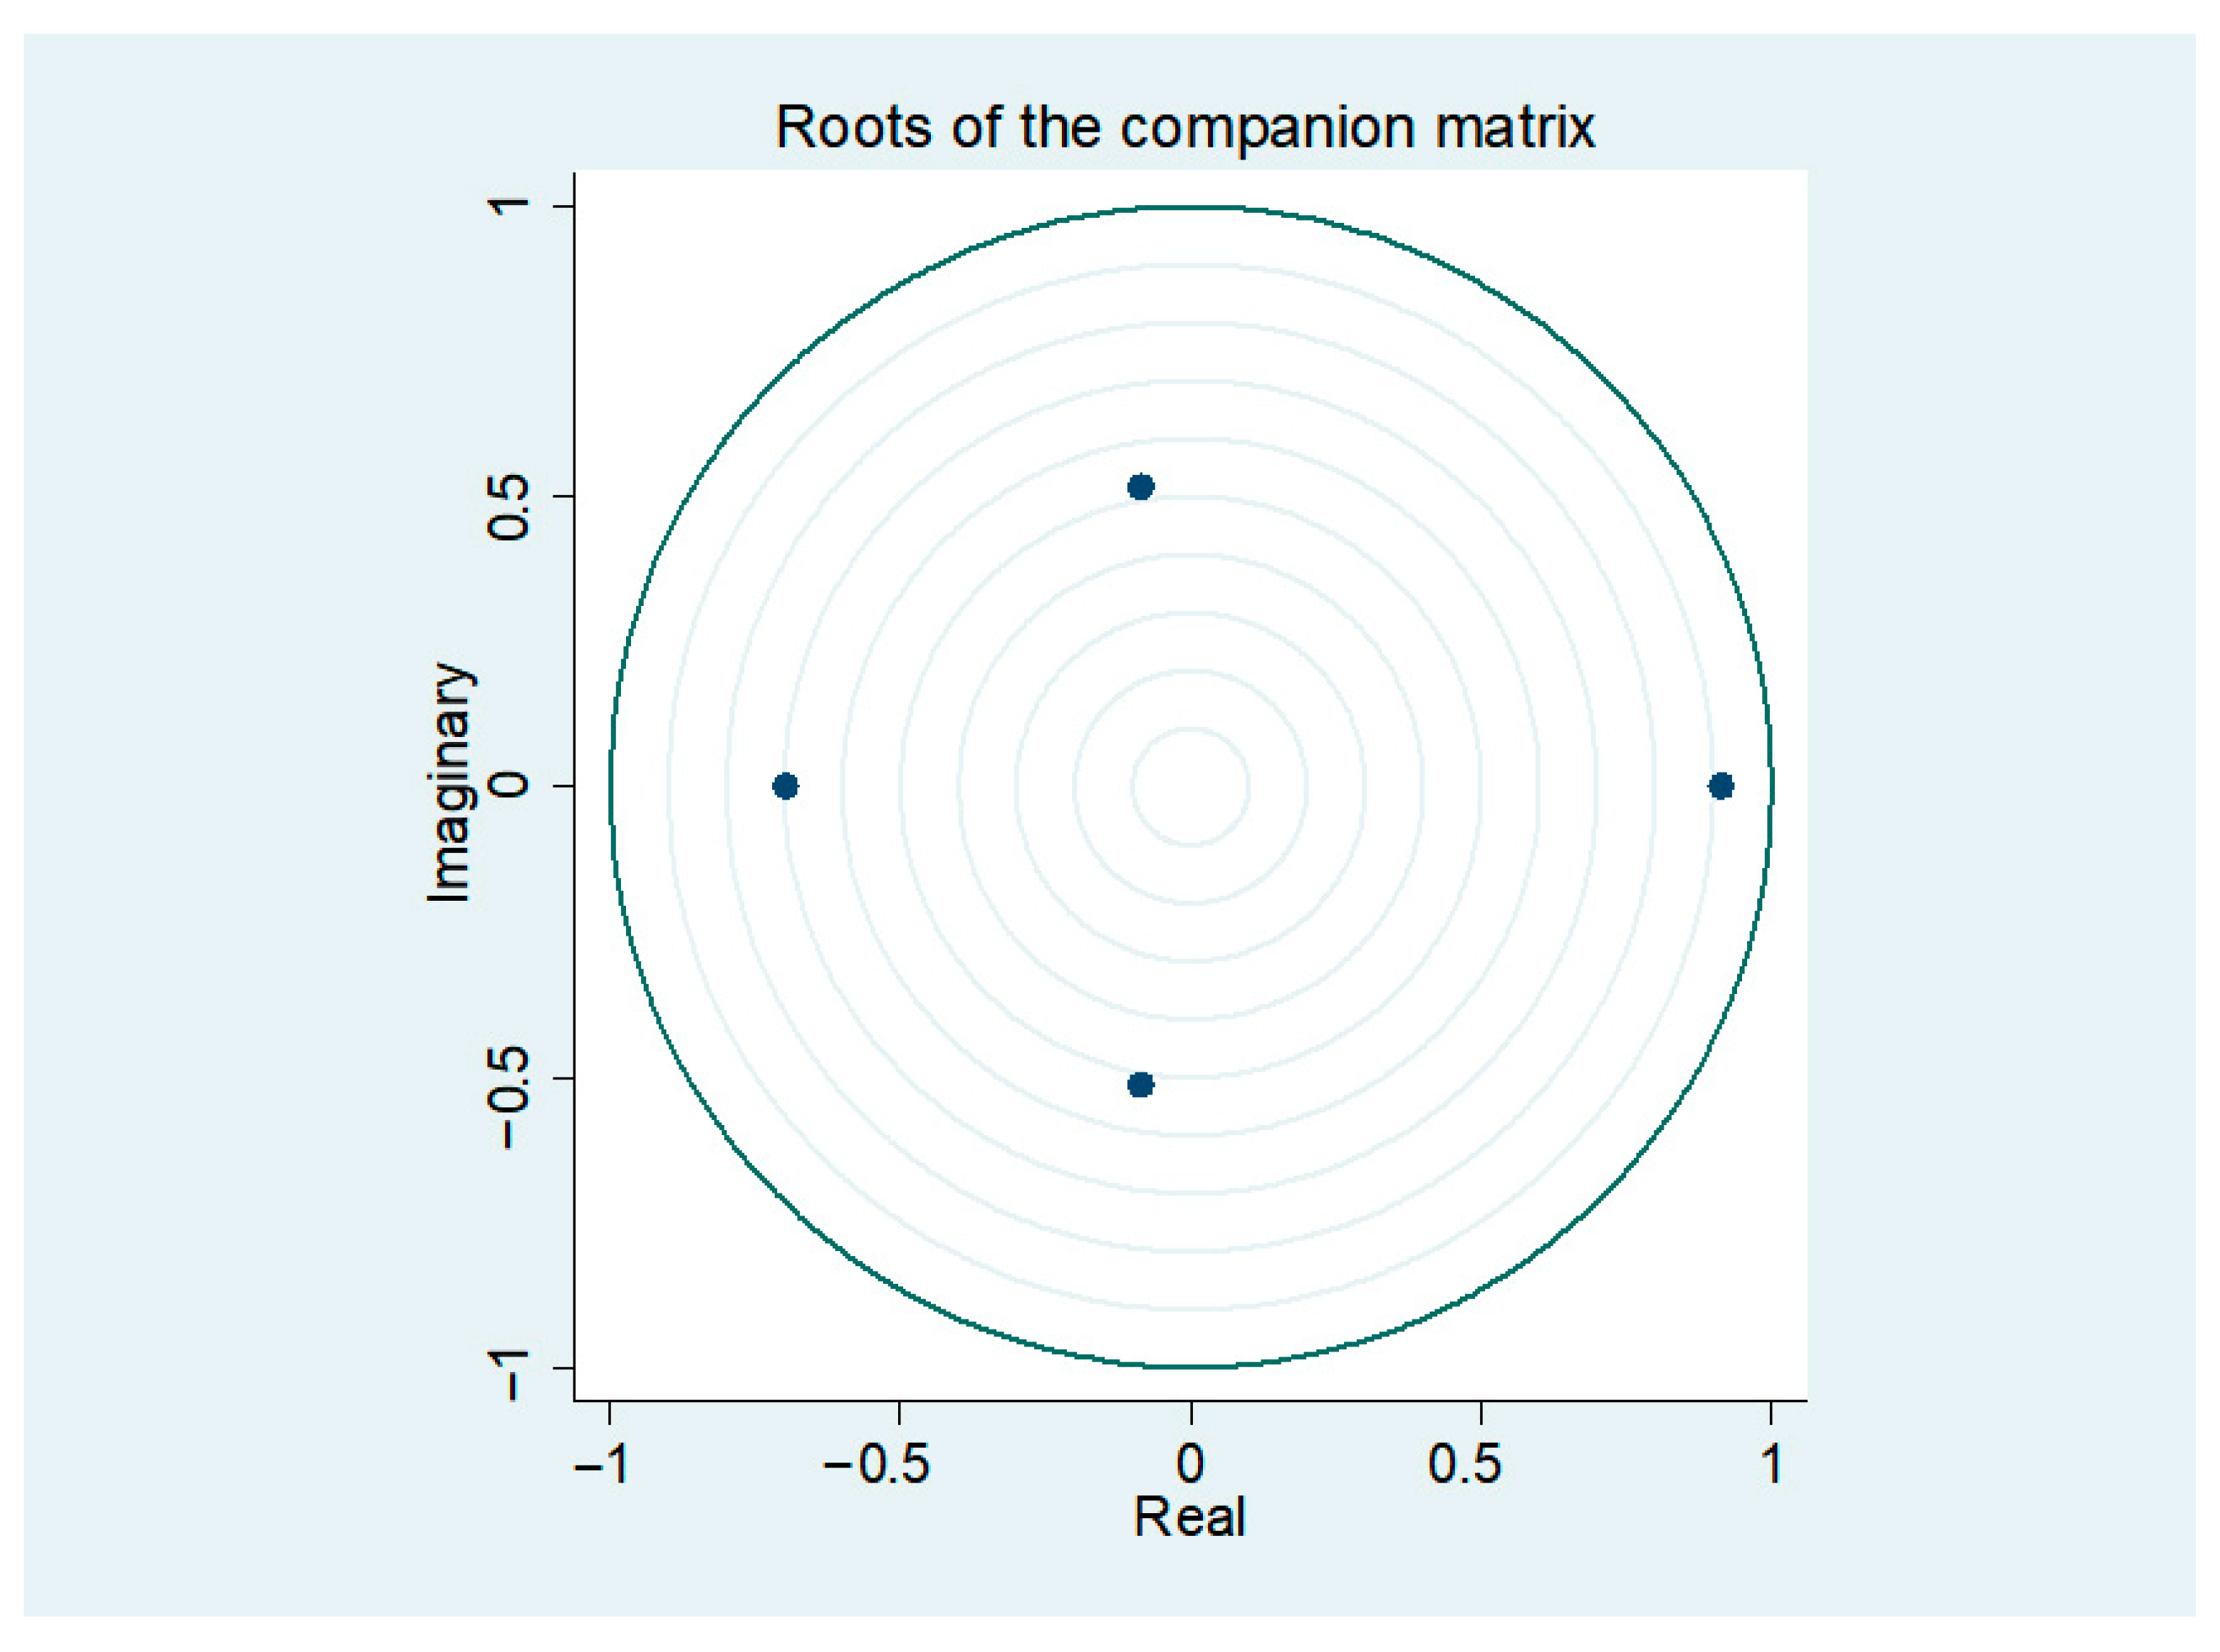
The reliability of the obtained results is confirmed by checking the model for normality, autocorrelation and stability using the Lagrange multiplier test and the Jarquet-Bere test. The results shown in
Figure 4 and in
Appendix B do not allow us to unequivocally state the stability of the constructed model and the high level of reliability of the conclusions drawn, since for cluster 4 not all eigenvalues lie inside the unit circle, and for cluster 3—one value is found near the edge of the circle.
To verify the reliability of the obtained results, we analyze the relationship between indicators using fixed- and random-effects models. At the initial stage, we calculate the regression coefficients using a regression model with fixed effects. The results of the calculations (
Table 11) show that the model with fixed effects is not suitable for describing these dependencies. For most indicators, the p-level value exceeds 0.01, which indicates a low level of statistical significance of the obtained results.
At the next stage, we analyze the relationship between the Smart City Governance Index and indicators characterizing the social (HDIcity), economic (GNI per capita), political (DemI) and information technology (DQL) development of smart cities using a model with random individual effects. The calculation results (
Table 12) with a high level of statistical significance confirm the feasibility of using this model to formalize the relationship between the analyzed indicators. For all analyzed indicators,
p-level > 0.01, which allows us to accept the main hypothesis that this model best formalizes the relationship between indicators.
The results of the Hausman test calculation confirm the previous results that the model with fixed effects is not suitable for formulating the relationship between indicators. Thus, the data presented in
Table 8 show that the Human Development Index and Digital Quality of Life Index have the greatest impact on Smart City Governance Index, while GNI per capita has practically no effect on the effectiveness of smart city management.
4. Discussion
The obtained results of the study of the key factors of e-government showed the difference between the general results and the difference of the decisive influencing factor for each formed cluster.
According to the results of VAR/VEC modeling, the formed hypotheses were refuted completely or were not confirmed for certain clusters. In particular, the first hypothesis, that a higher level of economic development has a strong positive influence on the development of e-government, was completely rejected. The presence of a relationship between these parameters was not confirmed for any cluster. Other hypotheses were rejected only for some clusters.
For the first cluster, all hypotheses were rejected, except for the second—regarding the presence of a strong direct impact of ICT development on e-government. For this cluster, the greatest relationship was found between the Smart City Governance Index and the Human Development Index; however, the nature of the HDI’s influence on the resulting indicator turned out to be negative.
The composition of the first cluster is very heterogeneous, but geographically, it mainly includes cities in Asia and the Pacific region. These cities do not belong to the countries of high economic development and democratic freedoms, but they have taken a course for an active transition to a smart economy with an emphasis on digital technologies. Furthermore, this region is characterized by a high level of digital and economic inequality, which is why part of the population is generally excluded from e-government processes [
21]. Thus, the highest values of the Smart City Governance Index of this cluster are explained by the ICT development factor and actually contradict the real values of the Human Development Index and the Democracy Index.
For the second cluster, a direct relationship was obtained between the Smart City Governance Index and the Human Development Index and the Democracy Index; however, the influence of the Democracy Index on the resulting indicator is low. The second cluster is formed mainly from the countries of the European region, which are close in terms of the level of economic development and digitalization. Studies show that in the smart cities of this region, despite formally developed electronic governance, the real participation of citizens is not high [
71].
For smart cities of the third and fourth clusters, a strong influence on the Smart City Governance Index of social and information technology factors (HDI and DQL Index, respectively) was confirmed. For the fourth cluster, which includes the majority of smart cities with the lowest level of economic development and democracy, a political factor (Democracy Index) is also added to the list of influential factors.
The Smart City Governance Index assessment method used in the article has some limitations. First of all, the Smart City Index chosen as a basis in itself is not unified and universal, and its calculation already has inherent shortcomings related to the possible failure to take into account all aspects of governance.
The Smart City Index examines e-government from the perspective of the quality of the user experience, that is, from the perspective of one group of stakeholders—citizens. Thus, e-governance in this study, as well as in the Smart City Index, is considered one-sidedly—from the position of citizens. This is not a significant drawback. After all, the majority of studies in this direction also consider this aspect and define it as the main criterion [
72]. However, Waladali et el. [
73] considered e-government from the position of civil servants. This aspect is less important when evaluating e-government, but the lack of such evaluation in the proposed approach can be considered a limitation of the model.
In the article, we tried to objectively take into account various characteristics of smart cities and analyze the level of electronic governance depending on economic, social, political and other parameters. Most of the existing studies consider e-governance in smart cities mainly from the point of view of the application of digital technologies. However, a number of studies confirm the importance of taking into account the influence of other factors, in particular, such as the level of education, the income level, the size of the city, the level of democracy, etc. [
63,
71,
74,
75,
76,
77,
78]. Thus, the value of this study and its novelty lies in the effort to analyze the relationships between the Smart City Governance Index and the relevant social, economic, political and information technology indicators. The results of the research can be useful for scientists, state and local government bodies in the management of digitization processes, the development of measures to improve the efficiency of e-governance.
At the same time, the limitation of this study is that the key factors were considered in general, i.e., for each factor one appropriate indicator was used (Democracy Index, Human Development Index, GNI per capita and Digital Quality of Life Index). Studies that focused on the analysis of 2–3 cities of one region or one country reveal many differences in their approaches to e-government, and, accordingly, different user experiences. It is practically impossible to take into account all possible influencing factors even within one cluster.
Smart cities included in the first cluster received very high results in the Smart City Governance Index calculation, but studies show that there is a large gap in income and education of residents in cities of this cluster [
21]. This leads to inequality of residents in opportunities to participate in e-government. This criterion was not taken into account in this study either. However, the digital divide and unequal access to digital administrative services are not the only concerns related to e-government. It is crucial to acknowledge the ethical considerations associated with digital technologies. The initial set of ethical concerns encompasses privacy, security and data protection. Establishing robust data protection and security measures is vital to building trust in digital government platforms. This matter holds greater significance in the realm of e-government for two primary reasons. Firstly, unlike the private sector, citizens have no alternative options for accessing public services. Secondly, considering the extensive and sensitive nature of government-held data, any breach or misuse of this information could lead to significantly graver consequences.
The second set of ethical issues revolves around transparency, data openness and accountability in government structures. E-government serves to achieve these objectives. By implementing electronic systems for public procurement, transparent budgeting practices, and open reporting of government agency data, it becomes possible to mitigate corruption. However, there is a potential conflict between data openness and the need to protect personal information. Prospects for future research include expanding the list of factors that can be used to analyze key factors in the development of smart city governance, including other stakeholders in the assessment, and taking into account equal access to e-governance for residents of one smart city, that is, what determines the sustainability of smart cities and not just the use of digital technologies.


