Article

European Union Smart Mobility–Aspects Connected with Bike Road System’s Extension and Dissemination

by
Radosław Wolniak
Faculty of Organization and Management, Silesian University of Technology, 44-100 Gliwice, Poland
Smart Cities 2023, 6(2), 1009-1042; https://doi.org/10.3390/smartcities6020049
Submission received: 2 February 2023 / Revised: 7 March 2023 / Accepted: 16 March 2023 / Published: 18 March 2023

Abstract

:
The analysis of scientific research described in peer-reviewed journals demonstrates the significance of bicycle road networks in relation to smart mobility. This research was conducted for European Union cities that meet the criteria of having a developed bicycle route network and are ranked among the top 100 European bicycle-friendliest cities in 2021. The study also analyzed whether each city was on national or international lists of smart cities or had smart city initiatives. The study indicates that a comprehensive and well-developed network of bicycle paths is a crucial element in the development of smart mobility solutions within a modern smart city. Among EU countries, cities in northern and central Europe, particularly in Germany, Sweden, Finland, Denmark, and the Netherlands, have the best-developed bicycle networks. The research on the correlation between the average temperature level in a country and the average values for smart city bike lanes showed a statistically significant negative correlation between the two variables. The lower a country’s average annual temperature, the more that a bicycle infrastructure is present in its smart cities, as measured by the length of bicycle paths and the saturation of the city with bicycle paths per square kilometer and per 1000 residents. After removing outliers (Finland, Ireland, and Luxembourg), a significant relationship was observed between the wealth of a country and the length and density of bicycle paths in smart cities. The linear correlation coefficient between the length of bicycle roads and GDP per capita was found to be −0.73, which is a high coefficient value.

1. Introduction

Today, many cities are implementing smart mobility solutions into their important activities. Smart mobility refers to the use of technology and data to enhance the efficiency, sustainability, and accessibility of transportation systems. It encompasses a wide range of transportation modes, including cars, bikes, buses, trains, and more. The aim of smart mobility solutions is to optimize the use of existing transportation infrastructure, reduce congestion and emissions, improve safety and accessibility, and enhance the overall mobility experience for users [1,2,3,4]. These solutions often involve the use of sensors, data analytics, and advanced technologies such as Artificial Intelligence, the Internet of Things (IoT), and 5G networks. The ultimate goal of smart mobility is to create transportation systems that are more efficient, sustainable, and accessible, resulting in an improved quality of life for people in cities.
The literature reviewed indicates that the bike road system is an integral part of smart mobility [5]. The number of bike roads can serve as a technical infrastructure indicator to measure the potential of smart mobility. This study, which analyzes the development of bike roads in specific provinces of Poland, contributes to the understanding of smart cities in the realm of smart mobility [6,7,8].
The literature reviewed demonstrates the significance of the bicycle road network regarding smart mobility. The extent of bicycle road infrastructure can be utilized as a technical infrastructure metric to gauge the smart mobility system’s capacity. Hence, the examination of the evolution of bicycle roads in selected provinces of Poland, presented in this study, adds to the existing knowledge base on smart mobility within the context of smart cities.
An analysis of the Scopus and Web of scientific publications and research connected with smart mobility smart bikes and the usage of bikes in smart cities allowed for us to conclude that there is a research gap connected with the widespread of bike road systems in European union smart cities. The authors point out that bike road systems and bike sharing are important from a smart city point of view [5,6,7,8,9,10,11], but they did not try to analyze the state of the bike roads on the European Union level.
Based on the identified research gap, in the presented papers, the following research objectives were set:
  • C1: To investigate what are the differences in bicycle road systems between smart cities in European Union Countries.
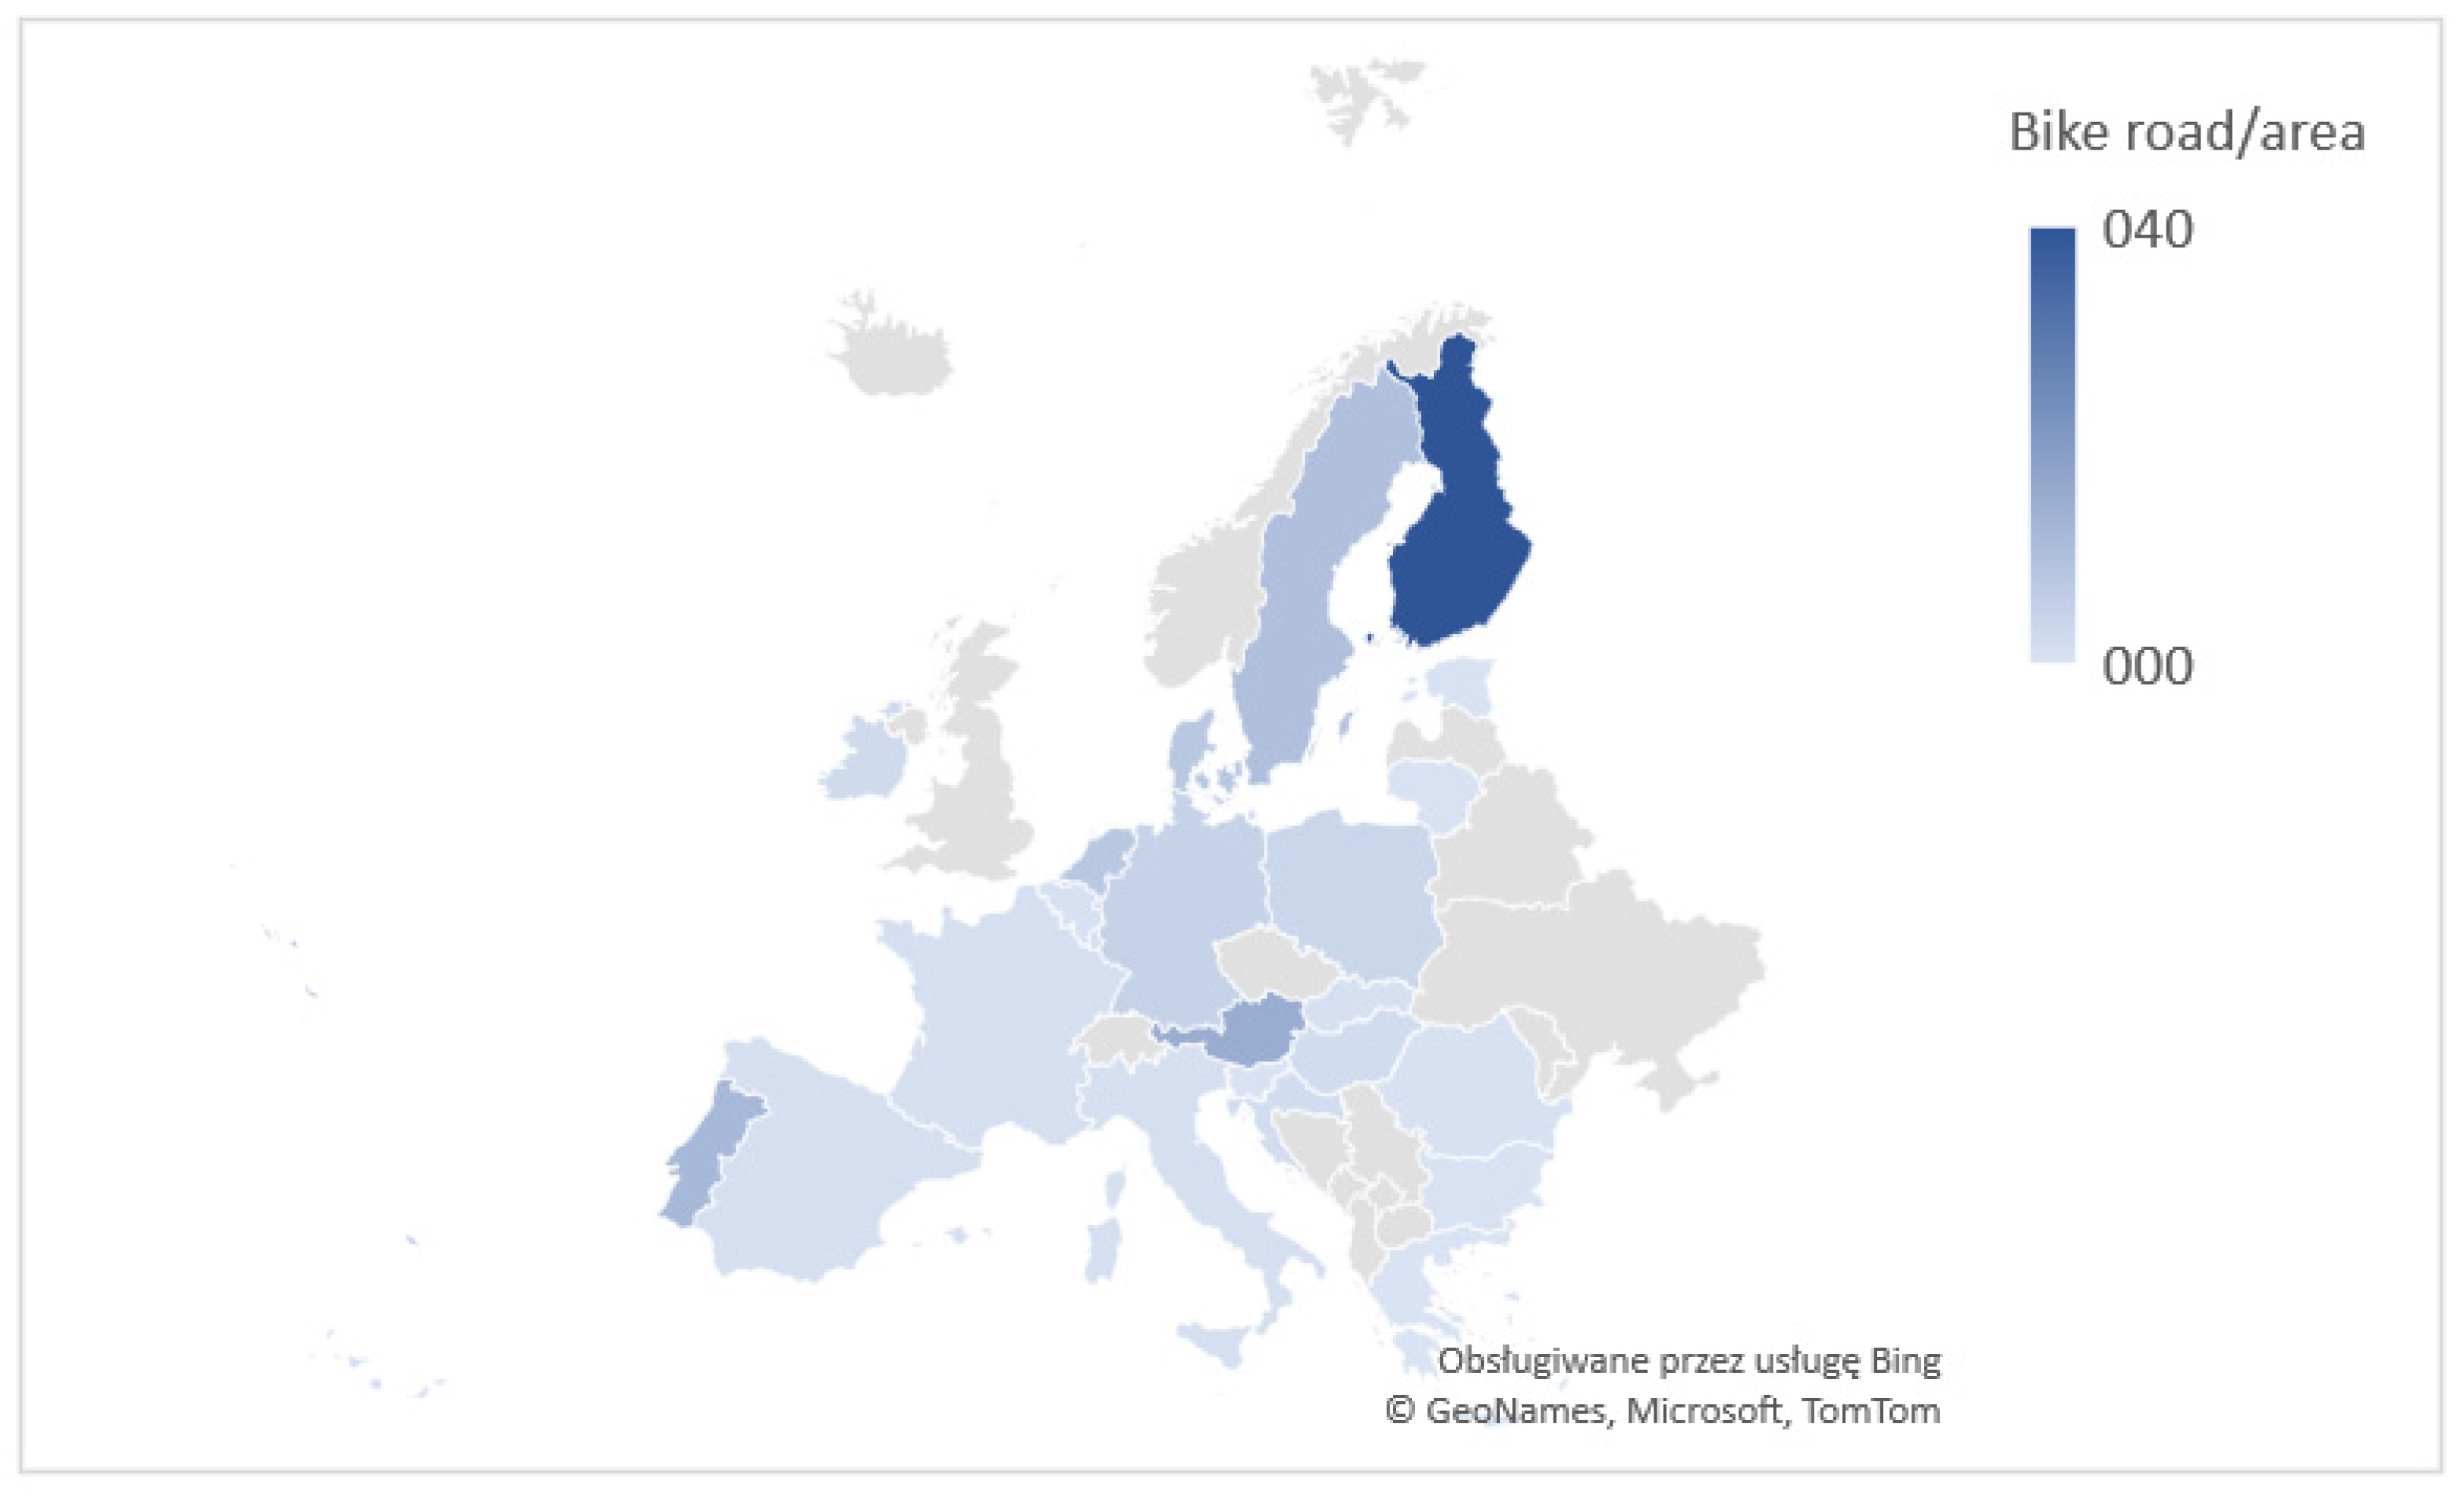
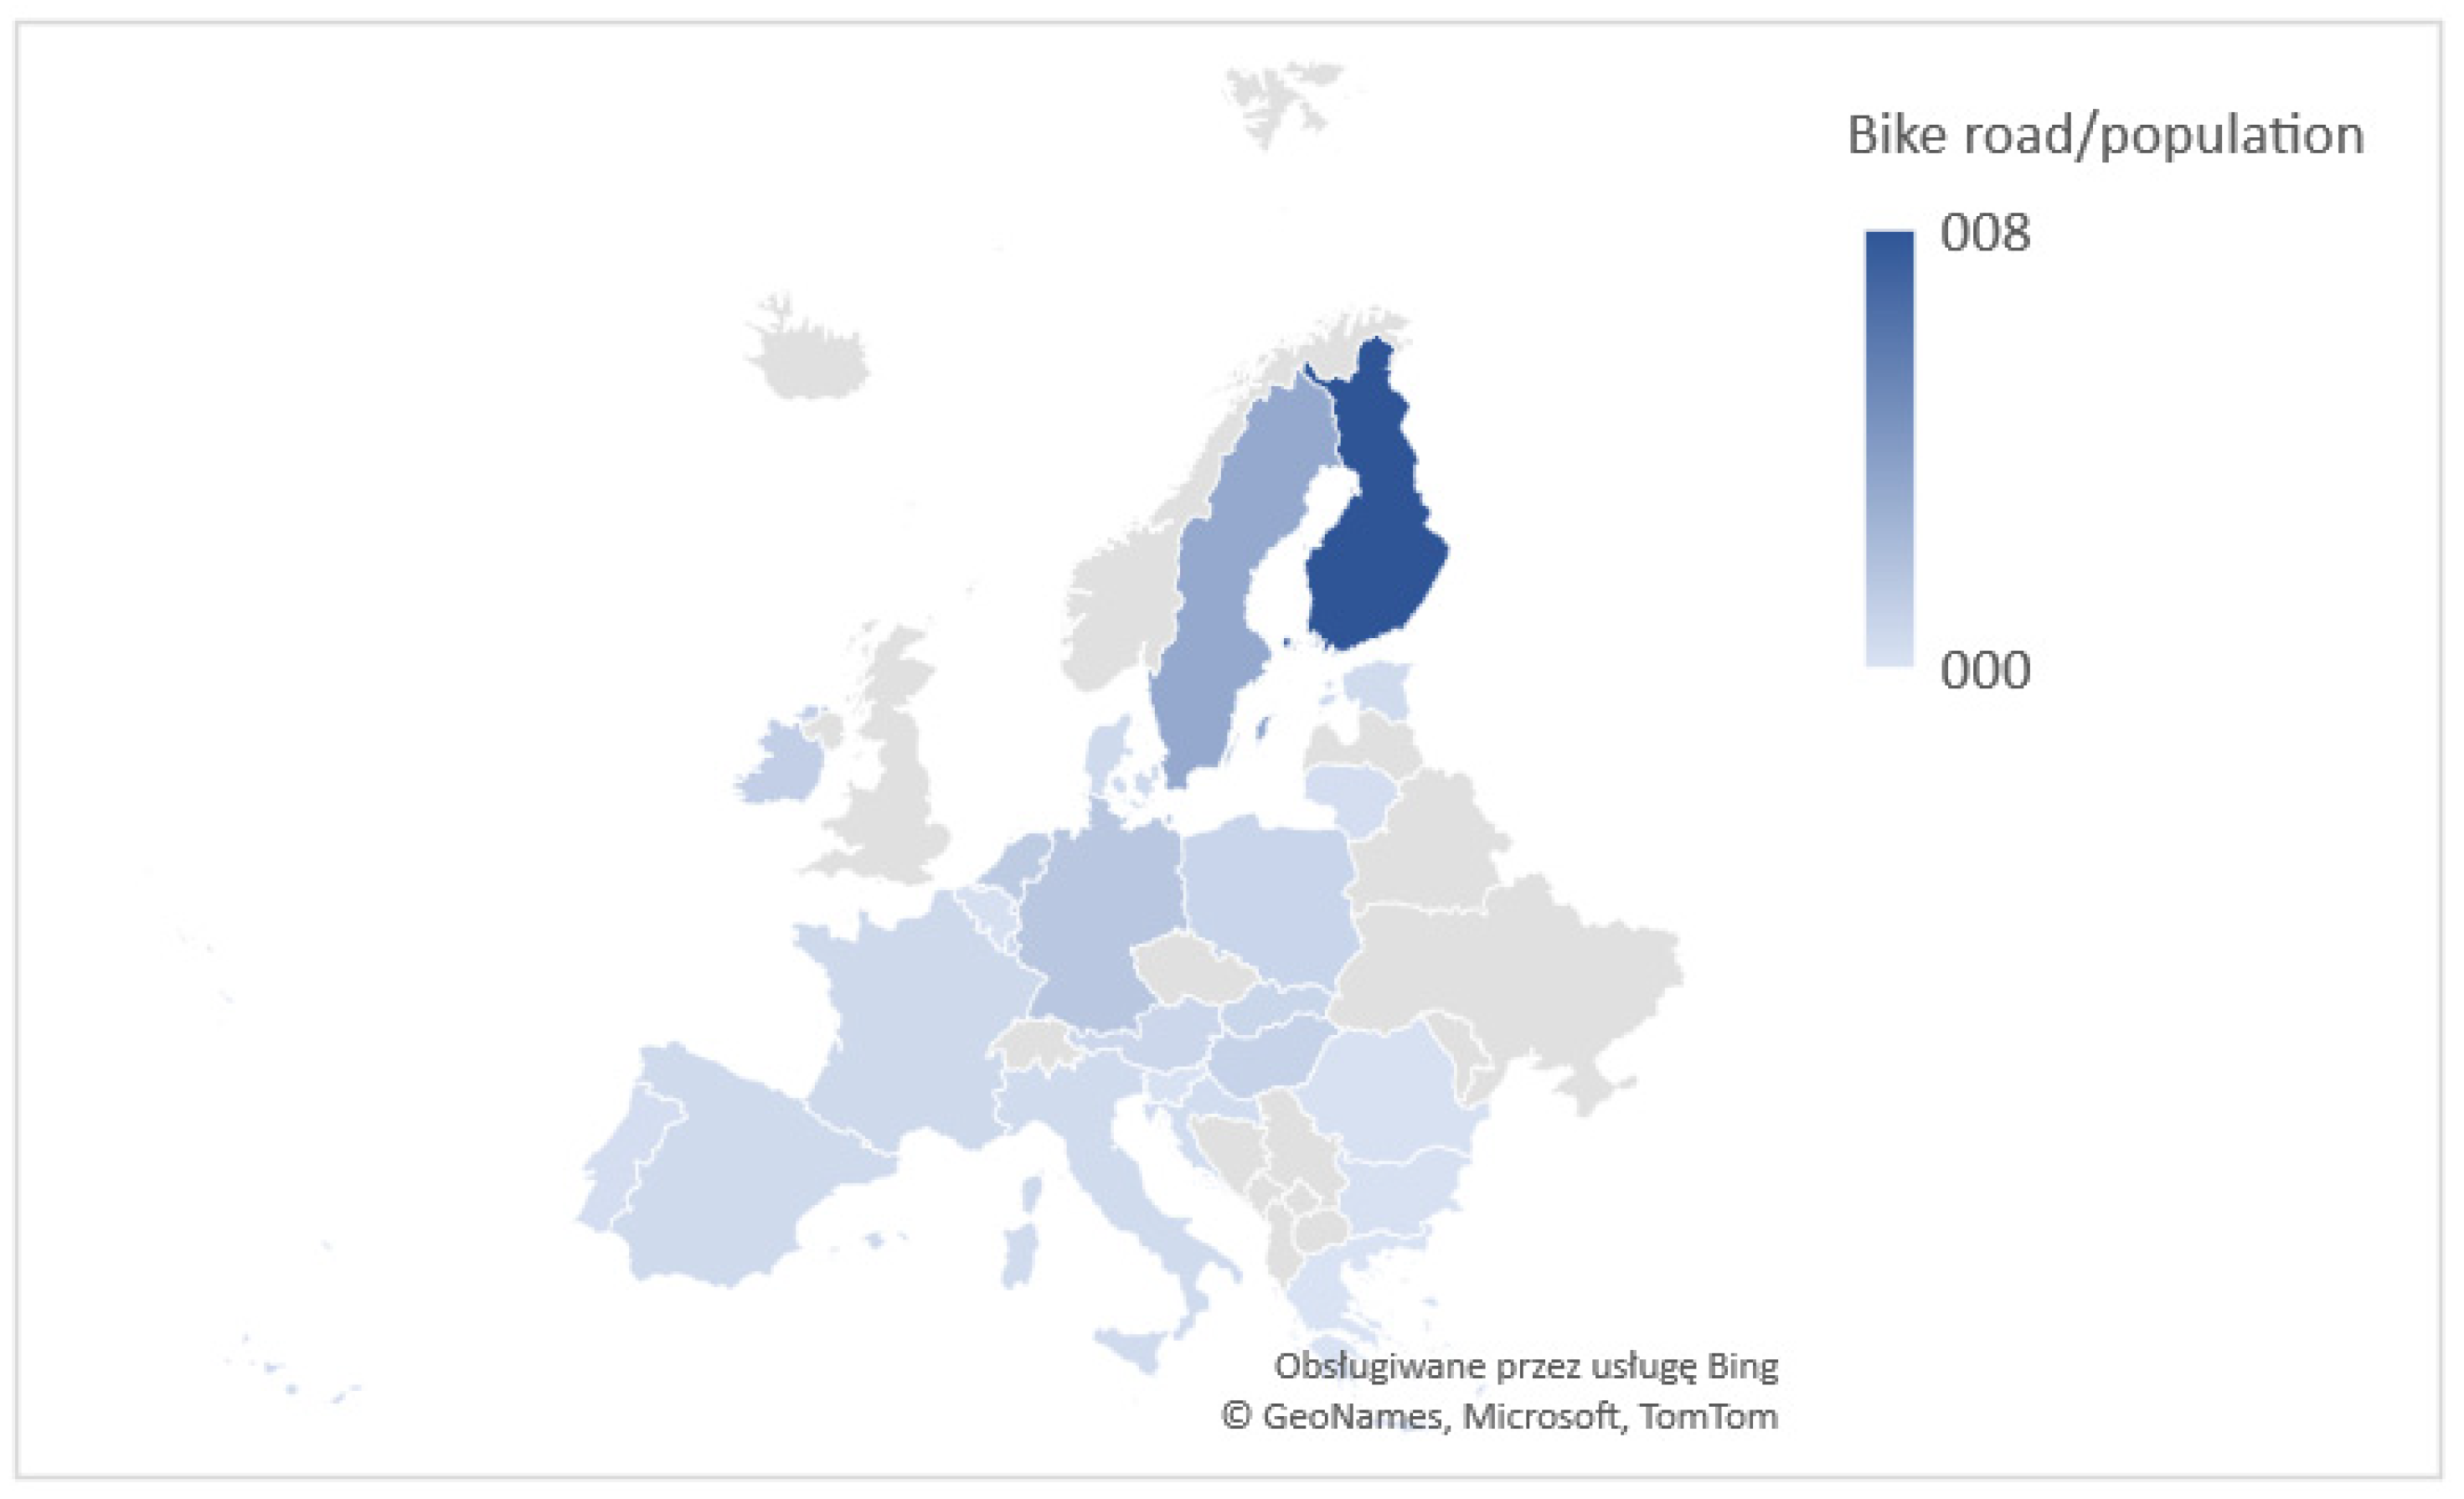
  • C2: To investigate the amount of bicycle roads per 1 km2 and 1000 citizens in European Union countries’ smart cities.
  • C3: To investigate whether the dissemination of smart city bicycle road systems in European Union countries is correlated with the average temperature of the country.
  • C4. To investigate whether the dissemination of smart city bicycle road systems in European Union countries is correlated with the GPD per capita of the country.
  • To realize those goals, the following scientific hypothesis were formulated:
  • H1. The average length of a bicycle path in smart cities is correlated with the average temperature of the country.
  • H2. The average length of a bicycle path in smart cities per 100 inhabitants is correlated with the average temperature of the country.
  • H3. The average length of a bicycle path in smart cities per 1 km2 is correlated with the average temperature of the country.
  • H4. The average length of a bicycle path in smart cities is correlated with the GPD per capita of the country.
The paper consists of the following chapters: literature review, methodology, results, discussion, and conclusion. In the literature review, there is an analysis of the background of the paper based on scientific papers from good international journals especially noted in the Scopus database. The next chapter describes the methodological aspect of the paper; in this chapter, there is a description of the data analyzed in the paper and the way that the indicators are calculated in the analysis. The next chapter presents the results of the analysis: the value of the main indicators with their description and with maps presenting indicators among European Union countries. In the discussion chapter, there is a presentation of scatter plots and correlation analysis between indicators, with an analysis of the results and points of views from other papers. The last chapter—the conclusion—recapitulates all of the results of the paper and provides information on the importance of the results and their limitations.

2. Literature Review

A smart city can be described as a modern and efficient city that is shaped by six key areas and is based on the active involvement of informed, independent, and decisive citizens [12,13,14]. This concept is distinct from earlier models of sustainable development, as it places a distinct emphasis on “mobility” as a crucial aspect that determines communication accessibility, ICT infrastructure, and innovative and safe transportation systems [15,16,17,18]. Smart cities are developing due to the intelligent utilization of digital information in various fields such as healthcare, mobility, energy consumption, education, knowledge transfer, and urban management [19,20].
A smart city can be defined as a well-functioning forward-looking city created by the above six areas and based on the active participation of informed, independent, and decisive citizens [12,13,21]. The essential element distinguishing this concept from previous models of sustainable development is the presence of “mobility” as a separate, important dimension defining communication accessibility, ICT infrastructure, and innovative and safe transportation systems [22]. Smart cities are emerging because of the intelligent use of digital information in areas such as health care, mobility, and energy consumption, based on papers [23,24] with meta-analyses on smart city concepts. It can be said that although there is no unanimous agreement on the dimensions of smart city concepts, there is a certain level of the accord, which can include concepts such as: “community”, “governance”, and “technologies”. Additionally, it is worth mentioning that the continuous advancement in digital technologies has disrupted conventional business models in various sectors, allowing for the creation of new products and services. However, even though the reorganization of procedures and the development of new models aim to add value for customers, all signs indicate that the integration of product services in networked smart cities is not as effective as desired. This issue could even be utilized by policymakers to encourage public investment in creating strategies for building network structures. Regarding the sustainability of smart cities (third topic), the focus should not only be on economic growth and territorial expansion, but rather on a sustainable development approach that seeks to balance ecosystems and enhance the quality of life for citizens [24,25]. The literature on the smart city concept indicates a consensus on the primary characteristics of smart cities, which include: sustainability, advanced ICT technology, high-tech governance, citizen participation, an innovative and highly skilled society, and a knowledge-based economy. A smart city should cultivate a society that values innovation and has the skills needed to develop a knowledge-based economy while utilizing advanced ICT technologies to promote sustainability and participatory urban governance [24].
The main features of a smart city typically include [25,26,27,28,29]:
  • The sustainable and efficient use of resources such as energy, water, and transportation;
  • High-quality and accessible public services and infrastructure;
  • A robust and integrated Information and Communication Technology (ICT) infrastructure;
  • Active citizen engagement and participation;
  • Innovative solutions for urban challenges and continuous improvement;
  • A safe and secure living environment;
  • Data-driven decision-making and management;
  • The integration of various urban systems such as transportation, healthcare, education, and energy.
The use of modern methods of intelligent transportation can benefit city residents and contribute to an increase in their quality of life. The main beneficial methods of pro-ecological transportation in a smart city can be electric cars and bikes [30]. The future of transportation systems is a causing concern due to the scarcity, expensive cost, and environmental damage caused by fuel-based vehicles. The implementation of electric vehicles is seen as a possible solution to address these issues, and it could pave the way for significant advancements in connected and automated transportation systems [31].
In particular, the widespread use of the bicycle as a means of transportation can contribute to an increase in residents’ quality of life [32,33,34]. Additionally, cycling is a form of exercise that can help improve cardiovascular health, reduce stress and anxiety, and increase overall physical fitness. Cycling is important for air quality. It does not emit pollutants, helping to improve air quality and reduce exposure to harmful substances, especially in cities. Cycling can help reduce noise pollution and promote a more active, livable, and sustainable urban environment. Cycling reduces the number of cars on the road, leading to less congestion and improved traffic flow. Widespread bicycle use can provide affordable transportation options for people who cannot afford cars or public transportation, improving accessibility and mobility for all [35,36,37].
It can be observed in the literature that biking is one of the factors which is connected with quality of life in a smart city [4,38]. The rising amount of bike usage is observed in many cities in European Union countries [39]. The smart city concept consists of six main areas—one of them is so-called smart mobility [40,41,42]. For example, Namiot, in his paper, points out that bicycles and their usage is an important element of smart mobility system’s implementation in the city [43,44].
The integration of bike usage as a crucial aspect in smart city models demonstrates its significance in modern, smart cities. For instance, the authors of smart mobility indicators, Orłowski and Romanowska [45], include biking as one of the indicators used in their analysis. Similarly, the other authors of a smart mobility solutions analysis, view bike usage and bike-sharing systems as key components of the smart mobility concept [46]. A report from Deloitte highlights the importance of bike commuting in smart mobility and suggests that investing in bike infrastructure, improving smart biking systems, and promoting bike-sharing programs are essential for enhancing smart mobility in cities.
In another paper about smart mobility in smart cities [47], the authors also use traveling by bike as one of the factors of smart mobility. They also use bicycle routes as one of the sub-indicators in technical infrastructure indicators in their concept of smart mobility measurement.
A city without an extensive system of bike roads cannot be smart because it cannot use new concepts of bike sharing and other smart solutions. A bike-sharing system is a service in which bikes are available for individual users to share on a very short-term basis. In the newfangled bike-sharing solution, there is a special smartphone application to monitor the system. Those bike-sharing systems can be also very beneficial for cities [48]. The extensive bike road system is the first step to building bike-sharing facilities. After there are enough bike lanes in particular area, the local authorities can start to build a system of bike sharing [49].
In another study on smart mobility in smart cities, the authors also consider biking as a factor in their smart mobility analysis. They include bicycle routes as one of the sub-indicators in their technical infrastructure indicators [6,7,50]. A city lacking a robust bike road system cannot be considered a smart city, as it cannot implement new concepts such as bike sharing and other smart solutions. Bike-sharing systems, where bikes can be used for short-term sharing, can be monitored through smartphone applications. These systems can also bring benefits to cities [8,9]. The creation of a comprehensive bike road system is crucial for establishing bike-sharing facilities. Once there are enough bike lanes in a particular area, local authorities can implement bike-sharing systems [10,11].
Bicycles are important in smart cities because they offer numerous benefits such as [51,52,53]:
  • Improved health and wellness: Biking is a great form of physical activity that can improve health and wellness.
  • Reduced traffic congestion: Biking can reduce traffic congestion, leading to smoother and faster commutes.
  • Lower carbon footprint: Biking produces no emissions, making it an environmentally friendly mode of transportation.
  • Cost savings: Biking eliminates the need for fuel and maintenance costs, making it a cost-effective mode of transportation.
  • Increased mobility: Biking provides a flexible and convenient mode of transportation, especially in densely populated areas.
  • Improved air quality: Biking reduces air pollution, leading to cleaner air and better public health.
    Enhanced public safety: Biking creates a safer environment by reducing the number of cars on the road and reducing the risk of accidents.
  • Increased social interaction: Biking promotes social interaction and community engagement, as it encourages people to get out and interact with others.
  • Improved access to services and amenities: Biking provides improved access to services and amenities, making it easier for people to get around and access what they need.
  • Promotes sustainability: Biking promotes sustainability by reducing carbon emissions, conserving energy, and reducing the demand for non-renewable resources.
Overall, bicycles can play a crucial role in creating smart, sustainable, and livable cities.
Of course, biking in smart cities can also have many problems and disadvantages. Main important of them are [51,52,53]:
  • A lack of infrastructure: in some cities, there may be a lack of proper bike lanes, bike parking, and other infrastructure that is necessary for safe and convenient bike usage.
  • Weather conditions: depending on the location, weather conditions such as rain, snow, and extreme heat can make bike usage difficult and unpleasant for riders.
  • Theft and security concerns: bikes are often easier to steal than cars, which can be a concern for riders who leave their bikes parked in public places.
  • Physical exertion: cycling can be physically demanding and may not be suitable for everyone, especially those with health problems or disabilities.
  • Cost: although bikes are generally less expensive than cars, they still require an initial investment, maintenance, and replacement costs.
  • Limited carrying capacity: bikes are often limited in terms of the amount of cargo they can carry, which can be a problem for people who need to transport large items or heavy equipment.
  • Safety concerns: riding a bike on busy roads and intersections can be dangerous, and the risk of accidents is higher for cyclists than for drivers.
  • Inconvenience: cycling may be time-consuming and less convenient than driving, especially for longer trips and errands.
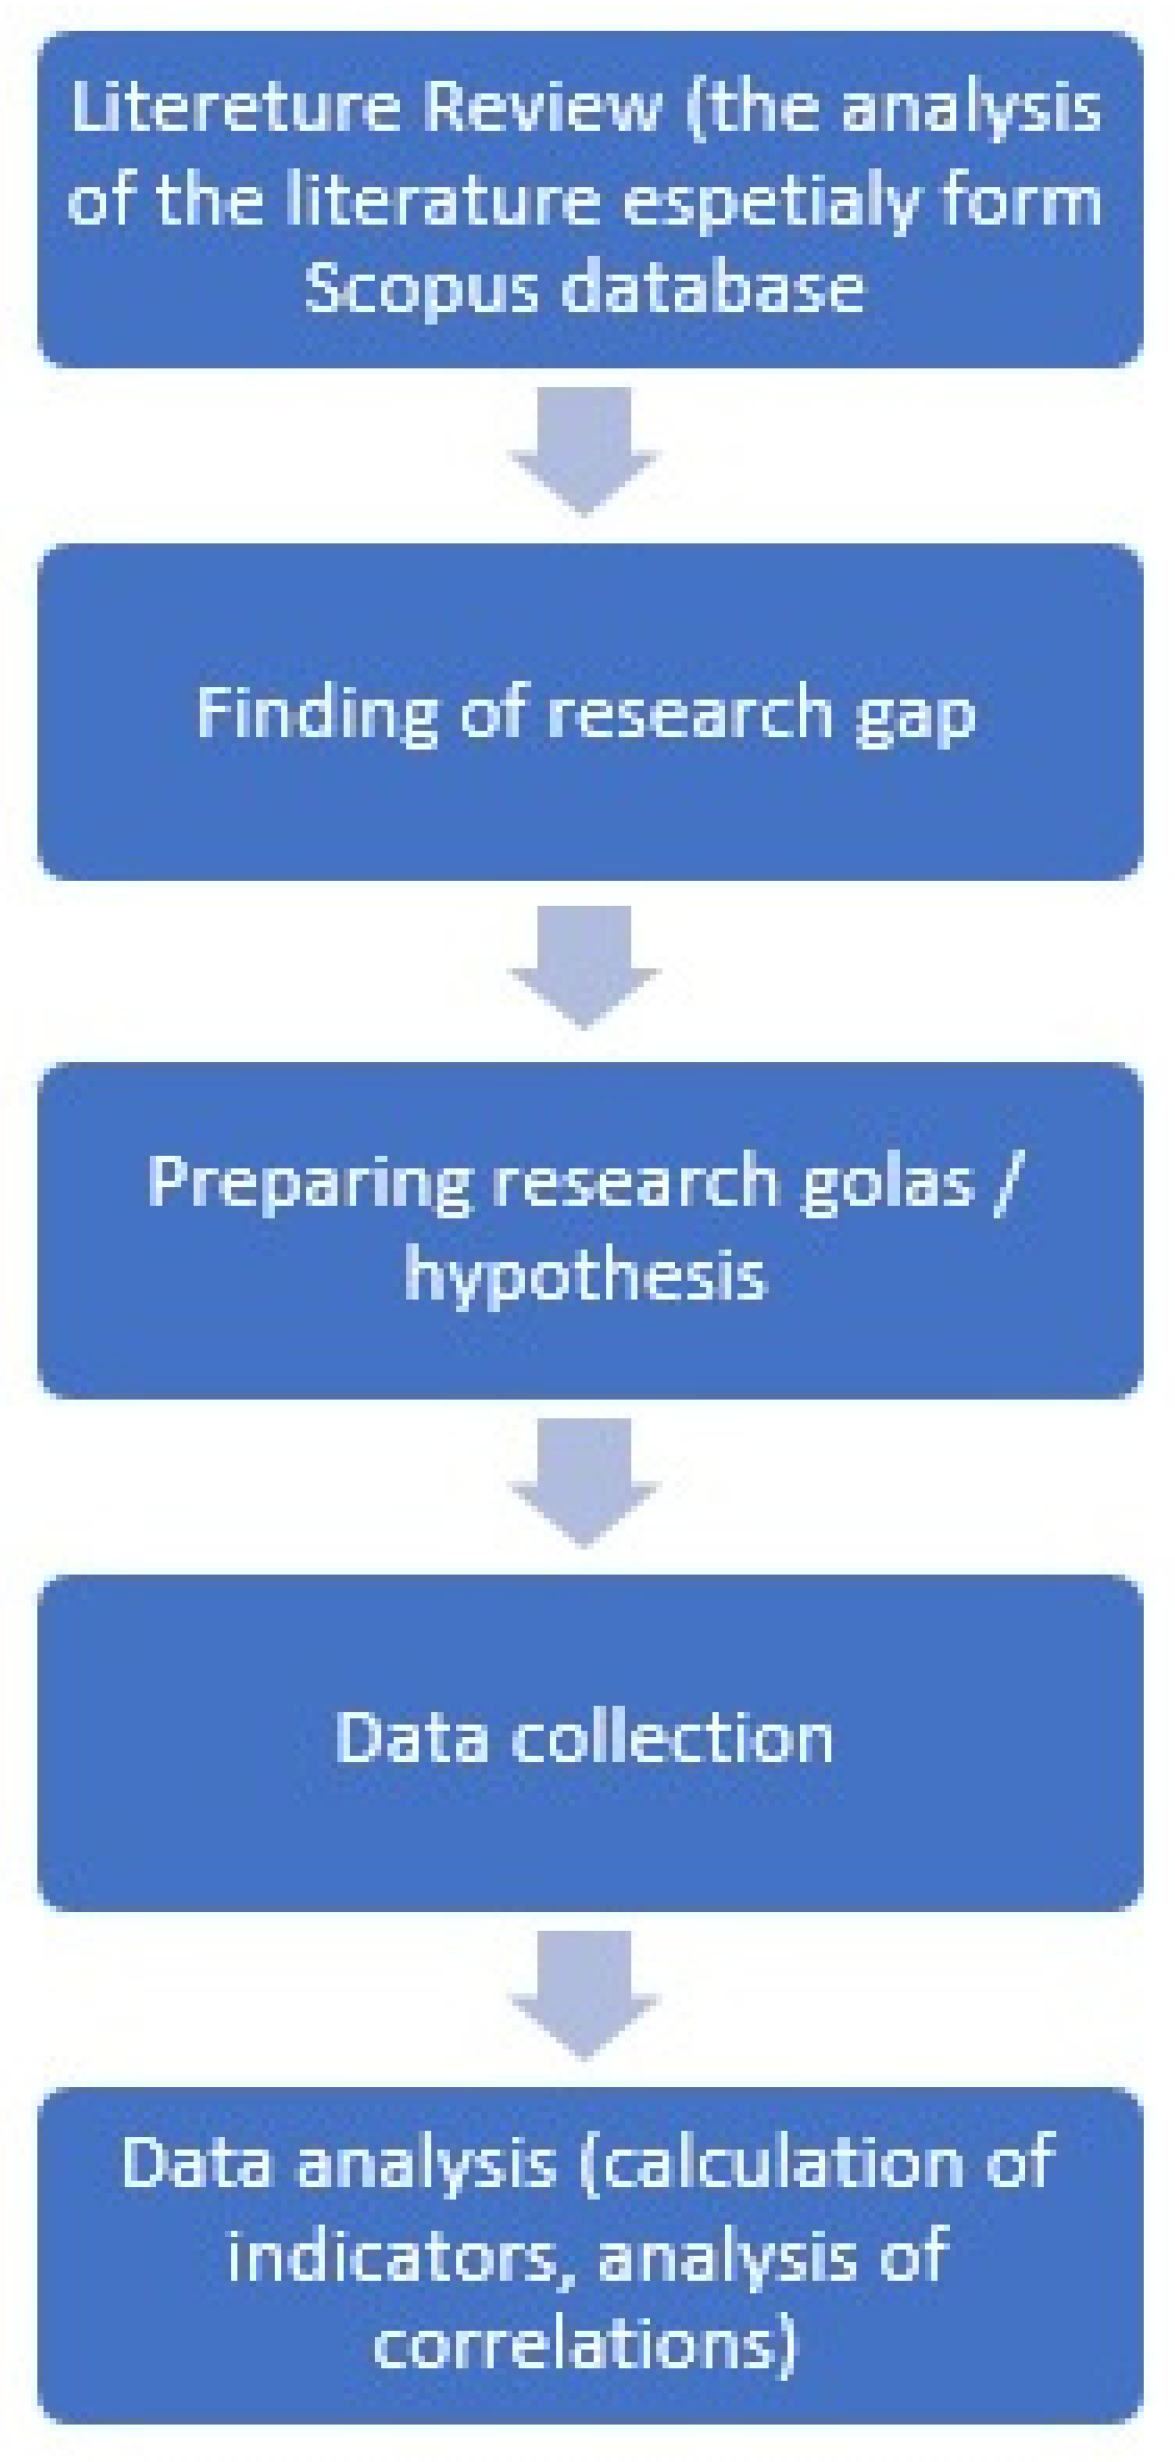
The transformation of cities into smart cities with increased bike usage is driven by environmental problems caused by overreliance on traditional modes of transportation [54,55]. Climate change and pollution are major global and European concerns, and making cities safe, resilient, and inclusive is one of the key goals of the Agenda for Sustainable Development, which includes mobility as a crucial aspect [56,57].
Smart mobility is an important component of modern smart cities and is necessary for Polish cities due to high levels of air pollution, long traffic congestion, and the high number of car accidents, which negatively affect the safety of residents [58]. A balanced approach that incorporates innovative technology and the needs of residents is essential for the successful implementation of smart mobility solutions. The goal is not to focus on innovation itself, but to integrate technology, systems, infrastructure, and capabilities to achieve maximum impact [59,60,61,62].
Cycling, scootering, and other alternative modes of transportation are crucial in advancing the concept of smart mobility. Commuting by bike or scooter offers the benefits of reducing traffic congestion and emissions and promoting physical fitness, as well as reducing greenhouse gases emitted by cars [63,64,65].
As cycling becomes more popular, cities will adopt technology and bike-sharing systems as part of their strategy to become smarter [66]. Many cities promote bike usage and bike-sharing among citizens, and incorporate bike-related eco-friendly solutions [67,68].
The pro-environmental impact of smart mobility is a crucial aspect of creating sustainable and livable cities. Smart mobility refers to the integration of digital technology and data analysis to optimize and improve transportation systems. It is designed to create more efficient, accessible, and sustainable forms of mobility that reduce traffic congestion, air pollution, and carbon emissions [69,70,71,72,73,74].
The environmental impact of traditional transportation systems, particularly cars and trucks, is well documented. Automobiles are major contributors to air pollution, including carbon dioxide, nitrogen oxides, and particulate matter. The emissions from cars and trucks are a significant source of greenhouse gases, which contribute to climate change. Additionally, cars are a major source of noise pollution, which can negatively impact public health and the quality of life in cities [75,76].
Smart mobility solutions aim to reduce the negative environmental impact of traditional transportation systems. For example, the increased use of public transportation, cycling, and walking can reduce the number of cars on the road, leading to less traffic congestion, reduced air pollution, and lower carbon emissions. The use of electric vehicles and clean fuels can also help reduce the carbon footprint of transportation systems [77,78].
Because of the very important pro-environmental impact of smart mobility and biking, the cities need to extend their bike road system to be better prepared for new smart mobility solutions.

3. Methodology

The introduction of this publication outlines the primary objectives of the research, which focuses on a specific aspect of smart mobility infrastructure—namely, biking infrastructure in smart cities. To analyze this infrastructure, appropriate indicators must be utilized. In this publication, the indicators presented by Wawre et al. [20] were employed, which categorized smart mobility indicators into various groups. Of these groups, one was defined as an indicator of technical infrastructure. In this study, these indicators were utilized specifically for the purpose of analyzing bicycle infrastructure, with a particular focus on the saturation of smart cities with bicycle paths. This served as the starting point for the discussions presented in this publication. By adapting the aforementioned concept to the subject matter being studied, a system of indicators was developed.
This publication was based on the following findings:
  • There is a lack of studies about baking infrastructure on the European Union level which can be used to compare cities and countries according to it.
  • There is a lack of analysis of statistical relations between the temperature and bike road systems in European Union countries.
  • There is a lack of statistical analysis about PKB per capita and the country’s development of bike road infrastructure.
  • There is a lack of analysis about the geographical dissemination of bike road infrastructure in the European Union and differences between particular countries.
The analysis presented in this publication was conducted for European Union cities that simultaneously meet the condition of having a developed bicycle route network and are among the top 100 European Cyclorank bicycle-friendliest cities in 2021 [79]. For each city, it was also analyzed whether the city is on national or international lists of smart cities or has smart city initiatives [80,81,82,83,84,85,86,87,88,89].
Of the top 100 cities according to the ranking in question, 83 are located within the European Union and can be considered smart cities. The 83 cities studied are located in 24 countries of the European Union. These cities were considered in the analyses pro-rated in the publication. Among the cities studied, 22 are located in Germany, 11 in Spain, 9 in Poland, 6 in France, 5 in Italy, 3 in Romania, 3 in Sweden, 3 in Bulgaria, and 2 in Denmark. The rest of the countries had one analyzed city: Austria, Belgium, Chechia, Croatia, Estonia, Finland, Greece, Hungary, Ireland, Lithuania, Luxembourg, the Netherlands, Portugal, Slovakia, and Slovenia. The list of the cities included in the study with the division in the countries is presented in Table 1.
To measure the relations between bike road systems and the temperature of the country, data about the average temperature in European Union countries were used [90].
In the analysis, there is a hypothesis about the relations between the bike road system and GPD per capita. The GPD per capita indicator was used because it can be seen as a good measure of the economic development of the country [85,86]. The value of the GPD per capita indicator was used according to World Economic Outlook Database [91].
The following indicators were used in the data analysis for each city studied:
B s c p I = B p I 1000
where:
BscpI—the length of bicycle paths in a smart city per 1000 inhabitants;
Bp—le;
I—the number of inhabitants in a smart city.
B s c p A = B p A
where:
BscpA—the length of bicycle paths per 1 km2 of an area;
Bp—the length of bicycle paths in a smart city;
A—the area of a smart city in km2.
B s c r = B p I 1000
where:
Bscr—the ratio of bicycle paths to total roads in a smart city;
Bp—the length of bicycle paths in a smart city;
I—the length of roads in a smart city.
The indicators were prepared according to the main rules which are useful about how to develop indicators in social sciences [92,93].
The concept behind this study involves the analysis of several indicators related to cycling, as well as one related to economic conditions and another related to weather. Among these indicators, GDP per capita is the most suitable for basic analysis as it reflects a country’s wealth and overall economic well-being. Countries with higher GDP per capita generally have more resources available for investing in infrastructure, including bike road systems. Furthermore, citizens of such countries are more likely to be able to afford to purchase bikes and use them as an alternative mode of transportation. GDP per capita is a comprehensive indicator that considers both individual income levels and overall economic performance, providing a complete picture of a country’s economic well-being that directly affects the availability of resources for infrastructure and bike road system investments. Therefore, a higher GDP per capita generally implies a higher level of economic activity and more resources available for infrastructure investments.
In future, it is possible to use more indicators, for example, income distribution, education level, or the analysis of living costs and car ownership costs.
The research concept also includes the use of one indicator for weather analysis. The “average temperature” indicator was chosen over the “number of sunny days” as it has a more significant impact on cycling conditions. Even on sunny days, low temperatures can make cycling uncomfortable or unsafe due to the presence of ice on roads or trails. Similarly, high temperatures can make cycling difficult and even dangerous, especially over long distances. This indicator provides a more accurate representation of the weather conditions that cyclists are likely to face, making it easier to design and plan bike road systems that are safe and comfortable to use. The speed of temperature could also be an interesting indicator in future analyses that focus specifically on weather aspects of cycling system building.
To analyze the collected data, the STATISTICA-13.3 software was utilized. The basic assumptions of measurable correlations were checked to analyze the correlation between variables. In the analysis, the linear correlation indicator was employed, and all correlation coefficients were calculated at the α = 0.05 level of statistical significance.
  • To interpret the correlations between indicators, the Guilford reliability classification was used. According to this approach, we can differentiate the following types of correlations [94]: 0.9 < r ≤ 1—very high,
  • 0.7 < r ≤ 0.9—high;
  • 0.4 < r ≤ 0.7—moderate;
  • 0.2 < r ≤ 0.4—low;
  • 0.00 < r ≤ 0.2—very low.
The mentioned descriptions of correlation coefficients were used in the interpretation of data.
Figure 1 displays a brief flowchart presenting the steps of the study described in this paper.

4. Results

In this chapter, there will be a juxtaposition of the main results of the paper. The presented data will be discussed in the next chapter.
In the Table 2, there are data about European Union smart cities, which are the best bike-friendly cities, according to Cyclorank 2021. In the table, there are data about city names, countries, bike road lengths, all road lengths, and segregated road lengths.
According to the data in the table, we can observe that there are differences between European countries in the number of bicycle-friendly cities. Germany has the highest number of cities with 21 cities, followed by Spain with 11 cities and then Poland with 9 cities. Regarding France, there are 6 cities; Italy has 5 cities; the Netherlands has 5 cities; Romania has 3 cities; Sweden has 3 cities; Bulgaria has 3 cities; and Denmark has 2 cities.
Regarding the other countries on the list, there is one city each, of which is always the capital of the country. When analyzing the data, it is worth noting that regarding the analyzed countries, the list of cities includes their capitals. It is in the capital where investments related to bicycle infrastructure are concentrated—the capitals of the countries are most involved in smart mobility. This can lead to an incongruous situation of significant differences between the commitment to the implementation of smart mobility principles regarding a country’s capital and the other cities, which can exacerbate social differences and lead to exclusion from the use of smart city tools in many cities.
Analyzing the length of bicycle paths in each of the surveyed cities, it can be noted that the longest network of bicycle paths is characterized by cities such as Helsinki—2605.18 km, Berlin—2478.84 km, Stockholm—1845.44 km, Hamburg—1789.6 km, Munich—1655.97 km, Gothenburg—1598.82 km, Cologne—1466.25 km, Warsaw—1384.1 km, Vienna—1384.1 km, and Bremen—1286.57 km. As many as five German cities, two Swedish cities, and one city each from Finland, Poland, and Austria made it into the top ten from the point of view of total bicycle path length.
From analyzing the data, it can be observed that by far the best-developed bicycle networks in the European Union are found in German cities—numerous non-German cities are on the list, and half of the cities in the top ten regarding the total length of bicycle routes are German cities. From the point of view of the length of bicycle routes in European Union cities, the longest total length of bicycle routes is characterized by cities in northern and central Europe. Regarding cities from western and southern Europe, they are far behind the leaders, with Toulouse in 24th place and Madrid in 25th place.
When analyzing the data, it should be considered that the individual cities are characterized by different sizes and populations. Therefore, in order to accurately track the differentiation of the studied cities from the point of view of the length of bicycle routes, it is necessary to include these parameters in the analysis. In cities with large areas, there should be more bicycle routes so that residents can reach all the places they need. Additionally, a larger population requires more bicycle routes.
In order to take this into account, the parameters of saturation of a given city with bicycle roads were calculated: the number of bicycle roads per 1 km2 of the city’s area and the number of bicycle roads per 1000 residents of the city. The relevant data for individual cities are summarized in Table 3. The table also calculates the ratio of bicycle roads to the length of all roads in each city.
Regarding the ratio of the number of bicycle roads per 1 km2 of area, the highest results are characterized by: Helsinki—39.6 km/km2, Hannover—21.39 km km2, Gothenburg—17.47 km km2, Vienna—15.05 km km2, Lisbon—11.86 km km2, Krakow—10.92 km km2, Stockholm—10.43 km km2, Copenhagen—9.88 km km2, Amsterdam—9.67 km km2, and Berlin—8.32 km km2. Again, as was the case with the analysis in absolute numbers, it can be observed that the European Union cities characterized by the highest density of bicycle paths per square km of area are located in northern and central Europe—Germany, Finland, Austria, Sweden, Denmark, and Poland. The only exception, in this case, is Portugal’s Lisbon.
The next parameter studied the number of bicycle paths per 1000 inhabitants; the following European Union cities ranked first: Helsinki—7.77 km, Stockholm—5.49 km, Gothenburg—3.75 km, Munich—3.19 km, Hamburg—3.04 km, Berlin—3.02 km, Munster—2.91 km, Bremen—2.73 km, Cologne—2.58, and Amsterdam—2.45 km. The top ten cities with the highest density of bicycle paths per 1000 residents include six German cities, two Swedish cities, and one city each from the Netherlands and Finland. Again, the earlier observations are confirmed: there is a definite advantage of cities in central and northern Europe and Germany in particular over the rest of the European Union countries regarding the construction of bicycle infrastructure for smart mobility.
Regarding modern smart cities, an analysis of the literature suggests that they should be sustainable. To be sustainable and more ecology-friendly, the city should decrease the amount of used private cars and increase the amount of public communication and bikes [39,52,53,54]. One of the parameters regarding how we can measure this is the relation between all roads and bike roads in smart cities. The smart city which is investing in alternative methods of communication toward smart mobility should have a better bike road-to-road ratio.
The bike road-to-road ratio is expressed as a percentage and it indicates what percentage of the sum of all roads in each city are bike roads. For the cities surveyed, the highest bike road-to-road ratios are found for the following cities: Malmo—20.9%; Helsinki—18.2%, Stockholm—17.8%, Copenhagen—16.1%, Antwerp—15.9%, Utrecht—15.5%, Rotterdam—14.7%, Amsterdam—14.5%, Nantes—13.7%, and Gothenburg—13%. The top ten cities with the highest percentage of bicycle roads in relation to total roads included three cities in Sweden; four cities in the Netherlands; and one city each in Denmark, Finland, and France. Regarding the analyzed variable, there is a clear advantage between Scandinavian cities (all three cities of Sweden were in this group) and cities of the Netherlands (four out of five cities from this country were in the top ten for the variable in question).
In the next stage of the research procedure, the data for each country were aggregated by calculating the average parameters for cities within the studied European Union countries. The results of the calculations are summarized in Table 3 and Table 4, respectively.
The analysis of the data in Table 4 shows that the countries in which smart cities are characterized by the greatest length of bicycle routes are: Finland—2605.18 km/city, Sweden—1456.6 km/city, Austria—1300.76 km/city, Denmark—969.88 km/city, and Germany—867.85 km/city. The lowest values are found for the countries: Greece—26.88 km/per city, Belgium—76.43 km/per city, Romania—80.4 km/per city, and Bulgaria—88.87 km/per city. Regarding the very large differences that occur between countries, the leading countries reach values of more than 1000 km/per city, while the worst countries do not exceed 100 km/per city. In Figure 2, there is an illustration of the data regarding bike road length in smart cities in European Union countries.
Regarding the smart cities’ saturation rates of bicycle routes per km of area (Table 5), the best results are found for the following countries: Finland—39.6 km/km2, Austria—15.05 km/km2, Portugal—11.86 km/km2, and Sweden—10.14 km/km2. The lowest results for the indicator in question are for Greece—0.13 km/km2, Italy—0.35 km/km2, Bulgaria—0.43 km/km2, Slovenia—0.44 km/km2, and Estonia—0.5 km/km2. The spread of data among countries is shown in Figure 3—bike road lengths per 1 km2 in smart cities in European Union countries.
The next smart mobility indicator calculated was the indicator of smart city saturation with bicycle roads per 1000 inhabitants. In this case, the highest values of the indicator are found in countries such as Finland—7.77 km/1000 people, Sweden—3.24 km/1000 people, Luxembourg—1.39 km/1000 people, Germany—1.59 km/1000 people, and Hungary—1.18 km/1000 people. The smallest values of the indicator are noted for the following countries: Greece—0.08 km/1000 people, Slovenia—0.15 km/1000 people, Romania—0.17 km/1000 people, Bulgaria—0.18 km/1000 people, and Belgium—0.23 km/1000 people. The data about the spread of bike road length per 1000 citizens in smart cities in European Union countries are shown in Figure 4.
The last coefficient calculated for smart cities in the European Union countries studied was an indicator for the percentage of bicycle roads in the total amount of roads in a city. The indicator can be taken as an indicator suggesting a country’s commitment to sustainability and replacing car traffic with bicycle traffic. For European Union countries, the highest values of the indicator are for smart cities in countries such as Finland—18%, Sweden—17.3, the Netherlands—15.5%, Luxembourg—14.4%, and Denmark—14%. The highest values of the indicator are obtained by Scandinavian and Benelux countries. The lowest values of the ratio are for the following countries: Italy—2%, Bulgaria—2.5%, Slovakia—2.6%, Greece—2.9%, Chechia—3%, and Croatia—3%.

5. Discussion

A good system of bicycle paths is an important factor in conditioning the development of smart mobility—one of the important aspects of a modern smart city. For smart mobility solutions to be applied in the city, e.g., bike sharing, or various types of applications that monitor bicycle traffic, e.g., smart tires, the basis is a readily available well-prepared network of bicycle paths in the city. Smart tires are a type of intelligent tire technology that provides various features to enhance the performance, safety, and efficiency of vehicles. They are equipped with sensors and communication devices that can collect and transmit data on tire pressure, temperature, and other relevant information to the vehicle’s onboard computer. This information can be used to alert the driver in case of low tire pressure or any other potential problems and to optimize the performance and fuel efficiency of the vehicle. Additionally, smart tires can communicate with other vehicles, infrastructure, and the cloud to provide real-time traffic updates, weather conditions, and road hazards, helping to enhance road safety [95,96].
Without a bikeway system, more advanced solutions that focus on using data analytics and artificial intelligence are not possible. The road network must have sufficient density to make moving around the smart city convenient and a real alternative to traditional means of transport.
The study shows that there are very large differences between the surveyed smart cities in terms of a functioning bikeway system within the city. In the smart cities located in the European Union, in particular, the best network of bicycle paths both in terms of overall length as well as saturation with bicycle paths per 1 square kilometer of an area or 1000 inhabitants is found in cities located in northern and central Europe in particular; this applies to German, Swedish, Finnish, Danish, or Ho-lender cities.
Among the cities surveyed, Helsinki has the longest bicycle path system (2605 km). Helsinki is a city that is well-advanced in smart mobility implementation. The city has a strategy—Bicycle Action Plan 2020–2025—for the further development of bicycle transportation [97]. It is a continuation of the earlier strategy, which resulted in a very good development of the bicycle road network, which is now the longest in the European Union [98]. In Helsinki, bicycle transportation has been widely promoted, starting in 1995; in particular, its use began to grow rapidly after 2010 [99]. All this required the creation of an adequate infrastructure, which has been developed in recent years and the city authorities plan to develop further [100]. Helsinki’s bicycle transportation system, according to the aforementioned strategy, should meet the following criteria: safe, direct, extensive, effortlessness, and pleasant [101].
In second place, in terms of the length of bicycle routes, was Berlin with a result of 2478.84 km. The city also has a detailed strategy for developing a bicycle system as part of its smart city implementation [102]. The current strategy is a continuation of one that was first developed in 2004 [103,104]. According to the Berlin documentation, cycling creates mobility and can positively impact on quality of life in the city. Using bikes as a transport mode is quiet, sustainable, and can lead to a decrease in air pollution in the city [105,106].
Copenhagen is also an interesting case as it is one of the first euro–European cities to start using bicycle transportation and smart mobility on a massive scale [45]. In Copenhagen, bicycles are used as an alternative means of transportation to traditional transportation—private cars [46,47,48,49]. From the point of view of the length of bicycle paths, Copenhagen is not currently in 1st place, but it is nevertheless ranked 8th in the European Union in terms of the number of bicycle paths per square kilometer.
Since individual cities differ significantly in population, as well as in area, the indicators of the length of bicycle routes per square kilometer of the city area and per thousand inhabitants were calculated. The obtained results allow for us to draw a similar conclusion: that the smart cities of Germany, the Netherlands, Sweden, Finland, Dania, and Austria have the best-developed bicycle network among the EU countries; sometimes single Polish and Portuguese cities also appear in the lead.
Regardless of the adopted coefficient, the top spot is occupied by the largest number of smart cities in Germany. In the top ten of the total length of bicycle paths, half are German cities. Regarding the length of bicycle paths per 1 square kilometer of surface area, two German cities are in the top ten. The juxtaposition of the length of bicycle paths per 1000 inhabitants was dominated by German cities, of which there are six in the top ten.
As for the ratio of the number of bicycle paths per square kilometer, Hanover came in second place behind Helsinki, with 21.39 km/km2. The wide spread of the biking system is one of the important goals of Hanover’s smart city strategy [107]. The city is trying to keep the bicycle infrastructure in a good state using special actions and programs to promote the use of bikes by citizens. Hanover tries to promote bikes and electric bikes by, for example, expanding the charging infrastructure which can be used in electric bikes [108].
Stockholm came in second place for the number of bicycle paths per thousand residents, with 5.49 km. In Stockholm, according to the urban mobility strategy, an increase in the use of bikes by citizens can be observed [109]. Because Stockholm would like to be fossil-fuel-free by 2025, it needs more sustainable related activities [110,111]. One of them is the extension of the bicycle road infrastructure which will benefit in decreasing air pollution and better the quality of life for citizens [112,113].
As for the ratio of bicycle road length to total road length, it is highest for Swedish and Dutch cities. This ratio suggests that a city is strongly committed to promoting sustainable development and reducing carbon emissions. An analysis of the literature confirms this assumption. For example, Egean, through analyzing the examples of Sweden, Denmark, and Iceland, showed Sweden’s strong commitment to decarbonization policies and the promotion of green energy [114]. This is confirmed by Skill’s considerations [115]. The Netherlands, too, has a policy committed to promoting sustainable development and green energy at the country and local levels [116]. The pursuit of green energy and a zero-emission economy requires investment in modern smart mobility methods including bicycle transportation [117,118].
Countries with the longest average length of bicycle paths in smart cities include countries such as Finland, Austria, Sweden, Denmark, and Germany. These countries are heavily involved in smart mobility including the expansion of their bicycle path system. In the case of Austria, Smidel also notes the country’s commitment to smart mobility including bike transport systems [119].
Regarding the length of bicycle paths concerning 1 square kilometer of city area, the frontrunners are similar, with only Portugal in addition. For the indicator of the saturation of smart cities with bicycle paths per 1000 inhabitants, in addition to the countries mentioned above, Luxembourg is in the lead.
The results also confirm the previously described observation that smart cities from southern Europe countries are much less involved in the expansion of bicycle paths compared to northern and central Europe. In particular, the countries bordering the Mediterranean Sea perform very poorly—Italy and Greece are in one of the last places in terms of all the indicators studied. Additionally, regarding Spain, although the indicators are a little higher, they still do not allow for us to conclude that smart cities in this country have a well-developed network of bicycle routes. A poorly developed bicycle road network is also found in the countries of the Balkan Peninsula, Bulgaria; Romania; and Slovenia. For northern European countries, the exception is Estonia, which does not have a well-developed network of bicycle paths in the smart city.
To verify the research hypotheses, in the next stage of the research, we decided to examine the correlation between the average temperature level in a country and the average values for smart city bike lanes in each country. The result shows that there are statistically significant (at the α = 0.05 level of statistical significance) negative correlations between the variables:
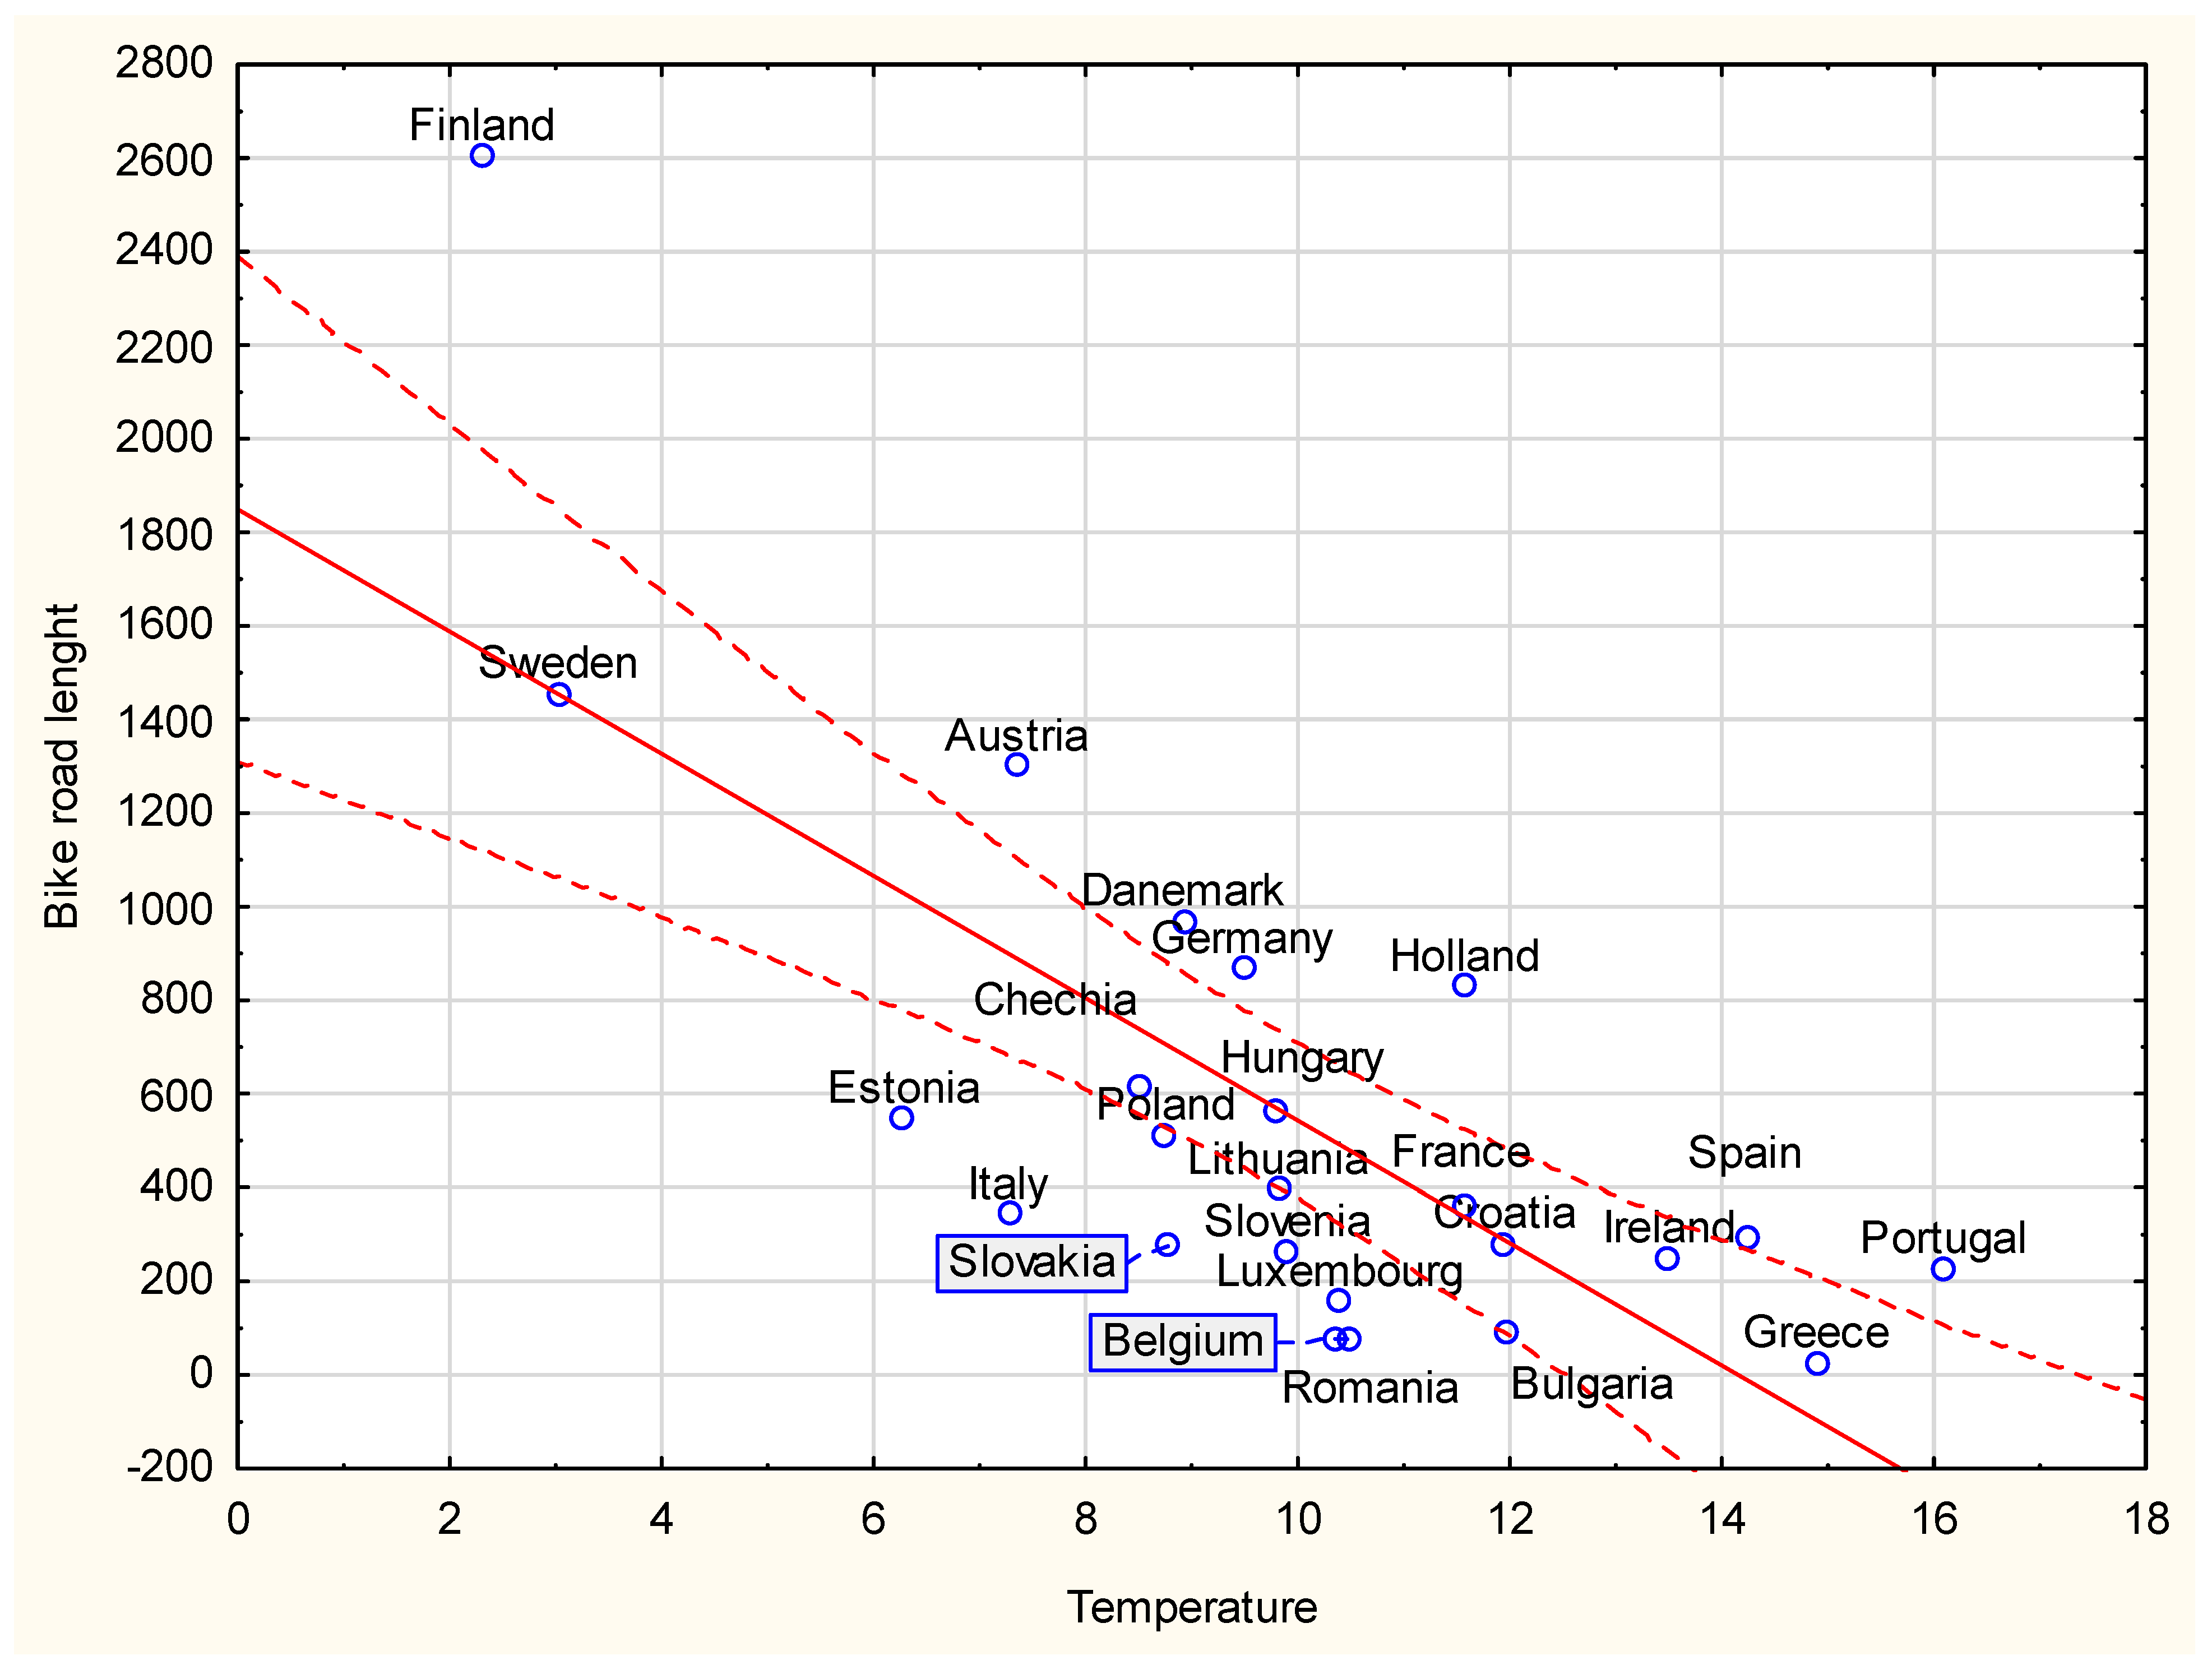
  • Between the length of bicycle paths and the average temperature of the country, the linear correlation coefficient is −0.74 (a very high coefficient value according to Guilford’s classification).
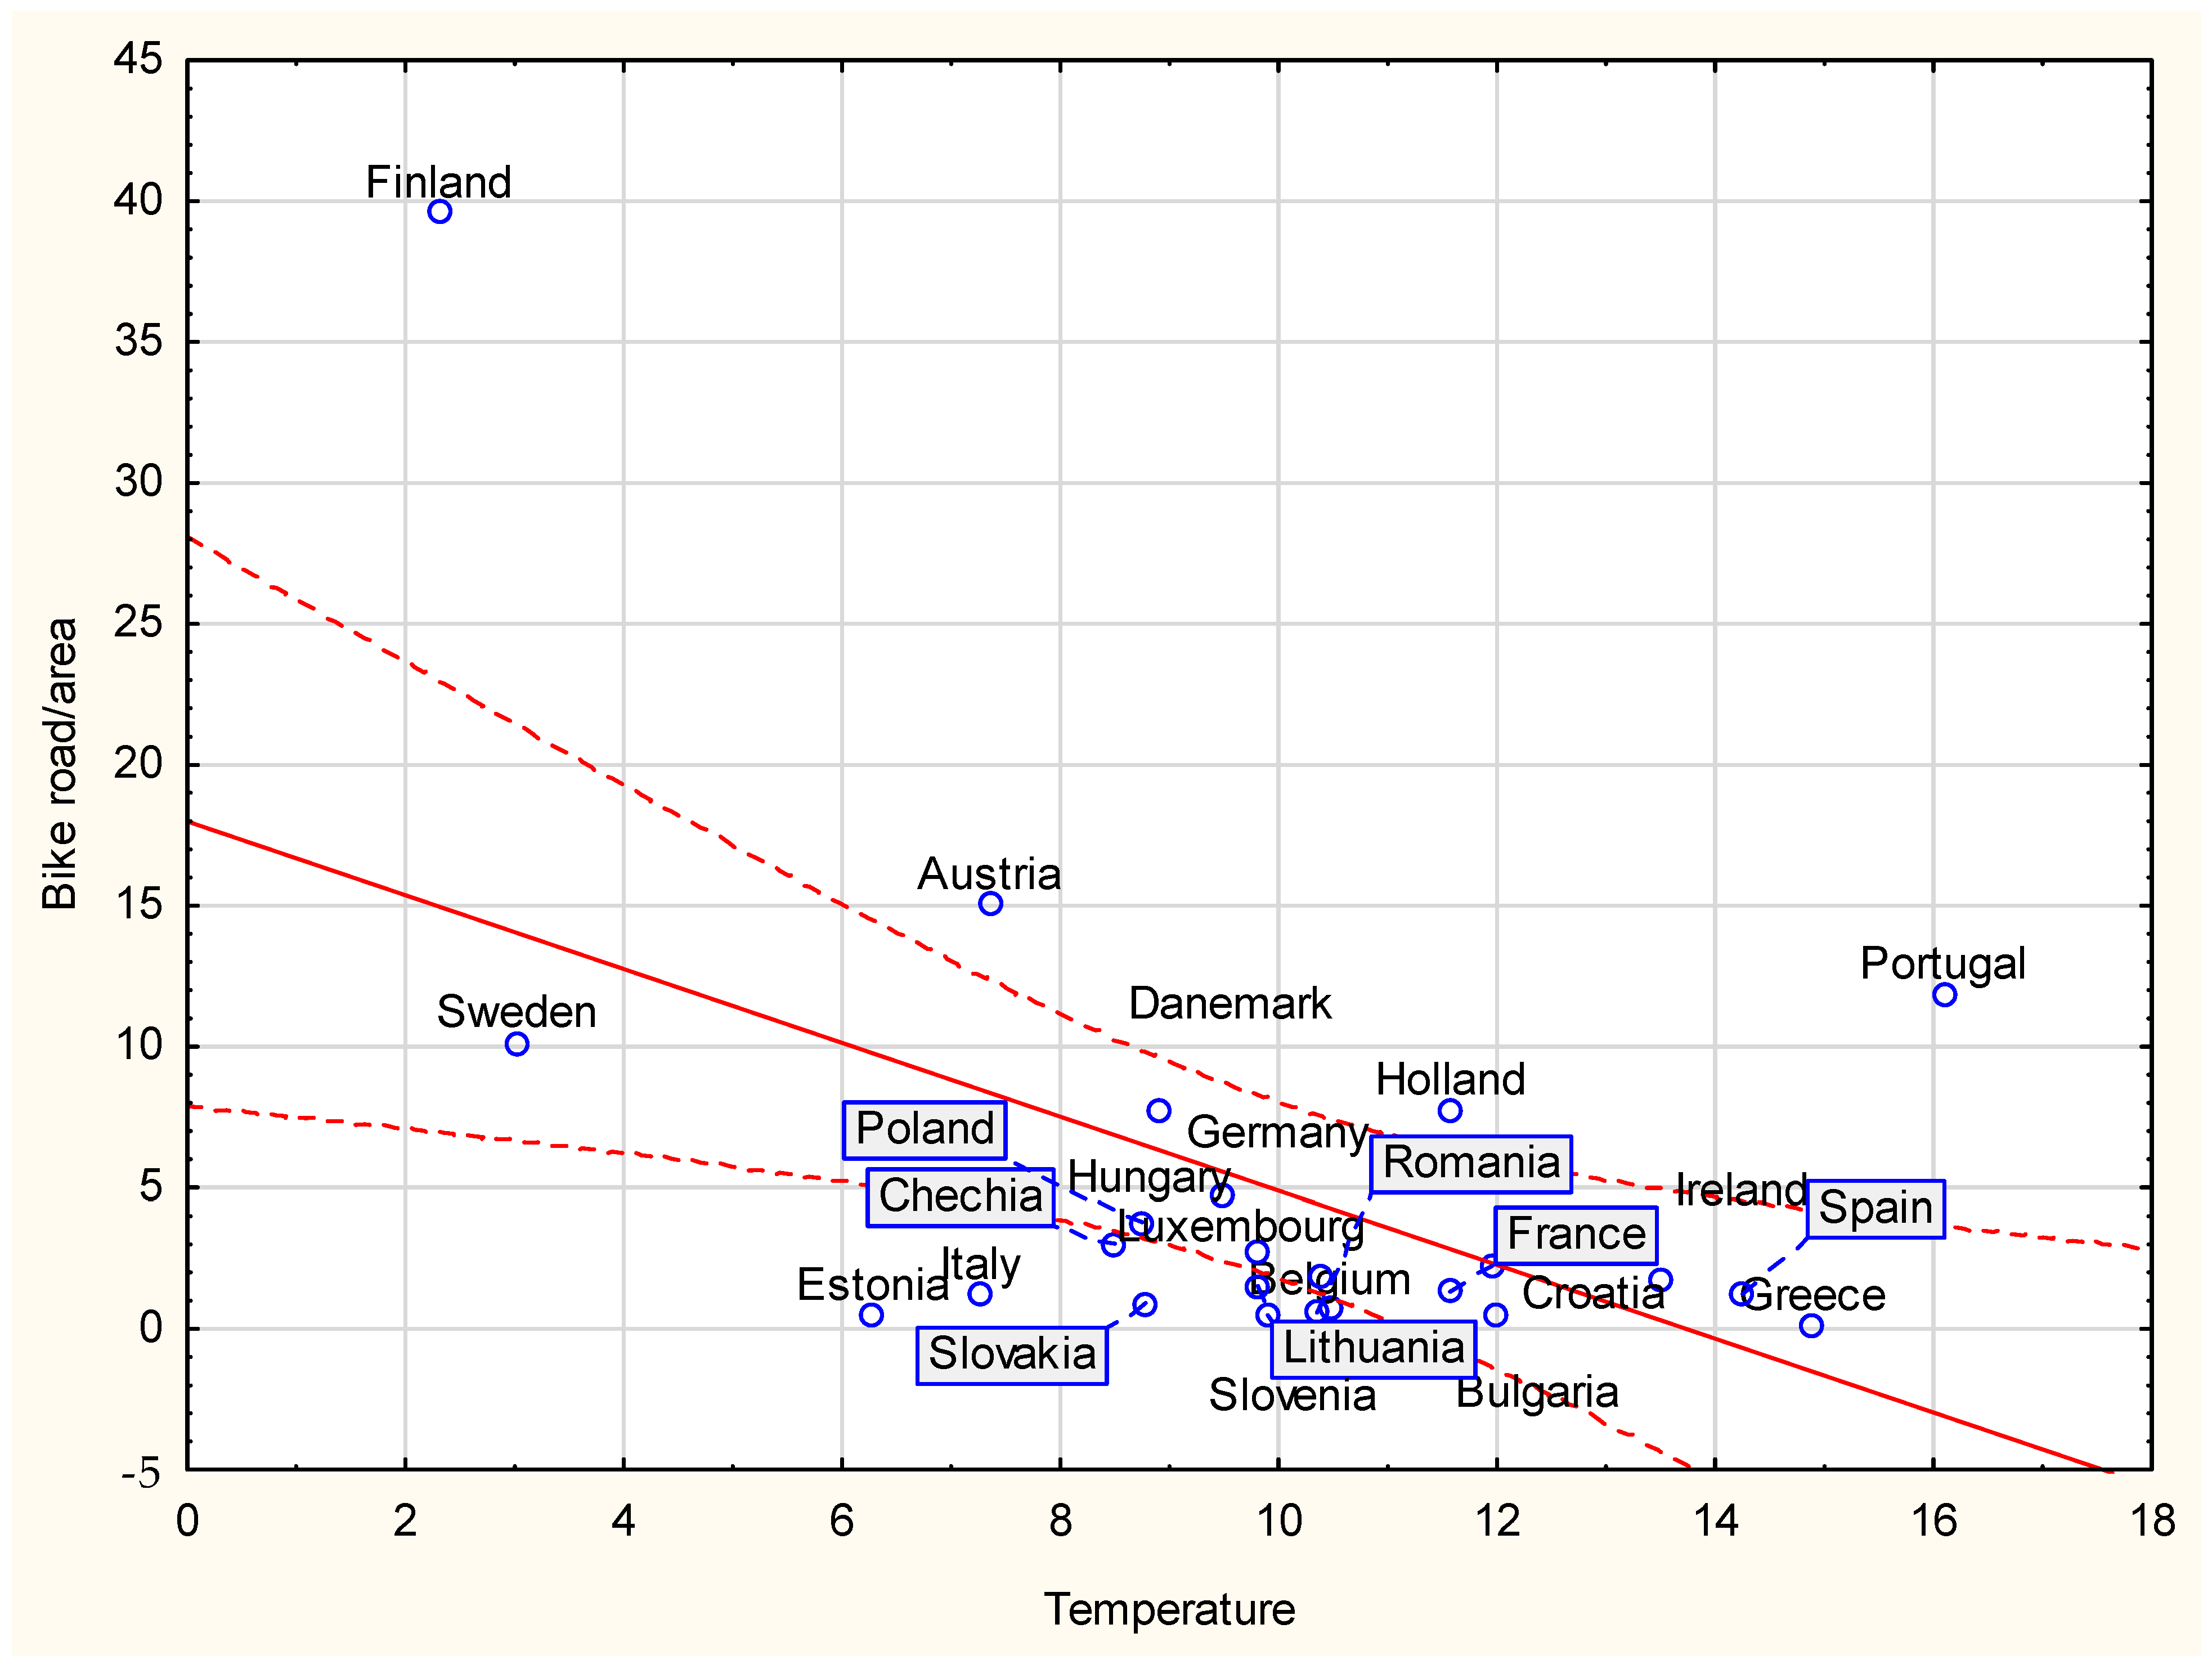
  • Between the ratio of the length of bicycle paths per square kilometer of surface area and the average temperature of the country, the linear correlation coefficient is −0.51 (a high coefficient value according to Guilford’s classification).
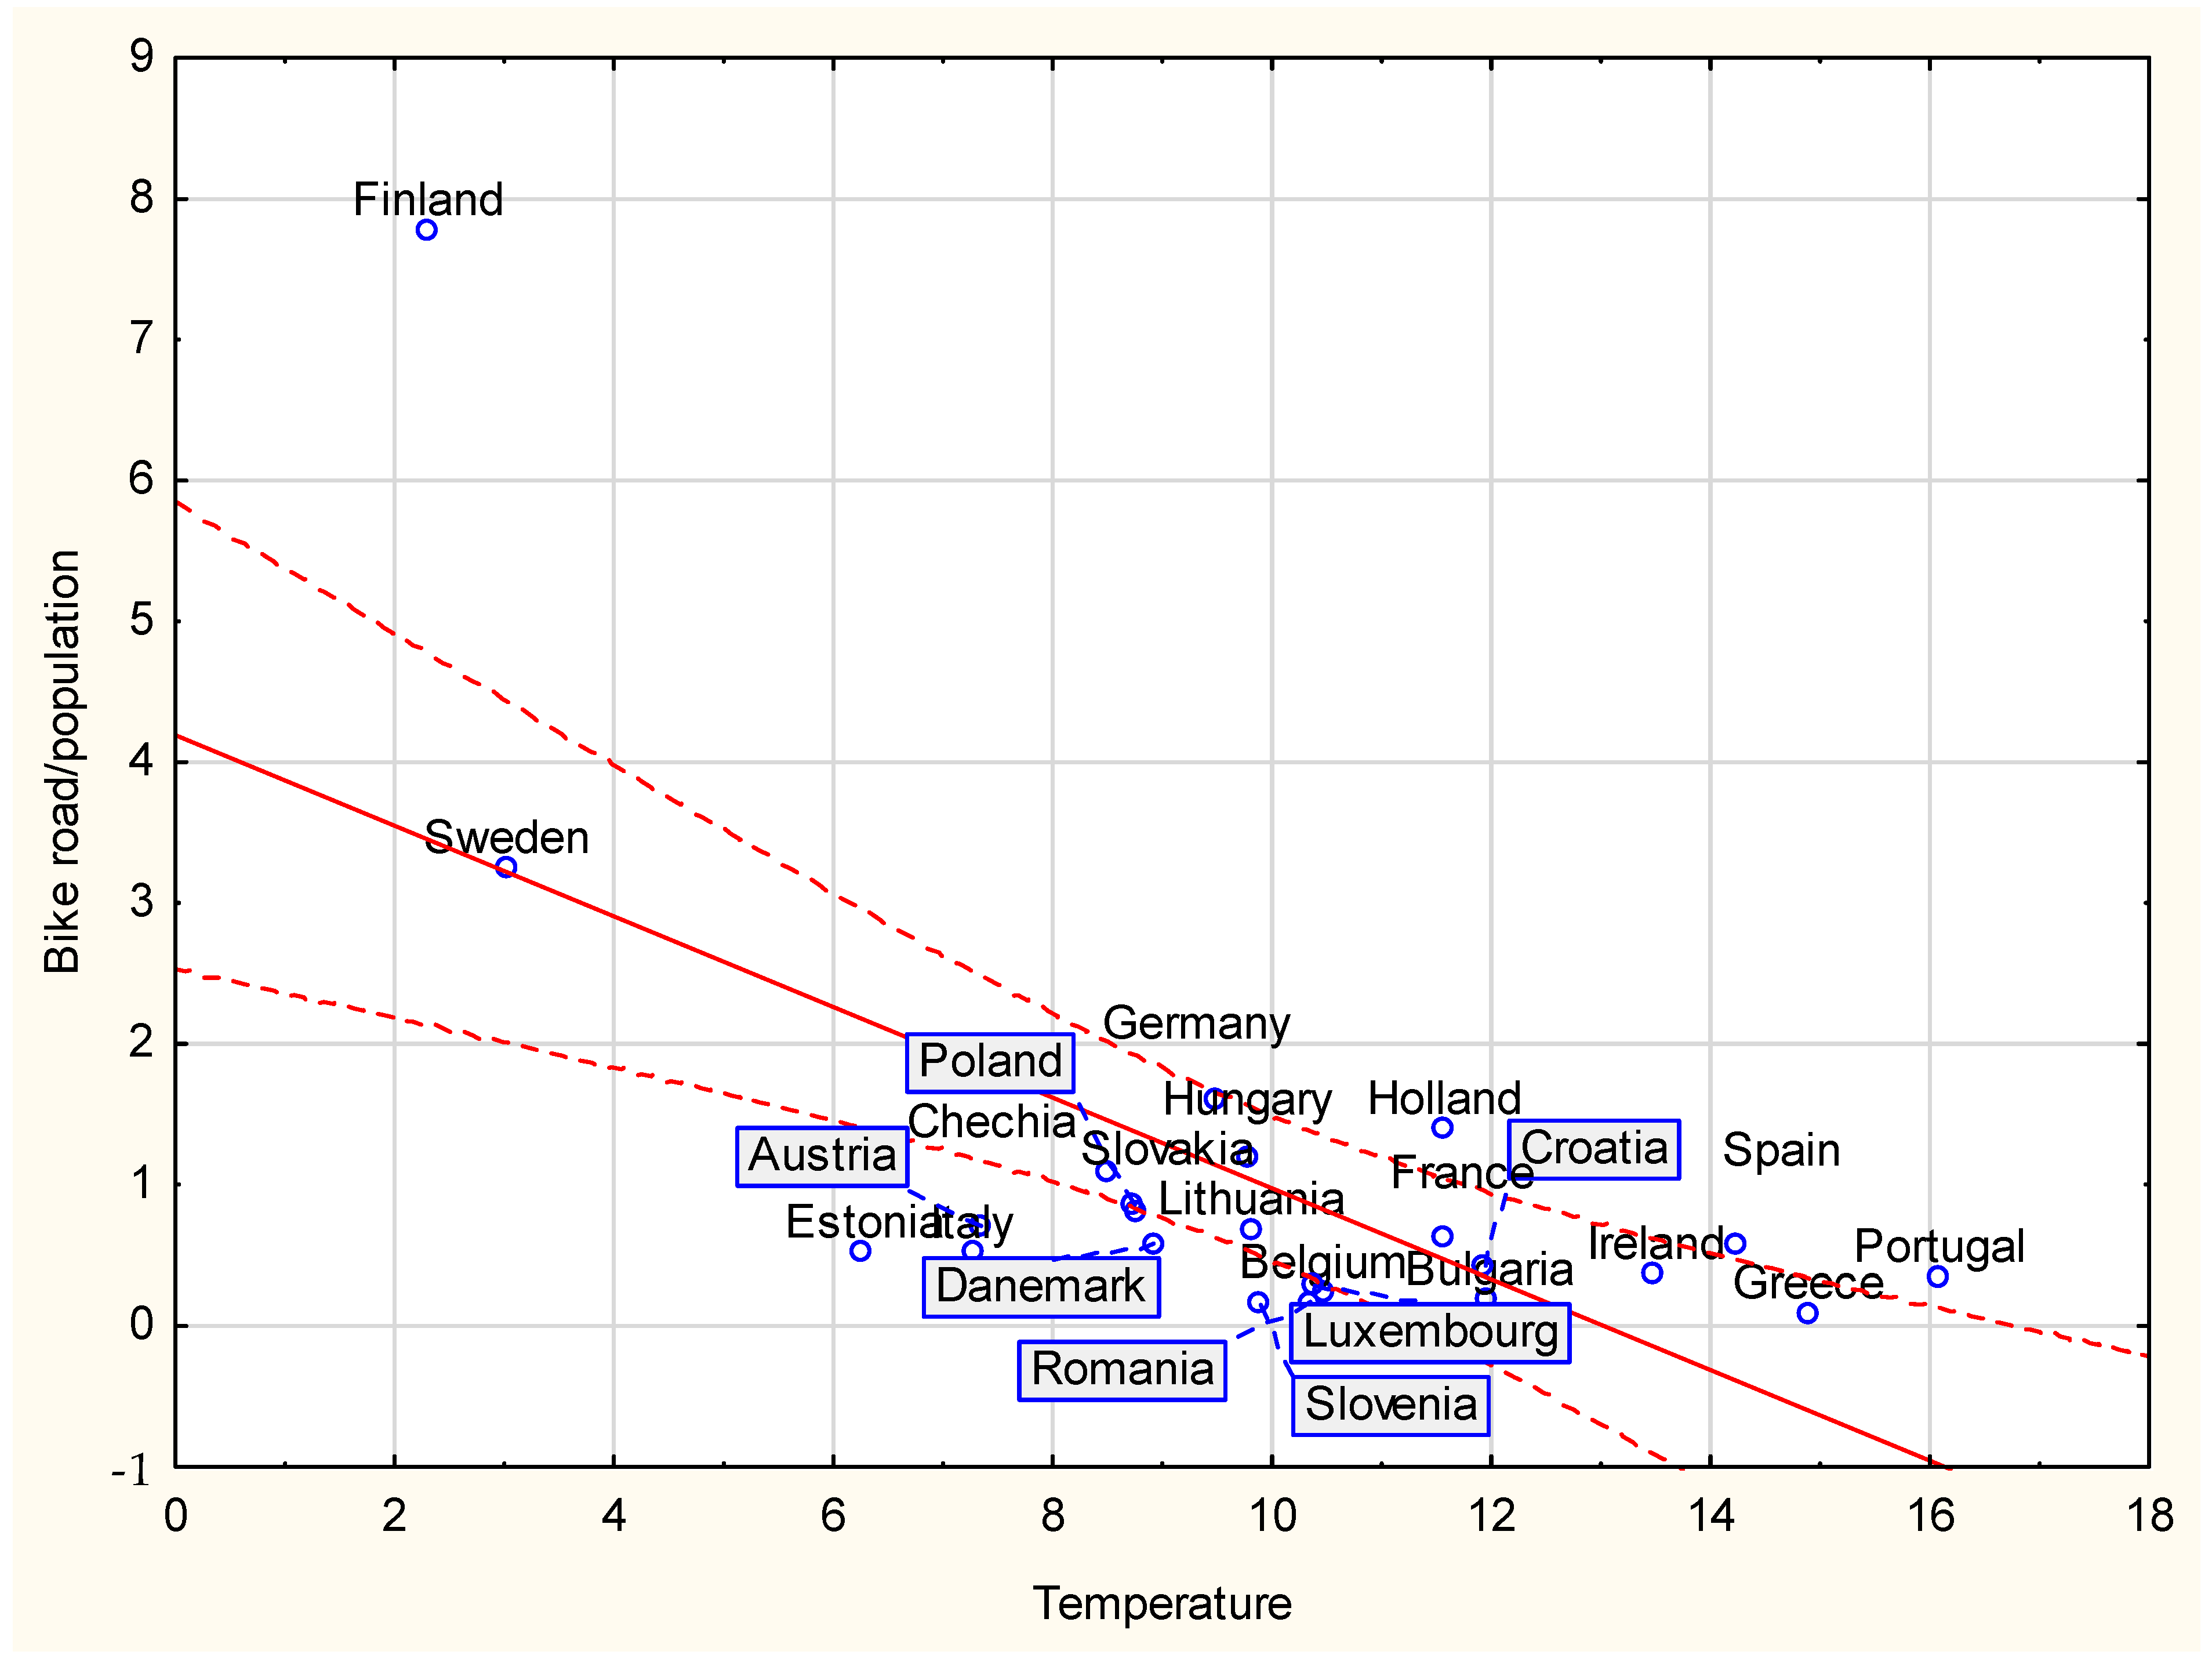
  • Between the rate of bicycle path length per 1000 residents and the country’s average temperature, the linear correlation coefficient is −0.66 (a high coefficient value according to Guilford’s classification).
The correlation coefficient between the length of bicycle paths and the density of bicycle paths per 1000 square meters of area and the country’s average temperature is at an average level, while the remaining correlation coefficient is at an average level. The coefficients have a negative value. The results imply that the lower a country’s average annual temperature, the more that a bicycle infrastructure, as measured by the length of bicycle paths and the saturation of the city with bicycle paths per square kilometer as well as per 1000 inhabitants, is present in smart cities within that country.
The results are counterintuitive. It might seem that the higher the average temperature in a country, the better the conditions for cycling, and therefore, the more bicycle paths there will be in countries’ smart cities and the higher the saturation level of cities with bicycle paths. However, the results already presented earlier suggested that the level of bicycle path saturation is higher in cities in central and northern Europe. Correlational analyses confirm this observation. It turns out that the lower the average temperature in a country, the more bicycle paths are built and the higher the saturation of smart cities with bicycle paths both per square kilometer of the area and per thousand residents. The results support hypothesis H1 as follows: the average length of bicycle paths in smart cities is correlated with the average temperature of the country.
The analysis of the data shows that in the European Union, it is mainly the northern countries that are intensively developing the bicycle path system in their smart cities.
Figure 5, Figure 6 and Figure 7 contain scatter plots of the average temperature of the country and variables such as Figure 1—the average bike road length, Figure 2—the average bike road length/area, and Figure 3—the average bike road/population, respectively.
Based on the collected data, the relationship between average bike road length in a smart city area in a country and average temperature can be expressed by the following formula:
The average bike road length in a smart city = 1849,24 − 130,634 ∗ average temperature
The scatter plot (Figure 5) shows that most countries fall within the range of 0.95 in terms of the relationship between the country’s average temperature and the average length of bicycle routes in smart cities. When analyzing the data, it is worth noting the following groups of countries:
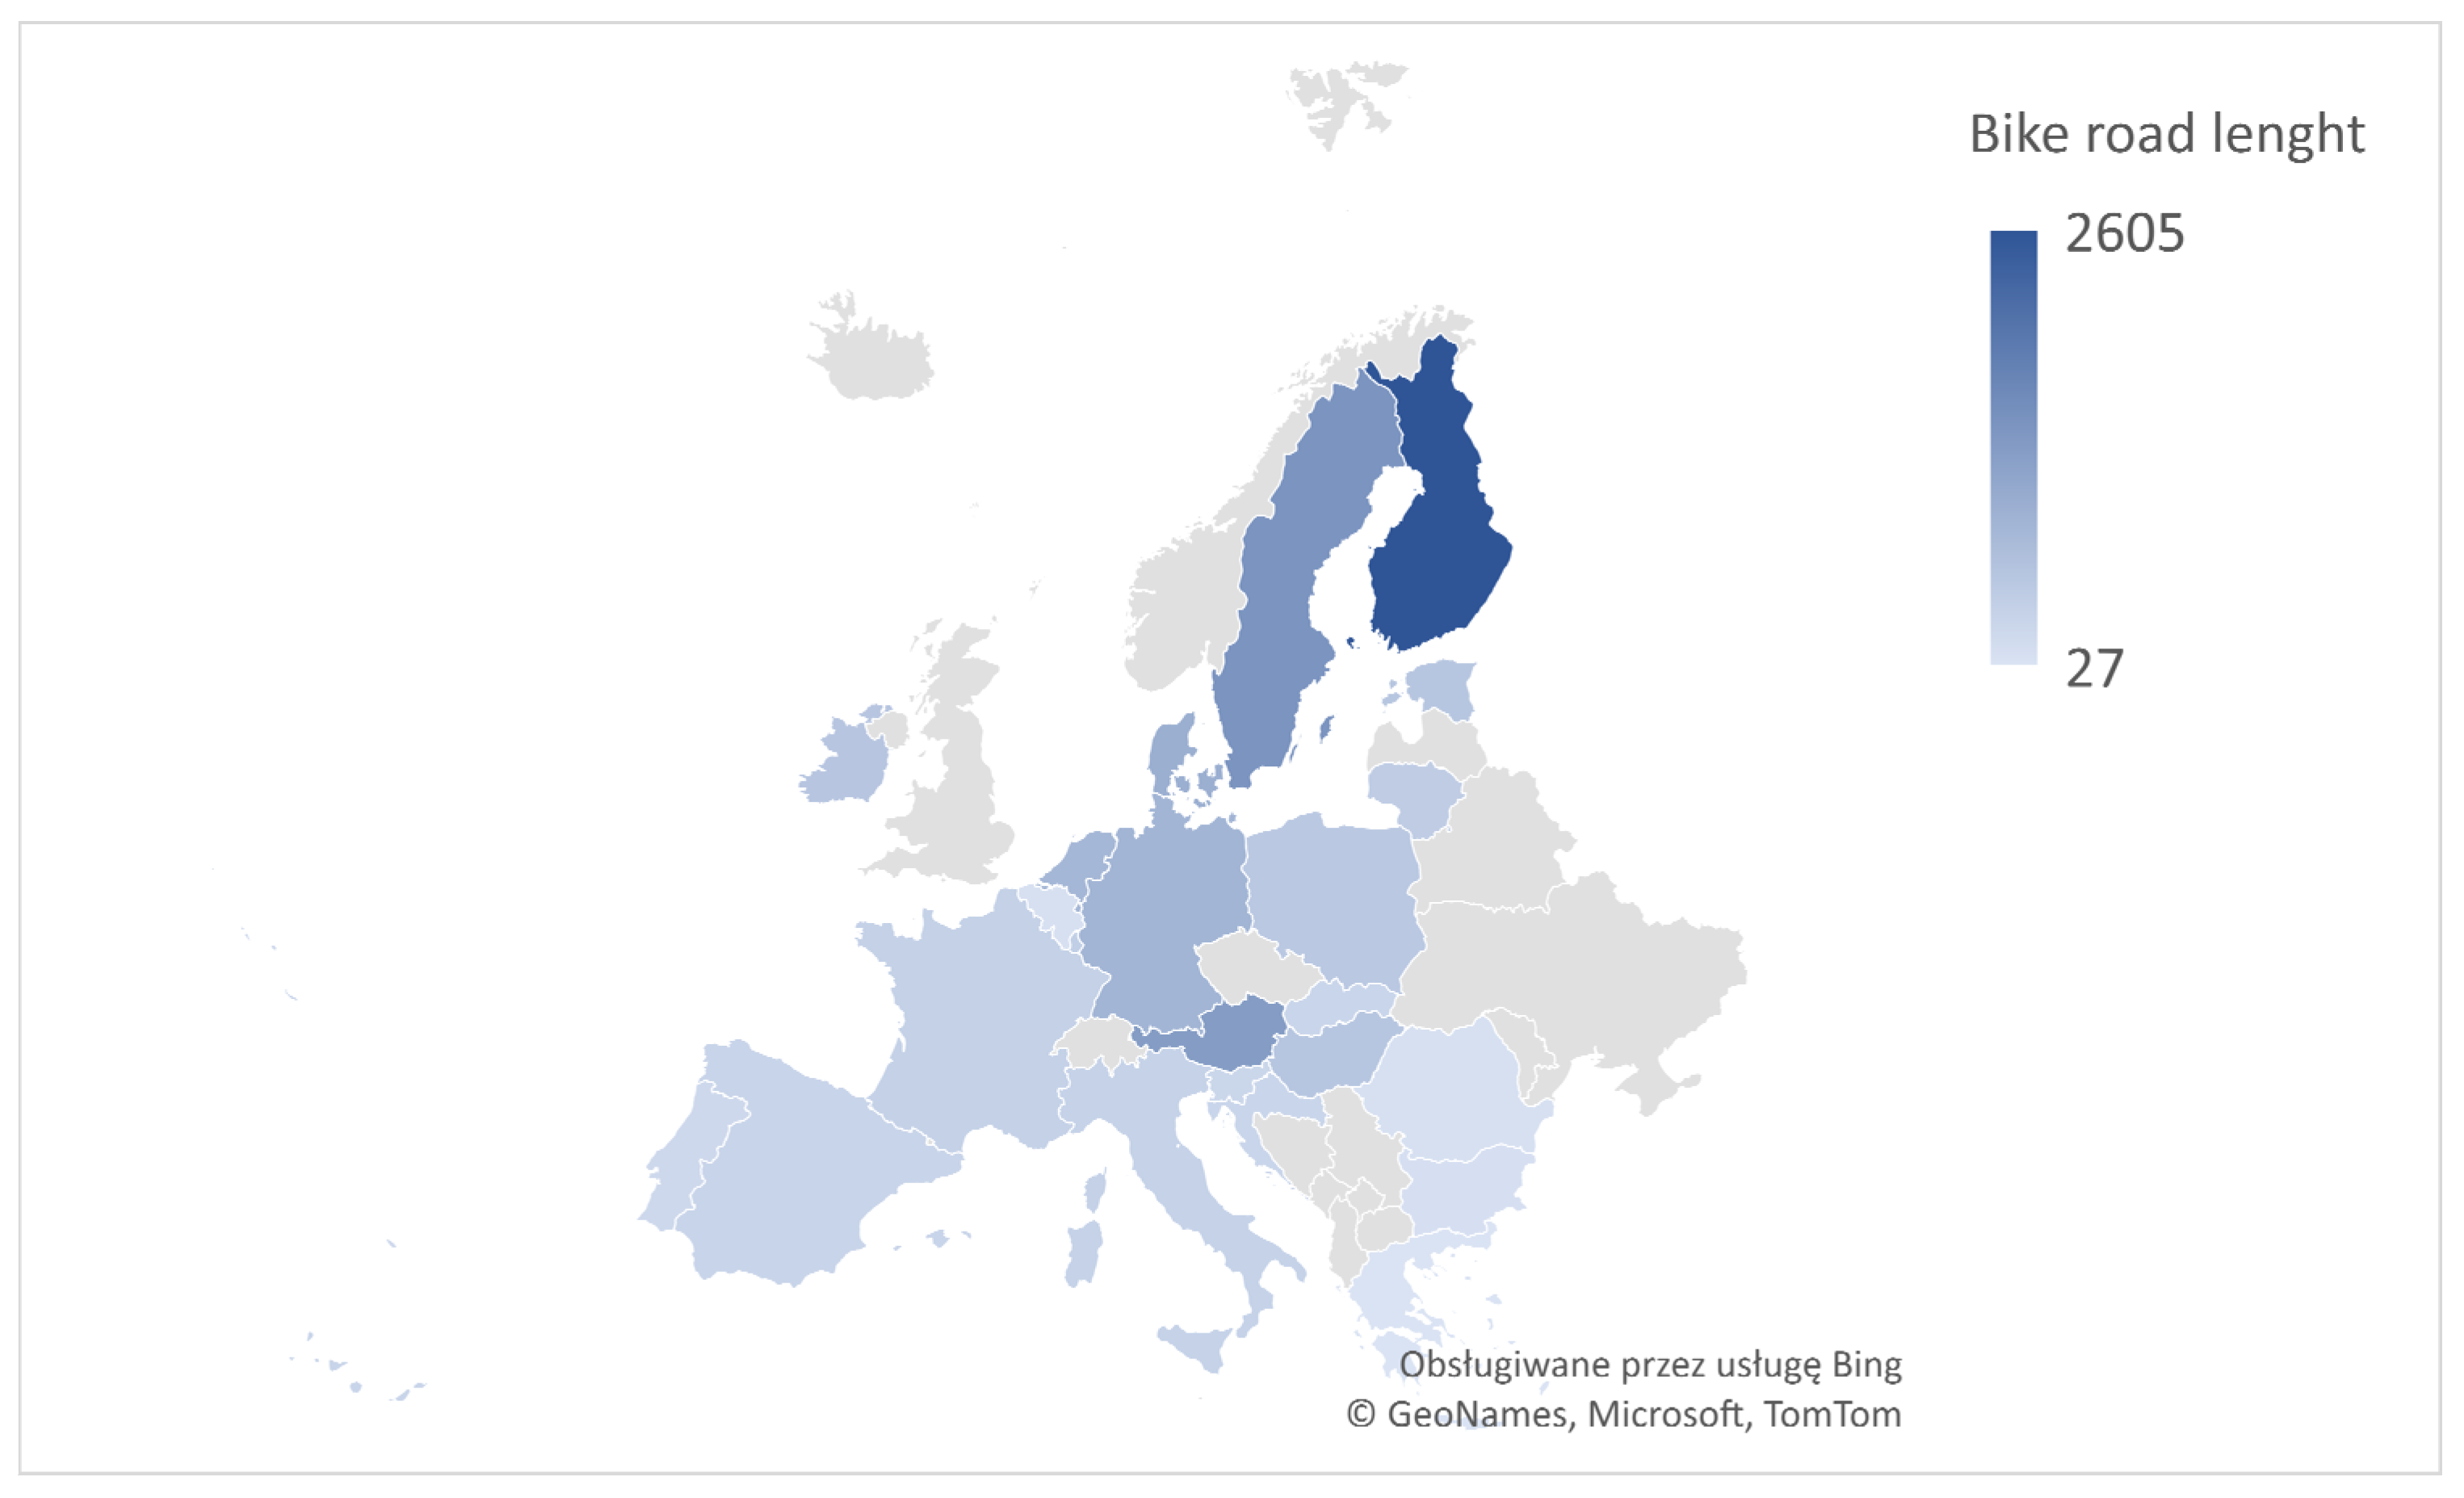
  • Finland—the country with the highest average length of bicycle paths in smart cities.
  • Estonia, Italy, Slovenia, Lithuania, Luxembourg, Belgium, and Romania—a group of countries that are below the confidence interval. This means that the length of bicycle paths in these countries in smart cities is shorter than their average temperature would suggest. These countries are investing less in bicycle infrastructure than neighboring countries with similar climate conditions.
  • Germany, Denmark, the Netherlands, Austria, and Portugal—a group of countries above the confidence interval. These countries are characterized by a greater length of bicycle routes in smart cities compared to neighboring countries characterized by similar climatic conditions.
The relationship between the average bike road length in the smart city per 1 square kilometer of an area in a country and the average temperature can be expressed by the following formula:
The average bike road length in a smart city per 1 km2 = 17.98 − 1.31 ∗ average temperature
The results support hypothesis H2 as follows: the average length of a bicycle path in smart cities per 100 inhabitants is correlated with the average temperature of the country.
The scatter plot in Figure 6 shows that most of the European Union countries studied are within the confidence interval of 0.95 between the variables, average bicycle road length in a smart city per 1 square kilometer and average temperature. By analyzing the chart, we considered that three groups of countries are worth noting:
  • Outlier point Finland—the country characterized by the lowest average temperature of people of the surveyed countries and the highest bike road length in smart cities per 1 square kilometer.
  • Portugal, Austria, and the Netherlands—the countries characterized by a higher saturation of bicycle paths in smart cities per 1 square kilometer of area compared to neighboring countries with similar climatic conditions.
  • Estonia, Italy, Slovakia, Slovenia, and Lithuania—a group of countries characterized by a lower density of bicycle paths in smart cities compared to neighboring countries with similar climatic conditions.
The last relationship studied was the relationship between the length of bicycle paths in a country’s smart cities per 1000 residents and the average temperature. Based on statistical analyses, a linear model between the variables was calculated, expressed by the following formula:
The average bike road length in a smart city per 1000 citizens = 4.19 − 0.322 ∗ average temperature
The presented considerations support hypothesis H3 as follows: the average length of a bicycle path in smart cities per 1 km2 is correlated with the average temperature of the country.
Again, as can be seen from the scatter plot in Figure 7, most of the investigated countries are within the confidence interval of 0.95 between the average bicycle road length in smart cities and average temperature. For countries that are outside the confidence intervals, the following groups are worth noting:
  • Finland—again, an outlier with the highest bike road length per 1000 inhabitants in smart cities and the lowest temperature among the EU countries surveyed.
  • Portugal, Spain, and the Netherlands—the countries characterized by a higher density of bikeways in smart cities as measured by the ratio of bikeway length per 1000 inhabitants compared to countries with similar climates.
  • Estonia, Italy, Austria, Denmark, Luxembourg, and Slovenia—the countries characterized by a lower density of bicycle routes in smart cities compared to neighboring countries with similar climate conditions.
Regarding the correlation analysis between the indicators of bicycle paths in smart cities (the total length of bicycle paths, the length of bicycle paths per square kilometer, and the number of bicycle paths per capita) and the wealth of residents as measured by GDP per capita at purchasing power parity, there is no correlation for any variables, as the corresponding correlation coefficients are not statistically significant at the α = 0.95 level.
A detailed analysis of the scatter plots between the variables (Figure 8, Figure 9 and Figure 10, rest: the scatter plot between GDP per capita and the average length of bicycle routes in smart cities) allows for us to conclude that the lack of correlation is due to the fact that there are clear outlier points in each case, which distort the results of the analysis:
For all three charts, the outlier points are Ireland and Luxembourg due to their very high GDP per capita that is clearly higher than in other countries, and Finland due to its very high rate of average bicycle path length in smart cities that is much higher than in the other European Union countries studied.
The study shows that there is no correlation between the GDP of individual countries and the length and density of the bicycle network in smart cities at the level of the European Union countries for all countries studied. However, due to the existence of clear three outliers which can distort the results of the analysis, it is worth conducting a correlation analysis for 21 EU countries (excluding Finland, Ireland, and Luxembourg).
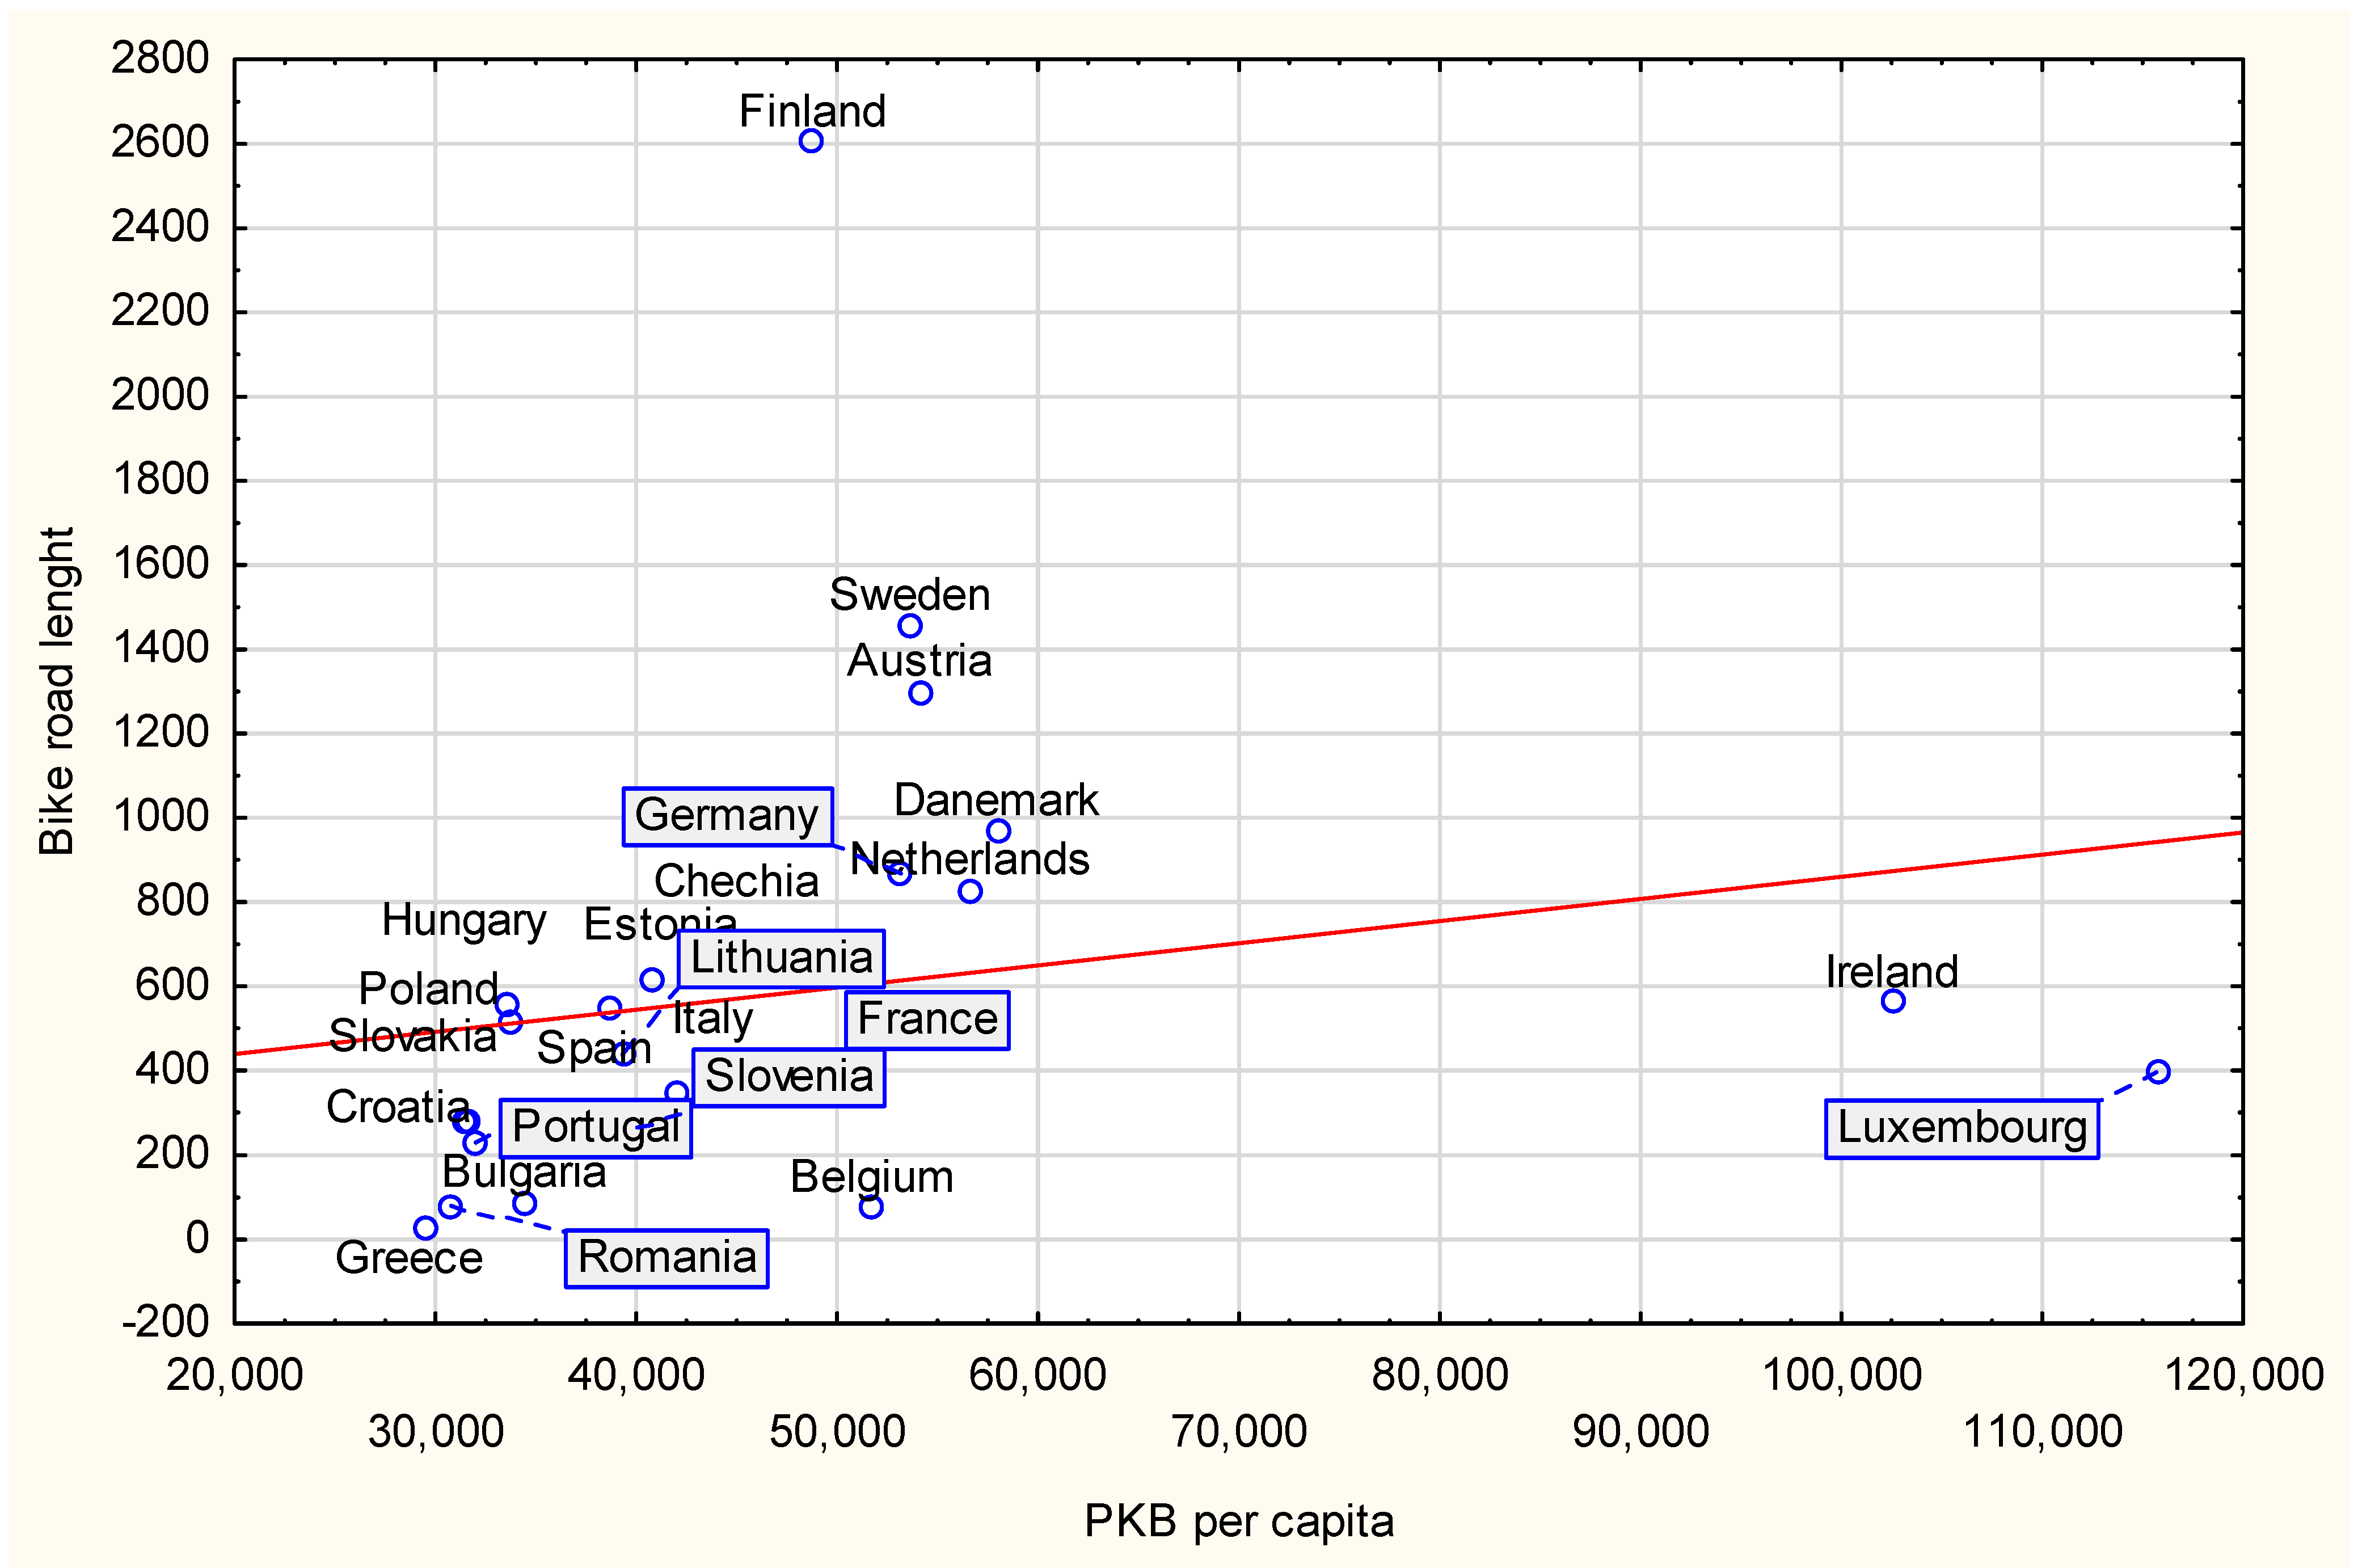
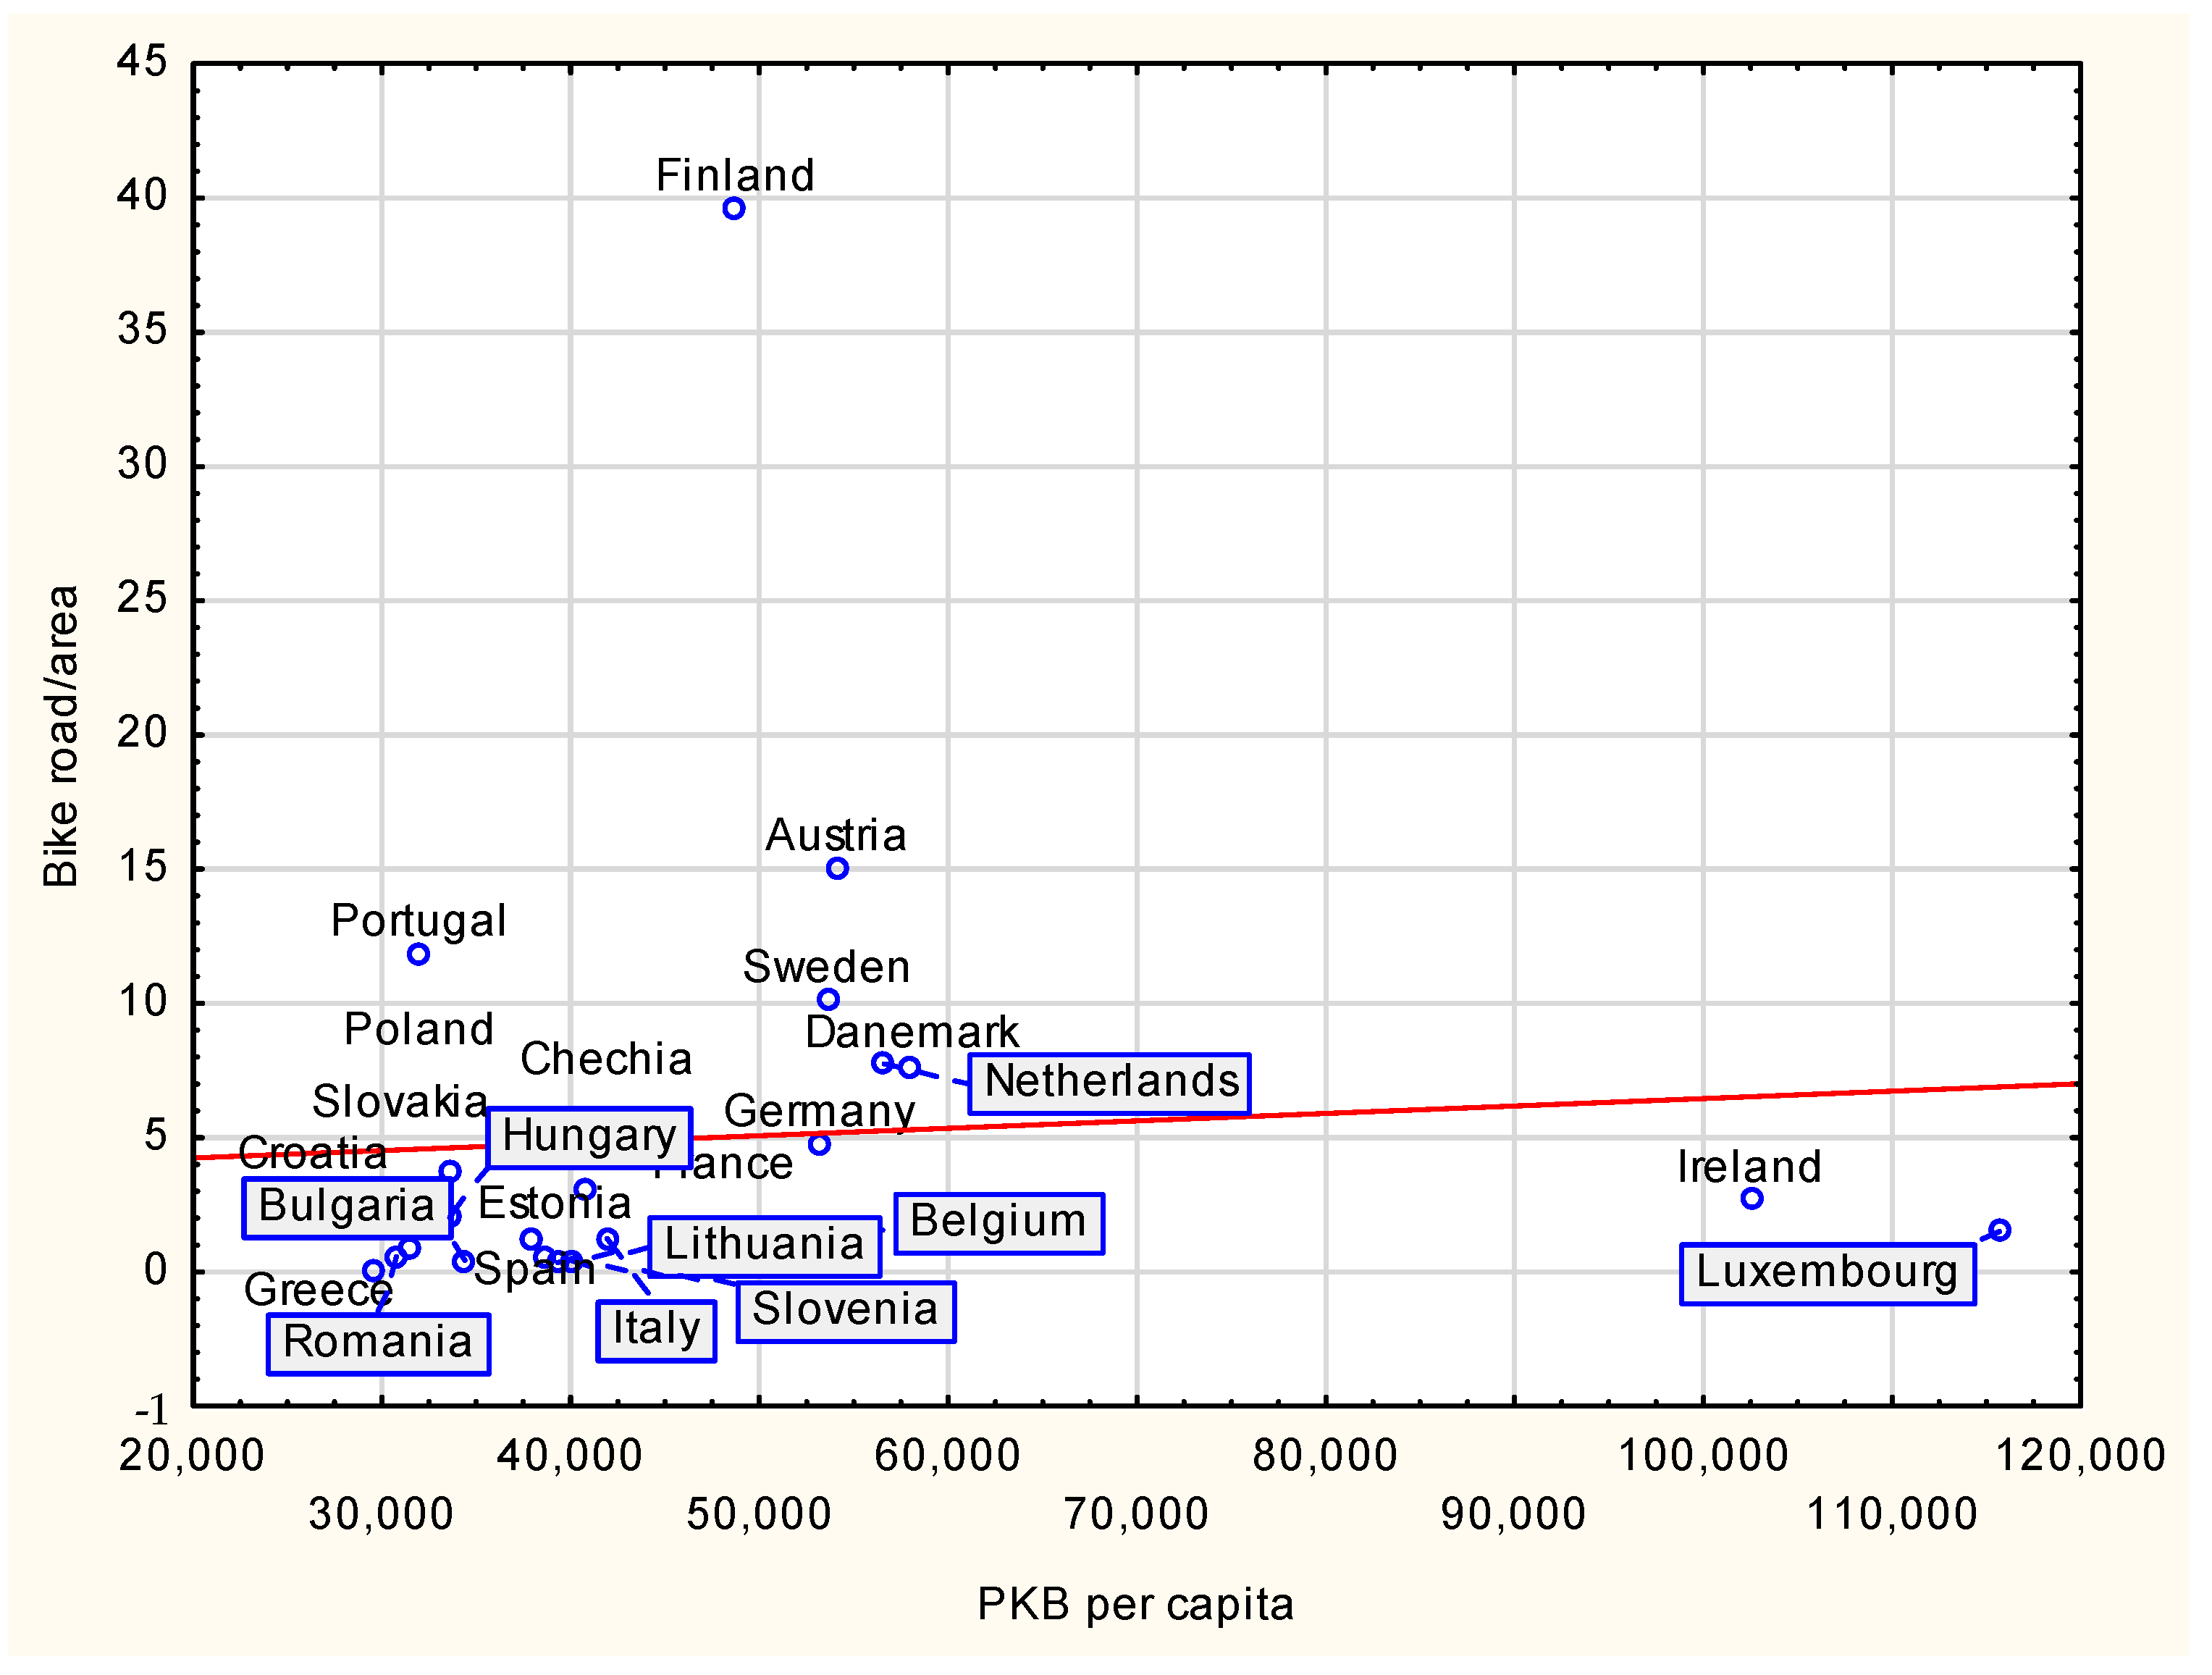
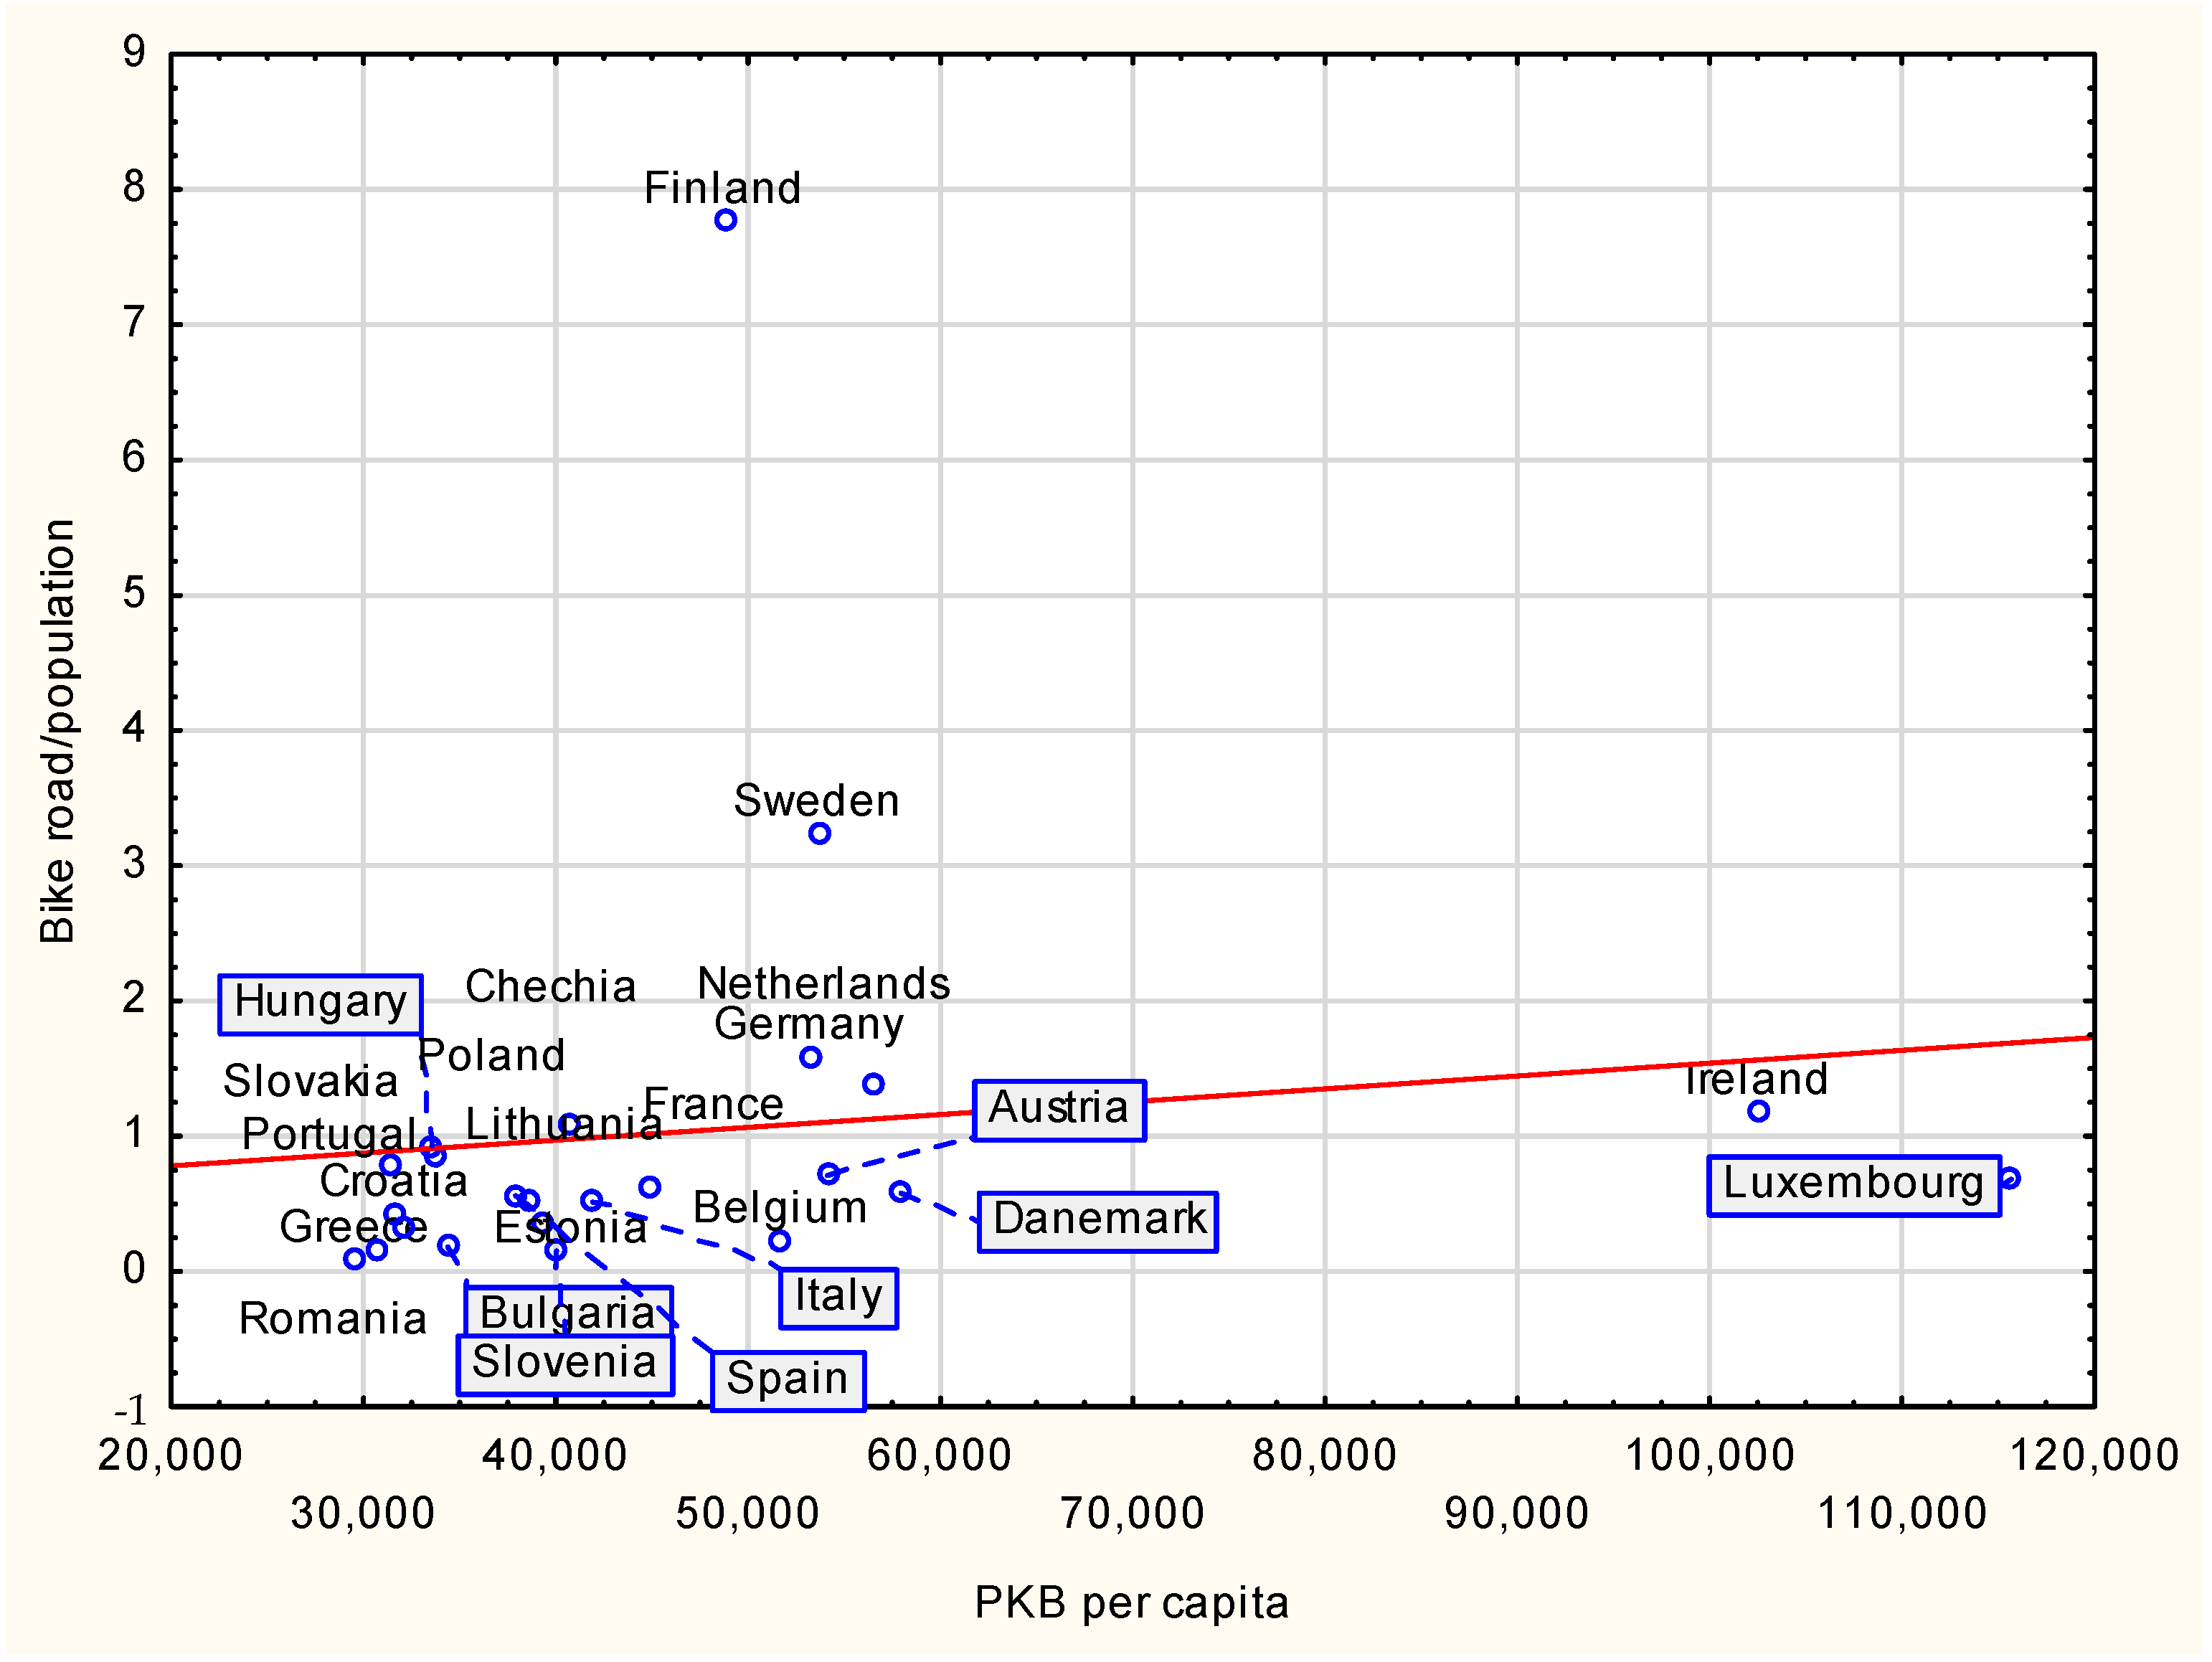
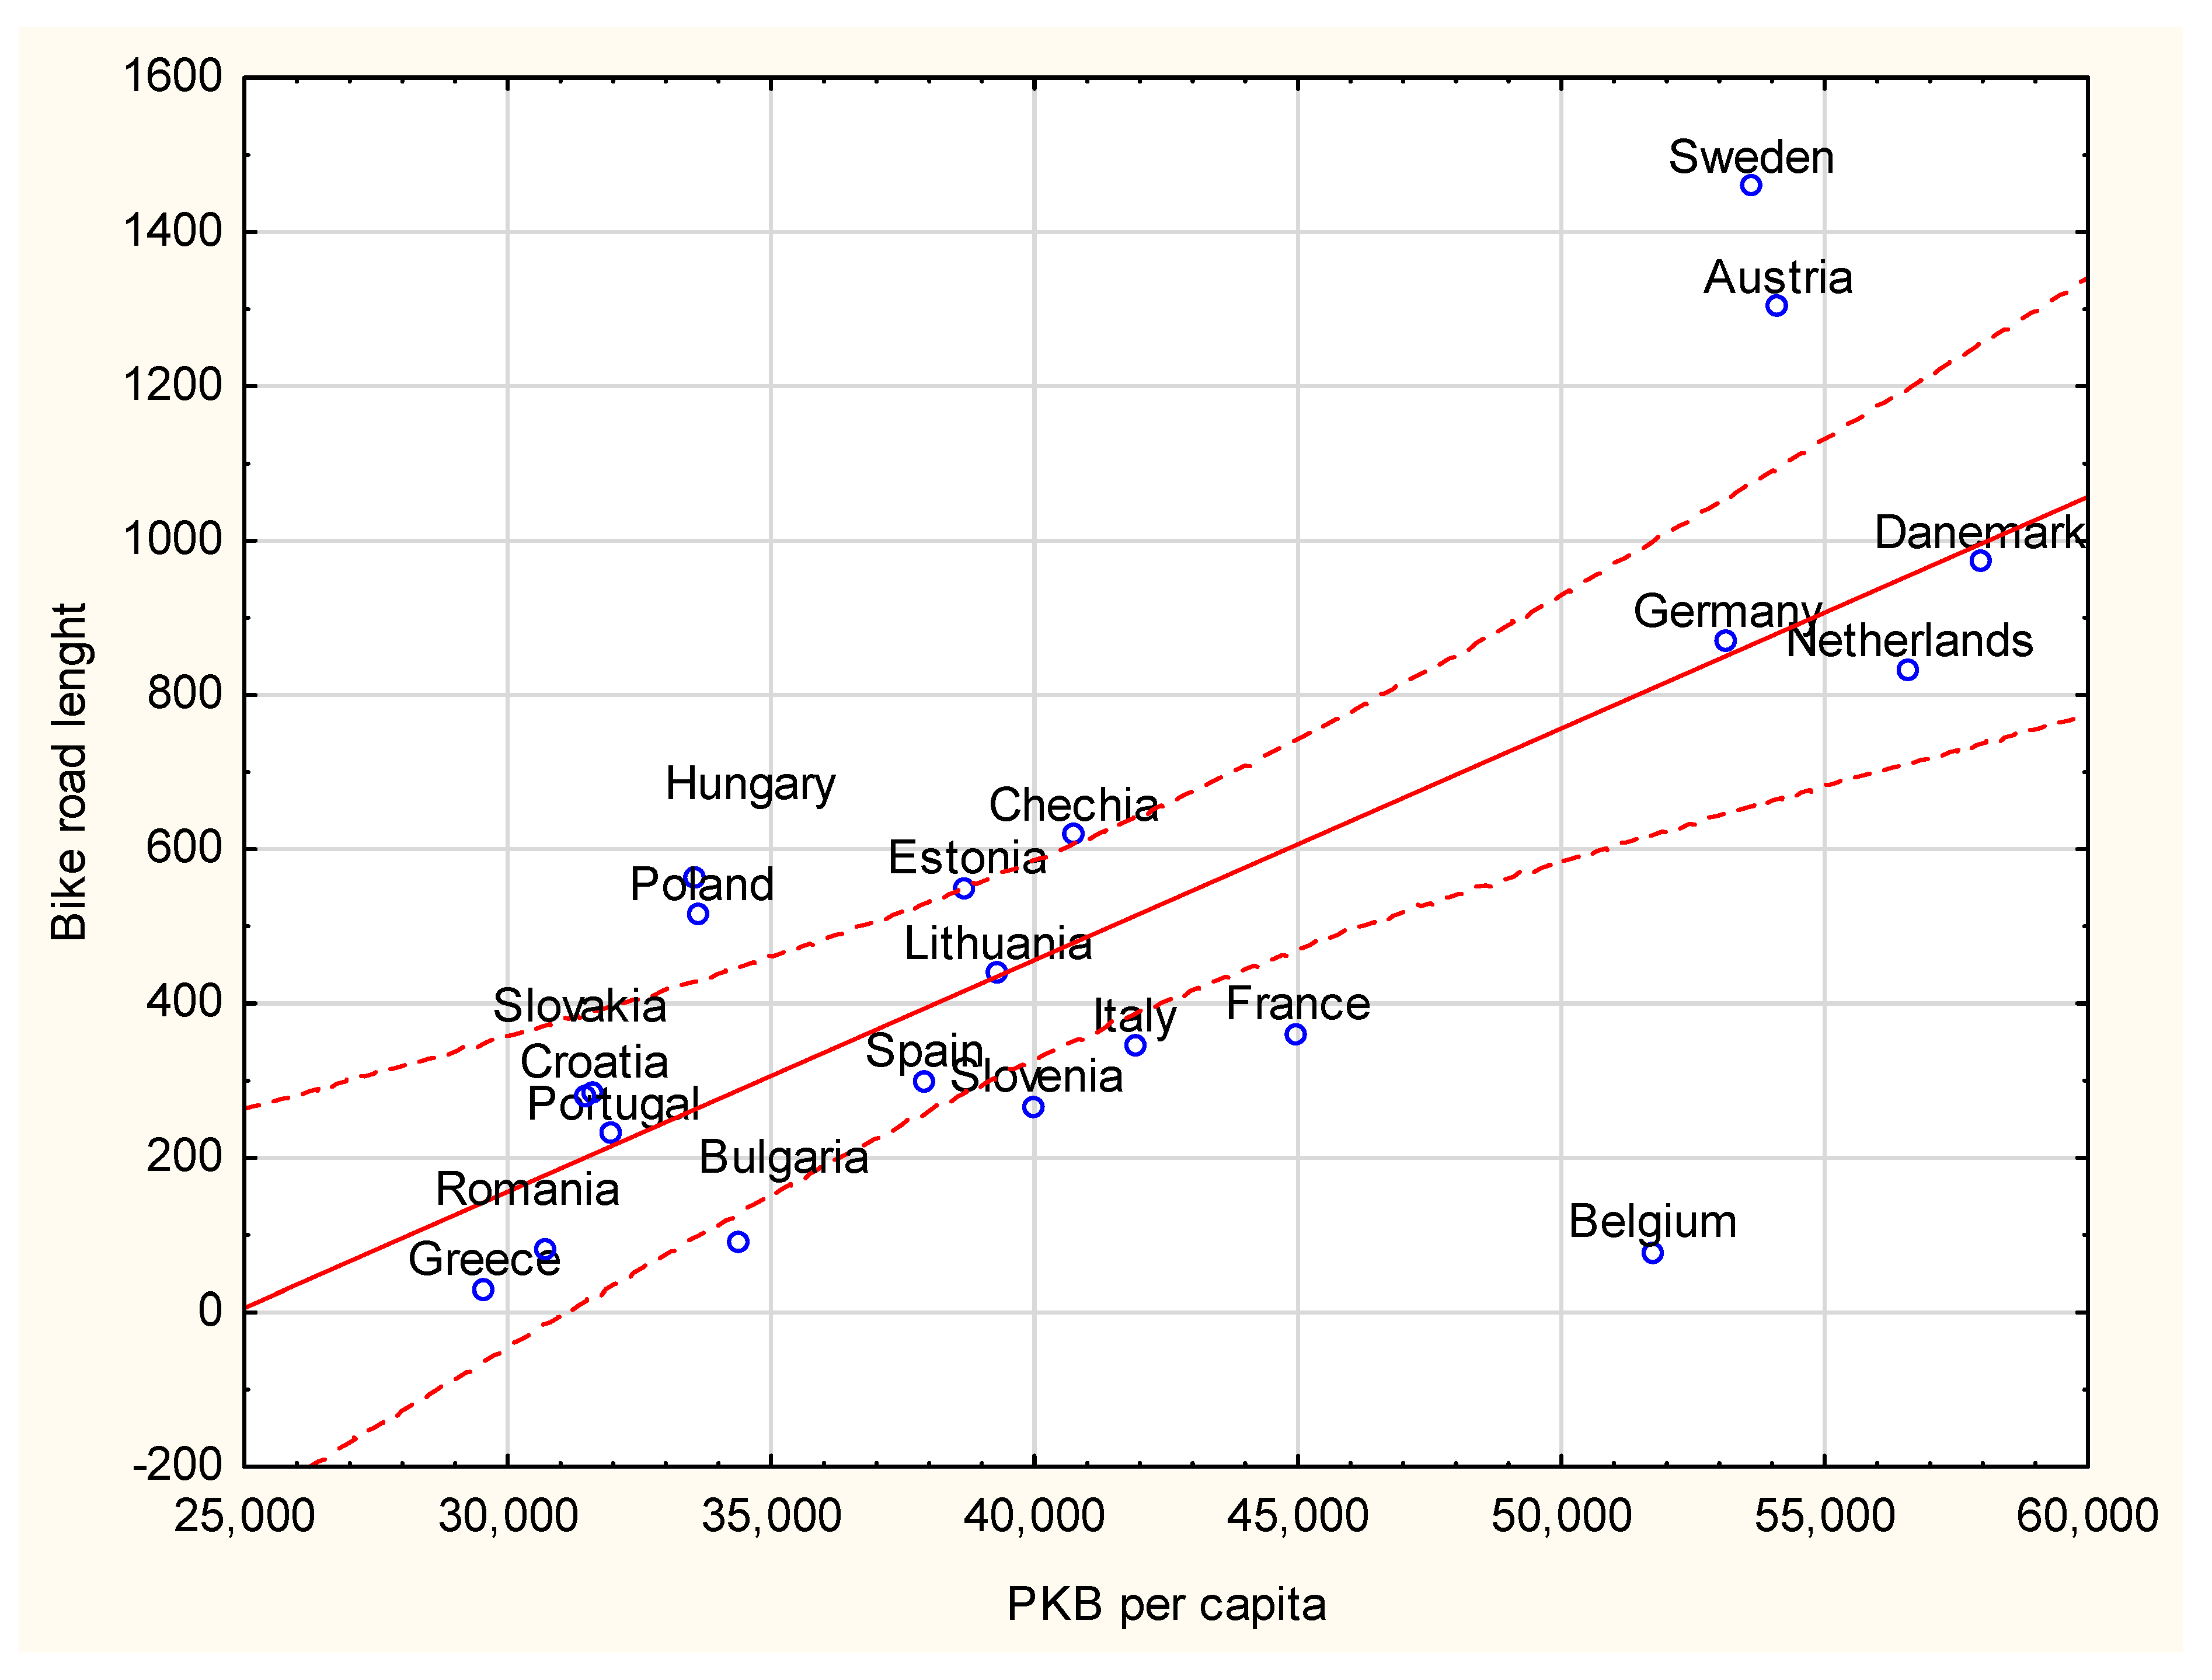
  • The statistical analysis shows that in this case, they are statistically significant (at the level of statistical significance of α = 0.05) between the variables. Between the length of bicycle roads and the wealth of the country, measured by the coefficient of GDP per capita at purchasing power parity, the linear correlation coefficient is −0.73 (a very high coefficient value according to Guilford’s classification).
  • Between the ratio of the length of bicycle paths per square kilometer of land area and the wealth of the country as measured by the ratio of GDP per capita by purchasing power parity, the linear correlation coefficient is −0.49 (an average coefficient value according to Guilford’s classification).
  • Between the indicator of the length of bicycle paths per 1000 residents and the country’s wealth as measured by the GDP per capita ratio according to purchasing power parity, the linear correlation coefficient is −0.52 (a high coefficient value according to Guilford’s classification).
Regarding the analysis of the 17 countries of the European Union conducted without the 3 countries that are significant outliers in terms of GDP per capita and the length and density of bicycle paths from the rest, a relationship was observed, showing that the wealth of a country affects the length of bicycle paths and saturation (both per 1 square kilometer and per 1000 inhabitants) with them of smart cities. Wealthier countries have the financial resources to build new bicycle paths.
The discussion shows that the results for all 24 countries studied do not support hypothesis H4 as follows: the average length of a bicycle path in smart cities is correlated with the GPD per capita of the country. However, after rejecting the outlier points and performing the analysis for the remaining 21 countries, the results support the hypothesis.
When planning a bikeway system, the funds must be used rightfully, which requires detailed planning of the bikeway system. For this reason, cities wishing to implement an advanced smart mobility system should develop an appropriate strategy for this purpose, the implementation of which will allow for them to reduce car traffic and expand the bikeway system with smart mobility [31,40,59].
This is all the more important because an analysis of the literature on the subject shows that the construction of new bikeways is not cheap and requires significant financial resources [62,63,64,65]. Numerous studies conducted in the European Union [64] and the US [57] have shown that the construction of bicycle infrastructure requires significant financial outlays at the initial stage. In this case, wealthier countries can make a much greater commitment to developing infrastructure under smart mobility. The results are also consistent with research conducted for Poland [120,121], which suggested the existence of such a relationship for that country between individual provinces [122,123].
It is worth noting that, except for the special cases of Finland, Ireland, and Luxembourg, the length and saturation of a country are significantly dependent on wealth as measured by GDP per capita. The results also help explain the apparent paradox that smart cities in countries with colder climates have longer and denser bicycle networks compared to countries with warmer climates. To some extent, this is due to the greater affluence of countries located in central and northern Europe. However, not everything can be explained by wealth, as evidenced by the case of Finland. This is because the construction of bicycle paths is also influenced by cultural factors, or factors such as habits of the residents, the promotion of smart mobility, etc.
Based on the study, the relationship between the length of bicycle paths in smart cities and GDP per capita for the surveyed 17 European Union countries can be expressed by the following linear model:
The average bike road length in a smart city = −745.13 + 0.03 ∗ PKB per capita
Figure 11 shows a scatter plot between GDP per capita and the average length of bicycle routes in smart cities for 17 countries. In particular, two groups of countries are worth noting in the graph:
  • Sweden, Austria, Poland, Hungry—countries whose smart cities are characterized by a greater length of bicycle roads than their wealth would suggest.
Belgium, Slovenia, Italy, and France—the countries whose smart cities are characterized by a smaller length of bicycle paths than their wealth would suggest. The development of bicycle transportation should have a positive impact on the lives of residents and various related indicators. For example, it can be noted that the implementation of smart mobility including smart biking should have a positive impact on the health of urban residents as well as the environment [42].

6. Conclusions

6.1. Main Results of the Paper

A well-prepared bike road system is a crucial factor in the development of smart mobility, which is one of the important aspects of a modern smart city. The availability of a bike road network is necessary for the implementation of advanced smart mobility solutions, such as bike sharing, or monitoring applications using smart tires. The bike road network must be dense enough to provide a convenient alternative to traditional modes of transportation. Research shows that there are significant differences between the bike road systems of different smart cities, with cities in northern and central Europe having the best networks. Helsinki has the longest bike road network, 2605 km, due to its Bicycle Action Plan 2020–2025 and its long history of promoting bike transportation. Berlin is in second place with 2478.84 km of bike roads and a well-defined development strategy for bike transportation.
The study indicates that a comprehensive and well-developed network of bicycle paths is a crucial element in the development of smart mobility solutions within a modern smart city. The cities in northern and central Europe, particularly in Germany, Sweden, Finland, Denmark, and the Netherlands, are found to have the best-developed bicycle network among the EU countries. Helsinki and Berlin are found to have the longest bicycle path system and a comprehensive strategy for the development of bicycle transportation as part of their smart cities implementation. Additionally, cities such as Copenhagen, Hanover, and Stockholm are notable for promoting the use of bicycles as an alternative means of transportation. The results of the study, based on the length of bicycle paths per square kilometer of the city area and per thousand inhabitants, highlight the dominance of German cities in terms of the best-developed bicycle network. Thus, the study underscores the importance of investing in a comprehensive network of bicycle paths for the development of smart mobility solutions in a modern smart city.
The cities that have the best bicycle network per square kilometer of an area or 1000 inhabitants are also dominated by cities in northern and central Europe. These cities have prioritized the development of their bicycle path systems as part of their smart city strategies, which has positively impacted the quality of life of their citizens and reduced air pollution. A good system of bicycle paths is critical in promoting the use of bikes as a sustainable and alternative mode of transportation in smart cities.
The results of the research on the correlation between the average temperature level in a country and the average values for smart city bike lanes showed that there is a statistically significant negative correlation between the two variables. The lower a country’s average annual temperature, the more bicycle infrastructure is present in its smart cities, as measured by the length of bicycle paths and the saturation of the city with bicycle paths per square kilometer and 1000 residents. The results are counterintuitive. The result also supports hypothesis H1—that the average length of a bicycle path in smart cities is correlated with the average temperature of the country. The analysis also showed that in the European Union, it is mainly the northern countries that are intensively developing the bicycle path system in their smart cities. The scatter plots support these findings and show the relationship between average temperature and the average length of bicycle paths in smart cities. The results support hypothesis H2 as well—that the average length of bicycle paths in smart cities per 1 square kilometer and 1000 residents is correlated with the average temperature of the country.
The results of the linear model calculation between the length of bicycle paths per 1000 residents in smart cities and average temperature support hypothesis H3, which states that the average length of bicycle paths in smart cities is correlated with the average temperature of the country. The scatter plot analysis showed that most of the countries are within the confidence interval of 0.95, while some countries such as Finland, Portugal, Spain, and the Netherlands had a higher density of bikeways in smart cities compared to countries with similar climates.
On the other hand, the study showed no correlation between the length and density of bicycle paths in smart cities and the wealth of residents, measured by GDP per capita. However, after removing the outliers (Finland, Ireland, and Luxembourg), a significant relationship was observed between the wealth of a country and the length and density of bicycle paths in smart cities. The linear correlation coefficient between the length of bicycle roads and GDP per capita was found to be −0.73, which is a high coefficient value.
Compared to other literature positions about the biking system in European Union countries, the main value is the broadness of the analysis. There was not an analysis of all European Union countries about relations between GDP per capita and bike road systems. Some local analysis—for example, an analysis of Polish provinces [121]—suggests that a relation between variables could exist but the research was only in one country. Additionally, there are some international rapports about building cycling paths. Generally, the conclusion of the rapports [124,125,126,127] is similar to this research—the higher the GDP of the country/city, the more possibility there is to build more cycling passes. However, in those rapports, there is no extensive analysis—only some case studies and examples of particular cities. Some analyzed papers also suggested the positive relationship between GDP and bike ownership [128].
Regarding weather, some previous research suggested that people use bikes more in hotter days of the year [129,130,131,132,133]. On this basis, it could be presumed that hotter climate cities will have more bike paths, but the results of the presented study were different—in European Union countries, cities from northern countries with colder weather have more bike paths compared to the rest of European Union countries.
The main difference between the presented paper and other analyses is the wide range of analyses which included all European Union countries, taking into account temperature factors that were not analyzed in this context.

6.2. Limitations of the Study

The main limitation of the study relates to the data in the analysis—the sample of cities was prepared on the basis of the Cyclorank Index [106], but there are other lists of cities that are best adjusted to bike activities. The main important cities are the same on all lists but in lower places—other lists can differ and can affect the results. Additionally, the analysis is static; for data from 2022, it is possible in future to conduct an analysis for the data in, for example, a two-year period, to achieve a dynamic view of the phenomena.

6.3. Future Research

In this paper, only selected indicators were used—one for economic aspects and one for weather aspects. Of course, it is possible to analyze more important factors and it could be an interesting starting point for future research. For example, it can be possible to analyze factors such as the minimum and maximum temperature, the spread of temperature, the number of sunny days, income distribution, education level, and the impact of living costs on car ownership. Additionally, in future, it is worth conducting a broader analysis of selected countries in the European Union, especially of those countries with the most extensive advancements in bike road system development; this could provide an opportunity to analyze more cities from those countries. Additionally, in future, it is possible to use more advanced statistical methods and/or approaches based on machine learning [134,135,136,137].

Funding

This research was funded by Silesian University of Technology, Faculty of Organization and Management, Department of Economics and Computer Science, grant number BK-274/ROZ1/2023 and 13/010/BK_23/0072.

Informed Consent Statement

Not applicable.

Data Availability Statement

Data are contained within the article.

Conflicts of Interest

The authors declare no conflict of interest.

References

  1. DeMaio, P. Smart Bikes: Public Transportation for the 21st Century. Available online: https://www.metrobike.net/wp-content/uploads/2013/10/Smart-Bikes.pdf (accessed on 7 January 2023).
  2. Wolniak, R.; Jonek-Kowalska, I. The creative services sector in Polish cities. J. Open Innov. Technol. Mark. Complex. 2022, 8, 17. [Google Scholar] [CrossRef]
  3. Wolniak, R.; Jonek-Kowalska, I. The quality of service to residents by public administration on the example of municipal offices in Poland. Adm. Manag. Public 2021, 37, 132–150. [Google Scholar] [CrossRef]
  4. Zayed, M. Towards an index of city readiness for cycling. Int. J. Transp. Sci. Technol. 2017, 5, 210–225. [Google Scholar] [CrossRef]
  5. Savastano, M.; Suciu, M.-C.; Gorelova, I.; Stativă, G.-A. How smart is mobility in smart cities? An analysis of citizens’ value perceptions through ICT applications. Cities 2023, 132, 104071. [Google Scholar] [CrossRef]
  6. Herdiansyah, H. Smart city based on community empowerment, social capital, and public trust in urban areas. Glob. J. Environ. Sci. Manag. 2023, 9, 113–128. [Google Scholar]
  7. Garret, A. Cost-Benefit of Cycling Infrastructure. Available online: https://cyclingsolutions.info/cost-benefit-of-cycling-infrastructure/ (accessed on 2 February 2023).
  8. Bicycle Facility Maintenance. Available online: https://safety.fhwa.dot.gov/PED_BIKE/univcourse/pdf/swless21.pdf (accessed on 2 February 2023).
  9. Maintenance Cost Estimate Report. Available online: https://www.rdbn.bc.ca/application/files/1415/8405/1429/Maintenance_Cost_Estimate_Report.pdf (accessed on 2 February 2023).
  10. Benevolo, C.; Dameri, R.P.; D’Auria, B. Smart mobility in smart city. In Empowering Organizations; Springer International Publishing: Cham, Switzerland, 2016; pp. 3–28. [Google Scholar]
  11. Kunytska, O.; Persia, L.; Gruenwald, N.; Datsenko, D.; Zakrzewska, M. The Sustainable and Smart Mobility Strategy: Country Comparative Overview; Lecture Notes in Networks and Systems; Springer: Cham, Switzerland, 2023; Volume 536, pp. 656–668. [Google Scholar]
  12. Dhingra, M.; Chattopadhyay, S. Advancing smartness of traditional settle-ment-case analysis of Indian and Arab old cities. Int. J. Sustain. Built Environ. 2016, 5, 549–563. [Google Scholar] [CrossRef] [Green Version]
  13. Lara, A.; Costa, E.; Furtlani, T.; Yugutcanlar, T. Smartness that matters: Comprehensive and human-cered characterization of smart cities. J. Open Innov. 2016, 2, 1–13. [Google Scholar]
  14. Albino, V.; Berardi, U.; Dangelico, R.M. Smart cities: Definitions, dimensions, performance, and initiatives. J. Urban Technol. 2015, 22, 3–21. [Google Scholar] [CrossRef]
  15. Ku, D.; Choi, M.; Lee, D.; Lee, S. The effect of a smart mobility hub based on concepts of metabolism and retrofitting. J. Clean. Prod. 2022, 379, 134709. [Google Scholar] [CrossRef]
  16. Huang, B.; Thomas, T.; Groenewolt, B.; van Berkum, E.C. An investigation of the motivators and barriers of smartphone app incentives for encouraging cycling. Decis. Anal. J. 2022, 5, 100127. [Google Scholar] [CrossRef]
  17. Agriesti, S.A.M.; Soe, R.-M.; Saif, M.A. Framework for connecting the mobility challenges in low density areas to smart mobility solutions: The case study of Estonian municipalities. Eur. Transp. Res. Rev. 2022, 14, 32. [Google Scholar] [CrossRef]
  18. Jan Wisniewski-RESETl. Paris’s Public Bike Sharing Schemes: Win or Fail for the Environment? 2019. Available online: https://en.reset.org/blog/pariss-public-bike-sharing-schemes-win-or-fail-environment-09302019 (accessed on 7 January 2023).
  19. Winslow, J.; Mont, O. Bicycle Sharing: Sustainable Value Creation and Institutionalisation Strategies in Barcelona. Sustainability 2019, 11, 728. [Google Scholar] [CrossRef] [Green Version]
  20. Guo, Y.; Yang, L.; Lu, Y.; Zhao, R. Dockless bike-sharing as a feeder mode of metro commute? The role of the feeder-related built environment: Analytical framework and empirical evidence. Sustain. Cities Soc. 2021, 65, 102594. [Google Scholar] [CrossRef]
  21. Komninos, N. Intelligent Cities: Innovation, Knowledge Systems and Digital Spaces; Spon Press: London, UK, 2002. [Google Scholar]
  22. Fontes, T.; Arantes, M.; Figuereido, P.; Novais, P. A Cluster-Based Approach Using Smartphone Data for Bike-Sharing Docking Stations Identification: Lisbon Case Study. Smart Cities 2022, 5, 251–275. [Google Scholar] [CrossRef]
  23. Resis, J.; Marques, P.A.; Marques, P.C. Where Are Smart Cities Heading? A Meta-Review and Guidelines for Future Research. Appl. Sci. 2022, 12, 8328. [Google Scholar] [CrossRef]
  24. Esashika, D.; Masiero, G.; Mauger, Y. An investigation into the elusive concept of smart cities: A systematic review and meta-synthesis. Technol. Anal. Strateg. Manag. 2021, 33, 957–969. [Google Scholar] [CrossRef]
  25. Brzeziński, Ł.; Wyrwicka, M.K. Fundamental Directions of the Development of the Smart Cities Concept and Solutions in Poland. Energies 2022, 15, 8213. [Google Scholar] [CrossRef]
  26. Prajeesh, C.B.; Pillai, A.S. Indian Smart Mobility Ecosystem—Key Visions and Missions. AIP Conf. Proc. 2022, 2555, 50005. [Google Scholar]
  27. Boichuk, N. Smart mobility jako podstawowy element koncepcji inteligentnego miasta—Studium przypadku wybranych polskich miast. In Inteligentne Miasta; Budziewicz-Guźlecka, A., Ed.; Rozprawy i Studia—Uniwersytet Szczeciński: Szczecin, Poland, 2020; Volume 1153, pp. 59–72. ISBN 978-83-7972-402-4. [Google Scholar]
  28. Deakin, M.; Al Waer, H. From intelligent to smart cities. Intell. Build. Int. 2011, 3, 133–139. [Google Scholar] [CrossRef]
  29. Tahmasseby, S. The Implementation of Smart Mobility for Smart Cities: A Case Study in Qatar. Civ. Eng. J. 2022, 8, 2154–2171. [Google Scholar] [CrossRef]
  30. Rahman, S.A.A.; Dura, N.H. Malaysia smart tourism framework: Is smart mobility relevant? Kasetsart J. Soc. Sci. 2022, 43, 1009–1014. [Google Scholar]
  31. Rajabi, M.S.; Habipour, M.; Bakhtiari, S.; Rad, F.M.; Aghakhani, S. The development of BPR models in smart cities using loop detectors and license plate recognition technologies: A case study. J. Future Sustain. 2023, 3, 75–84. [Google Scholar] [CrossRef]
  32. Christensen, H.R. Smart Biking as Gendered Innovations and Smart City Experiment? The Case of Mobike in China, Gendering Smart Mobilities; Routledge: Oxfordshire, UK, 2020; pp. 210–228. [Google Scholar]
  33. Simonofski, A.; Handekyn, P.; Vandennieuwenborg, C.; Wautelet, Y.; Snoeck, M. Smart mobility projects: Towards the formalization of a policy-making lifecycle. Land Use Policy 2023, 125, 106474. [Google Scholar] [CrossRef]
  34. Smart Cities Cycle: Building Bike Culture with Behavioral Economics. Available online: https://www.artefactgroup.com/ideas/smart-cities-cycle/ (accessed on 7 January 2023).
  35. Jonek-Kowalska, I. Health Care in Cities Perceived as Smart in the Context of Population Aging—A Record from Poland. Smart Cities 2022, 5, 1267–1292. [Google Scholar] [CrossRef]
  36. Jonek-Kowalska, I. Housing Infrastructure as a Determinant of Quality of Life in Selected Polish Smart Cities. Smart Cities 2022, 5, 924–946. [Google Scholar] [CrossRef]
  37. Wolniak, R.; Jonek-Kowalska, I. The level of the quality of life in the city and its monitoring. Innovation 2021, 34, 376–398. [Google Scholar] [CrossRef]
  38. Hoffmann, M.L. Bike Lanes Are White Lanes: Bicycle Advocacy and Urban Planning; University of Nebraska Press: Lincoln, NE, USA, 2016. [Google Scholar]
  39. Benni, J.; Macaraig, M.; Malmo-Laycock, J.; Smith Lea, N.; Tomalty, R. Costing of Bicycle Infrastructure and Programs in Canada; Clean Air Partnerships: Toronto, ON, Canada, 2019; Available online: https://www.tcat.ca/wp-content/uploads/2016/08/Costing-of-Bicycle-Infrastructure-and-Programs-in-Canada.pdf (accessed on 2 February 2023).
  40. Shmelev, S.E.; Shmeleva, I.A. Global urban sustainability assessment: A multidimensional approach. Sustain. Dev. 2018, 26, 904–920. [Google Scholar] [CrossRef]
  41. Visvizi, A.; Lytras, M.D. Smart Cities: Issues and Challenges: Mapping Political, Social and Economic Risks and Threats; Elsevier: Amsterdam, The Netherlands, 2019; Volume 1, pp. 47–62. [Google Scholar]
  42. Yun, Y.; Lee, M. Smart city 4.0 from the perspective of open innovation. J. Open Innov. Technol. Mark. Complex. 2019, 5, 92. [Google Scholar] [CrossRef] [Green Version]
  43. Namiot, D.; Sneps-Sneppe, M. On Bikes in Smart City. Autom. Control. Comput. Sci. 2019, 53, 63–71. [Google Scholar] [CrossRef]
  44. Dameri, R.P. Smart City and ICT. Shaping Urban Space for Better Quality of Life. In Information and Communication Technologies in Organizations and Society; Springer International Publishing: Cham, Switzerland, 2016. [Google Scholar]
  45. Orłowski, A.; Romanowska, P. Smart Cities Concept—Smart Mobility Indicator. Cybern. Syst. 2019, 50, 118–131. [Google Scholar] [CrossRef]
  46. Dudycz, H.; Piątkowski, I. Smart mobility solutions in public transport based on analysis chosen smart cities. Bus. Inform. 2018, 2, 19–35. [Google Scholar] [CrossRef] [Green Version]
  47. Wawre, M.; Grzesiuk, K.; Jegorow, D. Smart Mobility in a Smart City in the Context of Generation Z Sustainability, Use of ICT, and Participation. Energies 2022, 15, 4651. [Google Scholar] [CrossRef]
  48. How Bike Sharing Can Improve Urban Economic, Social & Environmental Performance. Available online: http://www.finchandbeak.com/1108/smart-cities-smart-transit-bike-shares.htm (accessed on 2 February 2023).
  49. INSEAD: Bike-Share Systems: Accessibility and Availability. Available online: https://sites.insead.edu/facultyresearch/research/doc.cfm?did=55916 (accessed on 2 February 2023).
  50. Focus on Cycling: Copenhagen Guidelines for the Design of Road Projects, City of Copenhagen. 2013. Available online: https://kk.sites.itera.dk/apps/kk_pub2/index.asp?mode=detalje&id=1133 (accessed on 7 January 2023).
  51. Panda, B.; Rad, F.M.; Rajabi, M.S. Wireless Charging of Electric Vehicles Through Pavements: System, Design, and Technology. In Handbook of Smart Energy Systems; Springer International Publishing: Cham, Switzerland, 2021; pp. 1–26. [Google Scholar]
  52. Faghihinejad, F.; Zoghifard, M.M.; Amiri, A.M.; Monajem, S. Evaluating Social and Spatial Equity in Public Transport: A Case Study. Int. J. Transp. Res. 2022, 1–10. [Google Scholar] [CrossRef]
  53. Yan, H.-T.; Hsu, Y.-C.; Chang, Y.-H. A multilevel analysis of the determinants of the attitude toward separate cycle paths in Taiwan. Soc. Sci. Q. 2022, 103, 1732–1749. [Google Scholar] [CrossRef]
  54. Lee, J.; Seo, D. Influences of Urban Bikeway Design and Land Use on Bike Collision Severity: Evidence from Pohang in South Korea. Sustainability 2022, 14, 8397. [Google Scholar] [CrossRef]
  55. Buehler, R.; Pucher, J. Cycling through the COVID-19 Pandemic to a More Sustainable Transport Future: Evidence from Case Studies of 14 Large Bicycle-Friendly Cities in Europe and North America. Sustainability 2022, 14, 7293. [Google Scholar] [CrossRef]
  56. Zuo, C.; Chen, Q. Intelligent Smart Community Public Service Supply Optimization Algorithm under Big Data Background for Smart City. J. Test. Eval. 2023, 51, 12. [Google Scholar] [CrossRef]
  57. Wang, J.; Huang, J.; Dunford, M. Rethinking the Utility of Public Bicycles: The Development and Challenges of Station-Less Bike Sharing in China. Sustainability 2019, 11, 1539. [Google Scholar] [CrossRef] [Green Version]
  58. United Nations. 17 Sustainable Development Goals. 2015. Available online: https://sdgs.un.org/goals (accessed on 7 January 2023).
  59. Caragliu, A.; Del Bo, C.; Nijkamp, A. Smart Cities in Europe; University Amsterdam, Faculty of Economics, Business Administration and Econometrics: Amsterdam, The Netherlands, 2006. [Google Scholar]
  60. Marsal-Llacuna, M.L.; Colomer-Llinàs, J.; Meléndez-Frigola, J. Lessons in urban monitoring taken from sustainable and livable cities to better address the smart cities initiative. Technol. Forecast. Soc. Chang. 2015, 90, 611–622. [Google Scholar] [CrossRef]
  61. Liaw, A.; Lin, J.-J. Bikeway network design model considering utilitarian and recreational bicycling in urban built-up areas. Int. J. Sustain. Transp. 2022, 1–14. [Google Scholar] [CrossRef]
  62. Chen, C.-W. Can smart cities bring happiness to promote sustainable development? Contexts and clues of subjective well-being and urban livability. Dev. Built Environ. 2023, 13, 100108. [Google Scholar] [CrossRef]
  63. Ploeger, J.; Oldenziel, R. The sociotechnical roots of smart mobility: Bike sharing since 1965. J. Transp. Hist. 2020, 41, 134–159. [Google Scholar] [CrossRef]
  64. Yang, Q.; Cai, J.; Feng, T.; Liu, Z.; Timmermans, H. Bikeway provision and bicycle commuting: City-level empirical findings from the US. Sustainability 2021, 13, 3113. [Google Scholar] [CrossRef]
  65. Dai, B.; Dadashova, B. Review of contextual elements affecting bicyclist safety. J. Transp. Health 2021, 20, 101013. [Google Scholar] [CrossRef]
  66. Firth, C.L.; Hosford, K.; Winters, M. Who were these bike lanes built for? Social-spatial inequities in Vancouver’s bikeways, 2001–2016. J. Transp. Geogr. 2021, 94, 103122. [Google Scholar] [CrossRef]
  67. Macioszek, E.; Świerk, P.; Kurek, A. The Bike-Sharing System as an Element of Enhancing Sustainable Mobility—A Case Study based on a City in Poland. Sustainability 2020, 12, 3285. [Google Scholar] [CrossRef] [Green Version]
  68. Ding, X.; Fan, H.; Gong, J. Towards generating network of bikeways from Mapillary data. Comput. Environ. Urban Syst. 2021, 88, 101632. [Google Scholar] [CrossRef]
  69. Shir, B.; Prakash Verma, J.; Bhattacharya, P. Mobility prediction for uneven distribution of bikes in bike sharing systems. Concurr. Comput. Pract. Exp. 2023, 35, e7465. [Google Scholar] [CrossRef]
  70. Liu, Y.; Feng, T.; Shi, Z.; He, M. Understanding the route choice behaviour of metro-bikeshare users. Transp. Res. Part A Policy Pract. 2022, 166, 460–475. [Google Scholar] [CrossRef]
  71. Turoń, K. Complaints Analysis as an Opportunity to Counteract Social Transport Exclusion in Shared Mobility Systems. Smart Cities 2022, 5, 875–888. [Google Scholar] [CrossRef]
  72. Jonek-Kowalska, I.; Wolniak, R. Sharing economies’ initiatives in municipal authorities’ perspective: Research evidence from Poland in the context of smart cities’ development. Sustainability 2022, 14, 2064. [Google Scholar] [CrossRef]
  73. Jonek-Kowalska, I.; Wolniak, R. Economic opportunities for creating smart cities in Poland. Does wealth matter? Cities 2021, 114, 103222. [Google Scholar] [CrossRef]
  74. Jonek-Kowalska, I.; Wolniak, R. The influence of local economic conditions on start-ups and local open innovation system. J. Open Innov. Technol. Mark. Complex. 2021, 7, 110. [Google Scholar] [CrossRef]
  75. Monti, A. Urban Cycling Mobility in the European Green Deal. J. Eur. Environ. Plan. Law 2022, 19, 55–73. [Google Scholar] [CrossRef]
  76. Torres, N.; Martins, P.; Pinto, P.; Lopes, S.I. Smart Sustainable Mobility on Campus: A secure IoT tracking system for the BIRA Bicycle. In Proceedings of the 2021 16th Iberian Conference on Information Systems and Technologies (CISTI), Chaves, Portugal, 23–26 June 2021. [Google Scholar]
  77. Breengaard, M.H.; Henriksson, M.; Wallsten, A. Smart and Inclusive Bicycling? Non-users’ Experience of Bike-Sharing Schemes in Scandinavia. In Lecture Notes in Computer Science (Including Subseries Lecture Notes in Artificial Intelligence and Lecture Notes in Bioinformatics); Springer: Cham, Switzerland, 2021; Volume 12791, pp. 529–548. [Google Scholar]
  78. Cabral, R.; Peixoto, E.; Carvalho, C.; José, R. An Ecosystem Approach to the Design of Sensing Systems for Bicycles. In Lecture Notes of the Institute for Computer Sciences, Social-Informatics and Telecommunications Engineering; Springer: Cham, Switzerland, 2021; Volume 372, pp. 580–595. [Google Scholar]
  79. Lumiste, M. Cyclorank. 2021. Available online: https://mlumiste.com/projects/cyclorank/?fbclid=IwAR1dmFQXRjo24WYwoJYC0eTPwqiA8_eyWTXzg9e9MvRa7ZLnU3527SDMrz8 (accessed on 2 February 2023).
  80. IESE Cities in Motion Index. 2022. Available online: https://media.iese.edu/research/pdfs/ST-0633-E.pdf (accessed on 2 February 2023).
  81. European Smart Cities. Available online: https://www.smart-cities.eu/ (accessed on 2 February 2023).
  82. Index Score of Leading Smart Cities in Germany in 2021. Available online: https://www.statista.com/statistics/1233294/smart-cities-ranking-germany/ (accessed on 2 February 2023).
  83. German Smart Cities with Open Data. Available online: https://rlist.io/l/german-smart-cities-with-open-data-updated-2020. (accessed on 2 February 2023).
  84. Ogrodnik, K. Multi-criteria analysis of smart cities in Poland. Geogr. Pol. 2020, 93, 2020. [Google Scholar] [CrossRef]
  85. Seven Spanish Municipalities of the CitiES 2030 Initiative, Selected for the European Mission “100 Climate-Neutral and Smart Cities”. Available online: https://diadespues.org/evento/siete-ayuntamientos-espanoles-de-la-iniciativa-cities-2030-seleccionados-para-la-mision-europea-100-ciudades-climaticamente-neutras-en-2030/?lang=en (accessed on 2 February 2023).
  86. Spanish Smart Cities with Open Data. Available online: https://rlist.io/l/spanish-smart-cities-with-open-data-updated-2020 (accessed on 2 February 2023).
  87. Leading Smart Cities in Italy as of 2021. Available online: https://www.statista.com/statistics/858268/leading-smart-cities-in-italy/ (accessed on 2 February 2023).
  88. Smart City in Sweden. Available online: https://www.flandersinvestmentandtrade.com/export/sites/trade/files/market_studies/2020-Smart%20Cities%20Sweden_0.pdf (accessed on 2 February 2023).
  89. Eurostat. Available online: https://ec.europa.eu/eurostat (accessed on 2 February 2023).
  90. Average Temperature by Countries. Available online: https://tradingeconomics.com/country-list/temperature (accessed on 2 February 2023).
  91. Word Economic Outlook Databases. Available online: https://www.imf.org/en/Publications/SPROLLs/world-economicoutlook-databases#sort=%40imfdate%20descending (accessed on 2 February 2023).
  92. Pomoni, M. Exploring Smart Tires as a Tool to Assist Safe Driving and Monitor Tire–Road Friction. Vehicles 2022, 4, 744–765. [Google Scholar] [CrossRef]
  93. Scuderi, T. Smart Tire Sensor Design Using Numerical Simulations. In Proceedings of the 2021 51st European Microwave Conference (EuMC), London, UK, 4–6 April 2022; pp. 837–840. [Google Scholar]
  94. Putri, H.E.; Isrokatun, I.; Majid, N.W.A.; Ridwan, T. Spatial sense instrument for prospective elementary school student. J. Phys. Conf. Ser. 2019, 1318, 12142. [Google Scholar] [CrossRef]
  95. Marasova, D.; Koscak, P.; Staricna, N.; Mako, S.; Matiskova, D. Digitization of air transport using smart tires. In Proceedings of the 2020 New Trends in Aviation Development (NTAD), Starý Smokovec, Slovakia, 17–18 September 2020; Volume 9379074, pp. 164–167. [Google Scholar]
  96. Embarak, O. Smart Cities New Paradigm Applications and Challenges. In Immersive Technology in Smart Cities. EAI/Springer Innovations in Communication and Computing; Aurelia, S., Paiva, S., Eds.; Springer: Cham, Switzerland, 2022. [Google Scholar] [CrossRef]
  97. Helsinki, Bicycle Action Plan 2020–2025. Available online: https://www.hel.fi/static/liitteet/kaupunkiymparisto/julkaisut/julkaisut/julkaisu-32-20.pdf (accessed on 2 February 2023).
  98. Finland: Forum Virium Helsinki A User-Driven Approach to Developing Smart City Services, Mobile Apps and Open Data. Available online: https://www.gsma.com/iot/wp-content/uploads/2012/12/cl_forum_virium_12_12.pdf (accessed on 2 February 2023).
  99. Willberg, E. Bike Sharing as a Part of Urban Mobility in Helsinki. Master’s Thesis, University of Helsinki, Helsinki, Finland, 2019. Available online: https://blogs.helsinki.fi/accessibility/files/2019/03/MasterThesis_EliasWillberg.pdf (accessed on 2 February 2023).
  100. Hämäläinen, M. A Framework for a Smart City Design: Digital Transformation in the Helsinki Smart City. In Entrepreneurship and the Community; Contributions to Management Science; Ratten, V., Ed.; Springer: Cham, Switzerland, 2020. [Google Scholar] [CrossRef]
  101. Niemi-Hugaerts, H. Helsinki Open Smart City IoT Lab Cities and Companies Shaping the IoT Sphere Together. Available online: https://www.openinnovationsummit.org/wp-content/uploads/2018/09/Hanna-Niemi-Hugaerts_Helsinki-Open-Smart-City-IoT-Lab-Cities-and-companies-shaping-the-IoT-sphere-together.pdf (accessed on 2 February 2023).
  102. New Cycling Strategy for Berlin. Available online: https://bicycleinfrastructuremanuals.com/wp-content/uploads/2019/02/radverkehrsstrategie_senatsbeschluss_en-1_New-cycling-strategy-for-Berlin_Germany.pdf (accessed on 2 February 2023).
  103. Karen, A. A Recommendation for a Bicycle Network in Berlin Based on the Guidelines of Copenhagen. Unica Euromaster in Urban Studies. Master’s Thesis. 2013. Available online: https://www.4cities.eu/wp-content/uploads/2016/06/MAthesis_4CITIES_ETROPOLSZKY_KAREN_ALICE_Cohort4.pdf (accessed on 2 February 2023).
  104. Berlin, towards a Mobility Transition for Everyone. Available online: https://www.google.com/url?sa=t&rct=j&q=&esrc=s&source=web&cd=&ved=2ahUKEwjKnq6rtvf8AhUxAxAIHXh1A9gQFnoECAYQAQ&url=https%3A%2F%2Fwww.berlin.de%2Fsen%2Fuvk%2F_assets%2Fverkehr%2Fmobilitaetswende%2Fbroschure_mobilitatswende-en.pdf&usg=AOvVaw1Kfd0yYV9n7f1lyT7IEAgX (accessed on 2 February 2023).
  105. Smart City Strategy Berlin, Senate Department for Urban Development and the Environmen 2015. Available online: https://www.stadtentwicklung.berlin.de/planen/foren_initiativen/smart-city/download/Strategie_Smart_City_Berlin_en.pdf (accessed on 2 February 2023).
  106. Zvolska, L.; Lehner, M.; Voytenko, Y.; Oksana, M.; Plepys, A. Urban sharing in smart cities: The cases of Berlin and London. Local Environ. 2019, 24, 628–645. [Google Scholar] [CrossRef] [Green Version]
  107. Correia, D.; Marques, J.L.; Teixeira, L. The State-of-the-Art of Smart Cities in the European Union. Smart Cities 2022, 5, 1776–1810. [Google Scholar] [CrossRef]
  108. City Development Plan—Mein Hannover 2030. Available online: https://www.google.com/url?sa=t&rct=j&q=&esrc=s&source=web&cd=&ved=2ahUKEwjOx9LIu_f8AhXbCBAIHeW1BJ8QFnoECA0QAQ&url=https%3A%2F%2Fwww.hannover.de%2Fcontent%2Fdownload%2F716799%2Ffile%2FMH%25202030%2520ENGLISCH.pdf&usg=AOvVaw0IF8NzB91G0XAT7Cu0LJ6e (accessed on 2 February 2023).
  109. Stockholm, Urban Mobility Strategy, 2012, City of Stockholm. Available online: https://international.stockholm.se/globalassets/ovriga-bilder-och-filer/urban-mobility-strategy.pdf (accessed on 2 February 2023).
  110. Stockholm Smart City. Available online: https://projects2014-2020.interregeurope.eu/fileadmin/user_upload/tx_tevprojects/library/Ann%20Hellenius.compressed.pdf (accessed on 2 February 2023).
  111. Landahl, G. Stockholm: Smart City. In Handbook of Smart Cities; Augusto, J.C., Ed.; Springer: Cham, Switzerland, 2021. [Google Scholar] [CrossRef]
  112. Pozdniakova, A.M. Smart cities strategies “London-Stockholm-Vienna-Kyiv” in search of common ground and best practices. Acta Innov. 2018, 27, 31–45. [Google Scholar] [CrossRef]
  113. Premat, C. Smart Cities in a Digital Nation: Are Swedish Cities Enough Innovative? In Smarter as the New Urban Agenda; Public Administration and Information Technology; Gil-Garcia, J., Pardo, T., Nam, T., Eds.; Springer: Cham, Switzerland, 2016; Volume 11. [Google Scholar] [CrossRef]
  114. Egean, A.A. Environmental and sociological aspects of sustainable development in green energy: A comparative analysis of the contexts of Europe (Sweden, Denmark, Iceland) and Asia (Japan, South Korea). IOP Conf. Ser. Earth Environ. Sci. 2021, 723, 42030. [Google Scholar] [CrossRef]
  115. Skill, K.; Axell, C.; Gyberg, P. Facts, Values and Perspectives on Sustainable Development in Free Teaching Materials in Sweden. Sustainability 2022, 14, 12290. [Google Scholar] [CrossRef]
  116. Yunita, A.; Biermann, F.; Kim, R.E.; Vijge, M.J. The (anti-)politics of policy coherence for sustainable development in the Netherlands: Logic, method, effects. Geoforum 2022, 128, 92–102. [Google Scholar] [CrossRef]
  117. Kistenkas, F.H.; Smits, M.-J.; Kamphorst, D. Implementing sustainable development into one integrated domestic environmental legislative act. A law comparison between two frontrunners: New zealand and the Netherlands. Eur. Energy Environ. Law Rev. 2020, 29, 240–244. [Google Scholar] [CrossRef]
  118. Monachesi, P. Sustainable Development and ICT Use Among Elderly: A Comparison Between the Netherlands and Italy. Lecture Notes in Computer Science (Including subseries Lecture Notes in Artificial Intelligence and Lecture Notes in Bioinformatics). In Proceedings of the 5th International Conference, Orlando, FL, USA, 26–31 July 2019; pp. 450–462. [Google Scholar]
  119. Smulders-Dane, S.; Smits, T.; Fielding, G.; Chang, Y.; Kuipers, K. Learning from regional sustainable development in the Netherlands: Explorations from a learning history. Sustainability 2016, 8, 527. [Google Scholar] [CrossRef] [Green Version]
  120. Smigiel, C. Behind the smart city theoretical arguments and empirical findings of a multiscalar strategy in Austria. Geogr. Z. 2020, 108, 39–62. [Google Scholar] [CrossRef]
  121. Wolniak, R. Analysis of the Bicycle Roads System as an Element of a Smart Mobility on the Example of Poland Provinces. Smart Cities 2023, 6, 368–391. [Google Scholar] [CrossRef]
  122. Good, Better, Best: The City of Copenhagen’s Bicycle Strategy 2011–2025 (2011), Københavns Kommune, Teknik-Og Miljøforvaltningen, Center for Trafik, Copenhagen. Available online: https://www.cycling-embassy.dk/2012/01/20/good-better-best-the-city-of-copenhagens-bicycle-strategy-2011-2025/ (accessed on 7 January 2023).
  123. Mazurek, A. Rola polityki rowerowej Kopenhagi w realizacji wiodących polityk publicznych Danii. Zarządzanie Publiczne 2018, 3, 323–333. [Google Scholar]
  124. Yanocha, D.; Mawdsley, S. Making the Economic Case for Cycling. 2022. Available online: https://www.itdp.org/wp-content/uploads/2022/06/CC_MAKING-THE-ECONOMIC-CASE-FOR-CYCLING-2022_JUNE11.pdf (accessed on 2 February 2023).
  125. Pimentel, P.V. Performance Evaluation for Bike-Sharing Systems: A Benchmarking among 50 Cities. 2016. Available online: https://ecf.com/sites/ecf.com/files/67_29AM1-1-1216-Pedro%20Pimentel%20de%20Vassimon.pdf (accessed on 2 February 2023).
  126. Zhu, Y.; Diao, M. Understanding the spatiotemporal patterns of public bicycle usage: A case study of Hangzhou, China. Int. J. Sustain. Transp. 2019, 14, 163–176. [Google Scholar] [CrossRef]
  127. Meng, L. Political economy and cycling infrastructure investment. Transp. Res. Interdiscip. Perspect. 2022, 14, 100618. [Google Scholar] [CrossRef]
  128. Chen, W.; Carstensen, T.A.; Wang, R.; Derrible, S.; Rueda, D.R.; Nieuwenhuijsen, M.J.; Liu, G. Historical patterns and sustainability implications of worldwide bicycle ownership and use. Commun, Earth Environ. 2022, 3, 171. [Google Scholar] [CrossRef]
  129. Alam, J. Bicycling and Weather. The Effect of Weather Related Factors on Bicyclists in Stavanger, Norway. Master’s Thesis, University of Stavanger, Stavanger, Norway, 2015. [Google Scholar]
  130. Sanmiguel-Rodríguez, A.; Giraldez, A.V. Impact of climate on a bike-sharing system. Minutes of use depending on day of the week, month and season of the year. Cuad. De Psicol. Del Deporte 2019, 19, 102–112. [Google Scholar] [CrossRef] [Green Version]
  131. Bakke, E.L.; Tørse, T. How does the weather affect the shared bicycle usage? Dan. J. Transp. Res. 2019, 1, 13–29. [Google Scholar]
  132. Goldman, K.; Wessel, J. Some People Feel the Rain, Others Just Get Wet: An Analysis of Regional Differences in the Effects of Weather on Cycling. Inst. Transp. Econ. Münster Work. Pap. 2020, 33. [Google Scholar] [CrossRef]
  133. El-Assi, W.; Mahmoud, M.S.; Habib, K.N. Effects of built environment and weather on bike sharing demand: A station level analysis of commercial bike sharing in Toronto. Transportation 2017, 44, 589–613. [Google Scholar] [CrossRef]
  134. Eslami, E.; Yun, H.B. Attention-Based Multi-Scale Convolutional Neural Network (A + MCNN) for Multi-Class Classification in Road Images. Sensors 2021, 21, 5137. [Google Scholar] [CrossRef]
  135. Bozorogkhou, H.; Alimohammadirokni, M. Estudio e investigación del impacto de los factores de la mezcla de marketing en la compra electrónica a través de teléfonos inteligentes (estudio de caso: Corporación Digikala). Nexo Rev. Científica 2022, 34, 992–1003. [Google Scholar] [CrossRef]
  136. Eslami, E.; Yun, H.B. Improvement of Multiclass Classification of Pavement Objects Using Intensity and Range Images. J. Adv. Transp. 2022, 2022, 4684669. [Google Scholar] [CrossRef]
  137. Samarakkody, A.; Amaratunga, D.; Haigh, R. Characterising Smartness to Make Smart Cities Resilient. Sustainability 2022, 14, 12716. [Google Scholar] [CrossRef]
Figure 1. The flowchart of steps for the presented study. Source: author’s own analysis.
Smartcities 06 00049 g001
Figure 2. Bike road length in smart cities in European Union countries. Source: author’s analysis.
Smartcities 06 00049 g002
Figure 3. Bike road lengths per 1 km2 in smart cities in European Union countries. Source: author’s analysis.
Smartcities 06 00049 g003
Figure 4. Bike road lengths per 1000 citizens in smart cities in European Union countries. Source: author’s analysis.
Smartcities 06 00049 g004
Figure 5. Scatter plot between the country’s average temperature and the average length of bicycle routes in the smart cities. Source: author’s analysis.
Smartcities 06 00049 g005
Figure 6. Scatter plot between the country’s average temperature and the average length of bikeways per square kilometer of area in the smart cities. Source: author’s analysis.
Smartcities 06 00049 g006
Figure 7. Scatter plot between the country’s average temperature and the average length of bike lanes per 1000 residents in the smart cities. Source: author’s analysis.
Smartcities 06 00049 g007
Figure 8. Scatter plot between GDP per capita and the average length of bicycle routes in smart cities. Source: author’s analysis.
Smartcities 06 00049 g008
Figure 9. Scatter plot between GDP per capita and the average length of bikeways per square kilometer of area in smart cities. Source: author’s analysis.
Smartcities 06 00049 g009
Figure 10. Scatter plot between GDP per capita and average length of bikeways per 1000 residents in smart cities. Source: author’s analysis.
Smartcities 06 00049 g010
Figure 11. Scatter plot between GDP per capita and average bicycle road length in the smart cities of 17 countries. Source: author’s analysis.
Smartcities 06 00049 g011
Table 1. List of the cities included in the study with division in countries.
NoCountryCity
1AustriaVienna
2BelgiumBrussels
3BulgariaPlovdiv, Varna, Sofia
4ChechiaPrague
5CroatiaZagreb
6DenmarkCopenhagen, Aarhus
7EstoniaTallinn
8FinlandHelsinki
9FranceNantes, Toulouse, Lyon, Paris, Nice, Marseille
10GermanyHannover, Munster, Bremen, Mannheim, Bonn, Dusseldorf, Munich, Nuremberg, Frankfurt, Hamburg, Duisburg, Karlsruhe, Leipzig, Dortmund, Essen, Berlin, Bielefeld, Bochum, Dresden, Stuttgart, Wuppertal, Cologne
11GreeceThessaloniki
12NetherlandsAmsterdam, Hague, Antwerp, Rotterdam, Utrecht
13HungaryBudapest
14IrelandDublin
15ItalyBologna, Turin, Florence, Milan, Rome
16LithuaniaVilnius
17LuxembourgLuxembourg
18PolandWroclaw, Warsaw, Poznan, Lublin, Krakow, Bydgoszcz, Gdansk, Szczecin, Lodz,
19PortugalLisbon
20RomaniaTimisoara, Cluj-Napoca, Iasi
21SlovakiaBratislava
22SloveniaLjubljana
23SpainValencia, Seville, Alicante, Palma, Barcelona, Zaragoza, Cordoba, Bilbao, Madrid, Malaga, Murcia
24SwedenMalmo, Stockholm, Gothenburg
Source: author’s analysis.
Table 2. Bike roads in European Union smart cities that are best adjusted for bikes.
NoCountryCityBike Road Length
[75]
Road Length
[75,85]
1AustriaVienna1300.7616,373.93
2BelgiumBrussels76.43883.91
3BulgariaPlovdiv94.832263.45
4BulgariaVarna66.194227.75
5BulgariaSofia105.596559.59
6ChechiaPrague616.4820,785.67
7CroatiaZagreb282.719550.99
8DenmarkCopenhagen741.254616.33
9DenmarkAarhus1198.5210,146.21
10EstoniaTallinn548.386622.59
11FinlandHelsinki2605.1814,339.53
12FranceNantes380.412780.18
13FranceToulouse666.925297.21
14FranceLyon275.932494.39
15FranceParis570.136174.52
16FranceNice69.972297.05
17FranceMarseille190.187685.41
18GermanyHannover1026.468361.35
19GermanyMunster927.777347.75
20GermanyBremen1286.5710,271.45
21GermanyMannheim516.436018.61
22GermanyBonn523.755416.14
23GermanyDusseldorf848.488323.37
24GermanyMunich1655.9716,984.83
25GermanyNuremberg677.607610.35
26GermanyFrankfurt729.999883.29
27GermanyHamburg1789.6025,557.07
28GermanyDuisburg618.597576.48
29GermanyKarlsruhe414.686689.29
30GermanyLeipzig765.1210,092.79
31GermanyDortmund812.0711,626.20
32GermanyEssen632.298762.29
33GermanyBerlin2478.8439,808.56
34GermanyBielefeld566.328597.44
35GermanyBochum404.686842.48
36GermanyDresden440.3010,779.37
37GermanyStuttgart399.699192.64
38GermanyWuppertal111.332645.89
39GreeceThessaloniki26.88917.16
40GermanyCologne1466.2514,756.88
41NetherlandsAmsterdam1259.298661.93
42NetherlandsHague548.464693.86
43NetherlandsAntwerp906.375693.08
44NetherlandsRotterdam875.165962.23
45NetherlandsUtrecht559.153609.50
46HungaryBudapest561.1918,618.63
47IrelandDublin251.866009.99
48ItalyBologna408.033739.61
49ItalyTurin305.844815.10
50ItalyFlorence178.574764.17
51ItalyMilan385.878008.79
52ItalyRome437.2021,712.35
53LithuaniaVilnius396.1111,206.06
54LuxembourgLuxembourg157.742254.80
55PolandWroclaw651.5612,543.52
56PolandWarsaw1384.1027,151.26
57PolandPoznan498.8911,518.12
58PolandLublin322.137256.87
59PolandKrakow443.5012,179.54
60PolandBydgoszcz275.296983.12
61PolandGdansk356.209093.51
62PolandSzczecin283.598112.34
63PolandLodz401.8413,668.31
64PortugalLisbon228.754434.45
65RomaniaTimisoara106.812414.10
66RomaniaCluj-Napoca76.862868.69
67RomaniaIasi57.522127.85
68SlovakiaBratislava275.5210,779.00
69SloveniaLjubljana264.766485.76
70SpainValencia511.104143.81
71SpainSeville365.774250.41
72SpainAlicante260.314221.62
73SpainPalma148.594050.32
74SpainBarcelona352.647881.66
75SpainZaragoza267.7110,067.73
76SpainCordoba185.056096.96
77SpainBilbao63.331693.15
78SpainMadrid652.1819,203.75
79SpainMalaga187.317647.25
80SpainMurcia276.1011,143.40
81SwedenMalmo926.264427.65
82SwedenStockholm1845.4410,363.48
83SwedenGothenburg1598.8212,253.42
Source: author’s analysis on the basis of [75,85].
Table 3. Bike roads per area and the population in European Union smart cities that are best adjusted for bikes.
NoCityPopulation [85]Area
[85]
Bike Road/AreaBike Road/PopulationBike Road/Road
1Austria2187.2471.402.540.5511.8%
2Belgium634.8202.551.290.416.2%
3Bulgaria513.3219.505.742.4514.5%
4Bulgaria1221.8203.704.450.7415.9%
5Bulgaria886.838.079.260.404.5%
6Chechia821.7101.3224.463.026.2%
7Croatia506.9116.244.871.126.6%
8Denmark354891.140.070.183.7%
9Denmark388.4258.831.561.045.9%
10Estonia944.340.6210.040.4310.9%
11Finland322.1145.663.601.639.7%
12France344.2140.671.960.802.6%
13France472.1141.079.122.7312.5%
14France333.7367.560.210.238.6%
15France475.5326.291.721.183.0%
16France404.5230.231.200.683.9%
17France324.6162.440.470.242.7%
18Germany567.6240.386.102.589.9%
19Germany1222.6526.151.410.6116.1%
20Germany544.4175.851.050.343.0%
21Germany354.4181.664.472.297.0%
22Germany2873179.162.460.154.1%
23Germany696.7405.010.620.364.2%
24Germany587121.885.081.058.2%
25Germany1472.3108.957.790.5810.2%
26Germany315.21255.410.502.017.2%
27Germany688.782.032.180.263.7%
28Germany313.1280.842.602.337.4%
29Germany504.7328.481.080.713.9%
30Germany426.5118.6213.483.7513.0%
31Germany309.4232.772.361.7711.7%
32Germany587.9217.498.233.047.0%
33Germany1309210.384.880.7812.3%
34Germany335.2102.4225.447.7718.2%
35Germany579.3248.680.230.102.7%
36Germany583.1243.851.700.716.2%
37Germany766.7266.951.660.583.6%
38Germany3664.1241.003.170.217.6%
39Greece673.91093.630.210.345.2%
40Germany175698.142.700.154.1%
41Netherlands3266.1980.290.410.122.9%
42Netherlands1860.3204.011.580.174.4%
43Netherlands554.6717.650.220.287.0%
44Netherlands536.191.493.020.5111.1%
45Netherlands801.6173.543.760.813.4%
46Hungary1620.8326.850.570.122.4%
47Ireland1897.1297.893.110.4920.9%
48Italy314.386.825.951.648.6%
49Italy345.8275.060.690.552.5%
50Italy409.7293.261.320.944.8%
51Italy518.4147.4511.233.199.7%
52Italy319.351.7317.932.9112.6%
53Lithuania325.747.985.750.852.5%
54Luxembourg656.2604.890.630.5813.7%
55Poland308.8395.700.180.233.0%
56Poland753.186.467.840.908.9%
57Poland544.1144.981.020.273.7%
58Poland498.6242.142.351.149.2%
59Poland342181.890.520.284.2%
60Poland364.6310.711.611.374.3%
61Poland574.7303.302.031.073.0%
62Poland122.3918.260.483.572.0%
63Poland806.365.8013.301.0914.7%
64Portugal619.3118.583.080.598.6%
65Romania975.674.191.420.111.6%
66Romania336.420.5389.915.4917.8%
67Romania540187.352.130.744.3%
68Slovakia279.7160.051.771.013.5%
69Slovenia1073.1208.732.630.518.3%
70Spain319.3105.390.260.082.9%
71Spain623.7112.520.950.174.4%
72Spain868.3261.922.550.7712.6%
73Spain549.2496.270.620.566.4%
74Spain602.5304.011.840.9315.5%
75Spain343.41286.580.401.4912.3%
76Spain447.2128.840.510.151.6%
77Spain1841141.299.210.717.9%
78Spain582.2177.002.240.683.5%
79Spain1360215.756.421.025.1%
80Spain311.2207.323.142.095.2%
81Sweden328.6300.550.370.344.2%
82Sweden666.9159.461.770.423.0%
83Sweden368.419.2913.880.732.7%
Source: author’s analysis.
Table 4. European countries—the number of analyzed smart cities and bike road lengths.
NoCountryNumber of CitiesAverage Bike Road LengthAverage Road Length
1Austria11300.7616,373.93
2Belgium176.43883.91
3Bulgaria388.874350.26
4Chechia1616.4820,785.67
5Croatia1282.719550.99
6Denmark2969.887381.2
7Estonia1548.386622.59
8Finland12605.1814,339.53
9France6358.94454.79
10Germany22867.8511,052.02
11Greece126.88917.16
12Hungary1559.153609.50
13Ireland1561.1918,618.63
14Italy5343.18608
15Lithuania1437.2021,712.35
16Luxembourg1396.1111,206.06
17Netherlands5829.685724.118
18Poland9513.0112,056
19Portugal1228.754434.45
20Romania380.42470.21
21Slovakia1275.5210,779.00
22Slovenia1264.766485.76
23Spain11297.287309.1
24Sweden31456.49014.85
Source: author’s analysis.
Table 5. European countries—bike path saturation in the surveyed smart cities.
NoCountryAverage Bike Road/AreaAverage Bike Road/PopulationAverage Bike Road/Road
1Austria15.050.717.9%
2Belgium0.700.238.6%
3Bulgaria0.430.182.5%
4Chechia3.021.073.0%
5Croatia2.190.423.0%
6Denmark7.710.5814.0%
7Estonia0.500.518.3%
8Finland39.607.7718%
9France1.310.638.7%
10Germany4.771.598.0%
11Greece0.130.082.9%
12Netherlands2.030.9315.5%
13Hungary2.691.183.0%
14Ireland1.240.515.6%
15Italy0.350.352.0%
16Lithuania1.510.683.5%
17Luxembourg7.761.3914.4%
18Poland3.780.864.0%
19Portugal11.860.345.2%
20Romania0.580.173.3%
21Slovakia0.920.802.6%
22Slovenia0.440.154.1%
23Spain1.240.564.8%
24Sweden10.143.2417.3%
Source: author’s analysis.
Disclaimer/Publisher’s Note: The statements, opinions and data contained in all publications are solely those of the individual author(s) and contributor(s) and not of MDPI and/or the editor(s). MDPI and/or the editor(s) disclaim responsibility for any injury to people or property resulting from any ideas, methods, instructions or products referred to in the content.

