Article

Design and Implementation of a Real-Time Crowd Monitoring System Based on Public Wi-Fi Infrastructure: A Case Study on the Sri Chiang Mai Smart City

by
Thalerngsak Wiangwiset
1,
Chayada Surawanitkun
1,
Wullapa Wongsinlatam
1,
Tawun Remsungnen
1,
Apirat Siritaratiwat
2,
Chavis Srichan
3,
Prachya Thepparat
4,
Weerasak Bunsuk
4,
Aekkaphan Kaewchan
4 and
Ariya Namvong
1,*
1
Center of Multidisciplinary Innovation Network Talent (MINT Center), Department of Technology and Engineering, Faculty of Interdisciplinary Studies, Nong Khai Campus, Khon Kaen University, Nong Khai 43000, Thailand
2
Department of Electrical Engineering, Faculty of Engineering, Khon Kaen University, Khon Kaen 40002, Thailand
3
Department of Computer Engineering, Faculty of Engineering, Khon Kaen University, Khon Kaen 40002, Thailand
4
Central Maintenance Sector, National Telecom Public Company Limited, Khon Kaen 40000, Thailand
*
Author to whom correspondence should be addressed.
Smart Cities 2023, 6(2), 987-1008; https://doi.org/10.3390/smartcities6020048
Submission received: 7 February 2023 / Revised: 12 March 2023 / Accepted: 14 March 2023 / Published: 17 March 2023

Abstract

:
The COVID-19 pandemic has caused significant changes in many aspects of daily life, including learning, working, and communicating. As countries aim to recover their economies, there is an increasing need for smart city solutions, such as crowd monitoring systems, to ensure public safety both during and after the pandemic. This paper presents the design and implementation of a real-time crowd monitoring system using existing public Wi-Fi infrastructure. The proposed system employs a three-tiered architecture, including the sensing domain for data acquisition, the communication domain for data transfer, and the computing domain for data processing, visualization, and analysis. Wi-Fi access points were used as sensors that continuously monitored the crowd and uploaded data to the server. To protect the privacy of the data, encryption algorithms were employed during data transmission. The system was implemented in the Sri Chiang Mai Smart City, where nine Wi-Fi access points were installed in nine different locations along the Mekong River. The system provides real-time crowd density visualizations. Historical data were also collected for the analysis and understanding of urban behaviors. A quantitative evaluation was not feasible due to the uncontrolled environment in public open spaces, but the system was visually evaluated in real-world conditions to assess crowd density, rather than represent the entire population. Overall, the study demonstrates the potential of leveraging existing public Wi-Fi infrastructure for crowd monitoring in uncontrolled, real-world environments. The monitoring system is readily accessible and does not require additional hardware investment or maintenance. The collected dataset is also available for download. In addition to COVID-19 pandemic management, this technology can also assist government policymakers in optimizing the use of public space and urban planning. Real-time crowd density data provided by the system can assist route planners or recommend points of interest, while information on the popularity of tourist destinations enables targeted marketing.

1. Introduction

In the worldwide effort to curb the transmission of SARS-CoV-2, also referred to as COVID-19, widespread collaboration and adherence to public health measures are crucial. Various politicians and health organizations across multiple nations have emphasized the importance of citizens’ compliance with non-pharmaceutical measures to limit the spread of the virus. Social distancing, which aims to maintain physical distance between individuals, has emerged as a globally widely adopted strategy [1]. Social distancing is now universally acknowledged as a particularly efficient method for preventing the spread of the infection, together with wearing face masks. It is regarded as a must in practically every nation. The Thai government has undertaken several social distancing practices, including curfews, travel restrictions, border inspections, and the closing of schools and public venues [2]. Nevertheless, managing the rate of infection transmission and the effectiveness of the restrictions is a challenging task. People are required to leave their homes to fulfill essential needs, such as obtaining food, medical care, and fulfilling necessary responsibilities and employment obligations. COVID-19 has had a significant impact on day-to-day life and the adoption of new ways of learning, working, and communicating. Therefore, this change may have stamped and change our lives forever. Many countries have now passed the peak of the coronavirus outbreak and are eager to recover their economies. As a preventive measure, governments and businesses are looking for local crowd monitoring or social distancing solutions that enable users to monitor crowd density, assess risks, plan trips, and maintain social distancing. As part of the efforts to promote safety and prevention in Thailand, the Thai government has created the Thai Chana application, a contact-tracing mobile application. The study presented in [3] aimed to investigate how the application impacts in-store customer visits. It concluded that the requirement for registration to enter stores raised a significant concern for privacy.
A real-time crowd monitoring system is one of the most important solutions of smart cities that enable us to continue with daily life during and after the pandemic [4,5]. Various technology-based solutions, as reported in [6,7,8,9,10,11], have emerged to aid the health and medical communities in coping with the COVID-19 challenges and implementing successful social distancing practices. Common approaches are camera or vision-based methods. The use of cameras can be affected by line-of-sight obstructions, suboptimal meteorological conditions, low illumination, and high contrast. Furthermore, privacy concerns are frequently raised regarding the use of cameras [10]. Other approaches are non-vision-based or wireless technologies. Several wireless technologies are commonly used for crowd monitoring, including Wi-Fi, Bluetooth, RFID, and cellular networks. Wi-Fi technology uses access points to monitor the movement and location of Wi-Fi enabled devices. Bluetooth technology uses a similar approach but has a shorter range than Wi-Fi. RFID technology, on the other hand, uses radio waves to identify and track tagged objects or individuals. Cellular network monitoring transmits information between the mobile device and the cell site. A more recent and modern approach involves Wi-Fi monitoring systems that rely on individuals connecting their smartphones to a network. Leveraging Wi-Fi networks to detect people in an area is an efficient approach that is more practical than other options because public Wi-Fi infrastructures are already available in smart cities [12]. To utilize cellular networks, various mobile network operators must work together [13]. According to [11,14], RFID technology requires additional investment in both active and passive radio frequency identification sensors.
Bluetooth technology has gained significant attention as a potential solution for crowd monitoring due to its low power consumption, high accuracy, and low cost. Several studies have explored the use of Bluetooth-based crowd monitoring in various settings, including office spaces, smart homes, and smart buildings [15,16,17,18]. Bluetooth technology offers numerous advantages for crowd monitoring, but there are also disadvantages to consider. Bluetooth is turned off by default on most mobile devices [19]. In [15,16], beacon devices are needed, or a specific application must be installed on mobile devices, along with a processing server. According to [18], occupant and environment sensors were required. In [20], the number of sensors needed was reduced in order to predict an area’s occupancy. The empirical findings revealed that indoor CO2 levels and the presence of Wi-Fi connected devices were crucial factors for accurately predicting occupancy levels across all types of spaces. For long-range monitoring, Wi-Fi has the advantage. Wi-Fi access points have a broader range and can cover larger areas when compared to Bluetooth beacons. This makes Wi-Fi technology suitable for monitoring large crowds, such as those in stadiums, convention centers, or public open spaces. On the other hand, Bluetooth is ideal for short-range monitoring. This makes them perfect for monitoring small, localized crowds, such as those in retail stores or indoor office spaces. In the work of [21], integrating Wi-Fi and Bluetooth capabilities produced superior results over using either Wi-Fi or Bluetooth alone. Wi-Fi only is generally superior to Bluetooth only. Wi-Fi is also more practical than Bluetooth since mobile devices are more likely to have Wi-Fi enabled than Bluetooth. Additionally, a Bluetooth-detecting device is required, as well as the utilization of existing Wi-Fi infrastructure. This is also true if the implementation of other technologies necessitates the acquisition of additional sensing devices. Other practical considerations when deploying specific-purpose devices are that they require connections to a power supply and communication network and that they require maintenance [22]. For utilizing existing Wi-Fi network infrastructure, the monitoring system has two options: invest in additional sensing devices with specific functions or use existing Wi-Fi access points as sensors. This research presents the design and implementation of the real-time crowd monitoring system based on existing public Wi-Fi infrastructure without additional investment in the Sri Chiang Mai Smart City.
The rest of the paper is structured as follows: Section 2 presents related works on crowd monitoring using Wi-Fi technology. Section 3 presents a case study on Sri Chiang Mai Smart City. Section 4 is the material and methods section, in which the system architecture and implementation is proposed. The output results, which are presented and analyzed in Section 5, are also further discussed in Section 6. Finally, Section 7 contains the conclusion.

2. Literature Review

Several studies have been conducted on the practice of crowd monitoring via Wi-Fi technology, but they differ in their approach. Certain studies utilize existing Wi-Fi access points or require additional specific devices. Meanwhile, others focus on practical usage or laboratory experiments. The studies also differ in terms of real-time monitoring capabilities, the availability for use, behavior analysis, and the provision of public datasets.
In the work of [22], a specific purpose sensing device was built. Each Wi-Fi sensor was constructed with a Raspberry Pi 3B, an Alpha AWUS036NHA Wi-Fi dongle, and a 4G dongle. Sensing data were processed and stored in a SQL database in real time as a temporary repository. The data from the SQL database were periodically transferred into binary files and saved in the file system for future monitoring. The system demonstrated its suitability for monitoring public places and was finally installed at the Humanities Library, which is a big library in the Université libre de Bruxelles.
A specific purpose sensing device was developed in another study [23]. The device consisted of a single-board Raspberry Pi Zero W and a wireless network adapter (TB Ralink 5370), with additional external components incorporated in the final version to address technical issues. Along with creating isolated sensors, a comprehensive network architecture was also developed by the researchers. The collected data were stored on a server as a series of CSV files, which could be later analyzed and visualized.
The work of [24] developed Wi-Fi sensing boxes that were designed for specific purposes using the Raspberry Pi Model B. This was achieved along with an extra Wi-Fi USB dongle for collecting probe requests. These boxes were installed in ten different locations around the Marina Bay in Singapore for the i Light Singapore 2019 event, which took place between January and February 2019. The framework for collecting and analyzing data was demonstrated, and the data collected during the event were saved on a server for future analysis. Several covert patterns present in the data were identified and analyzed by the researchers.
In [25], a Wi-Fi sensor with a specific purpose was constructed. The device consisted of a Raspberry Pi 3 with Raspbian installed, and a Huawei 4G dongle was also added. The study was centered on the Winter Wonders event held in the city of Brussels, Belgium, between 30 November 2018 and 6 January 2019. Crowd data in the form of time-series were gathered from the event’s two busiest areas, Sainte-Catherine and Bourse, and was also later used for forecasting purposes.
The work of [26] focused on the outcomes of a crowd monitoring tool in connection to the temporary prototype urban alterations executed in the historic city core of Bologna, Italy, as part of the Regeneration and Optimization of Cultural and Knowledge Cities (ROCK) project [27]. The Data Fusion Research Centre (DFRC), the project’s technical partner, deployed a series of sensors to collect the data [28]. The aggregated data were subsequently published in a publicly accessible location and made available for download in Excel format. The project proposed a solution for the smart city context that may benefit from big data analytics not only during the planning stage, but also during the verification phase of the actual consequences of the implemented strategies.
A near real-time monitoring system that utilized data from the current Wi-Fi infrastructure was proposed in [29]. The suggested approach enabled the high-frequency monitoring of crowd density at 5-min intervals or less. The system required products and infrastructure from Cisco Meraki [30]. In an empirical test in the city of Palma, located in the Balearic Islands, Spain, a cluster was constructed to collect the data flow based on an Apache Kafka server, which is an open-source solution for controlling data flows in a distributed database. The collected data were processed and stored in a relational database, which were managed by the PostgreSQL database engine. Later, the gathered information could be analyzed.
This paper introduces a Wi-Fi-based crowd monitoring solution that utilizes existing Wi-Fi access points (APs) and Wi-Fi network infrastructure. Wi-Fi APs are used as a network of always-on sensors. Wi-Fi roaming patterns and access points’ geospatial data are combined to enable real-time crowd monitoring and crowd behavior analysis in public places. A visualization of the crowd density map was generated in order to aid with risk assessment and social distancing compliance traveling planning. Historical data are also collected as a dataset, which is available for download. In Table 1, a comparison of the features of this work and related works is presented.

3. A Case Study on the Sri Chiang Mai Smart City

Sri Chiang Mai is a tourist town in Nong Khai Province, Thailand, with a long length of land bordering the Mekong River. It is opposite Vientiane, the capital city of Laos, which has one of the most beautiful landscapes. Along the banks of the Mekong River, shops, restaurants, and beverage stands will serve tourists and locals who come to engage in activities such as work, exercise, and leisure. Thus, a large number of locals and tourists visit this area every day. It is also for these reasons that the Sri Chiang Mai council provides Wi-Fi infrastructure, which is operated by National Telecom Public Company Limited. The primary objective of this network is to provide broadband internet access to all visitors in the city. There are nine Wi-Fi APs located along the Mekong River, which are highlighted in Figure 1 with green markers. The node names and locations are provided in Table 2.

4. Materials and Methods

A three-tiered architecture is proposed to support the system, as shown in Figure 2. The sensing domain focuses on data acquisition, the communication domain focuses on data communication, and the computing domain focuses on data visualization and analysis.

4.1. Sensing Domain

The purpose of the work is to implement a real-time crowd monitoring solution that utilizes existing Wi-Fi APs and Wi-Fi network infrastructure. There is no need to invest more in a specific device or a communication network. In the network, there are different models of APs that are presented from different manufacturers. Trying to control the various APs without its dedicated controller is challenging. The APs are used as always-on sensors. Detection of the presence of a mobile device near an AP is accomplished by detecting probe requests sent by devices with connectivity based on the 802.11 protocol family. Therefore, the approximate location of a mobile device can be determined based on the position of the AP. This method relies on having the precise geographic location of all APs in the network and assuming that each AP creates a separate network beyond the radio range of any other AP. As illustrated in Figure 3, one of Sri Chiang Mai public Wi-Fi hotspots is located at the Naga Courtyard station.
Given that the primary aim of the system is to monitor crowds, ensuring the privacy and security of the collected and generated data is crucial. To this end, the sensing data have been encrypted to avert any potential breaches. Additionally, irrelevant data were not gathered. All connections between APs and the server employ many layers of authentication and are encrypted using HTTPS to prevent man-in-the-middle attacks. All data have been saved on a secure server on a secure network provided by National Telecom Public Company Limited.

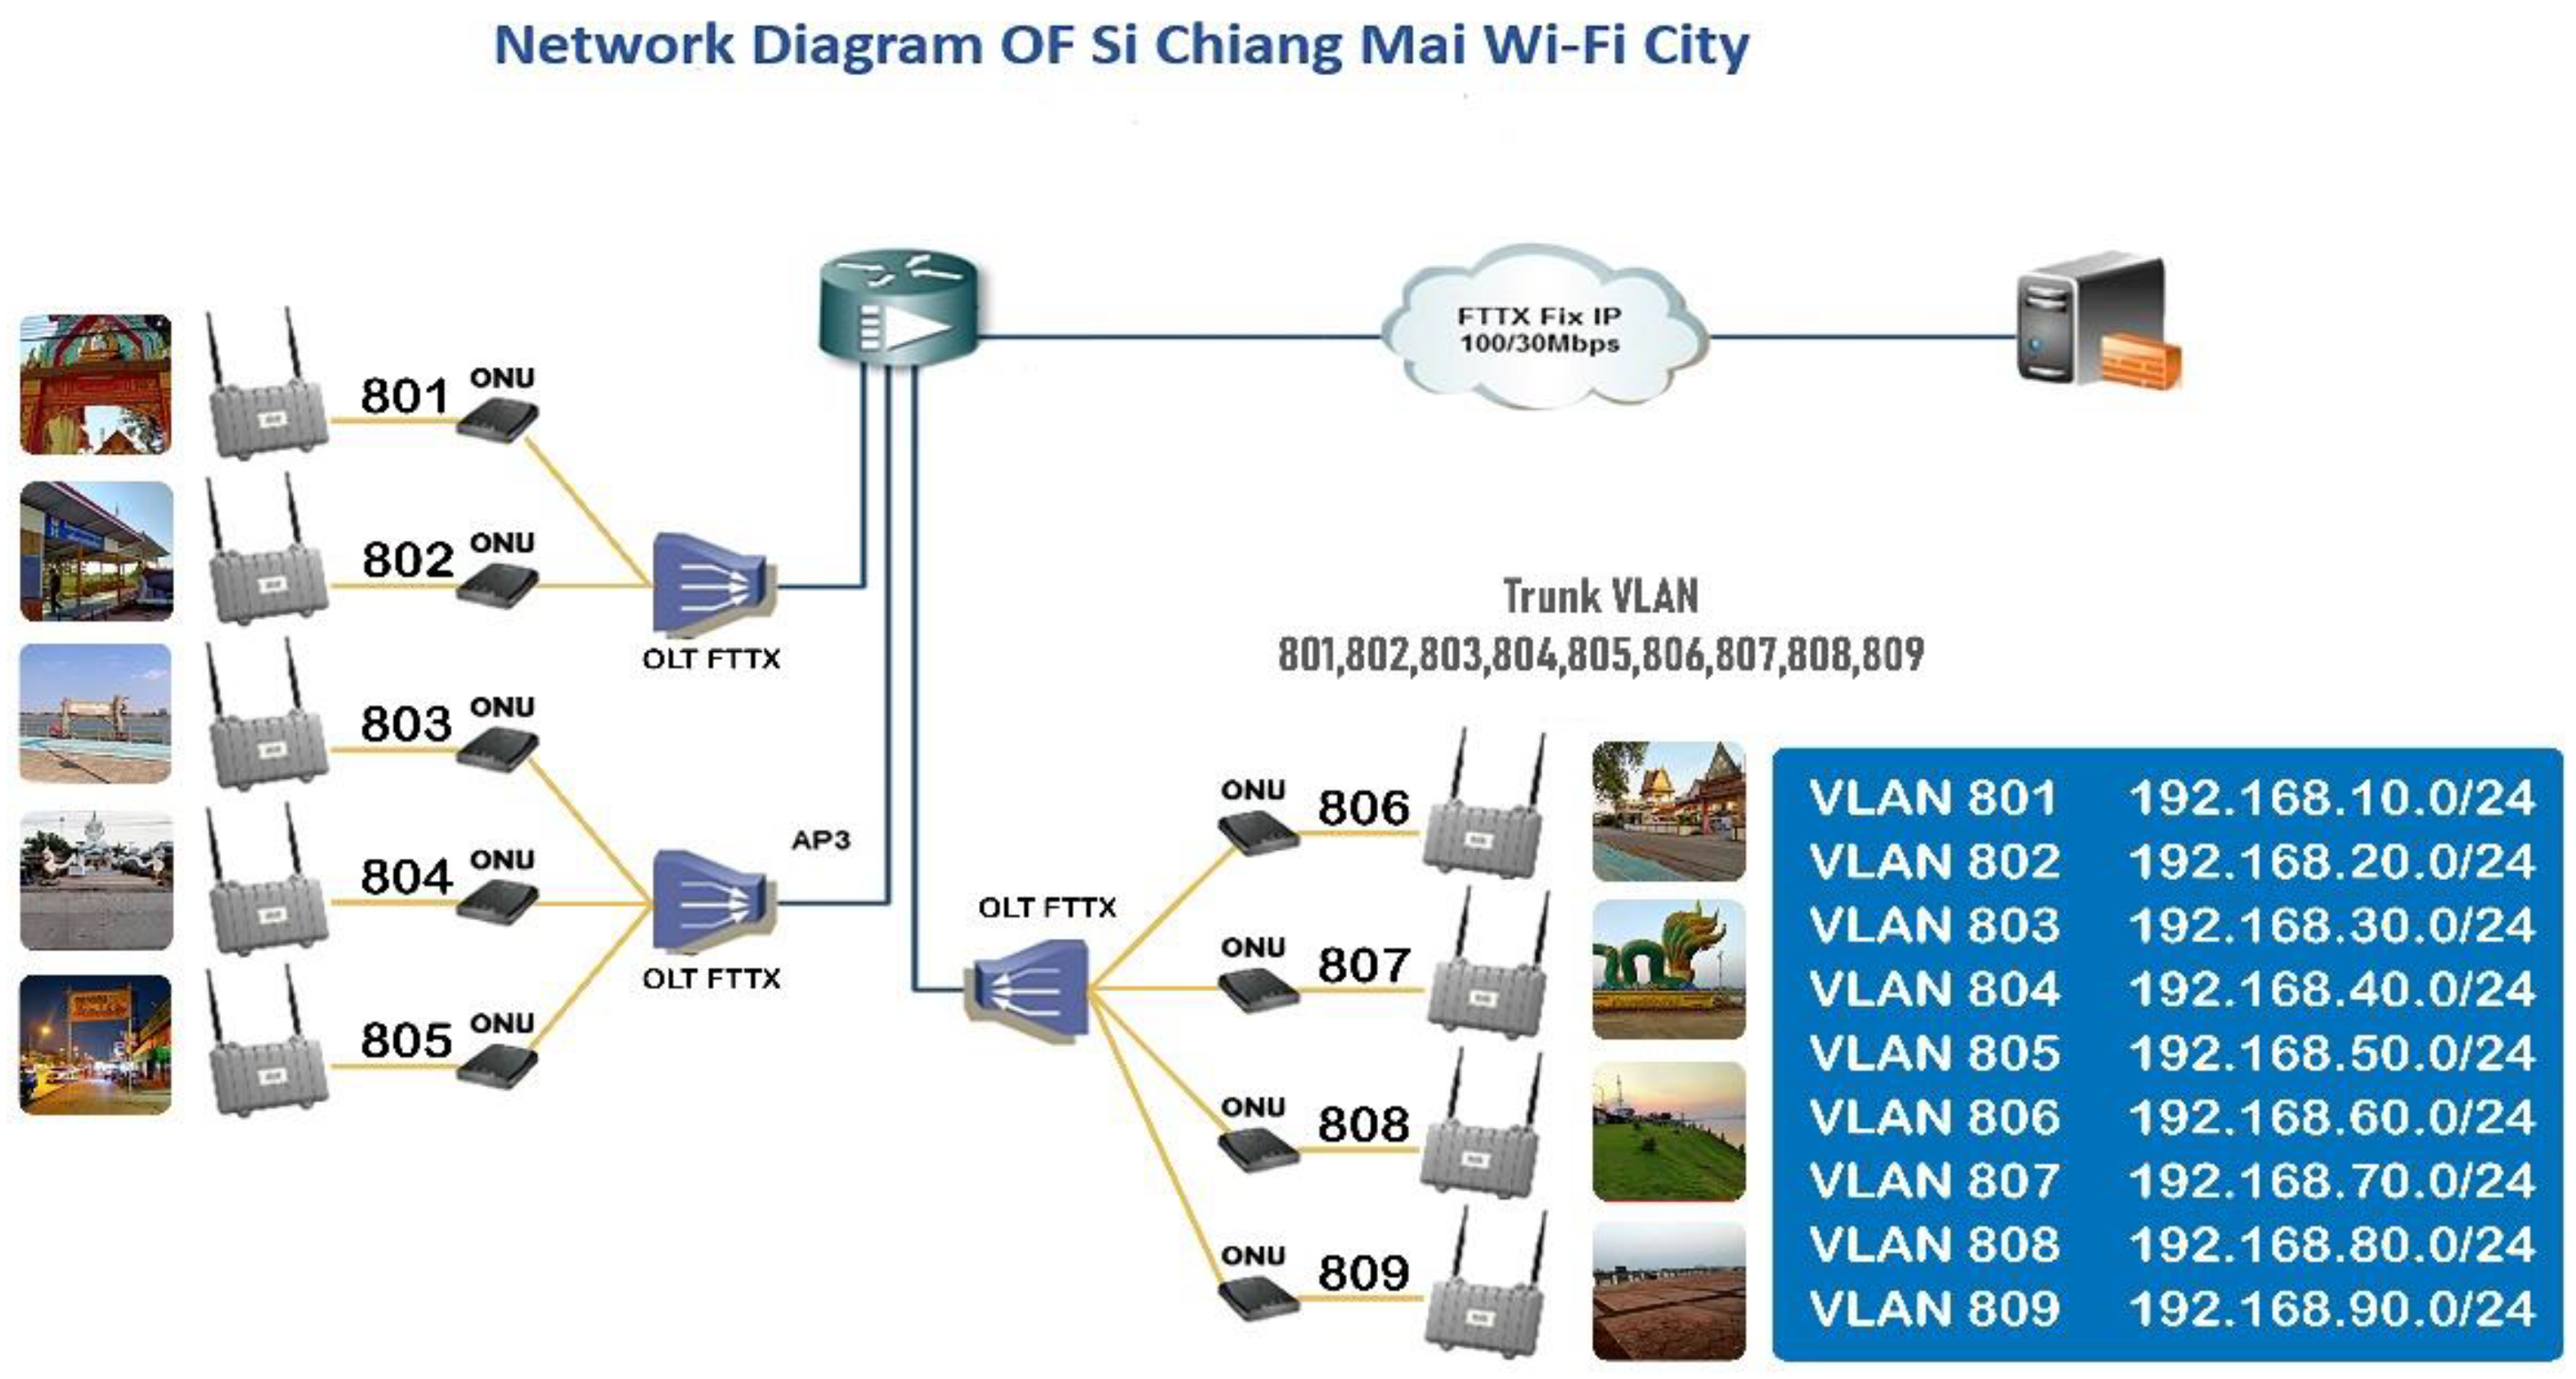
4.2. Communication Domain

To support a system that can be used in the real world—in this case, Sri Chiang Mai city—the technical architecture design and configuration are required. To allow localization of the present mobile device, a Wi-Fi network is initially logically divided into nine subnetworks for each site. Therefore, there are nine virtual local area networks (VLAN) for nine hotspot stations. Each VLAN assigned to an AP must be able to connect to a node Optical line terminal (OLT). This is a device that provides FTTx via a switch and is bridged to the AP via an optical network unit (ONU), as seen in Figure 4.
All sensing data from all APs will be transmitted to the processing server. The encrypted MAC address, the first detection time, the latest detection time, and the identity of the data collector are included in each record. The data are sent to the database server at every 1-min interval. Database cluster DB is being used to handle the massive amount of sensing and processing data. Then, the crowd estimation is calculated by counting the number of devices in each location. After that, the obtained data will be stored in a relational database. Data mining solutions can be applied to organized data collected in a relational database to extract valuable information for urban planners. Datasets are available for download at “https://nms.ntone.cloud/udn/realtime (accessed on 28 February 2023)”.

4.3. Computing Domain

The computing domain comprises three main tasks, including the processing of data, the creation of user-friendly visual representations for the user, and the analysis and understanding of urban behaviors.

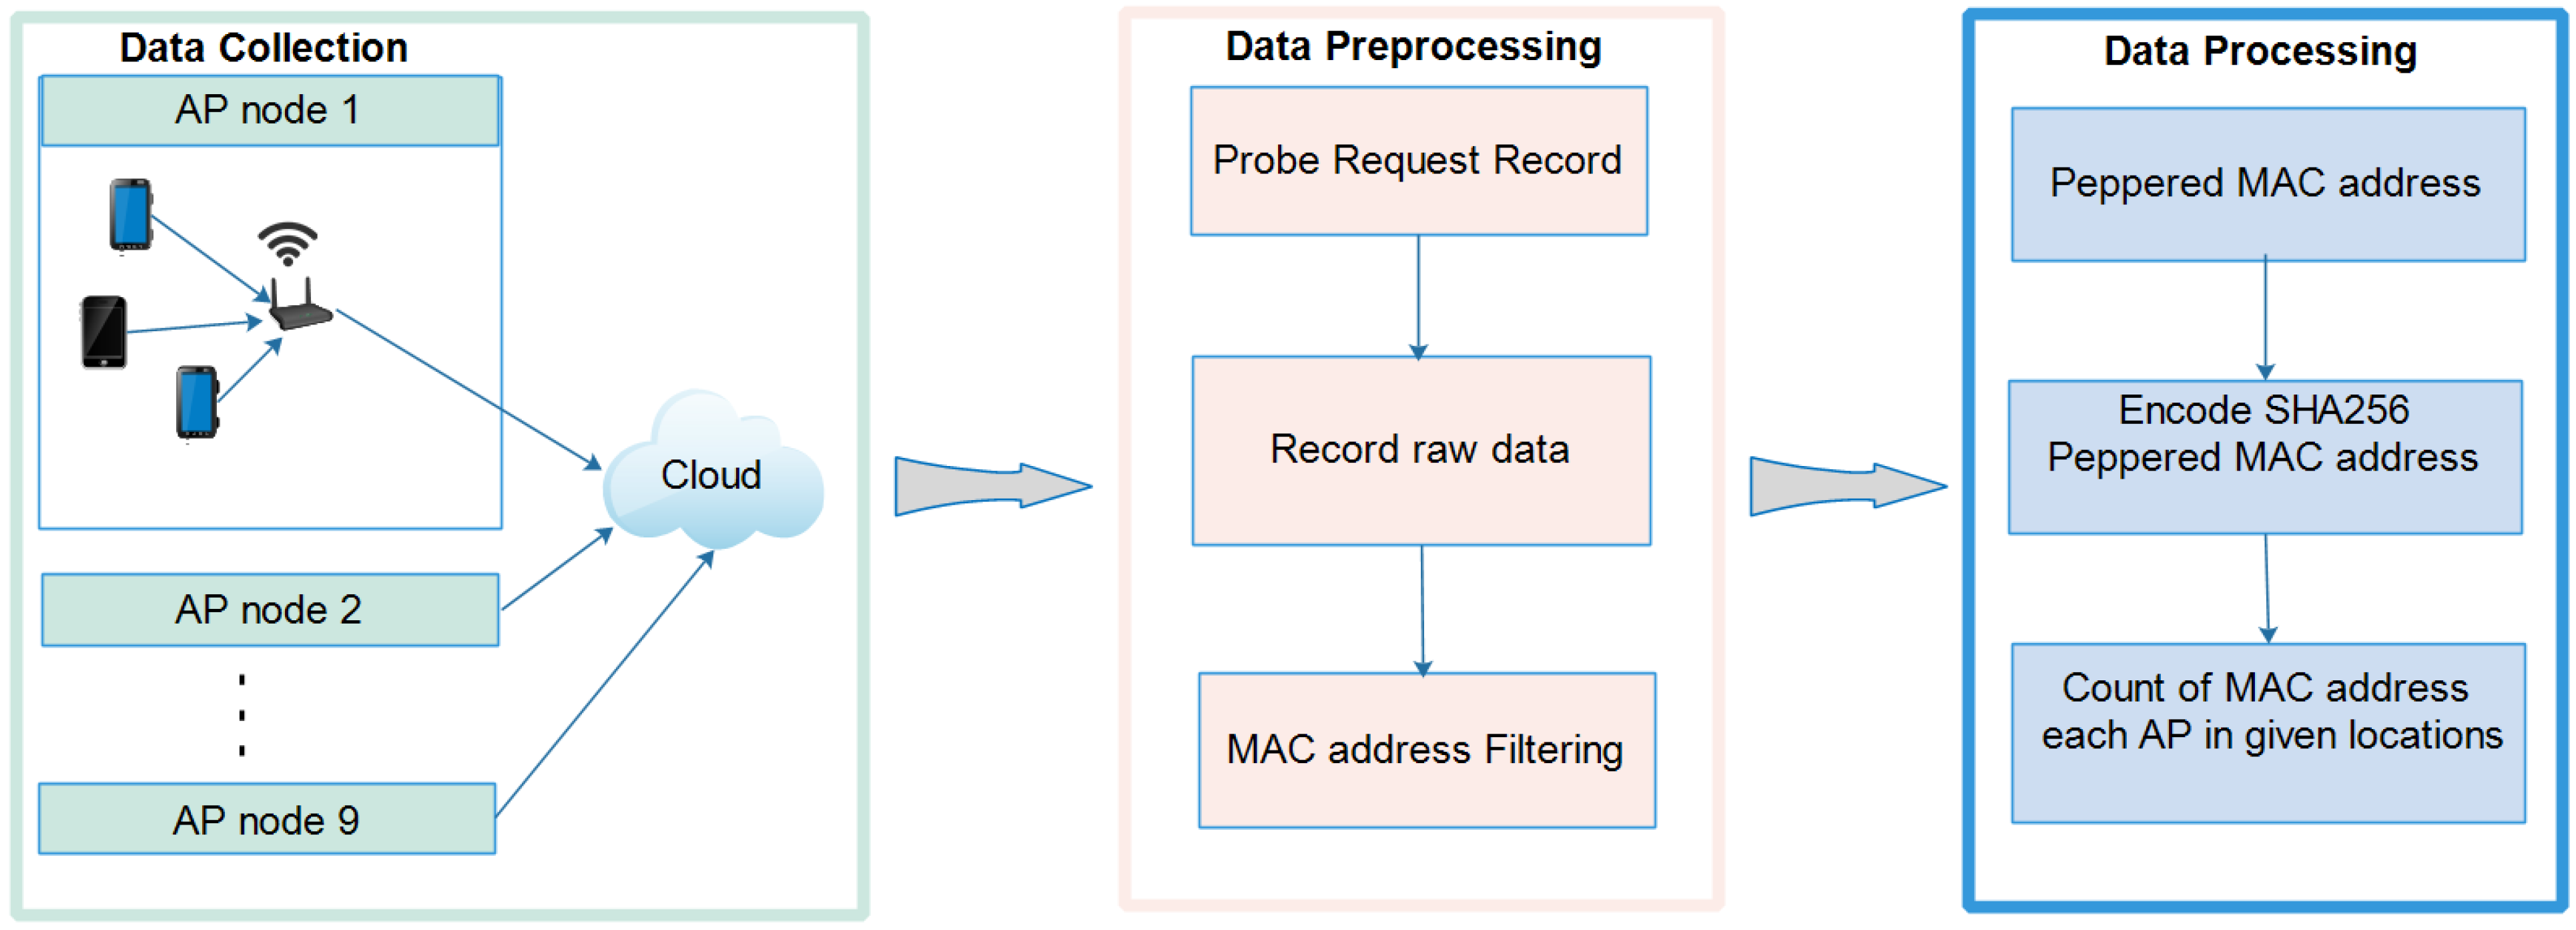
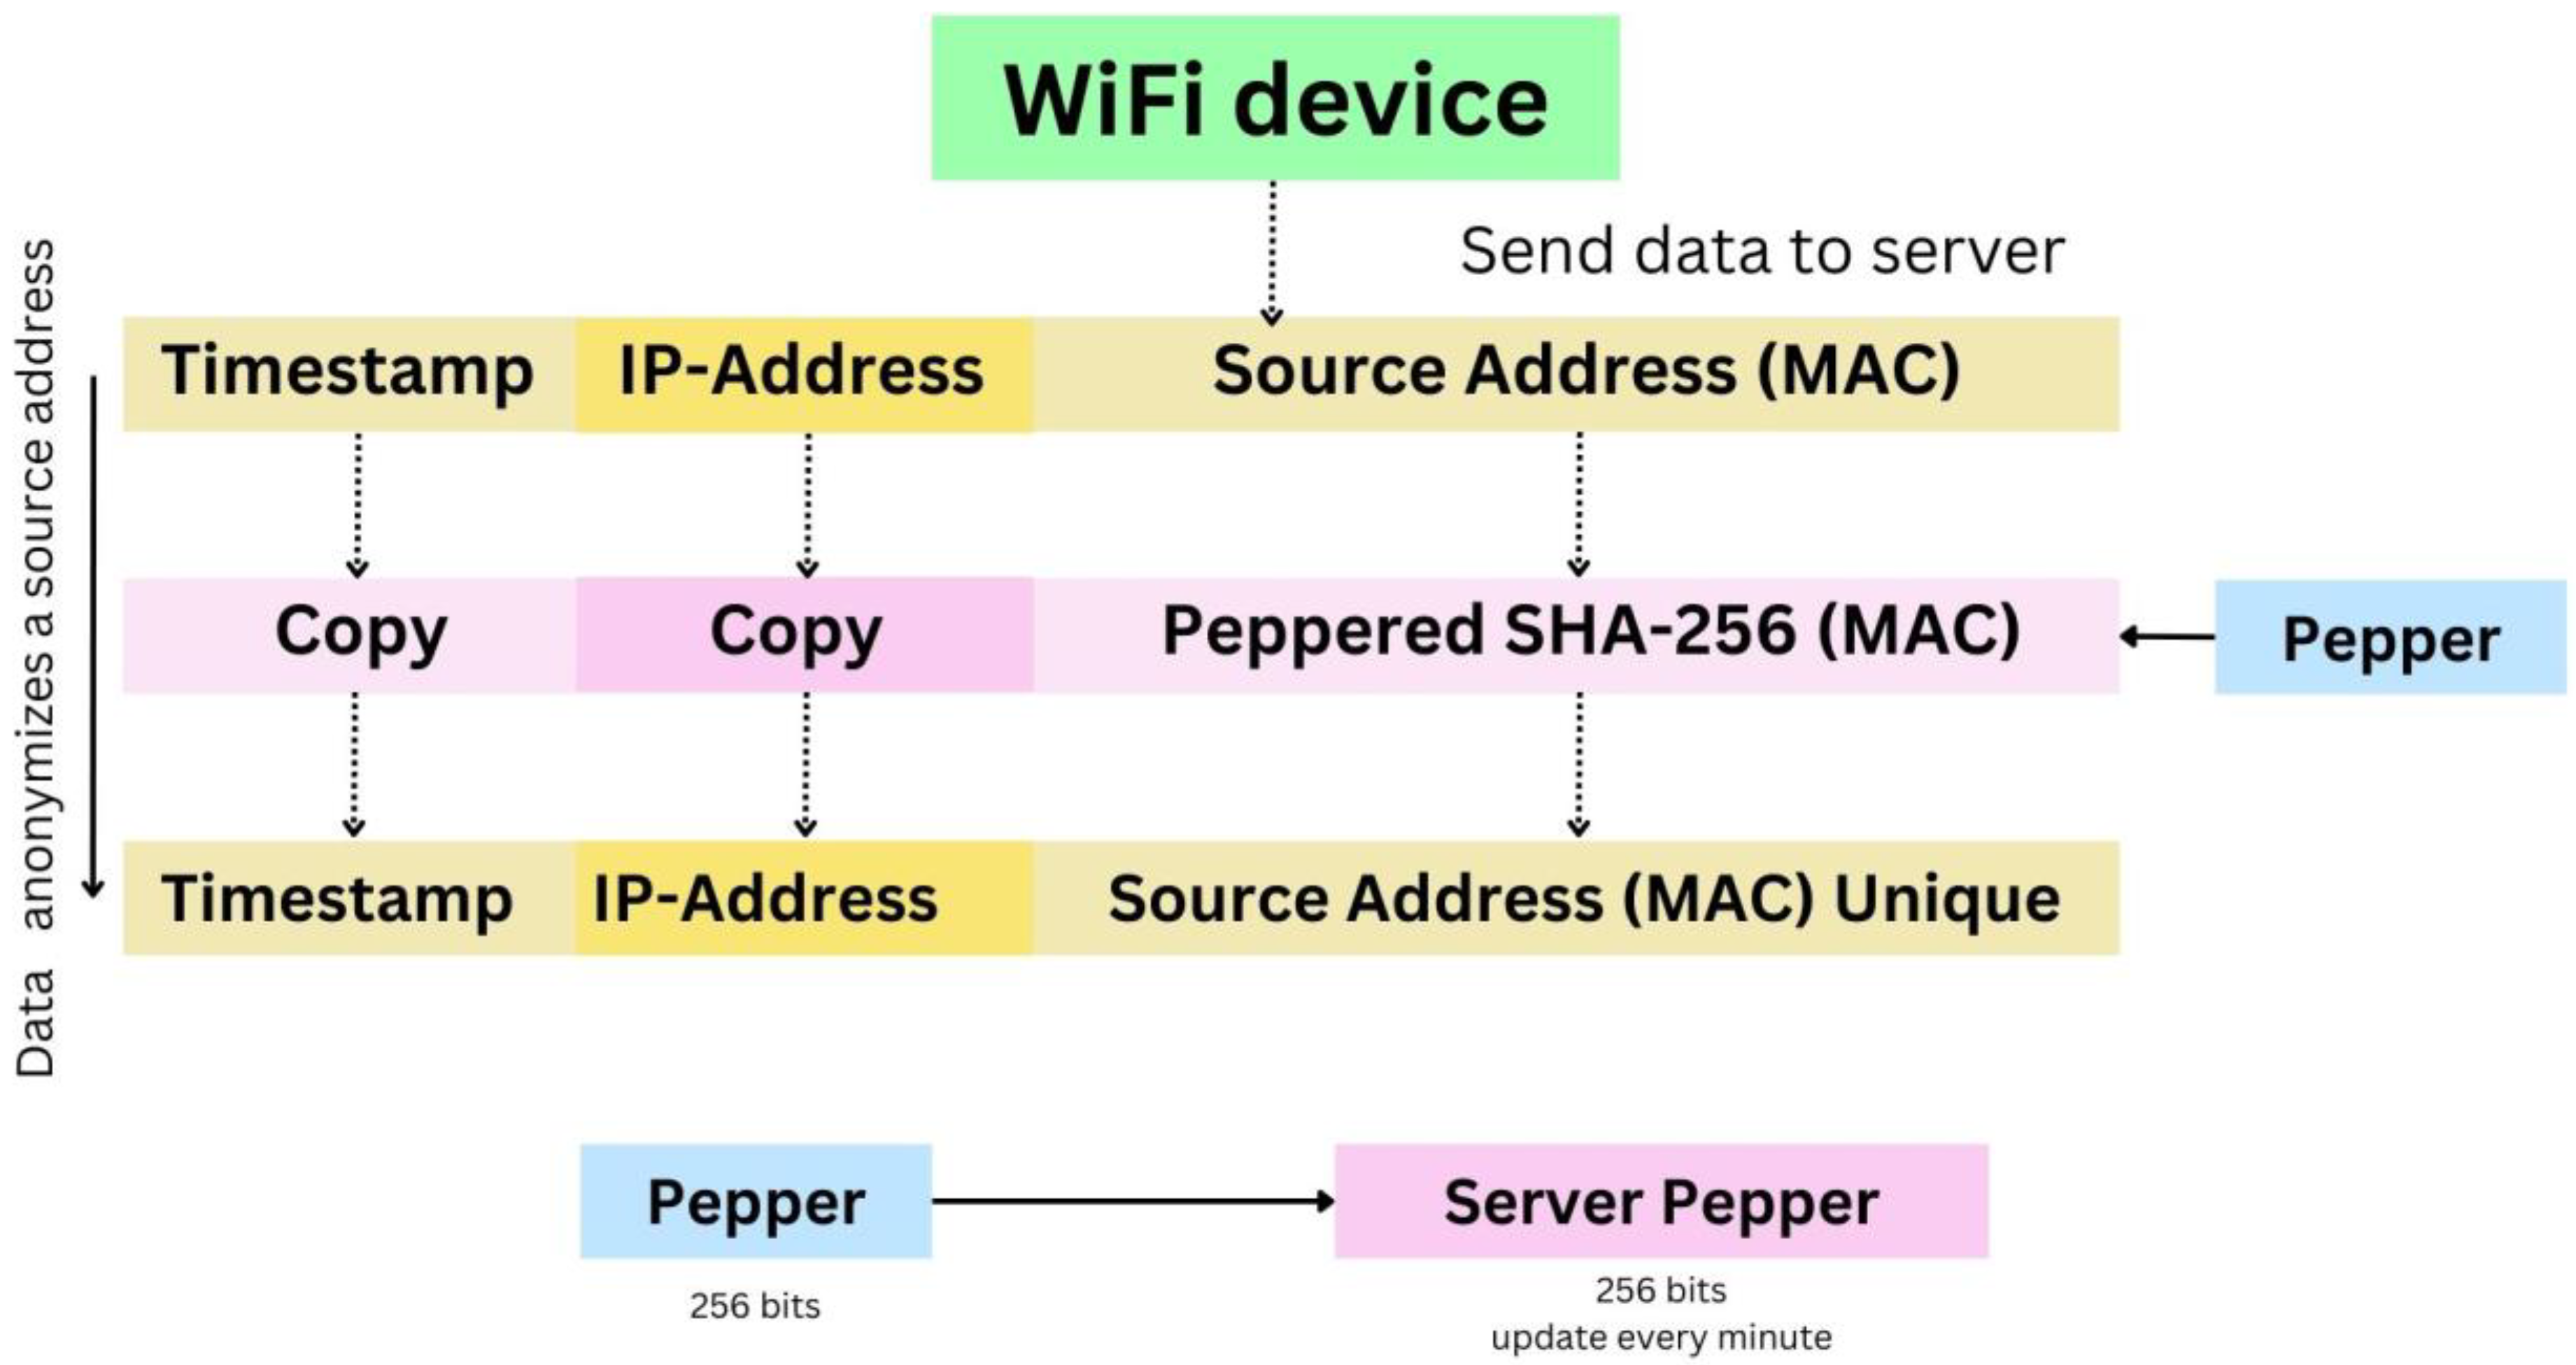
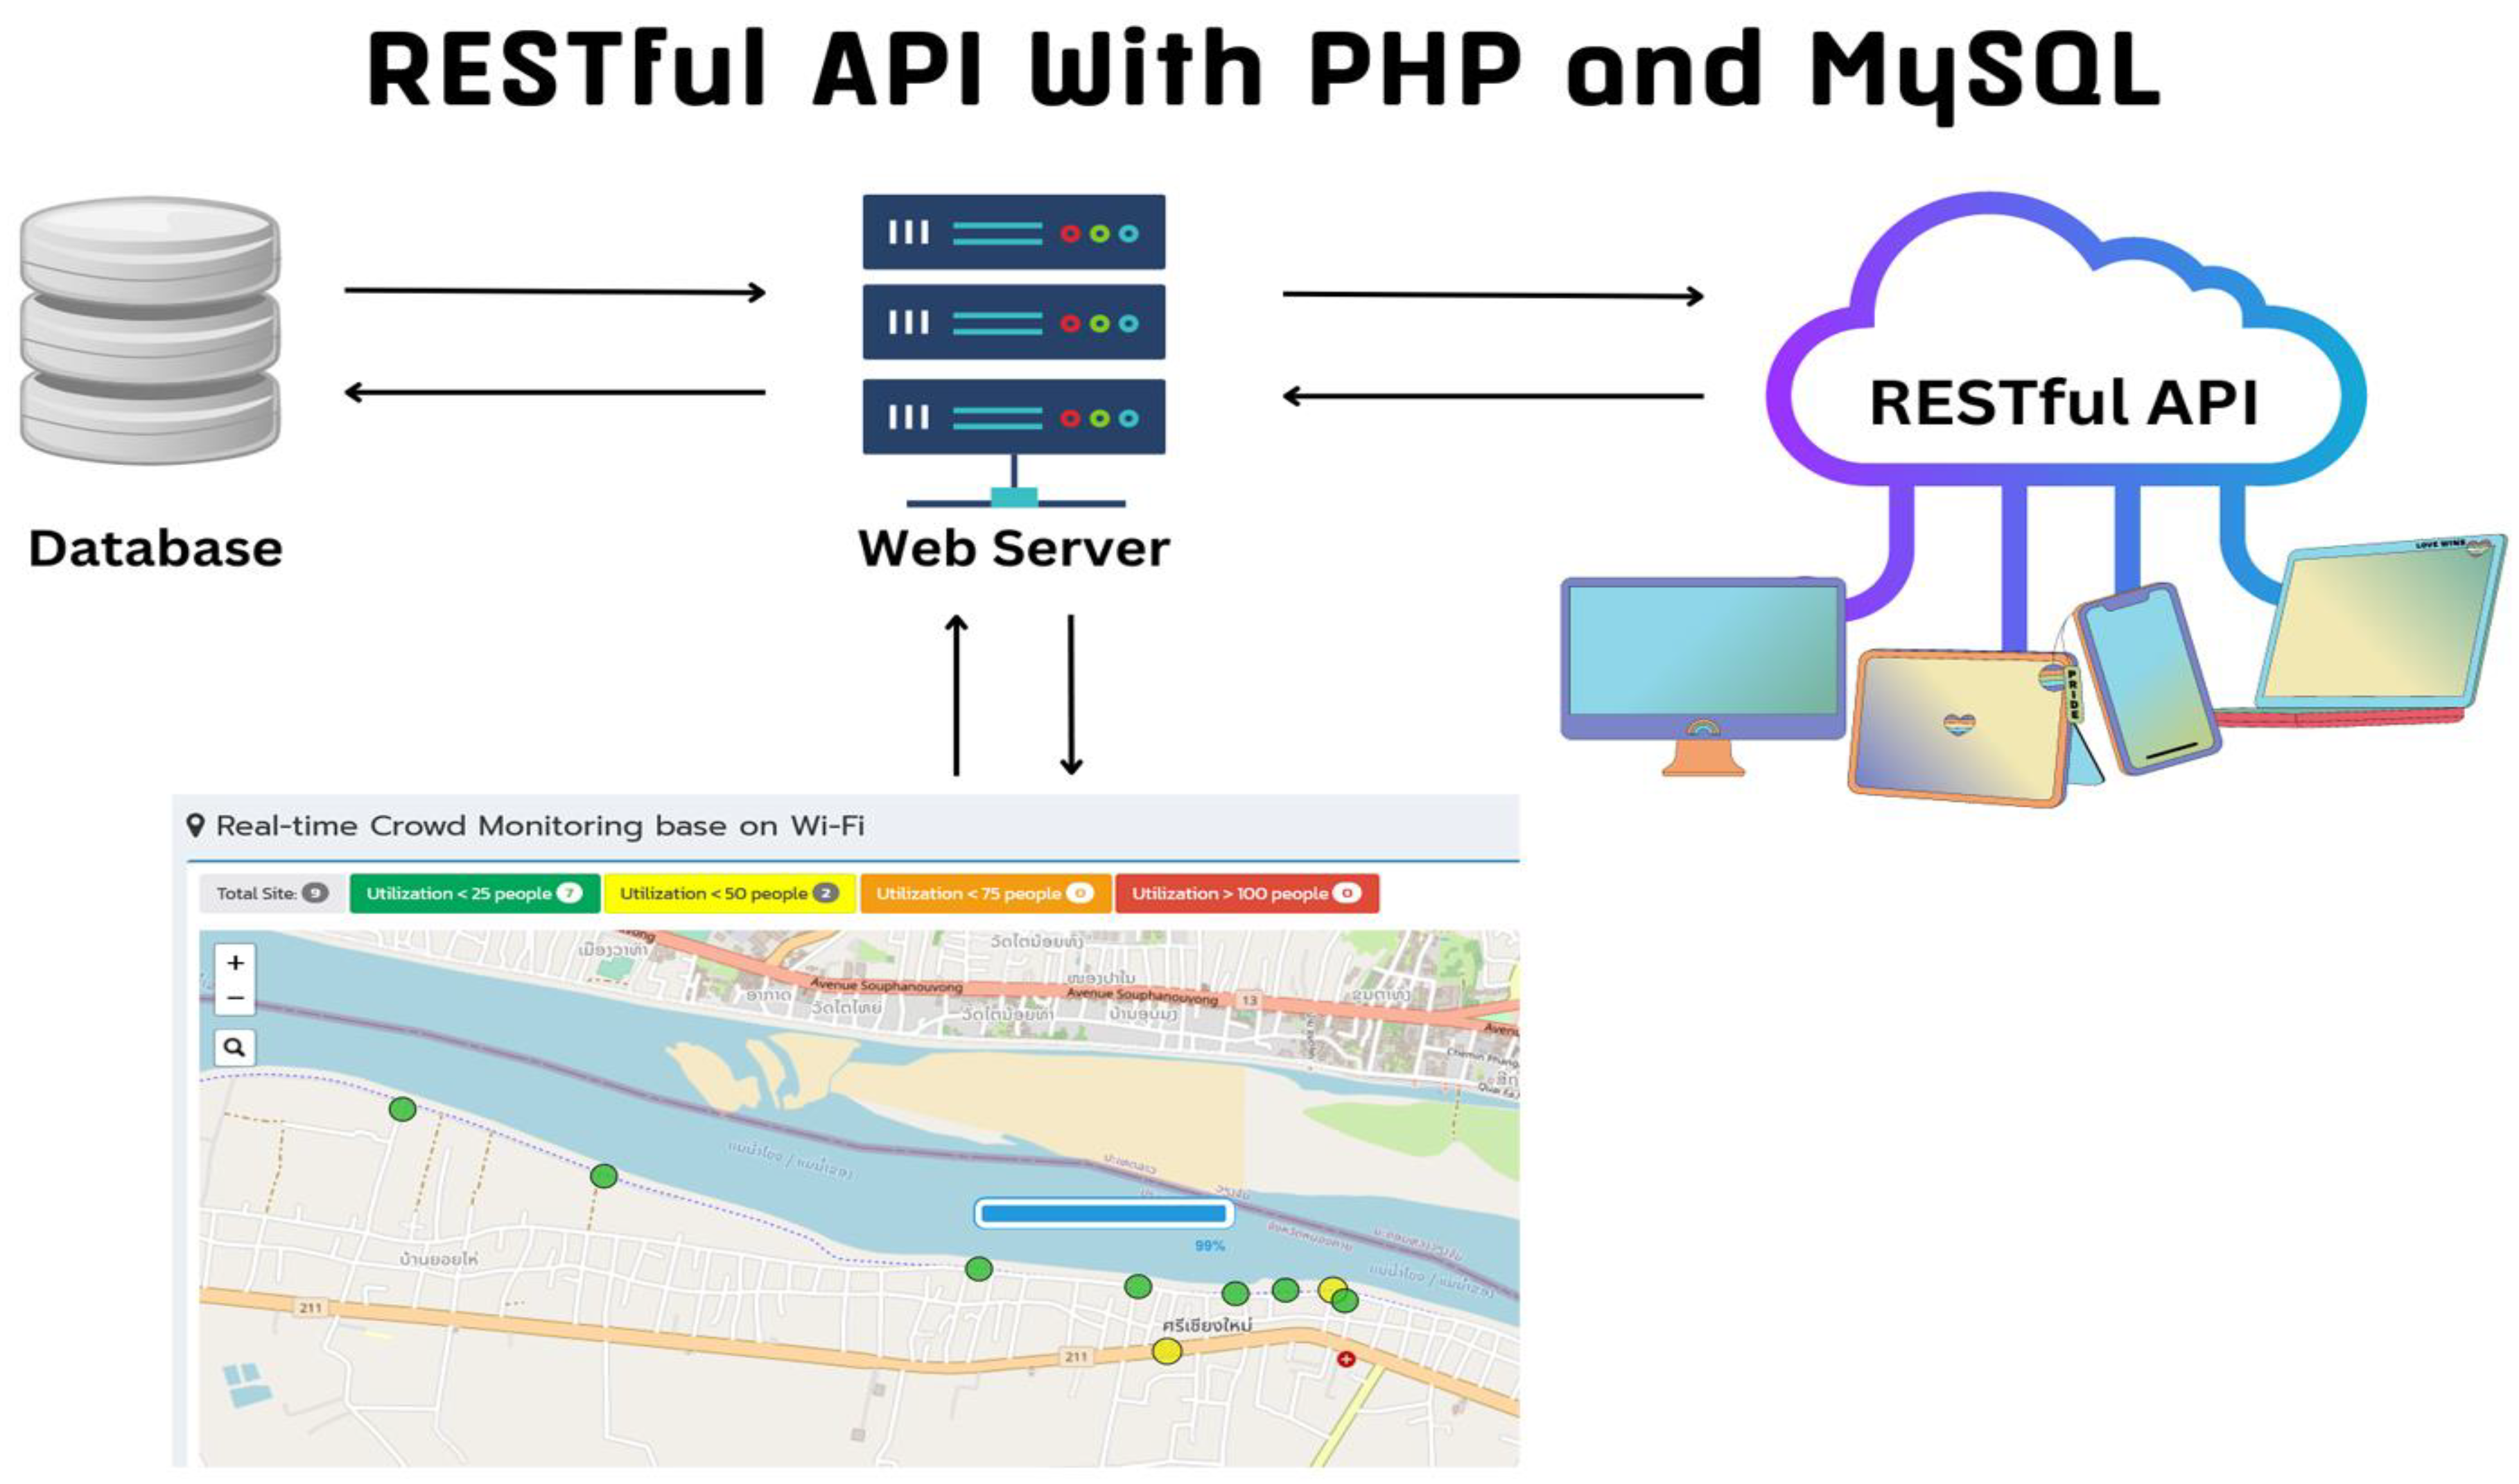
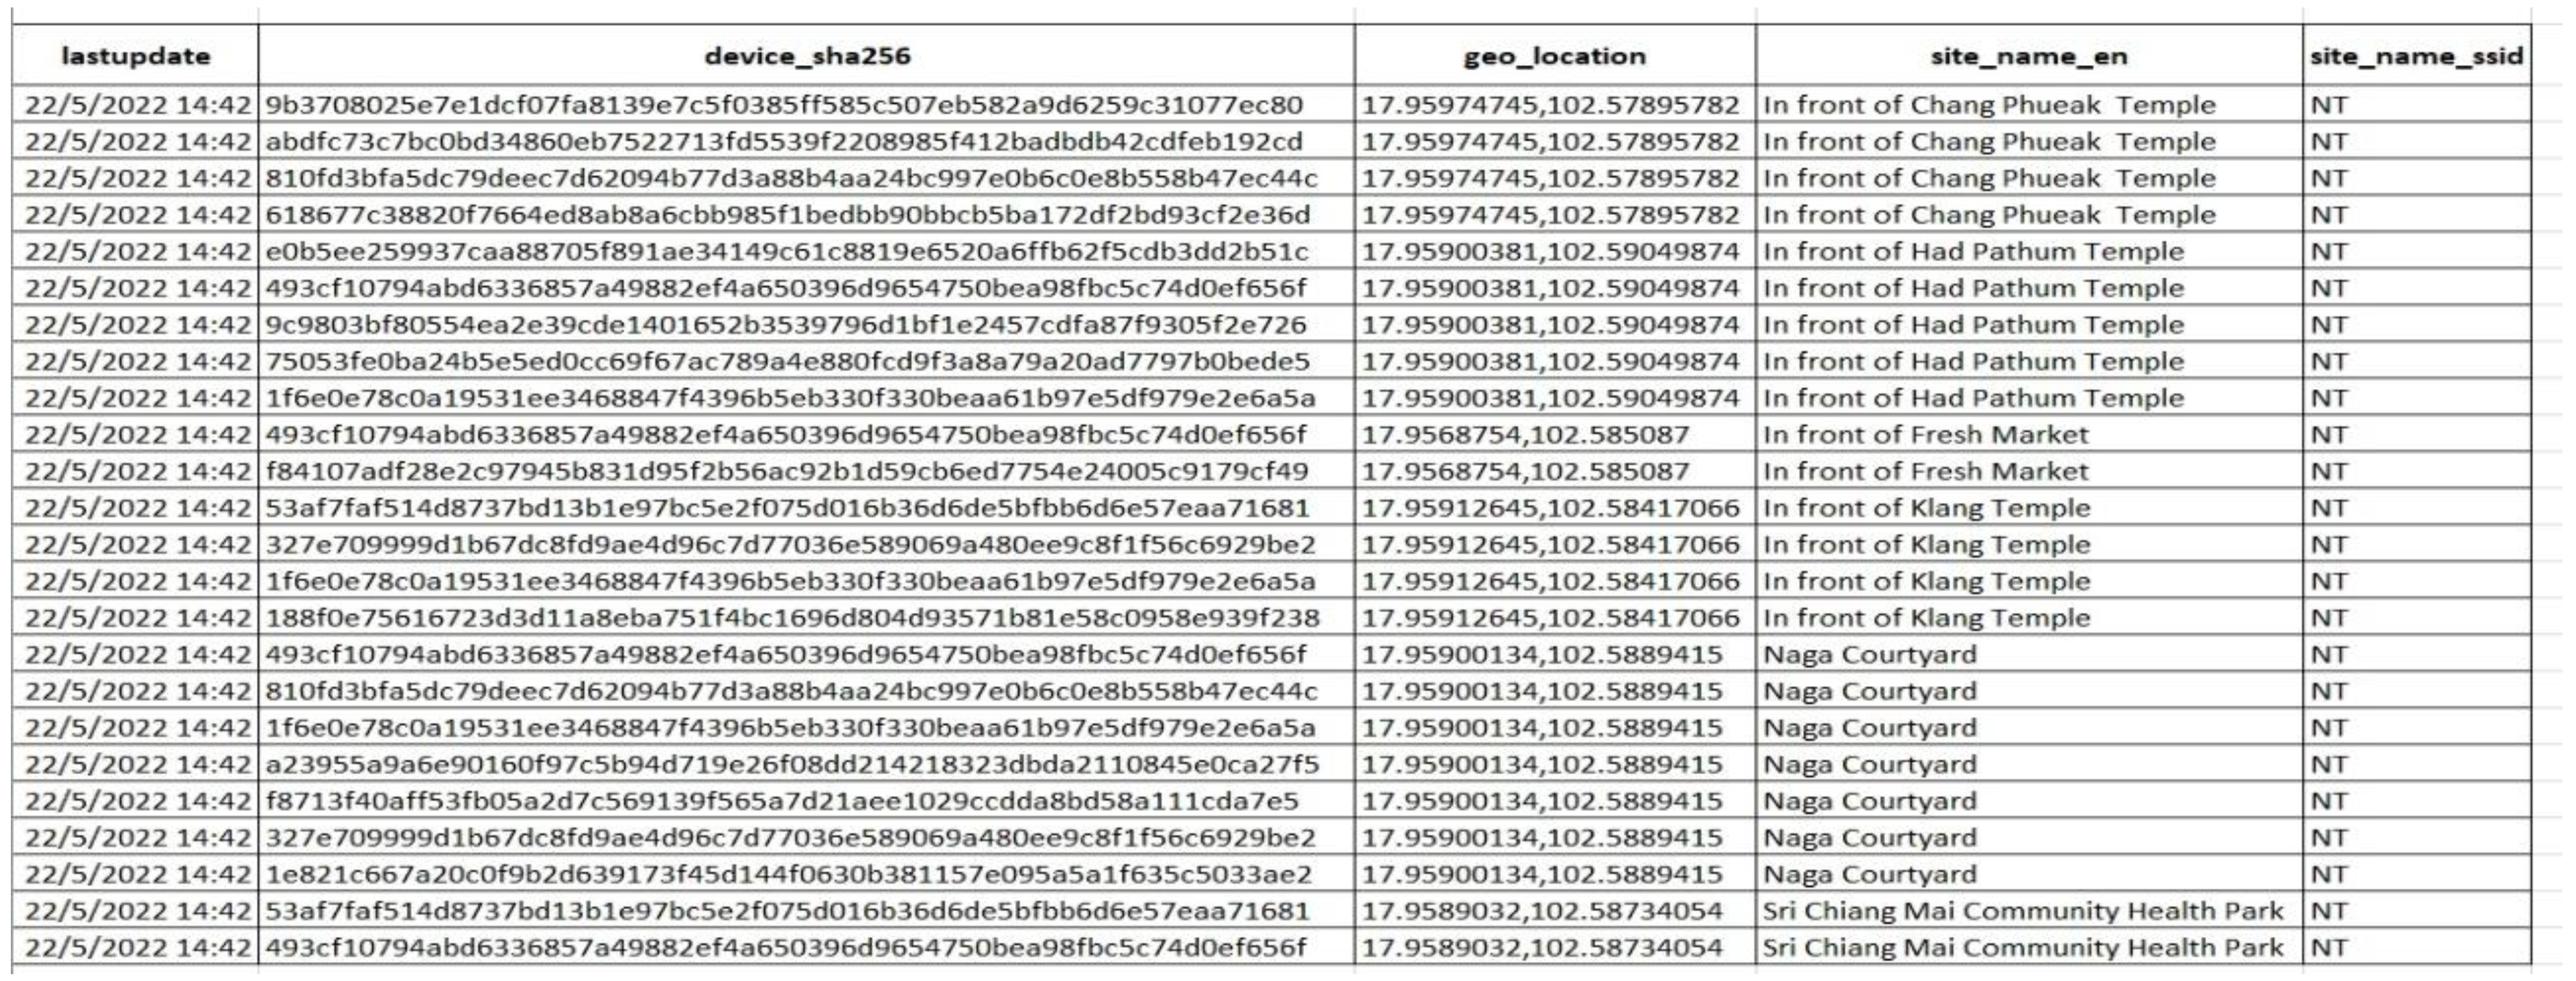
4.3.1. Data Processing

Before data processing in Figure 5, all sensing data from all APs will be transmitted to the data preprocessing that will be performed to eliminate invalid data and transform it into the desired format. Each record of raw data contains the MAC address, the first detection time, the latest detection time, and the identity of the data collector. Each row of a record of raw data will contain an IP address field that will be replaced with the site name; this is because the third octet of the IP address indicates the location of the AP installation. After that, the cleaned data are sent to the processing domain. In particular, the MAC address of the mobile device is encrypted to protect the user’s privacy. As depicted in Figure 6, the server adds a pepper to the complete MAC address prior to performing the SHA-256 hash function for the collected data.
The estimate value cannot be equated to the number of people directly as it is possible for an individual to not carry a device or carry multiple mobile devices. Crowd counting estimation by counting the number of devices may not accurately reflect the exact number of people present, but it can be used as a relative indicator. As an aside, in order to improve the estimation’s precision, the people–mobile factor can be applied in the future.

4.3.2. Data Visualization

In this section, we show, briefly, how the visualization module of the system is implemented, beginning with the database server, and ending with the creation of visual representations for the user, including real-time monitoring and historical presentations.
From Figure 7, this step takes the data that were processed in the previous step and displays the number of devices as numbers on the map in the locations where AP are installed, as seen in the result section in Figure 8. It also has a historical display of the number of devices in each AP as Figure 9. The visualization of the results is attained by the web application PHP, and its web framework, Express, is the foundation upon which the web server is built. In addition to that, it makes use of the MariaDB Database Server to manage the information that is connected to the user’s system credentials. It was built, throughout the development process, using the RESTful methodology. This indicates that the functions of the server were put into web resources and made available to other parts of the platform by means of a RESTful application programming interface (API). We use the leaflet program to make the maps, which, specifically, is the open-source JavaScript library for making interactive maps that work well on phones. In addition, we use high charts to make a line graph, such that we can see the historic data regarding the number of devices in the area where the AP is installed. Visualization of the real-time monitoring system is available at “https://nms.ntone.cloud/udn/realtime (accessed on 10 March 2023)”.

4.3.3. Data Analysis

Colab, which is a web-based tool, is utilized for analyzing data. It allows users to create and execute Python code from a web browser, making it ideal for machine learning, data analysis, and teaching purposes. Colab is a Jupyter notebook service that is hosted and does not require any setup. It also provides free access to computing resources, including GPUs. Data has been collected since 22 May 2022 until the present. However, for the purpose of presenting in this article, some data has been extracted and analyzed from 22 May 2022, to 30 September 2022.
The aim of this paper is to present the usage information to the administrators of the Sri Chiang Mai Municipality free Wi-Fi project in order that they might learn the various types of information that are obtained from the system. It is to be sent as a guideline for expanding the AP installation or moving the installation point to meet the needs of the people in the area as much as possible. Therefore, we would like to analyze the following two aspects:
  • The initial analysis focuses on the monthly count of individuals detected by Wi-Fi in the entire Sri Chiang Mai City area along the Mekong River during the available timeframe. This research aimed to determine the general frequency and quantity of persons in the region, as well as to detect any peak times;
  • The second analysis deals with understanding the busiest periods for people in the area in terms of time, days, and months. This is performed in order to learn if there is some variance that is associated with the different timeframes.
During the time of data collection, there was a festival called the Bun Bang Fai Festival, which was held from 23 May to 29 May 2022. The event and surrounding environments of each AP installation point are detailed in Table 3.

5. Results

In the section devoted to the results, we will present two primary sections. The first component is the application for real-time crowd monitoring, and the second component is the utilization of the data generated by the storage system in the first section in order to carry out the task of analyzing the behavior of people who are located in the area.
In the first component, we developed a real-time crowd monitoring application to improve the quality of life for local residents and respond to research questions that ask how many people are in a given area, as well as how many people had visited that location in the past. Therefore, the application was designed to perform four functions representing the number of people in each area in real-time, as well as to maintain a historical record of those who have visited a specific area.
The first function of the application is to provide a real-time representation of the residential areas in each location. This application allows locals to schedule their visits to the area at different times to avoid an approaching epidemic, or if, for example, a hawker needs to know where it is popular to go, they may check the app to see where the crowds are. There is also a location where people who participate in activities in the specified area can purchase food and beverages.
The web application is compatible with a variety of devices, including mobile phones, tablets, personal computers, and laptops. It is important to make use of a web browser in order to access the web application on the internet. As illustrated in Figure 8, you can put a message in the address bar by typing “https://nms.ntone.cloud/udn/realtime (accessed on 10 March 2023).” Chrome should be used on devices that run the Android operating system, while Safari should be used on devices that run the iOS operating system. A circular dot will appear on the screen to represent the number of people in each area. There are four different colors that indicate different statuses: green denotes that the density of the area is fewer than 25 people—this implies that there are areas that are less crowded; yellow denotes fewer than 50 people within the area, thereby indicating a population crowd that is roughly in the middle-sized range; orange represents a crowd in the area that is smaller than 75 people, which is a crowd that is becoming congested; red represents a crowd in the area that is larger than 100 people; this, therefore, indicates that there is a significant number of people in the area.
The second function of the application is to display the history of people who have visited a specific area. This is depicted with a line graph that displays the historical data for the number of people (displayed in hourly 1 h, 2 h, 3 h, 6 h, and 12 h; daily 1 D, 2 D, 3 D, and 7 D; monthly 1 M, 3 M, and 6 M; and all other timeframes) and enables you to set the date range for which you wish to view the data, as shown in Figure 9.
The third function of the application is to display the average density of a location at different times. This is depicted with a straight line with red dots which displays the average of the current and historical data for the number of people (it displays the average of the historical data in hourly 1 h, 2 h, 3 h, 6 h, and 12 h; daily 1 D, 2 D, 3 D, and 7 D; monthly 1 M, 3 M, and 6 M; and all other timeframes) and enables you to set the date range for the manner in which you wish to view the average data, as shown in Figure 10.
The final function is to make data downloadable in CSV format, as seen in Figure 11. Due to the large size of the data, they are separated by months to facilitate the downloads. If created in one piece, they may not be downloadable.
The social and geographic characteristics of the area were taken into consideration when making the decision to begin an investigation with Sri Chiang Mai’s free Wi-Fi. This was performed in order to find the answers to these three important questions: (1) On average, how many people were detected monthly by Wi-Fi in the entire Sri Chiang Mai City area along the banks of the Mekong River over the entire available time period? (2) How do we comprehend the overall frequency and number of individuals in the areas, and how do we identify the peaks at specific times? (3) What are the busiest times of the days, weeks, and months of the year for the people who live in this area? To answer the aforementioned questions, the analysis must be divided into spatial and temporal components.
Analyzing the available data for the entire area, it is interesting to note the following key characteristics (Figure 12 and Figure 13):
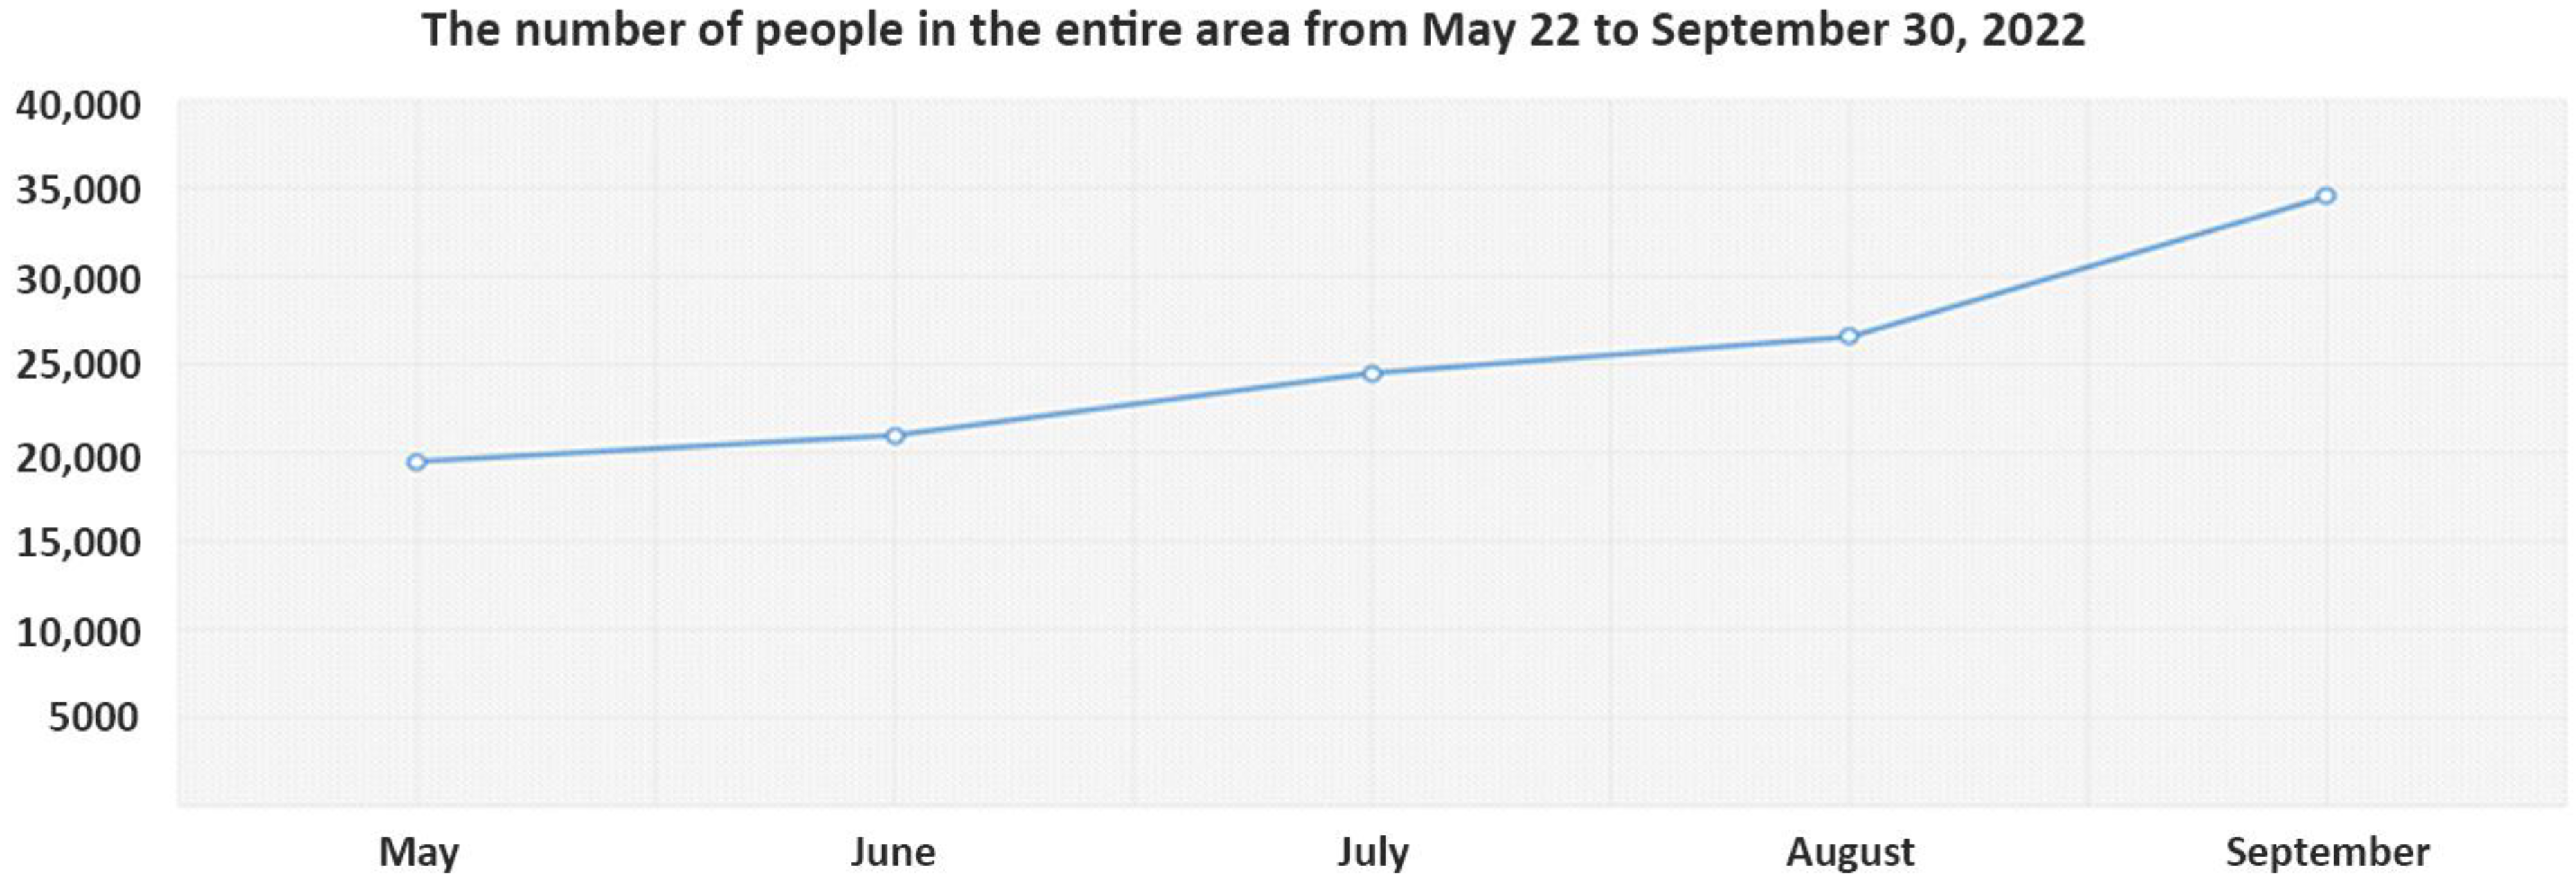
  • Since the beginning of the data collection on 22 May 2020, and until the present month, there has been a consistent rise in the total number of residents of the area. It is important to note that in these timeframes—as shown in Figure 12, as a result of a change in the form of the free Wi-Fi login that was more convenient and easier in late July—there has been a significant increase in the number of users who have logged in. In addition, replacing six of the APs from the total available qualified the system to support more users in mid-September;
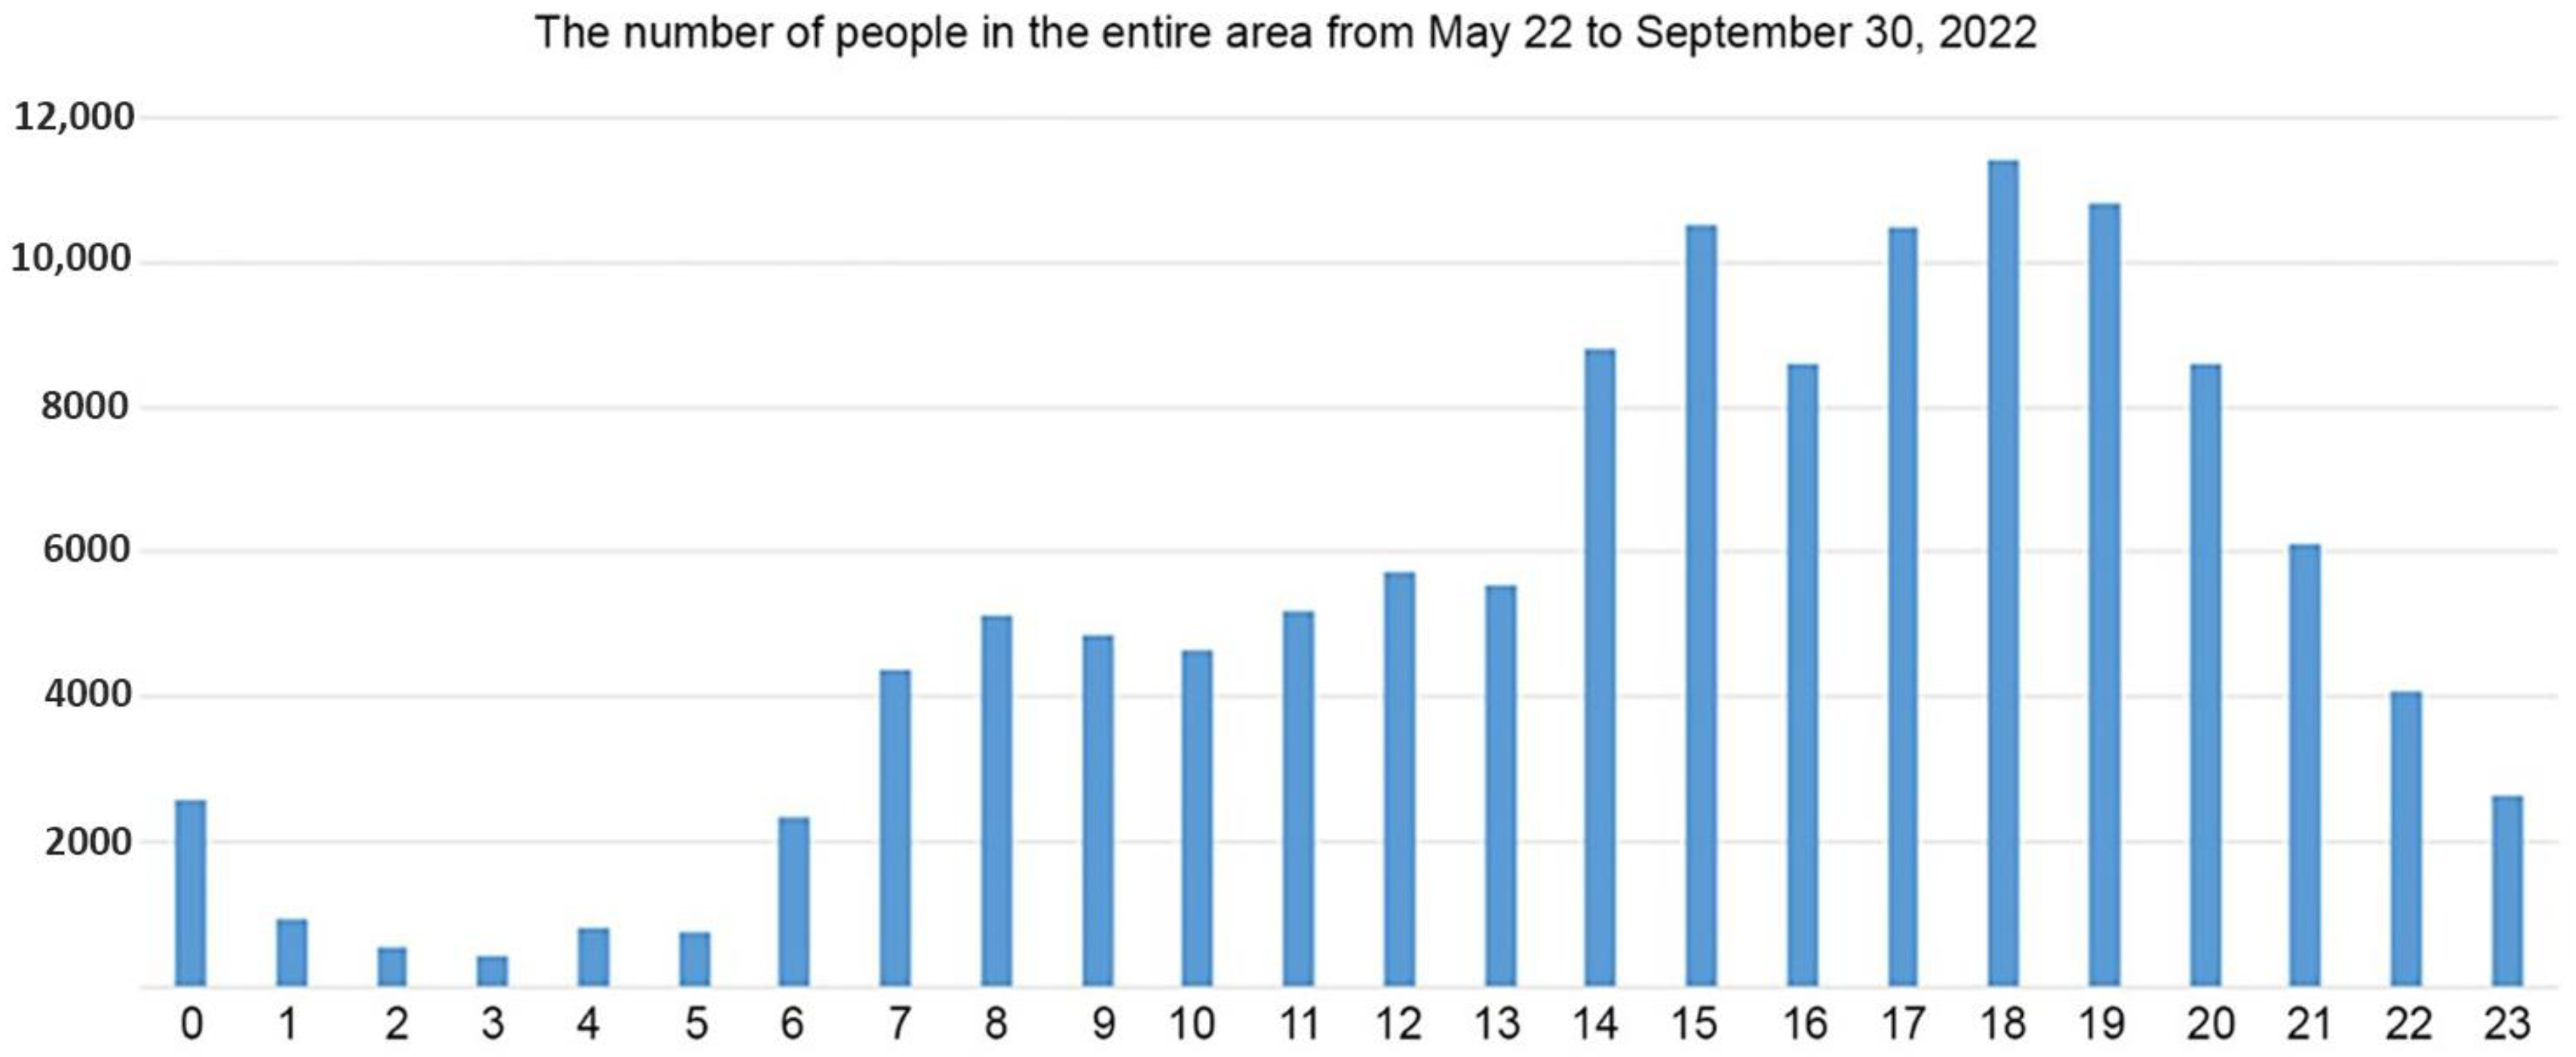
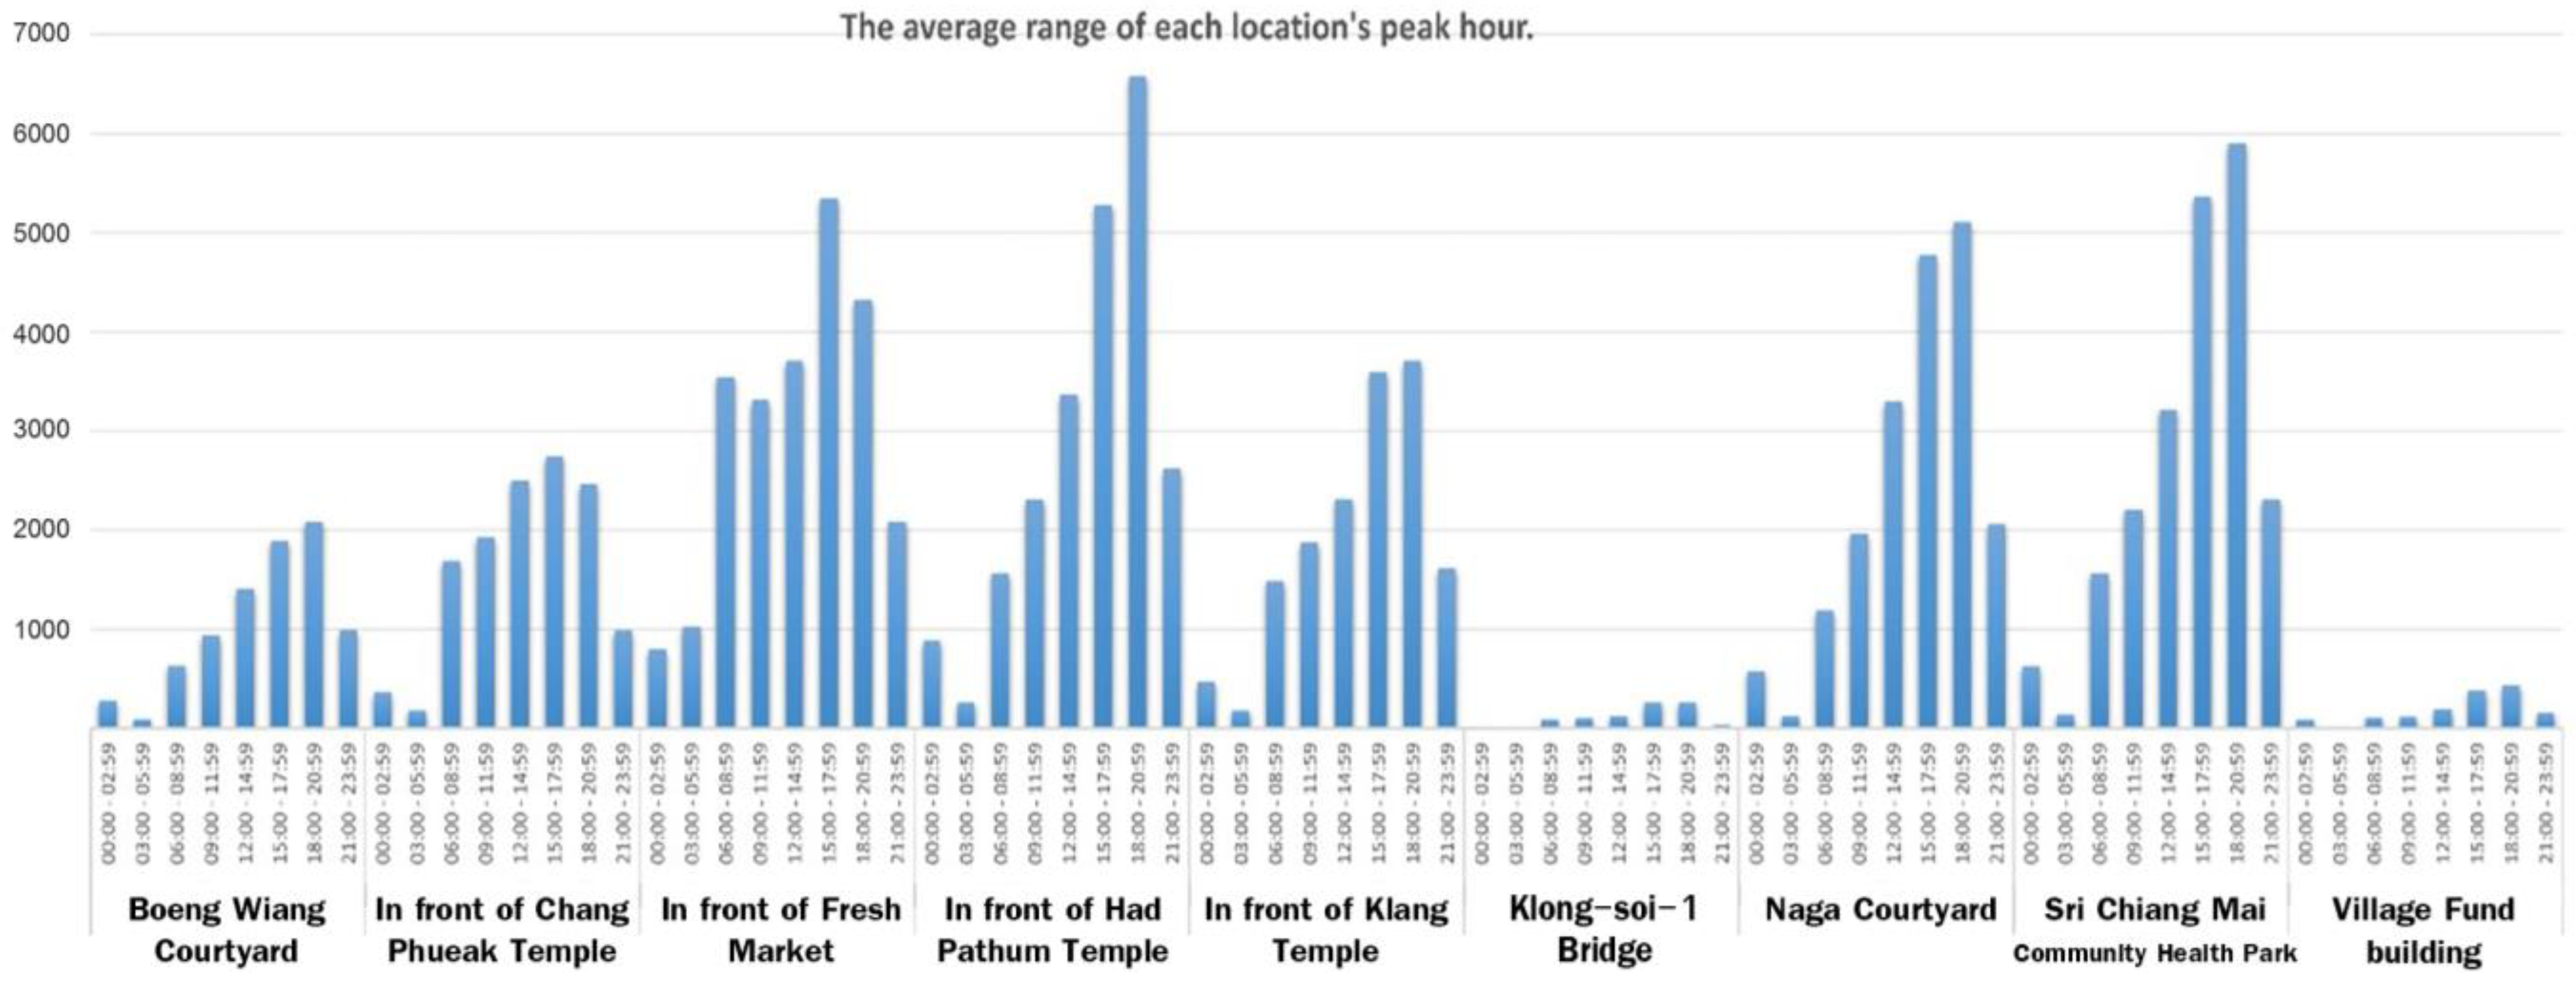
  • The hours of significant presence in the area took place at 13:00. Mainly, the arrival of people to the APs’ installed area began after lunch and continued until 15:00, as in Figure 13. After this, the recorded presence began to decrease until 16:00, after which it will begin to increase until 18:00, and finally it will continue to decrease gradually. Nonetheless, the observations can be explained by the characteristics of the area, e.g., after lunch. At six o’clock in the evening, the area will be at its highest density population. People who are outside for activities, including running, aerobic dancing, resting, eating, and drinking, in the general area of the Mekong River’s banks until 21:00, will then, eventually, return to their accommodations.
This general information will provide us with an overview and key points to understand the main trends each month. It also serves as a framework for further analysis and thought. However, the analysis must be tailored to specific months in order to correlate the precise time of the month with the presence or absence of an event, as well as to improve the free Wi-Fi system. Table 4 displays the total number of unique people who used the free Wi-Fi in all areas of Sri Chiang Mai during the selected months. In addition, the system linked the presence of events and improved the free Wi-Fi system within these months.
Table 4 demonstrates that the weeks in which there was a major event resulted in there being a greater overall crowd number than those weeks in which there was either no major event or an improved free Wi-Fi system. In particular, it is interesting to note the differences between 23–29 May 2022 and 23–29 June 2022. It is also especially interesting to note that the number of people attending the main event, which takes place from 23–29 May 2022, was significantly different from the number of people attending on 23–29 June and 23–29 July 2022, which are both non-event days. Therefore, it can be assumed that both the local people and those in the immediate neighborhood were in the area.
Nevertheless, despite the improvements made to the free Wi-Fi system in August, the number of people captured in the area was still lower than it was in May, which is before the improvements were made. It was demonstrated that if the improved system for free Wi-Fi was implemented in May, the number of people in the area would increase by approximately twofold.
In order to gain a comprehensive understanding of the space utilization within the area, we conducted an analysis of the area’s various segments. As depicted in Figure 1, the APs were distributed along the banks of the Mekong River in Sri Chiang Mai, allowing us to determine if there were any peculiarities in the distribution of the local inhabitants.
The following diagrams (Figure 14 and Figure 15) illustrate how there were certain distinctions between the groups:
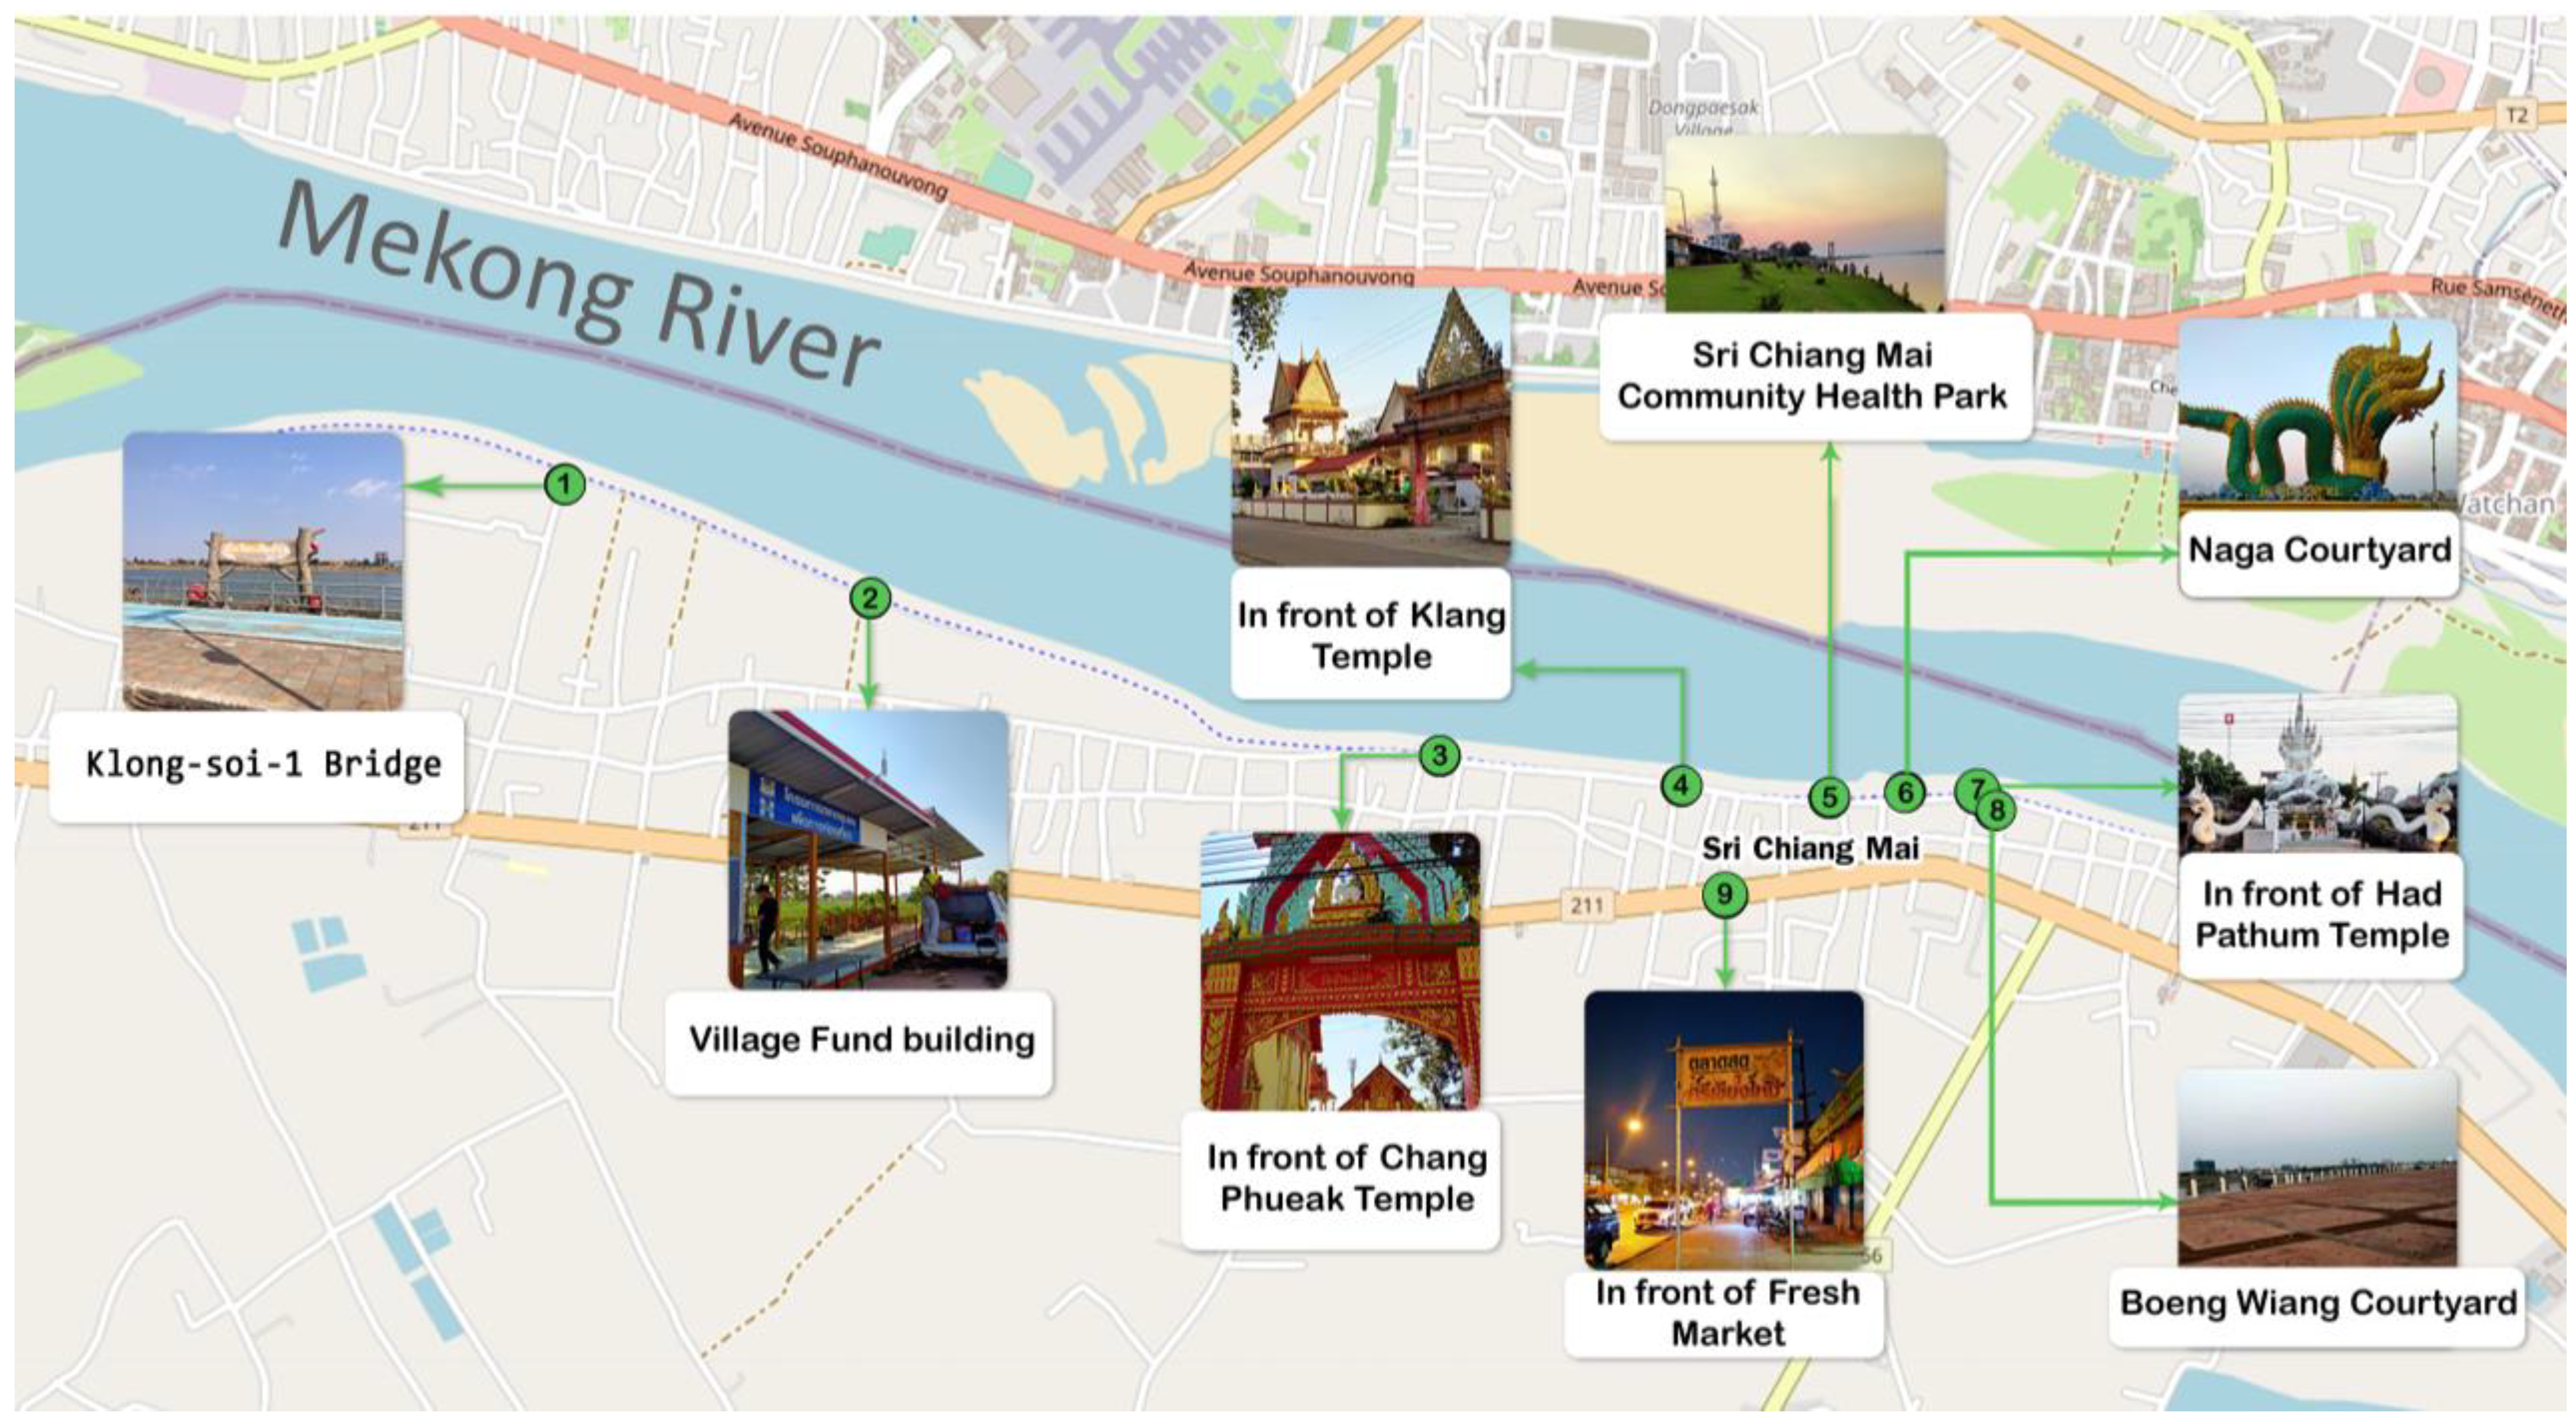
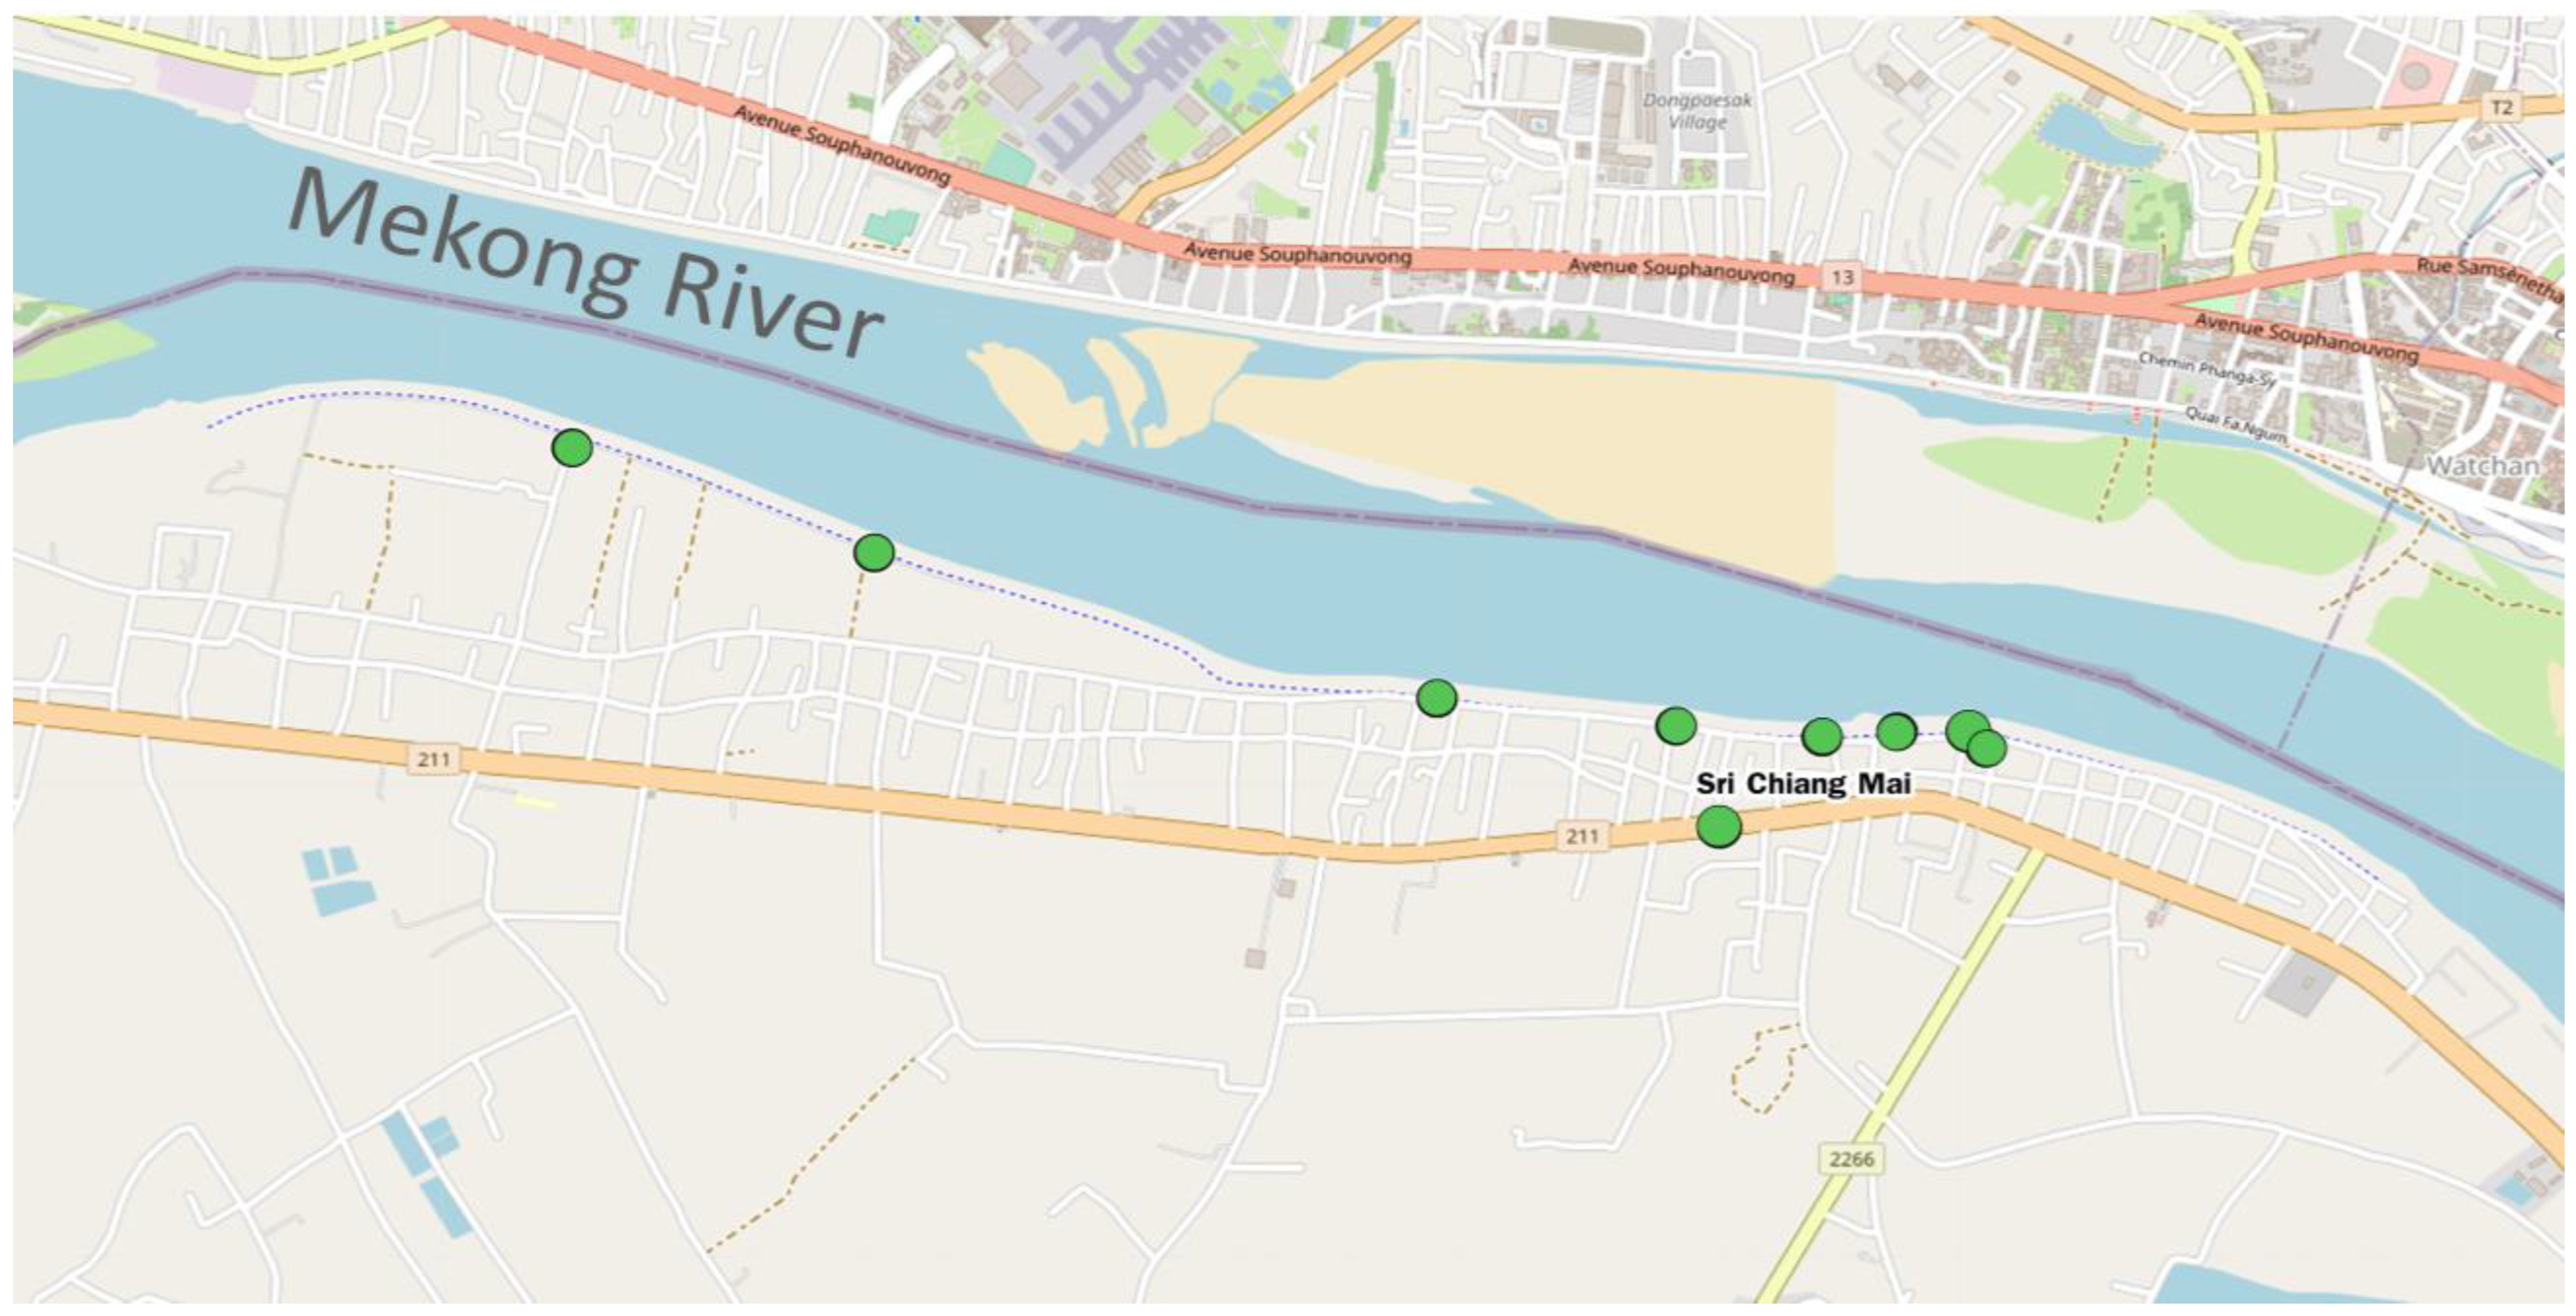
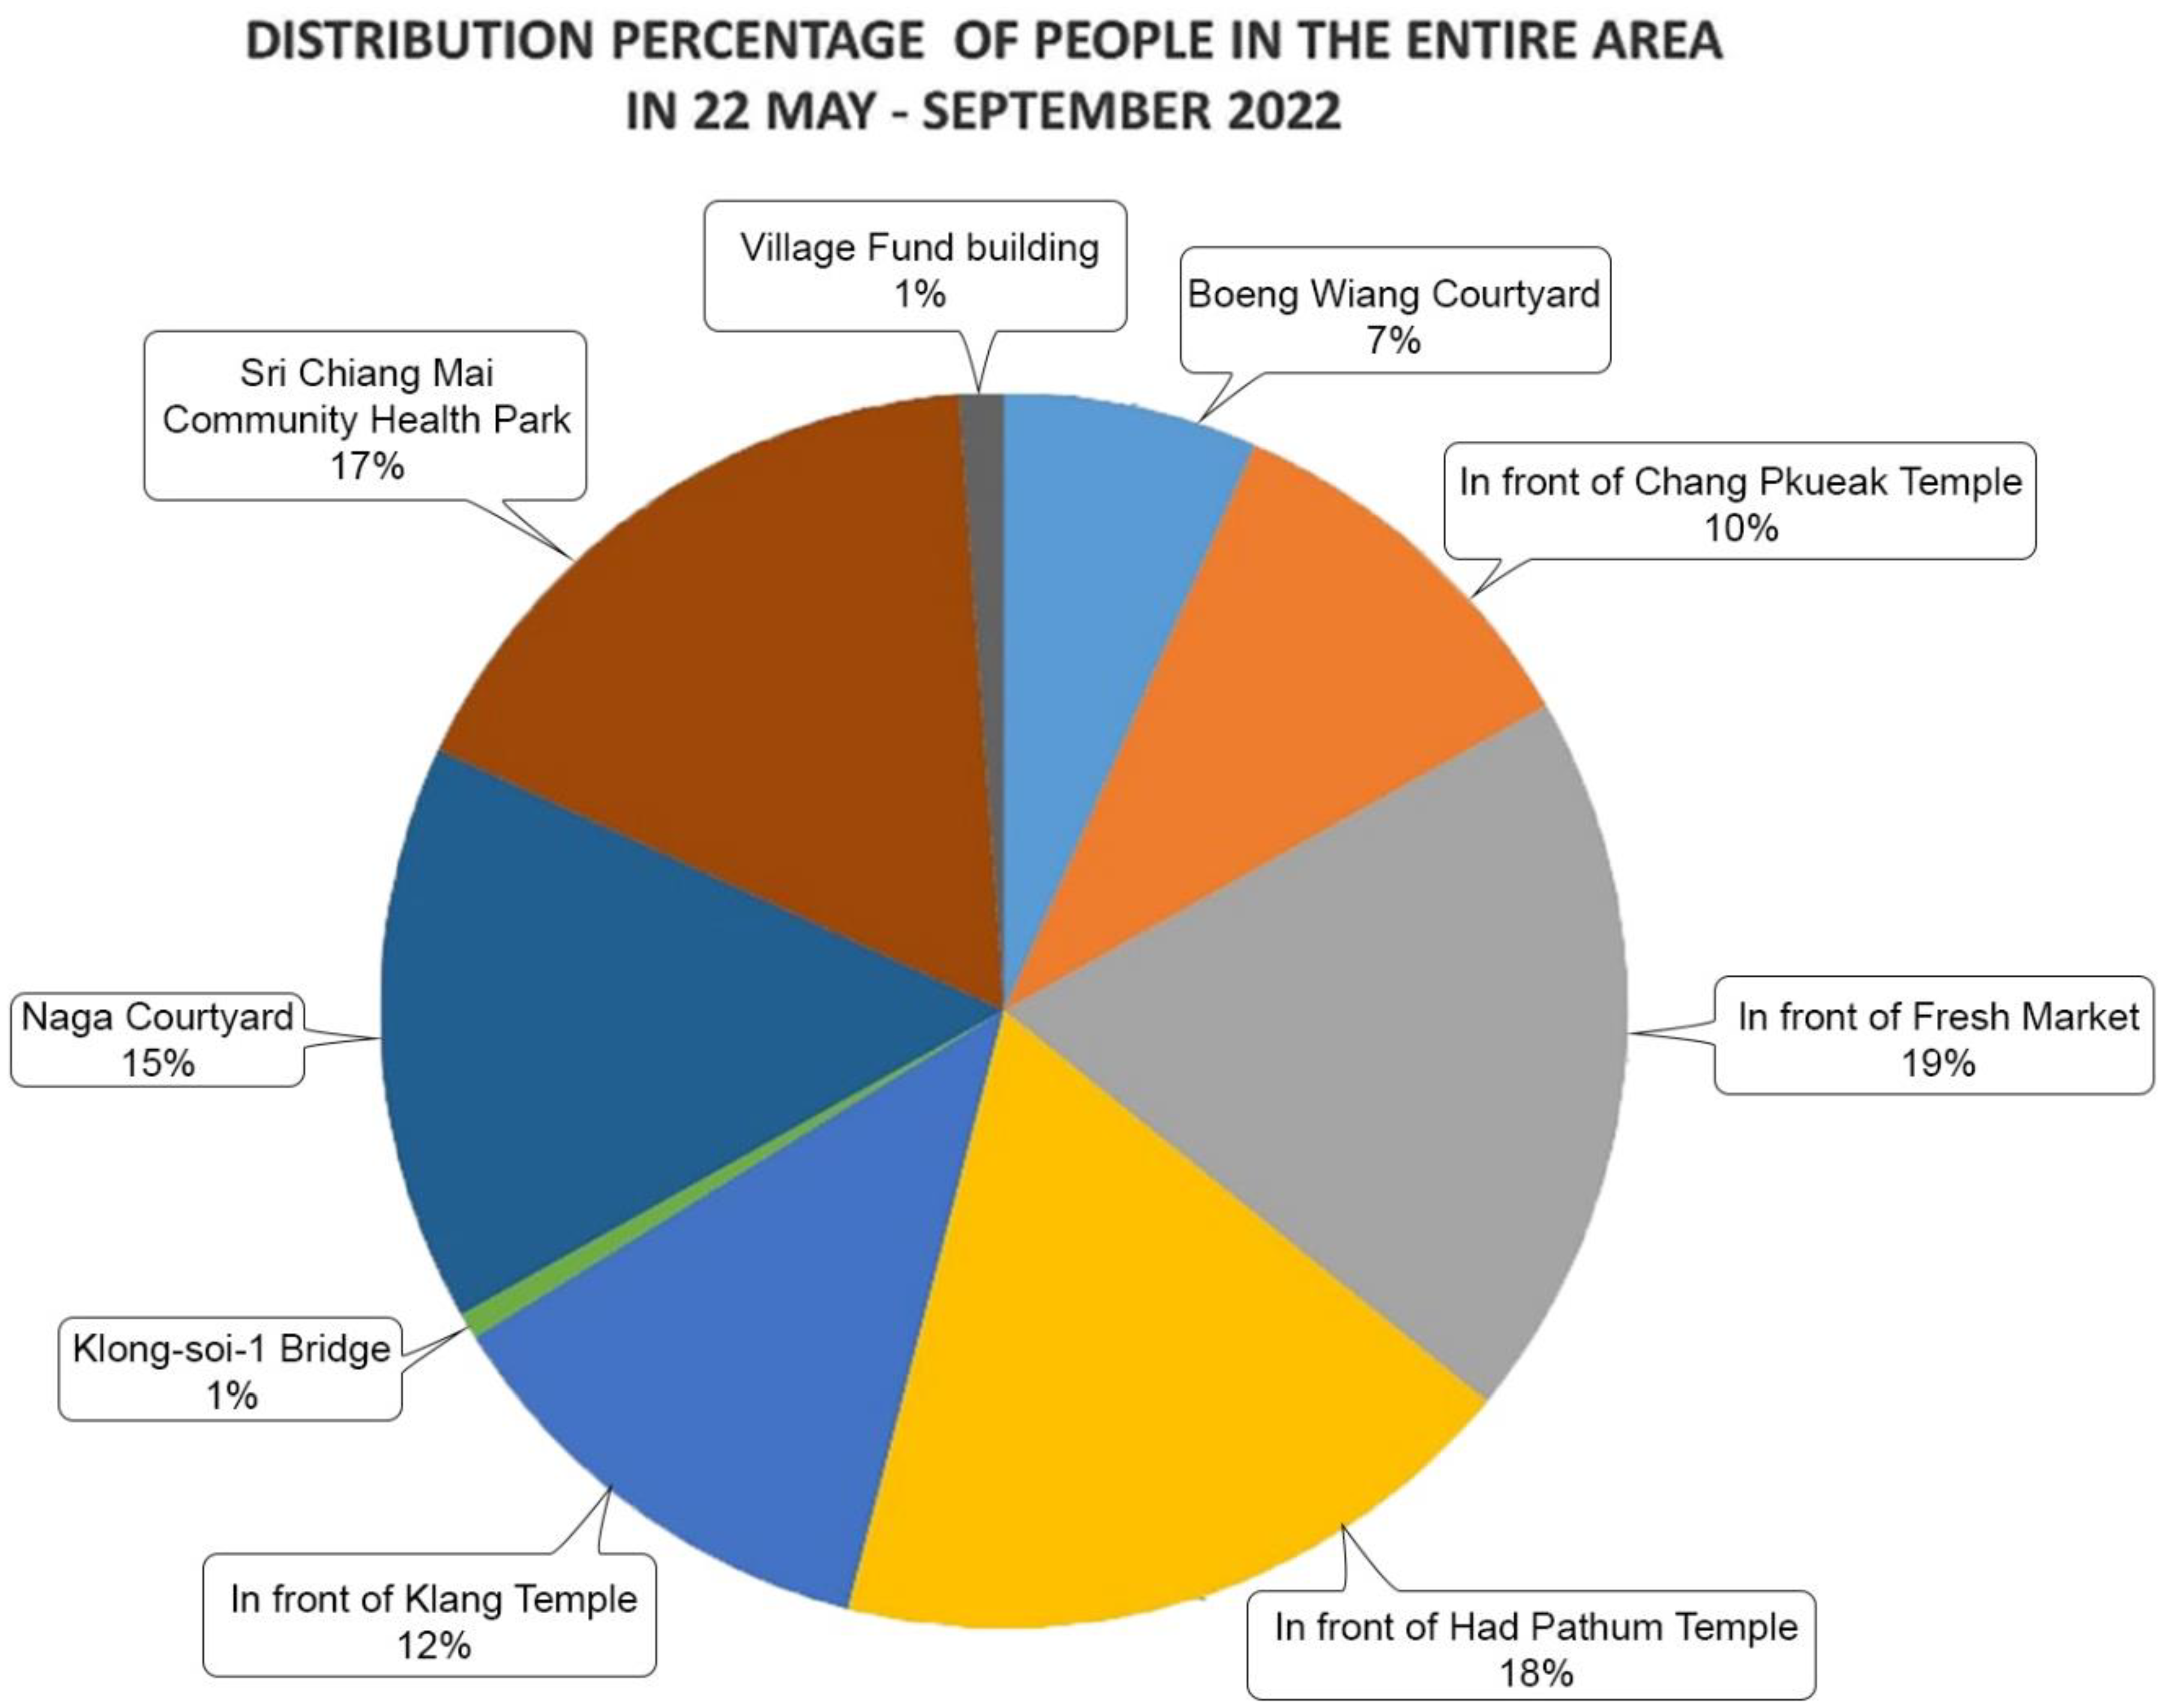
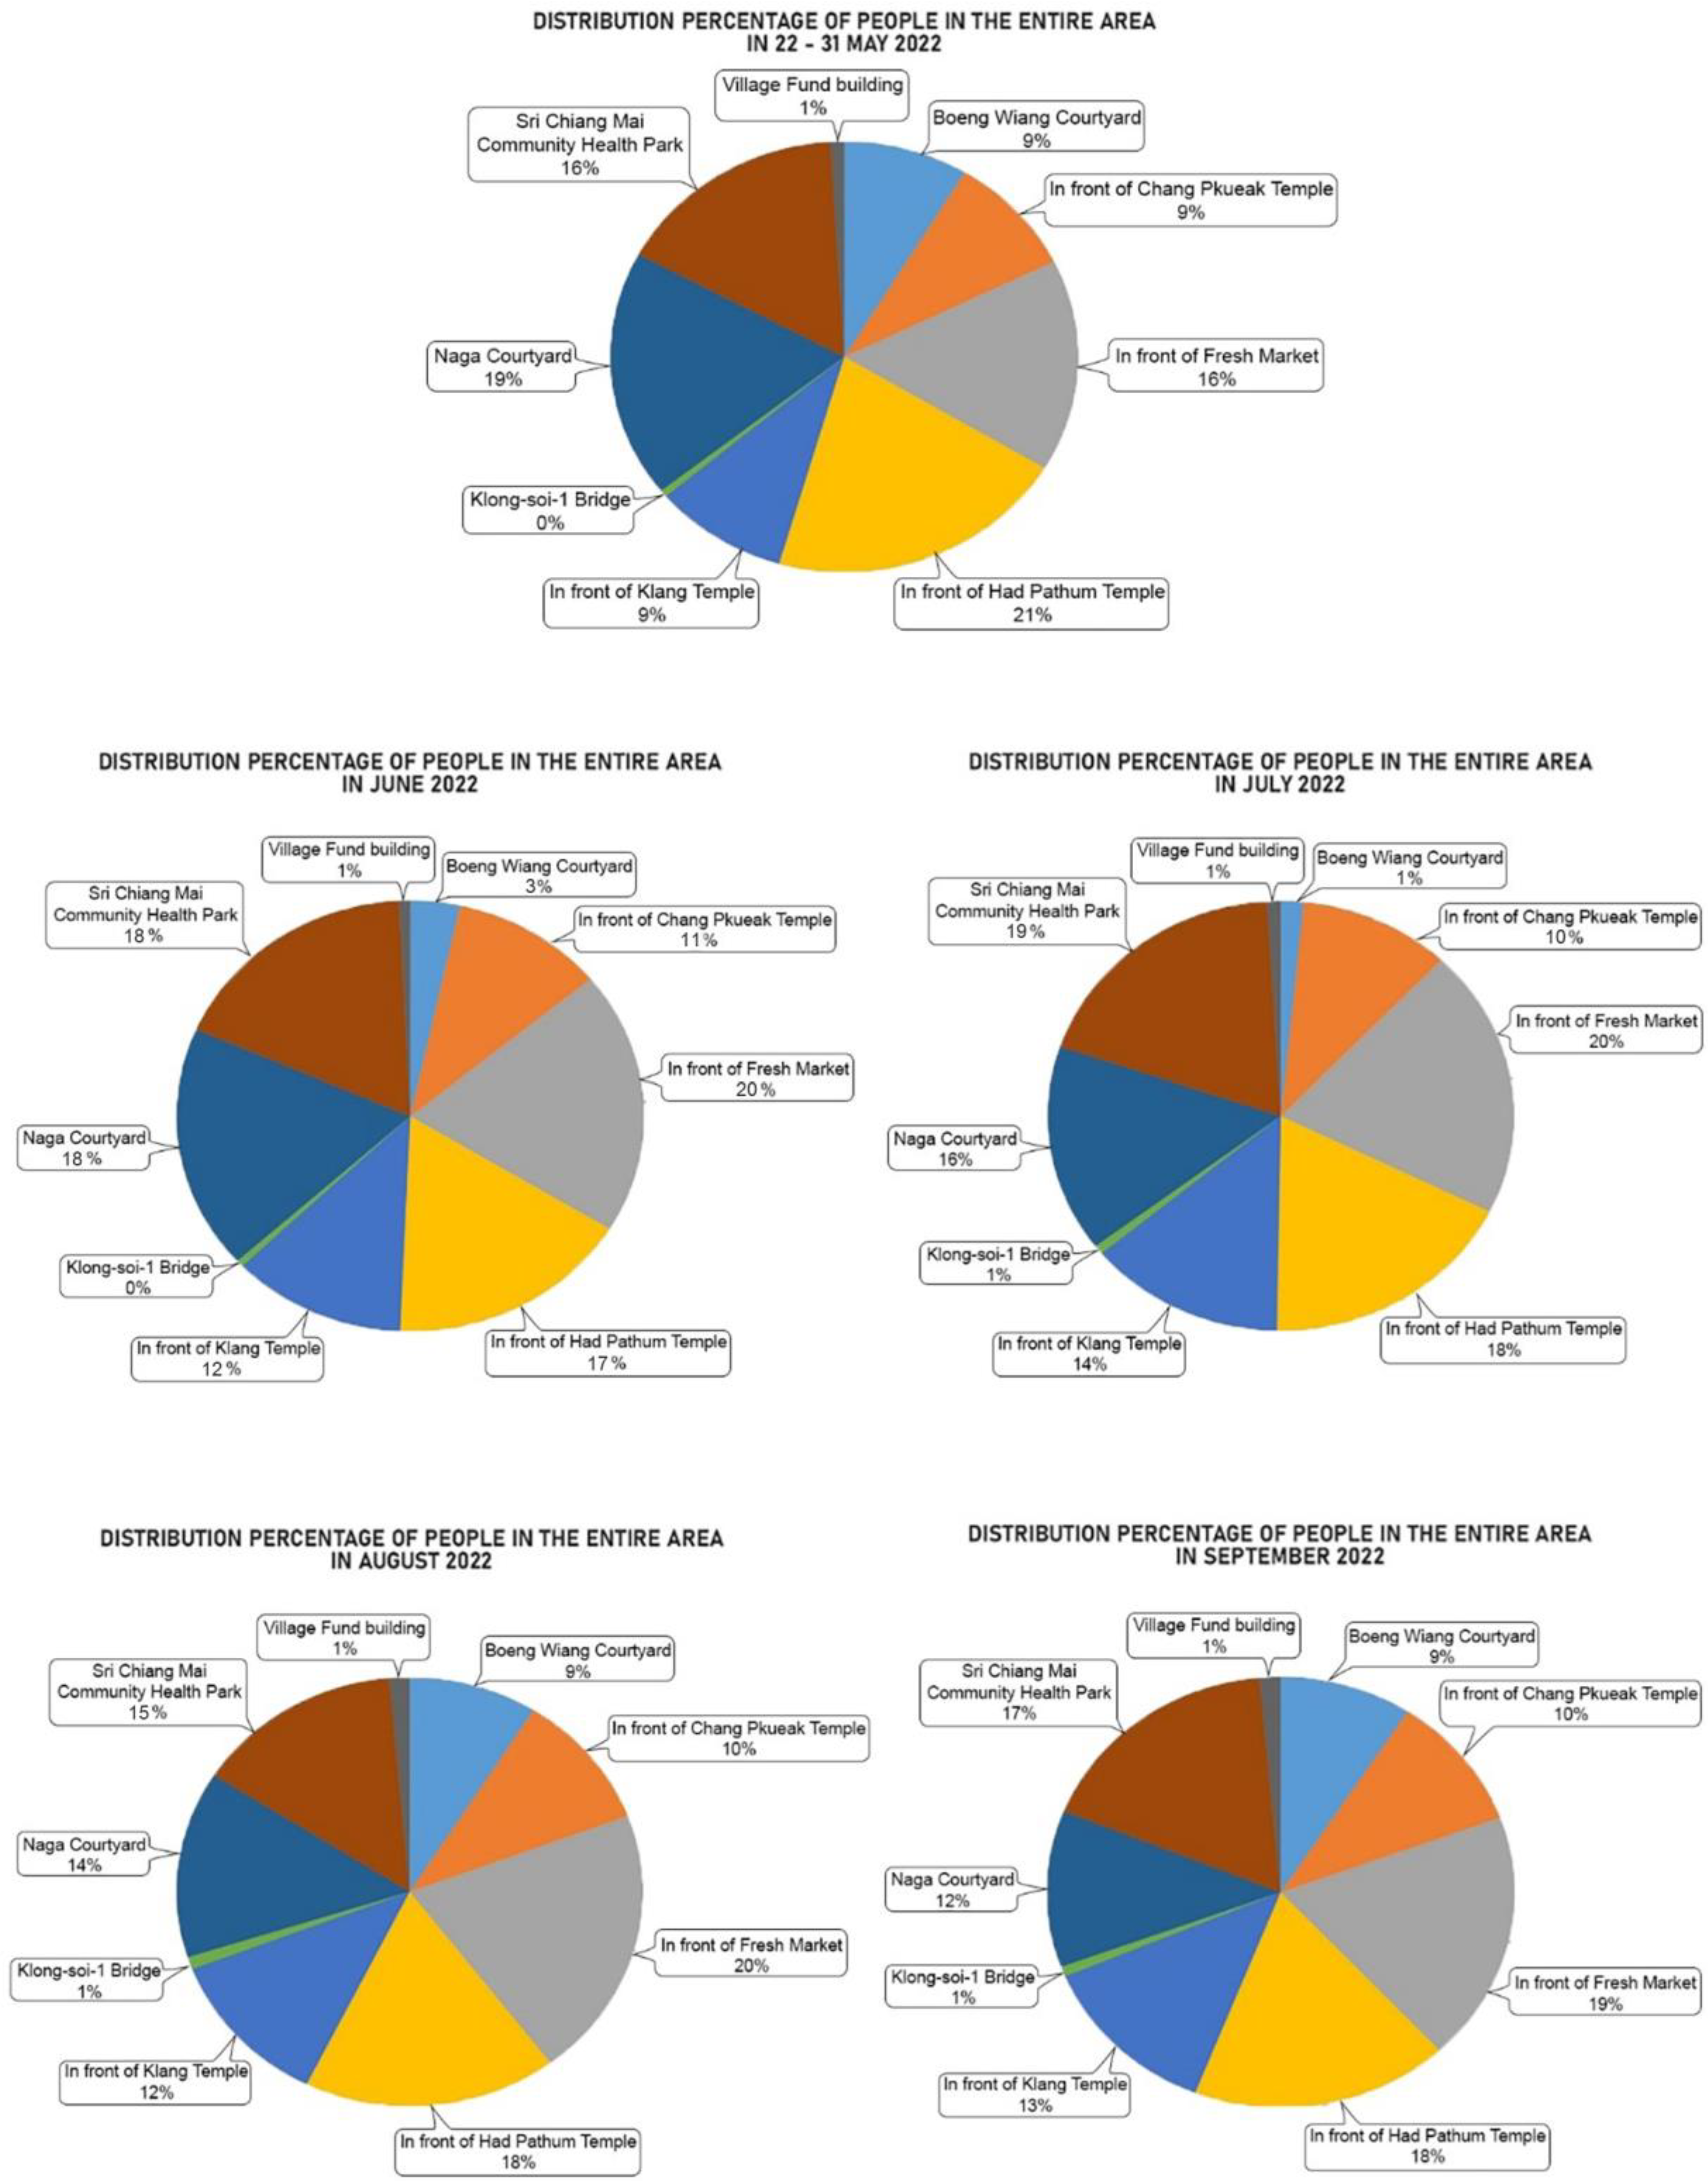
  • The majority of people were always collected by the APs installed in front of the Fresh Market. This is because of the fact that this place is where the primary source of variety in food ingredients exists, which is essential for the locals and why they frequently attend this area. As shown in Figure 1, this site is not located on the banks of the Mekong River, as the other eight areas are. Therefore, it is clear that these data have nothing to do with the reasons for the number of people in the other areas. Instead, it is where people must go for the reasons listed above; thus, there are more people living there than the other areas;
  • If only the eight points of interest along the banks of the Mekong River are considered, the area in front of Hat Pathum temple has the highest density of people. This is due to the fact that this area is the connection to the city’s main road, where people who come to participate in events along the Mekong River merge. In particular, the area immediately in front of the Had Pathum temple is extremely crowded with people who visit. The people of Si Chiang Mai consider it to be an important temple due to its stunning architecture; specifically, its beautiful white Buddha statues and Naga statues.
In Figure 14, the distribution percentage of people per area during the period 22 May 2022–September 2022 shows an interesting trend where the Naga courtyard, Sri Chiang Mai Community Health Park, and the area in front of the Had Pathum Temple are clustered together. These data can be explained by taking into consideration the following factors:
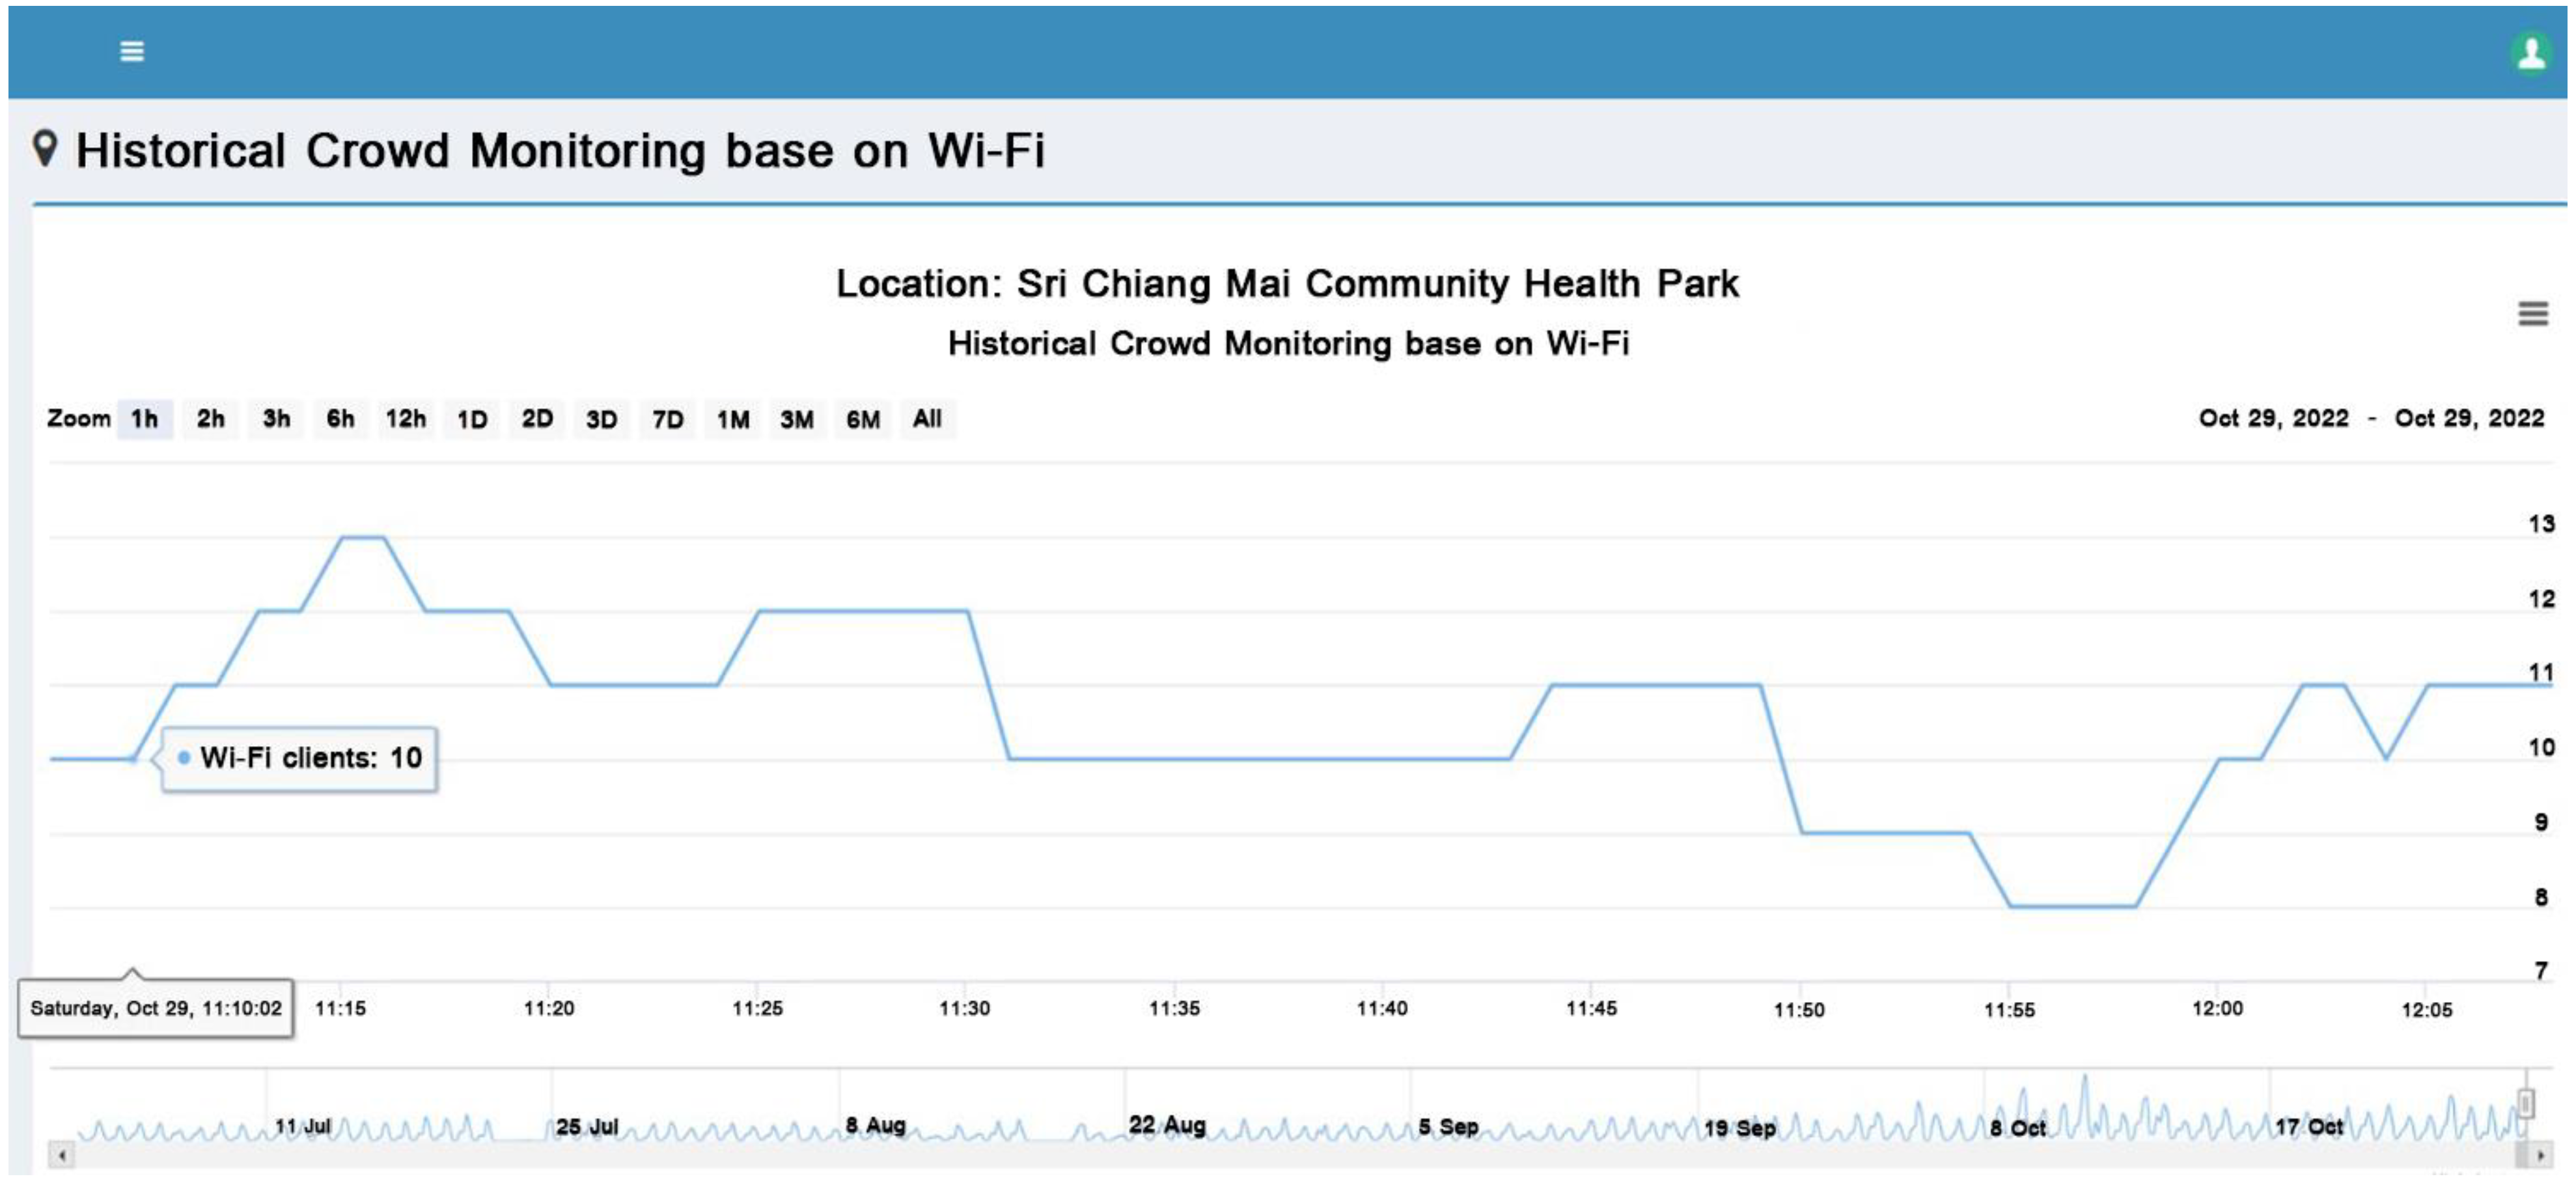
  • The APs were installed outside the building, without any shielding from the weather, and they were able to detect people walking in front of the structure. This area is one of the main pathways to the front of the Had Pathum temple, indicating that the APs for the Naga courtyard and Sri Chiang Mai Community Health Park were not only capturing the data of people inside the area, but also those passing by it;
  • It is also possible to allocate uninteresting areas, such as the Klong-soi-1 Bridge and the Village Fund Building, to attract people. However, those areas such as the Sri Chiang Mai Community Health Park, Naga Courtyard, and Hat Pathum Temple are all unique and continue to attract people to visit. This proves that the physical nature of the area, which includes points of interest and facilities such as gardens, restaurants, shops, etc., will directly affect the number of people who will visit those areas;
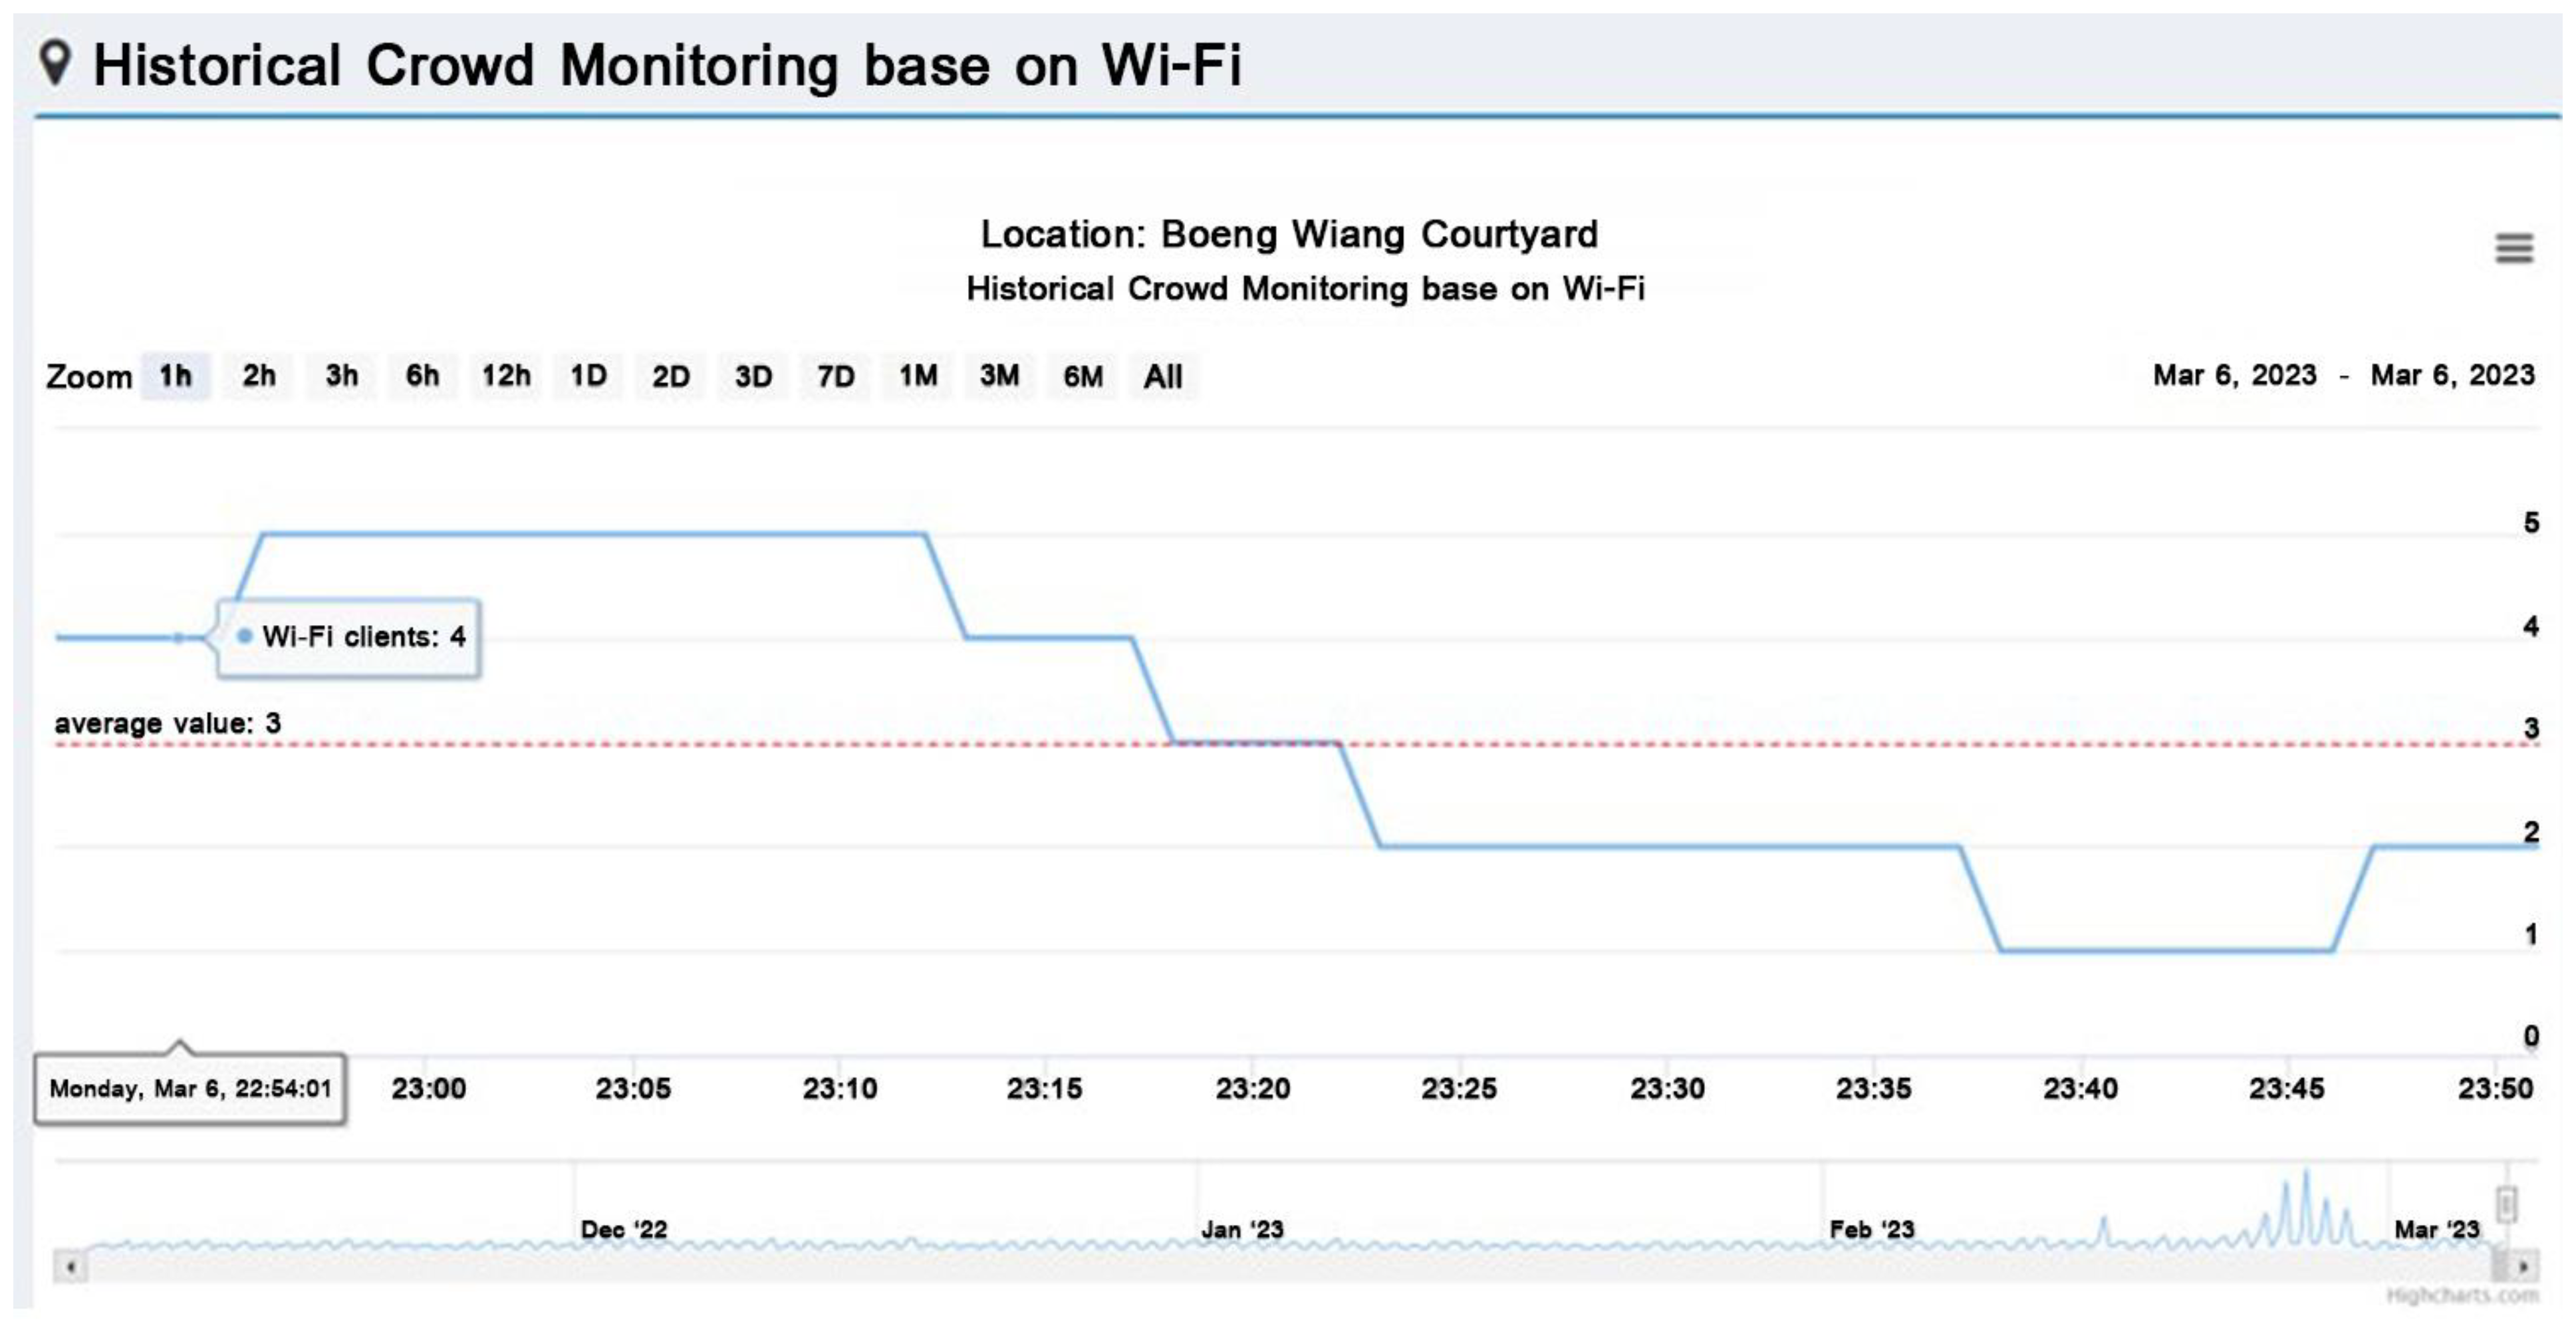
  • It is worth noting that the number of visitors to Boeng Wiang Courtyard, which is adjacent to Wat Hat Pathum, is approximately less than three times that of Hat Pathum Temple. Personal investigations revealed that the Boeng Wiang Courtyard is a large courtyard that is exclusively utilized for the hosting of municipal events. Based on the data collected for five months, if only one event had been held, such as the Bun Bang Fai Festival from 23 to 29 May 2022, then the number of people in the Boeng Wiang Courtyard area would have increased.
In fact, the same graph that analyzed the monthly display was homogeneous, with only minor differences in the five months from 22 May (the start date of data gathering) to the end of September 2022 (Figure 15).
The average amount of time people spend at the point where Sri Chiang Mai’s free Wi-Fi is available was the focus of our analysis of the duration of time spent there. Even if the analysis only offered a detail account of the individuals visited in the area, these data would still be meaningful. During the event, the majority of attendees were dispersed throughout the venue for less than five minutes. This is understandable given the movement of individuals to the event location. However, it is intriguing to observe that the number of people who stayed longer (i.e., from 5 to 20 to 60 min) tended to grow in timeframes with an event. Furthermore, a leaping trend was demonstrated when the improved free Wi-Fi system was in place during the timeframes of 20–60 min. On the other hand, the percentage of people who stayed longer than two hours was not found to be that high (Table 5).
The data show that 27.85% of the total length of stay in May was due to events, while 24.09 and 24.56% of the total length of stays in the area in August and September was due to the improved free Wi-Fi system. All timeframes—i.e., 5, 20, 60, and 120 min—have the most people staying in the area, accounting for 92.51% of the total. It is possible to show that people who come to the area in the Sri Chiang Mai Municipality will likely spend somewhere between five minutes and two hours there.
The final analysis we conducted for the entire Sri Chiang Mai area was based on the average number of peak hour ranges regarding the people who visited each location from the period of 22 May 2022 to 30 September 2022, as shown in Table 6 and Figure 16. The data are divided into events, each of which is three hours long. These data are pertinent because they demonstrate, in detail, how people will tend to explore the area. According to Table 6, there are approximately 30,000 people in the area between the hours of 18:00 and 20:59, which is the highest number of people in the area during the specified period. This is the time when people spend the most time in the area; however, the period between 15:00 and 17:59 is when people start coming out of the area. With this information, it is possible to explain these facts in a different light, such as the reason that most people who would be in the area is that they completed their working day and have thus gone out in order to participate in activities such as running, aerobic dancing, eating, and relaxing. After 21:00, they will start making their way home to rest for the night. From the appearance of the bar graph in Figure 16, it was observed that the trends in the number of people at each area were very similar, except for those three areas in front of Fresh Market; in front of Chang Phueak Temple; and Klong-soi-1 bridge. Let us start with the first of the three areas mentioned above, the front of the Fresh Market, since this is where consumer goods are sold. The busiest time was found to be between 15:00 and 17:59, which is when people come to shop for dinner preparation supplies. The second area of consideration is the front of Chang Phueak Temple, which is an area with shops selling used goods, as was explained in the methodology. Between 15:00 and 17:59, the greatest number of people may come to purchase goods and services. The shops in that area will begin to gradually close at 18:00. Khlong-soi-1 Bridge, which is where agriculture is utilized for the purpose of growing tomatoes, is the last location with the highest number of people during the hours of 15:00–17:59. People will take care of the tomato plants by watering, cutting the grass, and fertilizing them.

6. Discussion

Our real-time crowd monitoring system provides information that can be interpreted in a variety of ways. The system architecture consists of Wi-Fi access points, network management, a web server, and a visualization-displaying web application. This enables us to conduct a variety of behavioral analyses using the collected data. Based on the evidence presented, our interpretation of the results is as follows:
  • Events can attract people to visit urban spaces more frequently;
  • Aesthetic and facility-rich areas have a higher chance of being utilized by visitors;
  • Improved free Wi-Fi systems tend to register a continuous presence of people in the areas, indicating that they are being used;
  • The three locations examined in our research were utilized the most frequently between 18:00 and 20:59, by people who live or work near these locations;
  • Locals are the primary users of these areas, as evidenced by the increase in the number of people starting from 15:00 to 18:00, after which the number starts to decrease throughout the day.
We find this information interesting and believe that it can help replicate similar actions not only in the same area, but also in other areas. To close the gap in the data collected from our Wi-Fi infrastructure, we plan to install video cameras that can estimate the number of people in attendance and provide insights into crowd density and movement patterns.
Real-time crowd monitoring technology could improve user tracking across devices for people with several gadgets. The system currently estimates the population via their devices’ MAC addresses. The method may exaggerate the number of persons present if a person has multiple devices with distinct MAC addresses. The system could be improved to track users across all devices in order to fix this issue. Bluetooth beacons or other location-based technologies can identify multiple devices belonging to the same user. This would ensure that people with multiple devices are not overcounted and improve accuracy. Alternatively, the potential for underestimation should be acknowledged, and the importance of interpreting the data within this context should be emphasized. This is because the crowd size is based solely on the number of people connected to the Wi-Fi APs, which may not provide an accurate representation of the total number of people present in the area. To address this limitation, it is advisable to consider incorporating other data sources, such as video surveillance or other such sensors, in order to supplement the Wi-Fi-based crowd monitoring system.
While we believe that these results are promising, we recognize that there is room for improvement. We intend to increase the precision of our Wi-Fi sensors by adjusting the ratio of actual persons to detected gadgets. This will be achieved by evaluating the current facts regarding the use and adoption of smartphones and wearables, as well as by conducting polls under different circumstances. We will introduce this ratio as an adjustable parameter to enhance the accuracy of our estimations.
The real-time crowd monitoring system has various applications beyond just monitoring the density in urban spaces. One potential application is a point-of-interest (POI) recommendation system that uses the data gathered from the system to suggest places of interest to visitors based on their location, preferences, and historical data. This type of system could be particularly useful for tourists or people visiting a new city who may not be familiar with the area. Another potential application is route planning, where the system could suggest the best routes to take based on real-time crowd data. For example, if the system detects high levels of congestion in a particular area, it could recommend an alternate route to avoid the crowds. This could be particularly useful for city planners and transportation authorities in managing the traffic flow in busy areas. There have been several studies [31,32,33] on the use of real-time crowd data for POI recommendation and route planning. Overall, the real-time crowd monitoring system has the potential to be used in a variety of applications beyond just monitoring the number of people in urban spaces. The use of real-time crowd data for POI recommendation and route planning can improve the overall visitor experience in urban areas and help city planners manage traffic flow more efficiently.

7. Conclusions and Future Work

The purpose of this research was to design and implement a real time crowd monitoring system based on the existing public Wi-Fi infrastructure, with a focus on the Sri Chiang Mai Smart City. This study demonstrates the potential of leveraging existing public Wi-Fi infrastructure for crowd monitoring in uncontrolled, real-world environments. The monitoring system is readily accessible online and does not require additional hardware investment or maintenance. The collected dataset is also available for download. The main findings of this study indicate that the proposed system can monitor and track crowds in real time, thereby providing valuable insights into their movements, density, and behavior. The system also has the potential to enhance public safety and management, as well as to improve the overall experience of public spaces. The implications of the findings for the field of study are significant, especially in the context of the COVID-19 pandemic. By providing real-time crowd density visualizations and historical data for analysis, the proposed system can assist government policymakers in optimizing the use of public space and urban planning, while also ensuring public safety during the pandemic. The real-time crowd density data provided by the system can also assist in point-of-interest recommendations and route planning, thus enabling more responsive and effective urban planning and management systems.
One limitation of this study is that a quantitative evaluation was not feasible due to the uncontrolled environment in public open spaces; however, the system was visually evaluated in real-world conditions to assess crowd density, rather than represent the entire population.
Future research could focus on improving the accuracy and reliability of the system by incorporating additional data sources, such as Bluetooth devices, CO2 sensors, or vision-based technologies. Further exploration could also focus on developing machine learning algorithms for analyzing and interpreting the data collected, as well as in terms of improving the integration of the proposed system with other smart city solutions.
In conclusion, the design and implementation of a real-time crowd monitoring system based on existing public Wi-Fi infrastructure has the potential to significantly improve public safety and management, as well as to enhance the accuracy and relevance of point-of-interest recommendation and route planning systems, especially in the context of the COVID-19 pandemic. We believe that this research represents an important step forward in the development of more responsive and effective urban planning and management systems, and we look forward to further exploration and innovation in this exciting field.

Author Contributions

Conceptualization, C.S. (Chayada Surawanitkum), W.W., T.R., A.S., C.S. (Chavis Srichan), and A.N.; Methodology, A.N.; Software, T.W., P.T., W.B. and A.K.; Validation, A.N.; Formal analysis, A.N.; Investigation, T.W. and A.N.; Resources, T.W., P.T., W.B. and A.K.; Data curation, T.W., P.T., W.B. and A.K.; Writing—original draft, T.W. and A.N.; Writing—review and editing, C.S. (Chayada Surawanitkum), W.W., T.R., A.S., C.S. (Chavis Srichan), and A.N.; Visualization, T.W. and A.N.; Supervision, A.N.; Project administration, A.N. All authors have read and agreed to the published version of the manuscript.

Funding

This research received no external funding.

Data Availability Statement

Data will be available on request.

Acknowledgments

The authors express their gratitude to Sri Chiang Mai Municipality for providing valuable insights and guidance in comprehending the local context and facilitating fieldwork. The authors also extend their appreciation to National Telecom Public Company Limited for granting access to public Wi-Fi infrastructure and sharing their telecommunications expertise. Lastly, the authors would like to acknowledge the resources, facilities, and support provided by Khon Kaen University throughout the research.

Conflicts of Interest

The authors declare no conflict of interest.

References

  1. Nilsen, P.; Seing, I.; Ericsson, C.; Andersen, O.; Stefánsdóttir, N.T.; Tjørnhøj-Thomsen, T.; Kallemose, T.; Kirk, J.W. Implementing social distancing policy measures in the battle against the coronavirus: Protocol of a comparative study of Denmark and Sweden. Implement. Sci. Commun. 2020, 1, 77. [Google Scholar] [CrossRef]
  2. United Nations Thailand. Social Impact Assessment of COVID-19 in Thailand. Available online: https://www.unicef.org/thailand/media/5071/file/SocialImpactAssessmentofCOVID-19inThailand.pdf (accessed on 28 February 2022).
  3. Rattanapongsen, P.; Rakhang, C.; Pongthitikhuna, K.; d’Almeid, T.; Adunyarittigun, D. The Impact of Thaichana Application on Customer Purchasing Behavior in Clothing Stores. J. Bus. Adm. Maejo Univ. 2021, 3, 1–16. [Google Scholar] [CrossRef]
  4. Megahed, N.A.; Abdel-Kader, R.F. Smart Cities after COVID-19: Building a conceptual framework through a multidisciplinary perspective. Sci. Afr. 2022, 17, e01374. [Google Scholar] [CrossRef] [PubMed]
  5. Berenguer, A.; Ros, D.F.; Gómez-Oliva, A.; Ivars-Baidal, J.A.; Jara, A.J.; Laborda, J.; Mazón, J.-N.; Perles, A. Crowd Monitoring in Smart Destinations Based on GDPR-Ready Opportunistic RF Scanning and Classification of WiFi Devices to Identify and Classify Visitors’ Origins. Electronics 2022, 11, 835. [Google Scholar] [CrossRef]
  6. Nguyen, C.T.; Saputra, Y.M.; Van Huynh, N.; Nguyen, N.-T.; Khoa, T.V.; Tuan, B.M.; Nguyen, D.N.; Hoang, D.T.; Vu, T.X.; Dutkiewicz, E.; et al. A Comprehensive Survey of Enabling and Emerging Technologies for Social Distancing—Part I: Fundamentals and Enabling Technologies. IEEE Access 2020, 8, 153479–153507. [Google Scholar] [CrossRef]
  7. Nguyen, C.T.; Saputra, Y.M.; Van Huynh, N.; Nguyen, N.-T.; Khoa, T.V.; Tuan, B.M.; Nguyen, D.N.; Hoang, D.T.; Vu, T.X.; Dutkiewicz, E.; et al. A Comprehensive Survey of Enabling and Emerging Technologies for Social Distancing—Part II: Emerging Technologies and Open Issues. IEEE Access 2020, 8, 154209–154236. [Google Scholar] [CrossRef]
  8. Singh, U.; Determe, J.-F.; Horlin, F.; De Doncker, P. Crowd Monitoring: State-of-the-Art and Future Directions. IETE Tech. Rev. 2021, 38, 578–594. [Google Scholar] [CrossRef]
  9. Murad, S.S.; Yussof, S.; Badeel, R. Wireless Technologies for Social Distancing in the Time of COVID-19: Literature Review, Open Issues, and Limitations. Sensors 2022, 22, 2313. [Google Scholar] [CrossRef] [PubMed]
  10. Ansari, M.A.; Singh, D.K. Monitoring social distancing through human detection for preventing/reducing COVID spread. Int. J. Inf. Technol. 2021, 13, 1255–1264. [Google Scholar] [CrossRef] [PubMed]
  11. Duives, D.C.; Van Oijen, T.; Hoogendoorn, S.P. Enhancing Crowd Monitoring System Functionality through Data Fusion: Estimating Flow Rate from Wi-Fi Traces and Automated Counting System Data. Sensors 2020, 20, 6032. [Google Scholar] [CrossRef]
  12. Du, R.; Santi, P.; Xiao, M.; Vasilakos, A.V.; Fischione, C. The Sensable City: A Survey on the Deployment and Management for Smart City Monitoring. IEEE Commun. Surv. Tutor. 2019, 21, 1533–1560. [Google Scholar] [CrossRef]
  13. Baena, E.; Fortes, S.; Alay, Ö.; Xie, M.; Lønsethagen, H.; Barco, R. Cellular Network Radio Monitoring and Management through Virtual UE Probes: A Study Case Based on Crowded Events. Sensors 2021, 21, 3404. [Google Scholar] [CrossRef] [PubMed]
  14. Alghamdi, N.S.; Khan, M.A.; Karamti, H.; Nawaz, N.A. Internet of Things (IoT) enabled smart queuing model to support massive safe crowd at Ka’aba. Alex. Eng. J. 2022, 61, 12713–12723. [Google Scholar] [CrossRef]
  15. Filippoupolitis, A.; Oliff, W.; Loukas, G. Bluetooth Low Energy Based Occupancy Detection for Emergency Management. In Proceedings of the 15th International Conference on Ubiquitous Computing and Communications and 2016 International Symposium on Cyberspace and Security (IUCC-CSS), Granada, Spain, 14–16 December 2016; pp. 31–38. [Google Scholar] [CrossRef]
  16. Tekler, Z.D.; Low, R.; Gunay, B.; Andersen, R.K.; Blessing, L. A scalable Bluetooth Low Energy approach to identify occupancy patterns and profiles in office spaces. Build. Environ. 2020, 171, 106681. [Google Scholar] [CrossRef]
  17. Collotta, M.; Pau, G. A Novel Energy Management Approach for Smart Homes Using Bluetooth Low Energy. IEEE J. Sel. Areas Commun. 2015, 33, 2988–2996. [Google Scholar] [CrossRef]
  18. Tekler, Z.D.; Low, R.; Yuen, C.; Blessing, L. Plug-Mate: An IoT-based occupancy-driven plug load management system in smart buildings. Build. Environ. 2022, 223, 109472. [Google Scholar] [CrossRef]
  19. Chilipirea, C.; Dobre, C.; Baratchi, M.; van Steen, M. Identifying Movements in Noisy Crowd Analytics Data. In Proceedings of the 2018 19th IEEE International Conference on Mobile Data Management (MDM), Aalborg, Denmark, 26–28 June 2018; pp. 161–166. [Google Scholar] [CrossRef] [Green Version]
  20. Tekler, Z.D.; Chong, A. Occupancy prediction using deep learning approaches across multiple space types: A minimum sensing strategy. Build. Environ. 2022, 226, 109689. [Google Scholar] [CrossRef]
  21. Longo, E.; Redondi, A.E.; Cesana, M. Accurate occupancy estimation with WiFi and bluetooth/BLE packet capture. Comput. Networks 2019, 163, 106876. [Google Scholar] [CrossRef]
  22. Determe, J.-F.; Azzagnuni, S.; Singh, U.; Horlin, F.; De Doncker, P. Monitoring Large Crowds With WiFi: A Privacy-Preserving Approach. IEEE Syst. J. 2022, 16, 2148–2159. [Google Scholar] [CrossRef]
  23. Vega-Barbas, M.; Álvarez-Campana, M.; Rivera, D.; Sanz, M.; Berrocal, J. AFOROS: A Low-Cost Wi-Fi-Based Monitoring System for Estimating Occupancy of Public Spaces. Sensors 2021, 21, 3863. [Google Scholar] [CrossRef]
  24. Zhou, Y.; Lau, B.P.L.; Koh, Z.; Yuen, C.; Ng, B.K.K. Understanding Crowd Behaviors in a Social Event by Passive WiFi Sensing and Data Mining. IEEE Internet Things J. 2020, 7, 4442–4454. [Google Scholar] [CrossRef] [Green Version]
  25. Singh, U.; Determe, J.-F.; Horlin, F.; De Doncker, P. Crowd Forecasting Based on WiFi Sensors and LSTM Neural Networks. IEEE Trans. Instrum. Meas. 2020, 69, 6121–6131. [Google Scholar] [CrossRef] [Green Version]
  26. Boulanger, S.O.M.; Longo, D.; Roversi, R. Data Evidence-Based Transformative Actions in Historic Urban Context—The Bologna University Area Case Study. Smart Cities 2020, 3, 1448–1476. [Google Scholar] [CrossRef]
  27. ROCK Official Website. Available online: https://rockproject.eu (accessed on 15 November 2022).
  28. Data Fusion Research Centre (DFRC) Official Website. Available online: http://www.dfrc.ch (accessed on 15 November 2022).
  29. Alorda-Ladaria, B.; Ruiz-Pérez, M.; Ramos, V. A Near Real-Time Monitoring System Using Public WI-FI Data to Evaluate COVID-19 Social Distance Measures. Electronics 2022, 11, 2897. [Google Scholar] [CrossRef]
  30. Cisco Meraki Location Analytics Introduction. 2018, p. 1. Available online: https://documentation.meraki.com/MR/Monitoring_and_Reporting/Location_Analytics (accessed on 14 November 2022).
  31. Low, R.; Tekler, Z.D.; Cheah, L. An End-to-End Point of Interest (POI) Conflation Framework. ISPRS Int. J. Geo-Inf. 2021, 10, 779. [Google Scholar] [CrossRef]
  32. Zhao, P.; Luo, A.; Liu, Y.; Xu, J.; Li, Z.; Zhuang, F.; Sheng, V.S.; Zhou, X. Where to Go Next: A Spatio-Temporal Gated Network for Next POI Recommendation. IEEE Trans. Knowl. Data Eng. 2022, 34, 2512–2524. [Google Scholar] [CrossRef]
  33. Lu, E.H.-C.; Chen, H.-S.; Tseng, V.S. An Efficient Framework for Multirequest Route Planning in Urban Environments. IEEE Trans. Intell. Transp. Syst. 2017, 18, 869–879. [Google Scholar] [CrossRef]
Figure 1. The public Wi-Fi hotspots in Sri Chiang Mai Smart City along the Mekong River.
Smartcities 06 00048 g001
Figure 2. An overview of methods for building real-time crowd monitoring systems and data analysis.
Smartcities 06 00048 g002
Figure 3. The public Wi-Fi access point at Naga Courtyard station.
Smartcities 06 00048 g003
Figure 4. Overview of the communication domain.
Smartcities 06 00048 g004
Figure 5. Stage of data processing.
Smartcities 06 00048 g005
Figure 6. Encryption process.
Smartcities 06 00048 g006
Figure 7. Data visualization module.
Smartcities 06 00048 g007
Figure 8. The real-time crowd monitoring is available at https://nms.ntone.cloud/udn/realtime (accessed on 10 March 2023).
Smartcities 06 00048 g008
Figure 9. The graph showing the history of the data.
Smartcities 06 00048 g009
Figure 10. The average density of a location at different times.
Smartcities 06 00048 g010
Figure 11. An example of the raw data stored in a database.
Smartcities 06 00048 g011
Figure 12. The total number of people in the entire area between 22 May and 30 September 2022.
Smartcities 06 00048 g012
Figure 13. The average hourly population of the entire area between 22 May and 30 September 2022.
Smartcities 06 00048 g013
Figure 14. Distribution percentage of the people who used the free Wi-Fi in the entire area of Sri Chiang Mai for the timeframe of 22 May–September 2022.
Smartcities 06 00048 g014
Figure 15. Distribution percentage of the people who used the free Wi-Fi in the entire area of Sri Chiang Mai for each month.
Smartcities 06 00048 g015
Figure 16. The bar chart presents a comparison of the average range for peak hours at each location, for the period beginning 22 May 2022 and ending 30 September 2022.
Smartcities 06 00048 g016
Table 1. Comparison of features of monitoring system research works.
Feature[22][23][24][25][26][29]This Work
Specific device-
Practical usage---
Real-time monitoring-----
Real-time monitoring available------
Behaviors analysis-
Public dataset available-----
Table 2. The locations where Wi-Fi APs were installed.
No.SiteLat, Long
1Klong-soi-1 Bridge17.96530959 N, 102.56014981 E
2Village Fund building17.96298473 N, 102.56672917 E
3In front of Chang Phueak Temple17.95974745 N, 102.57895782 E
4In front of Klang Temple17.95912645 N, 102.58417066 E
5Sri Chiang Mai Community Health Park17.9589032 N, 102.58734054 E
6Naga Courtyard17.95900134 N, 102.5889415 E
7In front of Had Pathum Temple17.95900381 N, 102.59049874 E
8Boeng Wiang Courtyard17.95866402 N, 102.59089603 E
9In front of Fresh Market17.9568754 N, 102.585087 E
Table 3. List of surrounding details of the area and activities in the area between May and September 2022.
No.SiteEvent TitleThe Area’s Surroundings and Services
1Klong-soi-1 BridgeNoThe surrounding area is where tomatoes are planted, and it marks the end of the running lane. It is opposite Laos National Airport.
2Village Fund
building
NoSmall buildings where people in the community can come together to plan activities and sell farm goods to other people in the community.
3In front of Chang Phueak TempleNoIn the front of the temple there are about five places for food and beverages, as well as a store that sells used clothes.
4In front of Klang TempleNoNone
5Sri Chiang Mai Community Health ParkNoPeople can relax in the gardens, and there are a great deal of food options and drinks. The neighborhood elementary school is located directly across from the garden.
6Naga CourtyardFrom 23 May to 29 May 2022 the Bun Bang Fai Festival will be held in Boeng Wiang Courtyard, which is close to this area.Large statues of Naga and the beautiful gardens make this area a landmark for everyone in the town. There is also a great deal of food options and drinks.
7In front of Had Pathum TempleFrom 23 May to 29 May 2022 the Bun Bang Fai Festival will be held in Boeng Wiang Courtyard, which is close to this area.The principal Buddhist landmark is the temple, which contains exquisite white Buddha and Naga statues. On the opposite side of the temple is a large courtyard where locals and visitors participate in events and concerts. There is also a great deal of food options and drinks.
8Boeng Wiang
Courtyard
From 23 May to 29 May 2022 the Bun Bang Fai Festival will be held in this area.This is a very large courtyard that serves as a venue for a variety of events, including annual events and major city events. It also serves as a location for evening exercises.
9In front of Fresh MarketNoThis is the only place in town that sells raw materials for cooking. Available in the morning and afternoon of every day.
Table 4. Calculation of the number of people attending during specific 7-day timeframes with confirmation on whether there was a linking with events and whether the free Wi-Fi system was improved.
Timeframe (7 Days)Unique
People
EventImprovement of the Free Wi-Fi System?
23–29 May 20229564Yes (Bun Bang Fai Festival)no
23–29 June 20224064nono
23–29 July 20225404nono
23–29 August 20228731noyes (easy to connect)
23–29 September 20228464noyes (change APs)
Table 5. A comparison on how long people who used the free Wi-Fi stayed in the whole area of Sri Chiang Mai in a few different 7-day time periods.
Timeframe (7 Days)<1 min1–5 min5–20 min20–60 min60–120 min2–3 h3 hTotal TimeEventImprovement of the System?
23–29 May 20220.04%0.11%9.26%12.74%4.17%0.66%0.86%27.85%yesno
23–29 June 20220.00%0.03%0.05%5.16%1.89%0.26%0.29%7.67%nono
23–29 July 20220.00%0.04%0.65%10.78%3.09%0.64%0.63%15.83%nono
23–29 August 20220.01%0.02%4.60%13.93%3.72%0.77%1.03%24.09%noyes
23–29 September 20220.02%0.06%4.79%13.47%4.24%0.94%1.06%24.56%noyes
Table 6. The average ranges for the peak hours at each location during the period 22 May 2022–30 September 2022.
Site Name00:00

02:59
03:00

05:59
06:00

08:59
09:00

11:59
12:00

14:59
15:00

17:59
18:00

20:59
21:00

23:59
Unique
People
(Sum)
Klong-soi-1 Bridge144859511825925832865
Village Fund building82111091111903734331501459
In front of Chang Phueak Temple3591811692193024992744245998212,846
In front of Klang Temple46917814841875231535953708161215,236
Sri Chiang Mai Community Health Park62313615622201321453695901230921,315
Naga Courtyard57511711871964329247735108205819,074
In front of Had Pathum Temple88325715692302335952856577264122,846
Boeng Wiang Courtyard282916329351407188220869898304
In front of the Fresh Market791101935383310370853424319208524,112
Sum of unique people4078199411,85814,72320,10229,62230,84912,585126,057
Disclaimer/Publisher’s Note: The statements, opinions and data contained in all publications are solely those of the individual author(s) and contributor(s) and not of MDPI and/or the editor(s). MDPI and/or the editor(s) disclaim responsibility for any injury to people or property resulting from any ideas, methods, instructions or products referred to in the content.

