1. Introduction
Data collection is everywhere, home utility measurement, our coddled smartphones, and increasingly in public spaces, where government and corporate actors use algorithmic decision making generated from sensor inputs for a multitude of purposes [
1]. With so much data collected that either may be relevant to the public, partially funded by the public, or generated by the public, the power imbalance between the data owners and “the public” in smart public space is an underlying concern.
While tremendous effort has been put in place to increase consumer awareness of online data collection (primarily of data that is personal in nature), the standardization of data collection visibility in public space lags behind [
2]. This means that the practitioners of public spaces rarely know to what extent data are collected around them, much less how and why it is used or how to access it. Moreover, the focus on personal data disappoints in the public arena. Any data collected from one’s personal device or home that keeps track of the origin point is personal, thereby calling for increased consumer awareness, access, and control under the General Data Protection Regulation (GDPR) and similar laws. Public space is not inherently connected back to the individual, making the notification of collection and the right to access data not guaranteed.
The power imbalances between varying data stakeholders in the smart city and the rampant datafication of public spaces make the push towards “open data” potentially disruptive [
3,
4]. Open data can be viewed as the idea that data can be safely and ethically open to the public and should be made freely available. Andrew Schrock describes the history of open data in the United States as rooted in the early 1900s movement for freedom of information which naturally evolved with the internet, thereby shifting the focus of “openness” from information to data [
5]. Schrock shares that “civic hackers” both instigated and transformed with the shift to open data. Depending on one’s views, civic hackers, individuals who demand and use civic open data, can be geeky neoliberals or essential fixtures for democratic engagement and positive change [
5].
In 2019, the European Union (EU) amended the Open Data Directive, which pushes for more datasets stemming from the public sector to be made openly accessible [
6]. In the academic sector, the Open Science approach has been seen by some as the EU prioritizing innovation and “technical optimization” over ethics-first design principles like those fostered by Responsible Research and Innovation [
7]. A literature review revealed that open data are “1.12-1: to 181:1” times more economically valuable than closed data [
8] (p. 67).
While open data are gaining academic notice, there is still a dearth of studies that qualitatively detail the process and stakeholder concerns for a modern smart city project. This article serves to fill this gap by addressing the issue of open data in the smart city through the lens of business, academia, government, and the general public by documenting the trials of opening a small subset of data from a smart bridge in Amsterdam. In order to analyze what people think of open data and what they do with it, a datathon was hosted, where participants were interviewed about their experience. This analysis is useful because data sharing is more easily written about idealistically than put into practice. The often-hidden details that complicate the practice of open data are shared in this piece along with universal analysis.
The datathon described in this paper is by no means the first event exposing smart city data. Academia, government, and corporations alike have begun to embrace the concept of civic hackers as inspiration to host urban hackathons, usually posed with a design challenge, as a participatory means to urban development [
9]. For example, in 2014, a hackathon hosted in Denmark, with 65 university students participating, was made possible via a “triple helix” collaboration between academia, corporations, and government. Notably, citizens were not included in the triple helix model [
10]. The city of Mississauga in Canada hosted an open data challenge in 2020 with 18 days of competition that ended with a winning team [
11,
12]. India’s Ministry of Housing and Public Affairs hosted an open data week from 17 to 22 January 2022 with participation from their 100 smart cities on their Smart Cities Open Data Portal [
13]. On 5 March 2022, Open Data Day, an annual celebration beginning in 2019, drew 153 international events with people and datasets from all over the world [
14].
Given that open data are posited to become more of a norm in the smart city [
15], the time is ripe to analyze stakeholder interests and shifting power dynamics without the emphasis on civic hackers or specified design challenges. Civic hackers represent a minority of the population and specified design challenges do not necessarily translate to how a population might choose to use open data. This article proceeds in four parts.
Section 2 outlines the parameters of this study. It gives context to the bridge, data, research consortium, and datathon centered in this work.
Section 3 articulates the concerns and interests of public data sharing from within the research committee and Amsterdam municipality. This paper includes the process of opening data from the bridge and the organization of the datathon. Often these details are not included in academic research to the detriment of those wishing to duplicate similar projects or learn from the realistic challenges of smart city projects. Part Four describes and analyzes the outcomes of the datathon. Part Five discusses the question, “who wins” with open data based on the findings from this case study, which also foreshadows who loses. Finally, the paper concludes with predictions and recommendations for the future of infrastructural smart city open data.
2. Project Parameters
This paper draws upon a case study involving making a subset of data from the MX3D bridge open to the public through a datathon.
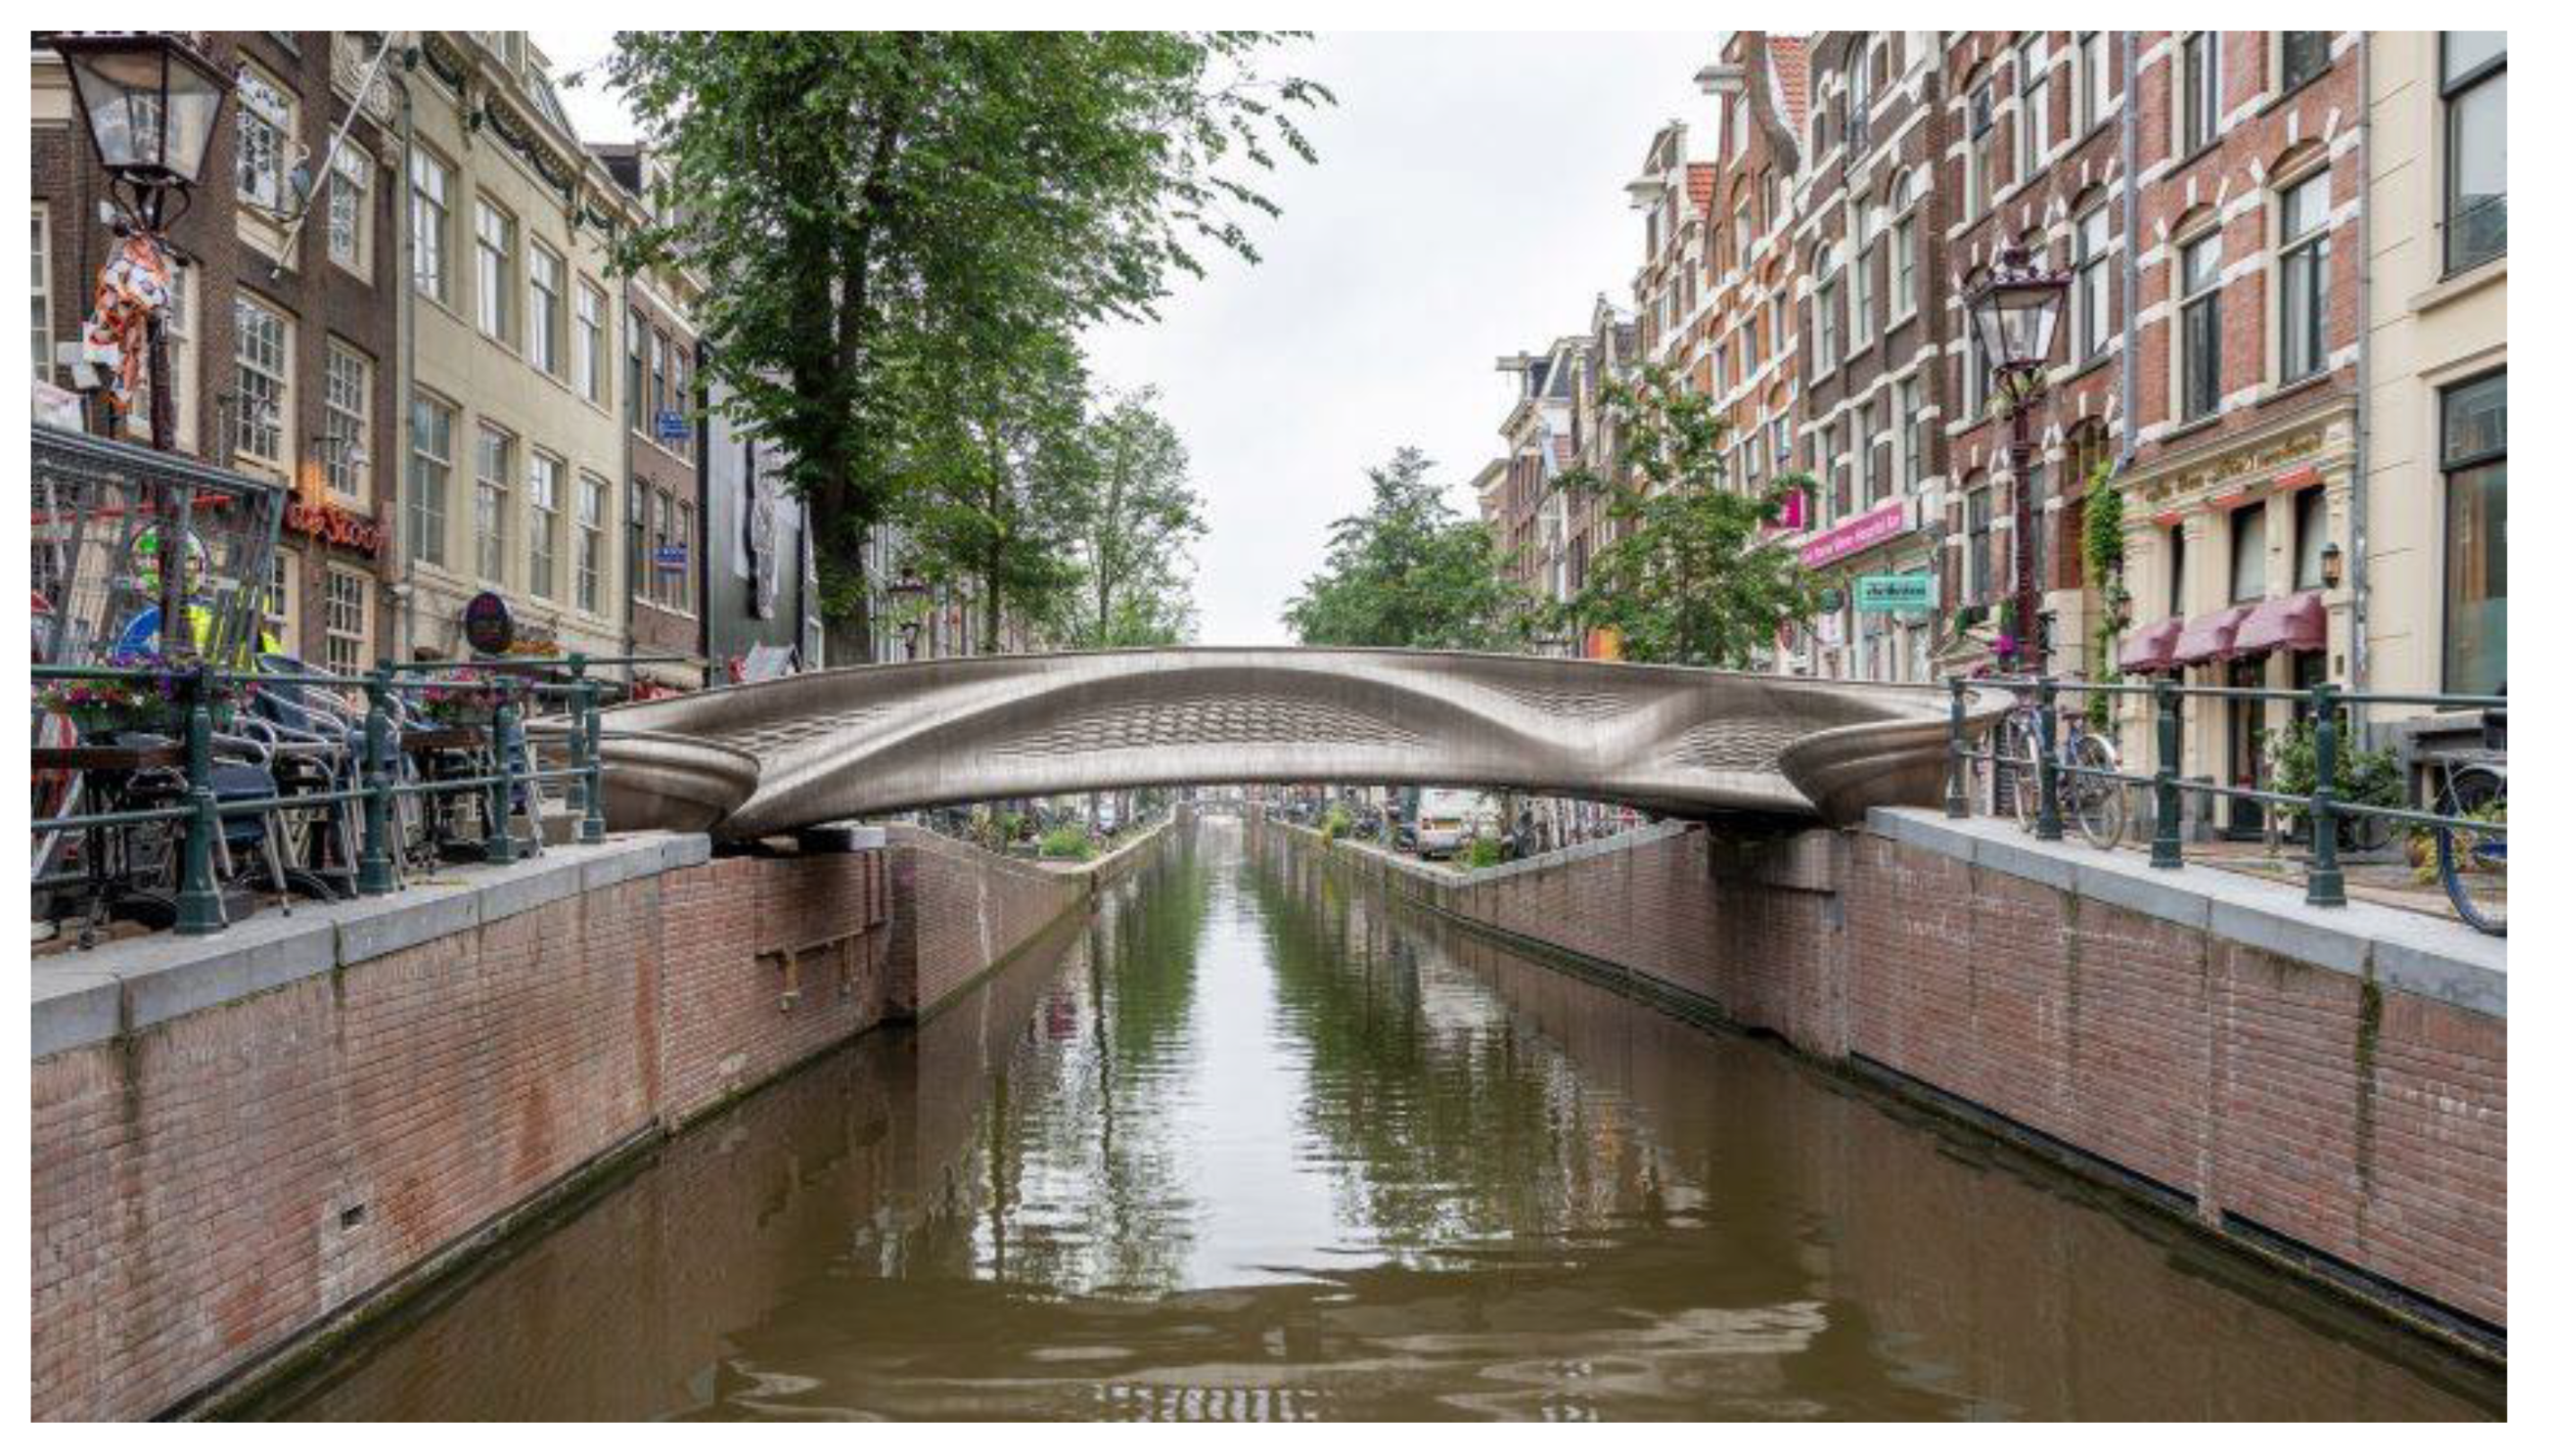
Figure 1 shows the MX3D bridge, a 12-m-long 3D-printed stainless steel bridge that rests over Oudezijds Achterburgwal Canal in Amsterdam’s Red Light district. It is the world’s first 3D-printed stainless steel bridge.
The bridge has over 90 sensors including load cells, displacement sensors, strain gauges, thermistors, accelerometers, and inclinometers. Readings from the sensors are stored in a local server room and then uploaded to a private cloud space where they are paired with open data climate readings from nearby. The Smarter Bridges Research Consortium is a group composed of corporate and academic actors including Autodesk, the Alan Turing Institute, and the University of Twente. Most members are interested in studying the structure of the bridge. MX3D, the company that created the bridge, was commissioned by Amsterdam municipality to place the bridge for a period between two and ten years with an initial contract for two years. As part of MX3D’s contract with the municipality, data from the bridge is owned by the city but shared with the Smarter Bridges Research Consortium through a contract. Consortium members have access to all the data from the bridge in almost real time.
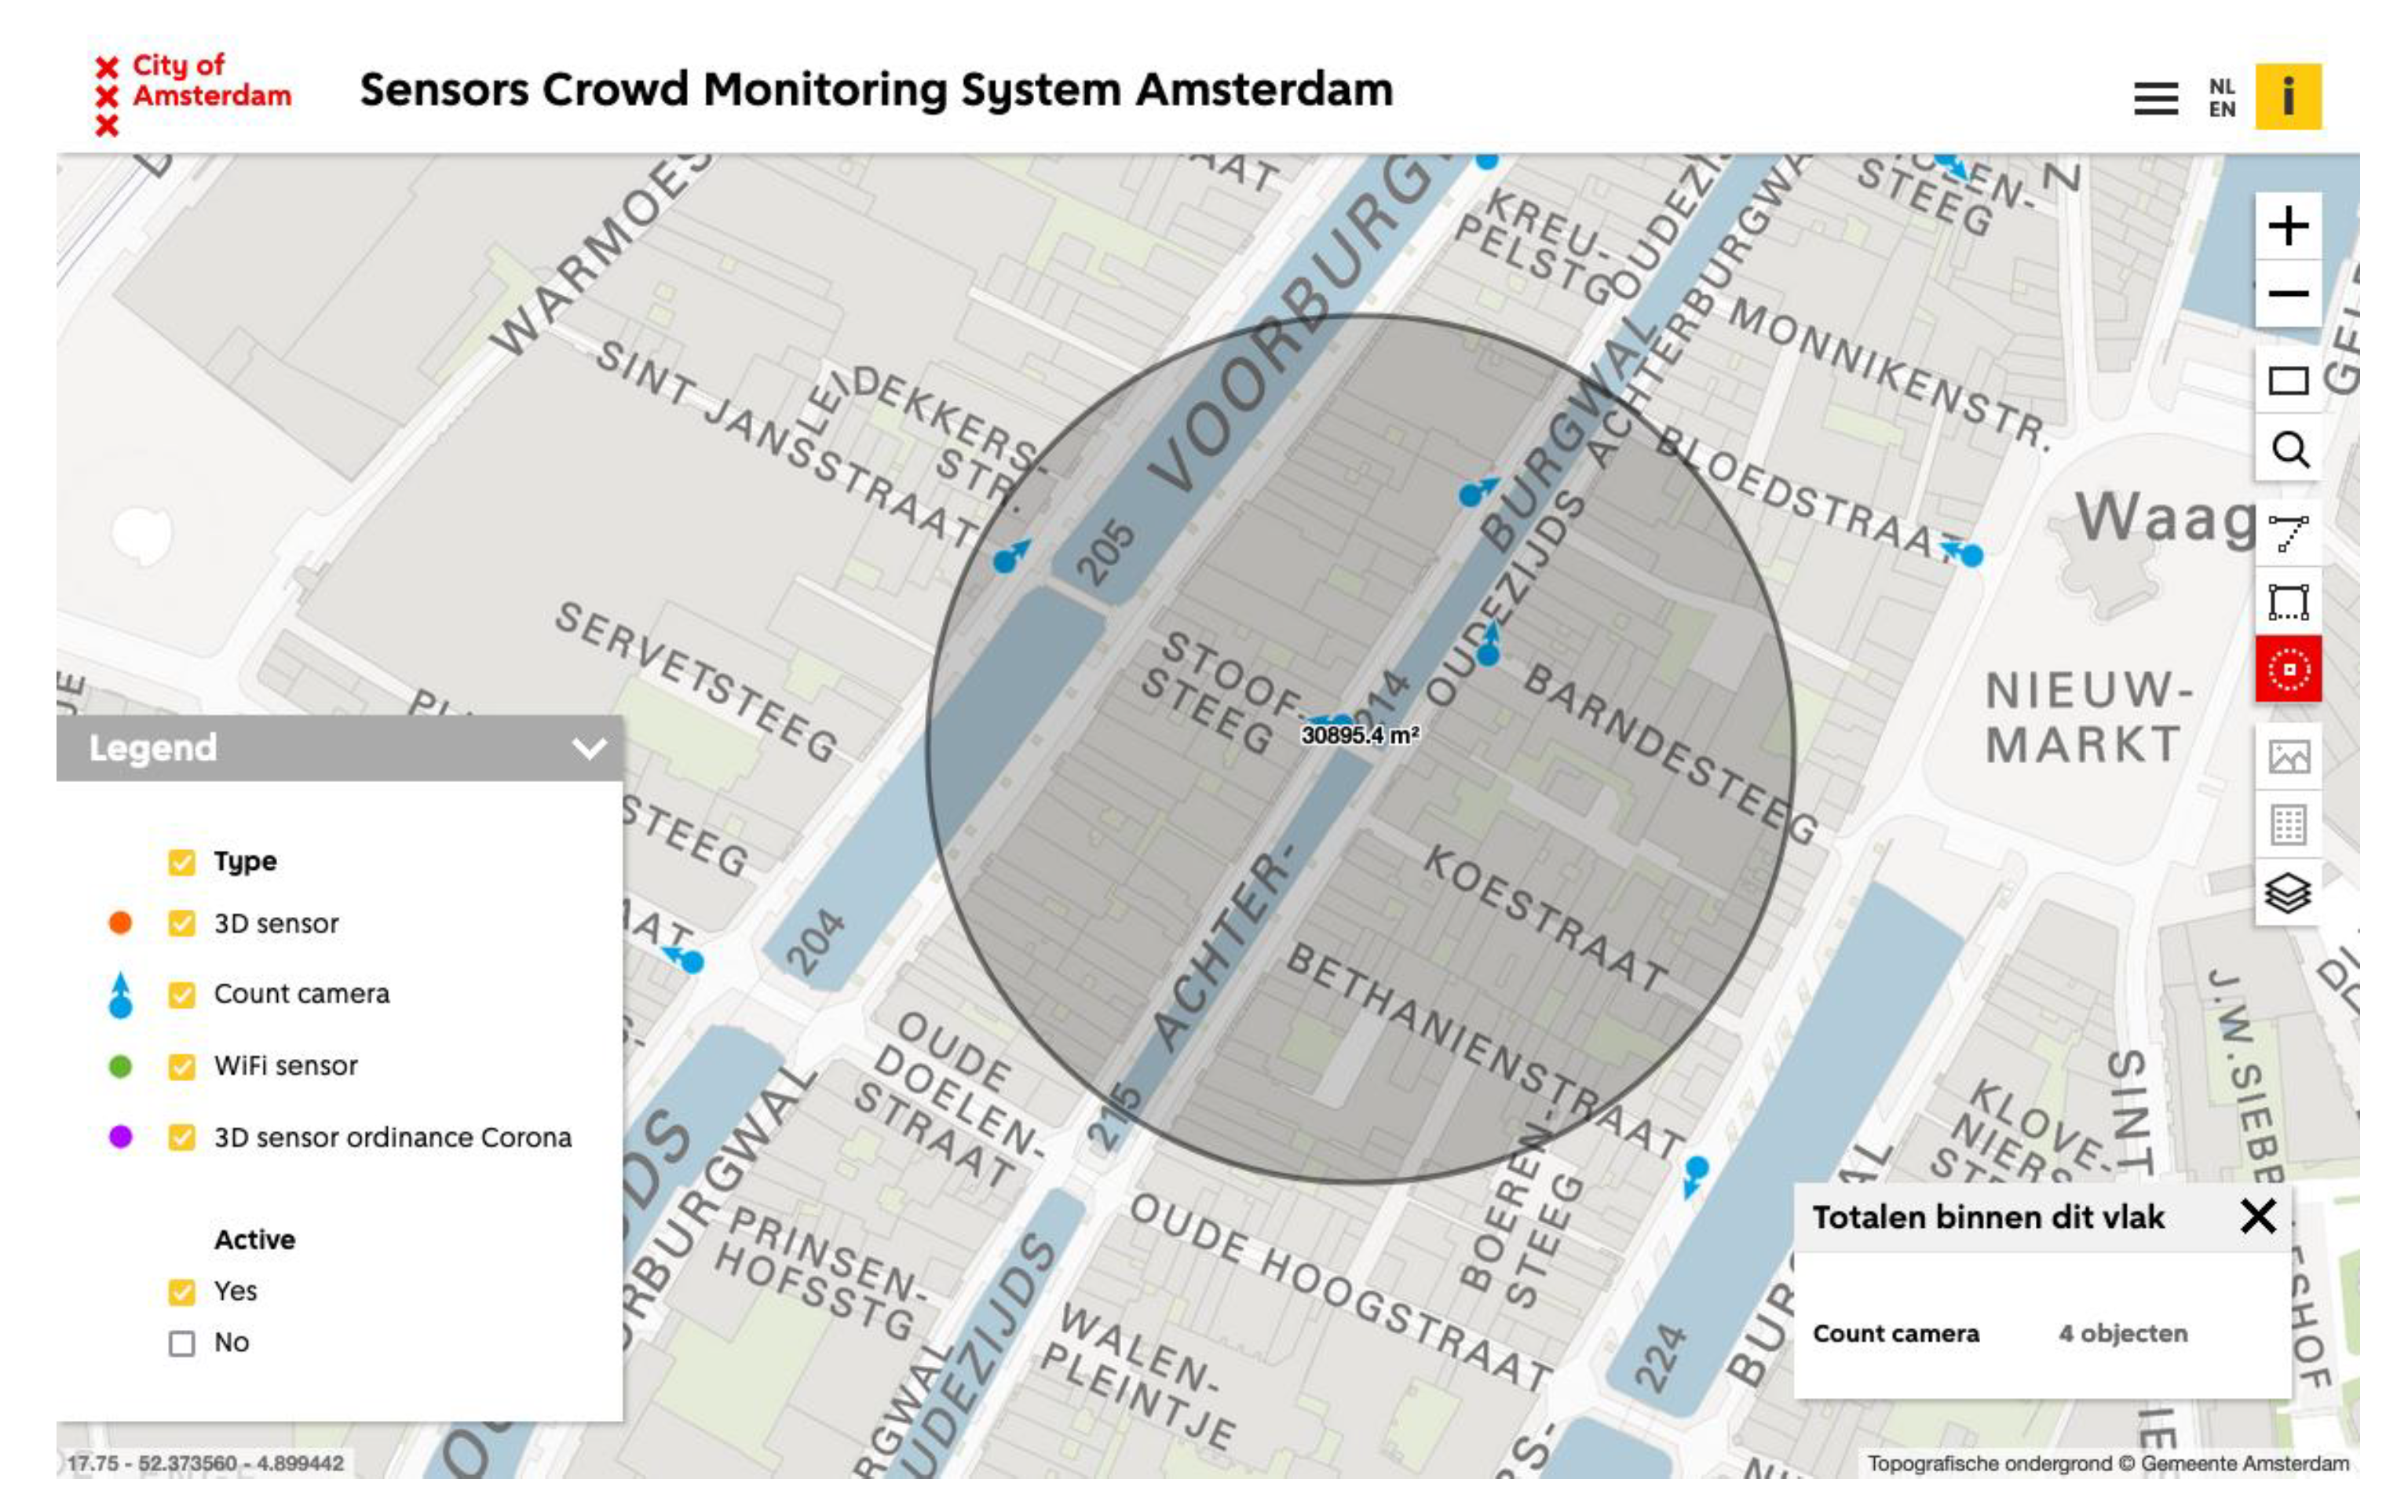
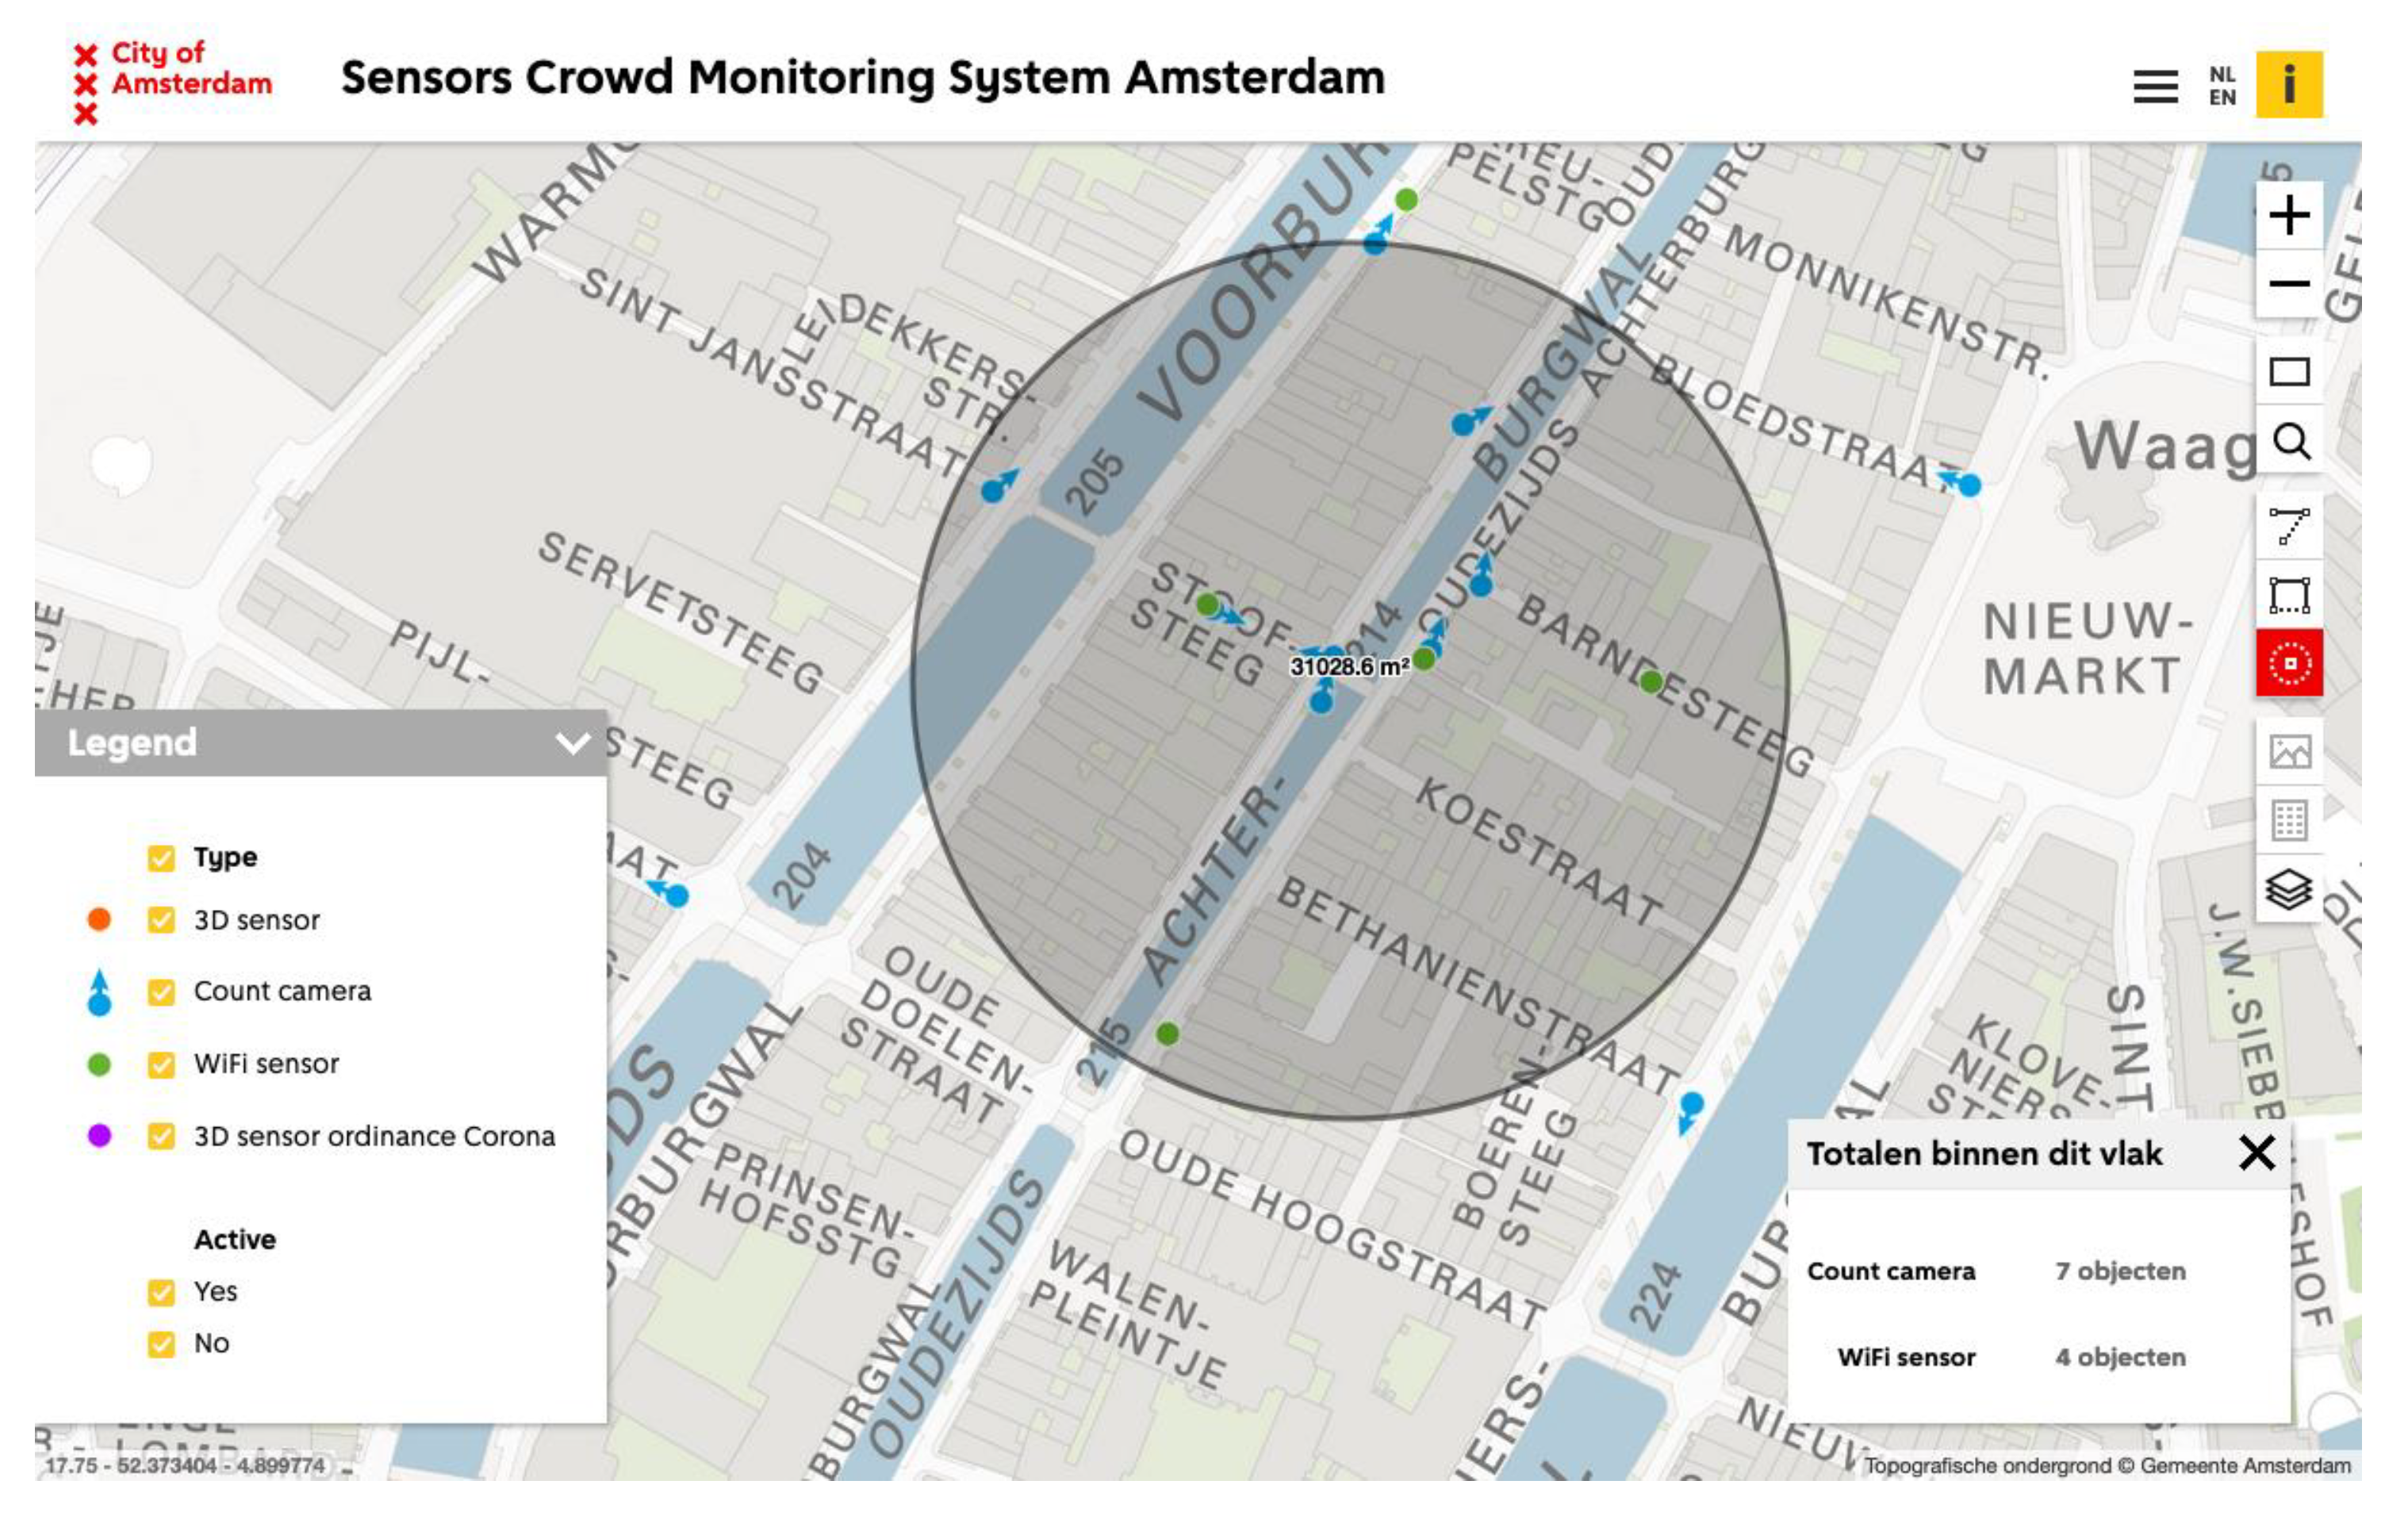
The NWO-funded research group, “BRIdging Data in the built Environment” (BRIDE), is a member of the Smarter Bridges Research Consortium and has long been interested in opening data from the bridge to the public. Some of the goals of BRIDE are to study what people do with the data, foster discussion on smart infrastructure, and ideally make the data a shared resource. The Red Light District, where the bridge is placed, is a hotbed for data collection. According to Amsterdam’s crowd monitoring map, as of summer 2022, there were four active crowd monitoring sensors within 100 m of the bridge and an additional three crowd monitoring sensors and four Wi-Fi trackers installed (but inactive) at the same distance from the bridge [
16]. These can be seen in
Figure 2 and
Figure 3. Currently, the public cannot access these data from the municipality, but the police may use these anonymous crowd data. These sensors should be taken as a low estimate because they do not include security cameras for businesses in the region.
Six months after the bridge was placed in Amsterdam, the project successfully applied for a grant to host a datathon to allow members of the public to access data from the bridge. The format of a datathon as opposed to a hackathon was to allow a “create-athon” option to not scare off non-technical participants and to emphasize that the event focused on data from the bridge. Traditionally, datathons are hackathons for data, but our event was divided into two categories, “hack” and “create,” each offering a €40 gift card per team member for the winning team and €20 for second place. The panel of judges included a software engineer who works in the Smarter Bridges Research Consortium, an official from Amsterdam municipality, and a professor of philosophy of technology—none of the judges organized the event or had prior connections with the participants.
The datathon was advertised on social media, through the University of Twente Design Lab, through the University of Twente event page, on Eventbrite, at a local non-profit community space, and at student group meetings. In total, 19 participants joined from backgrounds including computer science, design, and civil engineering, 16 of which ended up actively participating in the majority of the event. Ethics Review Board permission for interviews and data sharing was obtained from the Behavioral, Management, and Social Sciences (BMS) ethics committee at the University of Twente. All participants signed a consent form and organizers informed them that the event was also being held for research purposes. The group that joined was mainly young (under 30) with at least some university education. There were three doctoral researchers as well. This study may be seen as a step towards answering questions regarding how smart city open data impacts the public in the smart city but cannot be generalized due to its size and specificity. In order to make predictions about any given population there needs to be a representative sample; moreover, for a ±10% sampling error where P = 0.5 and the confidence rate is 95% for the Dutch population (approx. 17.5 million) we would need at least 100 participants [
17]. This estimate assumes that the attributes are normally distributed [
17]. Unfortunately, such a quantitatively rigorous study was outside the scope of the datathon.
3. Corporate Academic and Municipal Concerns
The first step in opening up data from the MX3D bridge to the public was to communicate with the Smarter Bridges Research Consortium. Although hosting an open data event seemed like a good test case for possibly opening up data for the future, it did not come without its concerns. One primary concern was that data from the bridge would be used for research that overlapped with that being done by group members. Given the current nature of academia, novel publications are often needed to justify and adhere to project funding. If a group at the hackathon was able to publish discoveries before the researchers, it would be considered a loss of investment.
Another concern was the possibility of people misinterpreting the data. Given the unique structure of the bridge, how the bridge was placed in the canal, and the possibility of sensors straying from the baseline, additional knowledge is necessary to have an accurate understanding of what sensor data means. The sensor data itself is “truthful” in that it does correctly share what the sensor registered and stored in the database. In actuality, there could be a power outage leading to a loss of data collection. The sensor could have “drifted,” meaning that the relative changes in values are accurate but shifted from the true values. A sensor could also just be broken. The bridge is also not directly placed on the load cells, some of the weight from the bridge is distributed directly into the ground. Therefore, adding the data from all four load cells at a given time will not give an accurate reading for the weight on the bridge and the weight of the bridge itself. As shared in a research paper from the project, it also takes engineering expertise to analyze the sensor output to determine bridge safety [
18].
The group also considered different options for sharing data at the event. Currently, an Autodesk API is used to share data from the bridge with the researchers. It was thought that participants at the datathon could use the API to access a separate instance of either the whole dataset or part of the dataset. The API route had been considered as a future option for researchers who want to join the project post embargo to access the full dataset. These researchers could register their research interests, name, and institution and sign a code of conduct to access the data from the bridge. This would have been a route for Autodesk to test their API and allow near real-time data access. Another option was to share .txt or .csv files from various sensors without granting access to the API. Sharing files as opposed to the API would reduce the likelihood of a collaborator hacking or breaking the database. It also would mean that the API would not have to be redesigned. For these reasons, the latter option was preferred.
When the group first considered opening data from the bridge, there was also a concern about whether the data would be fully open or only disclosed to event participants for a limited duration. The following question emerged: who can make the decision to share the data and what would be the license? Can individuals do whatever they wish with the data? Is the data then theirs to profit from? Who will act as overseer of the data if someone releases it into the wild on GitHub? It seemed that private data licensing would be difficult to control. The group decided that a public solution would be best and that the only entity that could legally make the decision would be the city of Amsterdam. That said, foreseeing the possibility that the route might not yield favorable results, the group considered using data from when the bridge was at the University of Twente or trying to use a non-disclosure agreement and have the event be part of an internal research project. Both of these latter options were not preferred.
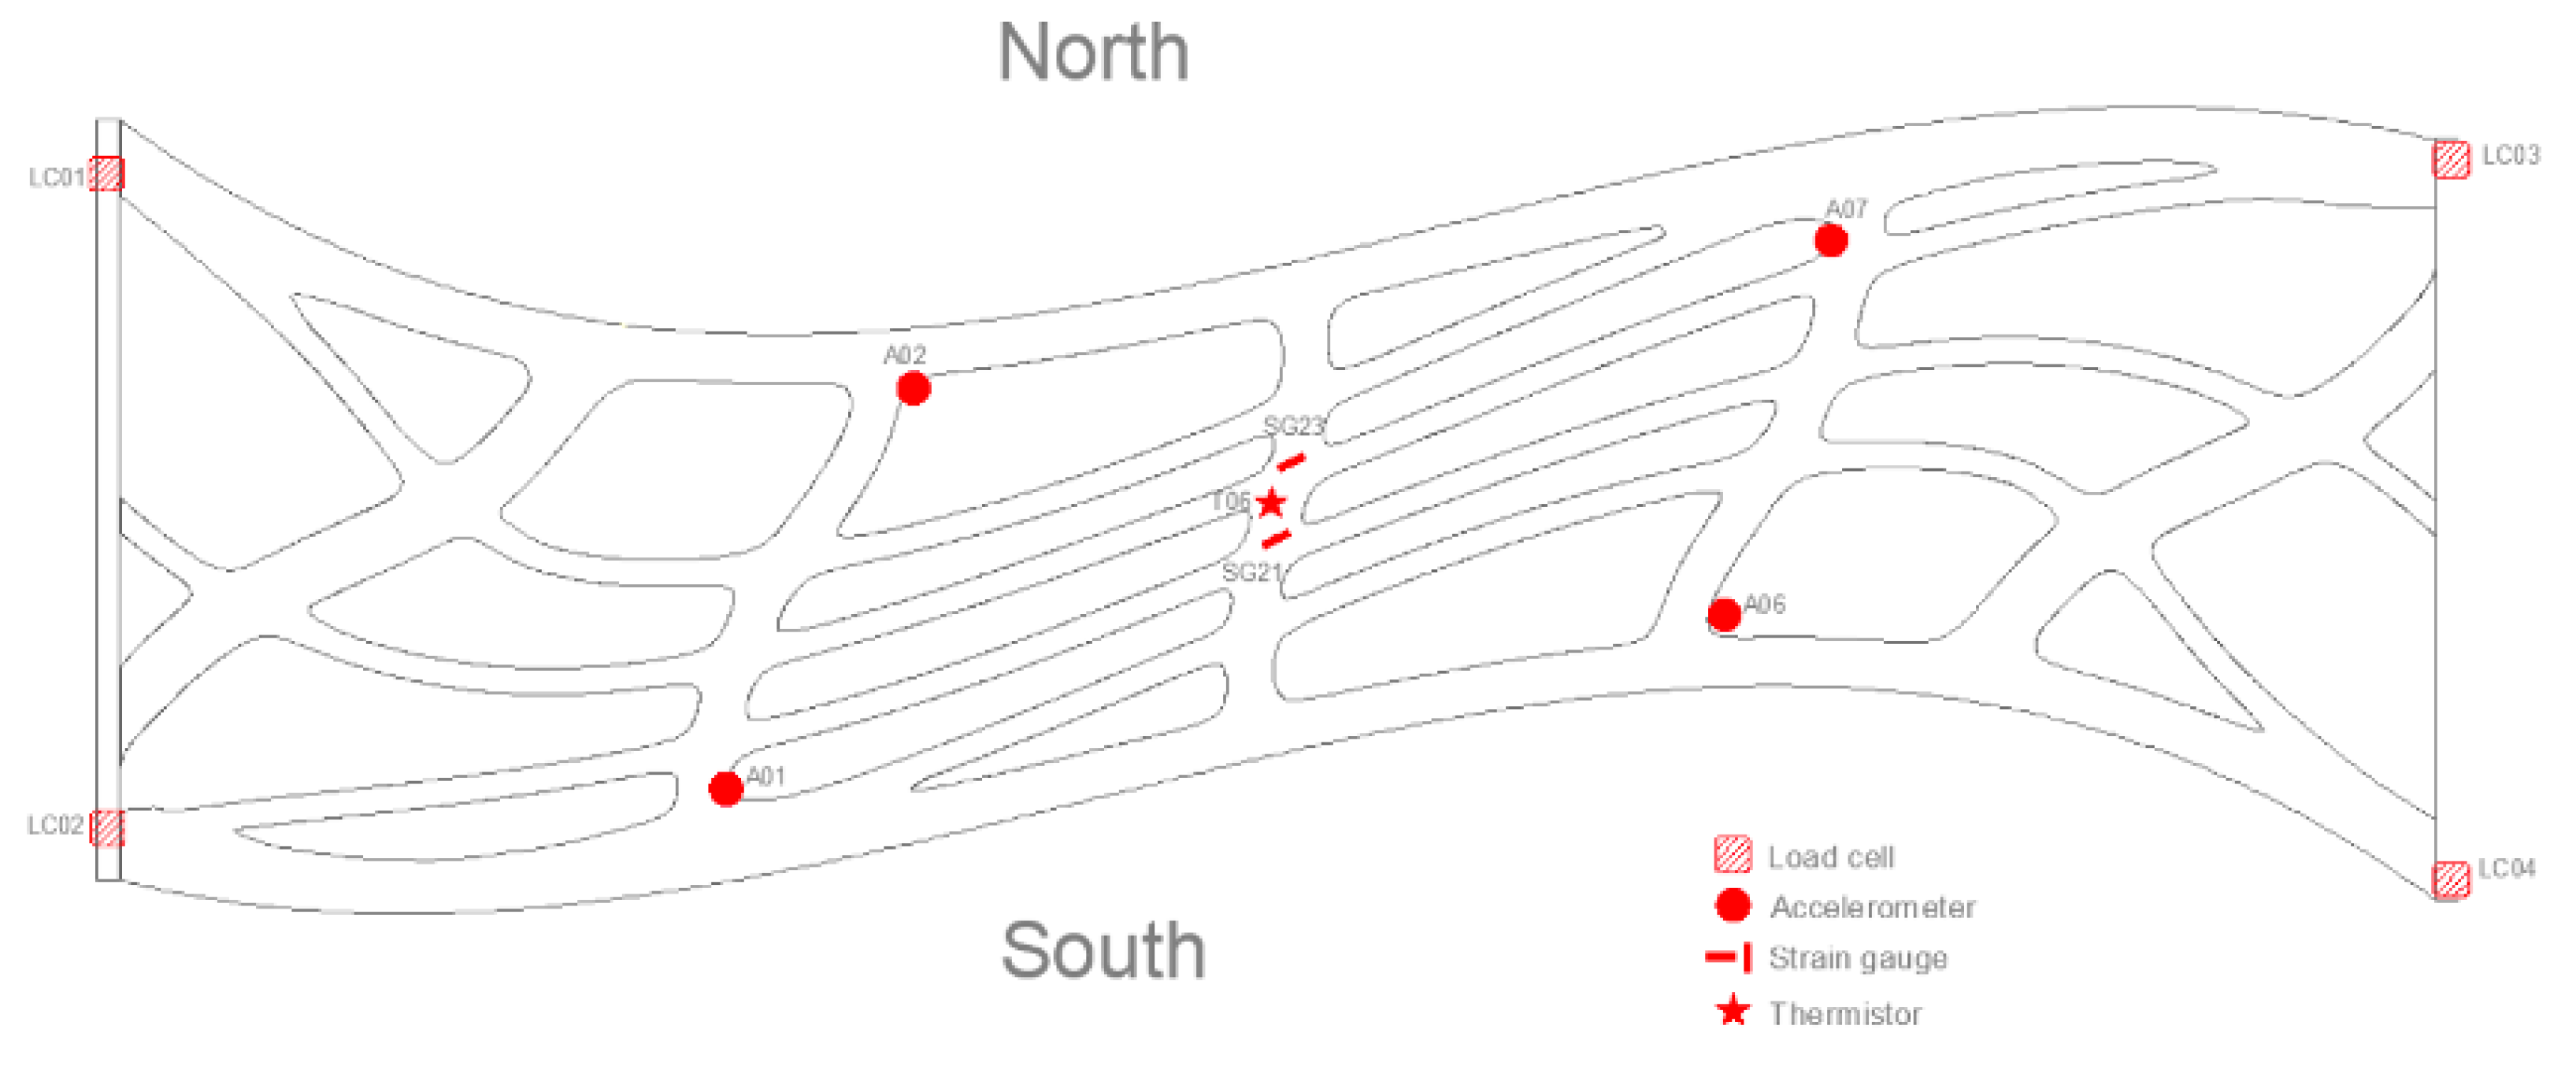
It was eventually decided to preselect datasets that would reduce risk from all the listed concerns. Data would be shared from a select group of more functional sensors. This dataset would be from a time when no extreme values were recorded that could be severely misinterpreted and all the load cells were functioning properly. In a joint decision-making process, three datasets were chosen using eleven sensors: one hour of data at ten readings per second, twelve hours of data with a min, max, and mean reading each second, and two weeks of data with the min, max and mean reading per fifteen minutes. All units were changed to be in their most intelligible form, which meant transferring some units from voltage to what they actually measured using the conversion method for each sensor type. The sensors were also labeled on a two-dimensional image of the bridge so that participants could connect the file name to the sensor type, units, and location on the bridge.
Table 1 and
Figure 4 show what was finally agreed to be shared with participants.
The next step was to communicate with the municipality of Amsterdam. At the time of organizing the event, Amsterdam’s privacy office was understaffed in comparison to the load of requests being made. Once contact was made, the author shared information with a privacy officer which was then forwarded to other agents in the municipality. First, they wanted to know what data exactly was going to be made available, where the data were stored, and how the data would be accessed. This is part of the city’s initiative for “controlled transparency”. This initiative requires the city to be aware of all the data that it opens to the public. For the event itself, the data were stored on the author’s University of Twente Microsoft One Drive. Each participant got access to download the dataset through an email invitation. When asked if it would be easier to only open up the dataset for the event, the officer responded that data for some members of the public means that data should be made available for all.
Another issue that arose during discussions with one of the municipality’s privacy officers is that the city also follows an assortment of regulations in addition to GDPR. At the time there was “Wet openbaarheid van bestuur” (WOB) which translates to “government (public access) to information act,” which as of May 2022 was replaced by “Wet open overheid” (WOO) that translates to “the open government act.” WOO promises more active disclosure of information than its predecessor but similarly has grounds for the privacy of information. For example, if the costs of sharing outweigh the benefits to the environment, then the data can remain closed [
19]. Additionally, there is “Wet hergebruik overheidsinformatie” (WHO), the government information reuse act and “Wet maatschappelijke ondersteuning” (WMO), the market and government act. It was not enough that the dataset shared for the datathon would be anonymous. The officer explained that anonymous data can expose confidential data and pose security risks. For example, purportedly anonymous traffic light data might show a string of green lights. These light patterns are indicative of sensitive affairs such as large amounts of money being transported to banks or the Dutch Royal Family commuting.
The Dutch government created a document that outlines the various guidelines to help with opening up government data to the public [
20]. The first guideline is that data should be proactively made open as long as it does not pose risks to privacy or other fundamental values. The second is that open data should be free of cost to reuse. The third is that the data be released under a CC-0 license, free of third-party rights. The fourth is that data can be accessed without registration. The fifth is that data are released in a standard format that is computer processable. The sixth is that metadata are included according to the DCAT-AP standard (see
Appendix A). The seventh is that the data are made as complete and as raw as possible—additional processing can only occur to comply with the disclosure framework provided that it does not violate competition law. Lastly, open data should be registered on data.overheid.nl so that it can be more easily found.
The Open Data guidelines conflict with several of the initial ideas for open data posited by the research consortium. For the datathon, the research consortium decided on a dataset that was not in its most raw state. Output was transferred into the correct units and the collection frequency decreased for longer spans of time to protect the consortium’s research advantage and to decrease the file sizes. Furthermore, a smaller subset of sensors was chosen. The full dataset of 10 Hz data from nearly a hundred sensors for several months would be a lot of information to store and possibly hold unforeseen information. Since the Netherlands is encouraging open data as a way to promote innovation, it makes sense for the license to be open for individuals to do what they want with the data and also profit from using it. For a corporation or institute that wants to publish their findings first, making data free from third-party rights takes away their advantage of being the data controllers. Another possible point of contention is that data can be accessed without registration. The Smarter Bridges Research Committee wanted to act like an ethics watchdog over the data, which is not possible without registration. It can be argued that people should have the right to use open data at their own discretion in private.
After a halting month of discussion, mainly due to competition with the many tasks Amsterdam’s privacy office oversees, Amsterdam’s Chief Technology Officer gave permission via email to release the chosen dataset to the public. In principle, the datathon dataset will be shared with the public beyond individual access via a link on the author’s Microsoft One Drive account. However, the process of how and where to share these data is not explicit—data.overheid.nl is one obvious choice, but there is also data.amsterdam.nl. The privacy officer reached out to others in the municipality asking for assistance with these questions, but the public dataset remains in limbo. One relatively innocuous project justifiably is not the highest priority for the city.
Since the city commissioned the bridge and is the technical owner of the data, it would appear from the Open Data Act that the government maintains the responsibility of navigating the post-embargo data opening. Yet, it seems that the municipality does not have the bandwidth to manage all the smart city projects, especially when there is no one-size-fits-all option. The smart city is filled with private and public partnerships where data management and storage are handled by third parties. Denoting responsibility is already challenging to navigate for those building smart infrastructures. A lack of open data is not always due to a lack of interest, but a lack of clarity when in many instances there is not one individual tasked with carrying out the duty and navigating the risks.
4. The Datathon
The goal of the datathon was to observe and analyze what happens when people are given access to open data from the bridge without prompts. In order to attract a variety of experience levels, the event was divided into “Hack” and “Create” as shared in the Project Parameters section. In order to make the data as accessible for the average person as possible, a student assistant was tasked with making a Jupyter Notebook that would help people upload and graph the data. The author also provided MATLAB code to plot data from the bridge. Each participant got access to a folder with all the datasets and a README that explained what sensors were provided, their locations, and a link to a tool to make the high-frequency data play as though it was alive.
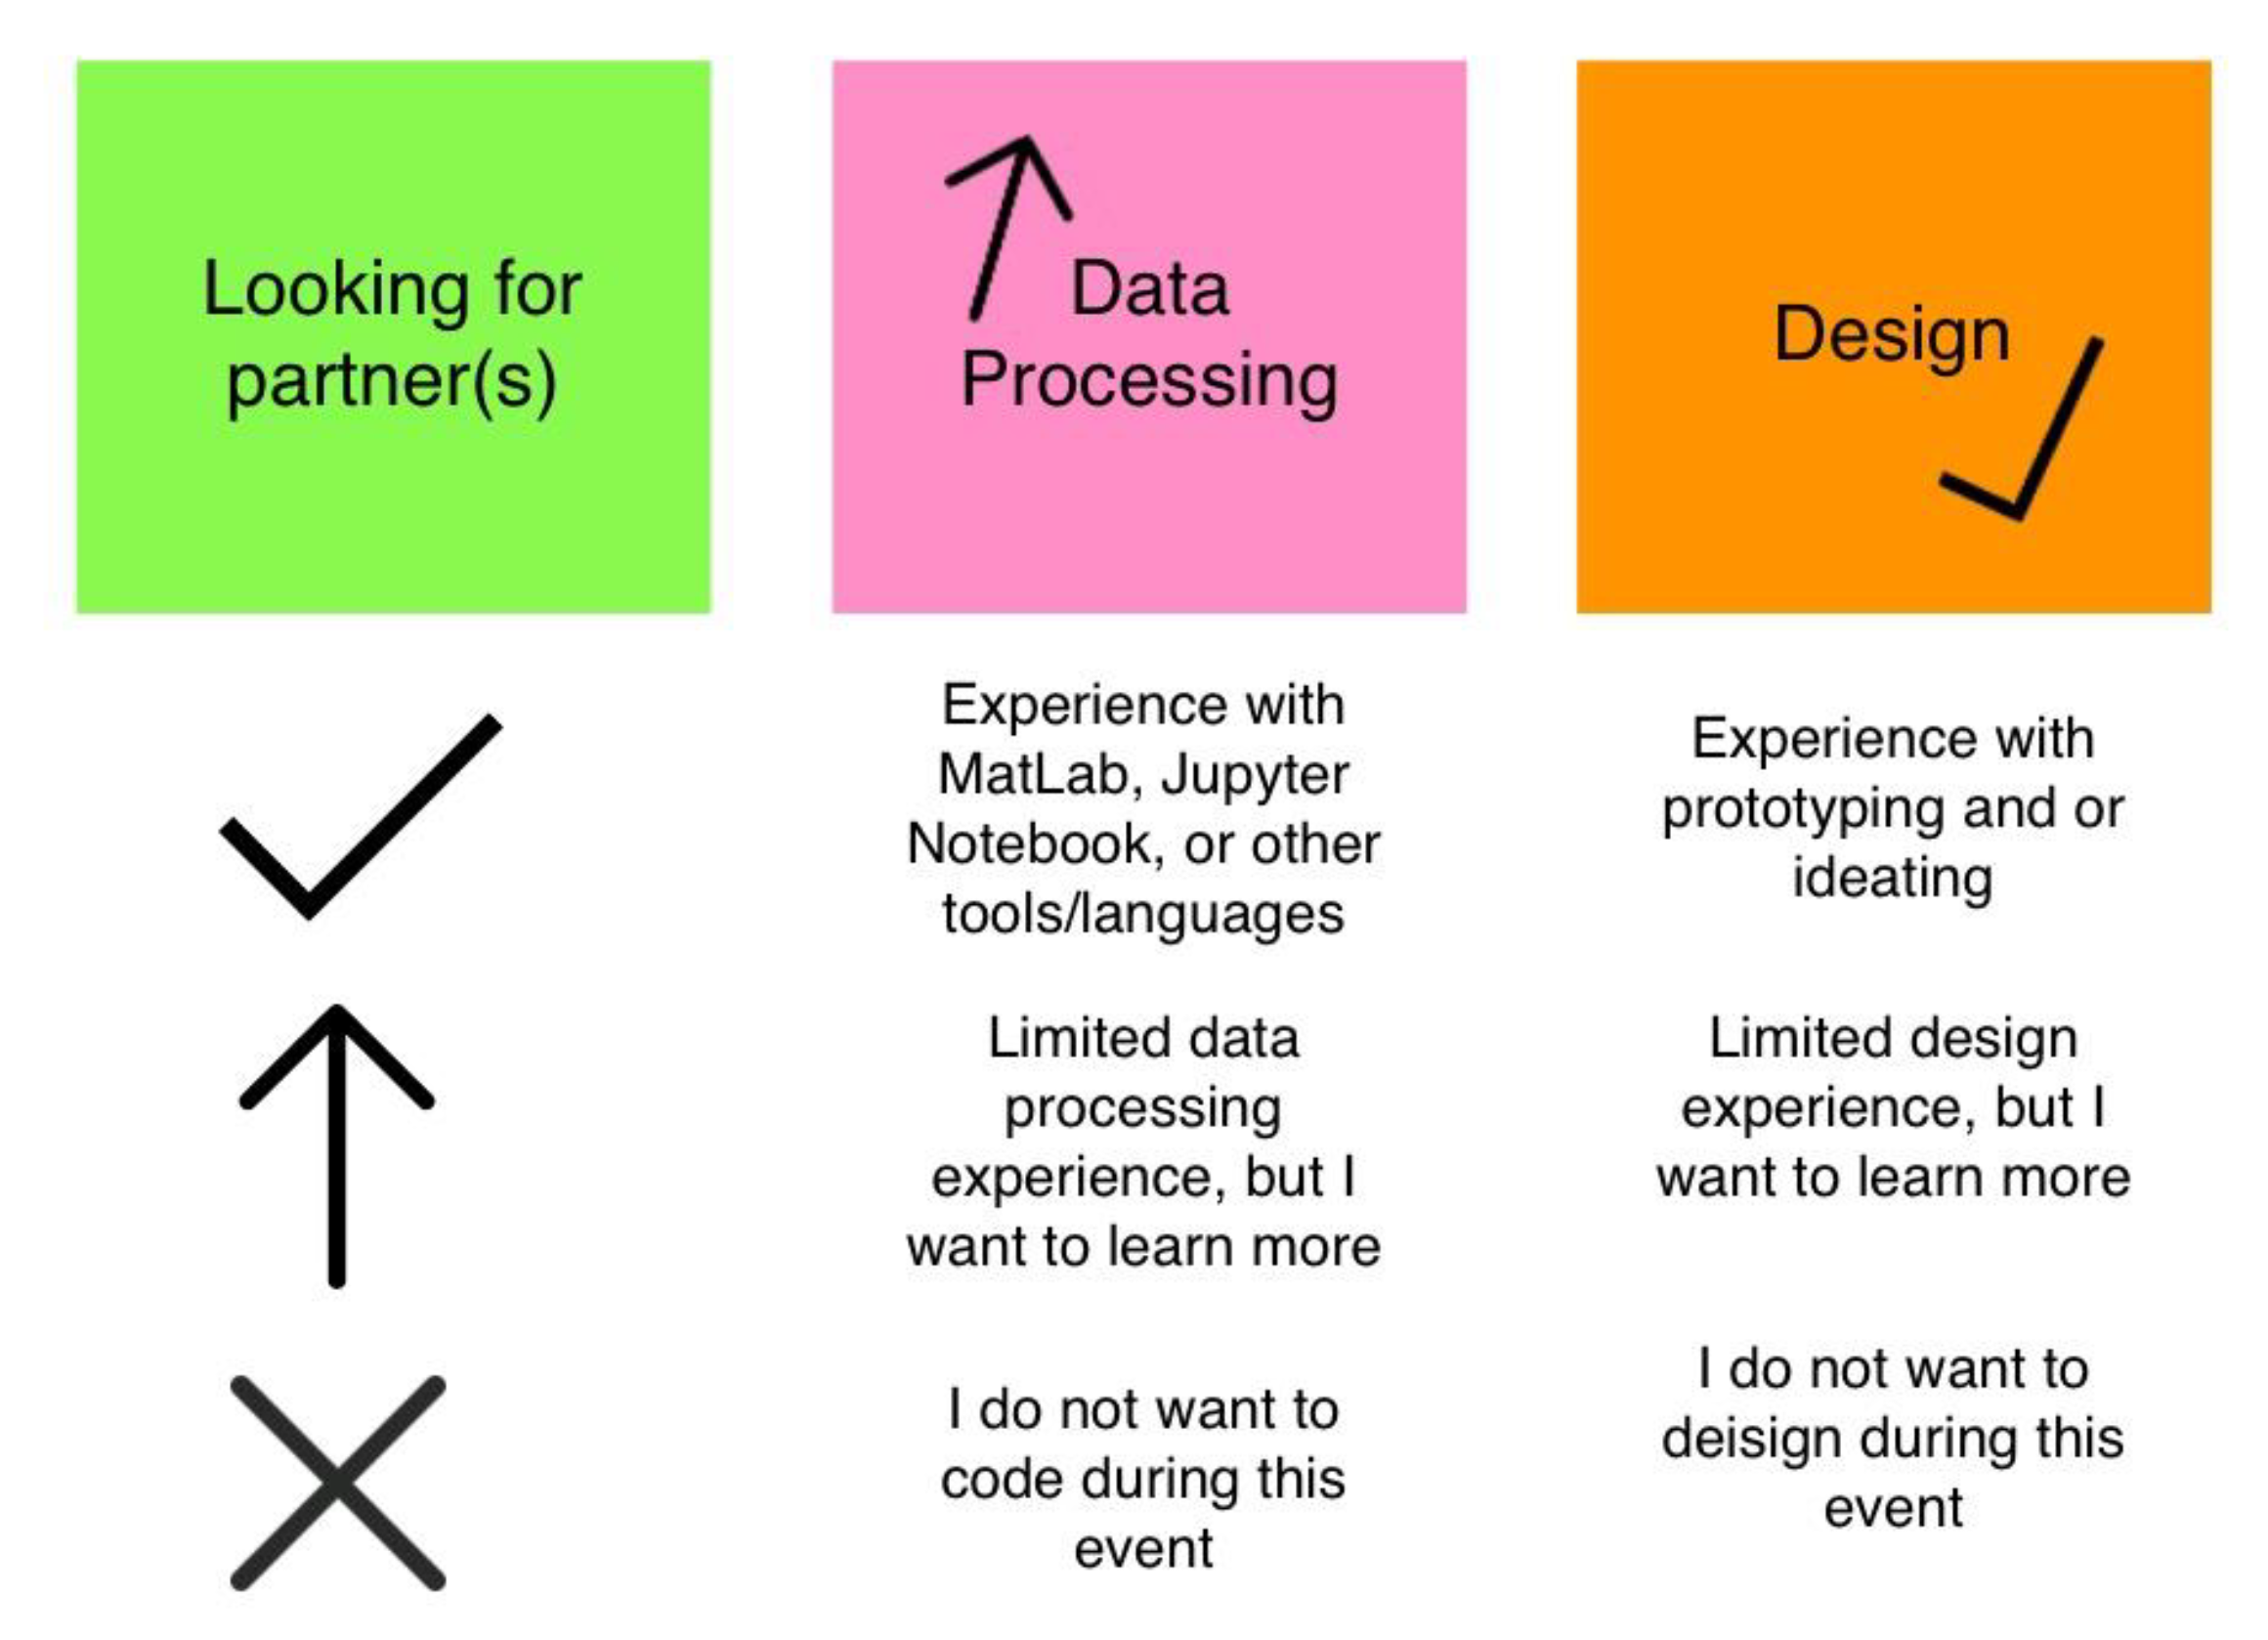
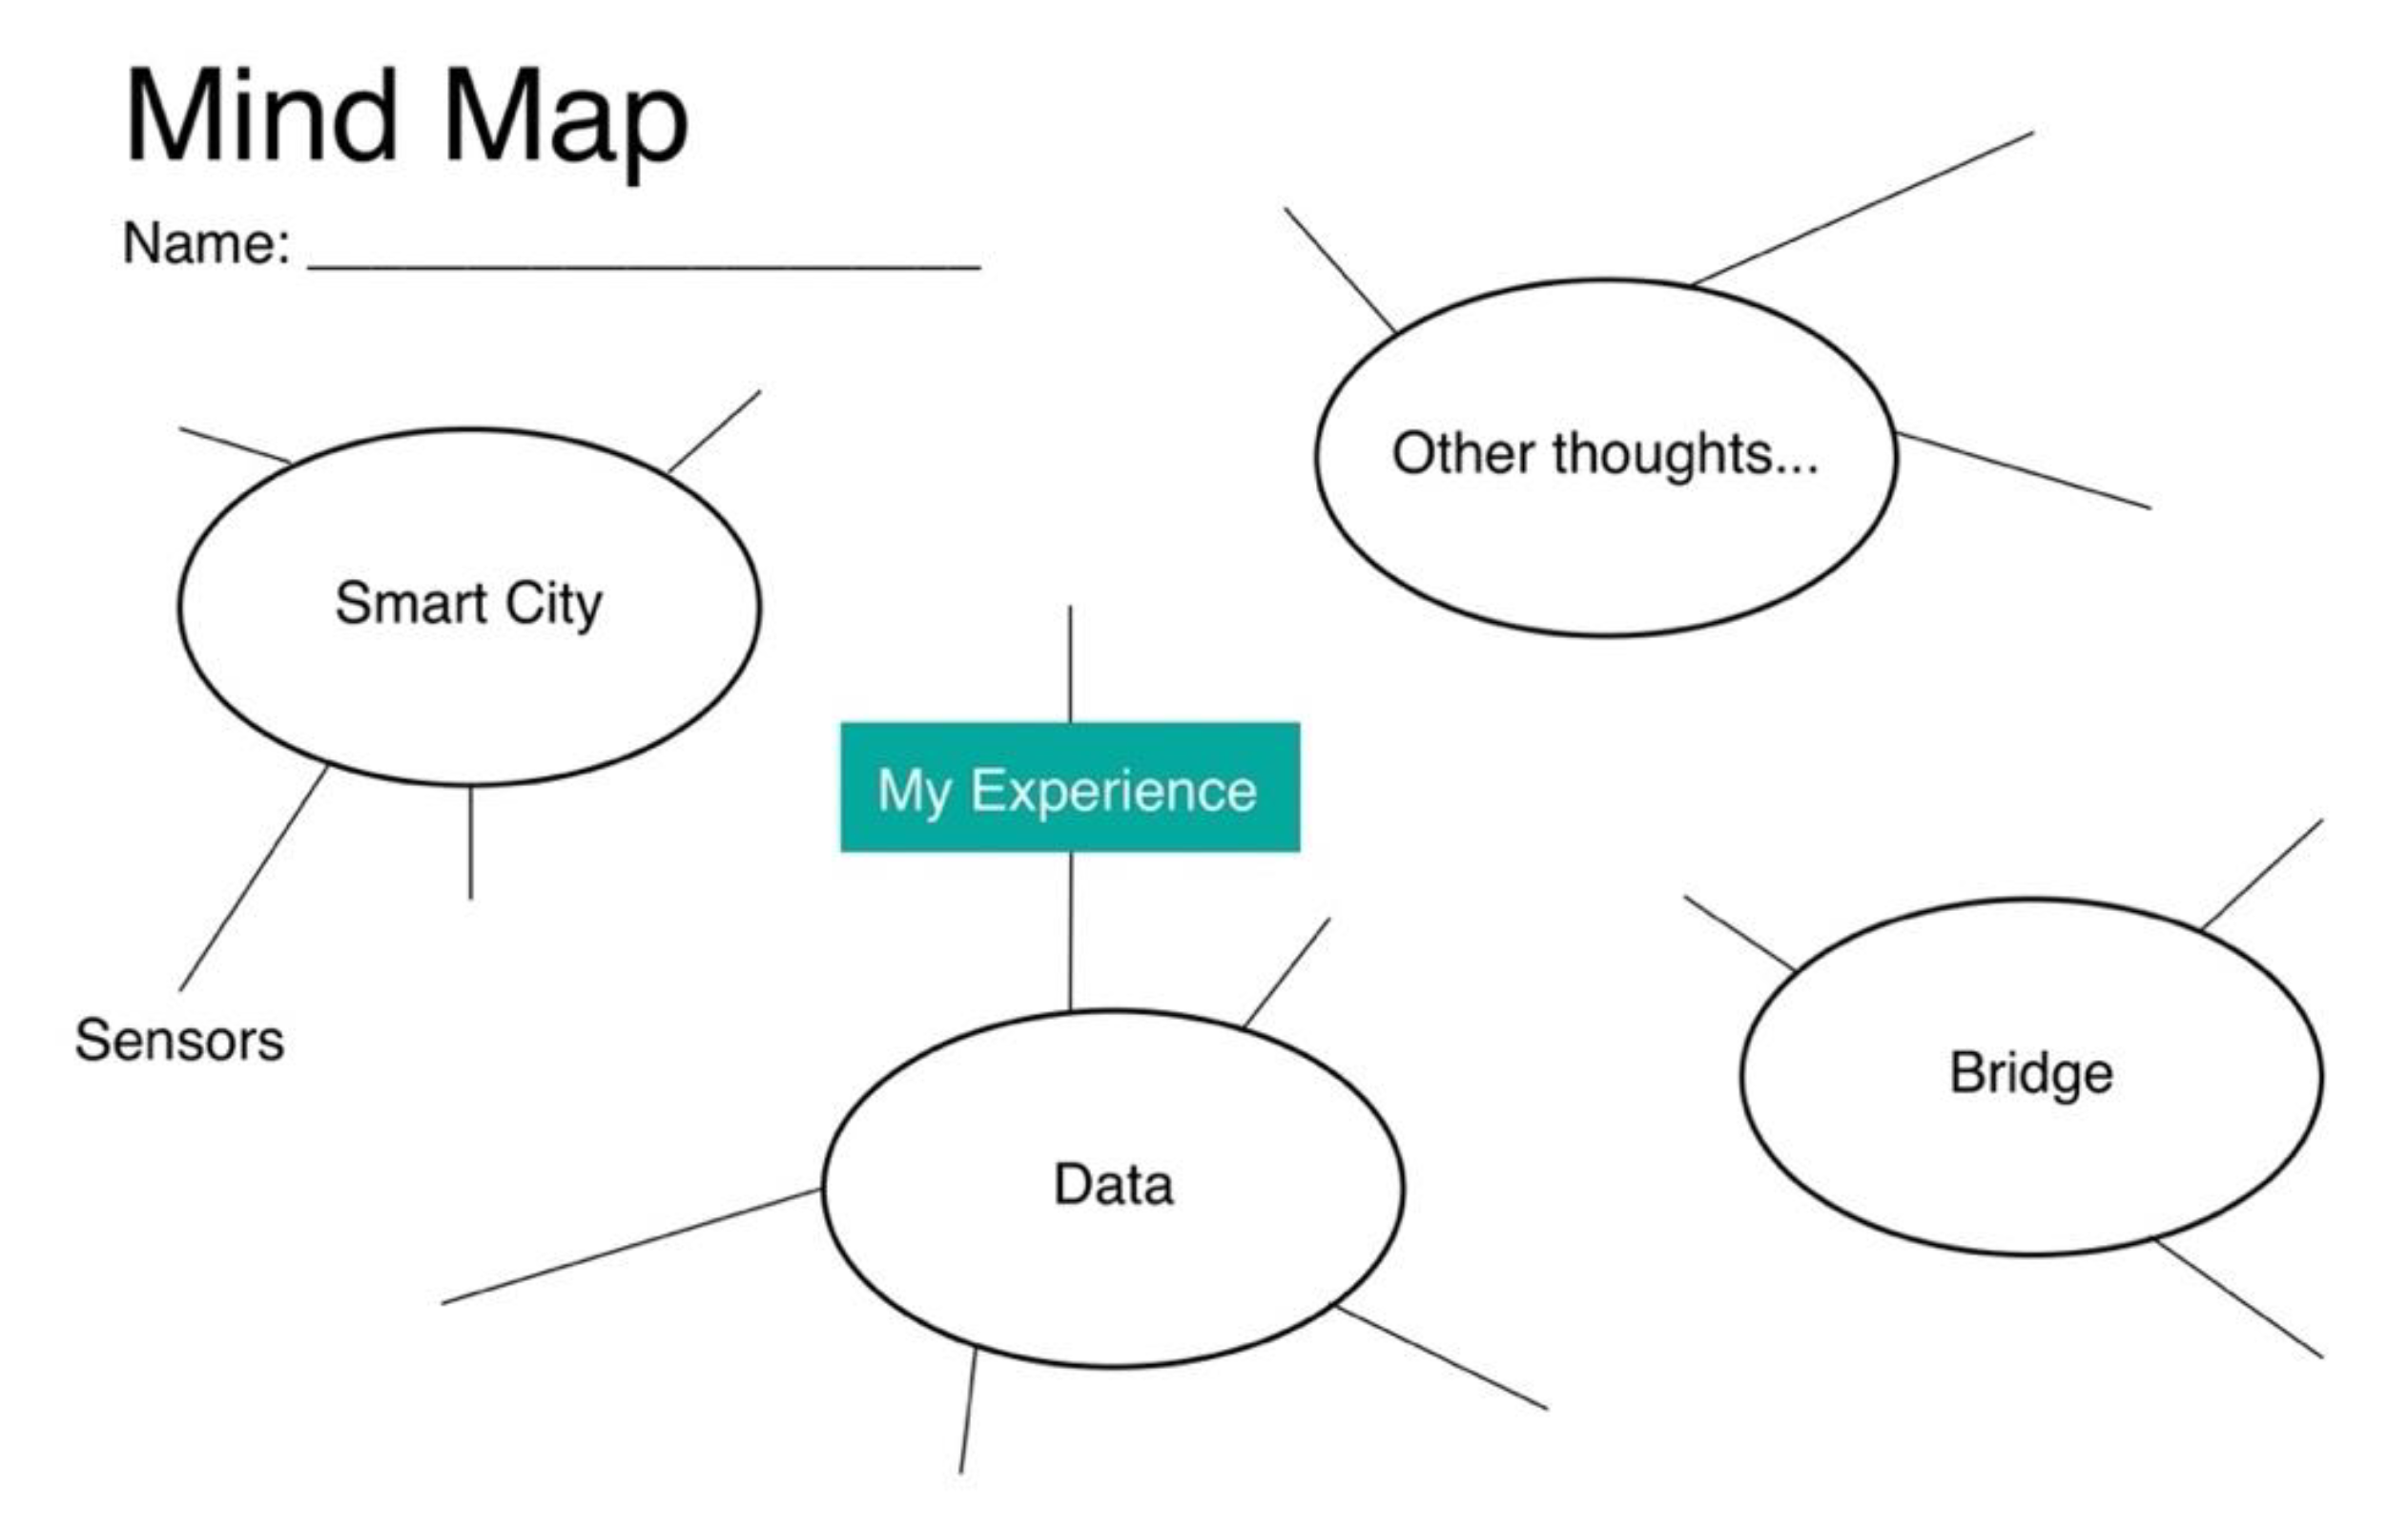
After registration, participants were given post-it notes to matchmake and form teams (
Figure 5) and a mind map to help themselves brainstorm (
Figure 6). Green indicated that they were looking for partners. Pink was for coding experience and orange was for design experience. Participants could put a ‘checkmark’ if they were experienced, an ‘up arrow’ if they had limited experience and want to learn more, or an ‘X’ if they had no experience and had no interest in doing any work in that domain. Next, they were introduced to the bridge, the dataset, and the judging criteria (
Table 2). Three groups came in with already formed teams (one of which joined virtually). One group quickly formed of two people who already knew each other and someone sitting at the same table as them. This left the last group to coalesce due to circumstances. The groups were able to design and present their projects for 6.5 h between 10:30 and 17:00.
Each group connected with the data differently based on their expertise. The first group of mainly computer science students and graduates had no trouble technically working with the data and programming with it. They did not bother reading the README file and independently found the GitHub code linked in the README that feeds high-frequency data as if it is alive. They also did not use any of the other tools provided such as the Jupyter Notebook and MATLAB code. As a fun challenge, they tried to think of something as unethical as possible, such as a drunk detection algorithm called “Stumble”—wordplay off of a dating app called “Bumble.” Their final project ended up being a tool that would take live data and create music based on the bridge traffic. They were the only team that was able to demo a sample of their final product. Although they had a limited understanding of civil engineering, they were able to build something interesting within the span of a few hours without necessarily knowing how each sensor worked or the bridge mechanics. This group demonstrated that open data might be used in creative ways by hackers for personal projects and that those with coding experience are adept at creating programs with data they might not fully understand.
The second group possessed the most varied mix of backgrounds, reflecting the circumstances of how they came together—more informally than formally. They thought that it was “cool” that these data were shared for the event and that it was fine to share the bridge data with the public because the data were anonymous, but to some, the data still felt very abstract and hard to connect with and understand. Another person shared that they did not feel like they had a right to the data necessarily. The group decided to use the data from the bridge to create a light beam display of fireflies that would “die” when the bridge is too crowded. This would help discourage crowdedness in the area and subtly inform people that the bridge collects data. This group was unsure how the fireflies would be made, which datasets would be used, or how the system would work. The more technically able in their group did attempt to make a prototype using data from the bridge, but ran into issues during the short time frame. While the first group was able to use the data right away without any of the tools provided, for some members of the second group the additional resources were insufficient to connect with the dataset, at least within the timeframe of the datathon.
The third group was completely design focused and decided to not use or examine the bridge data besides a brief peak at some of the files. They shared data and as the data are anonymous, they thought that it was fine to share the data from the bridge and that it was “good” to be transparent. They pointed out that maybe when one individual was on the bridge, they could be tracked. Originally, they thought of creating a meditation system on the bridge that would change based on load so that people could meditate together. The handrails could vibrate to cue breaths. By the end, they changed to a fountain system that would spray water based on interactions with the bridge. This would bring people to the present moment and take them away from their distracting phones. They suggested that this system could be monetized and sold, likely influenced by their interpretation of “generating value” from the judging criteria. This team demonstrated that open data, even when not used, may inspire ideation on possible use cases. Theoretically, if live data from the bridge was available to the public, the second and third groups could apply for a grant and acquire permission from the municipality to create their designs with the assistance of hired engineers.
Group Four had an engineering student who had worked with the bridge before. This person found the dataset frustrating because it offered less information than had been previously accessible to them. It was more challenging to find out where someone was on the bridge, especially for the longer, lower-frequency datasets. They could also not do what they originally planned because the dataset only included two strain gauges in the middle of the bridge as opposed to more physically distanced strain gauges. This group envisioned using screens to visualize the bridge data that could help local businesses predict when they might have more customers. They also thought if everyone has access to the data, then people could work together to point out if there is a flaw in the bridge or in the data itself. This team confirmed that limiting open datasets may restrain innovation from the users of the data. Restraining innovation might be helpful if revealing the location of someone during an individual bridge crossing is deemed harmful. Group Four was also the first group to recognize that the data might not be accurate and that the public might also be able to help analyze the data to recognize if the bridge needs maintenance work. These insights were sparked by the student who had previously worked on the bridge.
The fifth group consisted of two engineering researchers who joined online and thought that working with the data was “challenging and inspiring.” One of them thought that the data were an asset generated by the public, so there was no reason to not share the data. As engineers, they found the format of the data convenient but thought that it might be more challenging for the public to understand, giving the example of how the strain gauge orientations could be confusing. The other team member believed (1) people should be able to access raw data, (2) experts need to explain what they are doing, and (3) lots of interpretation should be given. They believed that “information is power” and pointed out that there is a freedom of information act (See
Appendix A). This person thought data access was a complicated and not a simple “yes” or “no” question.
Group Five’s final concept was to allow engineers to access geotagged social media data and use it to better understand sensor output on the bridge instead of more invasive techniques like cameras or time-consuming work such as standing and taking notes on site. They believed this would be ethical because people publicly share to social media, making it open data by choice, unlike being filmed or watched while crossing a bridge. Location-based social networks have already been recognized as useful in urban studies research despite their drawbacks of being unrepresentative of the total population [
21]. Beyond research integrity, considering all public data as open data and all open data as free to use and profit from may have serious social consequences that are beyond the scope of this article. Most people do not post to social media expecting it to be used in a larger context. At the same time, not all personal data are confidential. Open data broadly might force refinement of what types of personal information can and cannot be repurposed. This group demonstrated that there is some likelihood that open data from the MX3D bridge would be used in combination with other datasets.
There were a few people who joined the datathon partially and never submitted a final project. One of these people had visited the bridge in the fall of 2021, knowing that the bridge was smart and walked back and forth on it, but thought others were unaware that the bridge was collecting data. Another person thought that sharing the data from the bridge is fine in its current location. However, they expressed concern that if the bridge were located in a rural area where it was mainly used by only a few households, the bridge and its data collection would pose a threat to privacy. They explained that there could be a situation where someone leaves the house at 3:00 in the early morning and comes back later in the morning after an affair. Data from the bridge could be used against them in a legal proceeding, such as a divorce court. These two semi-participants saw the value in data collection because many bridge repairs in Amsterdam are currently instigated by individuals reporting or recording damage as opposed to preemptive sensors.
The last solo participant who joined late and also did not present was concerned about military, government, and corporations gaining access to the data—noting that open data also means open internationally. They shared that entities have more power than individuals. If data collection becomes more universal and open data practices are in place for all datasets, then powerful institutions have the resources to deanonymize data and also create new sources of knowledge from generalizing and combining data. This concern involving open data allowing for deanonymization is called “the mosaic effect.”
Mosaic theory refers to when data viewed independently would have no expectation of privacy, but in summation breaks societal expectations of discretion. Consider the 2012 United States Supreme Court case, United States v. Jones. In that case, the court reinterpreted the Fourth Amendment right to privacy, using mosaic theory. In that case, police officers violated their warrant requirements when installing a GPS tracker on Jones’s automobile, which would collect data on where Jones traveled. The case centered on a principle in privacy law—that individuals have a diminished privacy right in public spaces. However, Jones argued that the lack of expectation of privacy in public does not extend to continued surveillance, which may reveal personal information. The court rejected the government’s argument that there was no reasonable expectation of privacy in the continuous GPS tracking. The Jones case can be extrapolated and applied in other instances. For example, imagine a tracker revealing that a woman went to the gynecologist and later to a baby store [
22].
As a data scientist, graphing and manipulating the data was easy for the final participant. They weighed the costs and benefits of open data. Opening the data could be good for accountability and innovation. On the other hand, for transparency, they believed that it was important to share (1) who is accessing and (2) what they are doing with it—keeping track of these two standards would be challenging with open data. Finally, they believed that there should be privacy between individuals and their government. As cities increase in “intelligence” it will become more essential to design for privacy and define the individual right to privacy in public spaces. As there is nothing inherently private about being in public, the permanence of sensor collection in public space constitutes a new urgency for anonymization and deletion of data. The push for open data only makes these regulations more needed.
The observations from the event are further condensed and summarized in
Table 3 for quick referencing.
5. Discussion
Theoretically, the datathon provided the opportunity for up to 60 people ages sixteen and older to use data from the MX3D bridge, communicate with the chair of the Smarter Bridges Research Committee, and present their findings to a group with power relative to the project: an Amsterdam municipality officer, an engineer that builds a digital twin platform for the MX3D bridge and other infrastructures, and a professor of philosophy of technology. In practice, sixteen people actively participated in the majority of the event with an additional three hanging out or briefly manipulating the data. Although people could join online, the instructions were all in English and we would not be able to provide extensive virtual tech support. Five ideas emerged from the event: a sound system that creates music from bridge traffic, a firefly net that dies with crowdedness, an interactive fountain system, a commercialized crowd management system, and using geotagged crowdsourcing for ground truth data. As of now, there is no continuous, live, open dataset that would make most of the projects possible. Additionally, beyond gift cards for the project winners, no funding was made available to make the projects a reality.
Most datathon participants communicated that they enjoyed the event and were glad to participate. Of course, the event was self-selective—people independently signed up through advertising or were brought in by a friend. Software engineers could code using the data. Civil engineers were able to graph the data and determine how sensor behavior reflected the mechanics of the bridge. Designers were able to think creatively and share an artistic presentation, communicating the need and benefit of their design. Even as non-institutions, individuals brought their strengths to their interactions with the dataset. Those with greater expertise also had more concerns about open data sharing than those with less of a background in civil engineering or data science. These more “expert” views reflected some from the research committee, such as the concern over individuals misinterpreting data and that it might be helpful to prevent those with bad intentions from having access. Other views reflected the values and considerations of the Dutch government such as wanting data in its most raw form and that open data could generate value not possible by having the dataset closed. Most people thought that since the data are collected in a public space, they should be open to the public as long as they are anonymous (and can remain anonymous even after data fusion).
This case study revealed that in practice, “open data” has a different cost-benefit analysis for each stakeholder. For an individual academic entity that invests in a data collection system, opening data could mean losing the research advantage over other institutions. There might be a similar concern for corporate parties that choose to invest in the smart city in order to reap the greatest reward. Panning out to the market, though, competition drives innovation. Although open data may weaken the data producers’ advantage, everyone else gets free access to a system they do not manage, build, or upkeep. From a modern government perspective, where success is often derived from economic growth, open data are advantageous, especially for data made possible by tax revenue. Even the Smarter Bridges Research Consortium uses open data to capture environmental readings and store them alongside sensor readings from the bridge. Using that external open dataset was much easier (and more sustainable) than setting up a separate environmental sensor system just for the bridge.
Nonetheless, competition is only one factor when discussing open data. Additionally, there are concerns about the data itself. Data are not necessarily accurate: sensors may break, systems can shut down, and information can be wrongly labeled. Open data has the potential to spread false information far from those who have the background knowledge to interpret or correct it. Imagine a dataset about regional city crime rates presented without valuable information such as the population density throughout the city, where officers are most often sent, or what types of crime happen where. The initial dataset would have the potential to prompt decisions that would not make sense with more contextual knowledge. The participants of the datathon were not given information about sensor drift, the weight distribution of the bridge on the canal, or how heat affects load and strain. This could give users of open data the impression that they know more about a system than they actually do and allow for misinterpretation.
Determining what open data are safe to share is also not trivial. As described above, open data may require more open data to provide context so that the data are interpreted correctly. The majority of participants in the hackathon seemed to assume that anonymous data are safe to share and that it is good to share data generated in public. However, as the Amsterdam privacy officer noted, even anonymous data can reveal things that might better serve the interests of the public if they remain hidden. Maybe open bridge data would cause individuals to test the limits of the bridge to see the sensor feedback. This might crowd the area, cause noise disturbances, and unnecessarily stress a safe infrastructure. Determining unreasonable risk becomes increasingly complex in an open data environment where a bad actor might have access to additional datasets and deanonymize innocuous anonymous data.
Participants of the datathon valued having access to data from the bridge, but also shared that it is important to have information about data collection—who is collecting it and how is it used. The request for transparency is repeatedly shared as a tenet of ethical smart cities, often in the context of open data [
23]. However, when data are made open without the need for registration, transparency becomes impossible to manage. How do you inform the public about data usage if any entity can build something with the data without needing to explain their purpose? Moreover, what is the incentive for the data managers to share what they are doing with the data if others can also use the data for whatever purpose they wish, whether it be for business, research, crime, or a middle school science project? To the average person in the smart city, it may become a question of whether open data or transparency is more important.
When considering power dynamics between the public and the data controllers, it is important to note that open data are just one possible stage or avenue for public empowerment. There is the possibility for empowerment in the creation process, deciding what infrastructures are put into place and which should be avoided. There is also room for empowerment in the management phase through boards that include a diversity of citizens and responsive transparency with the public. Responsive transparency would involve making it publicly clear who is in charge, what decisions are being made with the data, what data are collected, and what are the justifications for collection. Responsiveness refers to the possibility for external actors to complain, praise, or edit the system. This concept is adapted from “contestablity,” which refers to the ability of the public to contest the process and outcomes of AI decision-making algorithms, thereby changing the function of the AI system [
24]. Responsive transparency, unlike open data, would allow the public to act like data controllers in terms of management and decision making but would not allow the freedom to use the dataset however they wish.
Open data from the MX3D bridge has a redistributive effect but not necessarily on the average person. It might have the highest relative impact for an individual or small institution without the resources to create the dataset but with the expertise to make use of it (as seen with the datathon and within the Smarter Bridges Research Consortium). When zooming out to the system at large, the most powerful companies, governments, and institutions have the highest capability to use multiple datasets and connect them to make new sources of knowledge that might be proprietary. This is not inherently negative—the Smarter Bridges Research Consortium makes use of an open dataset of environmental sensors, which is more sustainable than creating a new system from scratch. Additionally, it may encourage the installation of fewer systems to test, review, fix, and supply energy. Nonetheless, it shows that the direct benefits of open data largely bypass the average individuals in society. Useful applications may also be made available to the public through contextual open data access [
2].
6. Conclusions
This case study of opening data from the MX3D bridge to the public revealed nuances that expose the positive and negative effects of open infrastructural data. Some of the findings were counterintuitive. Open data may limit the monopolization of smart city data and lead to products that benefit members of the public and generate more revenue in the economy. It also allows anyone to see exactly what data controllers collect and make sense of the data in their own way. However, most people are not data experts and it is currently recommended in the Netherlands that open for some means open for all, including companies, governments, and militaries. These entities might have more resources and motivation to process data in ways that may disempower the public. Furthermore, if data are open for all without registration, then that limits the power of transparency, because it is impossible to share all the groups that are using the data and what they are doing with it.
The best opportunity for open data would be if the movement forces data controllers to be more selective in the datasets that they collect so that data collecting systems are rigorously examined, limited, and not built to cause ecological or social harm. The worry remains that datasets, once released into the world, are not independent bodies, but can be combined with other data and create something unforeseen. We are still at the beginning of possibly a long future of heightened data collection and processing in public spaces. Due to GDPR and similar legislation, the public is predisposed to be wary of personal data collection, but there are other ways that data can be harmful, some of which might take more generations to recognize. Moreover, open data does cannot compensate for the main harm of smart city data sets being built based on values that do not reflect society at large [
25].
When looking towards the future, and imagining a public with perhaps more data literacy than the current generation, open data seems both daunting and perhaps necessary. The large organizations capable of weaponizing data might be combining worldwide open data, but so too might activists, researchers, and new innovative businesses solving the pressing problems of the time. While the regular members of the public still might not be able (or interested) to use the multitudes of open datasets, they will benefit from others using data to improve the world on their behalf. The greatest challenge will be keeping lines of transparency open and allowing data systems and decision-making algorithms to be built and contested by those without data expertise and the political sway of the data controllers.


