
The State-of-the-Art of Smart Cities in the European Union


Abstract
1. Introduction
2. Theoretical Background
2.1. Smart City Initiatives
2.2. Smart City Categories
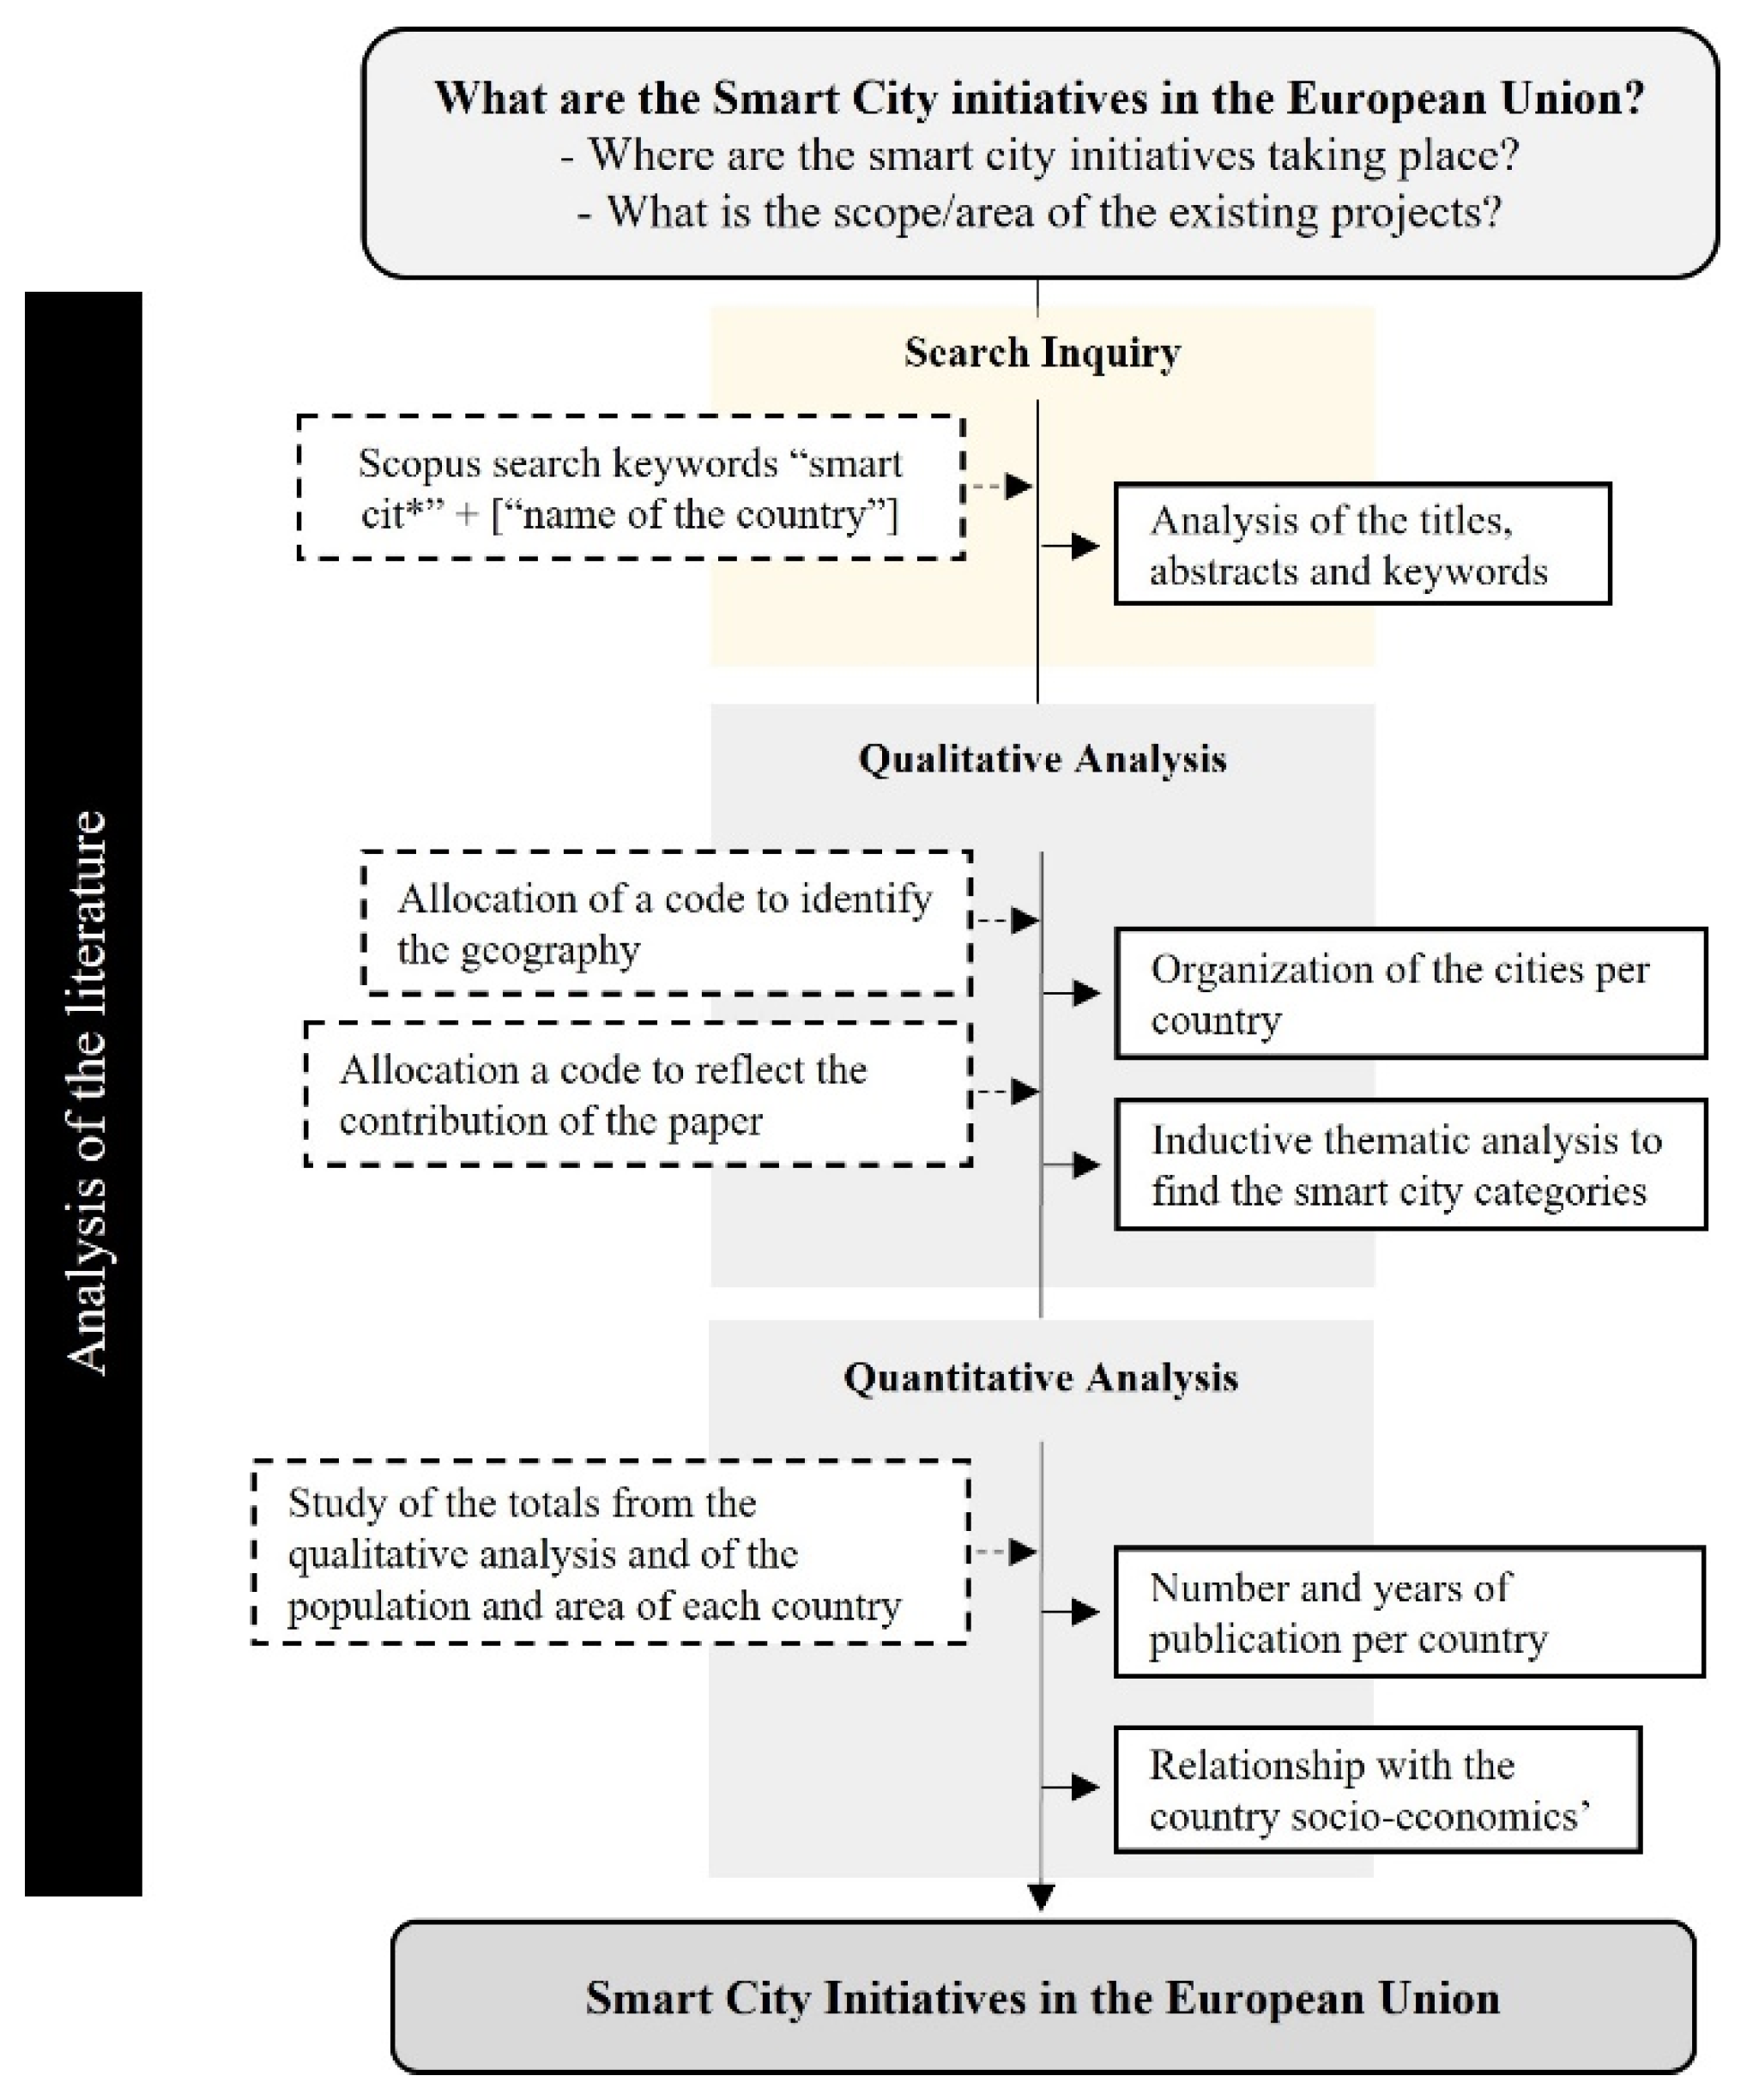
3. Materials and Methods
4. Results
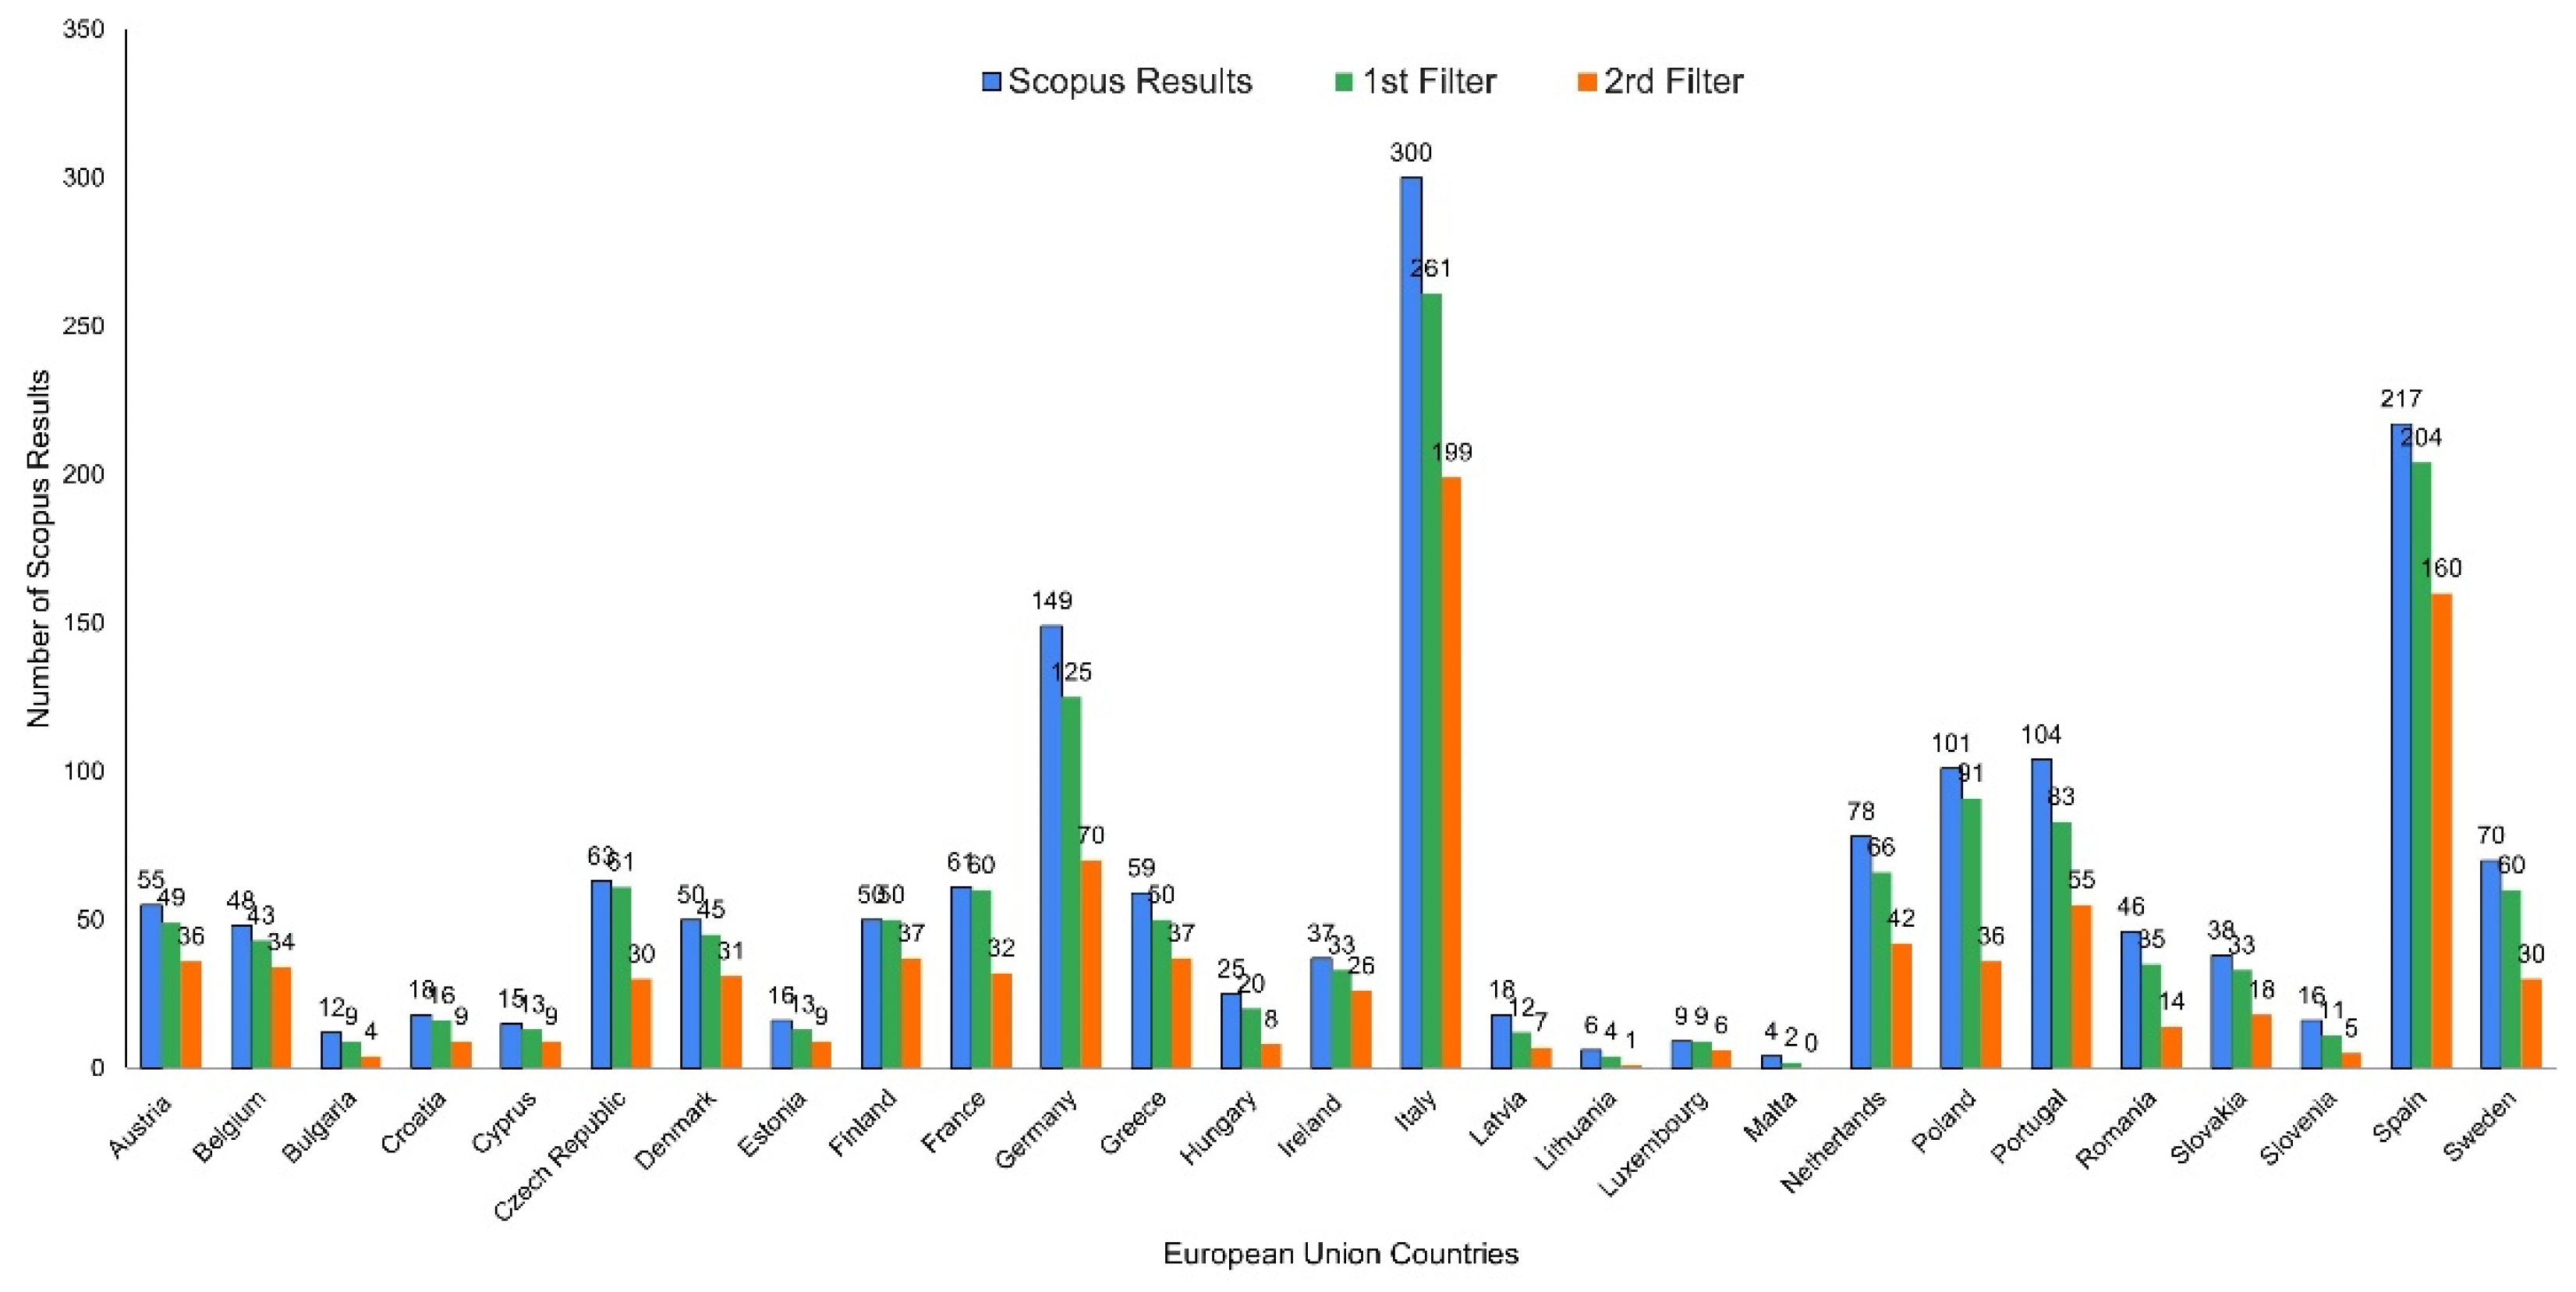
4.1. Countries’ Representation According to the Number of Smart City Initiatives
4.1.1. Emergence of the Smart City Initiatives by EU Country
4.1.2. Country Clusters by the Number of Smart City Initiatives
4.2. Countries’ Representation According to the Smart City Categories
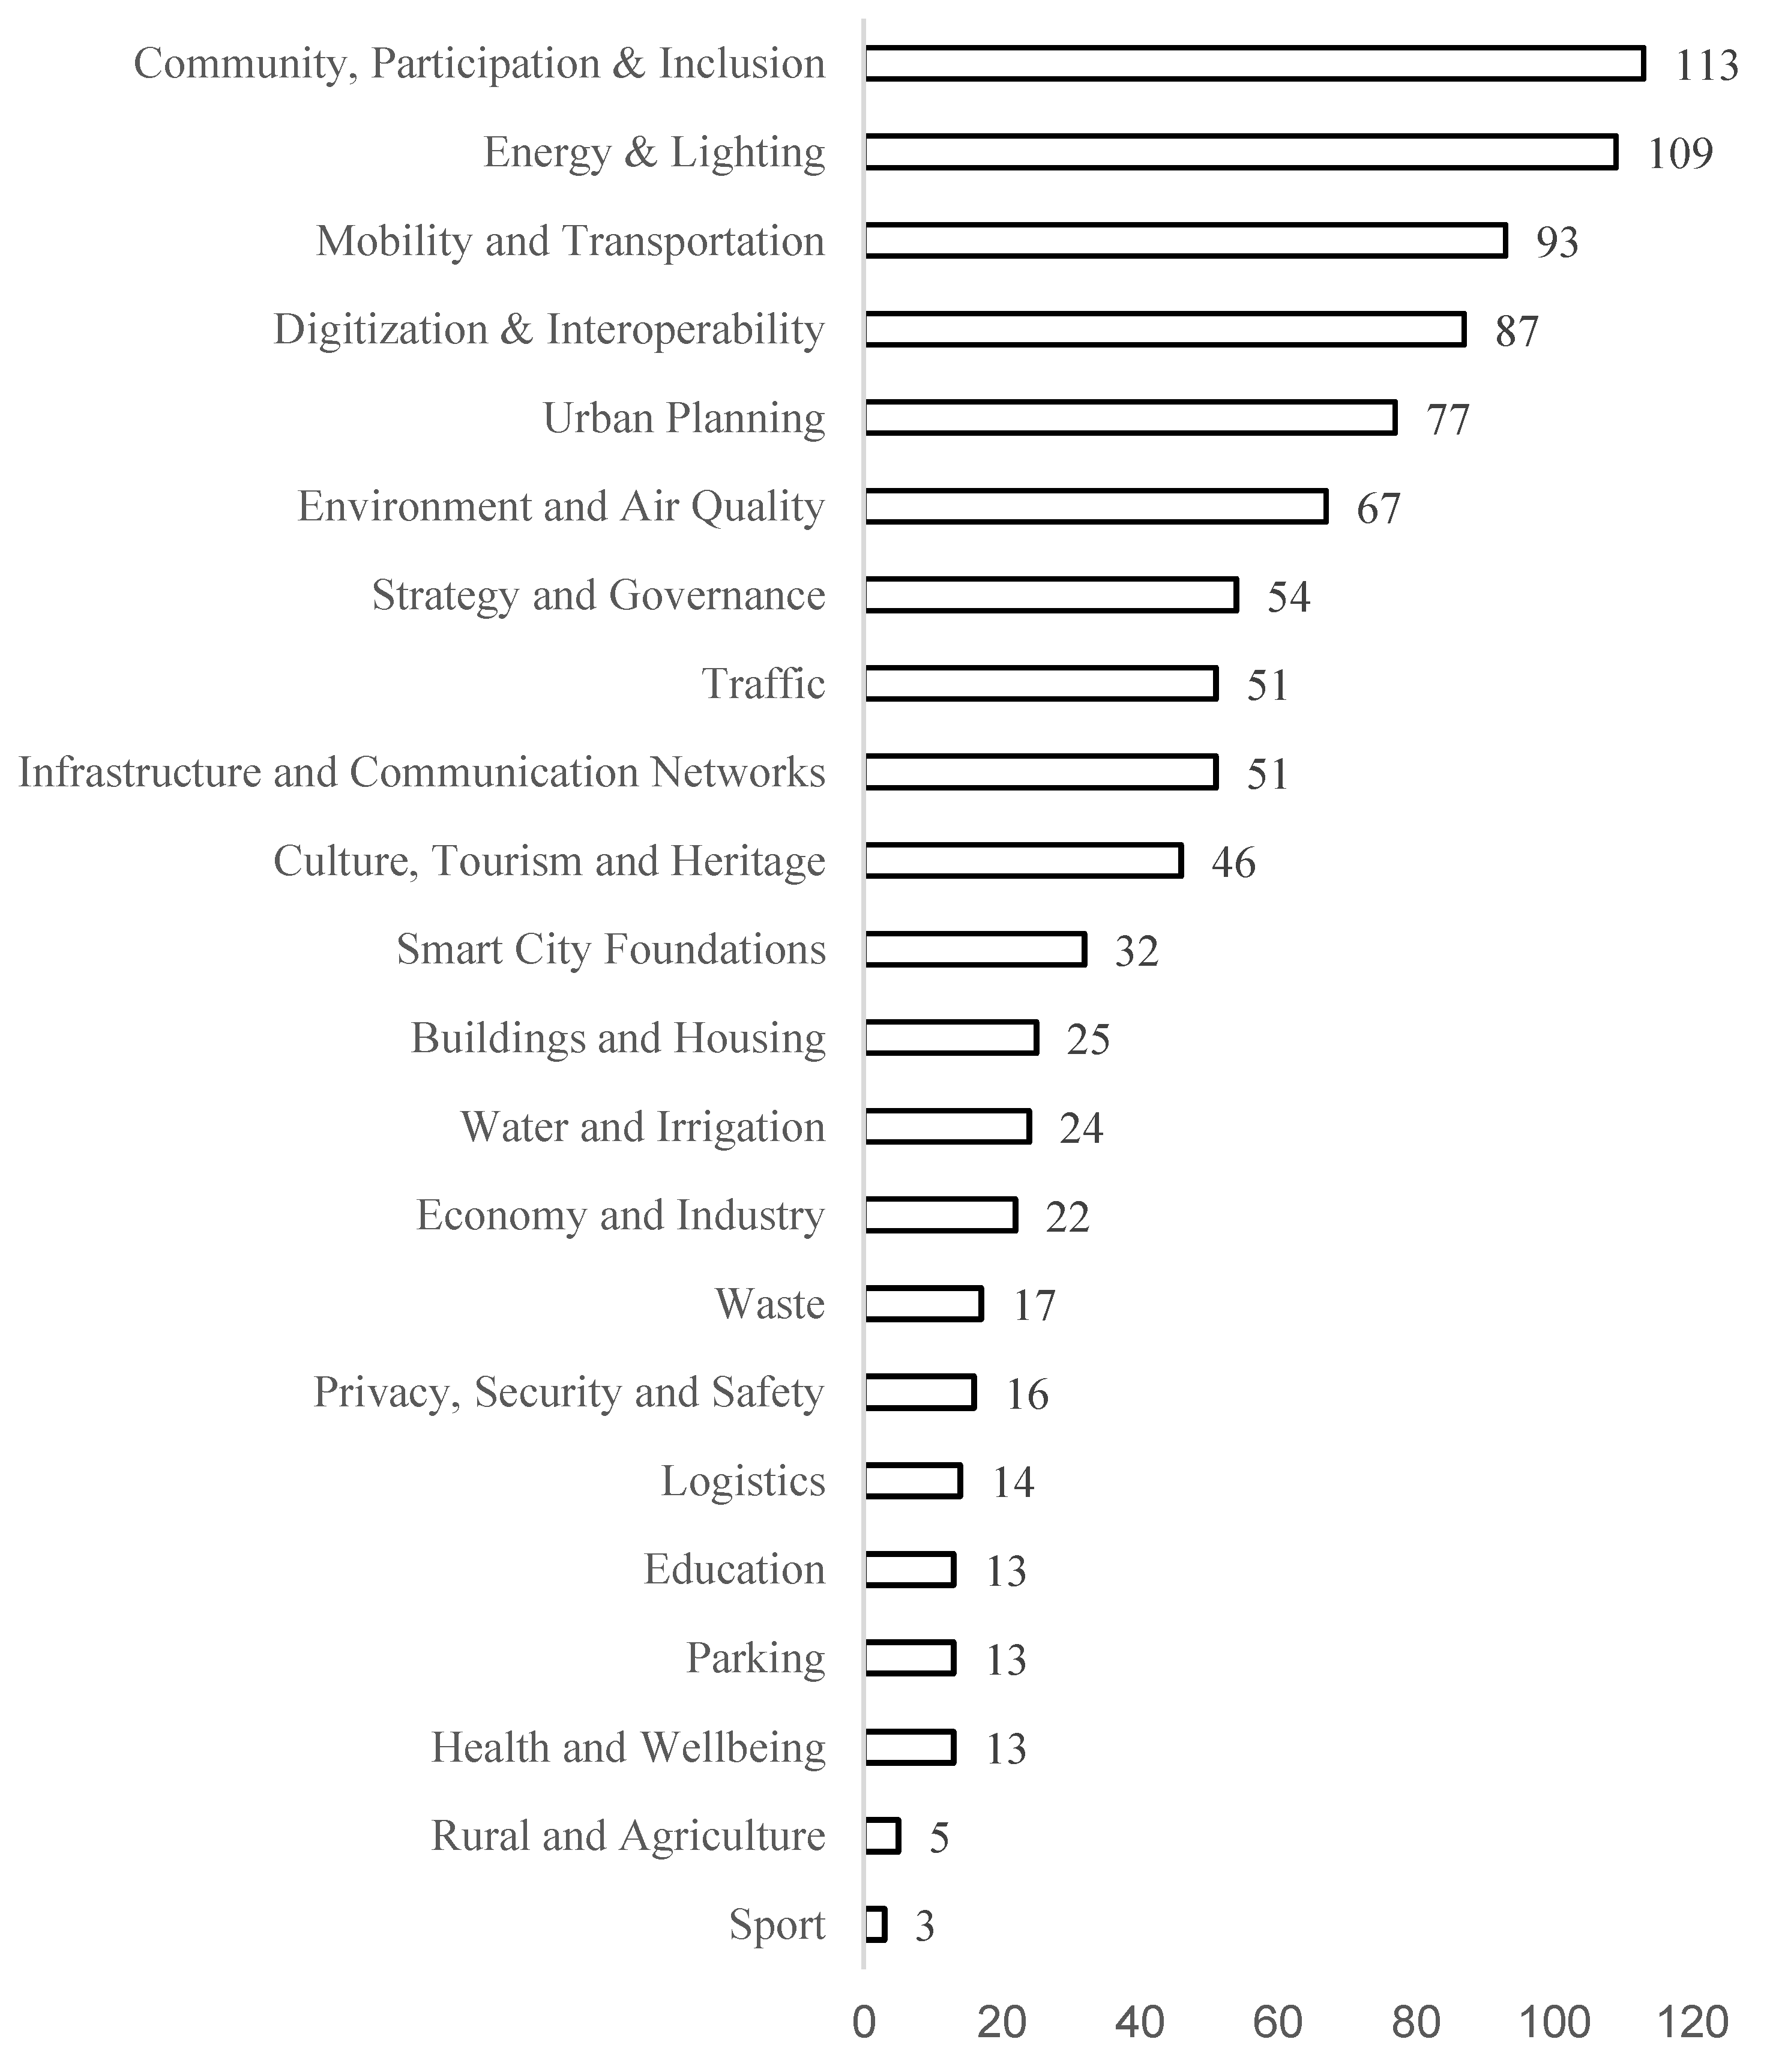
4.2.1. Smart City Categories
4.2.2. Smart City Initiatives by Category
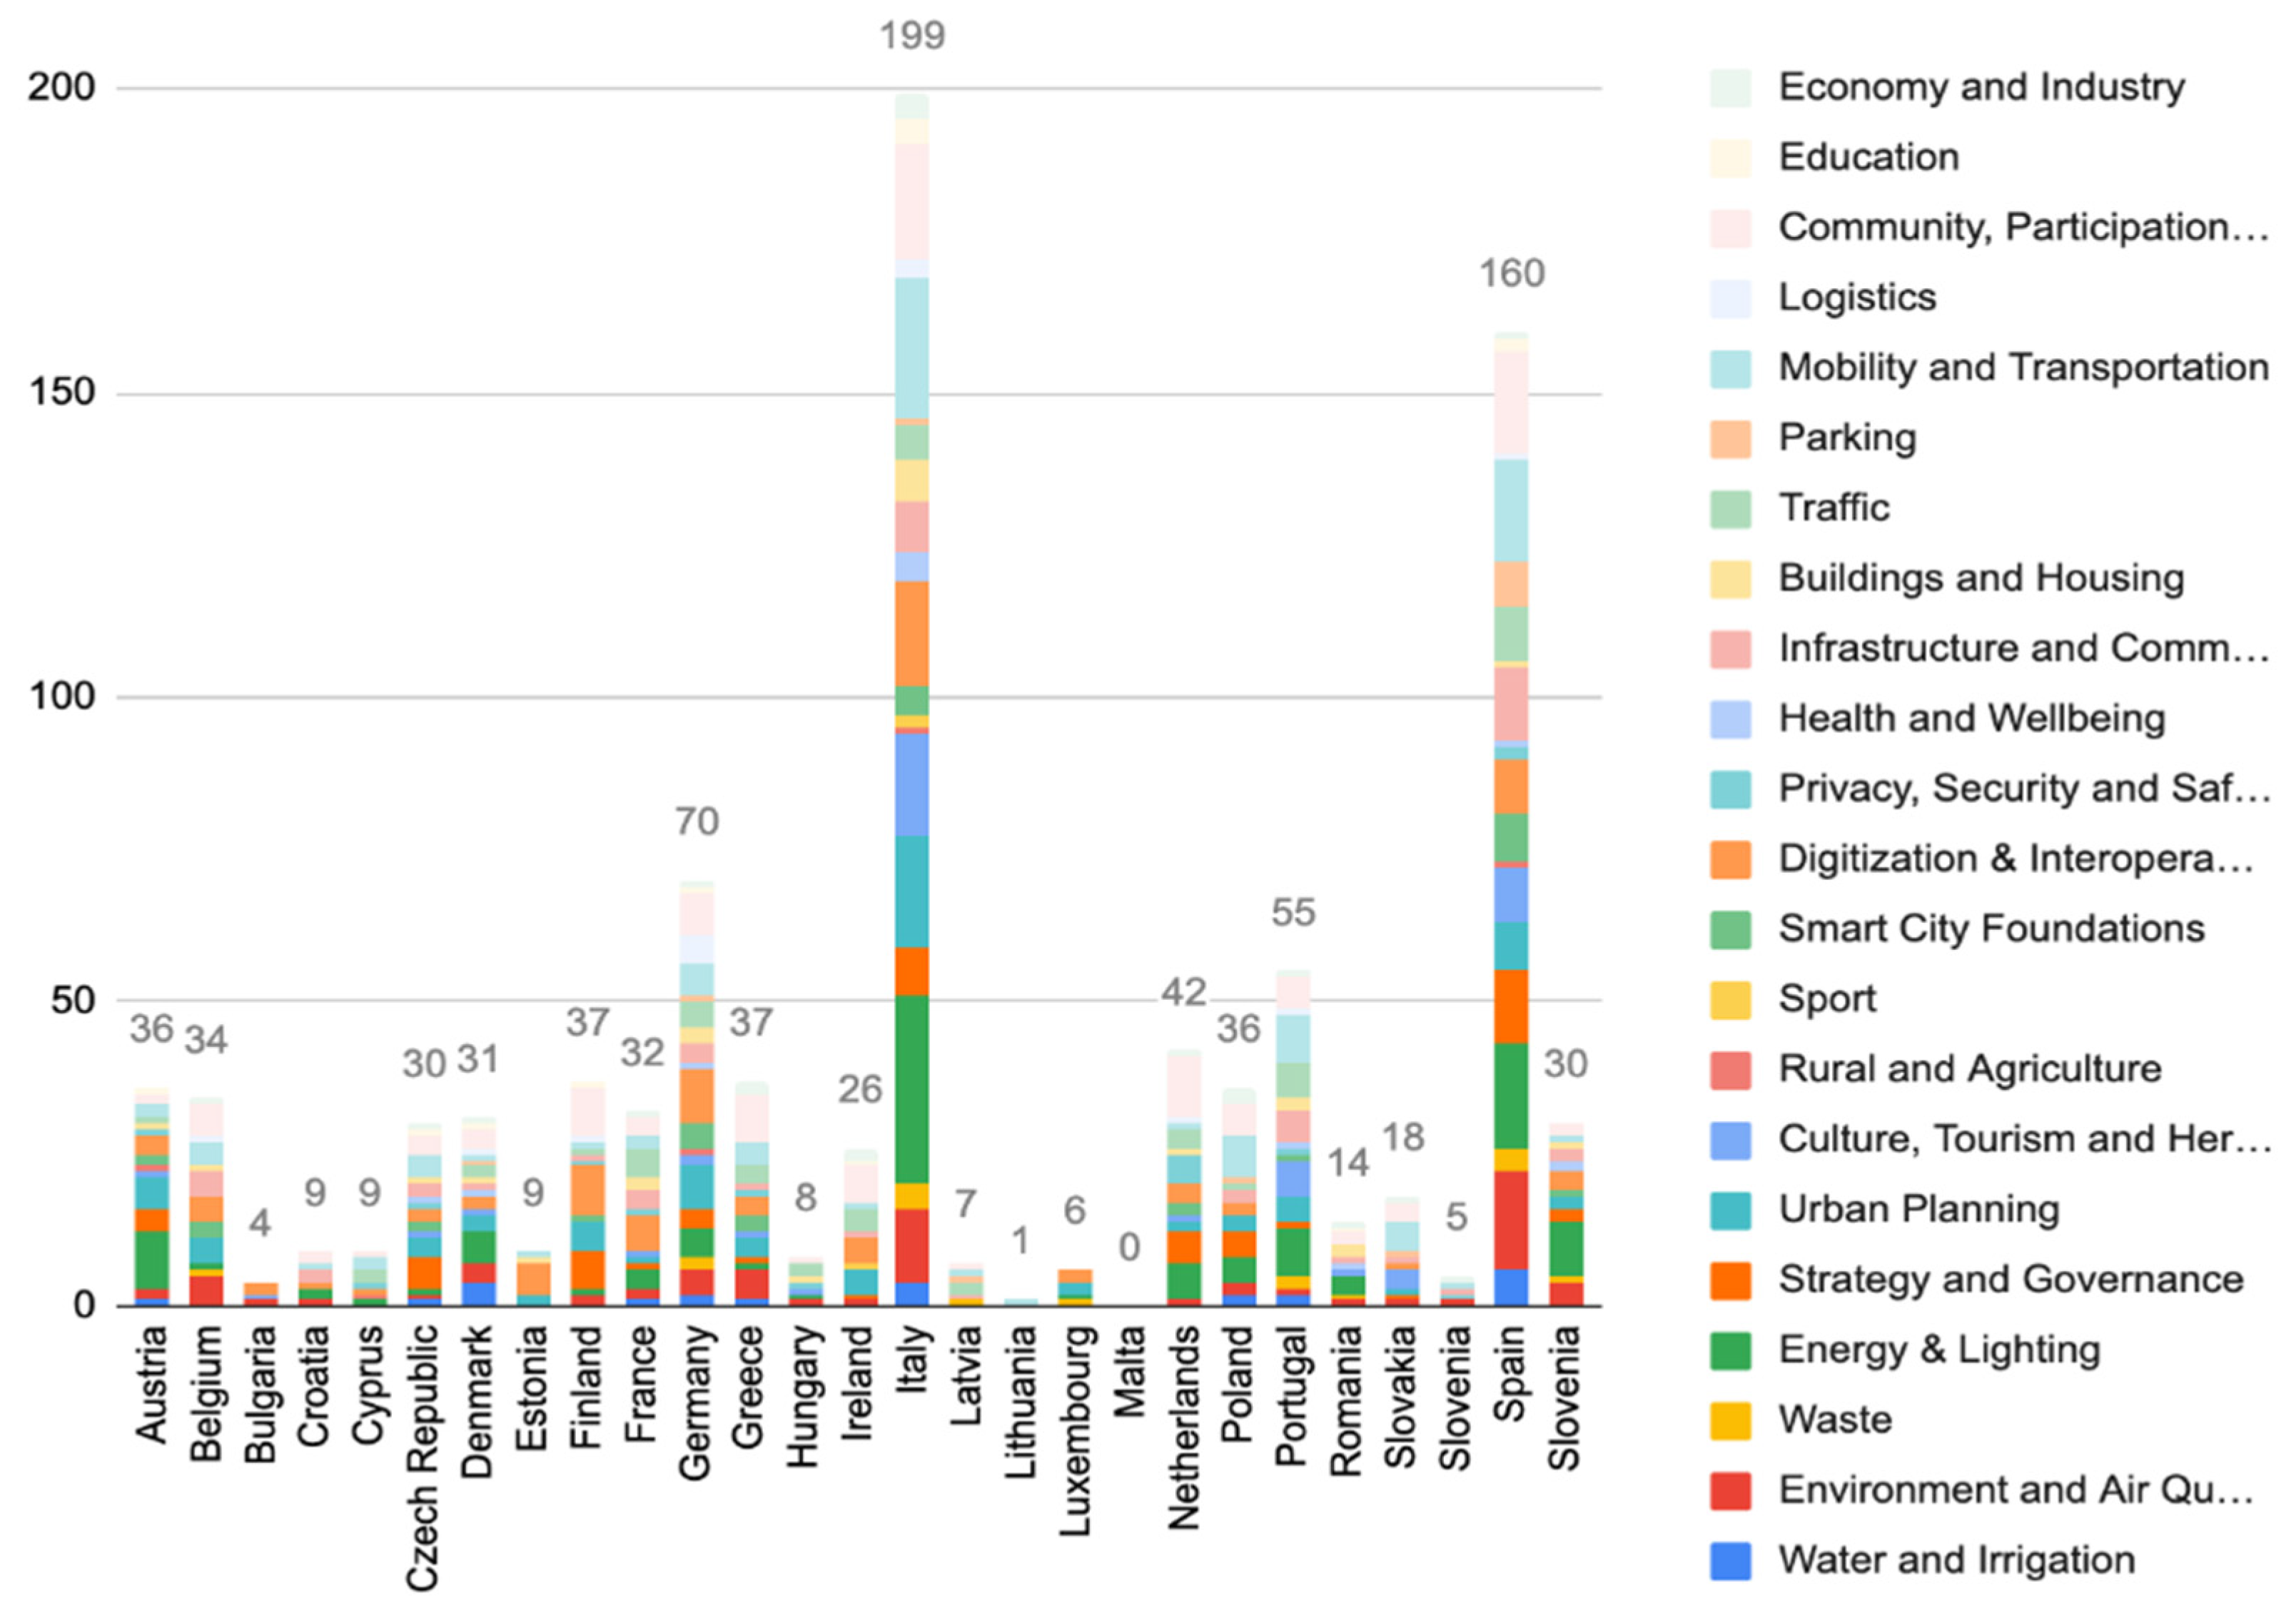
4.2.3. Representation of the Smart City Categories by Country
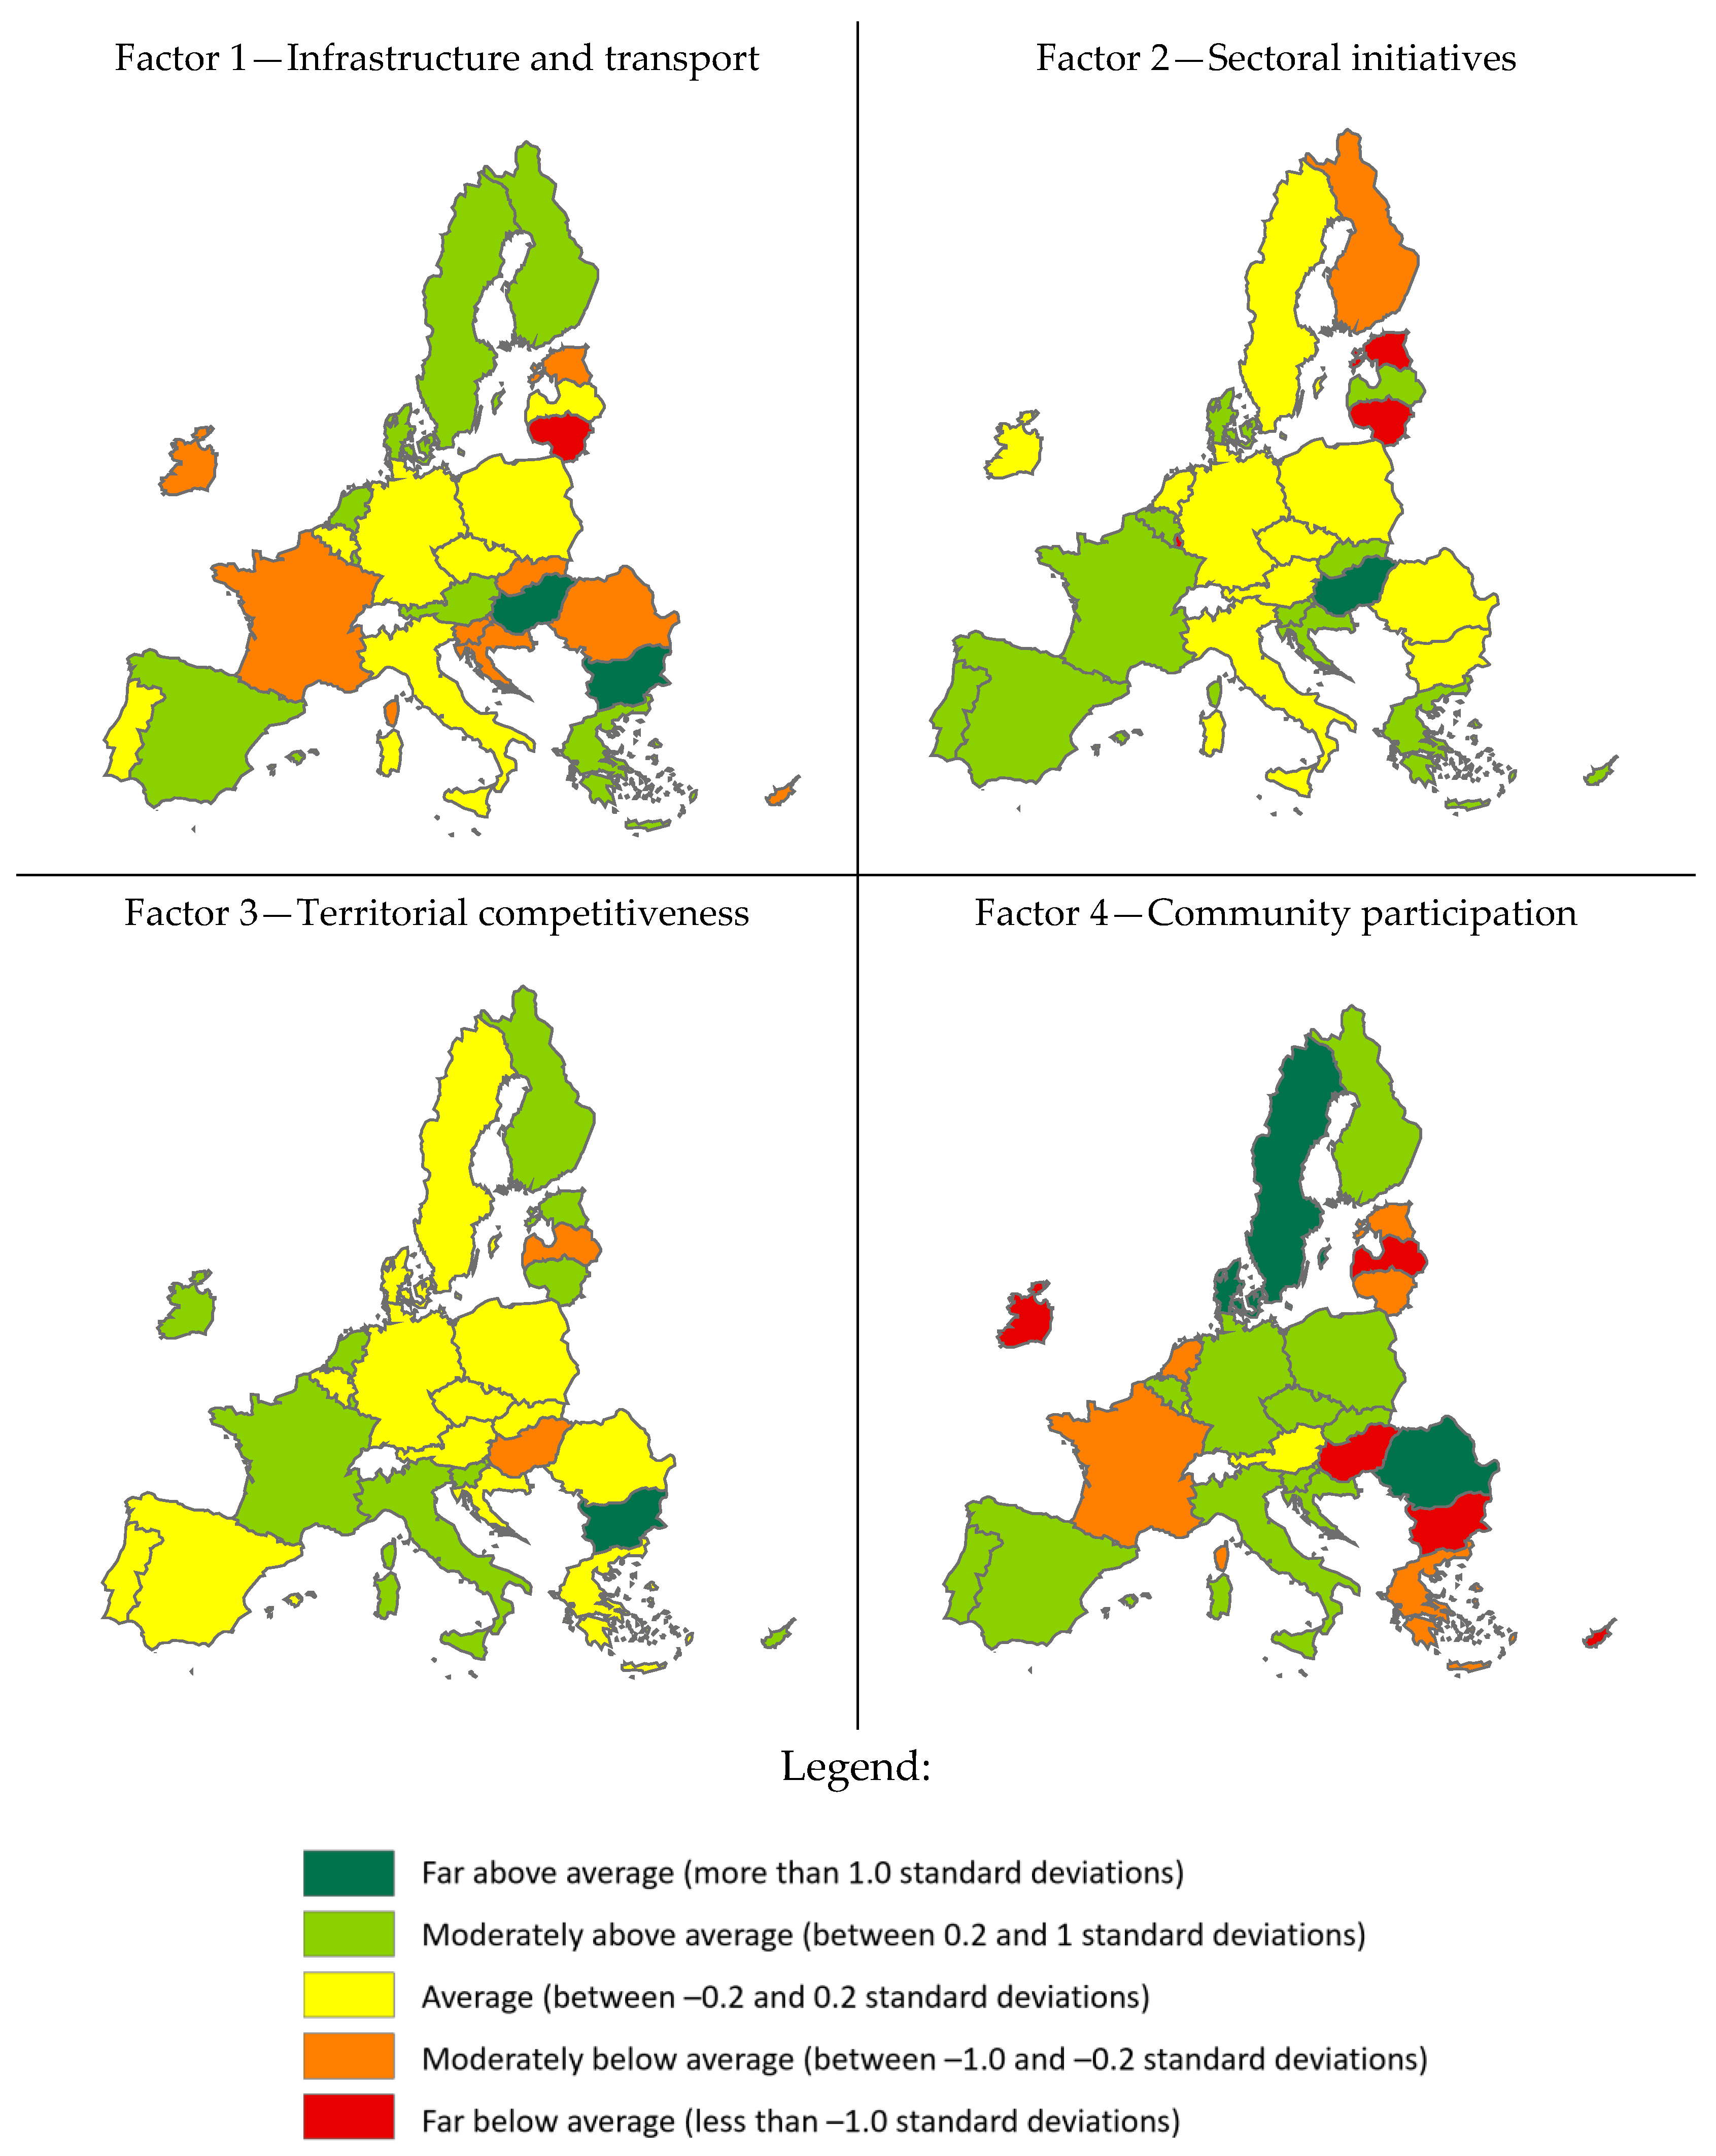
4.2.4. Country Cluster Analysis (Dimensionality Reduction)
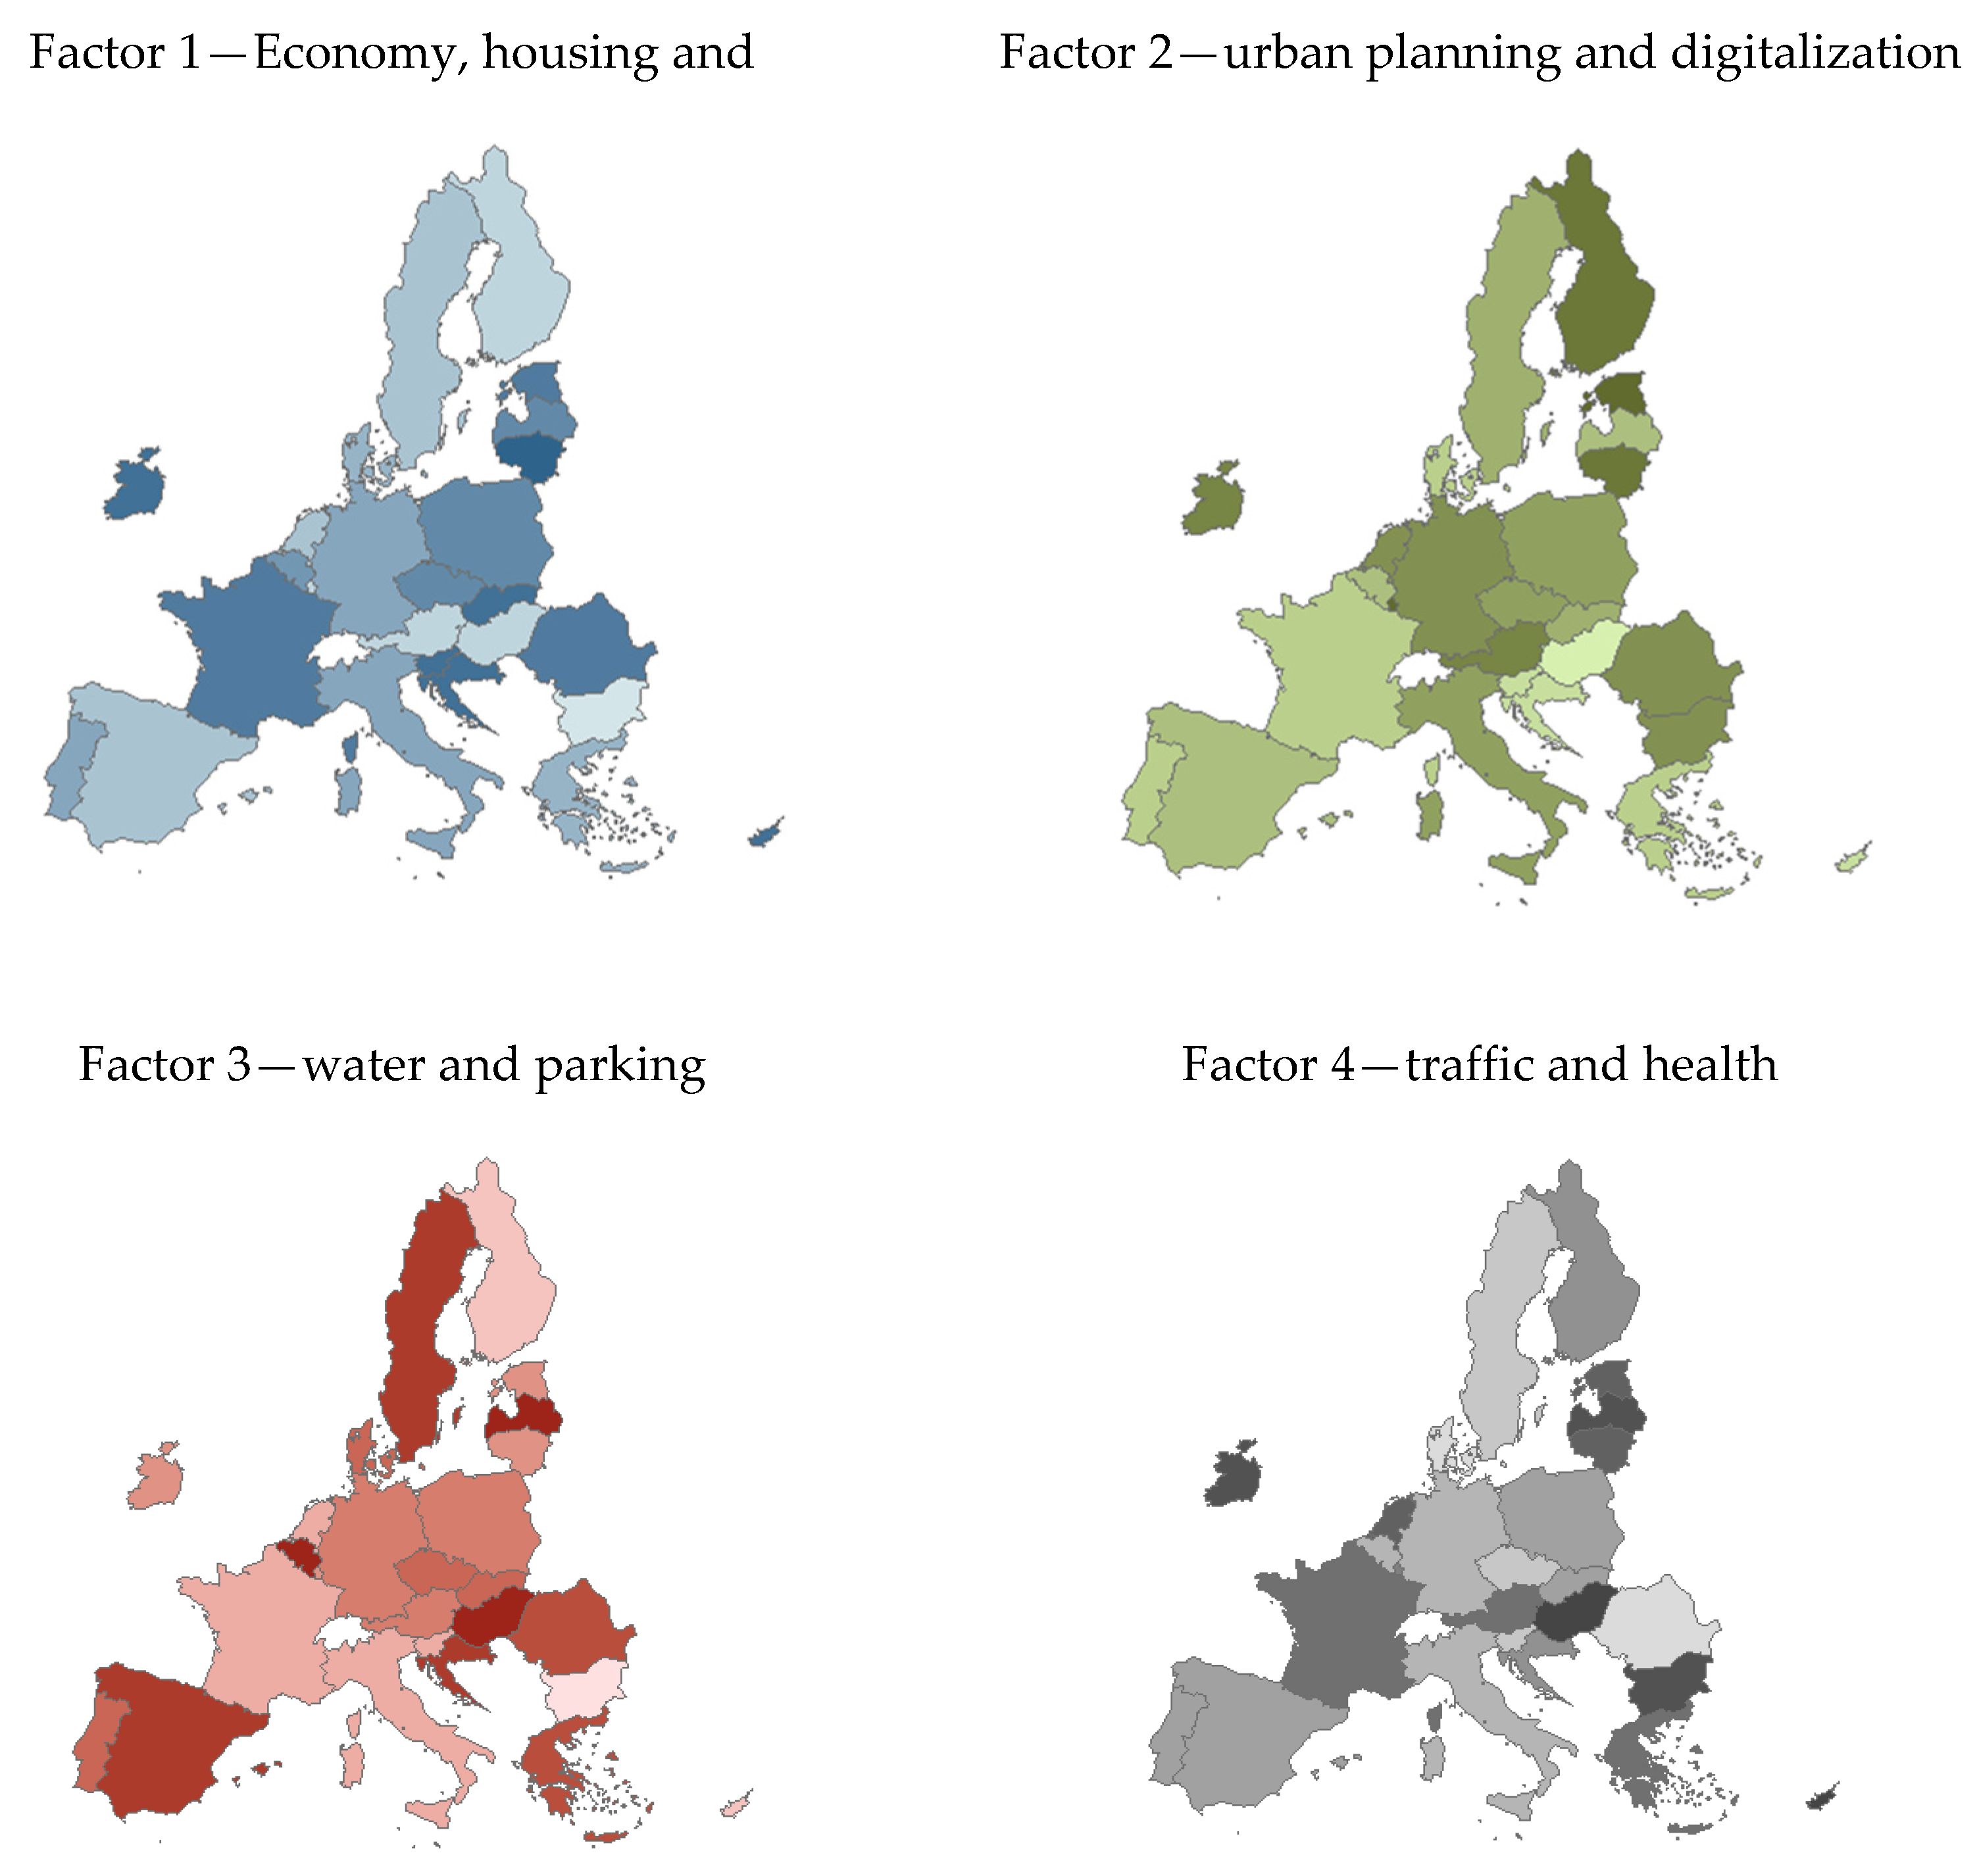
- The first factor joins initiatives related to the more tangible and material issues of the smart city, such as basic infrastructures (waste, water and air) and transport (parking, communication networks, traffic and mobility). Spain is clearly the leading country in this type of project, followed by Poland, Portugal and Italy (see Figure 9—factor 1);
- Factor 2 involves sectoral initiatives linked to sport, health, education and culture; Italy stands out as the country that invests most in this type of initiative, followed by Ireland and Romania (see Figure 9—factor 2);
- As for the third factor, a concern with the competitiveness of the entire territory is highlighted. Thus, it is possible on the one hand to identify projects related to rural and agriculture, and on the other initiatives in the category of logistics, digitalization, economy and industry. In these categories, four countries can be highlighted, firstly Germany, prominently, and then France, Italy and Poland (see Figure 9—factor 3);
- Finally, and contrary to factor 1, in this factor we have four initiatives of a more intangible nature linked to community participation and issues of security and privacy, in which the Netherlands appears in a leading position, followed by Ireland and Spain (see Figure 9—factor 4).
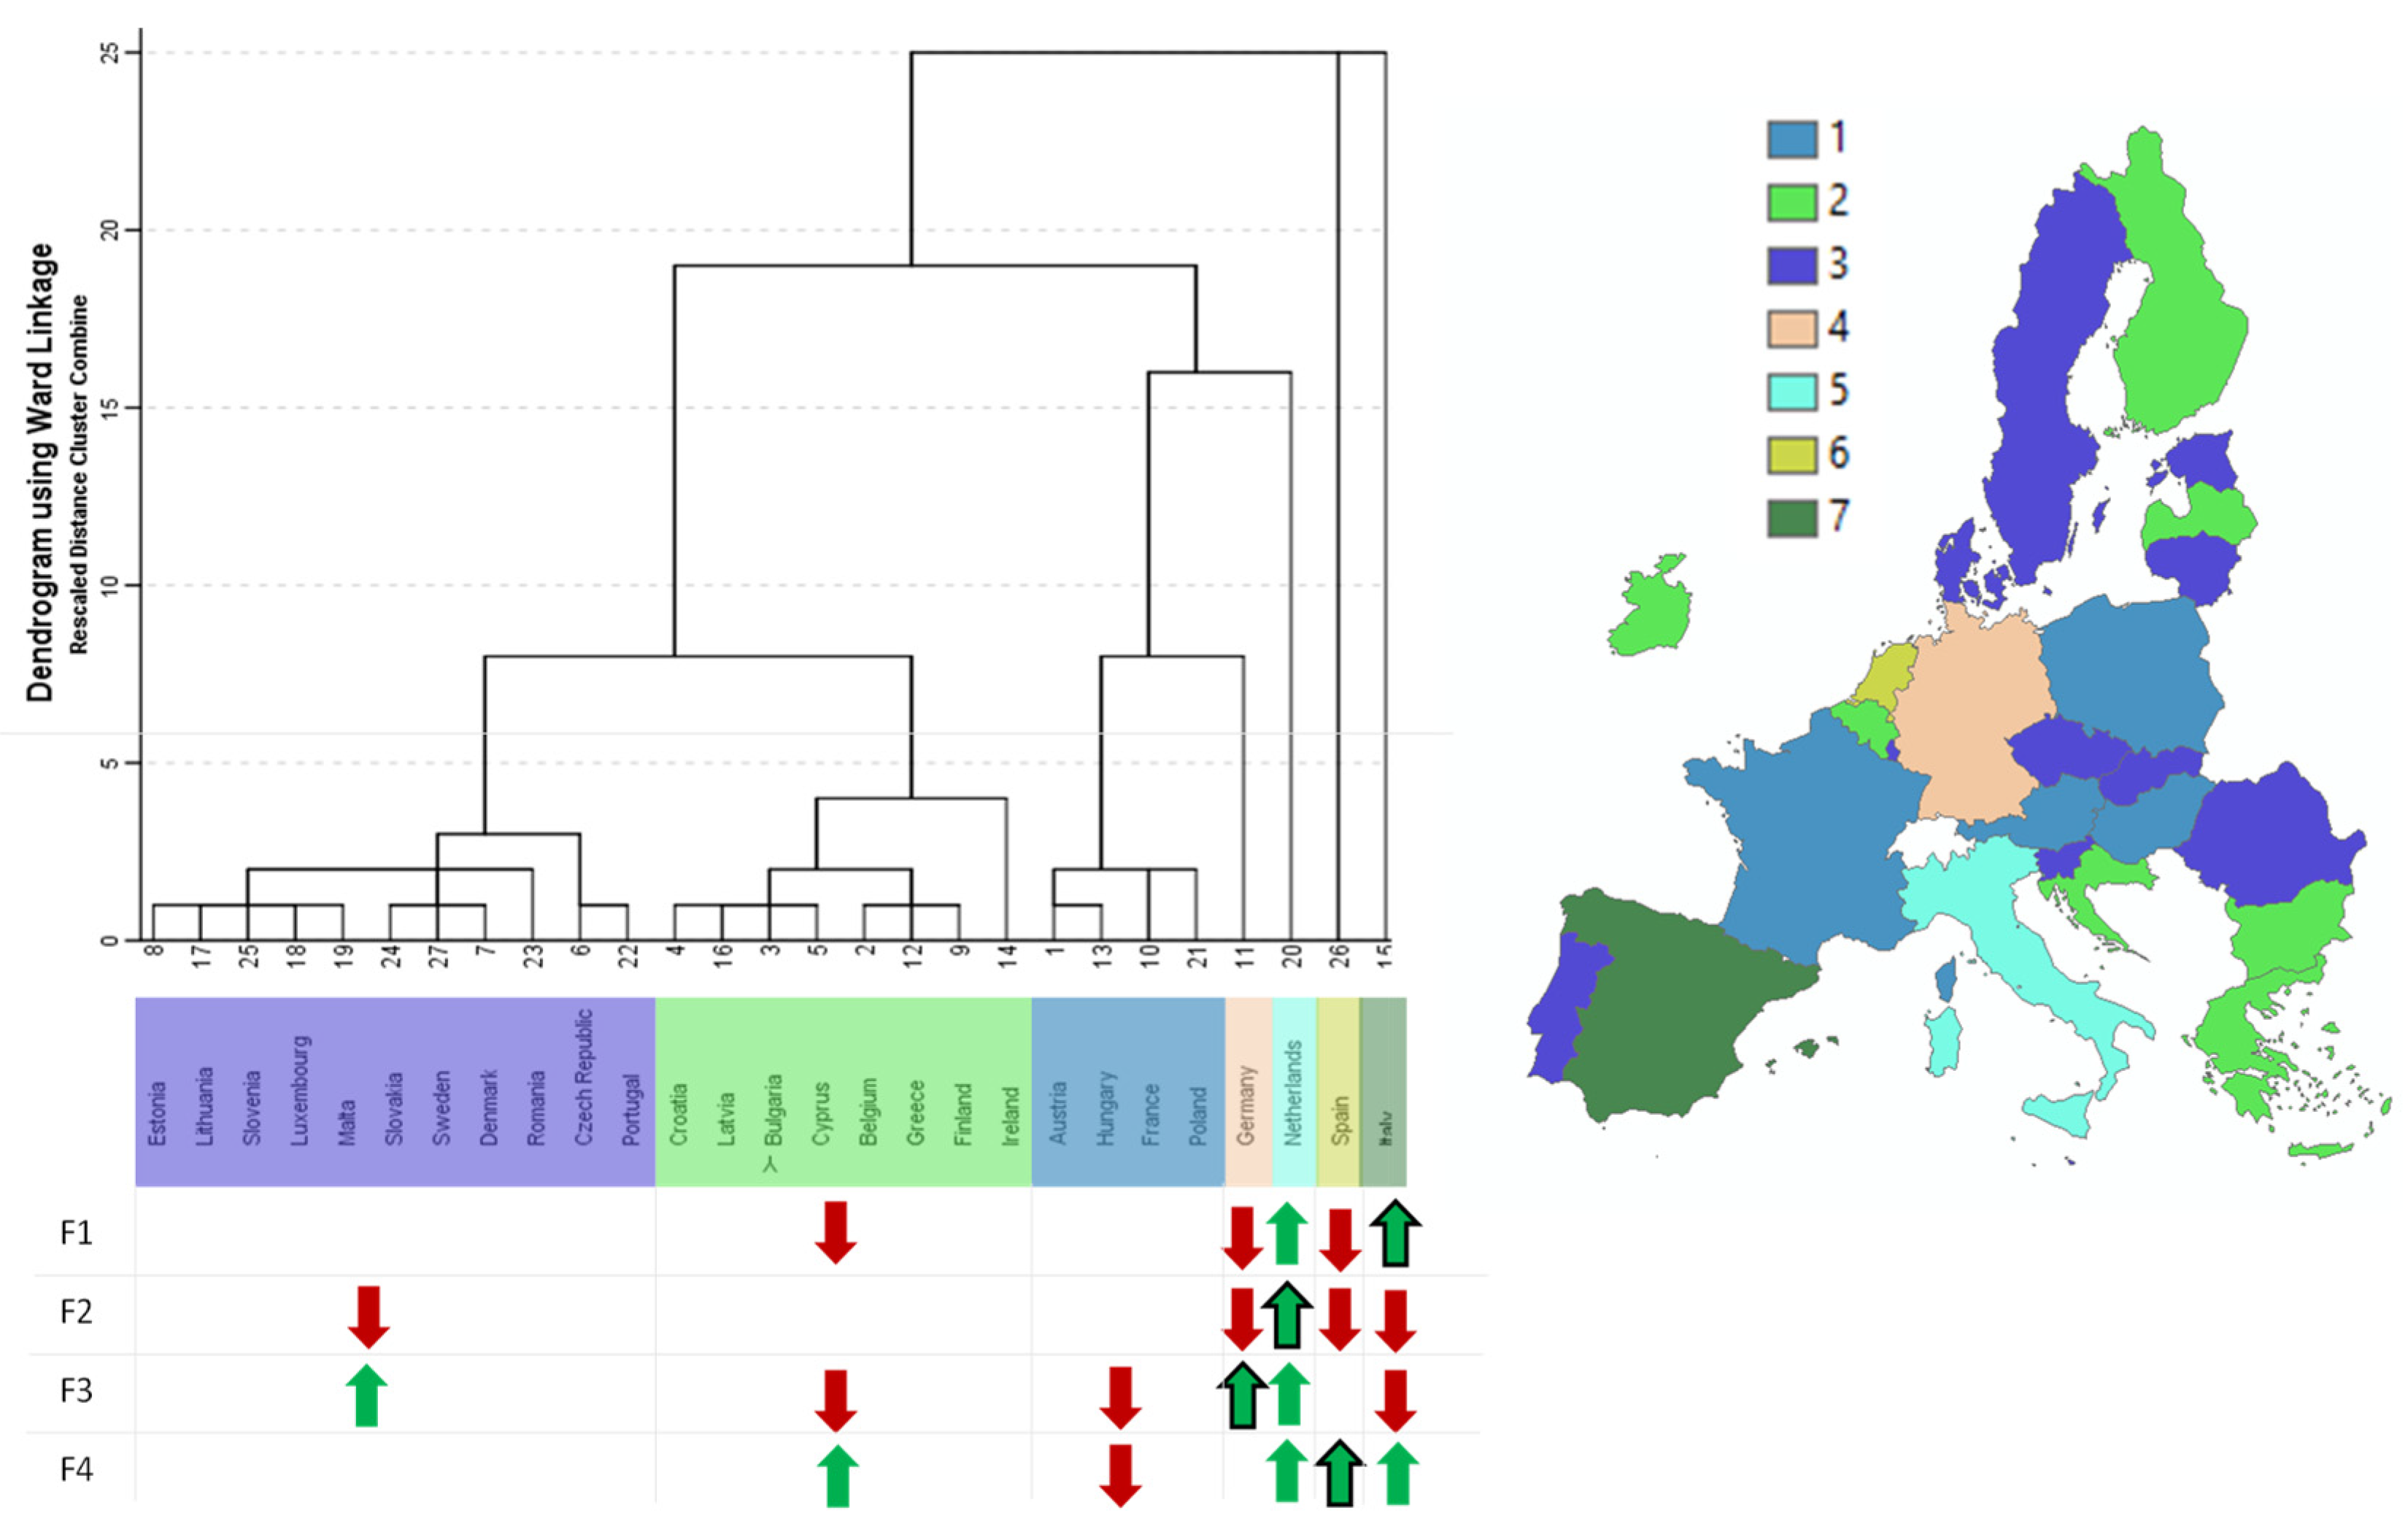
- Cluster 1 includes four countries (Hungary, France, Austria, and Poland), which are countries that have many initiatives related to agriculture, logistic, housing, digitalization (factor 3) and a few in factor 2; that is, those associated with sports, health, education and culture.
- The eight countries (Ireland, Greece, Finland, Belgium, Bulgaria, Latvia, Cyprus, and Croatia) included in cluster 2 have tended to invest little in factors 1 and 3 (basic infrastructures, transports, logistics, digitalization, economy) when compared with infrastructure-related initiatives that have greater importance.
- Cluster 3 (Estonia, Lithuania, Slovenia, Luxembourg, Malta, Slovakia, Sweden, Denmark, Romania, Czech Republic, and Portugal) is distinguished by low investment in projects related to community participation (factor 4) and rural and agriculture activities (factor 3).
- Clusters 4, 5, 6 and 7 are singular clusters, i.e., formed by a single member state because the values are so distinct that they appear as outliers and thus form a single cluster. In this case, the single-country clusters are Germany, the Netherlands, Spain and Italy. Those are the countries with the greatest number of initiatives in each of the major categories (factor 3, factor 2, factor 4 and factor 1, correspondingly).
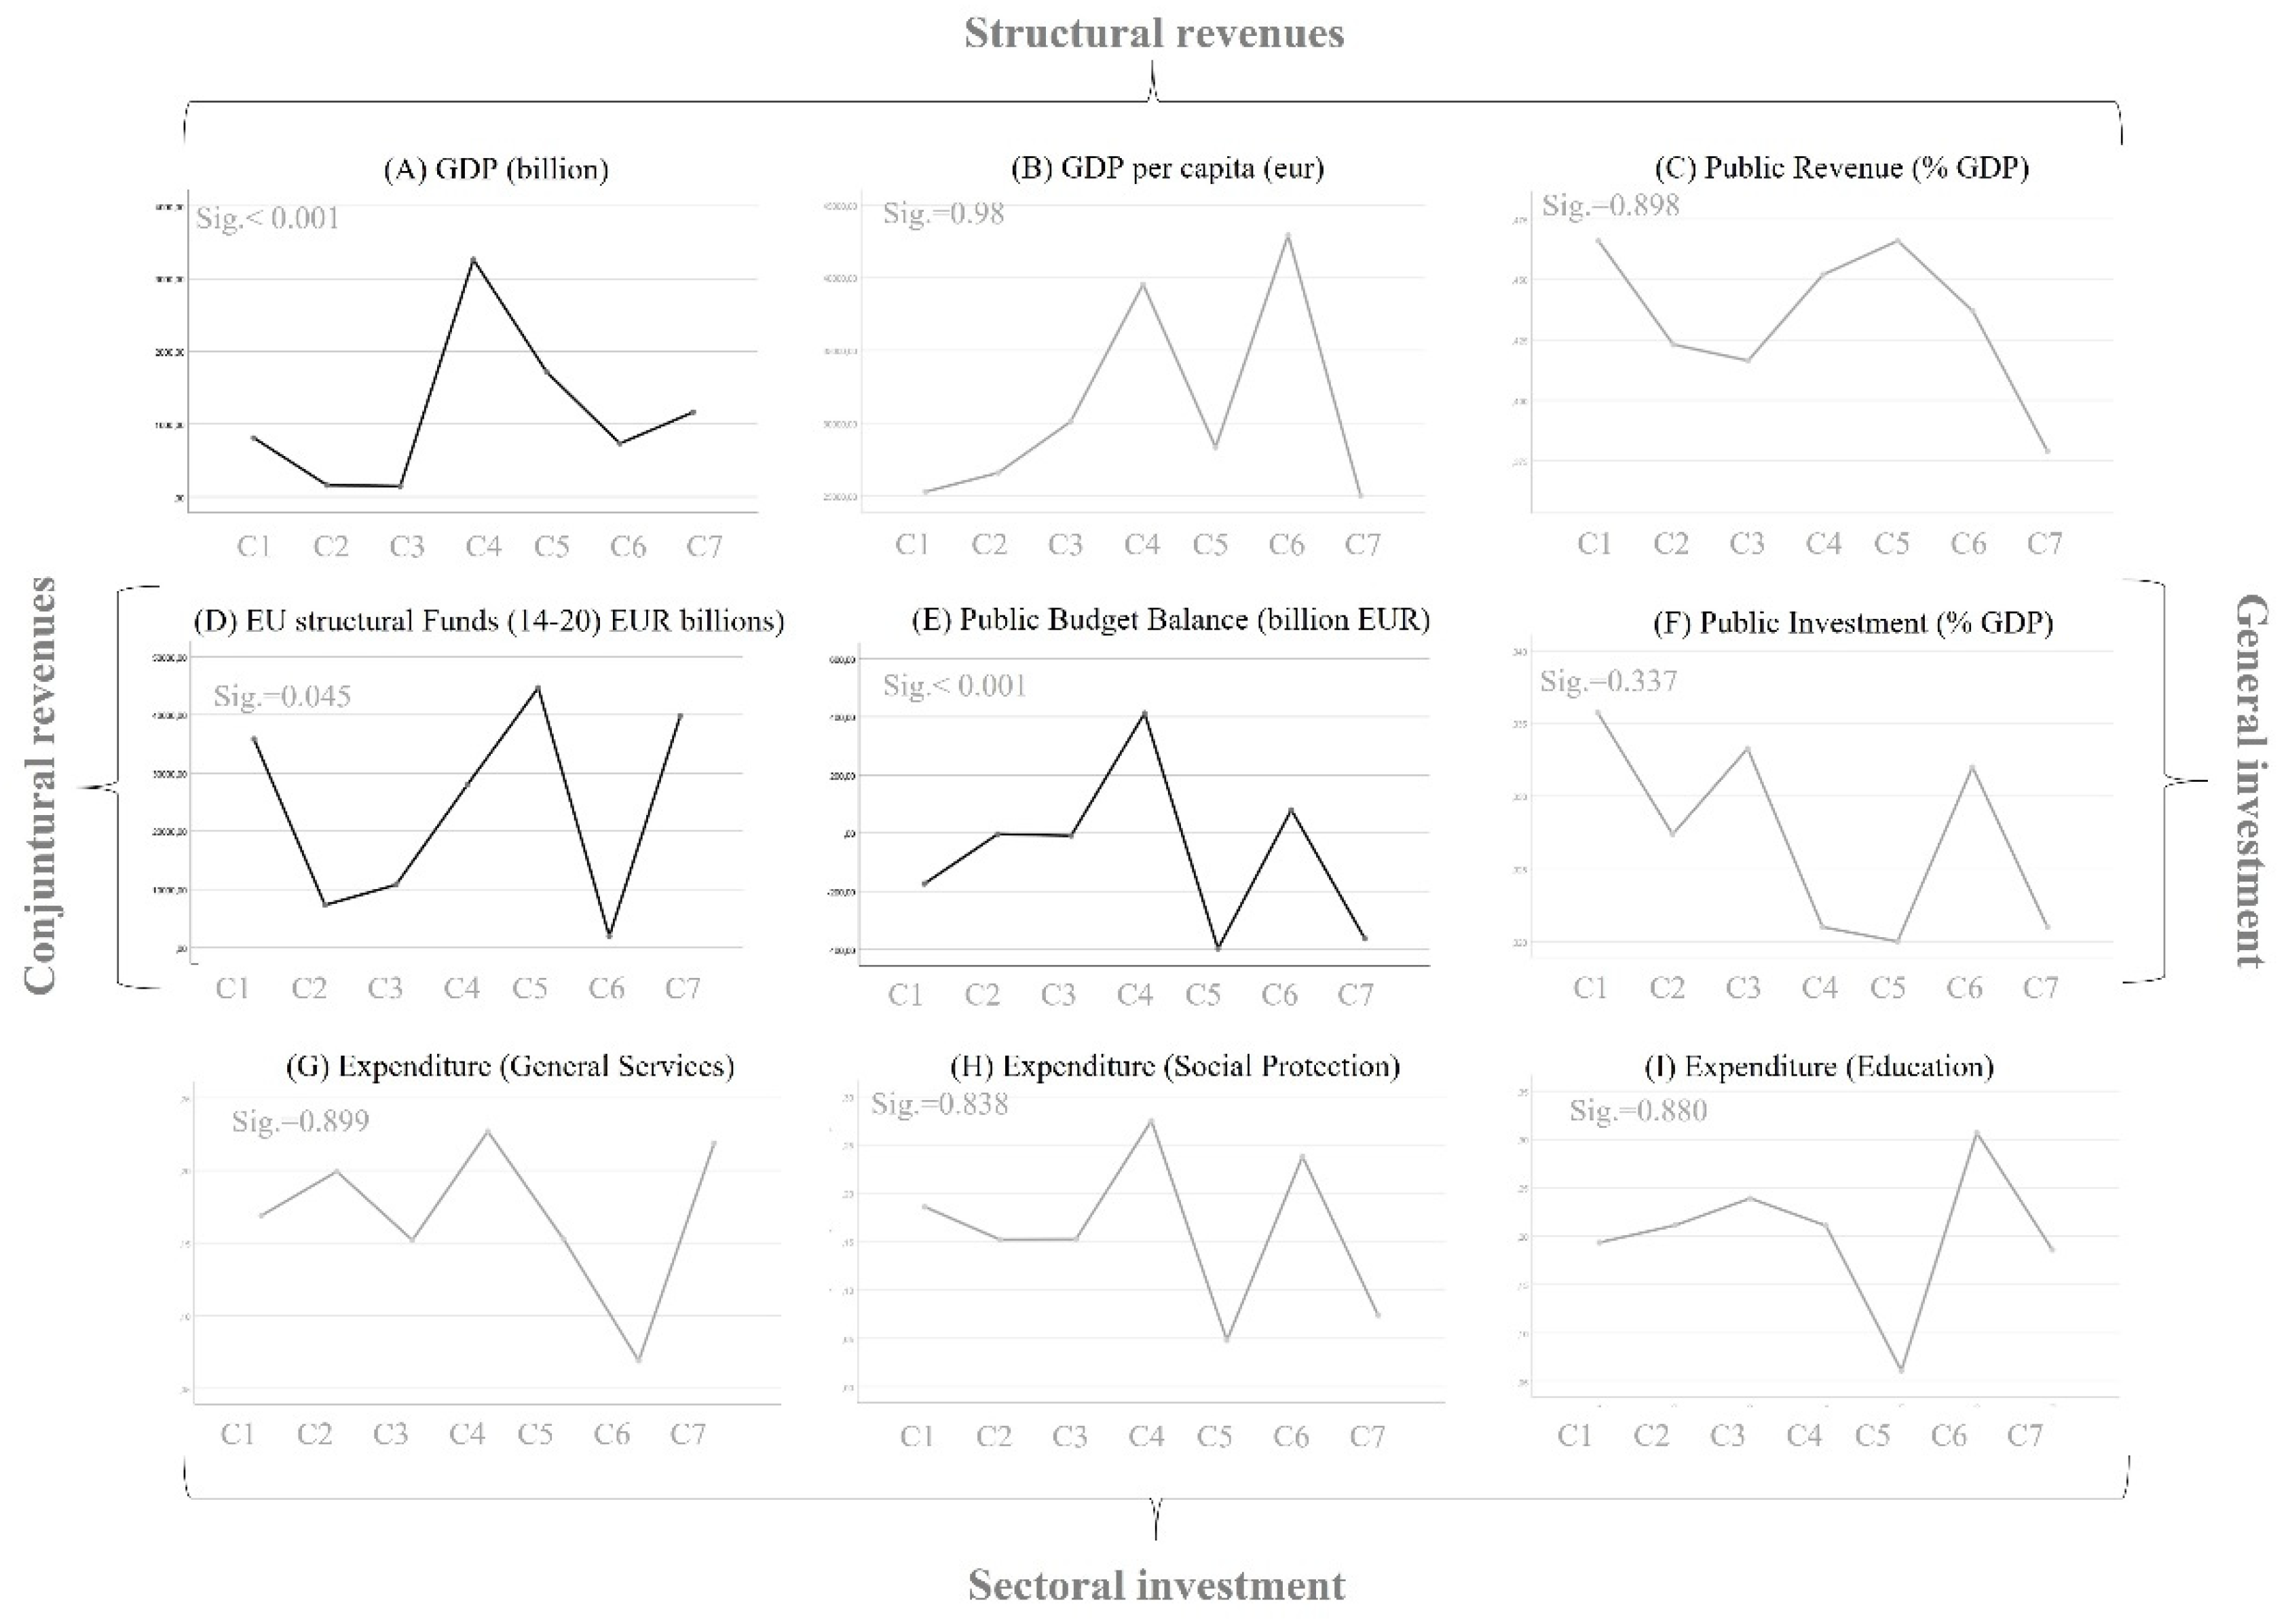
4.3. Socio-Economic Relationship
5. Discussion
6. Conclusions
Author Contributions
Funding
Conflicts of Interest
Appendix A

| Keywords | Category |
|---|---|
| Leaks, Floods, Anomaly Detection, Infrastructure, Stormwater, Rain and Melted Water, Wastewater, Water Quality, Irrigation, Smart Meters, Household Metering, Residential Consumption, Geothermal, Supply, Distribution, Pollution | Water And Irrigation |
| Emissions, Temperature, Air Quality, Sound and Geo-sensing, Green Roofs, Noise, Climate Change, Green Spaces, Indoor and Outdoor monitoring, Ozone, Urban Parks, Crowdsourcing Monitoring, Low Carbon, Remote Sensing, Gardening, Smoke/fire Sensing, Road Transport, Bicycle Monitoring | Environment and Air Quality |
| Circular Economy, Waste Management, Fill-level Sensing, Route Optimization, Illegal Dumping Recognition System, Waste Sorting, Waste Collection, Selective Waste Collection, Organic Waste | Waste |
| Smart Districts, Energy Systems, Urban Infrastructure, Renewable Energy, Green Solar Cities, Sustainable Energy, Intelligent Streetlight Management, Thermal Storage Systems, Efficiency, Photovoltaic, Roofs’ Solar Potential, Smart Energy, Buildings Performance, Sufficiency, System Optimization, Renewable Heating and Cooling, Electric Car, Smart Grid, Residential Microgrid, Waste Energy Recovery, Heat Storage, Geothermal, Wind Power Plants, Charging Stations, Distribution Network, Smart Lighting, Green Energy, Biomass, Climate Policy, Biogas, Fast Charging Infrastructure, Luminaires LED, Energy Storage, Self-sufficient | Energy & Lighting |
| Governance Framework, Development Strategy, Smart Municipality, Crisis Management Systems, Cross-Border, Virtual Crowds, Smart Sustainable Cities, Ubiquitous City, Public Procurement, Open Strategy, Smart City Control Rooms, Smart Urban Monitoring, Digital City, Smart City Implementation Strategy, Smart Governance, Smart Institutions, Policy Process Standardization, City Marketing, Official Statistics, Regional Strategy, City Profiling, Smart Regions, Urban Branding, Evaluation Method, European Projects, Sustainable Governance, Advanced e-Government, Green Branding | Strategy and Governance |
| 3D City Model, Urbanism, GIS, Public Services, Urban Policies, Spatial Data Population Distribution, Land Use, Urban Policies, Sustainable Urban Planning, Spatial Planning, Modeling Tool, Sustainable Development, Urban Computing, Urban Sustainability, Digital Twin, Urban Platforms, Planning Instruments, Urban Development Management Tools, Smart Urban Spaces, Virtual Reality, Geology, Soil permeability and Cartography, Mobile Geographic Information, Territorial Management Planning Strategies, Spatial Intelligence, City’s Mapping, Urban Accessibility, Smart Urban Spaces | Urban Planning |
| Smart Tourism Destination, Tourism and Hospitality, Living Lab, Travel Behavior, Heritage, Preservation, Cultural Impact, Sustainable Tourism, Smart Museum, Augmented Reality, Historic City Centers Reconstruction, Sustainable Winter Tourism, Slow Tourism Experience, Digital Interactive Art, Mobile Tourism, ICT for Tourism, Rural Tourism, Smart Tourism, Beach Attendance Prediction, Indicators | Culture, Tourism and Heritage |
| Rural Areas, Rural Contexts, Tree Inventory System, Small Cities, Cow Sharing, Smart Town, Urban-rural Relationships, Rural Regions, Smart Village, Olive Production Quality | Rural and Agriculture |
| Smart Stadium, Sport and Smart Communities, Sport Activity | Sport |
| Driving Elements, Smart City Proposition, Opportunities, Challenges, Priorities, Barriers, Benefits, Value Proposition, Ideology, Myths and Utopias, Evaluation System and Model, National Scale, Practices, Case Studies, Smart Region, Indicators, Characteristics, Understandings, Findings and Lessons, ISO 37120 standard, KPIs and Index, Rankings, Sustainability Assessment, Performance Measurement Systems, Trends and Opportunities | Smart City Foundations |
| Information Science, Standards, Mobile City Applications, Data Interoperability, Open Data Policy, UrbanAPI, Digital Transformation Strategies, Subsystems Integration, Sensor Aggregation, Information Modeling, Big Data Analytics, Mobile Phone Data, Urban Operating System, Mobile Sensor, Urban Sensing, Digital Society, Urban Digitalization, Digital Transformation, Information Dissemination, Open City Toolkit, Crowdsensing and Crowdsourcing, Urban Dashboards, Living Labs, Data Concentrator, Big Data, Open Data, Crowdsensed Data, Fog Computing Applications, Integrated Dashboard, Open Data Assessment, Platform-as-a-Service Architecture, Interoperability and Open Data | Digitization & Interoperability |
| Digital Rights, Surveillance, Biometric Border Management, Cybersecurity Education Management, General Data Protection Regulation, Reinforcement, Camera Systems, Blockchain, Security Monitoring, Intrusion and Abnormal Behavior Detection System, Autonomous Vehicles’ Privacy and Cybersecurity, Risk Management, Emergency Evacuation Planning, Crime Prevention, Coordinated Management, Emergency Response, Cameras and LiDAR Sensors, Digital Rights, Urban Safety, Smart Security, Public Safety System, Transparency and Control | Privacy, Security and Safety |
| Senior Care System, Smart Quarantine, Urban Health, Wellbeing, Urban Living, Disease Control, Predicting Diabetes Diseases, Satisfaction Estimation, Ambient Assisted Living (AAL), Elderly People Monitoring, Hospital Information Systems (HIS), Teledermatology Platform, eHealth, E-Prescription System, Quality of Life, Emotion, Stress Mapping, Covid-19, Predicting Patients’ Urgency Demand, Active Mobile Phone Intervention, Health Monitoring System | Health and Wellbeing |
| Wireless Sensors, Mobile Sensors, LoRaWAN, Internet of Things, 5G networks, Communication Technologies, LoRa Network, Wi-Fi and Interactive Displays, Digital Infrastructures, LPWAN Applications, Li-Fi Installation, Wi-Fi Network, Gateway City, Wireless Sensor Network, Cyber Physical Systems, Digital Infrastructures, ZigBee Wireless Communication, Narrowband IoT (NB-IoT), Industrial Internet of Things (IIoT), Architecture and Infrastructure, Wi-Fi hotspot, Bluetooth Sensors Network, Smart Urban Infrastructure, Power Line Communication (PLC) | Infrastructure and Communication Networks |
| Sustainable and Resilient Buildings, Sustainable Urban Regeneration, Utilities, Smart Building, Buildings Renovation, Green Building, Living Lab, Thermal Comfort, Thermal Modelling, Energy Efficient, Sound Foundations, 3D Buildings, Smart Home, Room Temperature Control Systems, Indoor Conditions Assessment, Occupancy Rate, Municipal Building Regulation, Housing Regeneration, Building Information Modelling (BIM) | Buildings and Housing |
| Responsive Traffic Signaling System, Traffic Forecasting and Route Guidance, Traffic Management System, Traffic Prediction, Bicycle Traffic, Road Marking, Road Damage Detection, Road Safety, Spatiotemporal Traffic Data, Road Accidents, Crowdsensing Urban Transit, Dynamic Obstacle Detecting, Smart Route Planning, Emergency Vehicle Routing, Road Assessment Conditions, Intelligent Traffic Light, Automatic Road Sign Inventory, Road Safety, Intelligent Crosswalks, | Traffic |
| Smart Parking, Off-Street Parking, Geospatial Factors, Parking Management, Pay-As-You-Go, Controlling System, Applications, Mobile Payment, Public Parking Spots, Social Parking, Real-Time Parking Prediction System, Park-and-ride Facilities | Parking |
| Population Distribution, Mobility Dynamics, Walking, Intelligent Transportation System, Electric Bike Sharing, Carpooling and Electro-mobility, Urban Transport, Smart Mobility, Light Rail, Public Transport Demand, Railroad Network, Pedestrian Movement, Transportation Modes, Green Transportation, Automated Driving, Mobility Politics, Integrated Urban Mobility, Electric Carsharing, Multimodal Sustainable Mobility, Shared Micromobility, Multi-modal Mobility, Inclusive Mobility, Carpooling Gamification, Soft Mobility, Autonomous Vehicles, Mobility-as-a-Service (MaaS), Crowd Mobility, Connected Cars | Mobility and Transportation |
| Sustainable Urban Freight Transport, Logistics, Last-mile, Future Urban Fleets, Intelligent Offloading Distribution, Logistics Freight Traffic, Short-distance Freight, Autonomous Vehicle Fleet, Local Food Delivery, City Logistics, Grocery Distribution and Delivery, Surplus Food Delivery, Logistics Routing Problem, Short Term Load Forecasting | Logistics |
| Participatory Governance, Collaborative Data Platforms, Citizen Participation, Human Centric Approach, Disabled Citizens, Participatory Sensing, Citizens Engagement, Participatory Innovation Platforms, Open Data, Co-creation, Smart Community, Bottom-up Participation, E-governance, E-participation, Democratization, Urban Experimentation, Social Policy, Virtual Community, Inclusion, Social Sustainability, Crowdsourced Governance System, Citizen Science model, Collaborative Decision-making Processes, Participatory Budget, Socio-technical experimentation, Stakeholder Involvement, Inclusive Smart Society, Local Leadership | Community, Participation & Inclusion |
| Education, Smart Campus, Hybrid Learning, Mobile Education, Public Libraries, School as a Service, Information Science, Human Capital, Knowledge and Intellectual Capital, Universities Role, Gamification Educational Strategy, Quality Management Skills, Learning and Teaching Environment, E-learning, University Curricula, Training, Employment Future Skills | Education |
| High-skilled Employment, Public Private Partnerships, Industry 4.0, Remote Working, Green Business Model, Knowledge Proximity, Sharing Economy, Smart Industry, Green Economy, Innovation Districts, Green Entrepreneurship, Economic Development and Welfare, Real Estate Valuation, Intelligent Fabrics, Smart Economy, Local Entrepreneurs, Technology Park, Micro-Enterprises, Startups, Accelerators, Open Innovation, Social Entrepreneurship, Digital Nomads, Intelligent Manufacturing System, Ethics, Sustainable Production, Inclusive 3D printing, Advertising, Corporate Social Responsibility | Economy and Industry |
Appendix B
| Topic | Cities | Countries |
|---|---|---|
| Water and Irrigation | Innsbruck (1), Zdarna (1), Aalborg (1), Copenhagen (2), Isted (1), Region of North Jutland (1), Lille (1), Frankfurt (1), Main (1), Skiathos (1), Bay of Pozzuoli (1), Bresso (1), Calabria Region (1), L’Aquila (1), Małopolska province (1), Sosnowiec (1), Aveiro (1), Cávado (1), Alicante (1), Barcelona (1), Huelva (1), Madrid (1), Valencia (2) | Austria (1), Czech Republic (1), Denmark (4), France (1), Germany (2), Greece (1), Italy (4), Poland (2), Portugal (2), Spain (6) |
| Environment and Air Quality | Graz (1), Vienna (1), Antwerp (4), Liege (1), Sofia (1), Dubrovnik (1), Brno (1), Aarhus (2), Copenhagen (1), Helsinki (2), Lyon (1), Nancy (1), Berlin (2), Ruhr Valley (1), Stuttgart (1), Athens (1), Elefsina (1), Igoumenitsa (1), Patras (1), Thessaloniki (1), Szeged (1), Dublin (1), Bologna (1), Campania Region (1), Cosenza (1), Florence (1), L’Aquila (1), Osmannoro (1), Pavia (1), Piedmont (1), Rome (1), Syracuse (1), Terni (1), Tuscany Region (1), Amsterdam (1), Krakow (1), Zabrze (1), Paredes (1), Bucharest (1), Lučenec (1), Krvavec (1), Cartagena (1), Coruña (1), Galicia (1), Huelva (1), Jaén (1), Llíria (1), Madrid (4), Malaga (2), Murcia (1), San Sebastián (1), Santander (1), Vitoria-Gasteiz (1), Malmö (2), Örebro (1), Uppsala (1) | Austria (2), Belgium (5), Bulgaria (1), Croatia (1), Czech Republic (1), Denmark (3), Finland (2), France (2), Germany (4), Greece (5), Hungary (1), Ireland (1), Italy (12), Netherlands (1), Poland (2), Portugal (1), Romania (1), Slovakia (1), Slovenia (1), Spain (16), Sweden (4) |
| Waste | Flanders Region (1), Hamburg (1), Regensburg (1), Bari (2), Genoa (1), Prato (1), Vidusdaugavas Region (1), Luxembourg (1), Porto (2), Oradea (1), Bilbao (1), Cartagena (1), Malaga (2), Stockholm (1) | Belgium (1), Germany (2), Italy (4), Latvia (1), Luxembourg (1), Portugal (2), Romania (1), Spain (4), Sweden (1) |
| Energy and Lighting | Graz (4), Linz (1), Salzburg (1), Vienna (2), Villach (1), Leuze (1), Sisak (1), Sveti Križ Začretje (1), Nicosia (1), Jeseník (1), Aarhus (1), Copenhagen (3), Sønderborg (1), Espoo (1), Lorraine Region (1), Lyon (1), Saint-Nazaire (1), Berlin (1), Cologne (1), Dortmund (1), Hamburg (1), Ludwigsburg (1), Trikala (1), Budapest (1), Altavilla Silentina (1), Bagheria (1), Bari (5), Bolzano (3), Campania Region (1), Cesena (1), Cosenza (1), Cuneo (1), Florence (1), Genoa (1), Lazio (1), Milan (3), Naples (1), Padova (1), Palermo (1), Savona (5), Terni (1), Trento (1), Vallelunga Pratameno (1), Luxembourg (1), Amsterdam (1), Apeldoorn (1), Eindhoven (1), Rotterdam (2), Zaanstad (1), Bydgoszcz (1), Gdańsk (1), Krakow (2), Bragança (1), Coimbra (1), Evora (4), Lisbon (1), Porto (1), Bucharest (1), Iasi (2), Ávila (1), Barcelona (4), Bilbao (1), Girona (1), Madrid (1), Malaga (4), Oviedo (2), Santiago de Compostela (2), Soria (1), Valladolid (7), Eskilstuna (1), Gothenburg (2), Malmö (3), Skellefteå (1), Stockholm (2) | Austria (9), Belgium (1), Croatia (2), Cyprus (1), Czech Republic (1), Denmark (5), Finland (1), France (3), Germany (5), Greece (1), Hungary (1), Italy (31), Luxembourg (1), Netherlands (6), Poland (4), Portugal (8), Romania (3), Spain (17), Sweden (9) |
| Strategy and Governance | Vienna (4), Brno (1), Karvina (1), Prague (1), Uherske Hradiste (1), Zlín (1), Helsinki (1), Oulu (3), Tampere (1), Vaasa (1), Lyon (1), Hamburg (1), Leipzig (1), Munich (1), Trikala (1), Dublin (1), Basilicata (1), Milan (3), Turin (4), Amsterdam (3), Rotterdam (1), Utrecht (1), Gdańsk (1), Katowice (1), Sandomierz (1), Warsaw (1), Lisbon (1), Banská Bystrica (1), Barcelona (7), Bilbao (1), Madrid (1), Santander (1), Valladolid (2), Stockholm (1), Växjö (1) | Austria (4), Czech Republic (5), Finland (6), France (1), Germany (3), Greece (1), Ireland (1), Italy (8), Netherlands (5), Poland (4), Portugal (1), Slovakia (1), Spain (12), Sweden (2) |
| Urban Planning | Graz (2), Vienna (3), Antwerp (1), Brussels (1), Wallonia (2), Brno (9), Karlovy Vary (1), Prague (1), Aarhus (2), Sønderborg (1), Talinn (1), Tartu (1), Helsinki (3), Lohja (1), Tuusula (1), Paris (1), Bonn (2), Herrenberg (1), Leipzig (1), Ludwigsburg (1), Nuremberg (1), Athens (1), Mykonos (1), Thessaloniki (1), Dublin (3), Limerick (1), Bergamo (1), Brescia (2), Cagliari (3), Catania (1), Florence (1), Iglesias (1), Matera (1), Milan (1), Naples (1), Pavia (1), Rome (2), Trento (1), Trieste (1), Turin (1), Luxembourg (2), Amsterdam (2), Plock (1), TriCity (1), Żuromin (1), Algarve (1), Braga (1), Lisbon (1), Porto (1), Trenčín (1), Alicante (1), Elda (1), Girona (1), Madrid (1), Rois (1), Santander (1), Vitoria-Gasteiz (1), Zaragoza (1), Stockholm (9) | Austria (5), Belgium (4), Czech Republic (3), Denmark (3), Estonia (2), Finland (5), France (1), Germany (7), Greece (3), Ireland (4), Italy (18), Luxembourg (2), Netherlands (2), Poland (3), Portugal (4), Slovakia (1), Spain (8), Sweden (2) |
| Culture, Tourism and Heritage | Graz (1), Varna (1), Usti nad Labem (1), Aalborg (1), Les Orres (1), Hamburg (1), Karlsruhe (1), Athens (1), Budapest (1), Bologna (1), Cagliari (3), Campania Region (1), Cosenza (1), L’Aquila (3), Madonna di Campiglio (1), Milan (1), Naples (1), Salerno (1), Sulcis Iglesiente—Guspinese (1), Sutri (1), Trento (1), Turin (1), Den Bosch (1), Bragança (1), Lisbon (2), Madeira (1), Porto (2), Brasov (1), Bratislava (1), Komárno (1), Lučenec (1), Ávila (1), Barcelona (1), Donostia-San Sebastián (1), Madrid (1), Malaga (1), Tarragona (1), Valencia (3) | Austria (1), Bulgaria (1), Czech Republic (1), Denmark (1), France (1), Germany (2), Greece (1), Hungary (1), Italy (17), Netherlands (1), Portugal (6), Romania (1), Slovakia (3), Spain (9) |
| Rural and Agriculture | Schneebergland (1), Nicosia (1), Brandenburg (1), Taranto (1), Granada (1) | Austria (1), Cyprus (1), Germany (1), Italy (1), Spain (1) |
| Sport | Dublin (1), Cagliari (1), Pisa (1) | Ireland (1), Italy (2) |
| Smart City Foundations | Vienna (2), Flanders Region (1), Ghent (2), Brno (1), Usti nad Labem (1), Helsinki (1), Berlin (1), Hamburg (2), Main (1), Heraklion (1), Region of Elefsina (1), Trikala (1), Bari (1), Genoa (1), Milan (1), Turin (2), Amsterdam (2), Cascais (1), Barcelona (4), Sant Cugat del Vallès (1), Santander (1), Valladolid (2), Gothenburg (1) | Austria (2), Belgium (3), Czech Republic (2), Finland (1), Germany (4), Greece (3), Italy (5), Netherlands (2), Portugal (1), Spain (8), Sweden (1) |
| Digitization & Interoperability | Graz (1), Vienna (2), Antwerp (1), Brussels (1), Flanders Region (2), Ruse (1), Sofia (1), Dubrovnik (1), Nicosia (1), Brno (1), Moravia Silesian (1), Aarhus (1), Copenhagen (1), Talinn (4), Tartu (1), Espoo (1), Hämeenlinna (1), Helsinki (4), Tampere (2), Lyon (1), Nantes (1), Nice (2), Paris (1), Rennes (1), Berlin (2), Freiburg (1), Hamburg (1), Lübeck (1), Munich (1), Munzingen (1), Ruhr Valley (1), Vaihingen (1), Kavala (1), Papagou (1), Trikala (1), Dublin (4), Bologna (2), Cagliari (1), Catania (2), Florence (2), Lecce (1), Merano (1), Messina (1), Milan (3), South Tyrol (1), Turin (2), Venice (1), Luxembourg (2), Amsterdam (1), Eindhoven (2), Krakow (1), Rzeszów (1), Košice (1), Barcelona (1), Béjar (1), Galicia (2), Granada (1), Valladolid (1), Vitoria-Gasteiz (2), Zaragoza (1), Karlshamn (1), Stockholm (1), Uppsala (1) | Austria (3), Belgium (4), Bulgaria (2), Croatia (1), Cyprus (1), Czech Republic (2), Denmark (2), Estonia (5), Finland (8), France (6), Germany (9), Greece (3), Ireland (4), Italy (17), Luxembourg (2), Netherlands (3), Poland (2), Slovakia (1), Spain (9), Sweden (3) |
| Privacy, Security and Safety | Vienna (1), Nicosia (1), Ostrava (1), Tampere (1), Nice (1), Lesvos (1), Budapest (1), Amsterdam (2), Eindhoven (1), Rotterdam (2), Porto (1), Ljubljana (1), Barcelona (2) | Austria (1), Cyprus (1), Czech Republic (1), Finland (1), France (1), Greece (1), Hungary (1), Netherlands (5), Portugal (1), Slovenia (1), Spain (2) |
| Health and Wellbeing | Prague (1), Aarhus (1), Frankfurt (1), Bologna (1), Lecce (1), Messina (1), Sardinian Region (1), Trento (1), Lisbon (1), Brasov (1), Jaén (1), Stockholm (2) | Czech Republic (1), Denmark (1), Germany (1), Italy (5), Portugal (1), Romania (1), Spain (1), Sweden (2) |
| Infrastructure and Communication Networks | Antwerp (3), Leuven (1), Bol (1), Osijek (1), Brno (2), Aalborg (1), Oulu (1), Grenoble (1), Lille (1), Lyon (1), Dortmund (1), Karlsruhe (1), Mainau-Lake Constance (1), Heraklion (1), Dublin (1), Bologna (1), Florence (1), Padova (2), Palermo (2), Prato (1), Salerno (1), Riga (1), TriCity (1), Warsaw (1), Aveiro (1), Castelo Branco (2), Lagoa (1), Porto (1), Bucharest (1), Bratislava (1), Logatec (1), Coruña (1), Gran Canaria Island (1), Madrid (1), Malaga (1), Pamplona (1), Santander (3), Santiago de Compostela (1), Valencia (2), Valladolid (1), Skellefteå (2) | Belgium (4), Croatia (2), Czech Republic (2), Denmark (1), Finland (1), France (3), Germany (3), Greece (1), Ireland (1), Italy (8), Latvia (1), Poland (2), Portugal (5), Romania (1), Slovakia (1), Slovenia (1), Spain (12), Sweden (2) |
| Buildings and Housing | Vienna (1), Seraing (1), Havířov (1), Nordhavn (1), Tartu (1), Grenoble (1), Nancy (1), Hannover (1), Munich (1), Vaihingen (1), Miskolc (1), Brescia (1), Gioia Tauro (1), Milan (1), Palermo (1), Pescara (1), Settimo Torinese (1), Turin (1), Amsterdam (1), Lisbon (2), Alba Iulia (1), Galati (1), Betanzos (1), Växjö (1) | Austria (1), Belgium (1), Czech Republic (1), Denmark (1), Estonia (1), France (2), Germany (3), Hungary (1), Italy (7), Netherlands (1), Portugal (2), Romania (2), Spain (1), Sweden (1) |
| Traffic | Vienna (1), Nicosia (2), Aarhus (1), Odense (1), Oulu (1), Lyon (2), Marseille (1), Nancy (1), Paris (1), Augsburg (1), Cologne (1), Hamburg (2), Patras (1), Thessaloniki (2), Budapest (2), Dublin (4), Catania (1), Florence (2), Milan (2), Modena (1), Turin (1), Jelgava (2), Delft (1), Enschede (2), Bialystok (1), Aveiro (1), Braga (1), Porto (4), Barcelona (1), Madrid (2), Malaga (1), Murcia (1), Navarre (1), Santander (2), Zaragoza (1) | Austria (1), Cyprus (2), Denmark (2), Finland (1), France (5), Germany (4), Greece (3), Hungary (2), Ireland (4), Italy (6), Latvia (2), Netherlands (3), Poland (1), Portugal (6), Spain (9) |
| Parking | Aarhus (1), Mainz (1), Milan (1), Jelgava (1), Warsaw (1), Žilina (1), Barcelona (1), Malaga (2), Santander (2), Seville (1), Zaragoza (1) | Denmark (1), Germany (1), Italy (1), Latvia (1), Poland (1), Slovakia (1), Spain (7) |
| Mobility and Transportation | Vienna (2), Flanders Region (1), Mons (3), Split (1), Limassol (2), Brno (1), Lovosice (1), Prague (2), Aarhus (1), Tartu (1), Vaasa (1), Lille (1), Paris (1), Berlin (1), Erfurt (1), Munich (2), Ruhr Valley (1), Heraklion (1), Thessaloniki (1), Trikala (1), Volos (1), Dublin (1), Apulia Region (1), Bologna (1), Cagliari (2), Catania (1), L’Aquila (1), Milan (2), Naples (1), Parma (1), Pavia (1), Piedmont (2), Pisa (1), Rome (1), Siena (1), Trento (2), Turin (4), Tuscany Region (1), Riga (1), Kaunas (1), Amsterdam (1), Krakow (1), Warsaw (4), Wroclaw (1), Zielona Góra (1), Águeda (3), Aveiro (1), Covilhã (1), Lisbon (1), Porto (1), Viana do Castelo (1), Bratislava (3), Žilina (2), Ljubljana (1), Barcelona (3), Bilbao (1), Castelló de la Plana (1), Galicia (1), Madrid (6), Malaga (2), Pamplona (1), Santander (2), Gothenburg (1) | Austria (2), Belgium (4), Croatia (1), Cyprus (2), Czech Republic (4), Denmark (1), Estonia (1), Finland (1), France (2), Germany (5), Greece (4), Ireland (1), Italy (23), Latvia (1), Lithuania (1), Netherlands (1), Poland (7), Portugal (8), Slovakia (5), Slovenia (1), Spain (17), Sweden (1) |
| Logistics | Brussels (1), Region of North Jutland (1), Helsinki (1), Baden-Württemberg (1), Cologne (1), Erfurt (2), Heilbronn (1), Basilicata (1), Calabria Region (1), Milan (1), Helmond (1), Covilhã (1), Pamplona (1) | Belgium (1), Denmark (1), Finland (1), Germany (5), Italy (3), Netherlands (1), Portugal (1), Spain (1) |
| Community, Participation & Inclusion | Vienna (2), Brussels (1), Ghent (1), Knokke-Heist (1), La Louvière (1), Namur (1), Koprivnica (1), Rijeka (1), Limassol (1), Brno (1), Usti nad Labem (1), Zlín (1), Aarhus (2), Copenhagen (1), Espoo (1), Helsinki (2), Oulu (3), Region of Häme (1), Tampere (1), Lyon (3), Cologne (1), Darmstadt (1), Essen (1), Hamburg (2), Munich (1), Stuttgart (1), Heraklion (1), Island of Kos (1), Kavala (1), Korydallos (1), Samos Island (1), Thessaloniki (1), Trikala (2), Budapest (1), Cork City (1), Dublin (4), Ennis (1), Bologna (1), Cagliari (4), Catania (1), Lombardy Region (1), Milan (3), Montieri (1), Pavia (2), Rome (1), Rovereto (1), Syracuse (1), Turin (3), Riga (1), Amersfoort (1), Amsterdam (4), Eindhoven (3), Schiedam (1), Utrecht (1), Poznań (1), Silesian Province (1), Warsaw (1), Wroclaw (2), Evora (1), Lisbon (3), Paredes (1), Cluj (1), Oradea (1), Bratislava (1), Poprad (1), Žilina (1), Alicante (1), Barcelona (3), Bilbao (1), Guadalajara (1), Huesca (1), Madrid (3), Malaga (1), Murcia (1), San Sebastián (1), Santander (2), Valencia (1), Vitoria-Gasteiz (1), Linköping (1), Luleå (1) | Austria (2), Belgium (5), Croatia (2), Cyprus (1), Czech Republic (3), Denmark (3), Finland (8), France (3), Germany (7), Greece (8), Hungary (1), Ireland (6), Italy (19), Latvia (1), Netherlands (10), Poland (5), Portugal (5), Romania (2), Slovakia (3), Spain (17), Sweden (2) |
| Education | Vienna (1), Prague (1), Aarhus (1), Espoo (1), Düsseldorf (1), Limerick (1), Brescia (1), Genoa (1), Glurns/Glorenza (1), Turin (1), Alba Iulia (1), Barcelona (1), Jaén (1) | Austria (1), Czech Republic (1), Denmark (1), Finland (1), Germany (1), Ireland (1), Italy (4), Romania (1), Spain (2) |
| Economy and Industry | Flanders Region (1), Prague (1), Aarhus (1), Paris (1), Berlin (1), Heraklion (1), Trikala (1), Dublin (2), Emilia-Romagna Region (1), Liguria (1), Rende (1), Turin (1), Utrecht (1), Bialystok (1), Bydgoszcz (1), Czestochowa (1), Águeda (1), Cluj (1), Žilina (1), Ljubljana (1), Madrid (1) | Belgium (1), Czech Republic (1), Denmark (1), France (1), Germany (1), Greece (2), Ireland (2), Italy (4), Netherlands (1), Poland (3), Portugal (1), Romania (1), Slovakia (1), Slovenia (1), Spain (1) |
Appendix C
| A | B | C | D | E | F | G | H | I | J | K | L | M | N | O | P | Q | R | S | T | U | V | Total | Categories | |
|---|---|---|---|---|---|---|---|---|---|---|---|---|---|---|---|---|---|---|---|---|---|---|---|---|
| Austria | 1 | 2 | 0 | 9 | 4 | 5 | 1 | 1 | 0 | 2 | 3 | 1 | 0 | 0 | 1 | 1 | 0 | 2 | 0 | 2 | 1 | 0 | 36 | 15 |
| Belgium | 0 | 5 | 1 | 1 | 0 | 4 | 0 | 0 | 0 | 3 | 4 | 0 | 0 | 4 | 1 | 0 | 0 | 4 | 1 | 5 | 0 | 1 | 34 | 12 |
| Bulgaria | 0 | 1 | 0 | 0 | 0 | 0 | 1 | 0 | 0 | 0 | 2 | 0 | 0 | 0 | 0 | 0 | 0 | 0 | 0 | 0 | 0 | 0 | 4 | 3 |
| Croatia | 0 | 1 | 0 | 2 | 0 | 0 | 0 | 0 | 0 | 0 | 1 | 0 | 0 | 2 | 0 | 0 | 0 | 1 | 0 | 2 | 0 | 0 | 9 | 6 |
| Cyprus | 0 | 0 | 0 | 1 | 0 | 0 | 0 | 1 | 0 | 0 | 1 | 1 | 0 | 0 | 0 | 2 | 0 | 2 | 0 | 1 | 0 | 0 | 9 | 7 |
| Czech Rep. | 1 | 1 | 0 | 1 | 5 | 3 | 1 | 0 | 0 | 2 | 2 | 1 | 1 | 2 | 1 | 0 | 0 | 4 | 0 | 3 | 1 | 1 | 30 | 16 |
| Denmark | 4 | 3 | 0 | 5 | 0 | 3 | 1 | 0 | 0 | 0 | 2 | 0 | 1 | 1 | 1 | 2 | 1 | 1 | 1 | 3 | 1 | 1 | 31 | 16 |
| Estonia | 0 | 0 | 0 | 0 | 0 | 2 | 0 | 0 | 0 | 0 | 5 | 0 | 0 | 0 | 1 | 0 | 0 | 1 | 0 | 0 | 0 | 0 | 9 | 4 |
| Finland | 0 | 2 | 0 | 1 | 6 | 5 | 0 | 0 | 0 | 1 | 8 | 1 | 0 | 1 | 0 | 1 | 0 | 1 | 1 | 8 | 1 | 0 | 37 | 13 |
| France | 1 | 2 | 0 | 3 | 1 | 1 | 1 | 0 | 0 | 0 | 6 | 1 | 0 | 3 | 2 | 5 | 0 | 2 | 0 | 3 | 0 | 1 | 32 | 14 |
| Germany | 2 | 4 | 2 | 5 | 3 | 7 | 2 | 1 | 0 | 4 | 9 | 0 | 1 | 3 | 3 | 4 | 1 | 5 | 5 | 7 | 1 | 1 | 70 | 20 |
| Greece | 1 | 5 | 0 | 1 | 1 | 3 | 1 | 0 | 0 | 3 | 3 | 1 | 0 | 1 | 0 | 3 | 0 | 4 | 0 | 8 | 0 | 2 | 37 | 14 |
| Hungary | 0 | 1 | 0 | 1 | 0 | 0 | 1 | 0 | 0 | 0 | 0 | 1 | 0 | 0 | 1 | 2 | 0 | 0 | 0 | 1 | 0 | 0 | 8 | 7 |
| Ireland | 0 | 1 | 0 | 0 | 1 | 4 | 0 | 0 | 1 | 0 | 4 | 0 | 0 | 1 | 0 | 4 | 0 | 1 | 0 | 6 | 1 | 2 | 26 | 11 |
| Italy | 4 | 12 | 4 | 31 | 8 | 18 | 17 | 1 | 2 | 5 | 17 | 0 | 5 | 8 | 7 | 6 | 1 | 23 | 3 | 19 | 4 | 4 | 199 | 21 |
| Latvia | 0 | 0 | 1 | 0 | 0 | 0 | 0 | 0 | 0 | 0 | 0 | 0 | 0 | 1 | 0 | 2 | 1 | 1 | 0 | 1 | 0 | 0 | 7 | 6 |
| Lithuania | 0 | 0 | 0 | 0 | 0 | 0 | 0 | 0 | 0 | 0 | 0 | 0 | 0 | 0 | 0 | 0 | 0 | 1 | 0 | 0 | 0 | 0 | 1 | 1 |
| Luxembourg | 0 | 0 | 1 | 1 | 0 | 2 | 0 | 0 | 0 | 0 | 2 | 0 | 0 | 0 | 0 | 0 | 0 | 0 | 0 | 0 | 0 | 0 | 6 | 4 |
| Malta 1 | 0 | 0 | 0 | 0 | 0 | 0 | 0 | 0 | 0 | 0 | 0 | 0 | 0 | 0 | 0 | 0 | 0 | 0 | 0 | 0 | 0 | 0 | 0 | 0 |
| Netherlands | 0 | 1 | 0 | 6 | 5 | 2 | 1 | 0 | 0 | 2 | 3 | 5 | 0 | 0 | 1 | 3 | 0 | 1 | 1 | 10 | 0 | 1 | 42 | 14 |
| Poland | 2 | 2 | 0 | 4 | 4 | 3 | 0 | 0 | 0 | 0 | 2 | 0 | 0 | 2 | 0 | 1 | 1 | 7 | 0 | 5 | 0 | 3 | 36 | 12 |
| Portugal | 2 | 1 | 2 | 8 | 1 | 4 | 6 | 0 | 0 | 1 | 0 | 1 | 1 | 5 | 2 | 6 | 0 | 8 | 1 | 5 | 0 | 1 | 55 | 17 |
| Romania | 0 | 1 | 1 | 3 | 0 | 0 | 1 | 0 | 0 | 0 | 0 | 0 | 1 | 1 | 2 | 0 | 0 | 0 | 0 | 2 | 1 | 1 | 14 | 10 |
| Slovakia | 0 | 1 | 0 | 0 | 1 | 1 | 3 | 0 | 0 | 0 | 1 | 0 | 0 | 1 | 0 | 0 | 1 | 5 | 0 | 3 | 0 | 1 | 18 | 10 |
| Slovenia | 0 | 1 | 0 | 0 | 0 | 0 | 0 | 0 | 0 | 0 | 0 | 1 | 0 | 1 | 0 | 0 | 0 | 1 | 0 | 0 | 0 | 1 | 5 | 5 |
| Spain | 6 | 16 | 4 | 17 | 12 | 8 | 9 | 1 | 0 | 8 | 9 | 2 | 1 | 12 | 1 | 9 | 7 | 17 | 1 | 17 | 2 | 1 | 160 | 21 |
| Sweden | 0 | 4 | 1 | 9 | 2 | 2 | 0 | 0 | 0 | 1 | 3 | 0 | 2 | 2 | 1 | 0 | 0 | 1 | 0 | 2 | 0 | 0 | 30 | 12 |
| Total | 24 | 67 | 17 | 109 | 54 | 77 | 46 | 5 | 3 | 32 | 87 | 16 | 13 | 51 | 25 | 51 | 13 | 93 | 14 | 113 | 13 | 22 | ||
| Countries | 10 | 21 | 9 | 19 | 14 | 18 | 14 | 5 | 2 | 11 | 20 | 11 | 8 | 18 | 14 | 15 | 7 | 22 | 8 | 21 | 9 | 15 |
Appendix D

| Component | ||||
|---|---|---|---|---|
| 1 | 2 | 3 | 4 | |
| Economy and Industry(%) | 0.850 | |||
| Buildings and Housing(%) | 0.769 | |||
| Mobility and Transportation(%) | 0.761 | |||
| Strategy and Governance(%) | −0.558 | |||
| Culture, Tourism and Heritage(%) | −0.456 | |||
| Energy & Lighting(%) | ||||
| Urban Planning(%) | 0.856 | |||
| Digitization & Interoperability(%) | 0.652 | |||
| Waste(%) | 0.616 | |||
| Environment and Air Quality(%) | −0.521 | |||
| Community, Participation & Inclusion(%) | −0.439 | |||
| Water and Irrigation(%) | ||||
| Parking(%) | 0.978 | |||
| Smart City Foundations(%) | 0.954 | |||
| Traffic(%) | 0.690 | |||
| Health and Wellbeing(%) | −0.671 | |||
| Infrastructure and Comm(%) | −0.575 | |||
| Rural and Agriculture(%) | 0.549 | |||
| Privacy, Security and Safety(%) | 0.505 | |||
| Education(%) | −0.503 | |||
| Logistics(%) | −0.443 | |||
| Sport(%) | ||||
| Total Variance Explained | 14.353 | 13.883 | 11.874 | 10.354 |


Appendix E
| Descriptions | |||||
|---|---|---|---|---|---|
| N | Mean | Minimum | Maximum | ||
| Number of Municipalities | 1 | 4 | 10,777.8 | 2098.00 | 35,357.00 |
| 2 | 8 | 322.0 | 31.00 | 589.00 | |
| 3 | 11 | 1235.1 | 60.00 | 6258.00 | |
| 4 | 1 | 11,054.0 | 11,054.00 | 11,054.00 | |
| 5 | 1 | 7960.0 | 7960.00 | 7960.00 | |
| 6 | 1 | 380.0 | 380.00 | 380.00 | |
| 7 | 1 | 8124.0 | 8124.00 | 8124.00 | |
| Total | 27 | 3214.5 | 31.00 | 35,357.00 | |
| Area (km2) | 1 | 4 | 282,356.5 | 82,409.00 | 647,795.00 |
| 2 | 8 | 96,037.9 | 5695.00 | 303,892.00 | |
| 3 | 11 | 94,445.5 | 315.00 | 407,340.00 | |
| 4 | 1 | 357,376.0 | 357,376.00 | 357,376.00 | |
| 5 | 1 | 295,114.0 | 295,114.00 | 295,114.00 | |
| 6 | 1 | 33,688.0 | 33,688.00 | 33,688.00 | |
| 7 | 1 | 504,712.0 | 504,712.00 | 50,4712.00 | |
| Total | 27 | 152,871.1 | 315.00 | 647,795.00 | |
| Inhabitants | 1 | 4 | 30,883.3 | 8773.00 | 66,989.00 |
| 2 | 8 | 5808.5 | 855.00 | 11,352.00 | |
| 3 | 11 | 6272.1 | 460.00 | 19,644.00 | |
| 4 | 1 | 82,522.0 | 82,522.00 | 82,522.00 | |
| 5 | 1 | 60,589.0 | 60,589.00 | 60,589.00 | |
| 6 | 1 | 17,082.0 | 17,082.00 | 17,082.00 | |
| 7 | 1 | 46,528.0 | 46,528.00 | 46,528.00 | |
| Total | 27 | 16,508.0 | 460.00 | 82,522.00 | |
| GDP (billion EUR) | 1 | 4 | 811.5 | 123.50 | 2287.60 |
| 2 | 8 | 160.0 | 19.20 | 437.20 | |
| 3 | 11 | 145.4 | 11.10 | 477.90 | |
| 4 | 1 | 3263.4 | 3263.40 | 3263.40 | |
| 5 | 1 | 1716.9 | 1716.90 | 1716.90 | |
| 6 | 1 | 733.2 | 733.20 | 733.20 | |
| 7 | 1 | 1163.7 | 1163.70 | 1163.70 | |
| Total | 27 | 481.5 | 11.10 | 3263.40 | |
| GDP per capita (EUR) | 1 | 4 | 25,275.3 | 12,261.00 | 42,086.00 |
| 2 | 8 | 26,575.4 | 7101.00 | 61,900.00 | |
| 3 | 11 | 30,096.8 | 9563.00 | 93,754.00 | |
| 4 | 1 | 39,545.0 | 39,545.00 | 39,545.00 | |
| 5 | 1 | 28,337.0 | 28,337.00 | 28,337.00 | |
| 6 | 1 | 42,922.0 | 42,922.00 | 42,922.00 | |
| 7 | 1 | 25,010.0 | 25,010.00 | 25,010.00 | |
| Total | 27 | 28,910.5 | 7101.00 | 93,754.00 | |
| Public Budget Balance (billion EUR) | 1 | 4 | −174.2 | −593.00 | −2.60 |
| 2 | 8 | −3.2 | −13.00 | 1.50 | |
| 3 | 11 | −8.7 | −57.00 | 8.00 | |
| 4 | 1 | 412.0 | 412.00 | 412.00 | |
| 5 | 1 | −397.0 | −397.00 | −397.00 | |
| 6 | 1 | 80.0 | 80.00 | 80.00 | |
| 7 | 1 | −362.0 | −362.00 | −362.00 | |
| Total | 27 | −40.2 | −593.00 | 412.00 | |
| Public Budget Balance (% GDP) | 1 | 4 | 0.0 | −0.03 | −0.01 |
| 2 | 8 | 0.0 | −0.01 | 0.02 | |
| 3 | 11 | 0.0 | −0.03 | 0.04 | |
| 4 | 1 | 0.0 | 0.01 | 0.01 | |
| 5 | 1 | 0.0 | −0.02 | −0.02 | |
| 6 | 1 | 0.0 | 0.01 | 0.01 | |
| 7 | 1 | 0.0 | −0.03 | −0.03 | |
| Total | 27 | 0.0 | −0.03 | 0.04 | |
| Debt (billion EUR) | 1 | 4 | 709.7 | 90.50 | 2218.40 |
| 2 | 8 | 303.0 | 10.80 | 1373.00 | |
| 3 | 11 | 71.2 | 2.10 | 242.60 | |
| 4 | 1 | 2092.6 | 2092.60 | 2092.60 | |
| 5 | 1 | 2263.1 | 2263.10 | 2263.10 | |
| 6 | 1 | 416.1 | 416.10 | 416.10 | |
| 7 | 1 | 1144.3 | 1144.30 | 1144.30 | |
| Total | 27 | 443.0 | 2.10 | 2263.10 | |
| Debt (% GDP) | 1 | 4 | 0.7 | 0.51 | 0.97 |
| 2 | 8 | 0.8 | 0.25 | 1.79 | |
| 3 | 11 | 0.5 | 0.09 | 1.26 | |
| 4 | 1 | 0.6 | 0.64 | 0.64 | |
| 5 | 1 | 1.3 | 1.32 | 1.32 | |
| 6 | 1 | 0.6 | 0.57 | 0.57 | |
| 7 | 1 | 1.0 | 0.98 | 0.98 | |
| Total | 27 | 0.7 | 0.09 | 1.79 | |
| Public Investment (EUR billion) | 1 | 4 | 28.3 | 5.10 | 79.60 |
| 2 | 8 | 4.1 | 0.50 | 9.80 | |
| 3 | 11 | 5.0 | 0.20 | 21.20 | |
| 4 | 1 | 68.9 | 68.90 | 68.90 | |
| 5 | 1 | 34.3 | 34.30 | 34.30 | |
| 6 | 1 | 23.6 | 23.60 | 23.60 | |
| 7 | 1 | 24.0 | 24.00 | 24.00 | |
| Total | 27 | 13.0 | 0.20 | 79.60 | |
| Public Investment (EUR per capita) | 1 | 4 | 857.5 | 450.00 | 1275.00 |
| 2 | 8 | 703.4 | 124.00 | 1523.00 | |
| 3 | 11 | 1076.4 | 270.00 | 3758.00 | |
| 4 | 1 | 834.0 | 834.00 | 834.00 | |
| 5 | 1 | 566.0 | 566.00 | 566.00 | |
| 6 | 1 | 1380.0 | 1380.00 | 1380.00 | |
| 7 | 1 | 516.0 | 516.00 | 516.00 | |
| Total | 27 | 896.0 | 124.00 | 3758.00 | |
| Public Investment (% GDP) | 1 | 4 | 0.0 | 0.03 | 0.04 |
| 2 | 8 | 0.0 | 0.02 | 0.04 | |
| 3 | 11 | 0.0 | 0.02 | 0.06 | |
| 4 | 1 | 0.0 | 0.02 | 0.02 | |
| 5 | 1 | 0.0 | 0.02 | 0.02 | |
| 6 | 1 | 0.0 | 0.03 | 0.03 | |
| 7 | 1 | 0.0 | 0.02 | 0.02 | |
| Total | 27 | 0.0 | 0.02 | 0.06 | |
| Public Revenue (EUR billion) | 1 | 4 | 412.6 | 55.00 | 1232.60 |
| 2 | 8 | 70.6 | 7.70 | 224.50 | |
| 3 | 11 | 65.0 | 4.50 | 240.60 | |
| 4 | 1 | 1474.6 | 1474.60 | 1474.60 | |
| 5 | 1 | 799.9 | 799.90 | 799.90 | |
| 6 | 1 | 320.0 | 320.00 | 320.00 | |
| 7 | 1 | 441.1 | 441.10 | 441.10 | |
| Total | 27 | 221.0 | 4.50 | 1474.60 | |
| Public Revenue (EUR per capita) | 1 | 4 | 12,305.8 | 4850.00 | 20,358.00 |
| 2 | 8 | 10,931.6 | 2567.00 | 21,592.00 | |
| 3 | 11 | 13,397.6 | 2913.00 | 41,599.00 | |
| 4 | 1 | 17,869.0 | 17,869.00 | 17,869.00 | |
| 5 | 1 | 13,202.0 | 13,202.00 | 13,202.00 | |
| 6 | 1 | 18,735.0 | 18,735.00 | 18,735.00 | |
| 7 | 1 | 9480.0 | 9480.00 | 9480.00 | |
| Total | 27 | 12,716.1 | 2567.00 | 41,599.00 | |
| Public Revenue (% GDP) | 1 | 4 | 0.5 | 0.40 | 0.54 |
| 2 | 8 | 0.4 | 0.26 | 0.53 | |
| 3 | 11 | 0.4 | 0.31 | 0.53 | |
| 4 | 1 | 0.5 | 0.45 | 0.45 | |
| 5 | 1 | 0.5 | 0.47 | 0.47 | |
| 6 | 1 | 0.4 | 0.44 | 0.44 | |
| 7 | 1 | 0.4 | 0.38 | 0.38 | |
| Total | 27 | 0.4 | 0.26 | 0.54 | |
| Public Tax Revenue (EUR Billion) | 1 | 4 | 297.7 | 98.00 | 681.00 |
| 2 | 8 | 42.9 | 4.90 | 134.70 | |
| 3 | 11 | 45.7 | 3.00 | 196.10 | |
| 4 | 1 | 773.3 | 773.30 | 773.30 | |
| 5 | 1 | 502.6 | 502.60 | 502.60 | |
| 6 | 1 | 180.2 | 180.20 | 180.20 | |
| 7 | 1 | 259.4 | 259.40 | 259.40 | |
| Total | 27 | 139.0 | 3.00 | 773.30 | |
| Public Tax Revenue (EUR per capita) | 1 | 4 | 6846.0 | 2580.00 | 11,424.00 |
| 2 | 8 | 6759.8 | 1511.00 | 12,650.00 | |
| 3 | 11 | 8982.8 | 1563.00 | 25,771.00 | |
| 4 | 1 | 9371.0 | 9371.00 | 9371.00 | |
| 5 | 1 | 8296.0 | 8296.00 | 8296.00 | |
| 6 | 1 | 10,551.0 | 10,551.00 | 10,551.00 | |
| 7 | 1 | 5574.0 | 5574.00 | 5574.00 | |
| Total | 27 | 7928.3 | 1511.00 | 25,771.00 | |
| Public Tax Revenue (% GDP) | 1 | 4 | 0.3 | 0.21 | 0.30 |
| 2 | 8 | 0.3 | 0.19 | 0.31 | |
| 3 | 11 | 0.3 | 0.16 | 0.46 | |
| 4 | 1 | 0.2 | 0.24 | 0.24 | |
| 5 | 1 | 0.3 | 0.29 | 0.29 | |
| 6 | 1 | 0.2 | 0.25 | 0.25 | |
| 7 | 1 | 0.2 | 0.22 | 0.22 | |
| Total | 27 | 0.3 | 0.16 | 0.46 | |
| Public Tax Revenue (% Public Revenue) | 1 | 4 | 0.6 | 0.53 | 0.57 |
| 2 | 8 | 0.6 | 0.57 | 0.73 | |
| 3 | 11 | 0.6 | 0.46 | 0.88 | |
| 4 | 1 | 0.5 | 0.52 | 0.52 | |
| 5 | 1 | 0.6 | 0.63 | 0.63 | |
| 6 | 1 | 0.6 | 0.56 | 0.56 | |
| 7 | 1 | 0.6 | 0.59 | 0.59 | |
| Total | 27 | 0.6 | 0.46 | 0.88 | |
| European Structural and Investment Funds (2014–2020 EUR billions) | 1 | 4 | 35,830.8 | 4923.00 | 86,112.00 |
| 2 | 8 | 7300.6 | 917.00 | 21,382.00 | |
| 3 | 11 | 10,797.6 | 140.00 | 30,883.00 | |
| 4 | 1 | 27,935.0 | 27,935.00 | 27,935.00 | |
| 5 | 1 | 44,656.0 | 44,656.00 | 44,656.00 | |
| 6 | 1 | 1947.0 | 1947.00 | 1947.00 | |
| 7 | 1 | 39,835.0 | 39,835.00 | 39,835.00 | |
| Total | 27 | 16,106.5 | 140.00 | 86,112.00 | |
| European Structural and Investment Funds (2014–2020 EUR per capita) | 1 | 4 | 1447.3 | 407.00 | 2553.00 |
| 2 | 8 | 1443.8 | 242.00 | 2889.00 | |
| 3 | 11 | 1820.6 | 237.00 | 3362.00 | |
| 4 | 1 | 339.0 | 339.00 | 339.00 | |
| 5 | 1 | 737.0 | 737.00 | 737.00 | |
| 6 | 1 | 114.0 | 114.00 | 114.00 | |
| 7 | 1 | 856.0 | 856.00 | 856.00 | |
| Total | 27 | 1459.7 | 114.00 | 3362.00 | |
| Expenditure (Education) | 1 | 4 | 0.2 | 0.15 | 0.28 |
| 2 | 8 | 0.2 | 0.00 | 0.41 | |
| 3 | 11 | 0.2 | 0.00 | 0.40 | |
| 4 | 1 | 0.2 | 0.21 | 0.21 | |
| 5 | 1 | 0.1 | 0.06 | 0.06 | |
| 6 | 1 | 0.3 | 0.31 | 0.31 | |
| 7 | 1 | 0.2 | 0.19 | 0.19 | |
| Total | 27 | 0.2 | 0.00 | 0.41 | |
| Expenditure (Social Protection) | 1 | 4 | 0.2 | 0.12 | 0.23 |
| 2 | 8 | 0.2 | 0.00 | 0.33 | |
| 3 | 11 | 0.2 | 0.05 | 0.56 | |
| 4 | 1 | 0.3 | 0.28 | 0.28 | |
| 5 | 1 | 0.0 | 0.05 | 0.05 | |
| 6 | 1 | 0.2 | 0.24 | 0.24 | |
| 7 | 1 | 0.1 | 0.07 | 0.07 | |
| Total | 27 | 0.2 | 0.00 | 0.56 | |
| Expenditure (General Services) | 1 | 4 | 0.2 | 0.10 | 0.25 |
| 2 | 8 | 0.2 | 0.05 | 0.41 | |
| 3 | 11 | 0.2 | 0.04 | 0.37 | |
| 4 | 1 | 0.2 | 0.23 | 0.23 | |
| 5 | 1 | 0.2 | 0.15 | 0.15 | |
| 6 | 1 | 0.1 | 0.07 | 0.07 | |
| 7 | 1 | 0.2 | 0.22 | 0.22 | |
| Total | 27 | 0.2 | 0.04 | 0.41 | |
| Expenditure (Health) | 1 | 4 | 0.1 | 0.01 | 0.25 |
| 2 | 8 | 0.1 | 0.00 | 0.26 | |
| 3 | 11 | 0.1 | 0.00 | 0.27 | |
| 4 | 1 | 0.0 | 0.02 | 0.02 | |
| 5 | 1 | 0.5 | 0.48 | 0.48 | |
| 6 | 1 | 0.0 | 0.03 | 0.03 | |
| 7 | 1 | 0.3 | 0.27 | 0.27 | |
| Total | 27 | 0.1 | 0.00 | 0.48 | |
| Expenditure (Economic Affairs) | 1 | 4 | 0.2 | 0.12 | 0.20 |
| 2 | 8 | 0.1 | 0.00 | 0.21 | |
| 3 | 11 | 0.1 | 0.04 | 0.18 | |
| 4 | 1 | 0.1 | 0.11 | 0.11 | |
| 5 | 1 | 0.1 | 0.13 | 0.13 | |
| 6 | 1 | 0.1 | 0.13 | 0.13 | |
| 7 | 1 | 0.1 | 0.10 | 0.10 | |
| Total | 27 | 0.1 | 0.00 | 0.21 | |
| Expenditure (Others) | 1 | 4 | 0.2 | 0.08 | 0.27 |
| 2 | 8 | 0.2 | 0.05 | 0.59 | |
| 3 | 11 | 0.2 | 0.04 | 0.46 | |
| 4 | 1 | 0.2 | 0.15 | 0.15 | |
| 5 | 1 | 0.1 | 0.13 | 0.13 | |
| 6 | 1 | 0.2 | 0.22 | 0.22 | |
| 7 | 1 | 0.1 | 0.15 | 0.15 | |
| Total | 27 | 0.2058 | 0.04 | 0.59 | |
References
- Graham, S. Spaces of surveillant simulation: New technologies, digital representations, and material geographies. Environ. Plan. D Soc. Space 1998, 16, 483–504. [Google Scholar] [CrossRef]
- Crang, M.; Graham, S. Sentient cities ambient intelligence and the politics of urban space. Inf. Commun. Soc. 2007, 10, 789–817. [Google Scholar] [CrossRef]
- Manovich, L. The poetics of augmented space. Vis. Commun. 2006, 5, 219–240. [Google Scholar] [CrossRef]
- Harrison, C.; Donnelly, I.A. A Theory of Smart Cities. In Proceedings of the 55th Annual Meeting of the ISSS, Hull, UK, 17–22 July 2017; Volume 91, pp. 399–404. [Google Scholar]
- Batty, M.; Axhausen, K.W.; Giannotti, F.; Pozdnoukhov, A.; Bazzani, A.; Wachowicz, M.; Ouzounis, G.; Portugali, Y. Smart cities of the future. Eur. Phys. J. Spec. Top. 2012, 214, 481–518. [Google Scholar] [CrossRef]
- Greenfield, A. Against the Smart City: A Pamphlet. This is Part I of “The City is Here to Use”; Do Projects, 2013; Available online: https://www.worldcat.org/pt/title/935510282 (accessed on 18 March 2022).
- Cohen, B. The 3 Generations of Smart Cities. 2015. Available online: https://www.fastcompany.com/3047795/the-3-generations-of-smart-cities (accessed on 18 March 2022).
- Sánchez-Teba, E.M.; Bermúdez-González, G.J. Are Smart-City Projects Citizen-Centered? Soc. Sci. 2019, 8, 309. [Google Scholar] [CrossRef]
- Trencher, G. Technological Forecasting & Social Change Towards the smart city 2.0: Empirical evidence of using smartness as a tool for tackling social challenges. Technol. Forecast. Soc. Chang. 2019, 142, 117–128. [Google Scholar]
- Correia, D.; Teixeira, L. From Smart City 1.0 to Smart City 3.0: Deep Understanding of the Smart City Concept and Evolution. In Smart Cities and Tourism: Co-Creating Experiences, Challenges and Opportunities, 1st ed.; Buhalis, D., Taheri, B., Rahimi, R., Eds.; Goodfellow Publishers Ltd.: London, UK, 2023; p. 43. [Google Scholar]
- Coletta, C.; Evans, L.; Heaphy, L.; Kitchin, R. Creating Smart Cities, 1st ed.; Routledge: London, UK, 2018. [Google Scholar]
- Correia, D.; Teixeira, L.; Marques, J.L. Investigating Smart City Barriers: Contribution of Experts based on a Delphi Analysis. Spat. Plan. Sustain. Dev. 2022, 10, 179–199. [Google Scholar] [CrossRef]
- Moradi, S. The scientometrics of literature on smart cities. Libr. Hi Tech 2020, 38, 385–398. [Google Scholar] [CrossRef]
- Ingwersen, P.; Serrano-López, A.E. Smart city research 1990–2016. Scientometrics 2018, 117, 1205–1236. [Google Scholar] [CrossRef]
- Dias, G.P. Smart cities research in Portugal and Spain. In Proceedings of the 2018 13th Iberian Conference on Information Systems and Technologies (CISTI), Caceres, Spain, 13–16 June 2018. [Google Scholar]
- Correia, D.; Teixeira, L.; Marques, J.L. Reviewing the State-of-the-Art of Smart Cities in Portugal: Evidence Based on Content Analysis of a Portuguese Magazine. Publications 2022, 9, 49. [Google Scholar] [CrossRef]
- Ruohomaa, H.; Ivanova, N.; Podkletnov, D.; Ivanova, K. The socio-technical impact of the current disruptive technologies on the smart city concept realization. CEUR Workshop Proc. 2020, 2556, 3–9. [Google Scholar]
- Ojo, A.; Curry, E.; Janowski, T. Designing next generation smart city initiatives—Harnessing findings and lessons from a study of ten smart city programs. In Proceedings of the European Conference on Information Systems (ECIS) 2014, Tel Aviv, Israel, 9–11 June 2014. [Google Scholar]
- Chang, P.P.; Kuri, J.L.R. Monterrey envisioned as a smart city developed through international model examples. WIT Trans. Ecol. Environ. 2014, 191, 51–64. [Google Scholar]
- Angelidou, M. The Role of Smart City Characteristics in the Plans of Fifteen Cities. J. Urban Technol. 2017, 24, 3–28. [Google Scholar] [CrossRef]
- Giest, S. Big data analytics for mitigating carbon emissions in smart cities: Opportunities and challenges. Eur. Plan. Stud. 2017, 25, 941–957. [Google Scholar] [CrossRef]
- Camboim, G.F.; Zawislak, P.A.; Pufal, N.A. Driving elements to make cities smarter: Evidences from European projects. Technol. Forecast. Soc. Chang. 2019, 142, 154–167. [Google Scholar] [CrossRef]
- Noori, N.; Hoppe, T.; de Jong, M. Classifying pathways for smart city development: Comparing design, governance and implementation in Amsterdam, Barcelona, Dubai, and Abu Dhabi. Sustainability 2020, 12, 4030. [Google Scholar] [CrossRef]
- Csukás, M.S.; Szabó, R.Z. The many faces of the smart city: Differing value propositions in the activity portfolios of nine cities. Cities 2021, 112, 103116. [Google Scholar] [CrossRef]
- Jucevičius, R.; Patašienė, I.; Patašius, M. Digital Dimension of Smart City: Critical Analysis. Procedia Soc. Behav. Sci. 2014, 156, 146–150. [Google Scholar] [CrossRef]
- Akande, A.; Cabral, P.; Gomes, P.; Casteleyn, S. The Lisbon ranking for smart sustainable cities in Europe. Sustain. Cities Soc. 2019, 44, 475–487. [Google Scholar] [CrossRef]
- Ferrer, J.R. Barcelona’s smart city vision: An opportunity for transformation. Field Actions Sci. Rep. 2017, 16, 70–75. [Google Scholar]
- Calzada, I. (Smart) citizens from data providers to decision-makers? The case study of Barcelona. Sustainability 2018, 10, 3252. [Google Scholar] [CrossRef]
- Mora, L.; Bolici, R. The Development Process of Smart City Strategies: The Case of Barcelona; Juvenes Print: Tampere, Finland, 2016. [Google Scholar]
- Lee, J.; Hancock, M.G. Toward a framework for Smart Cities: A Comparison of Seoul, San Francisco & Amsterdam; Smart Green City Projects. 2012. Available online: https://1library.net/document/yrj6e5oq-framework-smart-cities-comparison-seoul-san-francisco-amsterdam.html (accessed on 18 March 2022).
- Lee, J.; Hancock, M.G.; Hu, M.C. Towards an effective framework for building smart cities: Lessons from Seoul and San Francisco. Technol. Forecast. Soc. Chang. 2014, 89, 80–99. [Google Scholar] [CrossRef]
- Liu, P.; Peng, Z. Smart Cities in China. IEEE Comput. Soc. 2013, 16, 7. Available online: https://scholar.google.com/scholar?hl=pt-PT&as_sdt=0%2C5&q=Liu%2C+P.%3B+Peng%2C+Z.+Smart+Cities+in+China+&btnG= (accessed on 18 March 2022).
- Sanchez, L.; Muñoz, L.; Galache, J.A.; Sotres, P.; Santana, J.R.; Gutiérrez, V.; Ramdhany, R.; Gluhak, A.; Krco, S.; Theodoridis, E.; et al. SmartSantander: IoT experimentation over a smart city testbed. Comput. Netw. 2014, 61, 217–238. [Google Scholar] [CrossRef]
- Silva, B.N.; Khan, M.; Han, K. Towards sustainable smart cities: A review of trends, architectures, components, and open challenges in smart cities. Sustain. Cities Soc. 2018, 38, 697–713. [Google Scholar] [CrossRef]
- Hämäläinen, M. A Framework for a Smart City Design: Digital Transformation in the Helsinki Smart City. Contrib. Manag. Sci. 2020, 63–86. [Google Scholar] [CrossRef]
- Gohari, S.; Ahlers, D.; Nielsen, B.F.; Junker, E. The governance approach of smart city initiatives. Evidence from trondheim, Bergen, and Bodø. Infrastructures 2020, 5, 31. [Google Scholar] [CrossRef]
- Jonek-Kowalska, I.; Wolniak, R. Economic opportunities for creating smart cities in Poland. Does wealth matter? Cities 2021, 114, 103222. [Google Scholar] [CrossRef]
- Masik, G.; Sagan, I.; Scott, J.W. Smart City strategies and new urban development policies in the Polish context. Cities 2021, 108, 102970. [Google Scholar] [CrossRef]
- Alpopi, C.; Silvestru, R. Urban development towards smart city a case study. Rev. Adm. Si Manag. Public 2016, 27, 107–122. [Google Scholar]
- Siokas, G.; Tsakanikas, A.; Siokas, E. Implementing smart city strategies in Greece: Appetite for success. Cities 2021, 108, 102938. [Google Scholar] [CrossRef]
- van Winden, W.; van den Buuse, D. Smart City Pilot Projects: Exploring the Dimensions and Conditions of Scaling Up. J. Urban Technol. 2017, 24, 51–72. [Google Scholar] [CrossRef]
- Smékalová, L.; Kučera, F. Smart city projects in the small-sized municipalities: Contribution of the cohesion policy. Sci. Pap. Univ. Pardubic. Ser. D Fac. Econ. Adm. 2020, 28. [Google Scholar] [CrossRef]
- Ruohomaa, H.; Salminen, V.; Kunttu, I.; Drucker, P. Towards a Smart City Concept in Small Cities. Technol. Innov. Manag. Rev. 2019, 9, 5–14. [Google Scholar] [CrossRef]
- Rotună, C.I.; Cîrnu, C.E.; Gheorghiță, A. Implementing smart city solutions: Smart city map and city drop. Calit. Vietii 2017, 28, 313–327. [Google Scholar]
- Kóňa, A.; Gut’An, D.; Horváth, P. Slovak Republic on the Way to build smart cities based on KPIs with first Slovak smart city index. Sci. Pap. Univ. Pardubic. Ser. D Fac. Econ. Adm. 2020, 28, 1–9. [Google Scholar]
- Vitkova, L.; Silaci, I. Potential of culture for sustainable urban development. IOP Conf. Ser. Mater. Sci. Eng. 2019, 603, 032072. [Google Scholar] [CrossRef]
- Lozynskyy, R.; Pantyley, V.; Sawicka, A. The smart city concept in Poland and Ukraine: In search of cooperation opportunities. Bull. Geogr. Socio-Econ. Ser. 2021, 52, 95–109. [Google Scholar] [CrossRef]
- Alexopoulos, C.; Euripidis, L.; Charalabidis, Y. A Methodology for Participatory Planning of Smart City Interventions. Public Adm. Inf. Technol. 2021, 37, 163–188. [Google Scholar]
- Varró, K.; Szalai, Á. Discourses and practices of the smart city in Central Eastern Europe: Insights from Hungary’s ‘big’ cities. Urban Res. Pract. 2021, 15, 699–723. [Google Scholar] [CrossRef]
- Premat, C. Smart Cities in a Digital Nation: Are Swedish Cities Enough Innovative? BT—Smarter as the New Urban Agenda: A Comprehensive View of the 21st Century City; Gil-Garcia, J.R., Pardo, T.A., Nam, T., Eds.; Springer: Cham, Switzerland, 2016; pp. 207–224. [Google Scholar]
- Lombardi, P.; Giordano, S.; Farouh, H.; Yousef, W. Modelling the smart city performance. Innov. Eur. J. Soc. Sci. Res. 2012, 25, 137–149. [Google Scholar] [CrossRef]
- Mahizhnan, A. Smart cities: The Singapore case. Cities 1999, 16, 13–18. [Google Scholar] [CrossRef]
- Giffinger, R. Smart Cities Ranking of European Medium-Sized Cities; Centre of Regional Science: Vienna, UT, USA, 2007; Volume 16, pp. 13–18. Available online: http://www.smart-cities.eu/download/smart_cities_final_report.pdf (accessed on 18 March 2022).
- Giffinger, R. Smart cities ranking: An effective instrument for the positioning of the cities. ACE Archit. City Environ. 2010, 4, 7–26. [Google Scholar] [CrossRef]
- Albino, V.; Berardi, U.; Dangelico, R.M. Smart cities: Definitions, dimensions, performance, and initiatives. J. Urban Technol. 2015, 22, 3–21. [Google Scholar] [CrossRef]
- Eger, J. Smart Growth, Smart Cities, and the Crisis at the Pump A Worldwide Phenomenon. I-Ways J. E-Gov. Policy Regul. 2009, 32, 47–53. [Google Scholar] [CrossRef]
- Thuzar, M. Urbanization in Southeast Asia: Developing Smart Cities for the Future? Reg. Outlook 2011, 96–100. [Google Scholar] [CrossRef]
- Nam, T.; Pardo, T.A. Conceptualizing smart city with dimensions of technology, people, and institutions. In ACM International Conference Proceeding Series; Association for Computing Machinery: New York, NY, USA, 2011; pp. 282–291. [Google Scholar] [CrossRef]
- Caragliu, A.; del Bo, C.; Nijkamp, P. Smart cities in Europe. J. Urban Technol. 2009, 18, 65–82. [Google Scholar] [CrossRef]
- Ismagilova, E.; Hughes, L.; Dwivedi, Y.K.; Raman, K.R. Smart cities: Advances in research—An information systems perspective. Int. J. Inf. Manag. 2019, 47, 88–100. [Google Scholar] [CrossRef]
- Pramanik, M.I.; Lau, R.Y.K.; Demirkan, H.; Azad, M.A.K. Smart health: Big data enabled health paradigm within smart cities. Expert Syst. Appl. 2017, 87, 370–383. [Google Scholar] [CrossRef]
- Barrionuevo, J.M.; Berrone, P.; Costa, J.E.R. Smart Cities, Sustainable Progress: Opportunities for Urban Development. IESE Insight 2012, 14, 50–57. [Google Scholar] [CrossRef]
- Kourtit, K.; Nijkamp, P. Smart cities in the innovation age. Innov. Eur. J. Soc. Sci. Res. 2012, 25, 93–95. [Google Scholar] [CrossRef]
- Chourabi, H.; Nam, T.; Walker, S.; Gil-Garcia, J.R.; Mellouli, S.; Nahon, K.; Pardo, T.A.; Scholl, H.J. Understanding smart cities: An integrative framework. In Proceedings of the 2012 45th Hawaii International Conference on System Science, Maui, HI, USA, 4–7 January 2012; pp. 2289–2297. [Google Scholar]
- Neirotti, P.; de Marco, A.; Cagliano, A.C.; Mangano, G.; Scorrano, F. Current trends in Smart City initiatives: Some stylised facts. Cities 2014, 38, 25–36. [Google Scholar] [CrossRef]
- Mohanty, S.P.; Choppali, U.; Kougianos, E. Everything you wanted to know about smart cities. IEEE Consum. Electron. Mag. 2016, 5, 60–70. [Google Scholar] [CrossRef]
- Ahvenniemi, H.; Huovila, A.; Pinto-Seppä, I.; Airaksinen, M. What are the differences between sustainable and smart cities? Cities 2017, 60, 234–245. [Google Scholar] [CrossRef]
- Wolf, J.; Borges, M.; Marques, J.L.; Castro, E. Smarter Decisions for Smarter Cities: Lessons Learned from Strategic Plans. In New Paths of Entrepreneurship Development; Springer: Cham, Switzerland, 2019; pp. 7–30. [Google Scholar] [CrossRef]
- Hair, J.J.F.; Black, W.C.; Babin, B.J.; Anderson, R.E. Multivariate Data Analysis; Pearson Education: London, UK, 1998; Volume 5. [Google Scholar]
- OECD; European Commission. Key Data on Local and Regional Governments in the European Union; OECD: Paris, France; European Commission: Brussels, Belgium, 2018; Available online: https://www.oecd.org/regional/EU-Local-government-key-data.pdf (accessed on 18 March 2022).
- Correia, D.; Vagos, C.; Marques, J.L.; Teixeira, L. Fulfilment of last-mile urban logistics for sustainable and inclusive smart cities: A case study conducted in Portugal. Int. J. Logist. Res. Appl. 2022, 1–28. [Google Scholar] [CrossRef]
- Correia, D.; Teixeira, L.; Marques, J.L. Study and analysis of the relationship between smart cities and Industry 4.0: A systematic literature review. Int. J. Technol. Manag. Sustain. Dev. 2022, 21, 37–66. [Google Scholar] [CrossRef]


| Keywords | Category |
|---|---|
| Leaks, floods, anomaly detection, infrastructure, wastewater, water quality, irrigation, smart meters, residential consumption | Water and irrigation |
| Air quality, sound and geo-sensing, green roofs, noise, climate change, green spaces, indoor and outdoor monitoring, crowdsourcing monitoring | Environment and air quality |
| Circular economy, waste management, fill-level sensing, route optimization, selective waste collection, organic waste | Waste |
| Smart districts, energy systems, renewable energy, green solar cities, intelligent streetlight management, electric car, smart grid, residential microgrid, geothermal, wind power plants, green energy, biomass, biogas, fast charging | Energy and lighting |
| Governance framework, development strategy, smart municipality, crisis management systems, public procurement, open strategy, smart city control rooms, policy process standardization, city marketing, smart regions, advanced e-government | Strategy and governance |
| 3D city model, spatial data population distribution, land use, sustainable urban planning, spatial planning, modelling tool, urban computing, virtual reality, geology, urban accessibility | Urban planning |
| Smart tourism destination, tourism and hospitality, travel behavior, heritage, preservation, sustainable tourism, smart museum, augmented reality, rural tourism | Culture, tourism and heritage |
| Rural areas, rural contexts, small cities, cow sharing, smart town, urban-rural relationships, smart village | Rural and agriculture |
| Smart stadium, sport and smart communities, sport activity | Sport |
| Driving elements, challenges, priorities, barriers, benefits, value proposition, ideology, myths and utopias, evaluation system and model, national scale, practices, case studies, characteristics, understandings, findings and lessons, KPIs and index, rankings, trends and opportunities | Smart city foundations |
| Standards, data interoperability, open data policy, urbanAPI, information modeling, big data analytics, mobile sensor, crowdsensing and crowdsourcing, living labs, integrated dashboard | Digitization and interoperability |
| Digital rights, surveillance, cybersecurity education management, general data protection regulation, blockchain, risk management, crime prevention, emergency response, cameras and LiDAR sensors, digital rights, urban safety, smart security | Privacy, security and safety |
| Senior care system, urban health, wellbeing, disease control, hospital information systems (his), e-health, e-prescription system, quality of life, emotion, stress mapping, Covid-19, predicting patients’ urgency demand, active mobile phone intervention, health monitoring system | Health and well-being |
| Wireless sensors, mobile sensors, LoRaWAN, internet of things, 5G networks, communication technologies, LoRa network, Wi-Fi and interactive displays, cyber physical systems, Zigbee wireless communication, narrowband IoT (NB-IoT) | Infrastructure and communication networks |
| Sustainable urban regeneration, utilities, smart building, buildings renovation, green building, thermal modelling, smart home, municipal building regulation, building information modelling | Buildings and housing |
| Traffic forecasting and route guidance, traffic management system, road marking, road damage detection, road safety, crowdsensing urban transit, dynamic obstacle detecting, intelligent traffic light, automatic road sign inventory, road safety, intelligent crosswalks | Traffic |
| Smart parking, off-street parking, parking management, pay-as-you-go, controlling system, applications, mobile payment, social parking, real-time parking prediction system | Parking |
| Intelligent transportation system, electric bike sharing, carpooling and electro-mobility, smart mobility, light rail, public transport demand, pedestrian movement, green transportation, electric carsharing, multimodal sustainable mobility, shared micromobility, inclusive mobility, soft mobility, autonomous vehicles, mobility-as-a-service (MaaS), crowd mobility, connected cars | Mobility and transportation |
| Sustainable urban freight transport, logistics, last-mile, intelligent offloading distribution, logistics freight traffic, short-distance freight, autonomous vehicle fleet, city logistics, grocery distribution | Logistics |
| Participatory governance, collaborative data platforms, citizen participation, human-centric approach, co-creation, smart community, e-governance, democratization, urban experimentation, social policy, inclusion, collaborative decision-making processes, stakeholder involvement | Community, participation and inclusion |
| Smart campus, hybrid learning, mobile education, public libraries, school as a service, human capital, knowledge and intellectual capital, role of universities, gamification educational strategy, training, employment future skills | Education |
| Public private partnerships, Industry 4.0, remote working, sharing economy, smart industry, green economy, local entrepreneurs, startups, accelerators, digital nomads, intelligent manufacturing system, ethics, sustainable production, inclusive 3D printing, corporate social responsibility | Economy and industry |
| Component | ||||
|---|---|---|---|---|
| 1 | 2 | 3 | 4 | |
| Parking | 0.892 | |||
| Infrastructure and Communication Networks | 0.869 | |||
| Smart City Foundations | 0.778 | |||
| Environment and Air Quality | 0.757 | |||
| Waste | 0.669 | |||
| Traffic | 0.654 | |||
| Water and Irrigation | 0.651 | |||
| Mobility and Transportation | 0.626 | |||
| Strategy and Governance | 0.592 | |||
| Sport | 0.899 | |||
| Health and Wellbeing | 0.738 | |||
| Education | 0.737 | |||
| Culture, Tourism and Heritage | 0.670 | |||
| Urban Planning | 0.632 | |||
| Energy and Lighting | 0.557 | |||
| Rural and Agriculture | 0.837 | |||
| Logistics | 0.732 | |||
| Buildings and Housing | 0.708 | |||
| Digitization and Interoperability | 0.614 | |||
| Economy and Industry | 0.541 | |||
| Privacy, Security and Safety | 0.901 | |||
| Community, Participation and Inclusion | 0.565 | |||
| Total Variance Explained | 64.970 | 9.633 | 5.316 | 4.303 |
Publisher’s Note: MDPI stays neutral with regard to jurisdictional claims in published maps and institutional affiliations. |
© 2022 by the authors. Licensee MDPI, Basel, Switzerland. This article is an open access article distributed under the terms and conditions of the Creative Commons Attribution (CC BY) license (https://creativecommons.org/licenses/by/4.0/).
Share and Cite
Correia, D.; Marques, J.L.; Teixeira, L. The State-of-the-Art of Smart Cities in the European Union. Smart Cities 2022, 5, 1776-1810. https://doi.org/10.3390/smartcities5040089
Correia D, Marques JL, Teixeira L. The State-of-the-Art of Smart Cities in the European Union. Smart Cities. 2022; 5(4):1776-1810. https://doi.org/10.3390/smartcities5040089
Chicago/Turabian StyleCorreia, Diogo, João Lourenço Marques, and Leonor Teixeira. 2022. "The State-of-the-Art of Smart Cities in the European Union" Smart Cities 5, no. 4: 1776-1810. https://doi.org/10.3390/smartcities5040089
APA StyleCorreia, D., Marques, J. L., & Teixeira, L. (2022). The State-of-the-Art of Smart Cities in the European Union. Smart Cities, 5(4), 1776-1810. https://doi.org/10.3390/smartcities5040089