Article

User Preferences towards Hyperloop Systems: Initial Insights from Germany

by
Mohamed Abouelela
,
Christelle Al Haddad
*,
Md Ashraful Islam
and
Constantinos Antoniou
Transportation System Engineering, Department of Mobility Systems Engineering, TUM School of Engineering and Design, Technical University of Munich, 80333 Munich, Germany
*
Author to whom correspondence should be addressed.
Smart Cities 2022, 5(4), 1336-1355; https://doi.org/10.3390/smartcities5040068
Submission received: 6 August 2022 / Revised: 6 October 2022 / Accepted: 8 October 2022 / Published: 12 October 2022
(This article belongs to the Section Smart Transportation)

Abstract

:
The rapidly evolving urbanization is generating unprecedented travel demand, notably in intercity travel. With increasing challenges in motorized traffic, innovative and sustainable transport modes are more than ever necessary. The Hyperloop system is an emerging transportation mode with the potential to change long–distance commutes, especially between cities. There is a need for, but also gap in, understanding this potentially emerging transport mode. This study aims at filling this gap by deploying a stated preference study in Germany, in which data was collected for 786 respondents with 5640 scenarios, to investigate the factors impacting users’ preferences towards Hyperloop systems. Models were developed to examine factors impacting the immediate Hyperloop adoption (in the first year of its implementation), but also the choice between Hyperloop and other long–distance travel modes, such as airplanes and high-speed trains. Results indicate that mode-related characteristics (travel time, travel cost, safety), individual characteristics (gender, income level, availability of a driving license, access to a car, familiarity with the Hyperloop system), the current satisfaction level with high-speed trains and airplanes, and personality traits (confidence, affinity to technology) are the most significant factors in the choice and early adoption of Hyperloop systems.

1. Introduction

According to the United Nations, around 68% of the world’s population is expected to live in urban areas by 2050 [1]; other studies expect this percentage to go up to 80% [2]. This ever-growing urbanization, along with people’s increased mobility needs, call for innovative solutions to accommodate the expected increase in transportation demand. Among other emerging transport modes, the Hyperloop system, advertised by Elon Musk in his Hyperloop Alpha white paper [3], is a new transport mode consisting of capsules propelled by electromagnetic forces in low-pressure tubes [4,5,6,7]. The system is claimed to reach maximum speeds ranging between 1000 km/h and 1200 km/h, while generating less emissions and noise compared to existing high-speed modes, namely high-speed trains and jets [8,9]. Hyperloop is also believed to be much safer than airplanes [10], making it a more reasonable choice than flying from an economical perspective [11].
In theory, Hyperloop is immune to severe weather conditions and is resistant to earthquakes [3,12]. It is also claimed to be energy-efficient, with low emissions, making it a more sustainable mode of transport [6,9,13]. Benefits promised by the Hyperloop system have encouraged researchers to believe it would accelerate economic growth [14,15,16], become a game-changer in the intercity mobility landscape [17,18], and ultimately bring positive benefits for society and the environment [19]. The prospects of Hyperloop’s high technological nature, and the high expectations of having a faster, safer, and more sustainable mode of transport compared to the existing ones, makes it attractive to different stakeholders [20]. However, deployment of the Hyperloop is yet to occur, and to the best of the authors’ knowledge, research on factors impacting its demand and adoption is still limited. This study aims to fill this research gap by developing a stated preference (SP) survey to answer the following research questions:
  • What factors impact the early adoption of Hyperloop?
  • What factors affect the choice between Hyperloop and competing modes, namely high-speed train and air transportation (airplanes)?
The rest of this article is organized as follows: Section 2 presents an overview of the existing research on Hyperloop and on common factors used in mode choice. Section 3 presents the data and methods used in this study, including the questionnaire design, data collection tools, and the modeling framework for analysis. Section 4 and Section 5 show the collected sample, and the different model results. Finally, Section 6 discusses the model findings, including limitations and potential future research, and concludes with the key takeaways from this study.

2. Literature Review

2.1. Hyperloop Overview

The concept of Hyperloop was first popularized by Elon Musk [3] as an alternative to the California high-speed rail development to connect San Francisco and Los Angeles [21]. Since then, international companies have adopted and advanced the idea of pods/capsules traveling with reduced air resistance through low-pressure tubes [22,23,24]. Several studies have explored the potential benefits of Hyperloop systems, such as, but not limited to, faster travel speed; savings in travel time, energy consumption, and emissions; self-sustainability; and resistance to severe weather conditions and earthquakes. Positive benefits of this mode can be summarized as faster operation speed (up to 1200 km/h) [15,25], lower or no emissions during trips [26,27,28], and resistance towards adverse weather conditions [4,9,26]; due to these strengths and promising potentials, Hyperloop is believed to be capable of bringing about massive shifts in intercity travel [18,29] for both passenger and freight transportation [30,31]. Regarding business operations for freight transport, Hyperloop could reduce travel costs, expand same-day delivery services, increase accessibility to manufacturing hubs, and extend the effective economic boundaries of a city [29].
Despite Hyperloop’s attractiveness, the realization of the systems is hindered by many factors, such as high costs of infrastructure, maintenance and operation, safety aspects, reliability, land-use expropriation, and environmental impacts [32,33]. Moreover, manufacturing long vacuum chambers of a Hyperloop system requires advanced technical skills, which are also costly, hard to find, and risky to maintain [34]. Moreover, space in the train is also a concern in relation to Hyperloop operation [19,35]. Notwithstanding the previous hurdles for Hyperloop implementation, feasibility studies for system implementation are underway globally. Some of the proposed Hyperloop projects are summarized in Table 1.

2.2. Common Factors in Mode Choice

To the best of the authors’ knowledge, previous research has not yet investigated the impact of introducing Hyperloop on existing modes of transport and the potential modal shift resulting from this market penetration. Studies on conventional mode choice and emerging modes of transport, especially for long-distance travel, were therefore reviewed to determine significant factors that could influence mode choice decisions, and they were considered and used in the questionnaire design (Section 3). De Witte et al. [46] defined mode choice as the process of choosing between different travel alternatives. It is defined by a mixture of different factors, including individual sociodemographic, sociopsychological factors, and spatial characteristics. Some of the most significant factors for mode choice for long trips are travel time and cost [47,48,49,50,51], safety [52], access time, egress time, waiting time [49,53,54], level of service [36,55], comfort [49,56], travel purpose [47,49,57], and individual sociodemographics [48,49,52,56,58,59,60]. Previous studies differentiated between short-distance and long-distance trips as trip distance might influence the mentioned factors, although there is no standard definition for long trips. A long-distance trip is typically described as longer than 50–100 km [61]; consequently, long-distance trips are less regular, making travelers less familiar with accessible transportation options. It is to be noted that faster travel options are typically preferred in terms of long-distance trips [62].
Several studies described sociodemographic characteristics as critical for mode choice decisions. Sociodemographic variables such as gender [63], income [64], education [65], and age [66] are considered significant in different studies. For example, a study in the Toronto–Montreal Corridor [67] found that women have different tendencies compared to men in Canadian intercity travel mode choice. According to Georggi and Pendyala [68] and Mallett [66], males tend more than women to use a car in long-distance travel. Regarding income impact, high-income individuals tend to drive more compared to low-income people, who prefer to use buses [64]. When it comes to education level, studies have shown contradictory findings. In one study, people with higher education levels were found to prefer public transport for long-distance travel [65], whereas in another study, they were found to prefer a car [69]. Mode choice also depends on the trip purpose due to the different space–time fixity and time value [70]. Generally, business trips are more fixed within time and place [71,72]; thus, travel tends to use more expensive modes for business trips compared to other trip purposes [73]. Moreover, several studies considered the transit station location as an important factor for mode choice [74,75,76,77]. People are more likely to take the bus if the railway station is outside the city center [64,75,76,78]. Finally, de Lapparent et al. [79] studied the imbalance of heterogeneous preferences among European countries. According to this study, spatial heterogeneity in traveler composition and preferences can play an important role in mode choice decisions.
Utility maximization theory assumes that individuals faced with various alternatives will opt for the ones that yield the best benefits (utility) for them. Different computational and statistical techniques have been widely used in many fields, including transportation, to quantify the factors influencing mode choice decisions. The more traditional statistical methods used are known as discrete choice models, which are prevalent in transport mode and route choice modeling [80] and are usually based on the utility maximization theory. Based on the number of alternatives and goals, different models, such as multinomial logit, probit, binomial, nested, and ordered logit, are used [81]. The application of choice models in transportation is extensive; for example, Abouelela et al. [82] used choice models, including binary logit model, hybrid choice model, and an ordered logit model, to quantify the factors impacting the shift from traditional modes to pooled rides, the choice between different pooled ride services, and the frequency of using pooled rides, respectively. Mode choice studies have also been used in understanding emerging modes of transport; Al Haddad et al. [83] used an ordered logit model and multinomial logit models to assess the acceptance and adoption of urban air mobility.

3. Data and Methods

3.1. Questionnaire Design and Data Collection

3.1.1. Questionnaire Design

To understand user preferences for Hyperloop use compared to existing intracity mass transit modes, a stated preference (SP) survey was designed and disseminated in Munich, Germany. The survey consisted of four main parts. The first part investigated the users’ general travel behavior, such as the users’ main commute mode, modes used for long-distance trips (trips longer than 400 km), and satisfaction level with flights and high-speed trains, but also other questions including ownership of a driver’s license or access to a private car. Finally, this part included questions to assess general factors impacting users’ mode choice, including different attributes. The second part then investigated respondents’ familiarity with Hyperloop systems, including their perceptions and expectations from this mode.
The third part of the survey was the stated preference part, which consisted of 10 blocks with 10 scenarios/block. The number of scenarios was chosen using random design as previously used in Abouelela et al. [84], Walker et al. [85]. The scenarios were built considering one of the heaviest traveled corridors in Germany [86], between Berlin, the capital city of Germany and Munich. Berlin is the capital and largest city of Germany with a population of about 3.6 million individuals [87], and Munich is the third largest city with 1.5 million inhabitants [88]. Around 1.8 million passengers travel between Munich and Berlin by high-speed train, representing 46% of the total number of trips between the two cities, while 1.2 million people use an airplane for the same route, an equivalent of 30% of the total trips [89]. The distance between Munich and Berlin is about 623 km for the high-speed train and 504 km in flights. This frequently traveled corridor was chosen for the experiment design to give the respondents a realistic scenario for the mode choice decision and to reduce the hypothetical bias in the SP survey responses [90]. Table 2 shows the summary of the attributes and levels used in the designed survey, and Figure 1 shows the scenario details and a block example.

3.1.2. Data Collection

The designed survey was distributed online and was administrated on the online platform LimeSurvey (limesurvey.org, accessed on 6 October 2022). The data were collected from mid-January to the end of March 2021. The survey targeted users from Germany, specifically Munich, and was available in English and German and distributed among various groups, including local university groups, community groups, student dormitories, professional groups, and related research companies. The survey was further distributed on social networks, mailing lists, and professional media platforms such as Facebook, Linkedin, and XING).

3.2. Modeling Framework

The first modeling technique used was the exploratory factor analysis (EFA), a statistical method used to explain the variability within observed and correlated variables in terms of the lower number of unobserved variables; in other words, it is used as a dimensionality reduction technique [93,94]. In addition, it has been widely used in transportation research to estimate the latent construct of the data or users’ attitudes and perceptions [82], which was the case in this research. A scree plot test was performed to define the number of factors, in particular, a polychoric correlation coefficient was used for its appropriateness compared to Pearson’s correlation for ordinal categorical variables, using a Likert scale [95]. After applying the scree plot test, the final factors numbers considered the lowest variance per factor to be 10% of the total variance following an approach similar to the one used in Abouelela et al. [82], Tyrinopoulos and Antoniou [96]. Loadings higher than 0.40 were kept, considering the sample size, in accordance with Costello and Osborne [97], Hair et al. [98]; factors with loadings less than 0.4 were removed iteratively. Varimax rotation was applied to obtain a simple orthogonal structure between the different factors.
As the aim of this paper is to investigate the factors impacting the adoption and choice of Hyperloop, and due to the discrete nature of the dependent variables of interest, i.e., immediate adoption of Hyperloop (yes vs. no) and the mode chosen for travel (Hyperloop vs. other modes), discrete choice models were used; in particular, a binary model was used for the former and a multinomial logit model for the latter. Users’ attitudes, in terms of personality, traits, and perceptions of new technologies, extracted by the exploratory factor analysis results were incorporated into the modeling process in addition to individual and modal characteristics and attributes.

4. Data Analysis

4.1. Sociodemographic Characteristics

A total of 980 responses were collected; after removing the uncompleted responses, a total of 786 responses were deemed adequate to use. Table 3 shows the sociodemographic characteristics of the collected sample. In terms of gender, age, and education, the sample was skewed towards highly educated young males compared with the city of Munich (Germany 2011 census data). It is to be noticed that the majority of participants were young, 85% were under 34 years old, and 86% of the participants had at least a bachelor’s degree compared to 25% of the population. The strong presence of the young respondents was justified by being the target group of interest. In addition, in terms of occupation and household income, there was a strong presence of students, with a lower average income, compared to the city’s average, which makes sense (as most respondents were students). Moreover, around half of the sample had a valid driving license and access to a car. As this study focuses on the adoption and use of Hyperloop by young users, only responses for individuals between 18 and 34 years will be analyzed and presented in the following section.

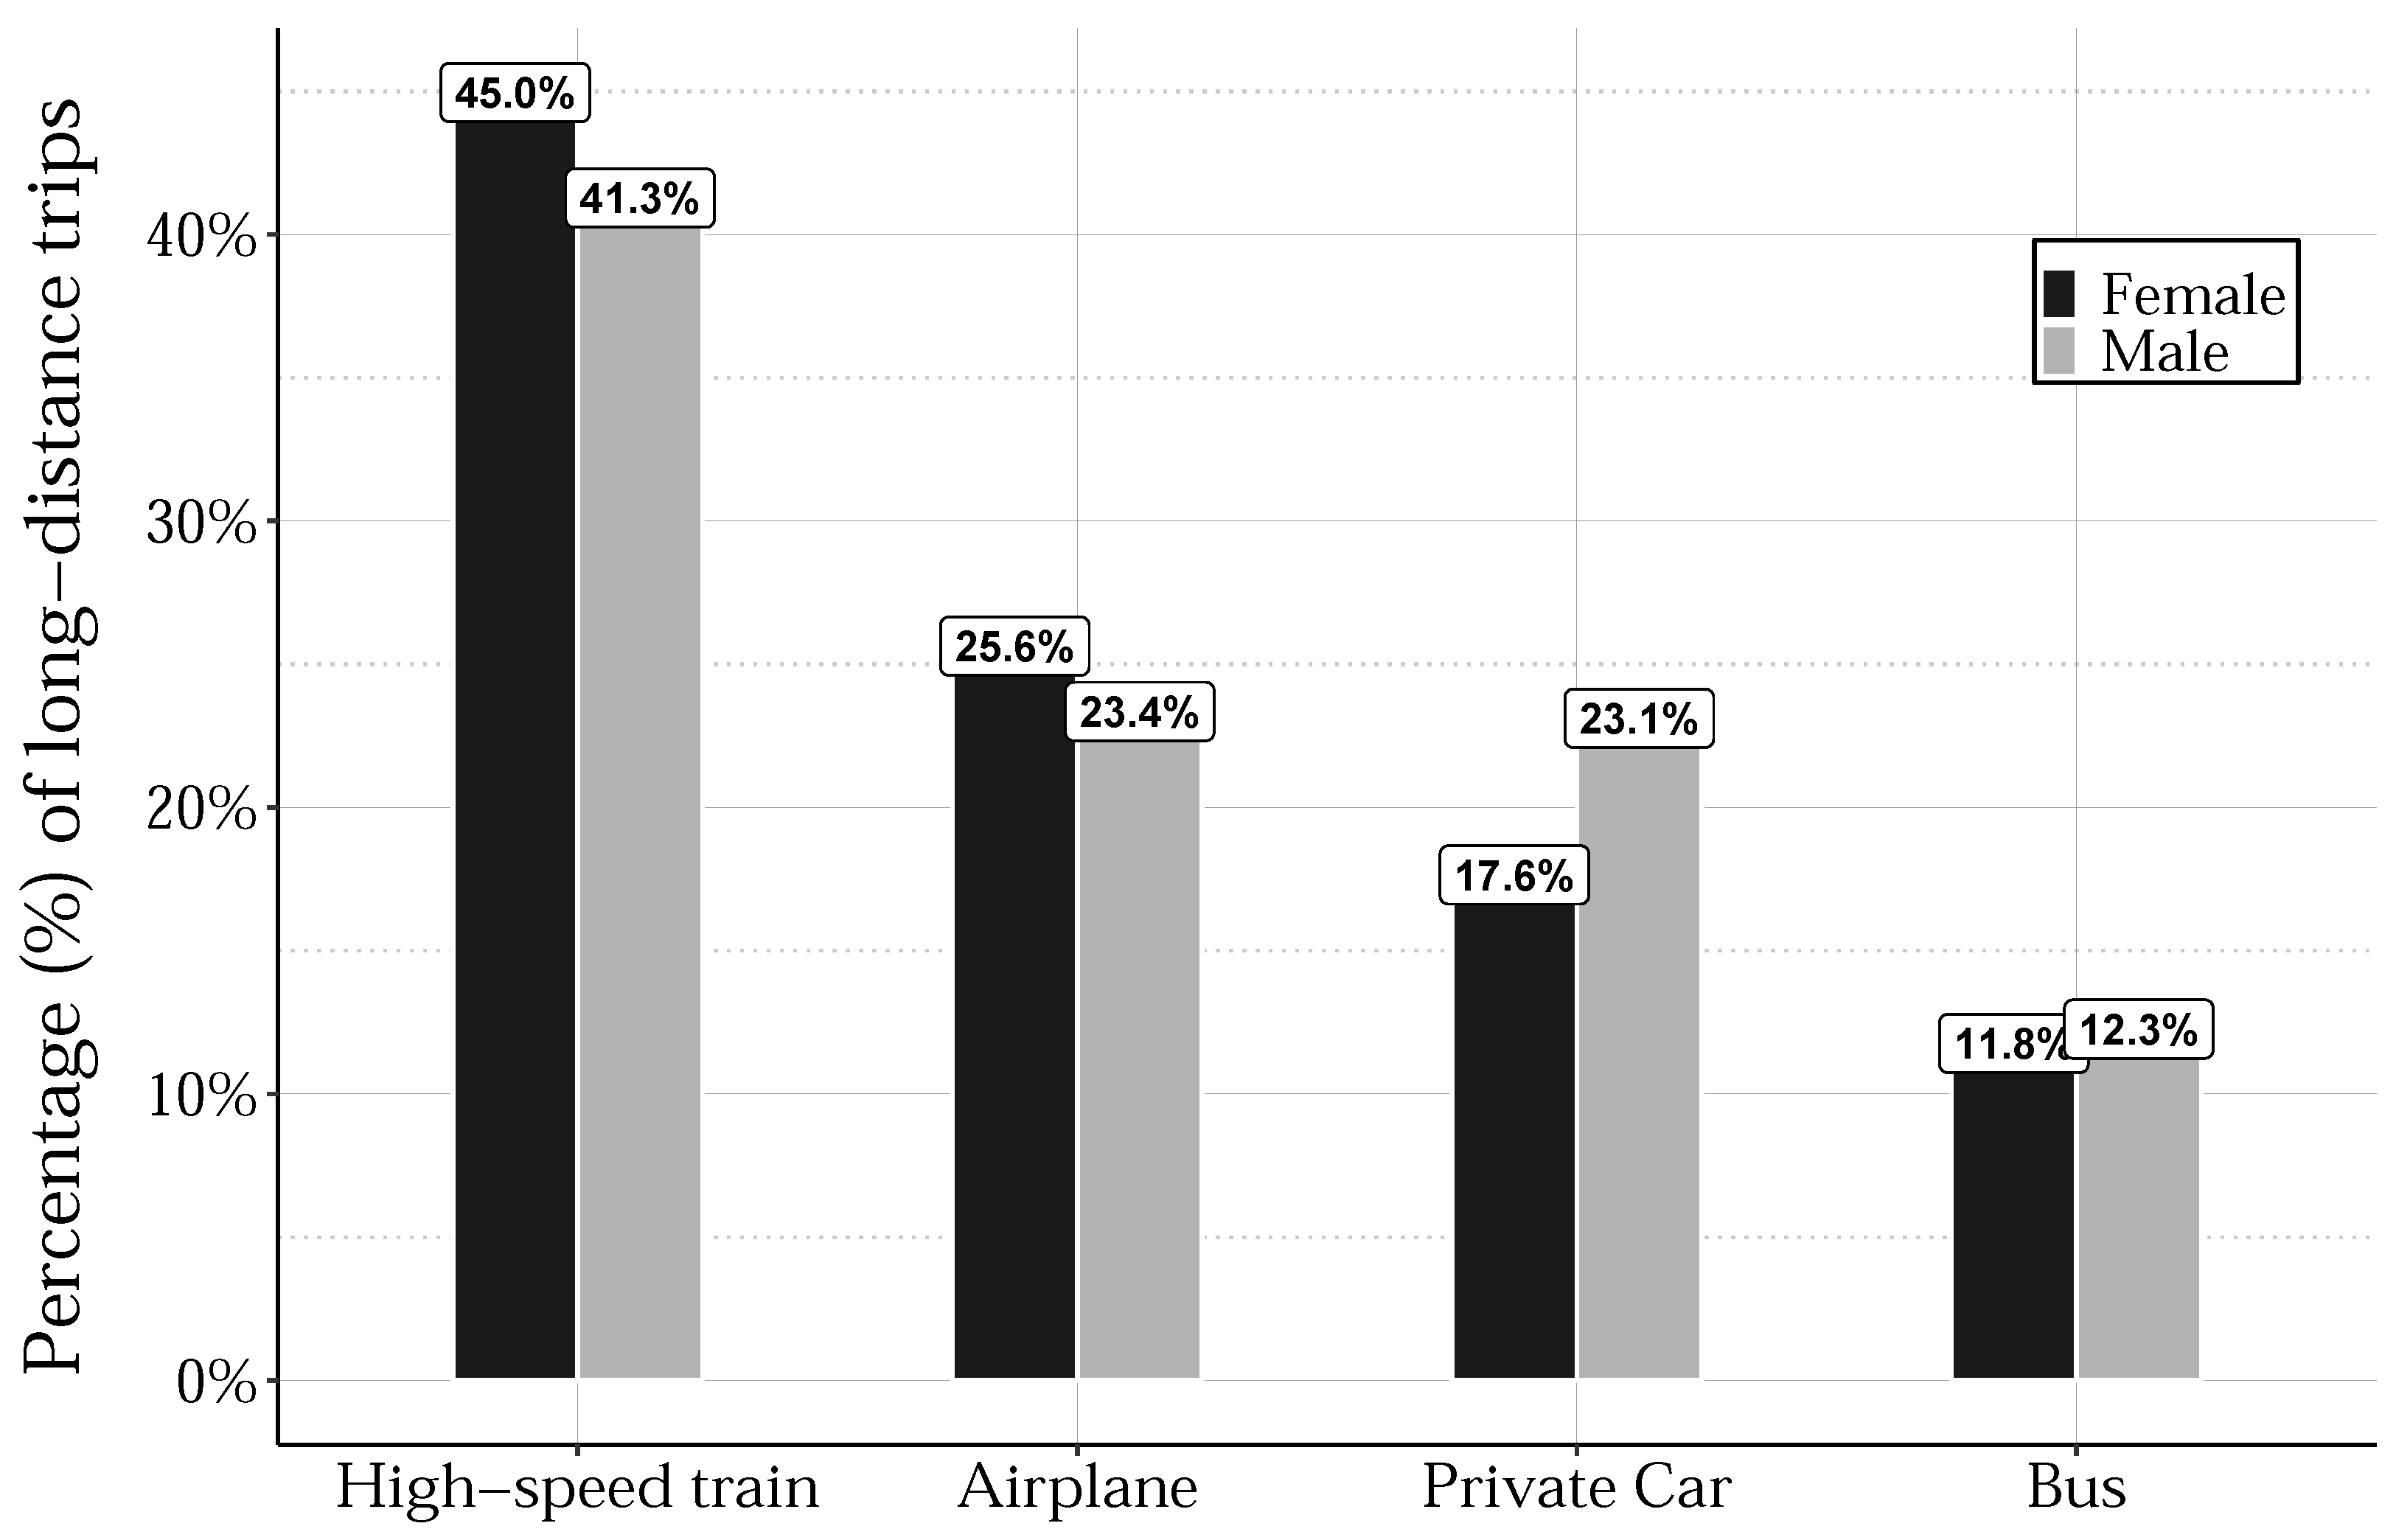
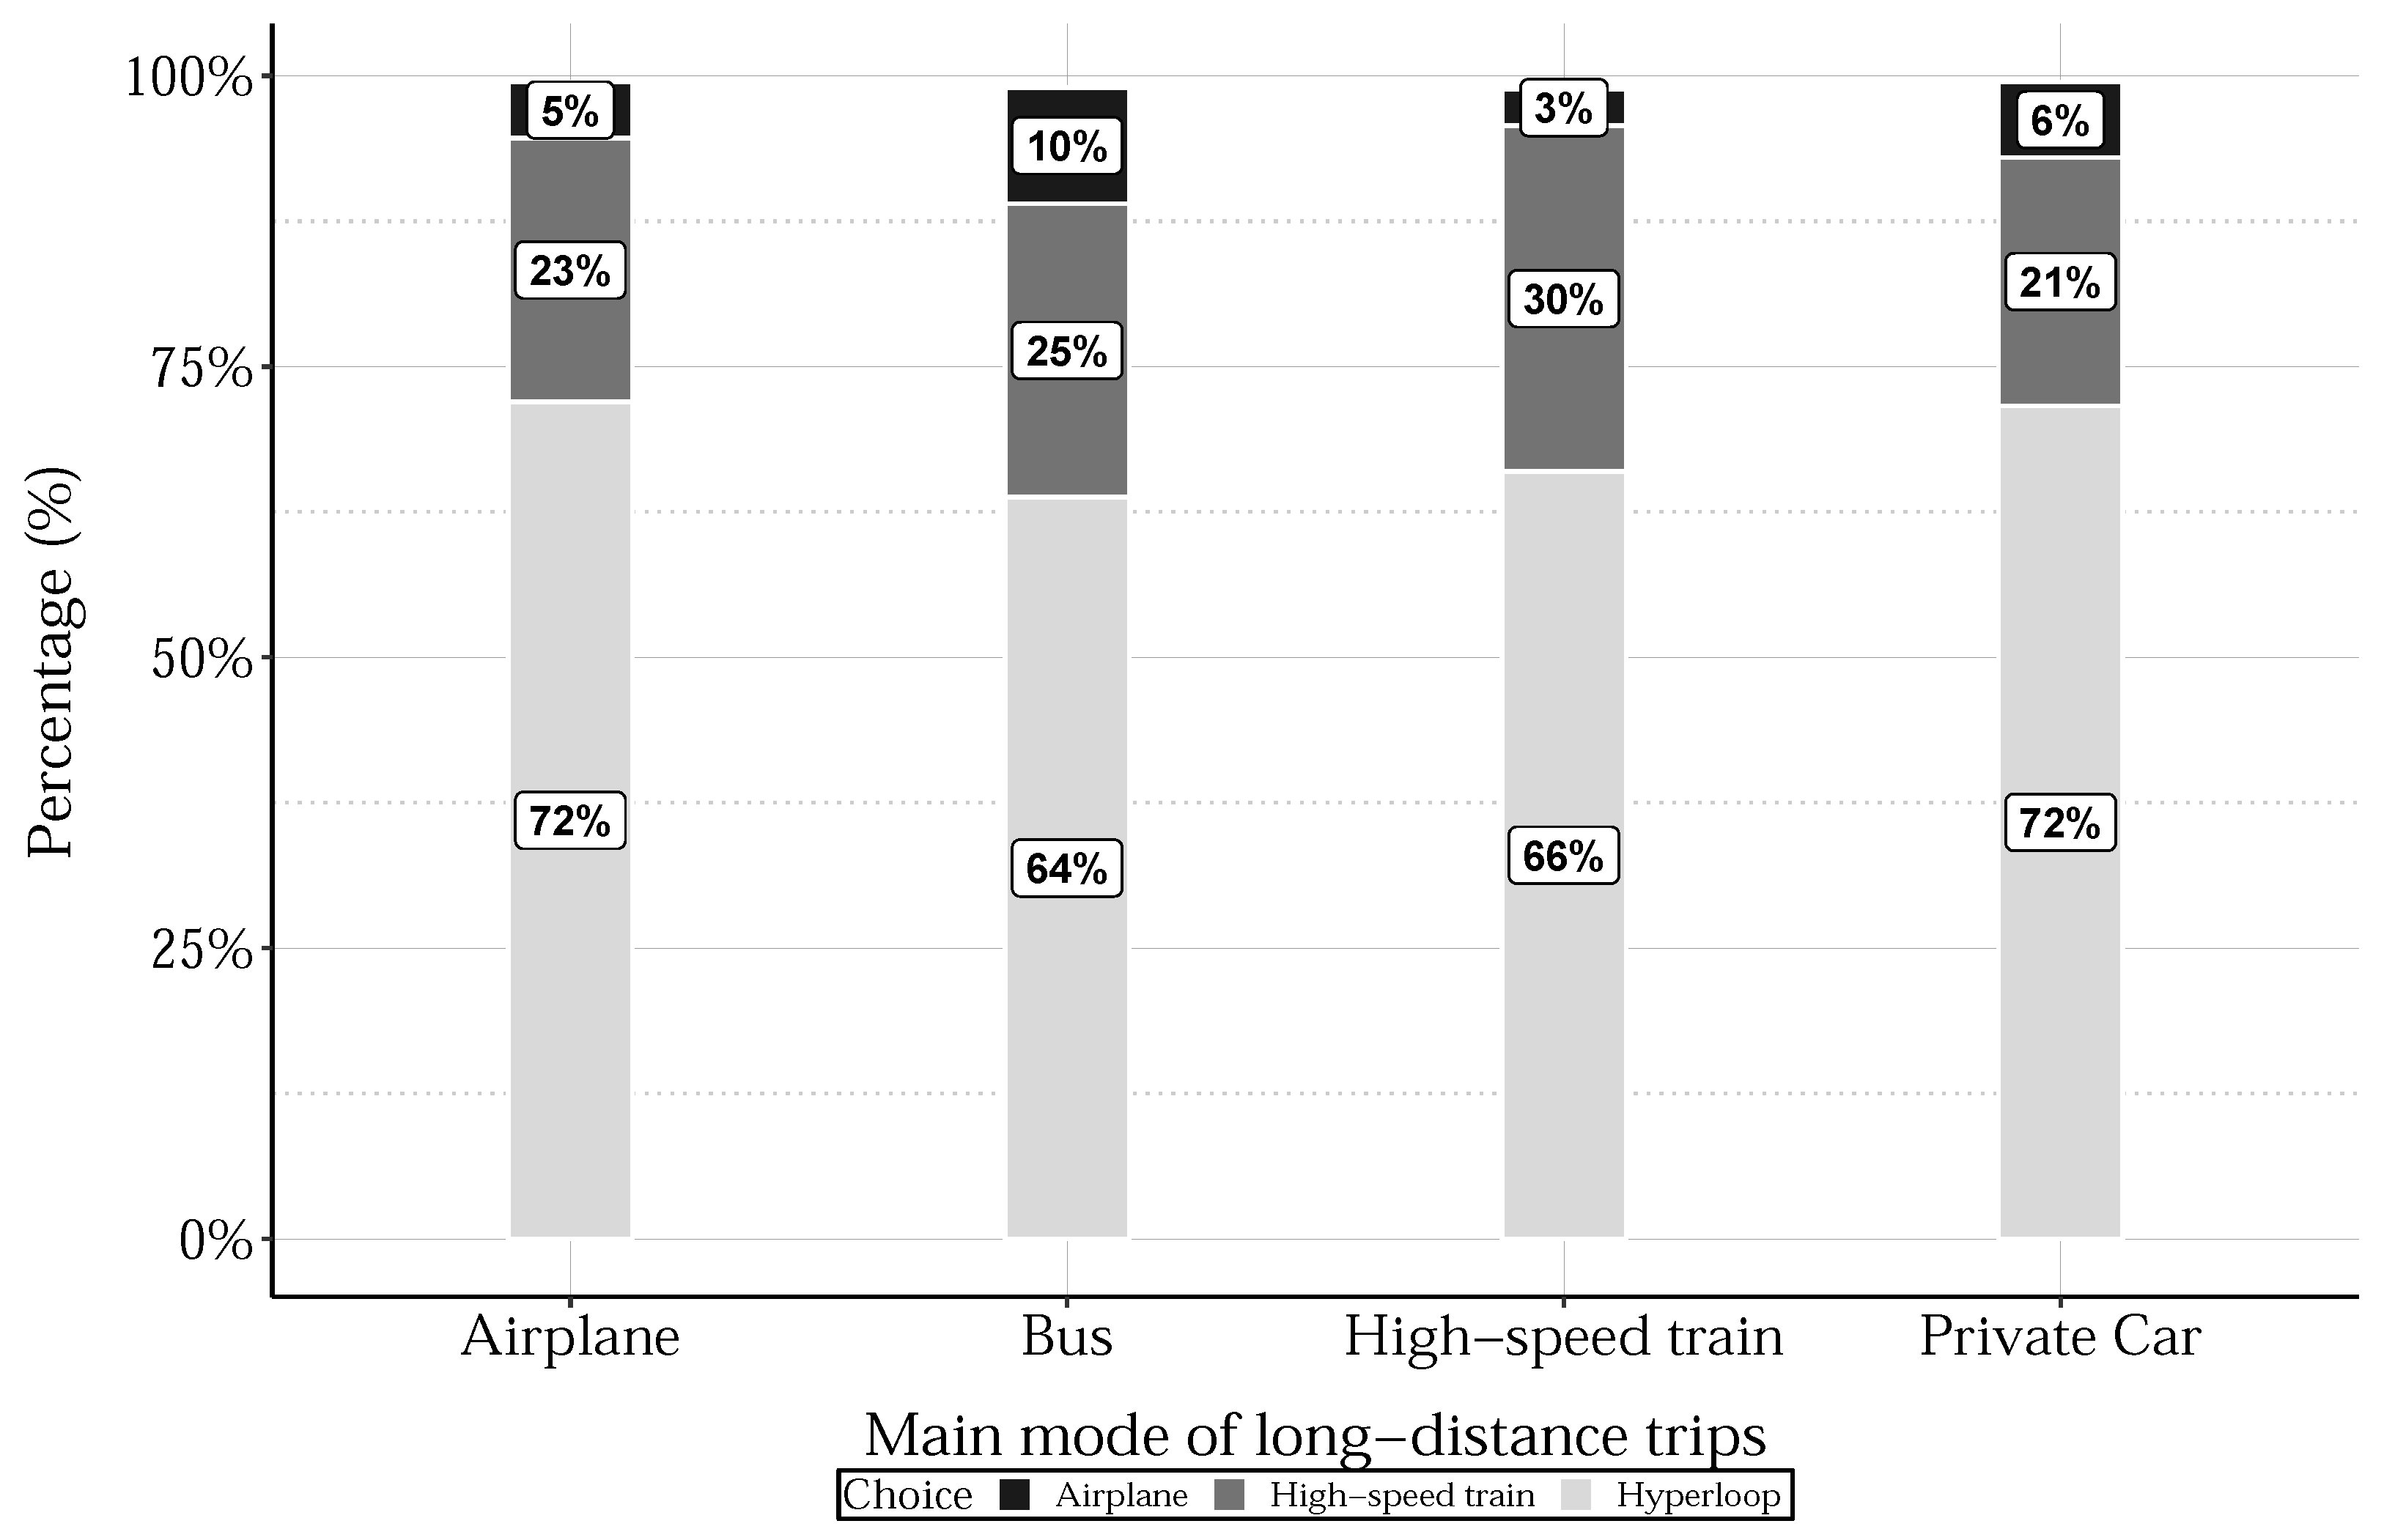
4.2. Travel Behavior

The first part of the survey investigated respondents’ travel behavior, as it has been found to impact mode choice and use emerging transport modes [82]; also, gender was found to play a significant role in the adoption of disruptive transport technologies, such as in the case of urban air mobility [83]. Therefore, respondents’ travel behavior was investigated, with a focus on gender differences. First, the most frequently used modes for urban travel were investigated and compared based on gender, as shown in Figure 2. Results indicate that respondents were frequent public transportation users and less dependent on a private car for daily movement; respondents also showed affinity to new transportation modes, i.e., scooters, despite it being limited to around 3% of users. A Chi-square test was performed to compare differences across gender; results indicated that there were no differences between the collected sample of males and females for general travel behavior in the urban environment.
The second item related to respondents’ travel behavior investigated the main modes used for long-distance trips, i.e., trips longer than 400 km. The top three chosen modes were high-speed train (HST), airplane, and car, representing 43%, 24%, and 21% of respondents, respectively. These results reflected the popularity of HST among respondents, as it captured about double the share of other modes. For this travel behavior item, gender was also not found to be significant for the choice made; a descriptive visualization of the results is shown in Figure 3.
Users also had to specify their use frequency for bus, car, airplane, HST, and ride–sharing services such as (BlablaCar). The frequency of use was specified on a four-point Likert scale, ranging from: (i) never or almost never; (ii) less than once a month; (iii) 1–3 times per month; (iv) and finally 1–3 times per week. The analysis of the frequency of use showed that respondents mainly traveled long distances less than once a month, and the distribution of the different modes used per gender showed no significant differences across gender.
Respondents’ satisfaction level for both HST and airplanes (flights) was visualized and is depicted in Figure 4. On average, the satisfaction level was slightly higher for females compared to males, but the differences were not statistically significant for both modes, and the satisfaction with airplanes (flight) use was slightly higher than that of HST: 63% and 46%, respectively.
Respondents also evaluated five aspects of mode choice that were most present in previous mode choice literature as indicated in Section 2; these were namely: comfort, environmental impact, travel time, and travel cost. This assessment included a ranking of the most critical factor in mode choice decision. Respondents’ ranked their options based on a five-point Likert scale, ranging from “very important” to “not important at all”. Results for this assessment are presented in Figure 5 and showed that cost, time, and safety were the most decisive factors in mode choice, capturing 91%, 89%, and 82% of the users, respectively. Similar to the previous question, the assessment of the responses to this question by gender showed no significant differences between female and male respondents.
Finally, respondents ranked their previous knowledge of Hyperloop systems on a four-point Likert scale, ranging from: “I know a lot about it” to “I do not know it”; results are presented in Figure 6. While almost a third of respondents (29%) had not previously heard about the system, only 9% claimed to have good knowledge of it. When comparing responses by gender, significant differences were observed, with a high confidence level. The majority of male users knew a lot about Hyperloop, or at least had looked into it (78% and 82%, respectively), compared to female respondents (22% and 18%, respectively). Therefore, gender is expected to play a significant role in Hyperloop use and adoption.

5. Modeling Results

5.1. Exploratory Factor Analysis

Exploratory factor analysis (EFA) was performed on two different sets of questions. In the first set, respondents were asked to respond to five statements on their concerns towards new technologies, with answers on a five–point Likert scale, ranging from “strongly agree” to “strongly disagree”. The main reason for using EFA was to reveal latent constructs behind different statements. Procedures for EFA estimation mentioned in Section 3.2 were followed, namely the use of varimax rotation and the cut-off value of 0.4 for factor loadings. Results for the performed factor analyses are presented in Table 4.
The estimated two factors for the first set of statements on technological questions were interpreted as technological affinity (Factor 1) and technological concerns (Factor 2). In the second set of questions used for the EFA, respondents rated their agreement with four statements regarding their personality, with answer options also following a five-point Likert scale as described above. Two factors were estimated with the proportion of variance more than 0.10 and factor loadings more than 0.40, following guidelines mentioned in Section 3.2. The extracted factors were interpreted as confident personality and non-confident personality.

5.2. Hyperloop Adoption Model

Users also specified their expected use of Hyperloop, with answer options ranging from the first year of operation, to the second or third year of operation, to the fourth or fifth year, starting in the sixth year, never, and unsure. Around 75% of respondents stated a use within the first two years, 14% were unsure, and less than 1% stated that they would never use the service. The year of the adoption reported by the users was initially set as an ordered dependent variable due to its ordinal nature to model the factors impacting the year of Hyperloop adoption. However, the distribution was unbalanced between the different choice categories, which created a separation effect while developing the model [99]. In addition, due to the limited number of unsure respondents and respondents who would never use the system, we excluded both categories from the developed models and aggregated the rest of respondents between respondents who would adopt the service in the first year and those who would adopt it starting from the second year. Table 5 shows the estimation results of the binary logit model, where the adoption year was the dependent variable set to zero when respondents chose to adopt the service in the first year of implementation and one otherwise. Only two variables proved to be statistically significant at a 95% confidence level, namely gender and confident personality (the latter being a newly generated factor based on the EFA results presented in Table 4). These results indicate that males are more likely than females to immediately adopt Hyperloop and that confident users are more likely to adopt the service early on; these findings are at least partially compatible with those presented by Al Haddad et al. [83] in their assessment of acceptance and adoption of urban air mobility, which is also an emerging mode of transport.

5.3. Multinomial Logit Model

To extract the factors impacting the choice of Hyperloop among other competing modes, in this case, HST and airplanes, a multinomial logit model (MNL) was developed; the model results are presented in Table 6, including the “none” option, which was kept as it has been previously shown to improve the model fit [52].
The mode-related attributes were all found to be significant, and the estimated coefficients showed that an increase in travel time and travel cost (negative estimated coefficients) reduce the likelihood of choosing the modes (for all modes), which is intuitive and common in mode choice modeling [52,84]. Safety was also highly significant; the higher the safety level (compared to driving safety level), the more likely the choice of the option. This factor was found to be significant for all modes and all levels (two or four times safer than driving), except for the airplane mode, in which safety level was only significant for the highest safety level (four times safer than driving); the latter is believed to be due to respondents’ general higher safety perceptions of airplanes compared to other modes. In addition, respondents’ higher satisfaction with flights compared to HST could be a reason behind the highest safety perception of flights; refer to Figure 4.
Among respondents’ individual characteristics, or sociodemographics, only household income, availability of a driving license, and access to a car, were found to be significant sociodemographics impacting the mode choice experiment. After setting the income level less than EUR 1000 as a reference level, all income levels were found to be significant for the examined modes except for HST, where only one level (between EUR 2000 and 3000) was found to be significant. The estimated income coefficients showed that high-income households (between EUR 2000 and 3000) are more likely to use each of the three tested modes compared to other income categories. In addition, the availability of a driving license reduces the likelihood of using different modes, including Hyperloop; however, access to a car increases the possibility of using flight, followed by Hyperloop.
Familiarity with Hyperloop coefficients showed that the more the respondents were knowledgeable with the Hyperloop concept, the more likely they were to use it (or state that they would use it). Satisfaction levels with HST and airplanes were aggregated to three levels, namely “not satisfied”, “neutral”, and “satisfied”. The “not satisfied” level was set as a reference level. The coefficient estimated showed that the higher the satisfaction with airplanes, the more likely to use them (airplanes or flights) compared to Hyperloop.
The extracted factors from the EFA were also used to estimate the impact of personal attitudes on the respondents’ choices. Affinity towards technology was found to most significantly impact all modes, with a higher magnitude for Hyperloop systems, indicating that the higher affinity would result in a higher likelihood of choosing Hyperloop. On the other hand, technological concerns would reduce this likelihood, and people would be more likely to use airplanes instead. Personality traits factors showed that a confident personality would result in a lower likelihood of using HST compared to Hyperloop and flights. On the other hand, a non-confident personality would result in a higher likelihood of using airplanes compared to Hyperloop.
An important application of MNL models in SP studies is to calculate the value of time (VOT) for the different, mostly for policy making, such as, but not limited to, ticket pricing [100]. VOT can be simply explained as the amount of money travelers value a unit of their time for or the willingness to pay to use a certain mode [101]. Small [102] presented VOT as an indirect utility function with time and value, as presented in Equation (1).
V O T = d T d C = V T V C . 60 = / min
where V = systematically derived element, C = travel costs, and T = travel times.
Based on the estimated MNL coefficients (see Table 6), the estimated VOTs for the three modes are; VOT(Hyperloop) = EUR 11.7 h, VOT(HST) = EUR 14.3 h, and VOT(airplane) = EUR 41.7 h. The calculated VOT shows that Hyperloop is the mode with the lowest VOT, compared to HST and airplanes. This calculation did not consider trip purpose, which is a limitation for this study. Wardman et al. [103] estimated VOT for HST commuter trips as EUR 10.5 h for trips shorter than 250 km, EUR 9.55 h for longer trips and business trips shorter than 250 km, EUR 45.6 h for flights, and EUR 30 h for HST. VOT for business trips longer than 250 km was EUR 39.8 h for HST, and EUR 71.1 h for flights. Other trip purposes shorter than 250km were found to have a VOT of EUR 9.8 /h for HST, and EUR 16.5 h for flights, and other trips longer than 250 km were found to have a VOT of EUR 8.22 h for HST, and EUR 18.8 h for flights. The estimated VOT for the HST was higher than the previously estimated German VOTs, except for the business trips; on the other hand, the estimated airplane VOT was higher than that of previous studies in Germany, but lower than the estimates for business trips. This study study calculated VOT based on the total travel time, including the in-vehicle travel time, access/egress time, and waiting time at the station. In practice, passengers may value these times differently. [54] suggested that in-vehicle time has a higher value than others. These could be limitations of this study, in particular in calculating the value of time.

6. Discussion, and Conclusions

6.1. Survey and Model Findings

The main findings of the data analysis of the survey’s results can be summarized as follows; more than half of the users are avid public transport users, and 82% of respondents commonly use sustainable modes for intercity transport, such as public transport, cycling, or walking: 55%, 19%, 7%, respectively. This travel behavior can be associated to many factors, such as the young age of respondents, the limited travel options they possibly have, and their environmental concerns, also reflected in their answers, where around 60% of them mention environmental impacts as an important reason to choose their travel mode (see Figure 5). In addition, for long-distance trips (higher than 400 km), the majority of respondents preferred HST, with around 43% choosing it as their primary mode of transportation for such trips; however, respondents had a higher tendency to be more satisfied with the current level of services of airplanes compared to HST. This could be due to their generally lower income levels, which results in their lower use of flights, and therefore false perception of its quality; however, more investigation is needed to verify this observation.
The majority of respondents (70%) had prior knowledge about Hyperloop technology, with only 9% of them having a profound understanding of this mode. Additionally, men tended to have significantly more knowledge and interest in Hyperloop compared to women. The importance of familiarity or knowledge about the new technologies was also found to play a significant role in further emerging transport modes, such as UAM, as indicated in Al Haddad et al. [83]. The analysis of the choice experiment results showed that Hyperloop was chosen on average around 68%, high-speed train around 26%, and airplanes (flights) around 5%, and none of the three options in less than 1% of the observed choice scenarios, with no significant difference between gender choices. The choice options were also compared to the current primary mode of long-distance travel, with no significant difference observed (see this comparison in Figure 7).
The choice experiment examined four major attributes of the used mode, namely travel cost, travel time, frequency of the service, and safety. Only frequency was not found to be a significant factor for all the tested modes, and safety was the factor with the highest coefficient in comparison to the rest of the service attributes, highlighting its importance for the adoption of new technologies, which was also observed in other emerging mobility studies [83]. Yet, despite frequency not being found as a significant factor, it is possible that respondents did not understand this attribute well, due to the used units, which could be improved in future studies.Individual characteristics also played a significant role in the mode choice. People with higher income levels were found to be more likely to choose flights and Hyperloop. Car access was found to be the individual factor with the highest magnitude. Furthermore, familiarity with Hyperloop and satisfaction with HST and flights played a significant role in mode choice, showing the potential for Hyperloop to attract people from other modes, specifically HST. Finally, personal attitudes showed that affinity to technology indicated a higher likelihood for the choice of Hyperloop, reference (see Table 6).
Modeling the early adoption of Hyperloop (using the first year of its implementation as opposed to later on) showed similar results, with only two significant estimated factors: gender coefficient, where males were more likely to be early adopters compared to females, and confident personality, which was also directly associated with early adoption. This gender gap could therefore be a relevant point to be addressed by stakeholders for successful market penetration.

6.2. Policy Implications

The model results indicated that travel time, cost, and safety are crucial factors in mode choice decisions. Therefore, the Hyperloop advantage in travel time should be leveraged and well-marketed, especially for time-sensitive passengers (e.g., people on business trips) who value time more than costs [72] for a successful adoption. Safety factors were also proven to be highly influential. As many experts are still concerned about the safety of the Hyperloop system, this factor should therefore be at the forefront of Hyperloop research and product development.
Models showed that users who have a high affinity towards technology would be more likely to use Hyperloop. Additionally, although gender did not have a significant impact on the mode choice modeling, it was crucial for the early adoption of Hyperloop. The gender impact on the early adoption should be considered in developing policy and marketing strategies of Hyperloop.
Most respondents in this study normally used high-speed trains (43%) as their primary transport mode for long-distance trips. This group of people would likely have a higher tendency to use and adopt Hyperloop, possibly due to their already low satisfaction with HST compared to flights. The same was also observed for public transport users.
For a successful penetration and adoption of Hyperloop systems, this study proved that mode choice decision is highly influenced by service attributes, sociodemographics, and individual attitudes, which should be considered in system planning and policy making. Currently, there are no regulations and official safety requirements for Hyperloop. Therefore, certifications could be a way of gaining users’ trust in terms of safety. Environmental and economic gains from Hyperloop should also be highlighted and compared with current modes. Cost is also crucial for mode choice; therefore, an affordable system would ensure a higher level of inclusiveness. Finally, an integration of Hyperloop within the existing modes would be crucial for an efficient and seamless operation.
The obtained results on significant factors are consistent with prior expectations and previous mode choice literature, where travel time, cost, and safety are often found to be major factors considered for decision making in mode choice. However, owing to the lack of literature in Hyperloop mode choice, this study confirms these findings, but also goes further into estimating a value of time for Hyperloop, as described in Section 5.3. These findings parallel those obtained in Al Haddad et al. [83], in which urban air mobility was assessed as an emerging mode of transport. Understandably, disruptive transport technologies, despite their differences, share commonalities in terms of societal perceptions towards them. In other words, research in Hyperloop could learn from other disruptive modes of transport and look at the lessons learned there, which could possibly be transferable, mostly in terms of policy implications for emerging modes of transport.

6.3. Limitations and Future Work Recommendations

This study of course has its own limitations. The SP survey was developed based on a random experimental design, which may have introduced biased statements and choice scenarios. The online distribution of the questionnaire may have resulted in sampling bias and under-representation of some groups; however, the targeted group of young users was well represented in this research. Still, it would be interesting to look at different age groups, including the working class (employees), as they might be users of interest, commuting for instance longer distances to and from work. In this case, different results could be found, and the current study results and value of time would not be directly applicable; insights from this study concern the targeted age group (younger users), and any extrapolation would need to carefully weigh the results based on the new targeted user group. Moreover, as Hyperloop is still developing, travel times and cost data are limited and purely theoretical. This study incorporated cost values from outside Europe, particularly North America. Translating these values into the European/German context may not be as direct as this study assumed. Due to the lack of safety regulations for Hyperloop, this study compared the Hyperloop, high-speed train, and airplane safety levels to driving safety, which may have caused some confusion for the respondents. Future work could improve these limitations as more research and data on Hyperloop attributes becomes available.

6.4. Conclusions

This study explored users’ preferences of Hyperloop, through mode choice and adoption upon a hypothetical Hyperloop implementation, using a stated preference survey targeting young users in Munich, Germany. A factor analysis identified personality traits, such as confidence, non-confidence, and technology affinity or concerns, as significant latent variables and attitude clusters. Discrete choice models were developed to emulate transport mode choice for long-distance trips and revealed that despite HST being the currently most prevalent mode for long-distance trips, people would prefer Hyperloop, should it be implemented. Travel cost, travel time, and travel safety were the more influential factors in the mode choice decision.
Sociodemographic attributes, including gender, income, and access to a car, would have various impacts on Hyperloop use and early adoption, as previously discussed. Moreover, prior knowledge of Hyperloop systems and current satisfaction levels with HST and flight services would also be influential. Interestingly, the primary mode for long-distance travel, personal attitude regarding new technologies, and personal confidence are driving factors for late Hyperloop adoption. The presented findings would be the first to address the research gap on Hyperloop mode choice and adoption, contributing to future studies on societal perceptions of this emerging mode and acting as a stepping stone in this unexplored field of study.

Author Contributions

The authors confirm contributions to the paper as follows: study conception and design: C.A.H., M.A., M.A.I. and C.A.; data collection: M.A.I.; analysis and interpretation of results: C.A.H., M.A. and M.A.I.; draft manuscript preparation: C.A.H., M.A. and C.A. All authors have read and agreed to the published version of the manuscript.

Funding

This study was supported by the DAAD Project number 57474280 Verkehr-SuTra: Technologies for Sustainable Transportation, within the Programme: A New Passage to India—Deutsch-Indische Hochschulkooperationen ab 2019, and the German Federal Ministry of Education and Research, Bundesministerium für Bildung und Forschung (BMBF), project FuturTrans: Indo-German Collaborative Research Center on Intelligent Transportation Systems.

Data Availability Statement

The data are not publicly available due to privacy reasons, and in accordance to the consent given by the participants.

Acknowledgments

The authors would like to express sincere gratitude to the respondents who took the time to participate in the survey, which was key to our analysis and obtained insights.

Conflicts of Interest

The authors declare no conflict of interest.

Abbreviations

The following abbreviations are used in this manuscript:
AICAkaike’s Information Criteria
ASCAlternative–specific constant
BICBayesian Information Criteria
HSTHigh–speed train
MNLMultinomial logit model
Ref.Reference
SEStandard error
SPStated preference
UAMUrban air mobility
VOTValue of time

References

  1. United Nations. 68% of the World Population Projected to Live in Urban Areas by 2050; UN: New York, NY, USA, 2018. [Google Scholar]
  2. Angel, S.; Parent, J.; Civco, D.L.; Blei, A.; Potere, D. The dimensions of global urban expansion: Estimates and projections for all countries, 2000–2050. Prog. Plan. 2011, 75, 53–107. [Google Scholar] [CrossRef]
  3. Musk, E. Hyperloop Alpha; Technical Report; SpaceX: Hawthorne, CA, USA, 2013. [Google Scholar]
  4. Alves, F. The Effects of Hyperloop on the Long-Range Personal and Freight Transportation Industry in Europe. Ph.D. Dissertation, Catolica Lisbon, Lisbon, Portugal, 2020. [Google Scholar]
  5. Cooper, D. Hyperloop One ’Proves’ It’s Cheaper Than High-Speed Rail; Engadget, 2016; Available online: https://www.engadget.com/2016-07-06-hyperloop-one-proves-its-cheaper-than-high-speed-rail.html (accessed on 6 October 2022).
  6. Planing, P.; Aljovic, A.; Hilser, J.; Furch, F. Acceptance of Hyperloop: First empirical insights based on a representative study in The Netherlands. PsyArXiv 2020. [Google Scholar] [CrossRef]
  7. Walker, J.; Li, J.; Srinivasan, S.; Bolduc, D. Travel demand models in the developing world: Correcting for measurement errors. Transp. Lett. 2010, 2, 231–243. [Google Scholar] [CrossRef]
  8. Goddard, S. The Hyperloop High Speed Transportation System: An Aerodynamic CFD Investigation of Nozzle Positions and Flow Phenomena. Master’s Thesis, University of the West of England, Bristol, UK, 2016. [Google Scholar]
  9. HyperloopTT. The First Breakthrough Transportation in a Century; HyperloopTT: Los Angeles, CA, USA, 2020. [Google Scholar]
  10. NOACA; HyperloopTT; TEMS. Great Lakes Hyperloop Feasibility Study; Northeast Ohio Areawide Coordinating Agency: Cleveland, OH, USA, 2019. [Google Scholar]
  11. Chandran, N.; Fujita, A. Hyperloop versus airplanes: What’s safer? CNBC, 11 December 2018. [Google Scholar]
  12. González-González, E.; Nogués, S. Railways of the Future: Evolution and prospects of High-Speed, MAGLEV and Hyperloop (2ndPart). Dyna Ing. Ind. 2017, 92, 483–485. [Google Scholar] [CrossRef] [Green Version]
  13. Rajendran, S.; Harper, A. A simulation-based approach to provide insights on Hyperloop network operations. Transp. Res. Interdiscip. Perspect. 2020, 4, 100092. [Google Scholar] [CrossRef]
  14. Marshall, W. Hyperloop: Shaping the Future of Transport. Part 1. 2019. Available online: www.theNBS.com (accessed on 15 August 2022).
  15. MORPC. Hyperloop Feasibility Study; Northeast Ohio Areawide Coordinating Agency: Cleveland, OH, USA, 2020. [Google Scholar]
  16. Pączek, P. The Hyperloop Concept Compared to the Economic Performance of Other Means of Transportation. Zeszyty Naukowe Wyższej Szkoły Technicznej w Katowicach 2017, 9, 127–143. [Google Scholar]
  17. Decker, K. Conceptual Feasibility Study of the Hyperloop Vehicle for Next-Generation Transport. In Proceedings of the AIAA SciTech 2017, Gaylord Texan, TX, USA, 9–13 January 2017. [Google Scholar]
  18. Schenker, J.L. Hyperloop Will Change Inter-City Travel - The Innovator news. The Innovator News, 1 September 2019. [Google Scholar]
  19. Antoniou, L. How will hyperloop systems affect society and transport? Intelligent Transport, 2018. Available online: https://www.intelligenttransport.com/transport-articles/74281/hyperloop-systems-society-transport/(accessed on 6 October 2022).
  20. Bordone, F. Hyperloop for the European Market: A Qualitative Study for a Possible Application. Master’s Thesis, University of Kassel, Kassel, Germany, 2018. [Google Scholar]
  21. Taylor, C.L.; Hyde, D.J.; Barr, L.C. Hyperloop Commercial Feasibility Analysis: High Level Overview; NASA: Cleveland, OH, USA, 1 July 2016.
  22. Virgin Hyperloop. Virgin Hyperloop|Pegasus. 2020. Available online: https://virginhyperloop.com/pegasus (accessed on 6 October 2022).
  23. Berger, R. Hyperloop Is Shaking up More Than Transportation. Think:Act Magazine, 1 August 2019. [Google Scholar]
  24. Asher, L. Op-ed: The hyperloop will revolutionize transportation in the post-coronavirus world. CNBC, 2 September 2020. [Google Scholar]
  25. Arch2O. Hyperloop Transportation and What It Means for Architecture. Arch2O.com. 2020. Available online: https://www.arch2o.com/hyperloop-transportation-means-architecture/ (accessed on 6 October 2022).
  26. Covell, J. Hyperloop Technology: Economic Analysis of a Transportation Revolution. Baccalaureate’s Thesis, The Pennsylvania State University, State College, PA, USA, 2017. [Google Scholar]
  27. Hansen, I.A. Hyperloop transport technology assessment and system analysis. Transp. Plan. Technol. 2020, 43, 803–820. [Google Scholar] [CrossRef]
  28. Matteo, R. Hyperloop Integration to Reach the NOAH Concept. Ph.D. Thesis, Politecnico di Torino, Turin, Italy, 2018. [Google Scholar]
  29. One, V.H. An Economist’s View on the Unprecedented Economics of the Hyperloop. Hyperloop One. 2017. Available online: https://medium.com/hyperloop-one/an-economists-view-on-the-unprecedented-economics-of-the-hyperloop-a76b71cedb3c (accessed on 6 October 2022).
  30. Delas, M.; Dalbavie, J.M.; Boıtier, T. Assessment of Potential Commercial Corridors for Hyperloop Systems; LiU Electronic Press: Linkoeping, Sweden, 2019. [Google Scholar]
  31. HHLA. Hyperloop Cargo Solutions: HHLA Hamburger Hafen und Logistik AG; HyperloopTT: Los Angeles, CA, USA, 2020. [Google Scholar]
  32. Voltes-Dorta, A.; Becker, E. The potential short-term impact of a Hyperloop service between San Francisco and Los Angeles on airport competition in California. Transp. Policy 2018, 71, 45–56. [Google Scholar] [CrossRef] [Green Version]
  33. Kumar, V.A.; Prajwal, G.; Khan, F.; Kapai, C.; Varun, N. Design and Development of Hyperloop Train. Int. J. Res. Eng. Sci. Manag. 2020, 3, 235–238. [Google Scholar]
  34. Greco, G. The High-Speed Future of the Hyperloop and What It Means for Airlines. Skift, 10 April 2018. [Google Scholar]
  35. Bradley, R. The Unbelievable Reality of the Impossible Hyperloop. MIT Technology Review, 10 May 2016. [Google Scholar]
  36. Stubbing, E.; Charette, G.; Ashraf, K. Preliminary Feasibility of Hyperloop Technology; AECOM: Quebec City, QC, Canada, 2020. [Google Scholar]
  37. Online, F. Mumbai-Pune Hyperloop travel in 25 minutes! How the concept of 1220 kmph technology came about; top facts. The Financial Express, 22 February 2020. [Google Scholar]
  38. KPMG. Pre-Feasibility Study Stockholm–Helsinki Using Hyperloop One Technology; KPMG I: Stockholm, Swden, 2016. [Google Scholar]
  39. Sahlgren, T. Helsinki to Stockholm in less than 30 mins by Hyperloop. Scandicorp, 10 May 2016. [Google Scholar]
  40. IV. IV. Hyperloop Transportation Technologies and HHLA form Joint Venture. 12 December 2018. Available online: https://www.internationales-verkehrswesen.de/hyperloop-tt-and-hhla-joint-venture/ (accessed on 6 October 2022).
  41. Welle, D. Hyperloop travel is coming to Europe. DW, 17 July 2017. [Google Scholar]
  42. Business Insider. Dutch startup has made Europe’s first Hyperloop system - Business Insider. Business Insider, 30 July 2019.
  43. Wedia. Hyperloop: Frankfurt to Amsterdam airport in just 50 minutes. IAM EXPAT, 19 April 2019.
  44. Swissinfo. Hyperloop projects inch closer to reality. swissinfo.ch, 28 July 2020.
  45. Swisspod Technologies. Swisspod Technologies—Hyperloop Transportation; 2020; Available online: SwisspodTechnologies---HyperloopTransportation (accessed on 6 October 2022).
  46. De Witte, A.; Hollevoet, J.; Dobruszkes, F.; Hubert, M.; Macharis, C. Linking modal choice to motility: A comprehensive review. Transp. Res. Part A Policy Pract. 2013, 49, 329–341. [Google Scholar] [CrossRef]
  47. Bouscasse, H.; Joly, I.; Peyhardi, J. A new family of qualitative choice models: An application of reference models to travel mode choice. Transp. Res. Part B Methodol. 2019, 121, 74–91. [Google Scholar] [CrossRef]
  48. Khan, U.; Yamamoto, T.; Sato, H. Consumer preferences for hydrogen fuel cell vehicles in Japan. Transp. Res. Part D Transp. Environ. 2020, 87, 102542. [Google Scholar] [CrossRef]
  49. Neely, S.P. Factors Influencing Mode Choice for Intercity Travel from Northern New England to Major Northeastern Cities. Master’s Thesis, University of Vermont, Burlington, VT, USA, 2016. [Google Scholar]
  50. Wang, F.; Ross, C.L. Machine Learning Travel Mode Choices: Comparing the Performance of an Extreme Gradient Boosting Model with a Multinomial Logit Model. Transp. Res. Rec. J. Transp. Res. Board 2018, 2672, 35–45. [Google Scholar] [CrossRef] [Green Version]
  51. Yang, Y.; Wang, X. Modeling the intention to use machine translation for student translators: An extension of Technology Acceptance Model. Comput. Educ. 2019, 133, 116–126. [Google Scholar] [CrossRef]
  52. Fu, M.; Rothfeld, R.; Antoniou, C. Exploring Preferences for Transportation Modes in an Urban Air Mobility Environment: Munich Case Study. Transp. Res. Rec. 2019, 2673, 427–442. [Google Scholar] [CrossRef] [Green Version]
  53. de Bok, M.; Costa, Á.; Melo, S.; Palma, V. Estimation of a mode choice model for long distance travel in Portugal. In Proceedings of the World Conference of Transport Research, Lisboa, Portugal, 11–15 July 2010. [Google Scholar]
  54. Moyano, A.; Moya-Gómez, B.; Gutiérrez, J. Access and egress times to high-speed rail stations: A spatiotemporal accessibility analysis. J. Transp. Geogr. 2018, 73, 84–93. [Google Scholar] [CrossRef]
  55. Eisenhauer, P.; Heckman, J.; Mosso, S. Estimation of Dynamic Discrete Choice Models by Maximum Likelihood and the Simulated Method of Moments. Int. Econ. Rev. 2015, 56, 331–357. [Google Scholar] [CrossRef] [Green Version]
  56. Kant, P. Route Choice Modelling in Dynamic Traffic Assignment. Ph.D. Thesis, University of Twente, Enschede, The Netherlands, 2008. [Google Scholar]
  57. Moeckel, R.; Fussell, R.; Donnelly, R. Mode choice modeling for long-distance travel. Transp. Lett. 2015, 7, 35–46. [Google Scholar] [CrossRef]
  58. Lavieri, P.S.; Bhat, C.R. Investigating objective and subjective factors influencing the adoption, frequency, and characteristics of ride-hailing trips. Transp. Res. Part C Emerg. Technol. 2019, 105, 100–125. [Google Scholar] [CrossRef]
  59. Li, J.; Jia, S.; Zhang, S.; Wang, Y. Modeling and Analysis of Ticketing Channel Choice for Intercity Bus Passengers: A Case Study in Beijing, China. J. Adv. Transp. 2019, 2019, 1–14. [Google Scholar] [CrossRef] [Green Version]
  60. Ni, X. Factors Affecting Public Support of Transportation Policies: Using an International Survey and Hybrid Discrete Choice Modeling. Master’s Thesis, Massachusetts Institute of Technology, Cambridge, MA, USA, 2019. [Google Scholar]
  61. Axhausen, K.W. Capturing Long-Distance Travel; Research Studies in Traffic Engineering Series; Research Studies Press: Baldock, UK, 2003; Volume 3. [Google Scholar]
  62. Pérez, M.d.C. HYPERLOOP: An Analysis of Its Fit in the European Union. Master’s Thesis, Politecnico di Milano, Milan, Italy, 2018. [Google Scholar]
  63. Stronegger, W.J.; Titze, S.; Oja, P. Perceived characteristics of the neighborhood and its association with physical activity behavior and self-rated health. Health Place 2010, 16, 736–743. [Google Scholar] [CrossRef] [PubMed]
  64. Zhao, P.; Li, S. Bicycle-metro integration in a growing city: The determinants of cycling as a transfer mode in metro station areas in Beijing. Transp. Res. Part A Policy Pract. 2017, 99, 46–60. [Google Scholar] [CrossRef]
  65. Limtanakool, N.; Dijst, M.; Schwanen, T. The influence of socioeconomic characteristics, land use and travel time considerations on mode choice for medium- and longer-distance trips. J. Transp. Geogr. 2006, 14, 327–341. [Google Scholar] [CrossRef]
  66. Mallett, W.J. Long-Distance Travel by Women: Results from the 1995 American Travel Survey. Transp. Res. Rec. 1999, 1693, 71–78. [Google Scholar] [CrossRef]
  67. Bhat, C.R. An Endogenous Segmentation Mode Choice Model with an Application to Intercity Travel. Transp. Sci. 1997, 31, 34–48. [Google Scholar] [CrossRef] [Green Version]
  68. Georggi, N.; Pendyala, R. Analysis of long-distance travel behavior of the elderly and low income. Transp. Res. Circ. 2001, E-C026, 121–150. [Google Scholar]
  69. Dieleman, F.M.; Dijst, M.; Burghouwt, G. Urban Form and Travel Behaviour: Micro-level Household Attributes and Residential Context. Urban Stud. 2002, 39, 507–527. [Google Scholar] [CrossRef]
  70. Pan, H.; Shen, Q.; Zhang, M. Influence of Urban Form on Travel Behaviour in Four Neighbourhoods of Shanghai. Urban Stud. 2009, 46, 275–294. [Google Scholar] [CrossRef]
  71. Wang, D. Place, context and activity–travel behavior: Introduction to the special section on geographies of activity–travel behavior. J. Transp. Geogr. 2015, 47, 84–89. [Google Scholar] [CrossRef]
  72. Pels, E.; Nijkamp, P.; Rietveld, P. Access to and competition between airports: A case study for the San Francisco Bay area. Transp. Res. Part A Policy Pract. 2003, 37, 71–83. [Google Scholar] [CrossRef]
  73. Algers, S. Integrated Structure of Long-Distance Travel Behavior Models in Sweden. Transp. Res. Rec. 1993, 1413, 141. [Google Scholar]
  74. Cervero, R. Walk-and-Ride: Factors Influencing Pedestrian Access to Transit. J. Public Transp. 2001, 3, 1–23. [Google Scholar] [CrossRef] [Green Version]
  75. Krygsman, S.; Dijst, M.; Arentze, T. Multimodal public transport: An analysis of travel time elements and the interconnectivity ratio. Transp. Policy 2004, 11, 265–275. [Google Scholar] [CrossRef]
  76. Martens, K. The bicycle as a feedering mode: Experiences from three European countries. Transp. Res. Part D Transp. Environ. 2004, 9, 281–294. [Google Scholar] [CrossRef]
  77. Dobruszkes, F.; Dehon, C.; Givoni, M. Does European high-speed rail affect the current level of air services? An EU-wide analysis. Transp. Res. Part A Policy Pract. 2014, 69, 461–475. [Google Scholar] [CrossRef]
  78. Cervero, R.; Duncan, M. Walking, Bicycling, and Urban Landscapes: Evidence From the San Francisco Bay Area. Am. J. Public Health 2003, 93, 1478–1483. [Google Scholar] [CrossRef]
  79. de Lapparent, M.; Axhausen, K.W.; Frei, A. Long distance mode choice and distributions of values of travel time savings in three European countries. Eur. Transp. 2009, 7. [Google Scholar] [CrossRef]
  80. Lee, B.H.Y.; Waddell, P. Residential mobility and location choice: A nested logit model with sampling of alternatives. Transportation 2010, 37, 587–601. [Google Scholar] [CrossRef] [Green Version]
  81. Ben-Akiva, M.E.; Lerman, S.R. Discrete Choice Analysis: Theory and Application to Travel Demand; MIT Press Series in Transportation Studies; MIT Press: Cambridge, MA, USA; London, UK, 1985; Volume 9. [Google Scholar]
  82. Abouelela, M.; Tirachini, A.; Chaniotakis, E.; Antoniou, C. Characterizing the adoption and frequency of use of a pooled rides service. Transp. Res. Part C Emerg. Technol. 2022, 138, 103632. [Google Scholar] [CrossRef]
  83. Al Haddad, C.; Chaniotakis, E.; Straubinger, A.; Plötner, K.; Antoniou, C. Factors affecting the adoption and use of urban air mobility. Transp. Res. Part A Policy Pract. 2020, 132, 696–712. [Google Scholar] [CrossRef]
  84. Abouelela, M.; Al Haddad, C.; Antoniou, C. Are young users willing to shift from carsharing to scooter–sharing? Transp. Res. Part D Transp. Environ. 2021, 95, 102821. [Google Scholar] [CrossRef]
  85. Walker, J.L.; Wang, Y.; Thorhauge, M.; Ben-Akiva, M. D-efficient or deficient? A robustness analysis of stated choice experimental designs. Theory Decis. 2018, 84, 215–238. [Google Scholar] [CrossRef] [Green Version]
  86. Welle, D. From Berlin to Munich in just four hours. DW, 8 December 2017. [Google Scholar]
  87. Berlin.de. Station Hauptbahnhof (Central Station). 2020. Available online: https://www.berlin.de/en/train-stations/1833747-2932875-station-hauptbahnhof-central-station.en.html (accessed on 6 October 2022).
  88. Statista. Munich: Population by Age Group 2019; Statista: New York, NY, USA, 2020. [Google Scholar]
  89. DFS. Air Traffic in Germany: Mobility Report 2017; Deutsche Flugsicherung (DFS): Erlangen, Germany, 2018. [Google Scholar]
  90. Chrzan, K.; Orme, B. An Overview and Comparison of Design Strategies for Choice-Based Conjoint Analysis. Sawtooth Softw. Res. Pap. Ser. 2000, 98382, 360. [Google Scholar]
  91. Dubernet, I.; Axhausen, K.W. The German value of time and value of reliability study: The survey work. Transportation 2020, 47, 1477–1513. [Google Scholar] [CrossRef] [Green Version]
  92. Burge, P.; Kim, C.W.; Rohr, C.R. Modelling Demand for Long-Distance Travel in Great Britain: Stated Preference Surveys to Support the Modelling of Demand for High-Speed Rail; RAND Corporation: Santa Monica, CA, USA, 2011. [Google Scholar]
  93. Wang, S.; Wang, Q.; Zhao, J. Multitask Learning Deep Neural Networks to Combine Revealed and Stated Preference Data. J. Choice Model. 2020, 37, 100236. [Google Scholar] [CrossRef]
  94. Washington, S.P.; Karlaftis, M.G.; Mannering, F. Statistical and Econometric Methods for Transportation Data Analysis; Chapman and Hall/CRC: Boca Raton, FL, USA, 2003. [Google Scholar] [CrossRef]
  95. Holgado-Tello, F.P.; Chacón-Moscoso, S.; Barbero-García, I.; Vila-Abad, E. Polychoric versus Pearson correlations in exploratory and confirmatory factor analysis of ordinal variables. Qual. Quant. 2010, 44, 153. [Google Scholar] [CrossRef]
  96. Tyrinopoulos, Y.; Antoniou, C. Public transit user satisfaction: Variability and policy implications. Transp. Policy 2008, 15, 260–272. [Google Scholar] [CrossRef]
  97. Costello, A.B.; Osborne, J. Best practices in exploratory factor analysis: Four recommendations for getting the most from your analysis. Pract. Assess. Res. Eval. 2005, 10, 7. [Google Scholar] [CrossRef]
  98. Hair, J.; Anderson, R.; Tatham, R.; Black, W. Multivariate Data Analysis, 5th international ed.; Prentice Hall: Hoboken, NJ, USA, 1998. [Google Scholar]
  99. Heinze, G.; Schemper, M. A solution to the problem of separation in logistic regression. Stat. Med. 2002, 21, 2409–2419. [Google Scholar] [CrossRef]
  100. Börjesson, M.; Eliasson, J. Experiences from the Swedish Value of Time study. Transp. Res. Part A Policy Pract. 2014, 59, 144–158. [Google Scholar] [CrossRef] [Green Version]
  101. Antoniou, C.; Polydoropoulou, A. The value of privacy: Evidence from the use of mobile devices for traveler information systems. J. Intell. Transp. Syst. 2015, 19, 167–180. [Google Scholar] [CrossRef]
  102. Small, K.A. Valuation of travel time. Econ. Transp. 2012, 1, 2–14. [Google Scholar] [CrossRef]
  103. Wardman, M.; Chintakayala, V.P.K.; de Jong, G. Values of travel time in Europe: Review and meta-analysis. Transp. Res. Part A Policy Pract. 2016, 94, 93–111. [Google Scholar] [CrossRef]
Figure 1. Survey block design example.
Smartcities 05 00068 g001
Figure 2. Main mode of transport as a percentage of total trips by gender.
Smartcities 05 00068 g002
Figure 3. Respondents’ main mode of transport for long-distance trips (≥400 km) by gender.
Smartcities 05 00068 g003
Figure 4. Respondents’ current level satisfaction with airplanes (flights) and high-speed trains by gender.
Smartcities 05 00068 g004
Figure 5. Respondents’ evaluation of mode choice attributes by gender.
Smartcities 05 00068 g005
Figure 6. Respondents’ familiarity with Hyperloop by gender.
Smartcities 05 00068 g006
Figure 7. Relationship between the mode for long-distance trips and mode chosen in the experiment excluding the “None” option.
Smartcities 05 00068 g007
Table 1. Summary of proposed Hyperloop projects.
CountryProposed RouteLengthCompanyDescription/TypeSource(s)
CanadaToronto–Windsor370 kmTransPodPassenger, cargo[36]
ChinaGuizhou, China.-HyperloopTTPassenger, 10 km commercial system in Tongren[36]
IndiaBengaluru–Chennai,
Mumbai–Chennai
350 km

1340 km
Hyperloop OneFeasibility study[22,37]
Saudi ArabiaMecca–Riyadh870 kmTransPodPassenger[36]
SwedenStockholm–Helsinki500 kmHyperloop OneCommercial passenger[38,39]
UKLondon–Glasgow,
Edinburgh–London
820 km
650 km
TransPod
Hyperloop One
passenger system
Cargo
[36]
USACleveland–Chicago,
San Francisco–Los Angeles
520 km

563 km
HyperloopTTNortheast Ohio Coordinating Agency
Commercial passenger, cargo
[4,9,15]
UAEDubai–Abu Dhabi150 kmHyperloopTTPassenger system[9,36]
GermanyHamburg-HyperloopTTJoint Venture Cargo
HTT and Port of Hamburg operator
[31,40,41]
NetherlandsAmsterdam–Frankfurt450 kmHardtPassenger system[42,43]
SwitzerlandZurich–Geneva250 kmSwisspodPassenger and cargo system[44,45]
Table 2. Scenario levels and attributes.
AlternativesAttributesAttribute LevelsValuesUnitSources
HyperloopTravel time−30%, 0%, +30%100/140/180minCreated for this experiment
Travel cost−30%, 0%, +30%46/69/92EURCreated for this experiment
SafetyDriving safety level, two times safer than driving, four times safer than driving [84]
Frequency5 min, 10 min, 15 minEvery 5/10/15minCreated for this experiment
High–speed trainTravel time−30%, 0%, +30%230/310/390min[91,92]
Travel cost−30%, 0%, +30%46/69/96EUR[91,92]
SafetyDriving safety level, two times safer than driving, four times safer than driving [84]
Frequency3, 4, 5 trips/dayevery 5/6/8hour[91,92]
AirplaneTravel time−30%, 0%, +30%180/250/320min[92]
Travel cost−30%, 0%, +30%90/140/190EUR[92]
SafetyDriving safety level, two times safer than driving, four times safer than driving [84]
Frequency3, 4, 5 trips/dayevery 5/6/8hourCreated for this experiment
Table 3. Sample sociodemographic characteristics.
Freq (Pct%)Munich Census (2011)
Gender
Female272 (35%)48.30%
Male487 (62%)51.70%
I prefer not to answer27 (3.4%)
Age
18–24267 (34.1%)8.10%
25–34422 (54%)18%
35+86 (12.3%)73.90%
I prefer not to answer11 (1.4%)
Education
Master or PhD329 (42%)2.5% (PhD)
Bachelor348 (44%)Bachelor/MS: 22.7%
Other101 (13%)
I prefer not to answer8 (1.0%)
Occupation
Working (Full-time)206 (26%)Full/part time 87.1%
Working (Part-time)65 (8.3%)
Student454 (58%)2.90%
Other49 (6.2%)
I prefer not to answer12 (1.5%)
Household Income
Up to 1000 €273 (35%
1000 to less than 2000 €140 (18%)
2000 to less than 3000 €98 (12%)Avg: 4220 €/household
3000 €or more130 (17%)
I prefer not to answer145 (18%)
Driving license
Yes452 (57%)
No319 (41%)
I prefer not to answer15 (2%)
Access to car
Yes374 (48%)
No395 (50%)
I prefer not to answer17 (2%)
Total (N) = 786
Table 4. EFA results for technology and personality-related statements.
Technological Concern StatementFactor 1Factor 2
Excited by the possibilities offered by new technologies0.76
I use new technology products even when expensive0.50
I trust high-speed automated systems0.64
Hyperloop will be successful in Germany0.52
New technologies causes more problems than they solve 0.55
I have concerns regarding personal privacy and data security for my trips 0.44
Sum of square of loadings1.410.56
Proportion variance0.230.10
Cumulative variance0.230.33
Factor interpretationTechnological affinityTechnological concerns
Personality StatementFactor 1Factor 2
My decisions are not usually influenced by what everyone else is doing0.75
Generally, I feel confident and positive about myself0.40
Given the opportunity, there are many things about myself that I would change 0.60
I often change my mind about decisions if my friends or family disagree 0.40
Sum of square of loadings0.740.54
Proportion variance0.180.13
Cumulative variance0.180.31
Factor interpretationConfident personalityNon–confident personality
Table 5. Hyperloop immediate adoption model results (binary logit model).
β Robust SERobust t-Testp-Value
Intercept−0.530.16−3.260.00
Gender (Males)0.340.201.710.04
Confident personality0.190.101.940.03
LL(0) = −327.86
LL(final) = −318.37
ρ 2 = 0.03
AIC = 642.74, BIC = 655.21
Table 6. Multinomial logit model results (Hyperloop vs. other modes).
HyperloopHigh-Speed TrainAirplaneNone
β SEt-Test β SEt-Test β SEt-Test β SEt-Test
Mode characteristics
ASC −0.800.34−2.35−5.480.58−9.44−9.540.77−12.35
Travel time−0.010.00−9.13−0.010.00−13.24−0.010.00−4.77
Travel cost−0.050.00−15.44−0.040.00−13.01−0.010.00−4.86
Safety (ref. = driving level safety)
Safety > = 2* driving safety level0.400.075.620.550.086.55
Safety > = 4* driving safety level0.530.096.190.610.097.060.810.136.30
Individual characteristics
Income level (ref. EUR < = 1000)
Income level: between EUR 1000 and 20000.360.094.16 0.840.184.56
Income level: between EUR 2000 and 30001.660.762.181.530.772.011.950.792.48
Income level: EUR > = 30000.340.113.13 1.590.198.29
Access to car (ref. = no access)2.090.464.571.790.463.922.210.494.52
Familiarity with Hyperloop (ref. = I know a lot about it)
I do not know it−0.150.08−1.96
I have heard about it
I have heard about it and looked into it−0.820.31−2.61−0.550.31−1.75−1.190.35−3.43
Satisfaction with other modes
Satisfaction with HST (ref. = not satisfied)
Neutral−0.750.54−1.41−0.780.54−1.46−0.840.57−1.47
Satisfied−1.180.48−2.45−0.770.48−1.62−1.360.51−2.70
Satisfaction with airplanes (ref. = not satisfied)
Neutral0.430.113.76
Satisfied1.150.353.270.750.342.201.500.374.08
Personal attitudes
Technological affinity0.530.134.070.200.131.480.280.151.93
Technological concern 0.470.085.94
Confident personality −0.180.07−2.76
Non−confident personality0.120.043.25 0.200.082.68
LL(0) = −4522.7, LL(final) = −3815.3
ρ 2 = 0.51, ρ a d j u s t e d 2 = 0.50
AIC = 7728.7, BIC = 80539
Publisher’s Note: MDPI stays neutral with regard to jurisdictional claims in published maps and institutional affiliations.

