1. Introduction
Urban factories are production systems located in an urban environment that utilize the unique resources and characteristics of their surroundings to create products locally with a potentially high degree of customer involvement [
1]. In recent years, the production of customized mobility solutions, such as cargo-bikes or e-scooters, which are tailored to the requirements of specific companies or customers, is increasingly found in urban areas [
2]. There are even reports of car manufacturing factories built in urban areas.
The current mainstream paradigm of car manufacturing, which provides a variety of car models, colors, and options, is called mass customization. Recently, however, there has been growing consensus in the car manufacturing industry that the mass-customization strategy is transforming into a mass-individualization strategy. Mass individualization takes the idea of products being uniquely catered to consumers’ desire and needs [
3]. For example, some car-buying customers may want to replace ordinary car seats with luxury brands such as Louis Vuitton to differentiate themselves. One reason expected to further accelerate this mass-individualization trend is the popularization of EVs capable of autonomous driving.
An AEV does not require a driver to operate the vehicle. As a result, it creates space and time to allow drivers and passengers for other activities instead of focusing on driving. It can be an office for those who are busy with work, or a rest area for those who need a break. If you think of your vehicle as an extension of the home or office, it is no longer an option but a necessity to customize the interior of your vehicle just like an office or a house. This will be the starting point of strategic thinking around implementing mass individualization in car manufacturing processes [
2]. However, it is difficult to mass produce personalized vehicles with the current car-manufacturing processes or value chain designed for the large-volume/low-variety paradigm. This is because the assembly process that provides various options to suit individual tastes becomes more complex and requires more labor, as interior parts become more diverse due to the individualization.
In general, the automobile manufacturing value chain consists of a pressing shop, body shop, paint shop and assembly. The press shop marks the beginning of the automotive production process, where body parts are shaped by precisely cutting metal blanks. The body shop transforms pressed metal parts into the structure of the vehicle by welding or joining. Then, the paint shop applies a protective and visual coating to the product. Finally, the assembly process assembles all sub-components, such as engines, glasses and seats, into vehicles [
4]. It should be noted that the assembly process is distinctly different from other processes in terms of automation level. The level of automation in press shops, body shops and paint shops is usually very high, with many reaching nearly 100%. However, the final assembly process is difficult to automate due to job complexity and part diversities. One way to achieve mass individualization while accepting different automation levels is to decouple the final assembly process from the traditional value-chain model. In other words, the press shop, body shop, and paint shop are continued in a large-scale mass-production system with high automation in suburbs, while the final assembly process is carried out in separate plants, allowing low automation. In the traditional value-chain model, the press shop, body shop, paint shop and the final assembly have been thought to be fit together in one place. However, once a new value chain is created by decoupling, the assembly process no longer needs to be physically located with the rest of the manufacturing processes. Instead, it can be moved to an urban area where the labor supply is elastic, solving the low-automation issue, and low-volume/high-diversity production can be realized with customer proximity and involvement.
Figure 1 shows the new value chain model in support of mass individualization. Note that the urban micro factories are networked in
Figure 1. The network of micro urban factories is an efficient structure and strategy to respond to the uncertainty of market demand in terms of model and volume. Model and volume flexibility can be maximized by producing different models for each micro urban factory and chaining them [
5].
One serious obstacle expected to occur when building an assembly plant in a city is the limitation on the factory size and space. In particular, in urban car-manufacturing factories, conveyor lines that requires large space, investment and operating costs, become an inflexible and expensive monument. Conveyor lines are essential for traditional assembly factories designed for synchronous manufacturing systems under some special conditions such as high volume, limited styles, long and stable production runs and fixed volume and mix (or penetration ratio). In urban factories, however, it is difficult to secure a large empty space to install conveyor lines which also need a large-scale capital investment. With mass individualization in mind, the urban car assembly factories should adopt an asynchronous manufacturing system in need of volume and mix flexibility, lower investment and high diversity, less facility infrastructure, easier convertibility to future products, an automation friendly process, etc. In other words, the need for a conveyor-less assembly factory comes in. Furthermore, the EV revolution helps enable conveyor-less assembly because the number of components required for EVs is drastically reduced compared to non-EVs.
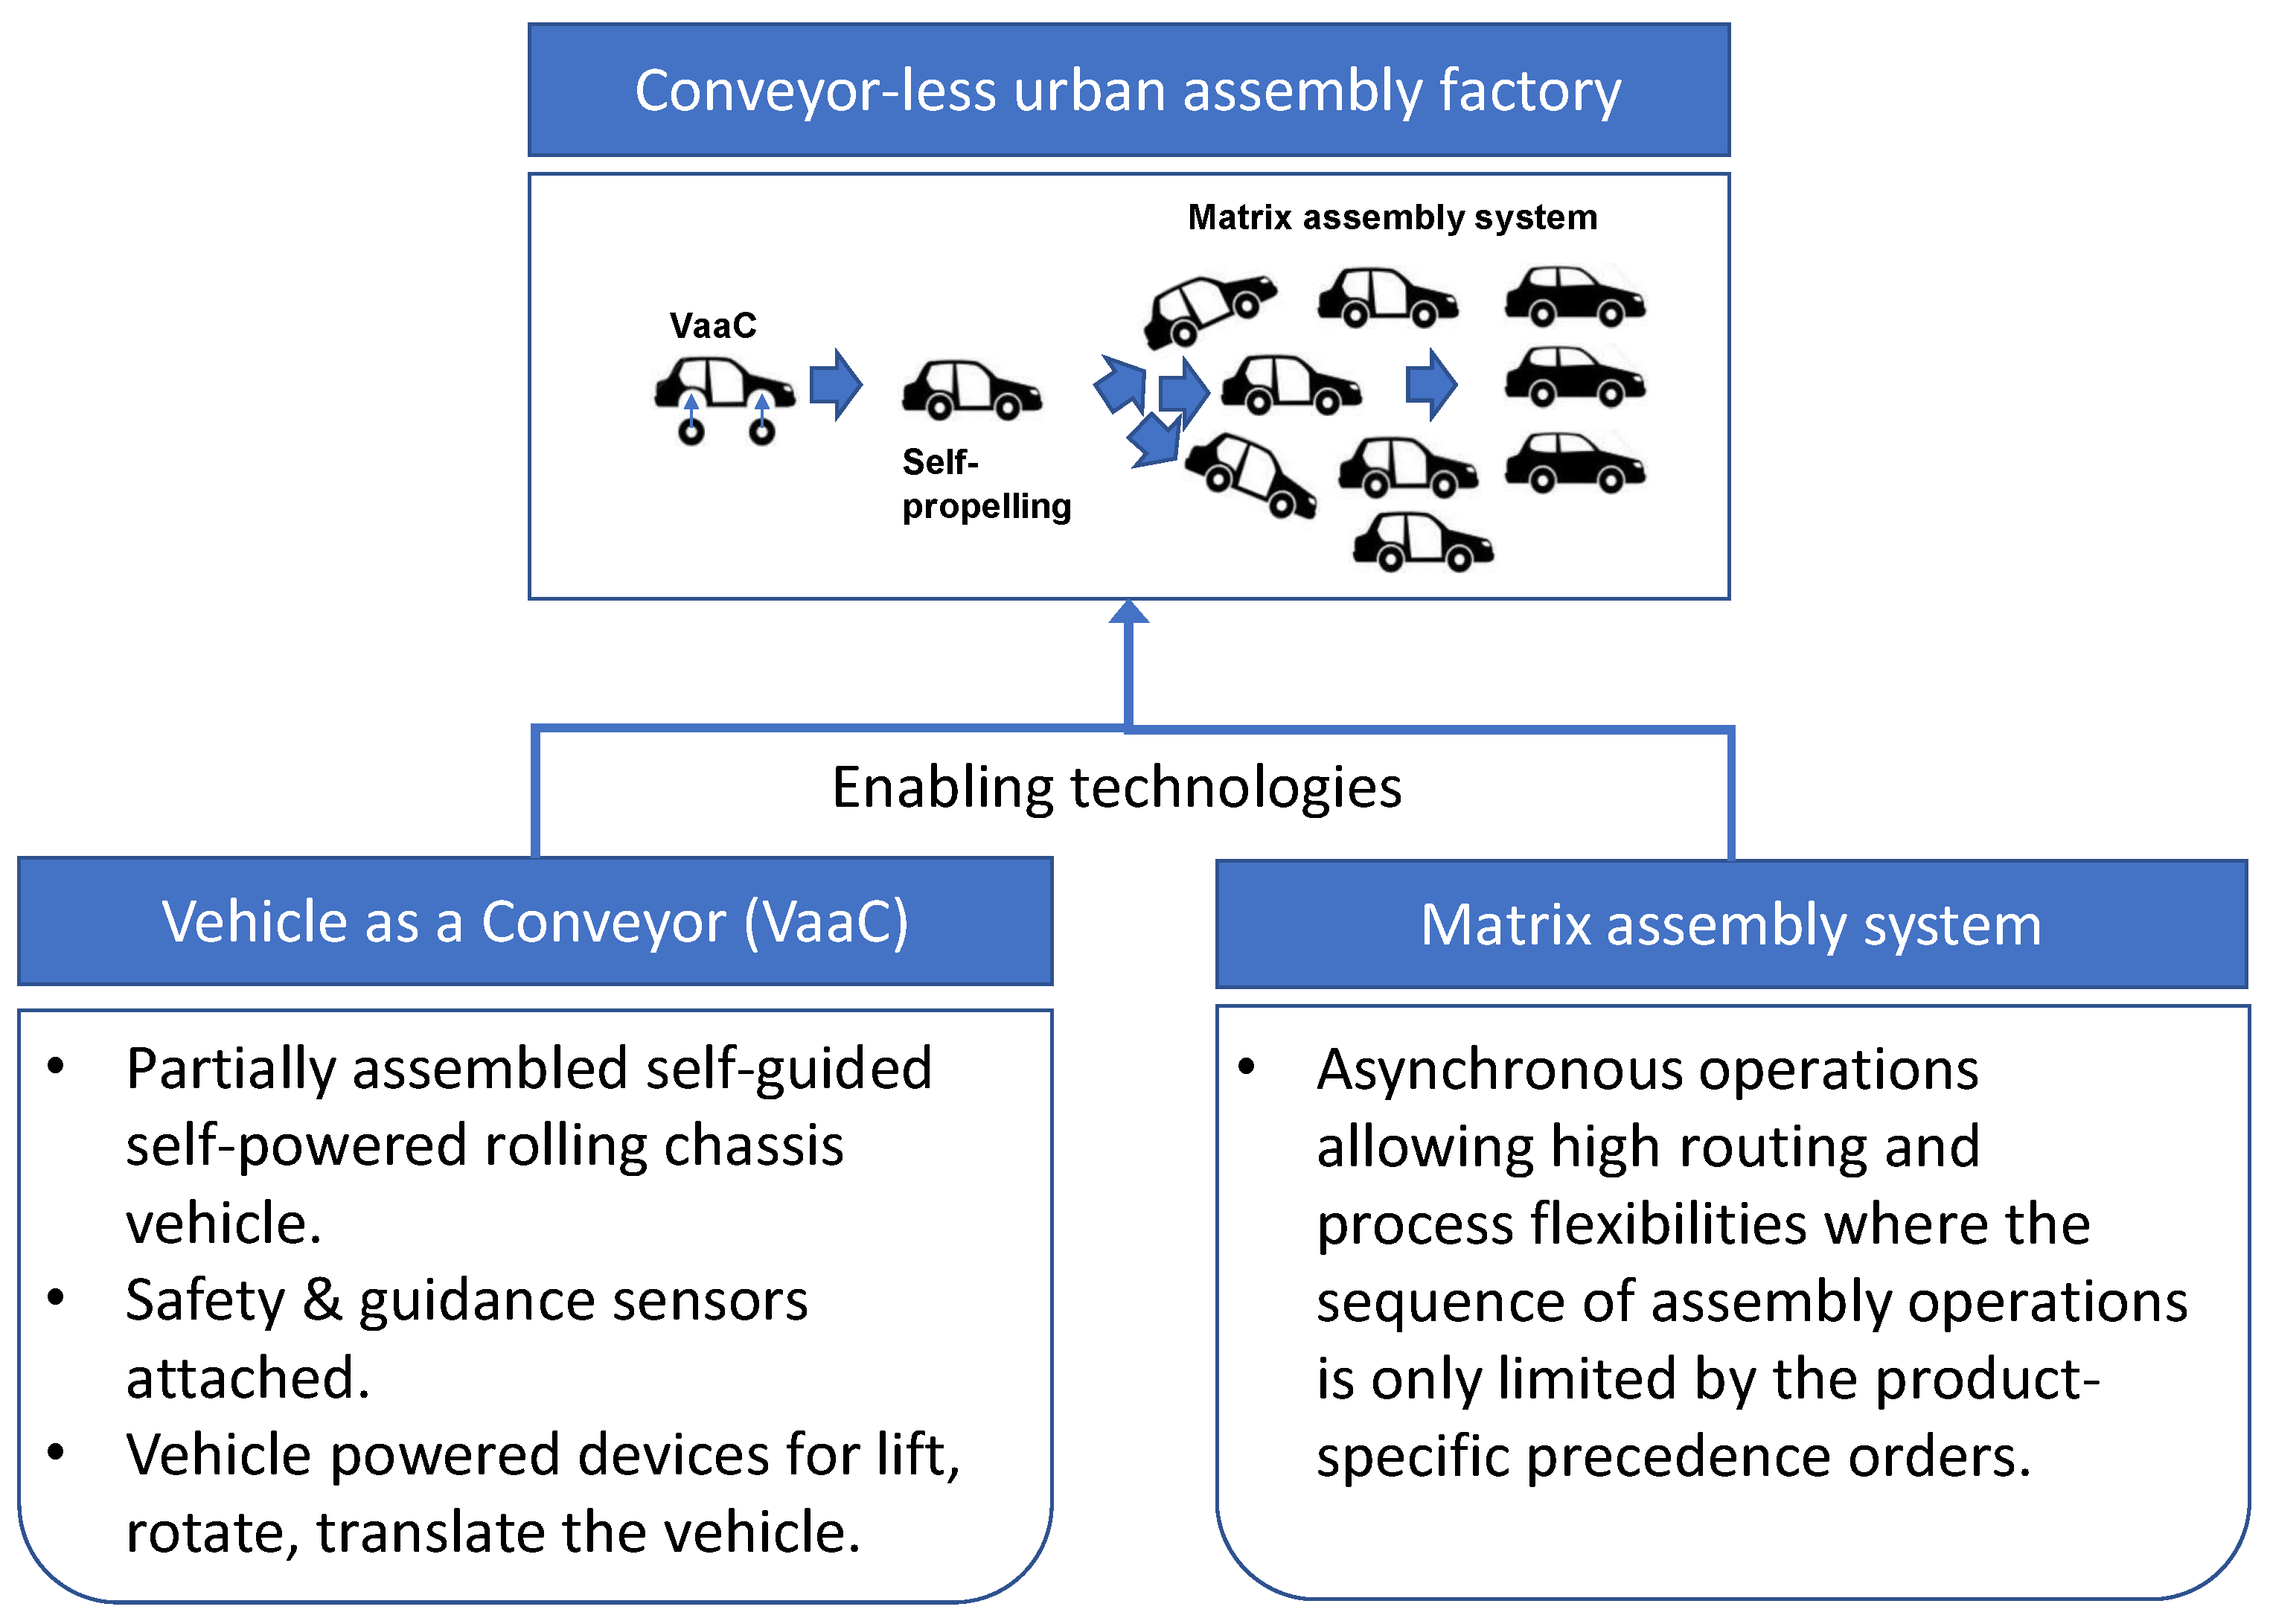
The objective of this study is to propose a new iterative matrix-system layout design method that can realize a conveyor-less urban car assembly factory with two technologies—VaaC and the matrix assembly system.
Figure 2 depicts the overall characteristics of the two presented technologies. This paper is structured as follows.
Section 2 presents a brief review of the existing literature on urban factories and urban car-factory cases.
Section 2 also introduces the concept of VaaC and the matrix system, as well as their features.
Section 3 proposes an iterative matrix-layout design method that consists of four steps: (1) layout refinement, (2) simulation, (3) cost analysis, and (4) optimization check.
Section 4 examines how each step is performed through simple examples. Finally,
Section 5 concludes and provides essential direction for future research.
2. Literature Review
A review of the literature on urban factories shows a significantly increasing research interest in this area. Abdoli et al. [
6] pointed out that people tend to give a lower priority to logistic planning than other decision factors when designing urban factories. Then, they claimed that overlooking the importance of logistics in the early factory-design phase will result in a loss in sustainability of urban factories. To address the issue, they proposed a holistic analysis approach that considers the logistics parts of urban factories, in particular. Ijassia et al. [
7] investigated state-of-the-art urban-factory cases to explore different definitions of the concept of an urban factory. Based on the investigation, the authors proposed a new topology of urban factories with different value-chain profiles. Sajadieh et al. [
8] described megatrends as trends affecting almost every aspect of people’s lives today, such as individualization, climate change, emissions, energy, and resource scarcity, urbanization, and human well-being. The authors predicted that manufacturing industries will be affected by these megatrends without exception. As a solution to the challenges caused by these megatrends, the authors studied the integration of urban production and smart factories enabled with Industry 4.0 technologies. Herrmann et al. [
1] argued that ongoing urbanization and the increasing decentralization of production have increased interest in the urban-factory concept. They explored key technologies and methods, enabling production in cities and requirements to expand and support the urban-factory concept, providing rich examples of various success stories of urban factories.
Increasing manufacturing flexility is a key strategy for implementing urban micro car-making factories where an asynchronous system will play a critical role. In that respect, the studies on applying the concept of asynchronous operating methods to the automobile production processes are important. For example, Kim et al. [
9] and Juxihong et al. [
10] presented new scheduling systems based on a matrix system that can be applied to automobile production, using MDP (Markov decision process) and reinforcement learning. Meanwhile, the research to improve the efficiency of the traditional automobile production system is still active. For example, Oh and Shin [
11] proposed a method to measure the complacency potential of individual car-making plants and induce continuous improvement from them.
Attempts to build a car manufacturing plant within urban areas have always been observed since the birth of the automobile industry. However, a notable change in recent years is the urbanization of EV production. In this section, three examples of urban EV car factories are introduced, as shown in
Table 1. The first case is the microfactory that Arrival, the U.K. EV startup, built in Rock Hill, South Carolina, the United States in 2021 [
12]. The micro-factory concept applied by Arrival is to make electric buses or vans as inexpensive as possible. For example, the use of aluminum-based lightweight materials instead of steel for the frame and body panels made from proprietary composite materials kept the cost of products under control. Additionally, without the need for hundreds of acres of land and specially purposed buildings, the microfactory was able to be built in an existing empty warehouse space in about six months. Its manufacturing processes do not use expensive metal-stamping presses, welding or paint shops, and do not use fixed conveyor assembly lines. Instead, a flat skateboard chassis is assembled from extruded aluminum parts, body panels are bonded with aerospace-style adhesives, and painting is performed by dying the composite material or wrapping a vehicle. AGVs transport body parts and assembly parts in lieu of conveyor lines.
The second example is e.GO Mobile AG’s EV production plant in Aachen. Founded in 2015, e.GO, an EV startup AG, started at RWTH Aachen University in Aachen, Germany. This plant is designed to sublimate the advantages of urban facilities and infrastructures without violating the environmental standards of residential area. For instance, emission-related adjustments and noise insulation measures are adopted to mitigate the impact of the factory on local residents. Furthermore, their inbound and outbound logistics are set up in such a way as to divert the traffic from adjacent residential areas to avoid traffic congestion [
1]. As a result, the e.GO factory is mentioned as a reference urban-factory model that takes full advantage of the attractive and lively urban space and the proximity to customers, suppliers and skilled workers.
A third example is Volkswagen’s urban car plant located in Dresden, Germany. The factory was built in 2001 with a glass structure that allows people to see the inside. Initially, more than 17,000 citizens signed a petition against the factory construction because of expected exhaust emissions from the factory and inbound and outbound trucks. However, the factory was finally able to be built by adopting an innovative idea of using the public-tram infrastructure called CarGoTram to deliver materials and products. At first, the plant produced the luxury limousine Phaeton, and now it runs at a small volume with the daily production of 72 e-Golfs in two shifts [
1].
In addition to these three cases, an urban smart-car factory that is expected to attract the attention of the automobile industry is the Singapore Hyundai Mobility Global Innovation Center (HMGICS). HMGICS, which Hyundai and Kia are advertising as a complete implementation of their new smart-factory concept, the so-called E-Forest, is scheduled to open in the second half of 2022 in Singapore. E-FOREST is an innovative smart-factory concept proposed by Hyundai and Kia to connect people, nature, and technology as one. E-FOREST is said to pursue manufacturing-system innovation through a customer-centric smart-mobility environment, personalization, and mobility services [
8].
Overall, these urban-factory cases can be seen as frontiers in preparation for a new production paradigm, mass individualization.
In addition to the literature from the urban car-factory field, various fields have actively reported on recent studies on urban factories [
13,
14,
15].
2.1. Vehicle as a Conveyor (VaaC)
In urban car-manufacturing factories, the conveyor lines become an inflexible and expensive monument. Therefore, it is desirable to develop a vehicle assembly process that is not dependent on a conveyor system and, instead, achieves high adaptability to demand changes with low-cost investments and asynchronous operations allowing high routing and process flexibilities. There are two conspicuous autonomous transport technologies within production to enable the conveyor-less matrix assembly system: AMR (autonomous mobile robot) and VaaC (vehicle as a conveyor). AMRs are vehicles that are equipped with on-board sensors to autonomously move partially assembly vehicles or materials along predefined process plans without the need of magnetic tapes coated on the building floor that AGVs (automatic guided vehicles) need. While AMR technology has been covered and highlighted by many publications over the years, the concept of VaaC is totally new.
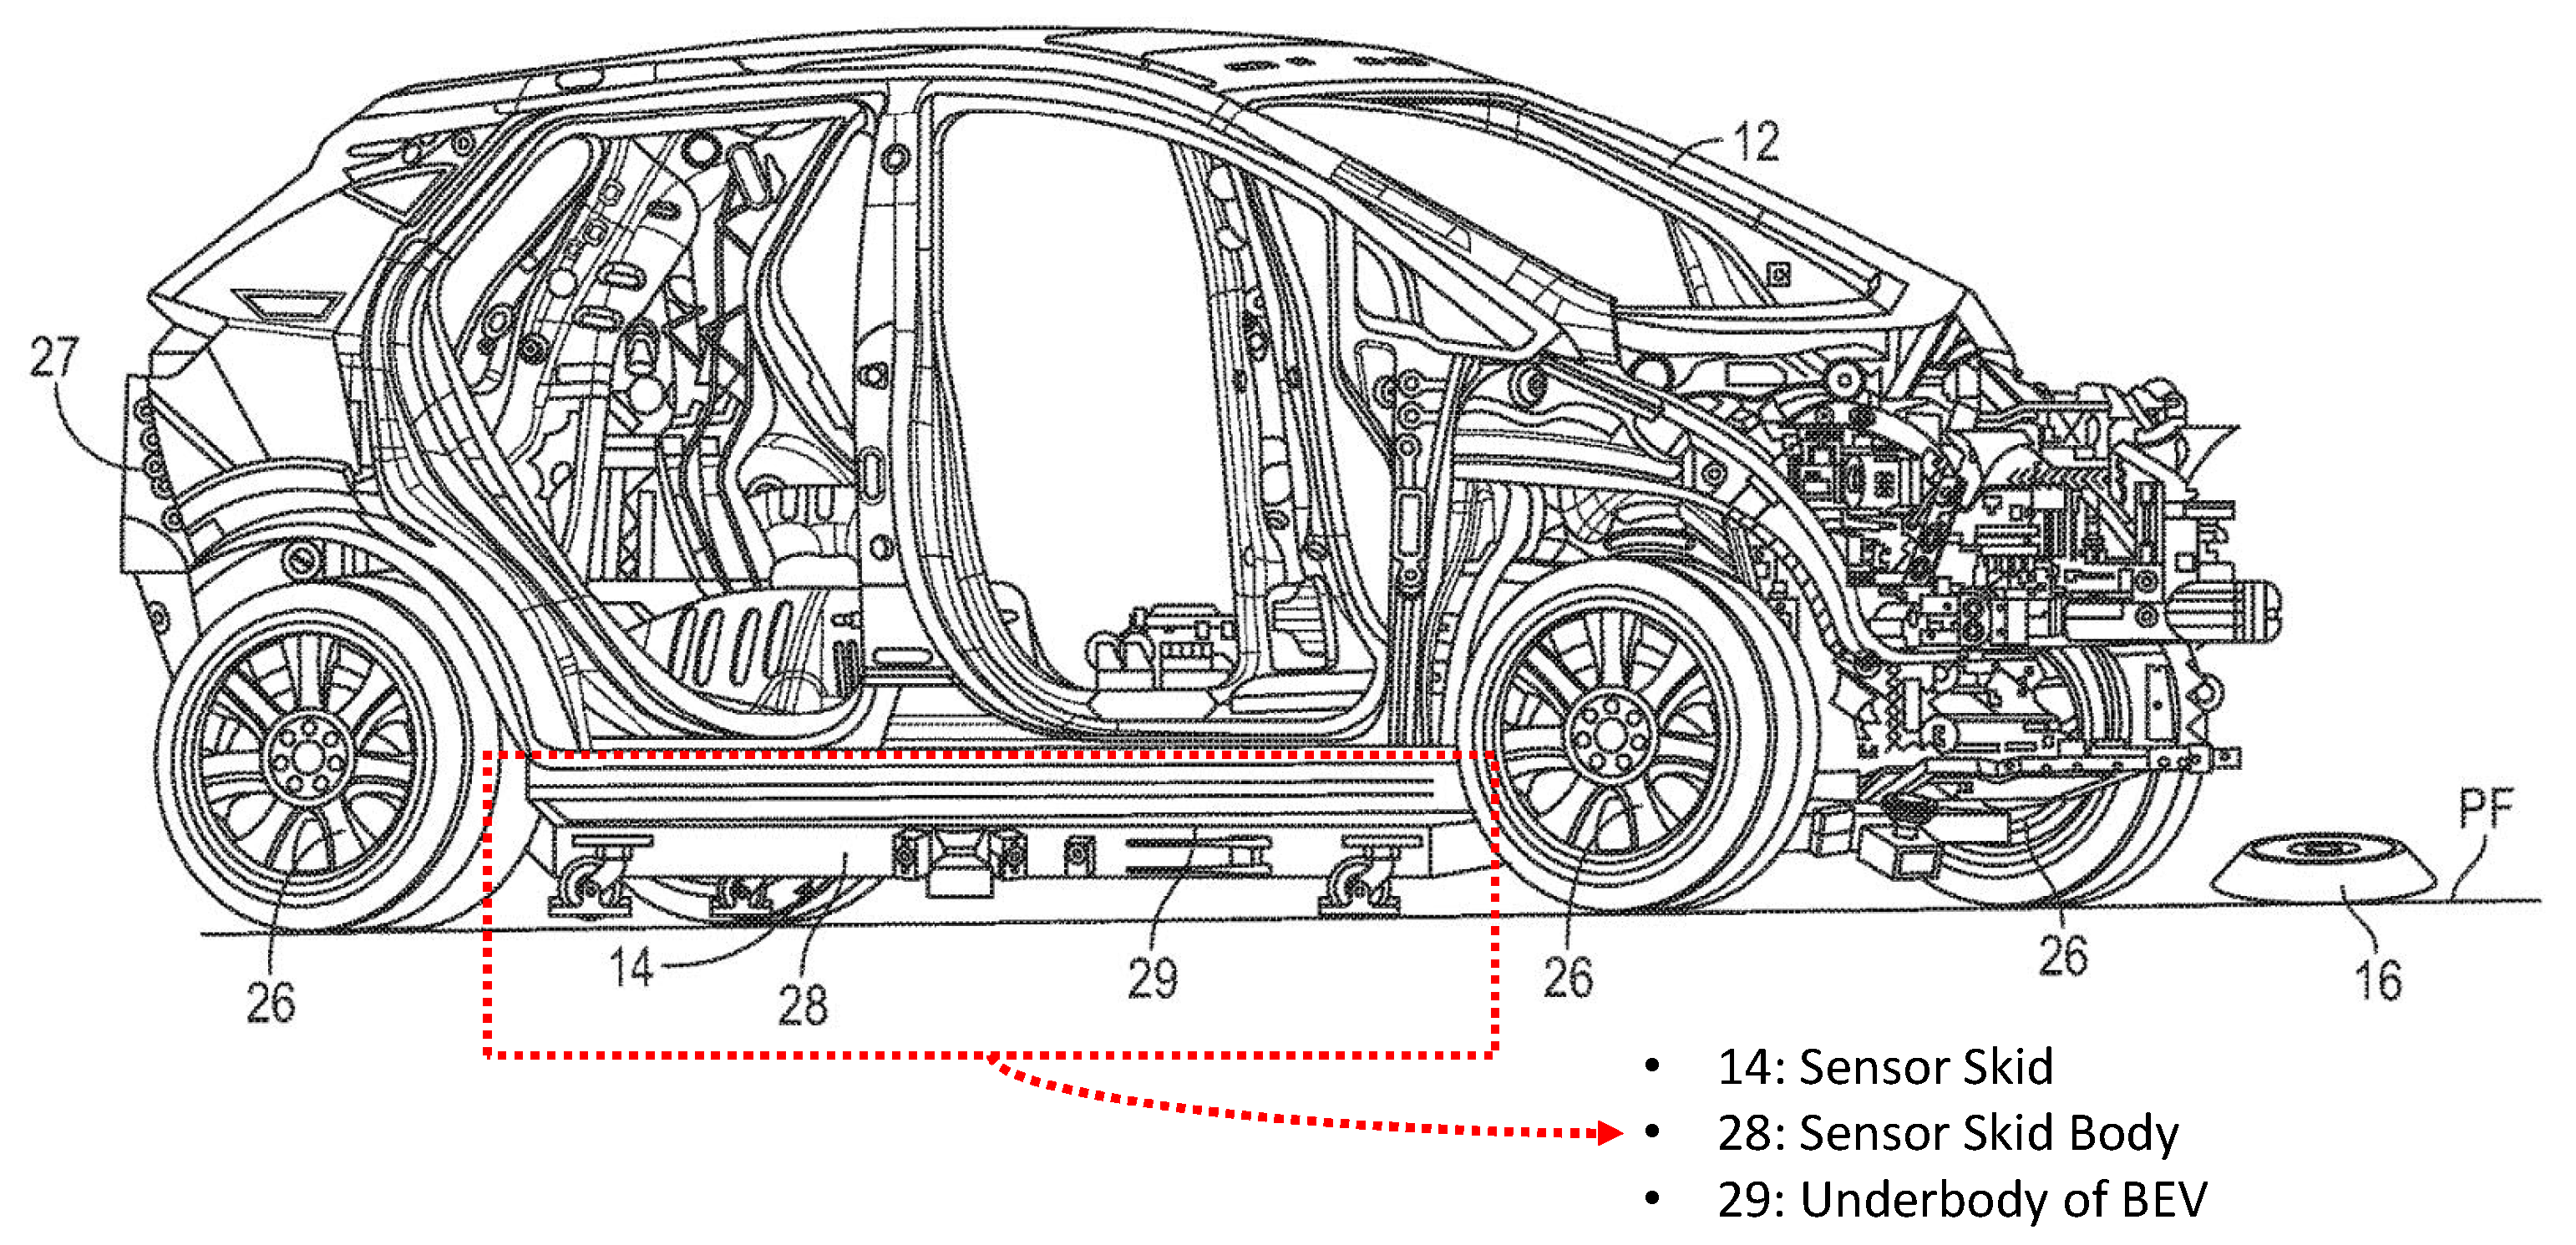
This section will discuss technologies to implement the concept of VaaC. VaaC is defined as a partially assembled BEV (battery electric vehicle) that self-guides through an assembly process with a sensor skid temporarily attached under the BEV. The sensor skid that is located under the BEV controls and guides the BEV based on local sensing and communication with a high-level planning/scheduling fleet management system. The sensor skid is attached to the vehicle body temporarily and is configured to be easily removed at the end of the assembly (i.e., minimizing its impact on BEV). The sensor skid includes a plurality of sensors coupled to the skid body where each sensor is configured to detect objects around the BEV. In detail, about the connection mechanism between the sensor skid and the BEV, as shown in
Figure 3, the sensor skid (14) includes a skid body (28) which is configured to be coupled under the underbody (29) of the partially assembled BEV. The skid body (28) has a set of pins which facilitate the temporary engagement to locator holes in the underbody (29). By using the sensor skid, the assembly process control is not dependent on a fixed conveyor system configuration, thereby allowing real-time re-routing and adjusting.
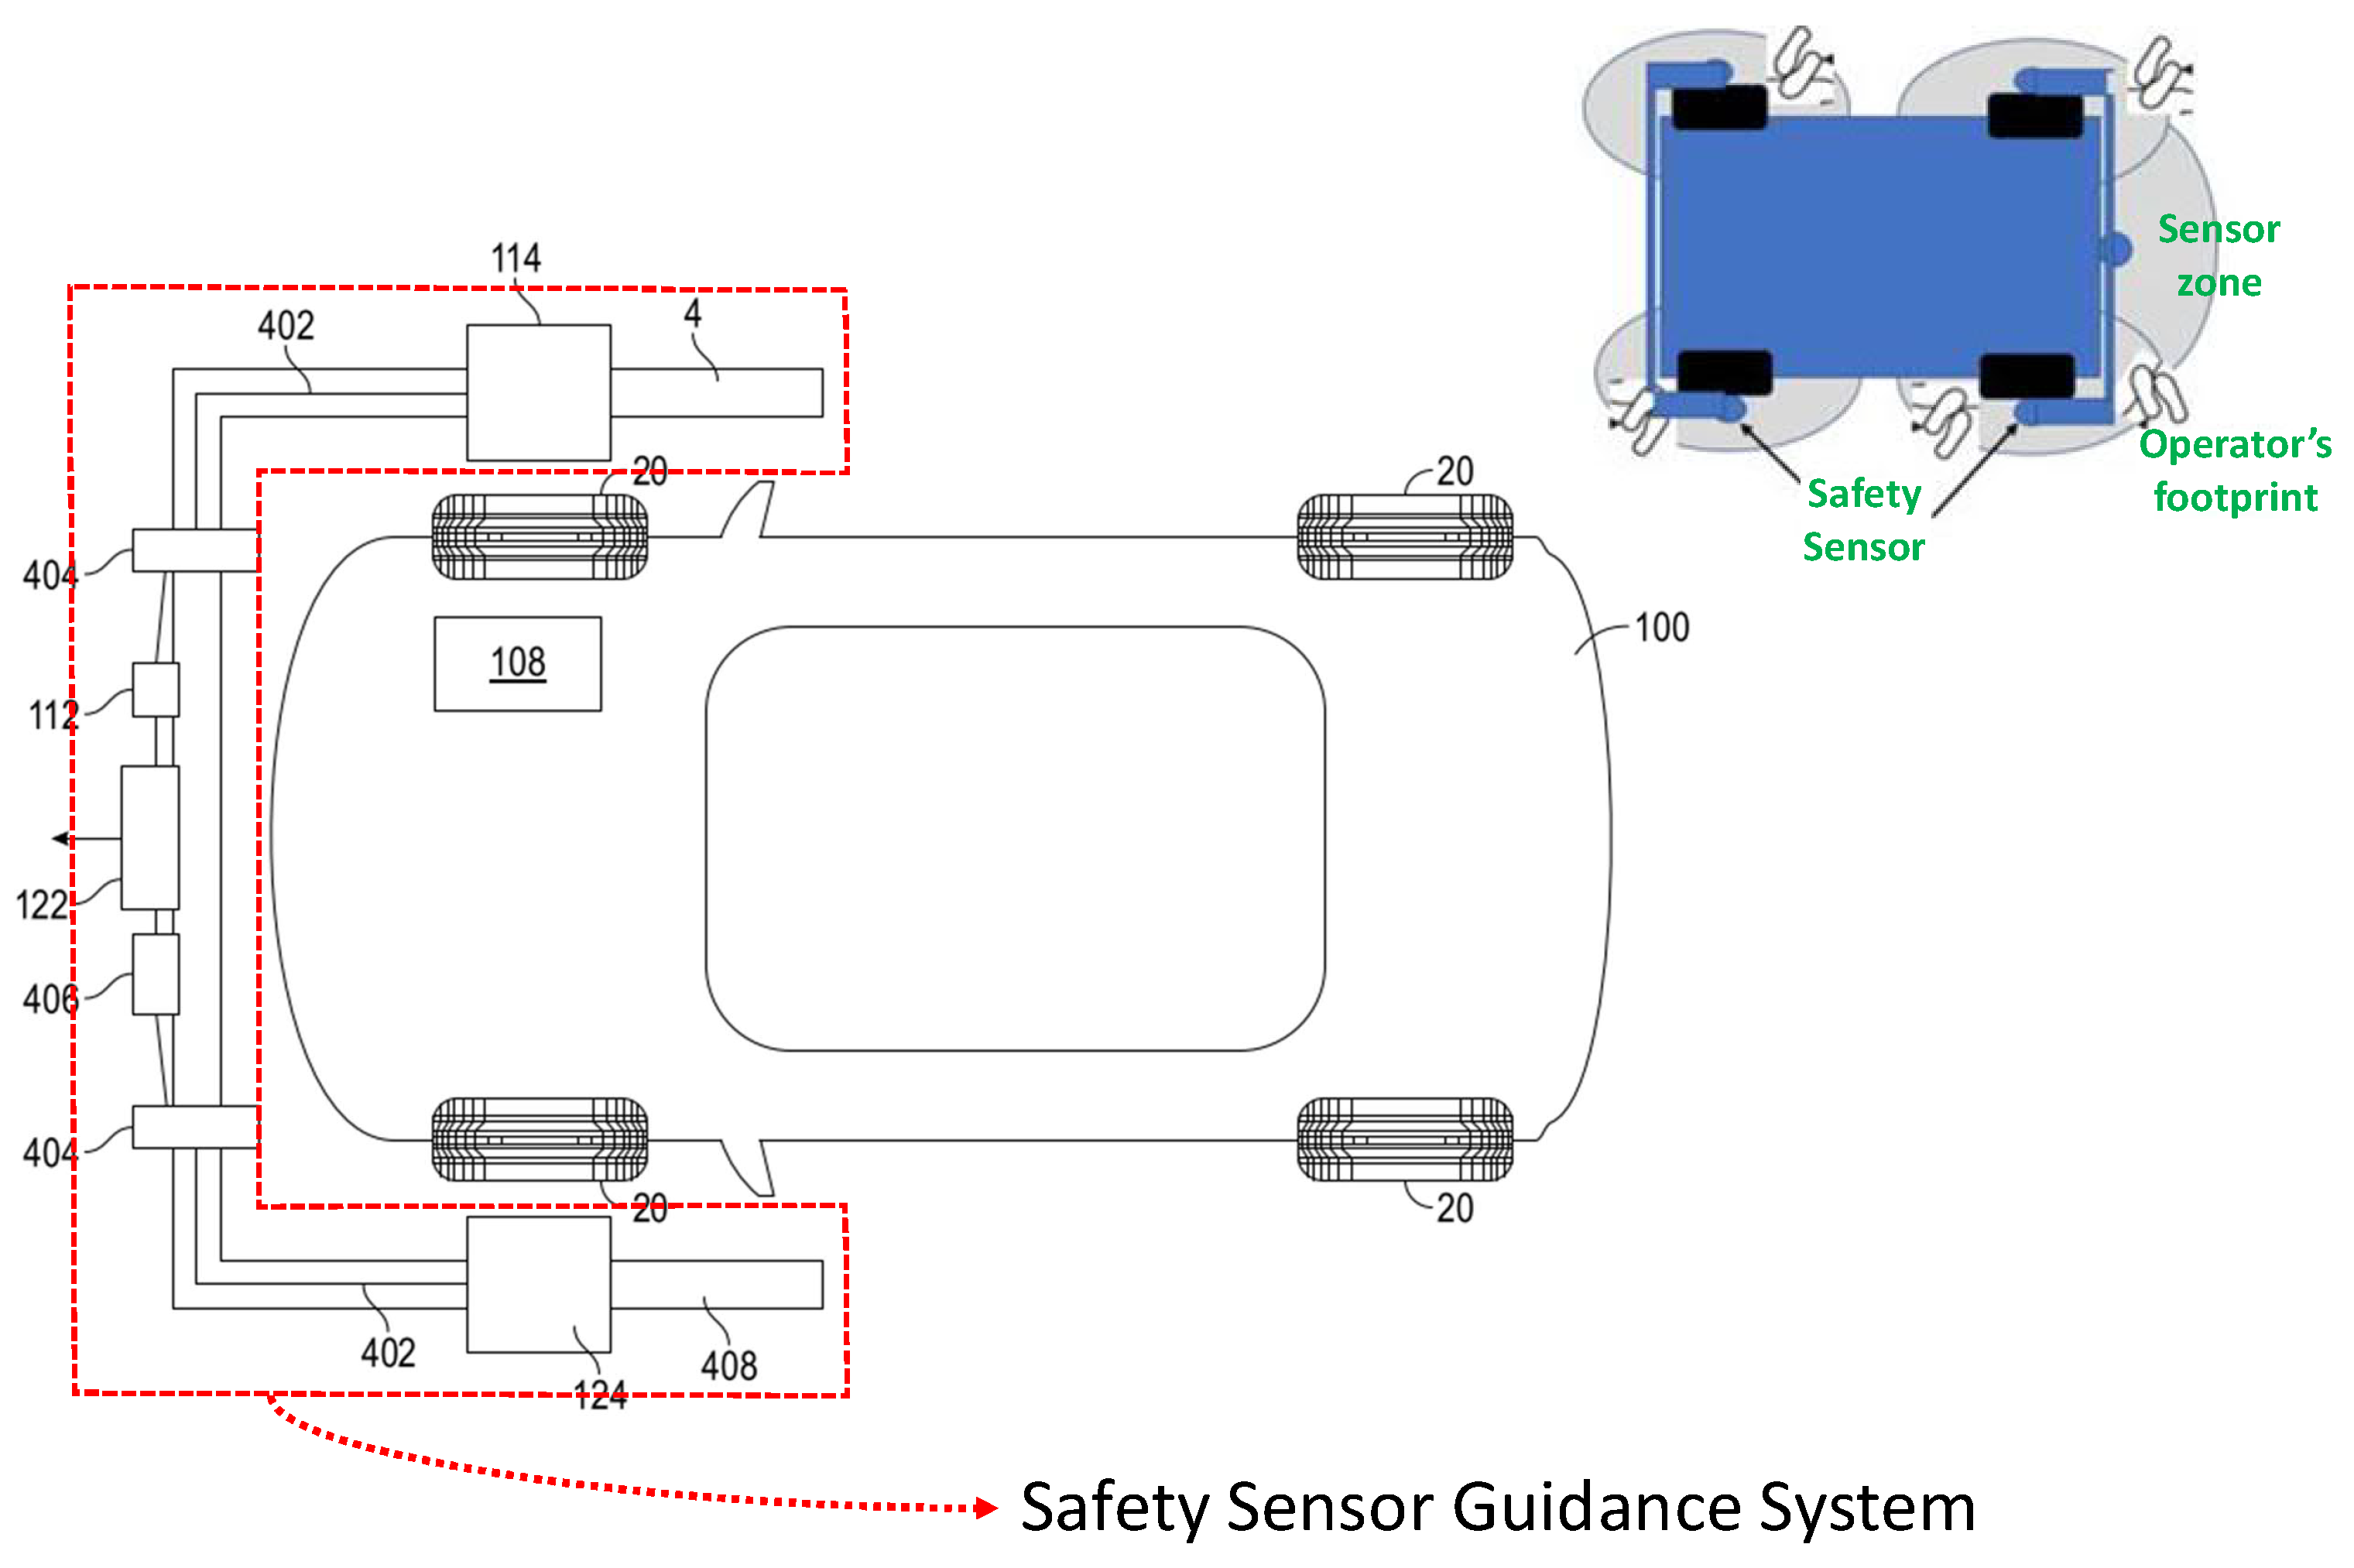
Meanwhile, as an alternative to the sensor skid, a safety-sensor guidance system can be used. The safety-sensor guidance system is mounted to the chassis as in
Figure 4. The system includes a sensor, a transceiver, and an emergency stop (estop) device. In detail, the sensor (114) is configured to detect intrusion into a predetermined sensor zone area, measured outward from the respective sensor. The predetermined range is less than two feet but, in practice, would be dictated by accepted standards for safety-rated sensing and stopping distances. For example, if the operator’s footprint comes within the range, the sensor detects it and stops the vehicle. The safety-sensor guidance system further includes a path projector (122) configured to project a visible beam forward from the vehicle. In some cases, the safety sensor guidance system attaches multiple sensors at one or more different corners of the chassis. For example, a first sensor (114) may be affixed to a first corner of the chassis, and, wherein the safety sensor guidance system further includes second sensor affixed (124) to a second corner of the chassis, a third sensor is affixed to a third corner of the chassis, and a fourth sensor affixed to a fourth corner of the chassis. Each sensor may be configured to sense in a three-dimensional volume, such that the volumes overlap to create a buffer zone around the chassis. For automatic driving, a safety-sensor guidance system temporarily takes over a partially assembled vehicle. In other words, during the temporary takeover, a safety-sensor guidance system temporarily re-purposes various onboard ECM modules with manufacturing-specific software protocols to accept commands for odometry, deceleration, acceleration, operator sensing, and safety protocols.
Another key technology enabling the conveyor-less assembly system is vehicle-powered devices, which help to reposition vehicles. In a typical car assembly plant, it is necessary to use specially designed equipment to reposition vehicles such as lifting the vehicle or tilting it sideways, to optimize the working height for human operators. In such a case, vertically adjustable carriers that are attached to floor conveyors or overhead conveyors have been used to satisfy this requirement. However, that equipment requires a significant amount of external power along with a fixed electrical installation, which is not suitable for urban factories that prefer less facility infrastructure and easier convertibility or reconfigurability to future production models. Accordingly, it is desirable to provide a vehicle-powered device to change the vehicle position, which does not require an external power supply.
In addition, a vehicle-powered device is useful for space saving. In other words, a traditional car manufacturing factory built in a suburban area usually maintains sufficient space for clearance to support a car’s turning motion, which requires a wide turning radius. Indeed, cars often need to turn during their movement between stations. In this case, the vehicle-powered device can be used to move the vehicle directly in parallel or vertically, which saves space, which is useful for urban factories where space is limited.
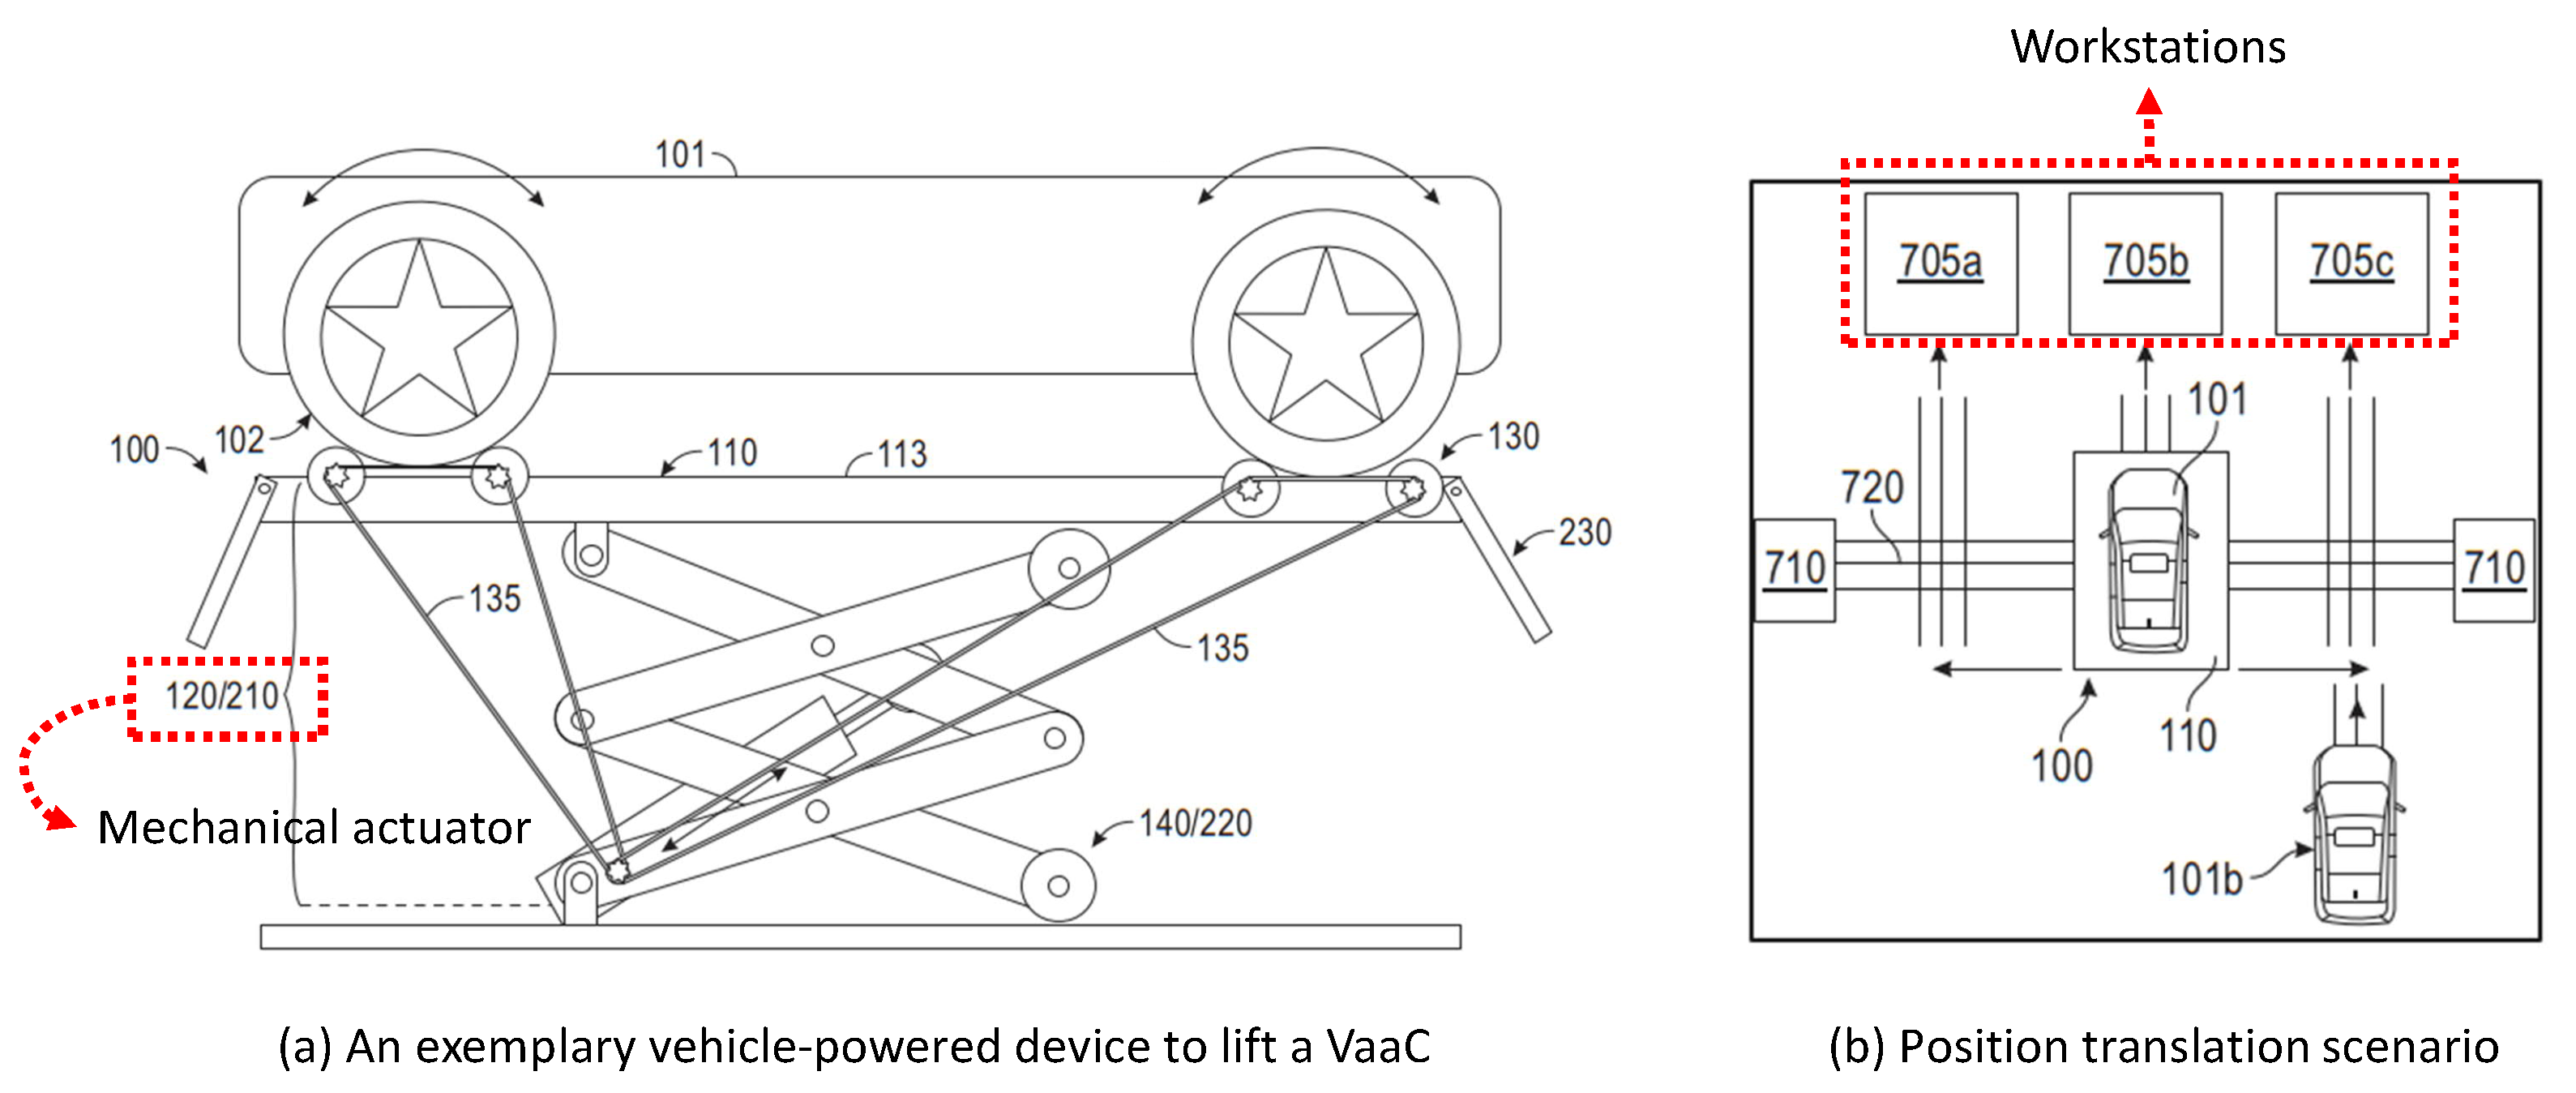
The main feature of vehicle-powered devices is a mechanical actuator to actuate the passive motion device based on the movement of one or more wheels of the vehicle to change a position of the vehicle, wherein the position of the vehicle relative to the platform is unchanged and the passive motion device is actuated by only the movement of one or more wheels of the vehicle without a need for external power.
In detail, as shown in (a) of
Figure 5, the mechanical actuator (120) includes two rollers (130) and a belt (135), and the passive motion device (140). Instead of a belt, the mechanical actuator may include other mechanisms such as a chain, drive shaft, or hydraulics, for example. When a wheel (102) of the vehicle is positioned and interlocked between the two rollers of the mechanical actuator, the movement of the wheel (102) results in the belt (135) actuating the passive motion device (140), which lifts the vehicle up or down. Meanwhile, (b) of
Figure 5 illustrates a scenario including a return mechanism for the vehicle-powered device. As shown, a vehicle (101) is on the platform (110) of a vehicle-powered device (100) which translates the position of the vehicle to the left or right so that the vehicle can finish assembly tasks from each of three workstations (705a, 705b, 705c).
2.2. Matrix System
It is claimed that the matrix system has a significant advantage in the two flexibilities—operational flexibility and routing flexibility. Operational flexibility (OF) represents the ability to interchange the order of operations [
16,
17]. Given that a group of products follows the same order of processes, the OF of a product group can be measured as the ratio of alternative precedence graphs to the maximum possible number of alternative precedence graphs.
Meanwhile, routing flexibility (RF) is defined as an ability to account for machine unavailability [
17,
18,
19]. RF can be achieved by utilizing multi-purpose machines that realize alternative routes for parts that encounter unavailable machines. Conceptually, RF equals the average number of machines that can perform one operation.
In fact, there are not many cases of implementing a matrix system in the real industry yet. However, in the field of the automotive industry, KUKA AG demonstrated a matrix production system where the assembly cells in a grid layout and the material handling system were separated and highly automated using various Industry-4.0 technologies [
20].
3. Methodology
The conveyor-less matrix assembly system is characterized by high adaptability to demand changes with low-cost investments and asynchronous operations allowing high routing and process flexibilities where the sequence of assembly operations is only limited by the product-specific precedence orders [
21]. With high flexibility potentials, however, the system needs to face high complexity issues in modeling and control. The high complexity may reduce the system performance, and, thus, one key development need is how to design such an asynchronous matrix system. This section presents an iterative conveyor-less matrix system layout design in such a way as to maximize labor productivity, workstation utilization, and footprint usage, while minimizing system costs and cycle times. Specifically, the target layout design area for an asynchronous assembly system is the automotive trim area.
Trim area is the area where car interiors are assembled, mostly by human workers assisted by appropriate tools. It has a variety of workstations and performs multiple tasks sequentially starting from tagging VIN (vehicle identification number) and assembling many sequenced or bulk parts including instrument panel, glasses, car seat, etc. Some workstations require less specialized tools such as crimp or fastening tool, whereas others require very specialized equipment such as robots with EOAT (end-of-arm tooling) to interact with parts and components. One of the main objectives of the trim area is to maximize vehicle throughput, while minimizing the investment and operating costs.
The design strategy embraces an iterative approach to improve the quality of solutions incrementally while considering the similarity of tools, ergonomics, and human operations between workstations.
3.1. Flexibility Measuring
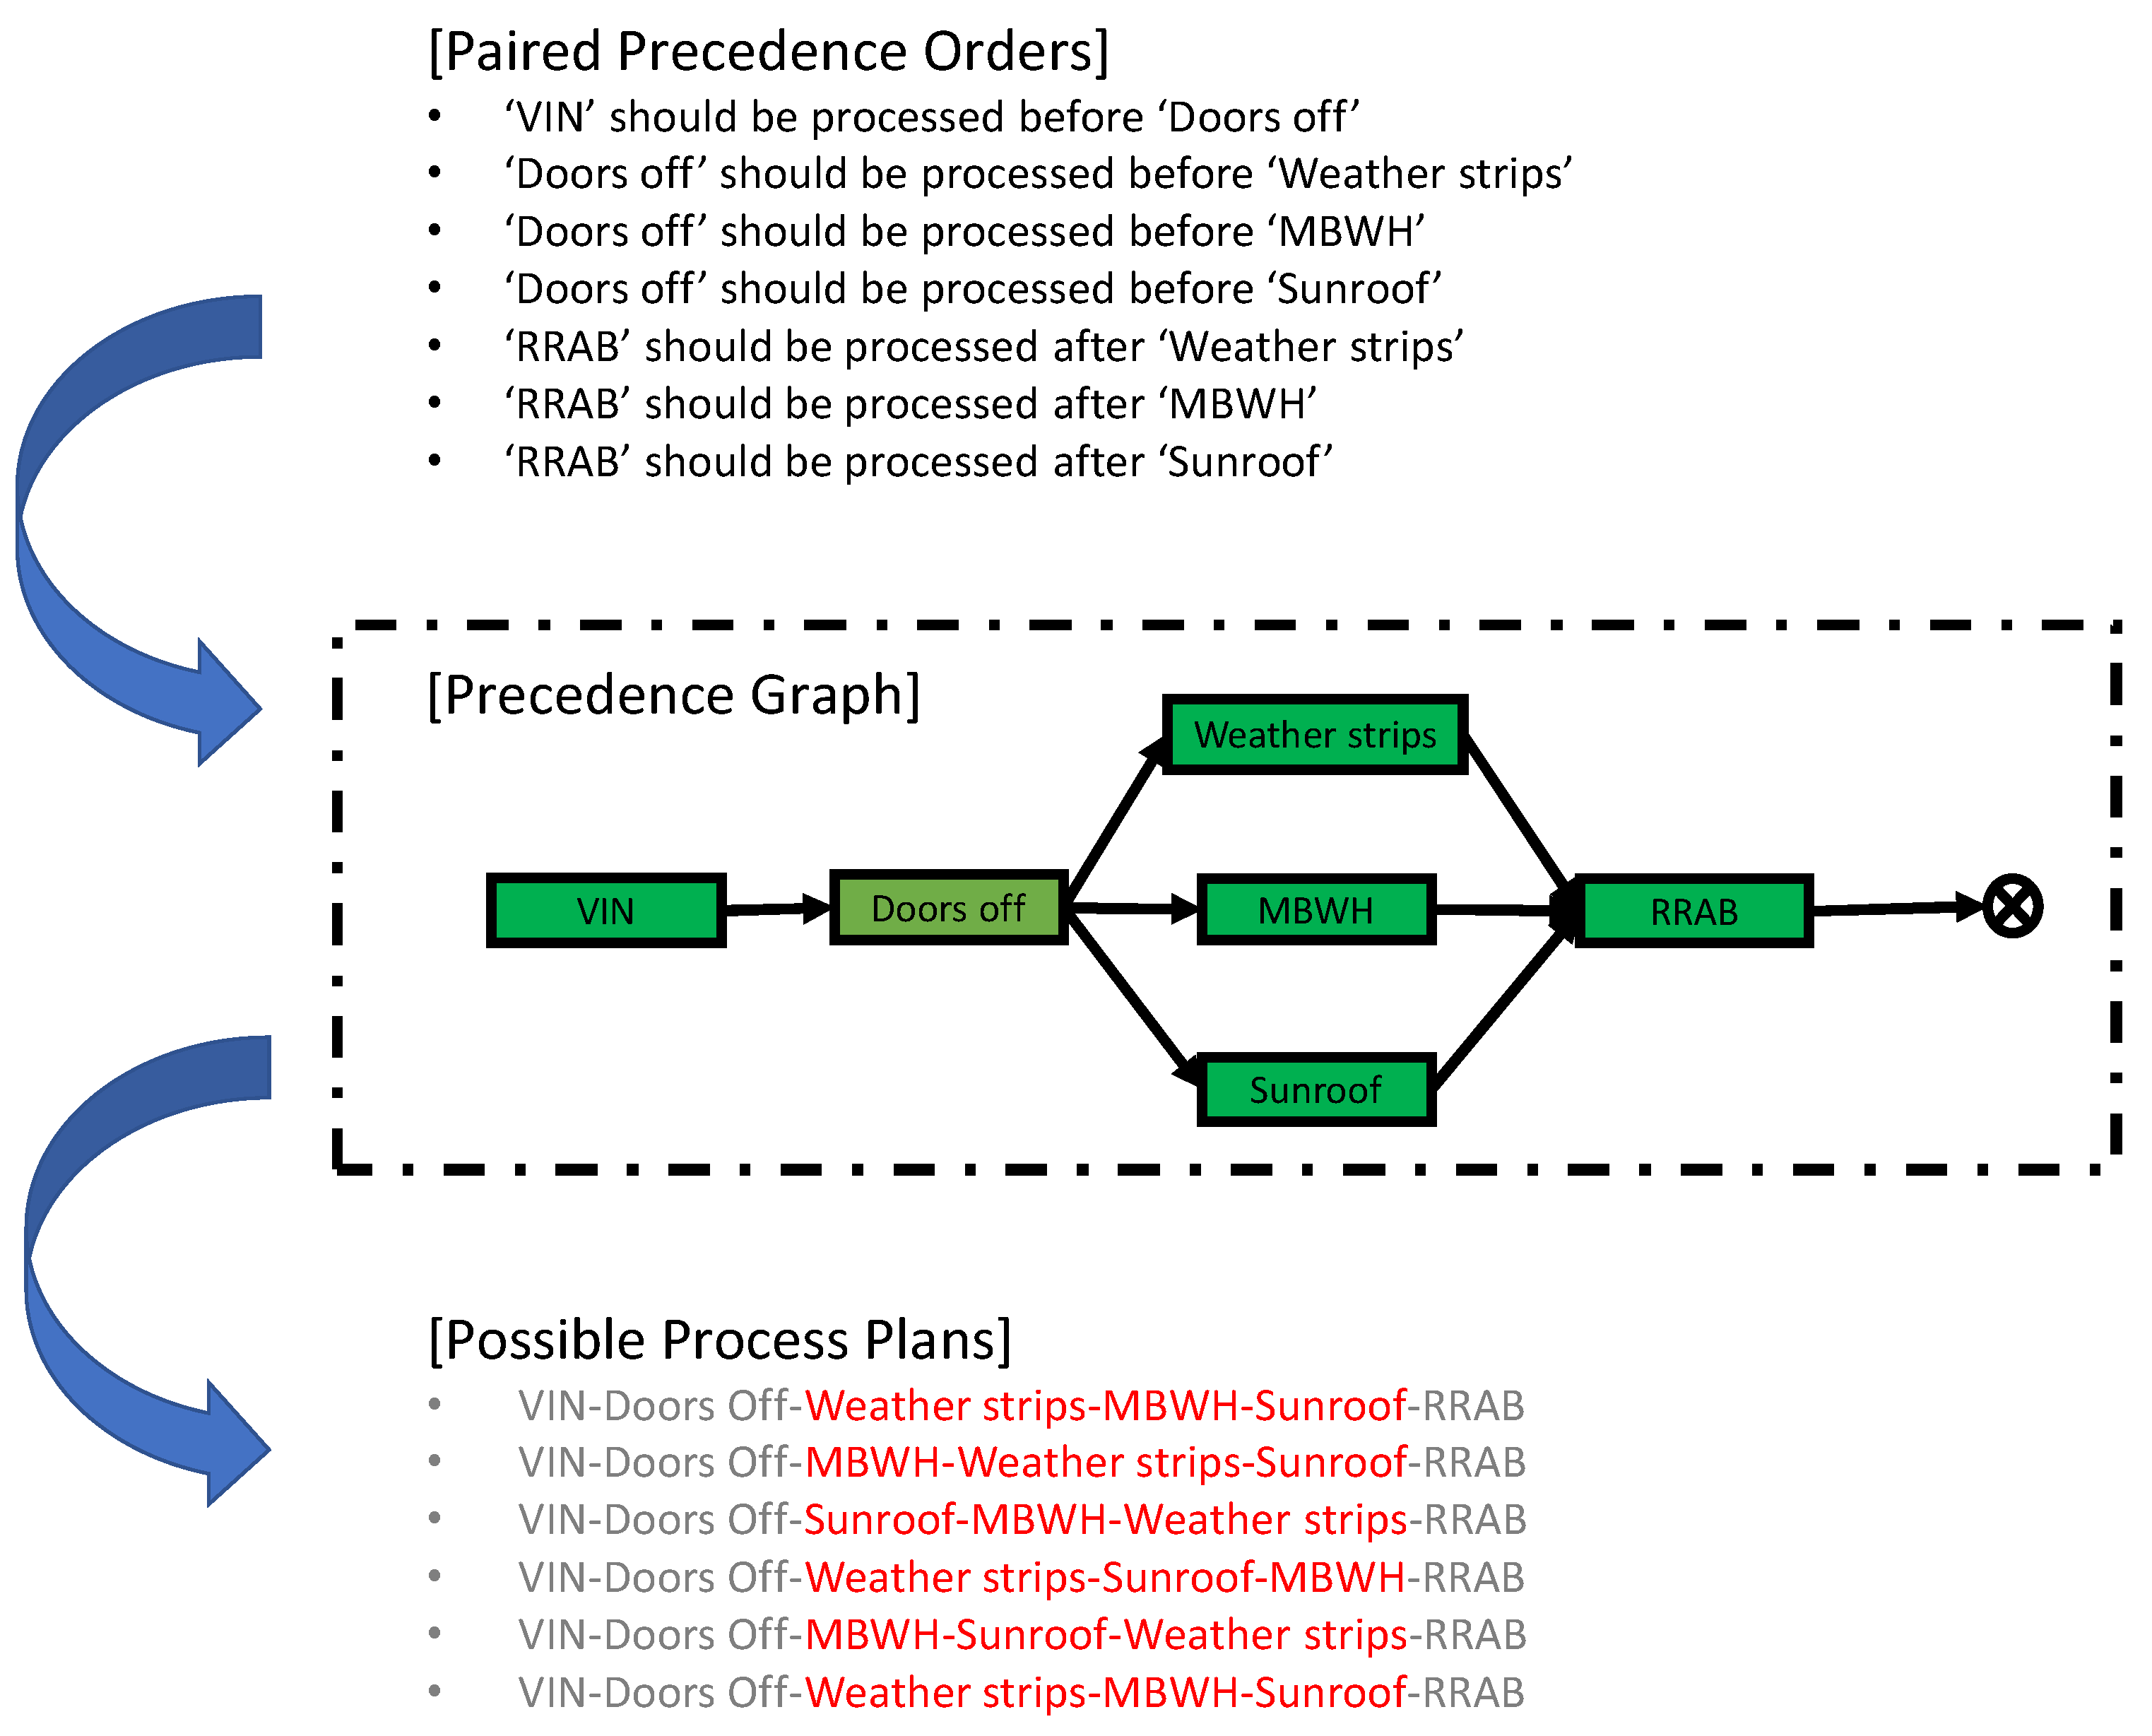
Given that a group of products follows the same order of processes, the OF of the product group can be measured as the ratio of alternative precedence graphs to the maximum possible number of alternative precedence graphs as below:
For example, if a product needs six processes, then the maximum possible number of alternative precedence graphs becomes 6!. In the illustrated example in
Figure 6, only six alternative precedence graphs are possible. Since the total number of alternative precedence graphs is 720 (=6!), OF is equal to 100% (=
) which is 0.833%.
Meanwhile, RF equals the average number of machines that can perform an operation and the following formula is used to measure RF:
where
u equals to the index of operations and
m and
n represent the total number of machines and the total number of operations, respectively;
stands for index set of machines that can perform operation
u.
For example, let us assume that a system has four machines (i.e.,
m = 4) and a product needs four processes (i.e.,
n = 4). In this assumption, if one machine exercises only one process uniquely, RF becomes 25% (=
). On the other hand, if each machine operates all four processes commonly, then RF becomes 100% (=
). The three examples in
Figure 7 shows how the different layouts have different OF and PF values. Three layouts, for illustration, are: (1) in-line layout; (2) matrix layout with each workstation capable of one dedicated operation; (3) matrix layout with one universal workstation capable of all four operations.
3.2. Similarity Measuring
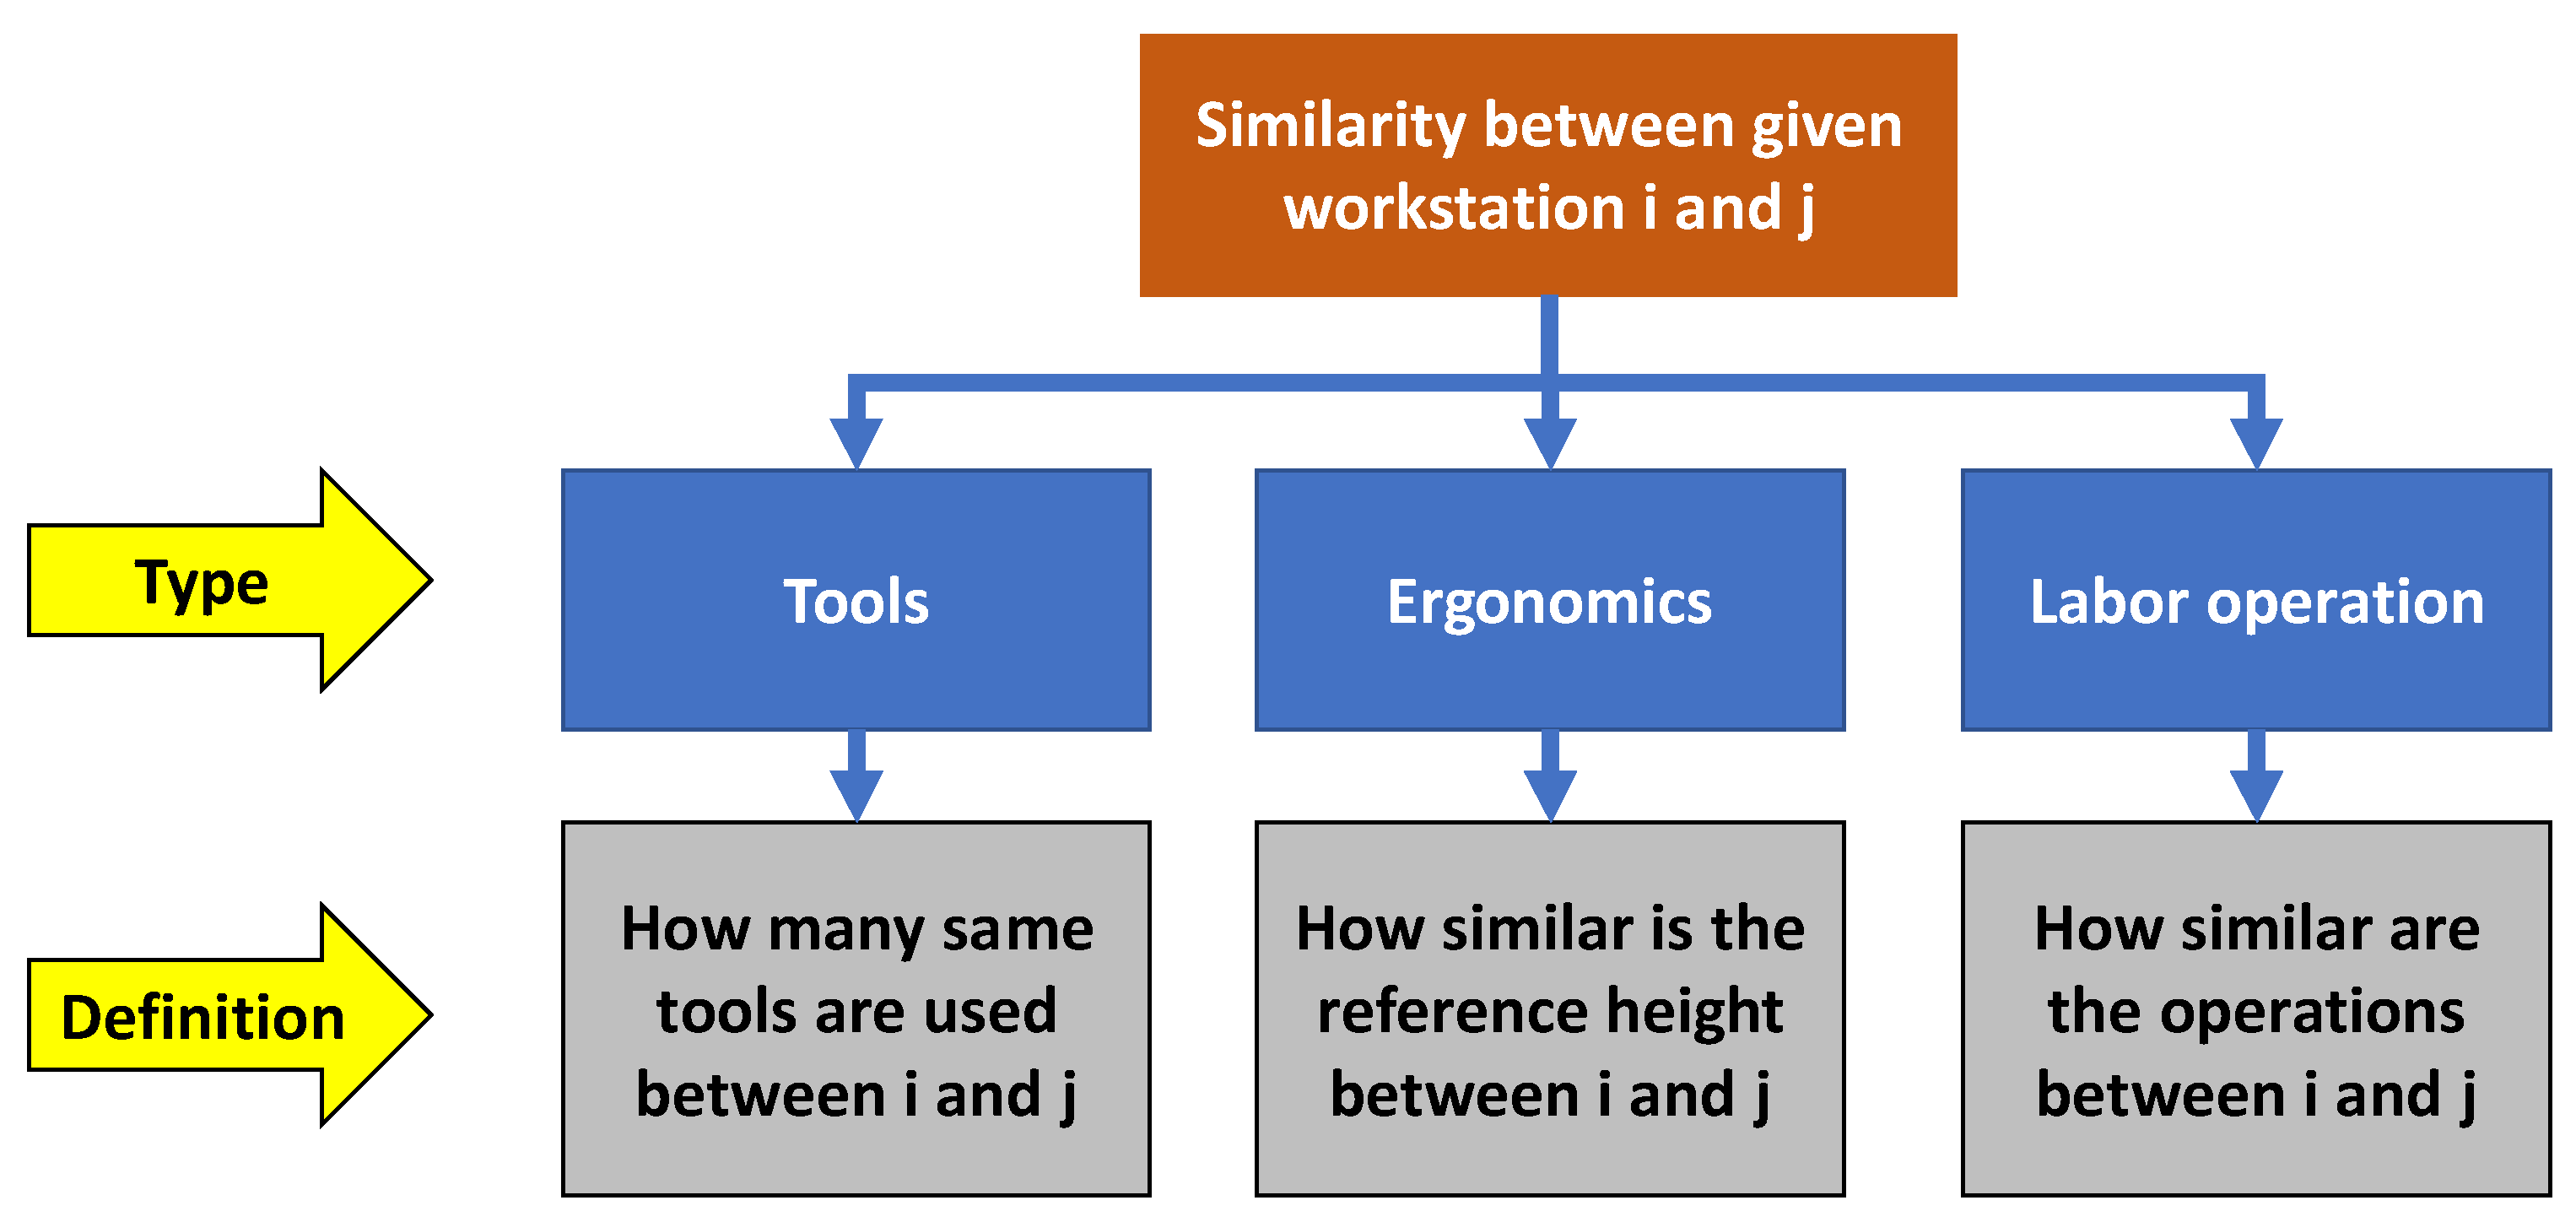
An important background technology used in the iterative matrix-layout design is the measuring of similarity between workstations. The important reason for measuring the similarity between workstations is that by using the measured similarity, two similar workstations with low utilization can be combined, which may increase overall system productivity. The similarity that can be measured between workstations in the trim area of car assembly process can be largely decomposed into three similarities, as shown in
Figure 8. Definitions and simple examples for each similarity are as follows.
The tools similarity measure how many of same tools are used between given two workstations. The formula to measure the tools similarity is this:
For the example of workstations—console assembly and carpet installation, both workstations use two types of tool—impact screw drivers and impact wrenches. In this case, the similarity of the two workstations is . This means that these two workstations have all the tools in common.
The ergonomics similarity is based on the reference heights (in inches) of various workstations. Three classes: (i) high, (ii) medium, and (iii) low, are identified based on workstation heights. The formula of human-operation similarity is this:
In detail, two workstations in the same height class are assigned a score of 1 (one), two workstations in neighboring classes are assigned a score of 0.5 (half), and two workstations in disjoint classes are assigned a score of 0 (zero). For example, sunroof installation has the highest reference heights but door-on workstations have medium reference heights for ergonomics. In this case, the similarity between the two workstations in terms of human worker’s reference height is 0.5 because the high height and the medium height are neighboring.
The human-operation similarity measures how many of the same human operations are used between given two workstations. Trim-area human operations can be divided into seven categories: (i) motion, (ii) join, (iii) retain, (iv) measure, (v) attach, (vi) detach, and (vii) work. The formula of human-operation similarity is this:
For example, carpet installation requires five operations such as motion, measure, attach, retain, and join, while headlamp-securing operation needs three operations: motion, join, and retain. In this case, the similarity is .
Since Verma et al. (2022) performed more complete similarity measurements between workstations in the trim area, readers who want to see a more extensive example should refer to their paper [
22].
3.3. Iterative Design Process
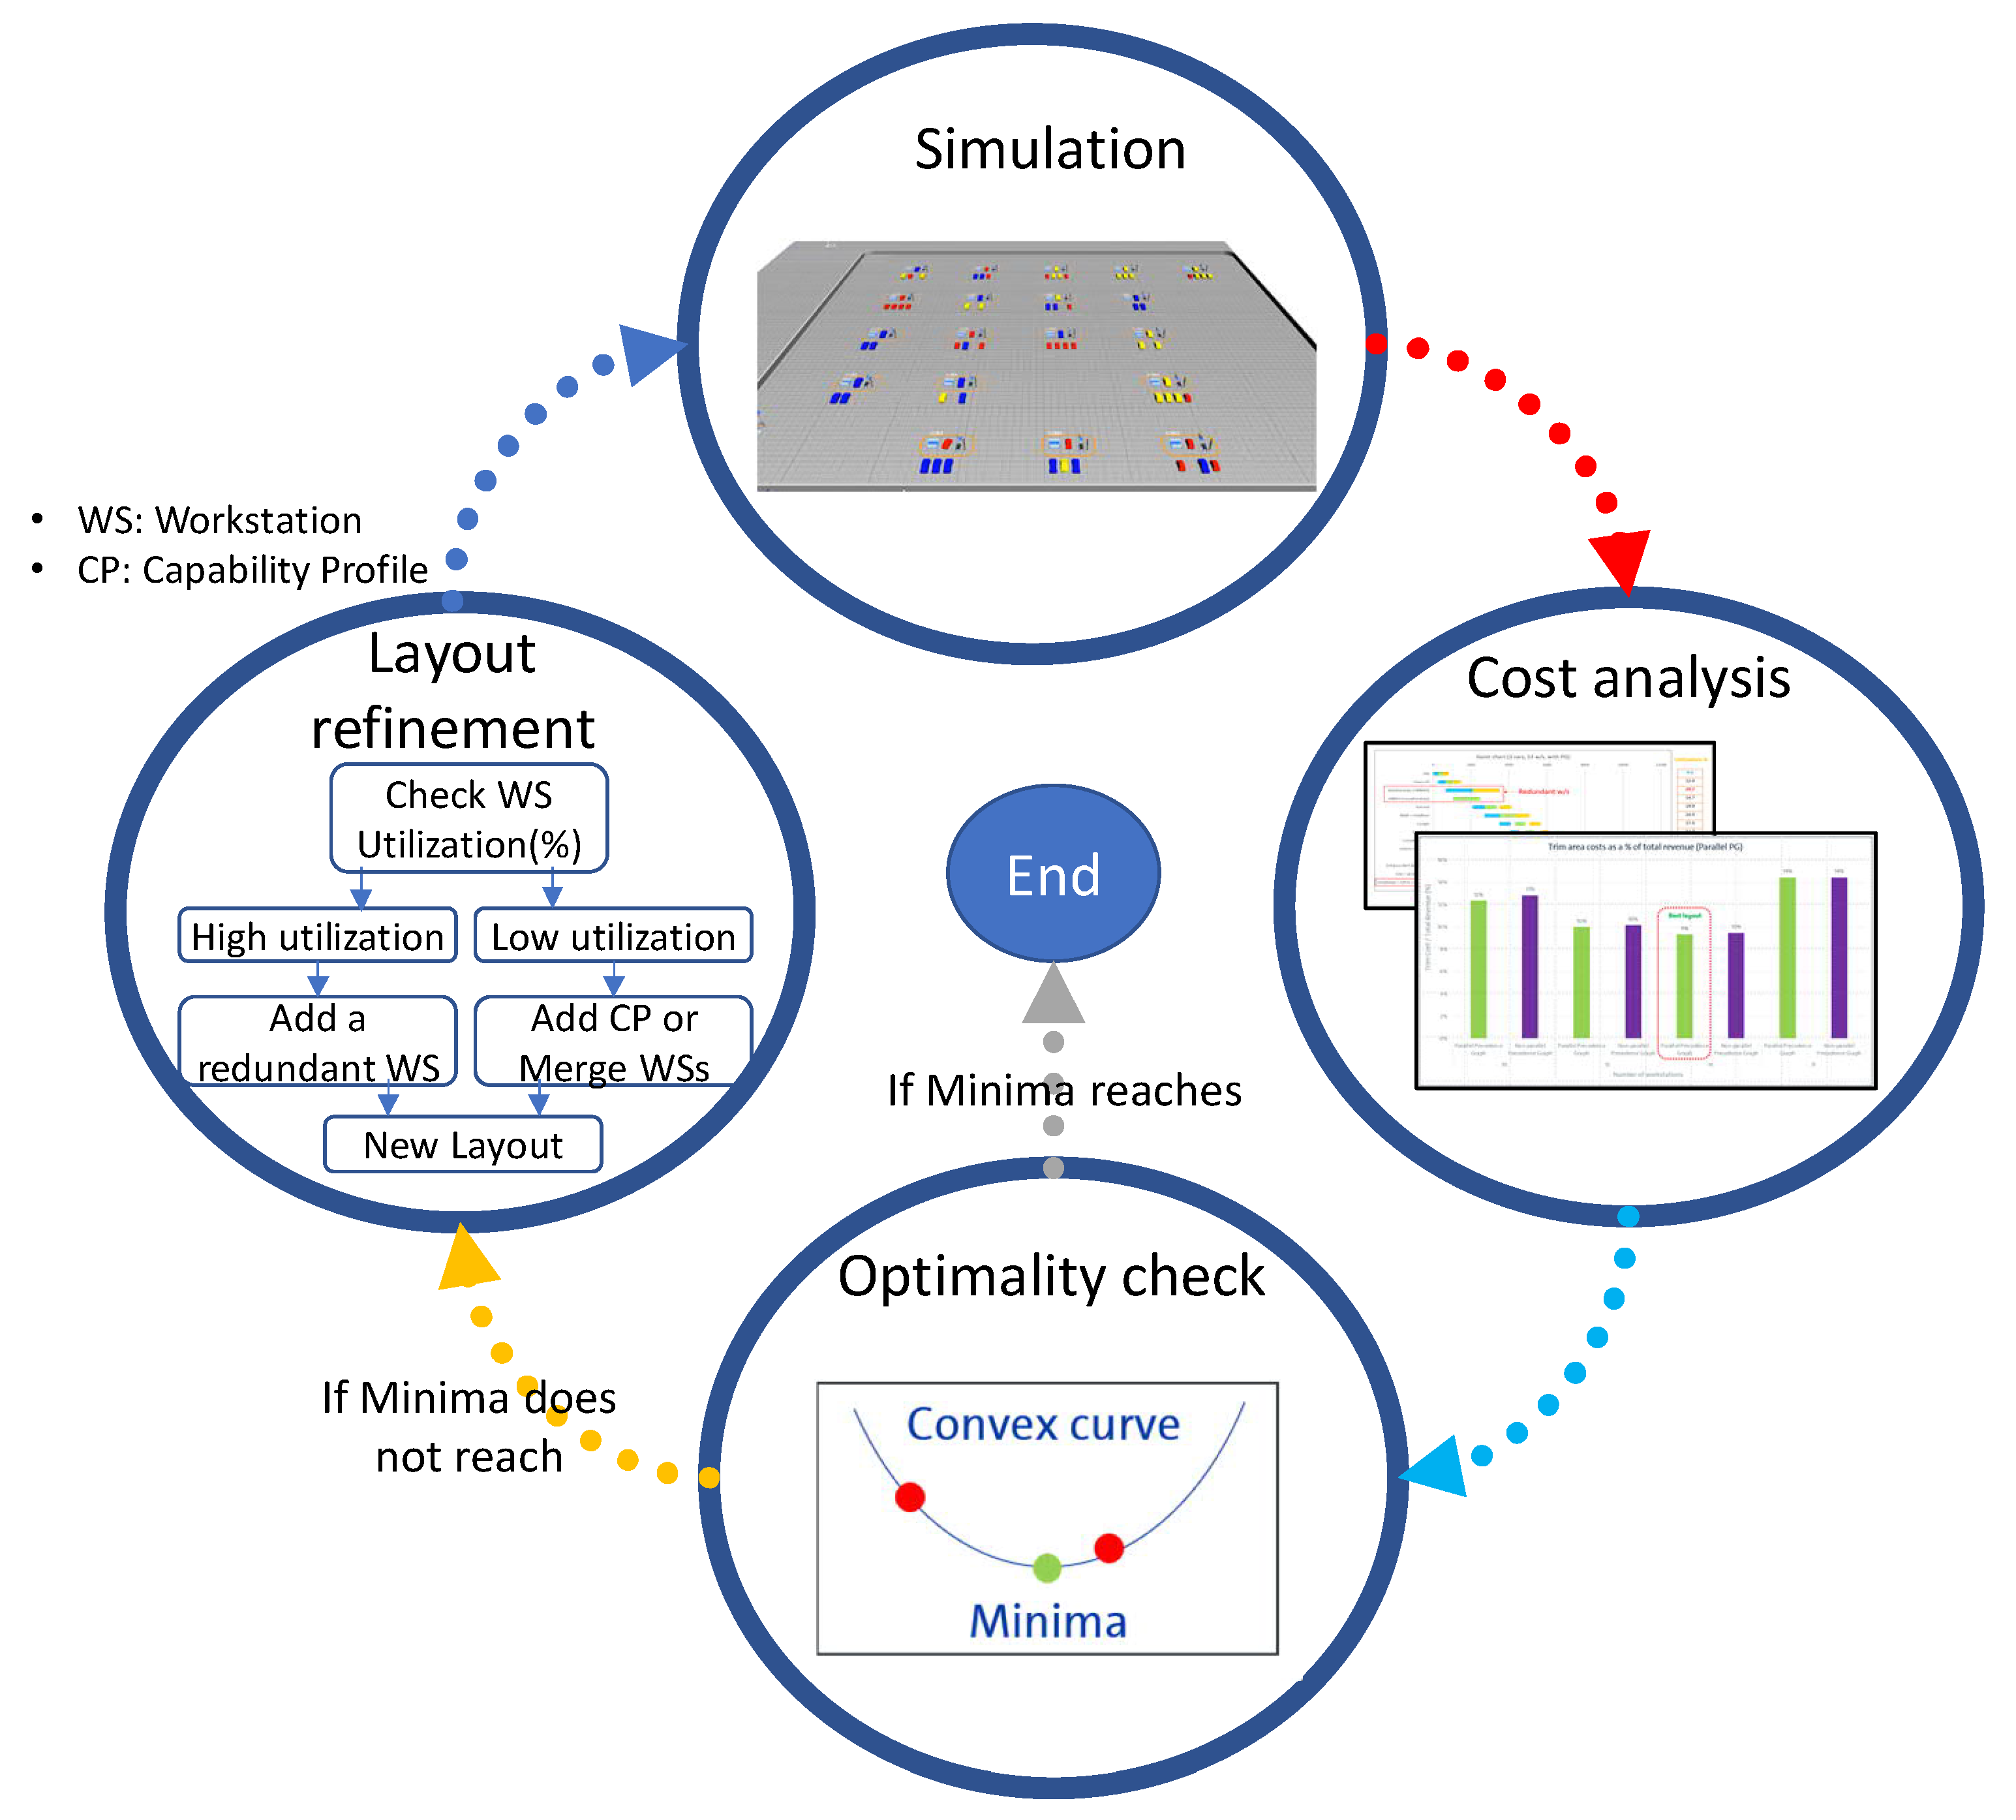
This iterative design process can be divided into four main steps, as follows:
Layout refinement: since designing an asynchronous assembly system takes into account a fairly large search space, this step aims to reduce the search space by using domain-specific constraints such as precedence graphs, cycle times, similarity matrices, and footprint;
Simulation: this step uses a discrete event simulation model by taking workstation utilization percentage as a metric for search refinement and calculates the makespans of the alternate layouts considered;
Cost analysis: this step performs a cost analysis to evaluate the ratio of trim-area costs to total revenue, as a quantification of the cost savings obtained by this methodology;
Optimality check: this step checks whether the evolved layout finally becomes the optimal solution where a layout with the highest workstation utilization and the lowest makespans is evaluated to be optimal.
The four main steps are also depicted in
Figure 9. Note that this process starts with the assumption that some critical information for layout design has already been given as input. The critical information includes cycle times of each operation, initial number of operations per workstation, reference heights of the operation from the ergonomics perspective, and precedence graphs defining the precedence relationship between any two operations, etc.
4. Results
In this section, we apply the proposed iterative design method to an example trim assembly process. Each subsection below will cover the pertinent layout design step in detail.
4.1. Layout Refinement
The purpose of this step is two-fold: (1) refine the layout evaluated in the previous cycle (if there is no evaluated layout, the layout given at the beginning will be used) and (2) find an enhanced layout that may ensure the higher utilization of workstations and a smaller makespan (i.e., high throughput).
More specifically, this refinement step is divided into two parts. The first part is to improve the system’s makespan by adding redundant workstations for workstations that show excessively high utilization because they may cause bottleneck issues. The other part is to increase a capability profile (CP) or merge with other workstations for those workstations that show too-low utilization. Increasing a capability profile means assigning another operation to a workstation [
23]. Remember that the three similarities (tools, ergonomics, labor operations) were discussed in the previous background section. For example, if two workstations with low utilization have a fairly high similarity in terms of tools, ergonomics and labor operations, the two workstations can be merged to become one workstation, and the capability profile of the combined workstation increases because the number of operations it performs will increase. Please refer to Verma et al. (2022) [
22] for the full use of similarity matrices and capability profiles to refine an example case.
Note that adding redundant workstations and/or changing the CP values inevitably changes the flexibility of the newly created layout. Thus, the OF or RF value changes. It can be a great help in managing the layout history if the OF and RF values are calculated and stored for a partial layout or the entire layout, whenever a new layout is created.
4.2. Simulation for Performance Analysis
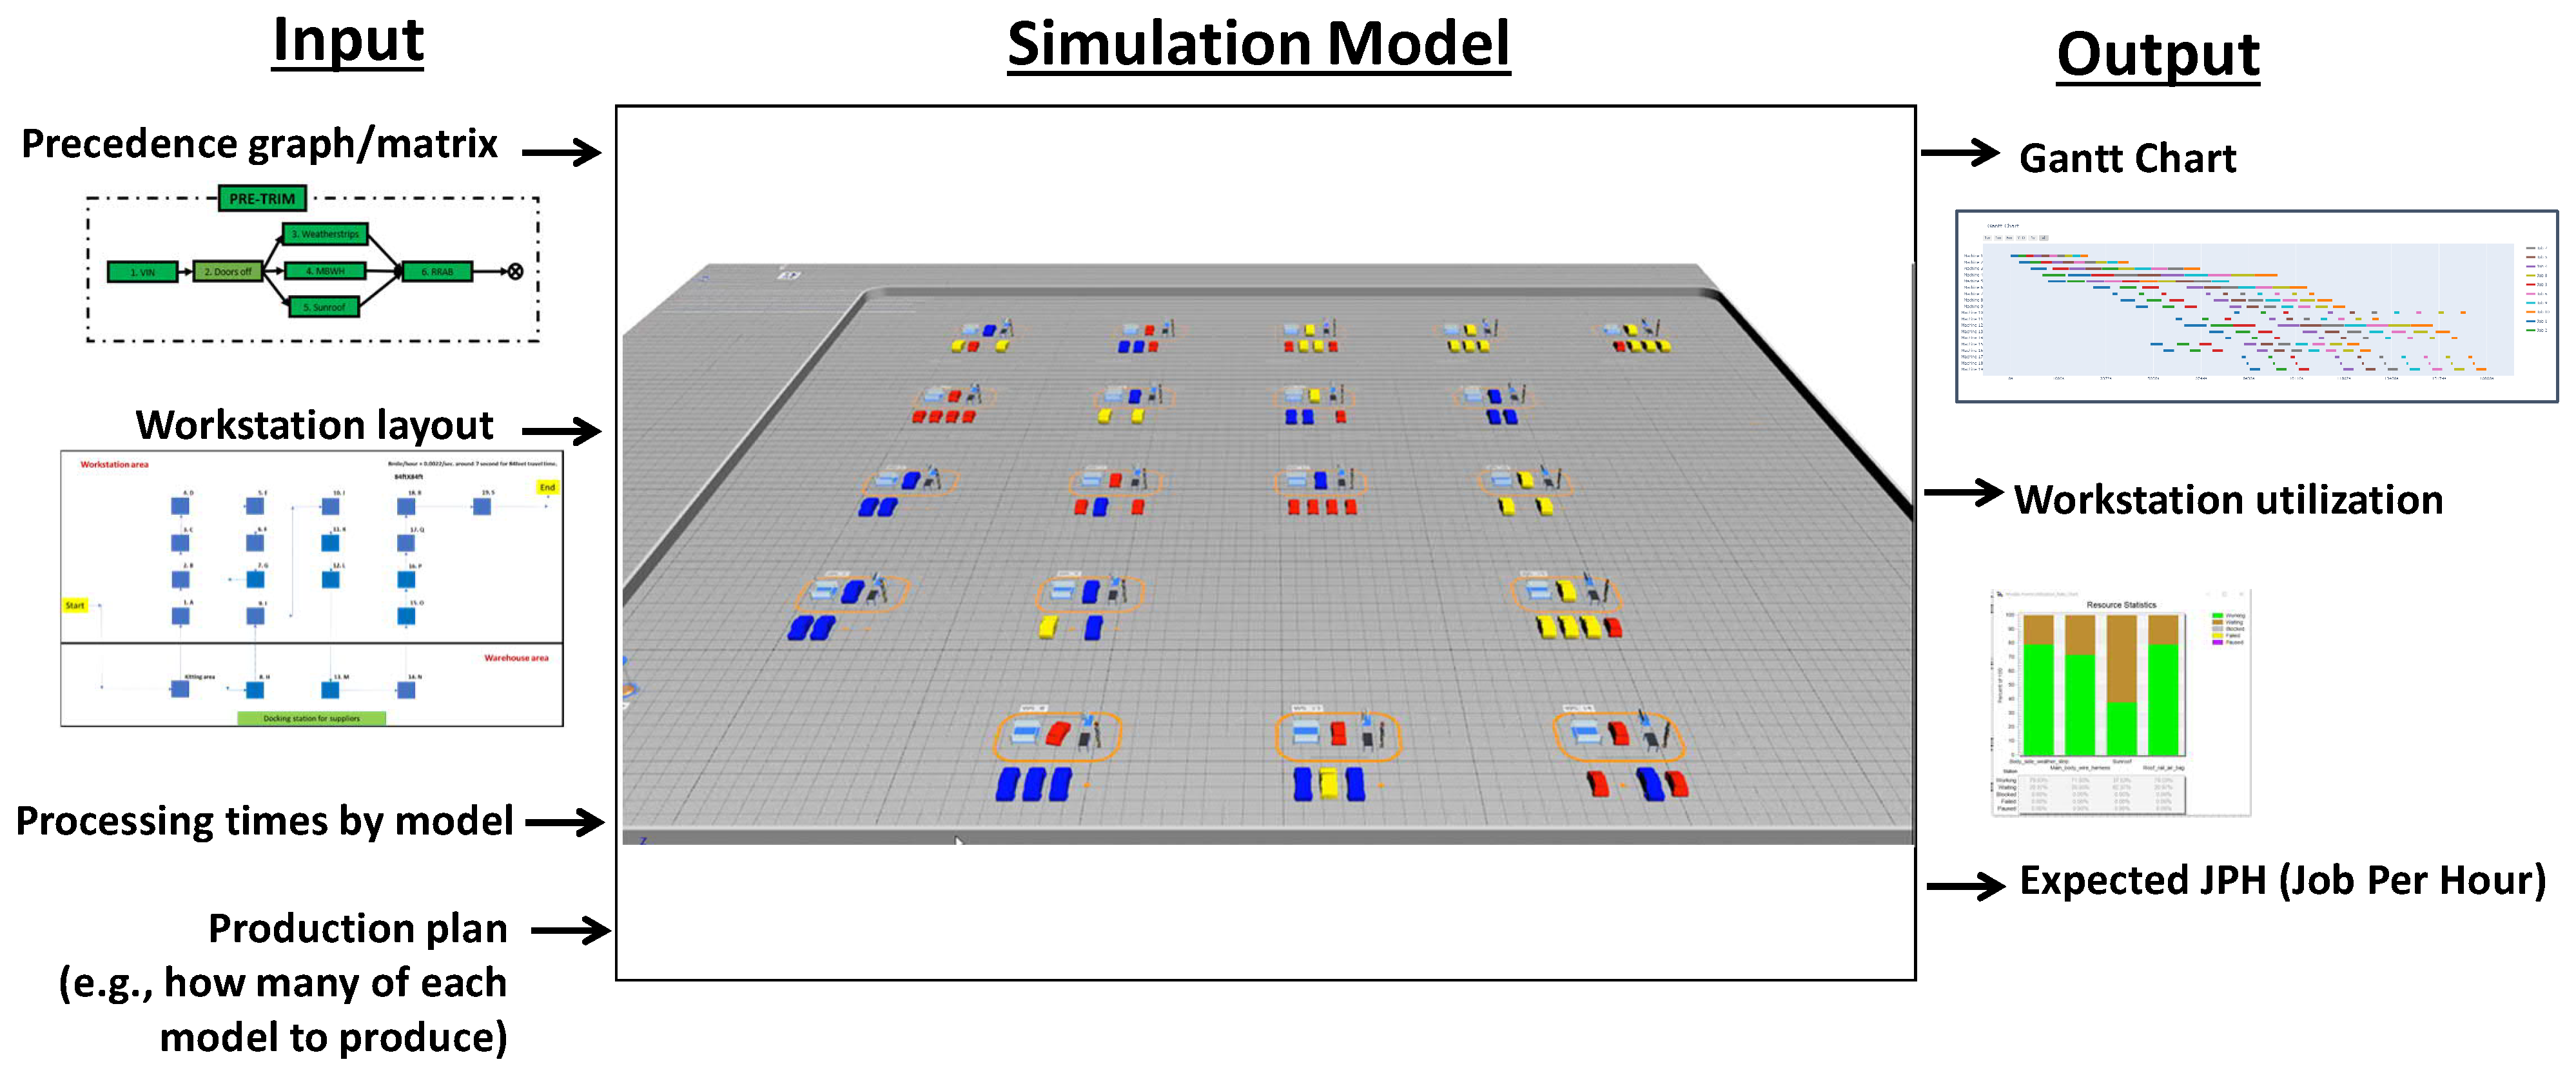
This step uses a simulation model to evaluate a refined conveyor-less matrix assembly layout where a commercial simulation package is used to run the simulation model. The study utilized the Siemens Tecnomatix Plant Simulation (version 16.0), which is widely used in the automotive industry. The overall structure of the model is presented in
Figure 10, where the inputs are: (1) precedence graph/matrix, (2) workstation layout, (3) processing time by model, and (4) production plan (e.g., how many of each model to produce). The outputs are: (1) Gantt chart, (2) workstation utilization, and (3) expected JPH (job per hour). The inputs are overridden or refined through the design cycle until the best design is found. Two output variables, such as workstation utilization and the expected JPH, are especially important because they are used for design refinement and cost analysis. Note that, since VaaCs (moving objects in the simulation model), are defined as an agent moving at its own speed in the simulation, the transit time between workstations can be calculated during the simulation, meaning that it is not necessary to provide the transit time of VaaC explicitly and deterministically.
Since the simulation approach is classified as a heuristic method, it is required to establish logics to control the movement of VaaCs. For the routing control, the model uses the minimum-time-until-processing rule to select which workstation or operation will be the next destination for the VaaC. For instance, let us assume that a VaaC could perform currently either operation o1 or operation o2, and they can be performed at workstation w1 and w2, respectively. The vehicle expects to take 120 s and 210 s to move to each workstation and until start the operation, respectively. Then, it moves to workstation w1 and performs operation o1 at the workstation under the minimum-time-until-processing rule.
Meanwhile, as another method for evaluating the matrix layout, there is the mixed integer linear programming method (MILP), which is an exact method. MILP is based on an extension of the flexible-job-shop problem striving for optimal solutions for proactive scheduling while it has limitations to obtain schedules in polynomial time. The simulation model generates schedules reactively dealing with unexpected events but generally does not guarantee optimality. Two models are completely different but can work collaboratively by verifying each other. Please refer to Kim et al. (2022) [
24] for the full discussion about the possible collaboration scenario between MILP and simulation-based approaches.
4.3. Cost Analysis
The cost-analysis step aims to show the trim-area costs as a percentage (%) of total revenue because the target layout design area for an asynchronous assembly system is scoped to the automotive trim area and it is important to understand the impact of a refined layout design for the trim area on overall revenue. The cost-analysis formula used in this step is based on the assumption that this trim area forms the bottleneck of the whole process, or determines the overall productivity. This study provides the following hypothetical parameters for an illustrative example where we assume that the previous simulation step evaluated a layout with 14 workstations and obtained the JPH (job per hour) of the layout:
Simulated JPH (job per hour): 5. Note that this number should be obtained from the previous simulation step;
One shift per day. One shift runs for an 8 hr duration;
235 working days per year;
Car price: USD 30,000 per unit. Note that GM and Honda expect their affordable EV car price to be around USD 30,000;
Annual revenue (million USD) = (million USD)
Number of workstations: 14;
Footprint of a workstation: 4 ft × 84 ft;
Investment cost (USD) per one square foot that includes average tooling costs: USD 205;
One time investment cost (million USD) =
Annual labor cost (million USD): USD 100,000 per worker with the assumption that two workers are working together for one workstation
4.4. Optimality Check
This step aims to determine the optimal layout by evaluating layout variants generated from the design refinement process. Note that this study applied the proposed procedure to the trim area of an actual compact EV production plant. However, since the data used in for the case study is confidential, the actual layout, process names and workstation information are not disclosed.
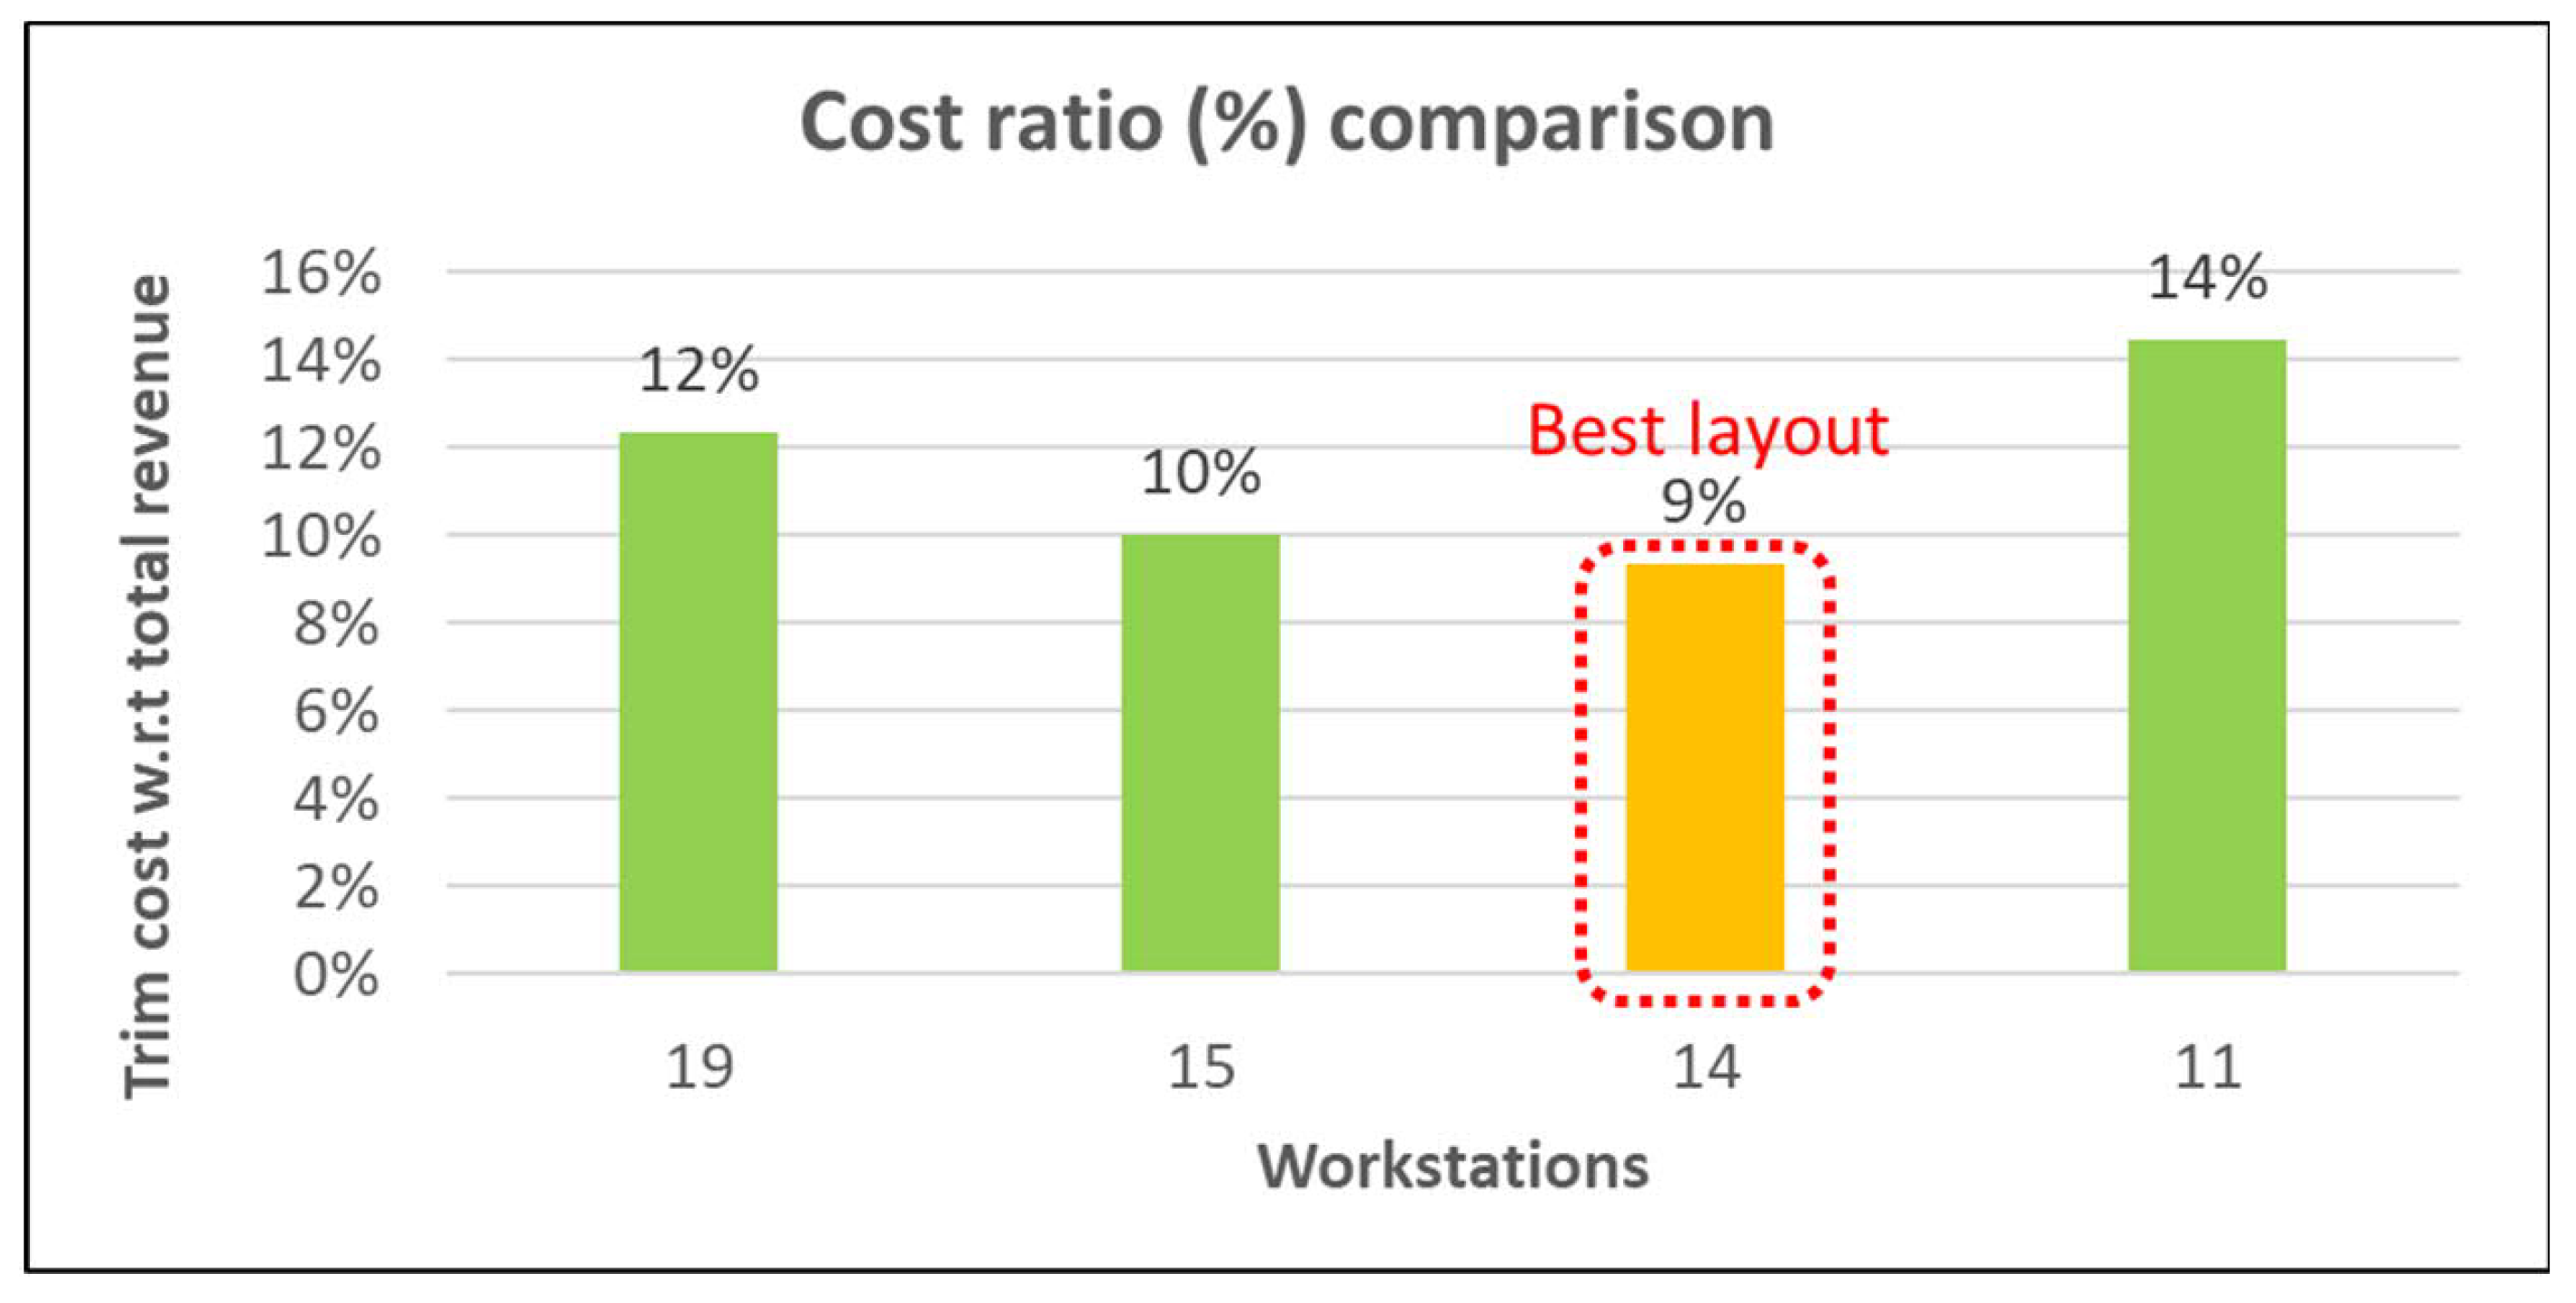
First, the study team virtually grouped and rearranged more than 60 actual workstations on the trim-area conveyors, which are sequentially synchronized with a cycle time of approximately 1 min, into a matrix-system layout with 19 asynchronized workstations in such a way that the tool, ergonomics and operation similarities within a workstation are maximized, with the help of subject-matter experts. Since the matrix layout based on the 19 workstations is an asynchronous matrix system, the cycle time of the 19 workstations will all be different. However, since it assumes that self-propelling VaaCs are transferring themselves in the system instead of using sequential conveyor lines, it can bring the benefit of considerable process and routing flexibility. Using the matrix layout based on the 19 workstations as a starting point, then, the proposed procedure was applied and sequentially refined the layouts to be 15, 14, and 11 workstation layouts. The results of cost analysis on studied layouts are shown in
Figure 11 and
Table 2, below.
From
Figure 11 and
Table 2, it is observed that as the number of workstations decreases, the JPH estimated by the simulation decreases too, resulting in a decrease in annual revenue. This can be seen as a natural result because if you reduce the number of workstations in an asynchronous system, the utilization of workstations tends to increase, but the throughput (e.g., JPH) may drop due to the lack of resource or bottleneck issues.
On the contrary, as the number of workstations decreases (i.e., the size of the layout is reduced), the sum of one-time investment and labor costs is also reduced, thereby increasing the cost-saving effect. Considering the trade-off relationship between the sum of investment and labor cost and the revenue (i.e., the formation of a convex curve structure), it was finally decided that the most optimal layout case is a layout with 14 workstations.
5. Conclusions
The conveyor-less-assembly-plant concept is a revolutionary attempt to transport manufacturers from the Henry Ford era to the iPhone era. To realize the idea of an urban conveyor-less car assembly factory, this study proposed a new iterative matrix-system layout design method that can realize a conveyor-less urban car assembly factory with two technologies—VaaC and a matrix assembly system. The proposed method consists of four steps: (1) layout refinement, (2) simulation, (3) cost analysis, and (4) optimization check, and then this study applied the proposed method to the trim area of an actual compact EV production plant. The application study results proved that the proposed method can successfully find the convex curve structure between the cost (i.e., the sum of investment and labor) and the revenue and help decision makers select the optimal layout for an urban conveyor-less car assembly factory.
From a theoretical point of view, this study is the first to propose a systematic methodology to design the layout of an urban car factory when an EV car is already capable of self-propelling in the assembly stage even before the finished product stage, which, thus, contributes to providing elements to arouse interest and spur future research into the conveyor-less urban car factory from academia. From a practical point of view, on the other hand, this study contributes to informing practitioners that mass individualization can be realized economically (contrary to common concerns that mass individualization might be expensive) by constructing a conveyor-less urban car assembly plant because it can increase flexibility, utilization and labor productivity, avoiding the cost required to construct the expensive physical conveyor system.
There are many possible ways to apply this methodology in practice, but we can imagine a scenario where the car factory per se ceases to exist and is combined with car dealerships. Using VaaC (a “skateboard”-type platform) and the proposed design method, a micro urban car assembly infrastructure is built in the warehouse of a car dealership. Then, automobile components (the platform or VaaC skateboard, the body components, the seats, glass, and console, etc) are shipped from suppliers directly to the dealer. The dealer assembles vehicles and delivers them to customers through the order-to-delivery (OTD) system. We can call this a point-of-sale (POS) factory, which is one of the possible practical scenarios in the future using the proposed methodology.
This study is limited because it covers only a part of the essential engineering technologies for realizing a conveyor-less urban car assembly plant. Another limitation is that only the heuristic control algorithms were tested in the simulation model. If machine-learning or reactive-scheduling methods were used, different performance results may have been obtained [
10].
Future research will focus on how to implement economically sustainable urban factories. In fact, in realizing an urban factory, creating a sustainable business model is as important as developing engineering technologies. This is because, without an appropriate sustainable business model, urban factories may result in lower performance and more costs due to various environment issues and supply-chain/logistics challenges in urban areas. Therefore, future research intends to develop methods to address various challenges in environmental and supply-chain management with case studies.


