Article

A Comprehensive Methodology for Assessing the Impact of Smart City Interventions: Evidence from Espoo Transformation Process

by
Aristotelis Ntafalias
1,*,
Giorgos Papadopoulos
2,
Panagiotis Papadopoulos
1 and
Aapo Huovila
3
1
Elin VERD S.A., 14561 Kifissia, Greece
2
SUITE5 Ltd., Limassol 3013, Cyprus
3
VTT Technical Research Centre of Finland Ltd., P.O. Box 1000, 02044 Espoo, Finland
*
Author to whom correspondence should be addressed.
Smart Cities 2022, 5(1), 90-107; https://doi.org/10.3390/smartcities5010006
Submission received: 16 December 2021 / Revised: 17 January 2022 / Accepted: 18 January 2022 / Published: 21 January 2022

Abstract

:
In recent years, the world’s population living in cities has been rapidly increasing. Cities are transforming their infrastructure in a smarter and more efficient way so that sustainable development forms part of their long-term strategy. However, this transformation does not always result in expected benefits due to a variety of factors such as an absence of social acceptance, a lack of holistic design and the development of unilateral interventions. An analysis of the scientific literature related to the evaluation of the impact of smart city actions revealed a gap in the holistic methods for their assessment. To this end, an accurate evaluation of implemented smart solutions focusing on the energy domain is necessary in order to assess the expected and realized impact of each solution. This paper proposes a seven-step methodology for assessing the impact of smart city interventions and presents a use case for the city of Espoo. A number of major findings were the outcome of our research and development work, such as the need for a thorough analysis of the long-term vision of the city, a combined top-down and bottom-up approach and the ongoing cooperation between all stakeholders involved in urban planning and transformation, in which necessary Key Performance Indicators (KPIs) are defined.

1. Introduction

1.1. The Necessity of Impact Assessment

According to the United Nations [1] 68% of the world’s population is projected to live in urban areas by the year 2050; cities, therefore, are anticipated to face new challenges in sustainably integrating further populace, such as a lack of appropriate infrastructure for sustainable energy and automated systems, applications and commercial arrangements, digital security, network connectivity and data capacity [2]. Cities will be required to transform their infrastructures in a smarter, more efficient and resilient way so that sustainable development forms part of their long-term strategy and a better quality of life is assured to their citizens. The concept of the smart city is multidimensional [3], with the aim of increasing urban sustainability and quality of life while pursuing economic development among its citizens [4]. Additionally, sustainability has gained popularity among scholars, environmental policy makers and government agencies [5]. However, a smart city is not just about creating technically viable urban areas and stimulating economic growth; it requires a multifaceted and multidimensional approach that promotes a structural transformation in the urban ecosystem, directing the development of cities towards their “smartness” in areas such as economy, governance, social, environment, mobility and ICT [6]. According to the International Energy Agency (IEA), “the advantages of cities in net-zero transitions vary greatly from one city to another, but they all have considerable potential to turn national ambition into practice” [7]. Additionally, the EU’s green agenda for urban areas [8] promotes horizontal initiatives that develop common methods for the evaluation and monitoring of smart city communities. To this end, our aim is to address the smart city aspects related to sustainability and to define a methodology that any city can adopt to contribute to its smart transformation, in line with the vision of the European Commission [9].

1.2. International Literature Review in Relation to Evaluation of Impact of Smart City Interventions

The concept of the smart city has gained popularity in recent years. According to [10], “smart city” and “digital city” are the most used terminologies in literature to indicate the transformation of urban areas. The European Commission [11] defines a smart city as “a place where traditional networks and services are made more efficient with the use of digital and telecommunication technologies for the benefit of its inhabitants and business”. There is a variety of domains that smart cities may comprise and interlink with; however, there are commonalities existing among scholars and practitioners.
The Smart City Wheel by Boyd Cohen [12] (elaborated further in [13,14]) proposes six domains that are used in a city’s performance as a smart city: smart economy, smart governance, smart living, smart environment, smart mobility and smart people. The authors of [15] argue that smart city domains could include smart buildings; their proposed framework examines the building sector integration and its potential increased effectiveness via the utilization of smart city technologies, specifically smart energy, smart mobility, smart living and smart environment. The authors of [16] highlight that the domain of energy comprises an additional domain by itself, which has indeed gained increased significance in recent months in a European, but also a global, context. A different view is approached by the authors of [17], where it is argued that the common architecture for smart cities needs to be multi-tier, consisting of five main layers (natural environment, hard non-ICT-infrastructure, hard-ICT-infrastructure, services and soft-infrastructure). A similar approach is adopted by the authors of [18], where they divide the smart city into three dimensions: technology (hardware and software infrastructures), population (creativity, diversity and education) and institutions (governance and policy). The technological aspects of smart cities have been identified as the bridging, but nevertheless core, ingredients of urban transformation, contributing to the clarity of synergies and dependencies among various domains [19] and enhancing the digital city concept towards smart cities [10]; a more specific analysis on the pervasive use of ICT within the context of smart cities is provided in [20]. The Smart City Index (SCI) [21] attempts to further generalize the smart city domains, categorizing them into smart city assessment, economy, human capital management, mobility, environment and quality of life. It is evident that the energy domain as a whole, and its core role within sustainability, sits centrally in the smart city development sphere, embracing, in addition, the digital advancements of the energy sector [22].
Impact assessment methodologies for evaluating smart city transformation programs have been developed in recent years, aimed at creating generalized patterns, context and processes to assist relevant stakeholders towards implementing efficiently transformative actions and utilizing control mechanisms [23]. An analysis performed by URENIO Research and ITI-CERTH on 20 cities showed that the most significant factors on the realization of smart city actions relate to institutional barriers; thus, they suggest that development and impact assessment methodologies should embrace key stakeholders and carefully consider the interactions and parameters of localization [24]. Knowledge representation utilizing ontologies is proposed in [25] to map linkages and dependencies, with the aim of also addressing the prioritization of significance. A theoretical framework utilizing the Genova smart city association is described in [26] to approach the direct and indirect benefit identification of smart city partner companies, while in [27], a dashboard approach is analyzed with the aim of quantifying, using a five-step process, the performance of related investments. KPIs serve in such quantification with the additional scope to track overall performance in wider smart city domains relating to sustainability [28], but also to compare performance among different cities [29]. In [30], the authors proposed 16 KPIs for measuring the performance of smart city actions, which require both qualitative and quantitative analysis to be calculated, while ISO 37101 [31] provides a comprehensive high-level process for implementing sustainable transformations, proposing sectorial indicators that need to be considered via a combined strategic and operational implementation. ISO 37122 establishes an example list of indicators, categorizing them into 19 domains relating to sustainability [32].
A bottom-up approach is used in [33] to define a taxonomy of 413 detailed indicators to evaluate, in 10 domains and with 5 types of indicators, the performance of actions in the context of smart sustainable cities. On the other hand, the standardized normalization of indicators is proposed in [34,35] to link specific domain performance with wider city objectives and assist with ranking and comparison exercises. The authors of [36] propose the use of weighting systems to link city objectives with domain performance, such as in [37], where the link with mobility is studied. Such top-down approaches offer a wider performance evaluation and policy-related context, although they might be lacking the detail and operational effectiveness that detailed bottom-up KPI development might offer.
Our literature review revealed the lack of a holistic methodology for assessing the impact of integrated smart city interventions with a focus in the energy domain. This paper addresses this gap by developing a comprehensive methodology aimed at providing distinct steps and detailed KPIs which can be used by cities to help them transform towards smart sustainable cities. We proceed with a detailed analysis of large-scale smart and sustainable city transformation projects to extract the lessons from methodologies and real-world examples that have used actual cities and relevant stakeholders to formalize their methodological approaches.

1.3. Relevant Work from Large Scale Projects

The transition of the passive, reactively changing processes and infrastructure of existing European cities towards more citizen-centric, environmentally-friendly smart cities, comprises a high priority in the European’s Commission agenda [38]. In this work, we gather lessons from previous prominent smart city-related projects, and we formulate an informed, robust and novel methodology for assessing and abetting the smart city transformation; we focus, as such, on the thorough analysis and critical review of relevant European projects and initiatives. A detailed understanding of four prominent methodologies from relevant projects under the Europeans Commission’s (EC) Horizon 2020 umbrella (CITYkeys [39]; Smart Cities Information System-SCIS [40]; City VITAlity Sustainability-CIVITAS [41]; Triangulum [42]) was achieved and resulted in the evaluation of the appropriateness and soundness of the Key Performance Indicators (KPIs) these projects propose.
CITYkeys, defined as a holistic indicator framework, is aimed at facilitating and enabling stakeholders in projects or cities to learn from each other, create trust in solutions, and monitor progress, by means of a common integrated performance measurement framework.
SCIS is defined as a common platform for data collection and monitoring. SCIS is a knowledge platform to exchange data, experience and know-how and to collaborate on the creation of smart cities [43]. Focusing on energy, mobility and transport and ICT, SCIS showcases solutions in the fields of energy efficiency in buildings, energy system integration, sustainable energy solutions on a district level, smart cities and communities and strategic sustainable urban planning.
CIVITAS is a H2020 city transport initiative aimed at analyzing transport metrics [44]. The CIVITAS initiative is a network for cities that aims to achieve a significant change in the modal split towards sustainable, efficient and cleaner transport modes, by introducing ambitious measures and policies. It proposes KPIs concerning mostly the transportation sector.
TRIANGULUM, is a recently completed Smart Cities lighthouse project, which presented a process of evaluation and monitoring that adopted a seven-stage impact assessment methodology, supporting replication by ensuring compatibility with other generic smart city assessment frameworks.
From the above projects, it became clear that the use of metrics, and particularly KPIs, is becoming more and more necessary in monitoring the progress of activities and evaluating the achieved impact. Additionally, the use of KPIs is needed in the areas where cities mostly have to measure their smart city performance, taking into consideration perspectives such as energy, economic, social and technology.
Table 1 below presents an overview of the KPIs available in the studied projects. It allows a straightforward verification of their characteristics, including the number of indicators for each framework, the type of indicator, the assessment scale they are applied to and the related impact categories.

1.4. Purpose and Approach

Our literature review and detailed analysis of large scale projects reveals that, while previous studies have analyzed relevant KPIs for large-scale smart city projects [45], there is a need to better understand the evaluation process, integrating both bottom-up and top-down approaches, including city goals and other stakeholder needs. The research question that our work is aiming to address is how to accurately measure the impact of actions taken by cities on their way to smart transformation. The objectives of this research work are to propose a multi-level approach analysis of the expected impacts and planned interventions involving both city stakeholders and energy experts and to allow the definition of specific KPIs for each given case. To achieve these objectives, we provide the distinct contributions of this paper as follows:
  • We conduct a thorough review of prominent projects that have approached impact assessment methodologies for smart cities and have reported significant lessons;
  • We analyze the city implementation plan in order to have a deep understanding of the transformation strategy followed and the expected impact;
  • We define a bottom-up approach for the analysis of interventions and corresponding actions that constitute the smart urban transformation;
  • We aggregate and categorize a suite of KPIs that can be used in an assessment process, focusing on their distinction among categories that allow sectoral evaluation, which may, however, be integrated into a holistic energy domain assessment;
  • We provide a normalization approach, detaching the particularities and exogenous characteristics of cities, both for building and non-building KPIs;
  • We define a methodology for the evaluation of the process in order to highlight the findings for overcoming the obstacles that arise during the transition from the design phase to the implementation and operation; and
  • We apply our developed methodology in the city of Espoo as part of the city’s planning stage towards its transformation which is anticipated until 2025.
This paper is structured as follows: Section 2 introduces the proposed methodology for assessing integrated smart city interventions. Section 3 presents the validation of the methodology for the city of Espoo. Section 4 presents the discussion on the results and Section 5 presents the conclusion of the paper.

2. Materials and Methods

There were no explicit materials used for the development of this research. However, a number of methods were carefully chosen and used to complement the extensive literature review presented in the previous chapter. Our methods included workshops on breaking-down, understanding and using the KPIs, the coordination of focus groups with specific domains for analysis, as well as unstructured and structured interviews with direct and indirect city stakeholders.
The term smart urban transformation has been broadly used and includes a variety of areas in which interventions can be made, such as smart buildings and neighborhoods, the use of big data, smart water and waste management, the development of ICT infrastructure, smart transportation, etc. From these areas, corresponding categories of KPIs can emerge with different characteristics and ways of measuring with tools such as dashboards, smart city and national reporting tools, etc. Our work mainly focuses on the energy data of smart buildings and districts which are related to the consumption and optimization of energy production, as well as the increase of self-consumption and storage. In addition, a non-building perspective is applied related to smart governance, smart mobility, social and citizen’s engagement, ICT infrastructures and environment. In the following section the proposed methodology, as well as the study participants involved, are presented.

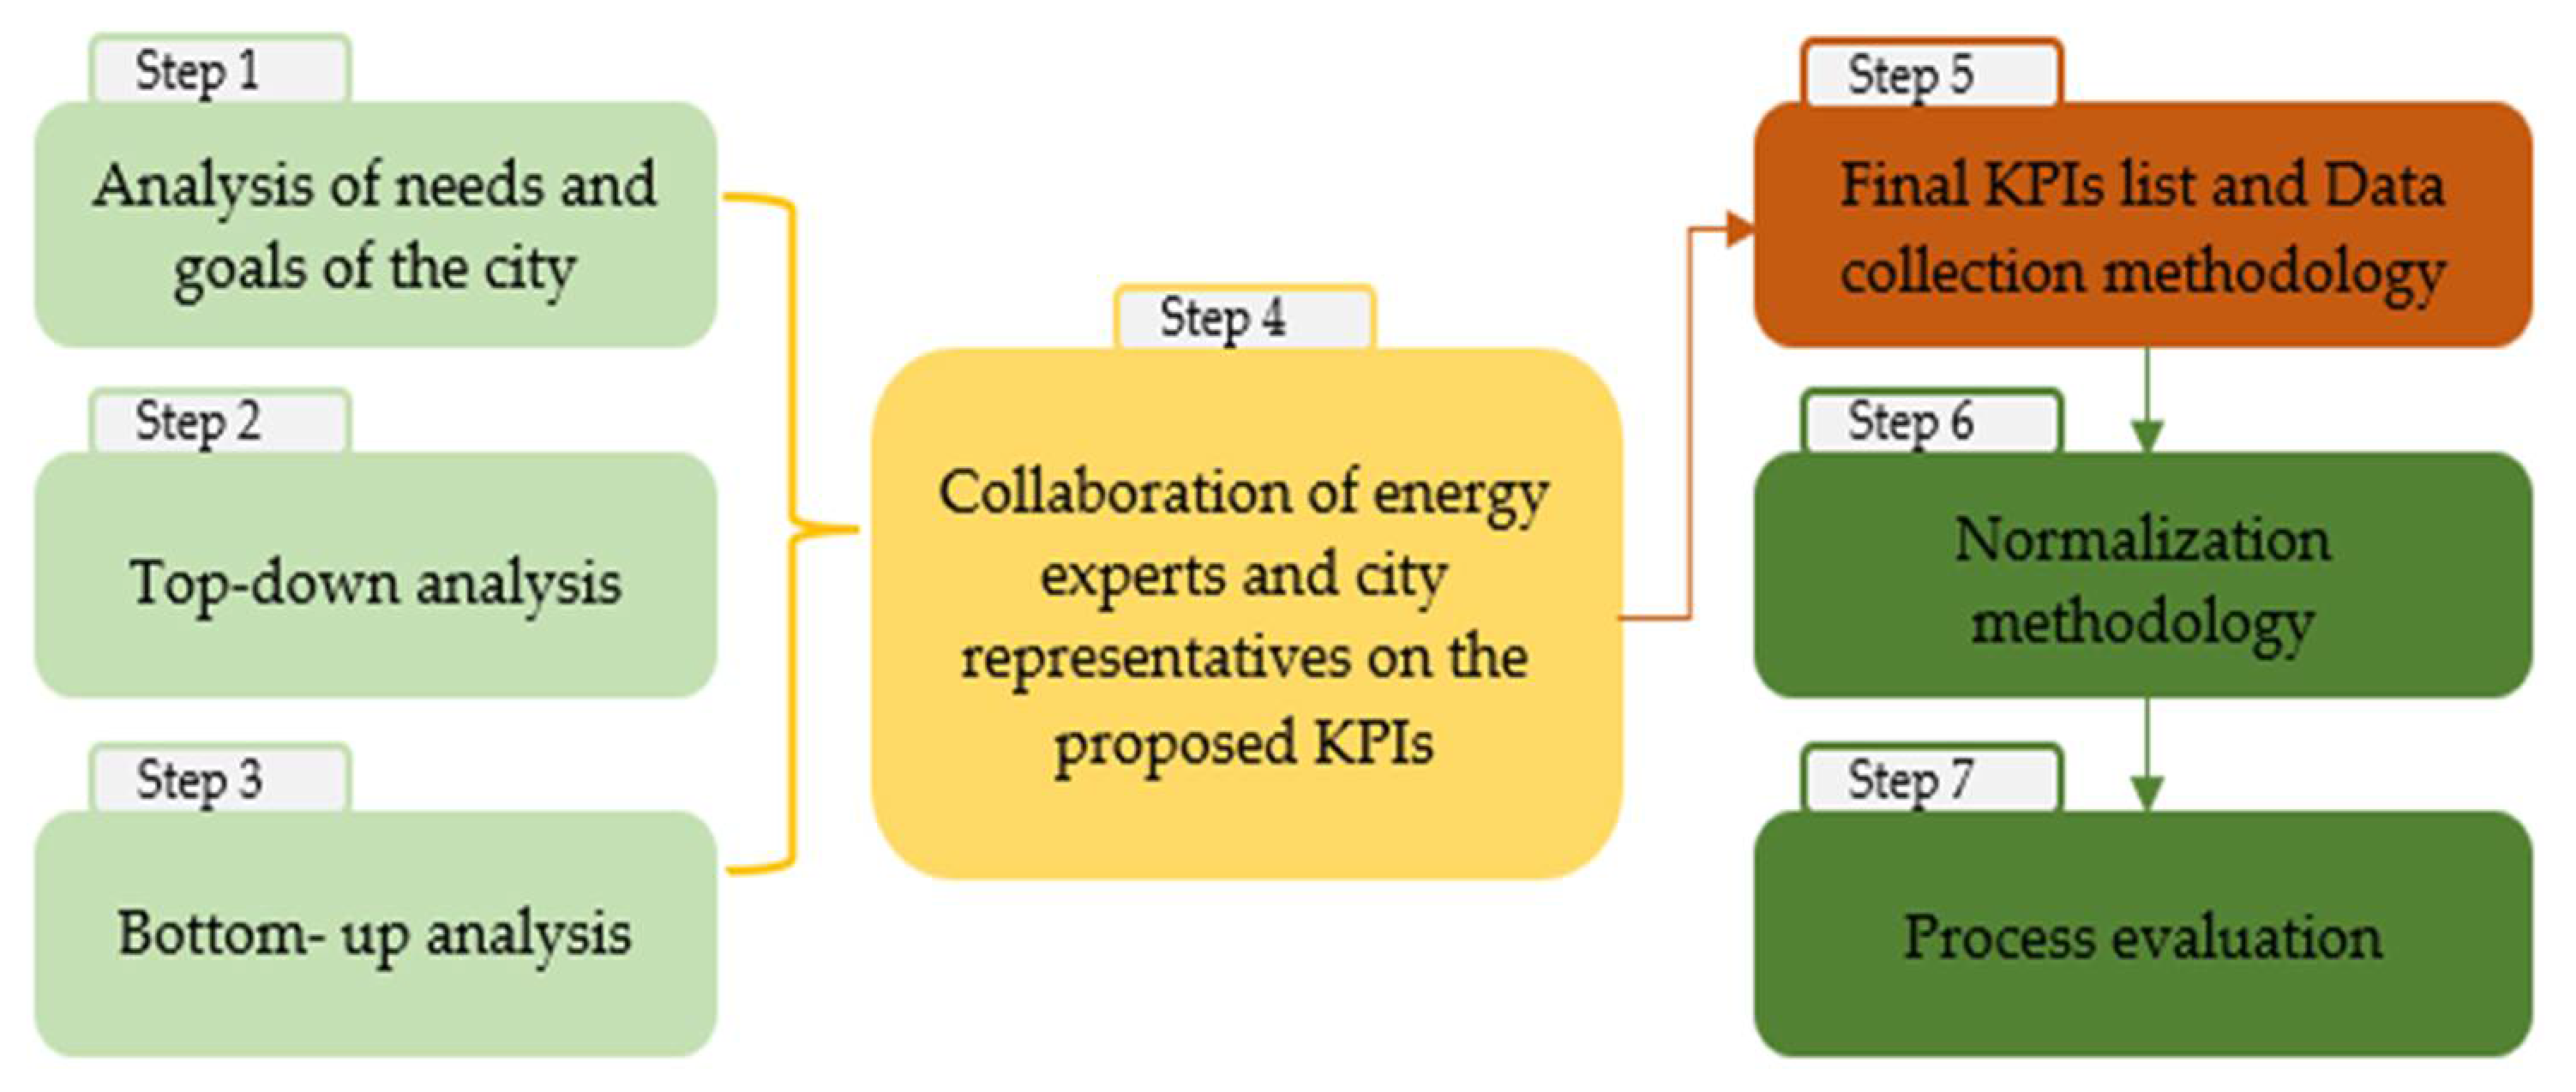
2.1. Developing the Smart City Impact Assessment Methodology

In this section, the proposed methodology is described, which consists of seven distinguished steps and is presented schematically in Figure 1. The methodology aims to create an assessment process for the impact achieved by smart interventions in cities that are moving towards sustainable transformation.
For step 1, an in-depth analysis of city’s needs and targets is carried out. In step 2, the methodology adopts a top-down approach from a technical perspective, provided by a group of energy experts, to determine the correlation between urban and smart transformation and to define the main list of KPIs contained within city’s targets and on the impact that the planned actions are envisaged to deliver. In step 3, a bottom-up analysis is performed from the perspective of city planners and stakeholders. The following step 4 comprises of a collaboration of energy experts and city representatives on the proposed KPIs. In step 5, the data needs and constraints for the definition of the KPIs, as well as a data availability check, is performed. The subsequent step 6 consists of the finalization of the KPIs list, as well as their data-normalization approach, to allow for an objective and effective comparison. In step 7, an evaluation process is presented to highlight new findings about success factors and strategies to overcome possible barriers during the implementation and the operation phases. This step is essentially a sensitivity analysis of the process. The three phases of project development (design, implementation and operation) are quite different over time, which means that the initial commitments and obligations undertaken by the parties involved may change. Changes such as insufficient cooperation between stakeholders, the absence or insufficient presence of stakeholders in collaborative activities (e.g., co-creation in business models and sustainable solutions etc.) and the provision of poor-quality data or information necessary for the calculation of KPIs are possible obstacles that could prevent the full implementation of the methodology.
The following table (Table 2) presents all parties involved in the proposed methodology, as well as the stages of participation.

2.2. Understanding a City’s Objectives

In Europe, cities have been typically developing strategic plans through initiatives such as the Covenant of Mayors [46], which brings together many municipalities that voluntarily commit to implementing EU climate and energy targets. At a national level (e.g., in Greece), local policies and laws require municipalities to prepare strategic plans, such as sustainable urban mobility plans and electric vehicle charging plans, and deliver their actions upon certain approval criteria which adhere to national infrastructure policies. On the other hand, the involvement of relevant stakeholders who are in key positions (and potentially hold either permanent or long-term tenures to avoid political conflicts) is deemed necessary to ensure local engagement and to unlock efficient communication which may otherwise hindered by bureaucracy. In our approach for the study case of Espoo, a network of key stakeholders was put together within the framework of the European Commission-funded H2020 SPARCS project [47]. However, the most important part of this process is not simply the establishment of the anticipated solutions derived from a strategic plan, but the awareness of the needs of each city, as well as the understanding and clarification of the key-objectives, such as those presented below:
  • The increased integration of renewable energy in the generation mix;
  • An optimized excess heat management method for the specific city needs and existing characteristics and infrastructure;
  • The optimization of local energy systems in the presence of distributed renewables, storage, demand side management and e-mobility energy resources;
  • An improved energy performance of buildings and districts through human-centric building control optimization, advanced retrofitting and the optimization of district-wide electrical network operation; and
  • The reduction of GHG emissions and improvement of local air quality and urban well-being.
The awareness of a city’s long-term vision facilitates the evaluation of the solutions and guides the measurement of their impact. Therefore, the first step towards an impact assessment is to understand the current state of cities and study the expected goals in the context of smart transformation.

2.3. Top-Down Analysis

As mentioned before, the introduction of KPIs as specific measurements that turn the determination of achieved impacts into quantifiable values is required as part of the key-target analysis of each city. The first list of KPIs is defined in this step, following a top-down analysis of the planned interventions and actions performed by energy experts. This analysis provides the first understanding of the needs of the city, regarding the metrics that should be collected, and lays the foundations on which the evaluation framework will be based.

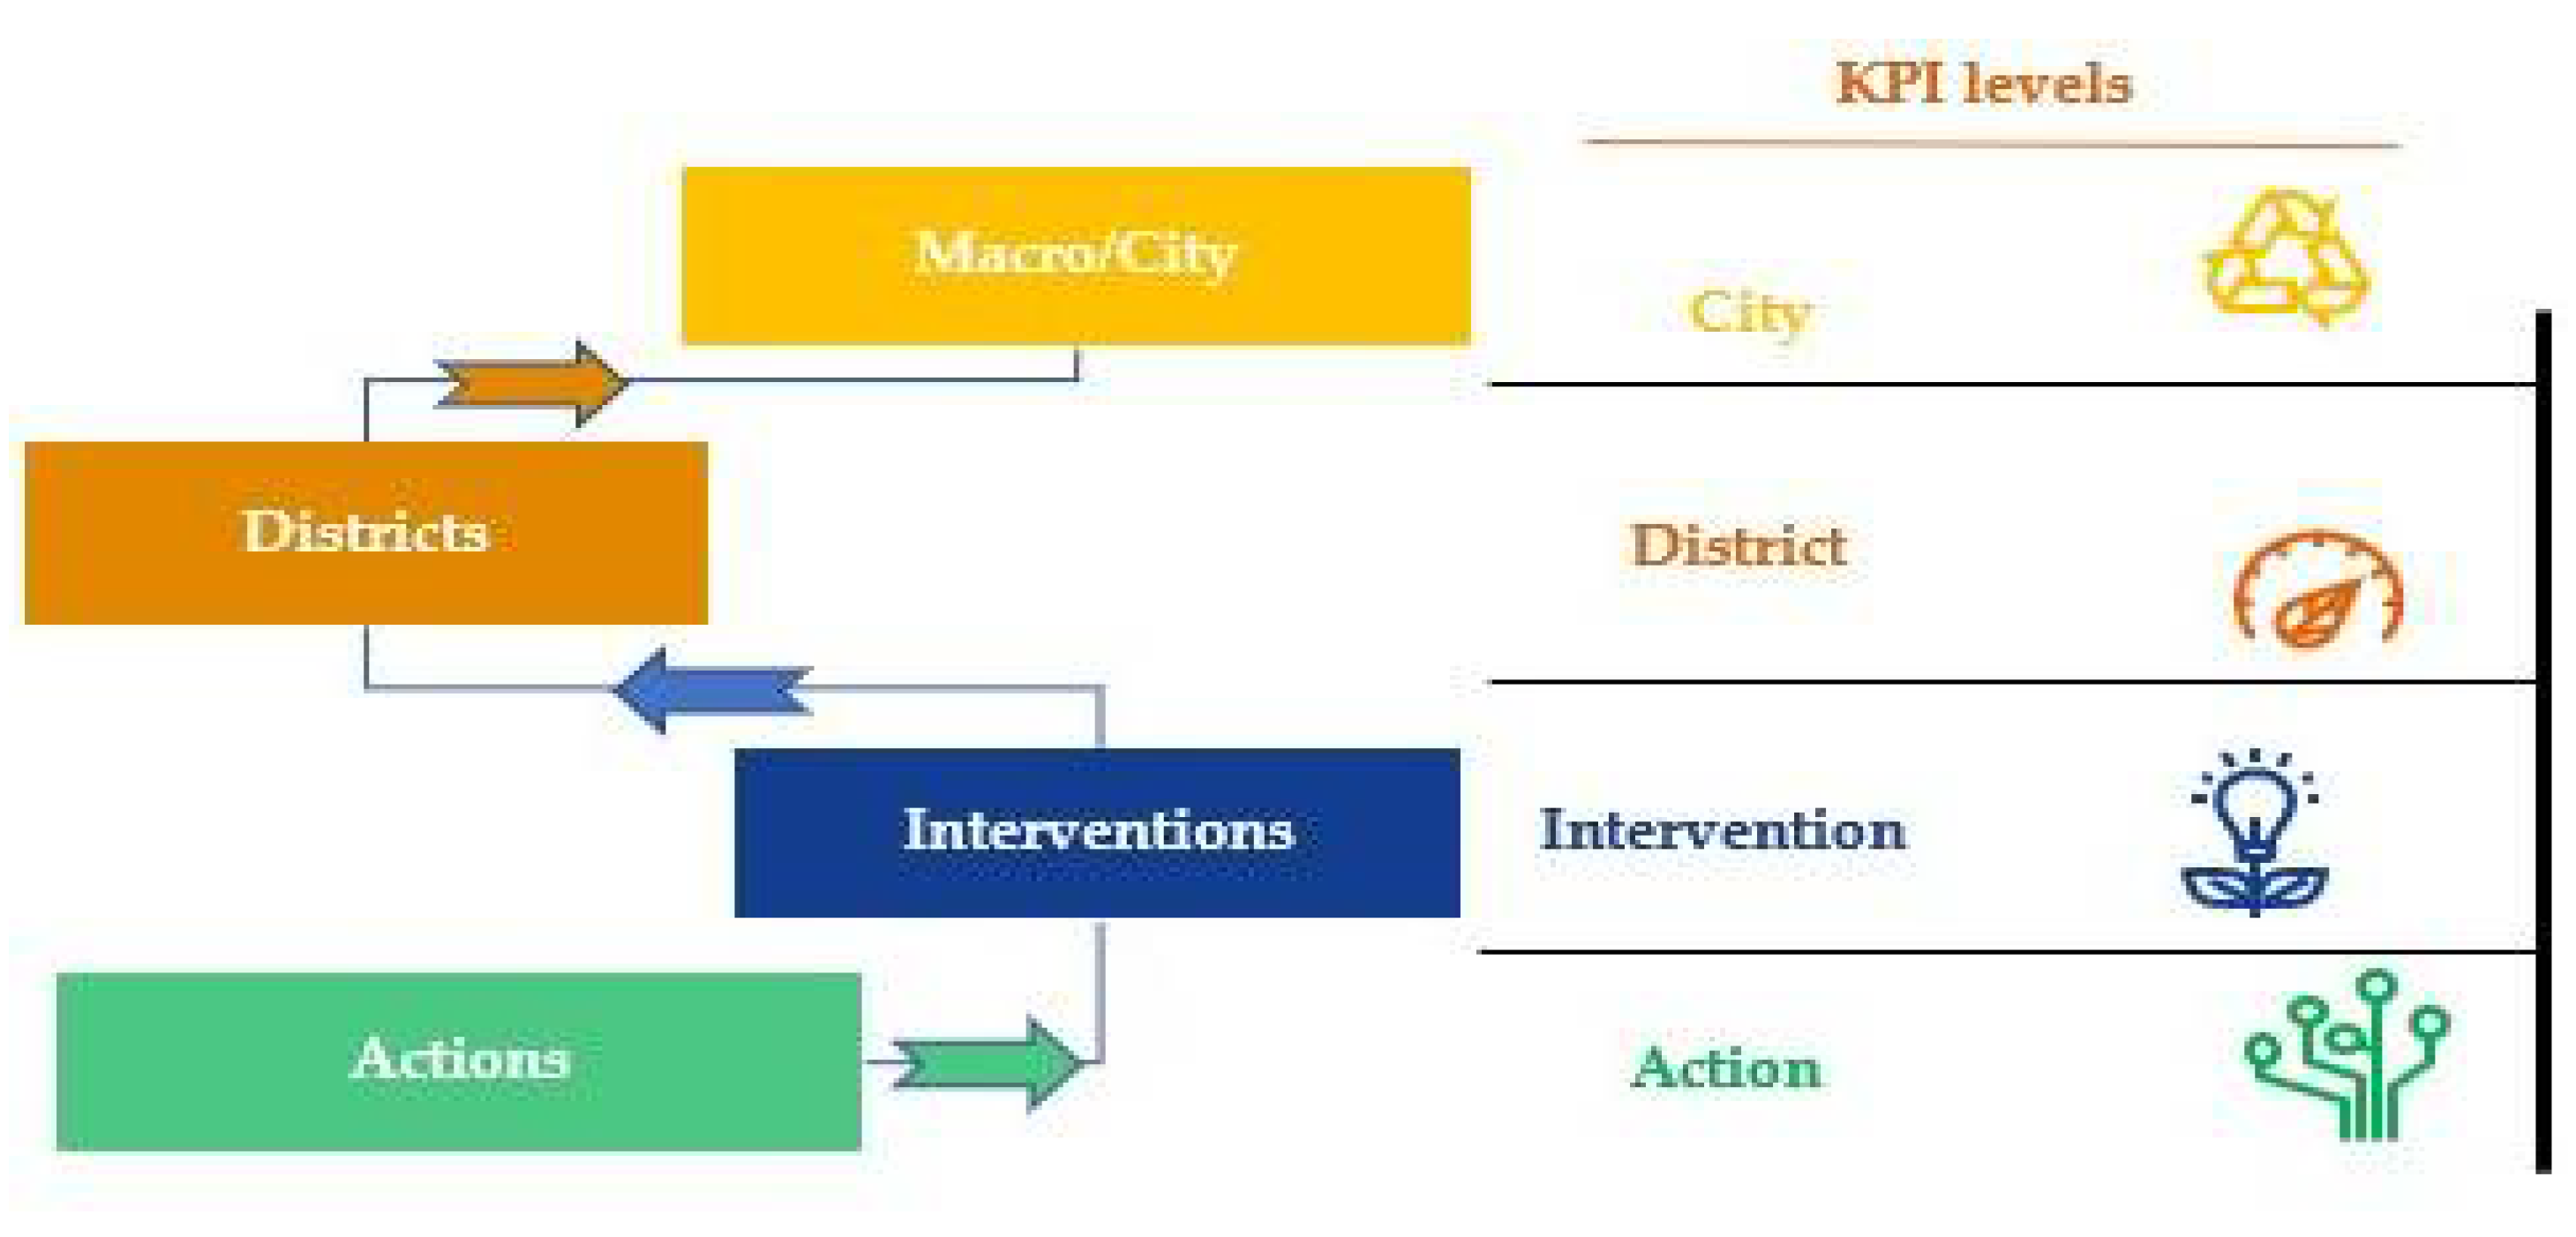
2.4. Bottom-Up Analysis of Interventions and Actions

The analysis of a city’s general impact targets and the definition of the first KPIs that can assess the expected impact are the first steps towards understanding the needs of the smart transformation. In order to completely define the KPIs required to evaluate the specific interventions planned for the city, a detailed bottom-up analysis of their explicit actions must be carried out, in which city stakeholders, partners and energy experts consider each action and intervention in order to document the expected impact of each activity. The lowest level of activity is the individual action. Many actions constitute an intervention level and several interventions define a district level. Following the same approach, the macro/city level is based on numerous districts. In the same way that these levels are structured, the definition of KPIs takes place, which means that, in order to define the final list of KPIs for a city, many actions must be analyzed in several districts (Figure 2).

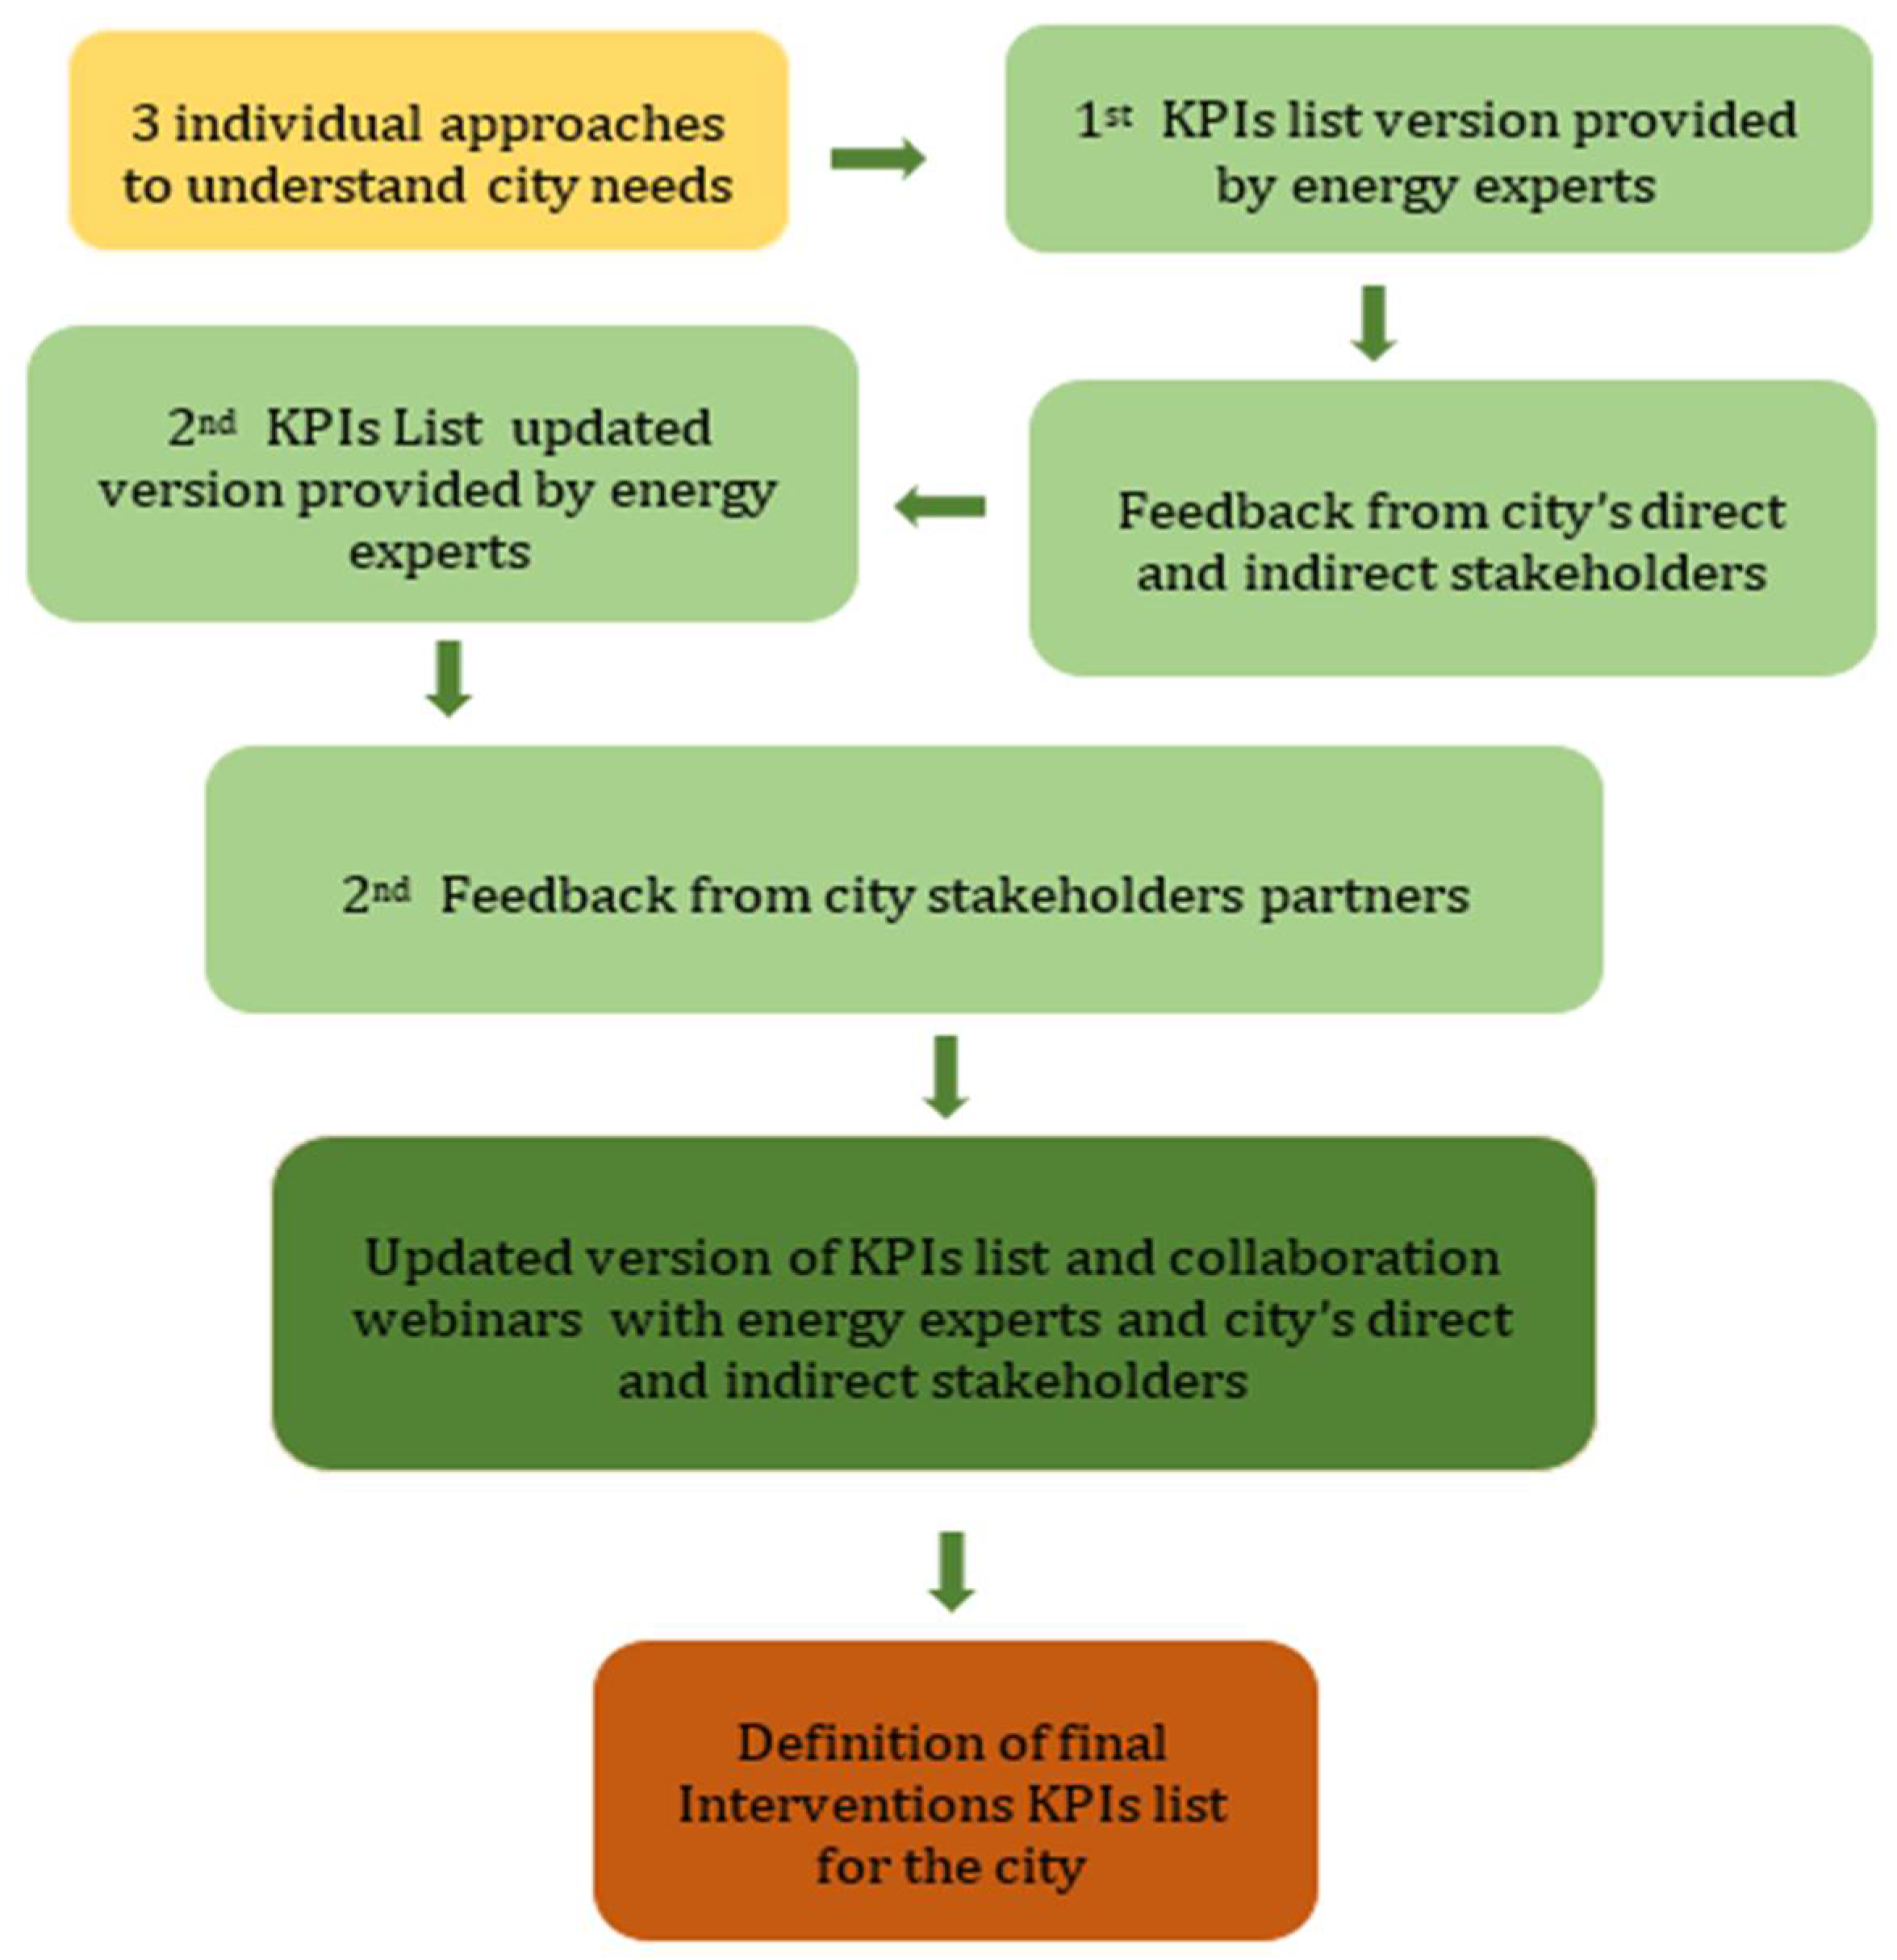
2.5. Collaboration of Energy Experts and City Representatives

As mentioned in previous sections, there are three separate approaches to fully understanding a city’s needs for smart transformation. Throughout this process, many KPIs are proposed, but further evaluation and in-depth analysis is required to determine a final list of KPI interventions. Figure 3 presents the collaboration process among energy experts and a city’s direct and indirect stakeholders. Usually this is a demanding and time-consuming process as many workshops are required, with the participation of the city’s internal and external stakeholders and the energy experts. Initially, all KPIs from the three different approaches are collected and the first version of the KPI intervention list is created. Feedback is then requested by energy experts from both the city’s direct and indirect stakeholders. As a next step, all comments and notes are incorporated, and the second version of the KPs lists is created. At that point, a second round of feedback is requested, and final comments are submitted by stakeholders. With the third edition of the KPIs list ready, workshops among energy experts and stakeholders take place and the final list is set.

2.6. Final KPIs List and Data Collection Methodology

An important element of performance measurement is represented by the data collection capability, which allows the calculation of the KPIs. These KPIs refer to a wide range of categories based on each city’s objectives and cover aspects such as environmental, energy, mobility, economic, ICT, governance, citizen engagement and social. However, applying a data collection methodology in the project context is neither easy, nor lacking obstacles. As the impact assessment and the decision being made based on it are significantly influenced by the data provided; the use of unreliable information might seriously damage a city’s smart transformation targets by influencing the city stakeholders towards making the wrong decisions. For this, several forms of feedback collection are utilized to obtain the necessary information such as workshop sessions, live consultation and clarification sessions, as well as offline reviews. To assist city partners in their efforts to optimize the data collection process and ensure consistency in the measurement of each KPI, the details of KPI definitions, calculation types, data needs and constraints should be available.

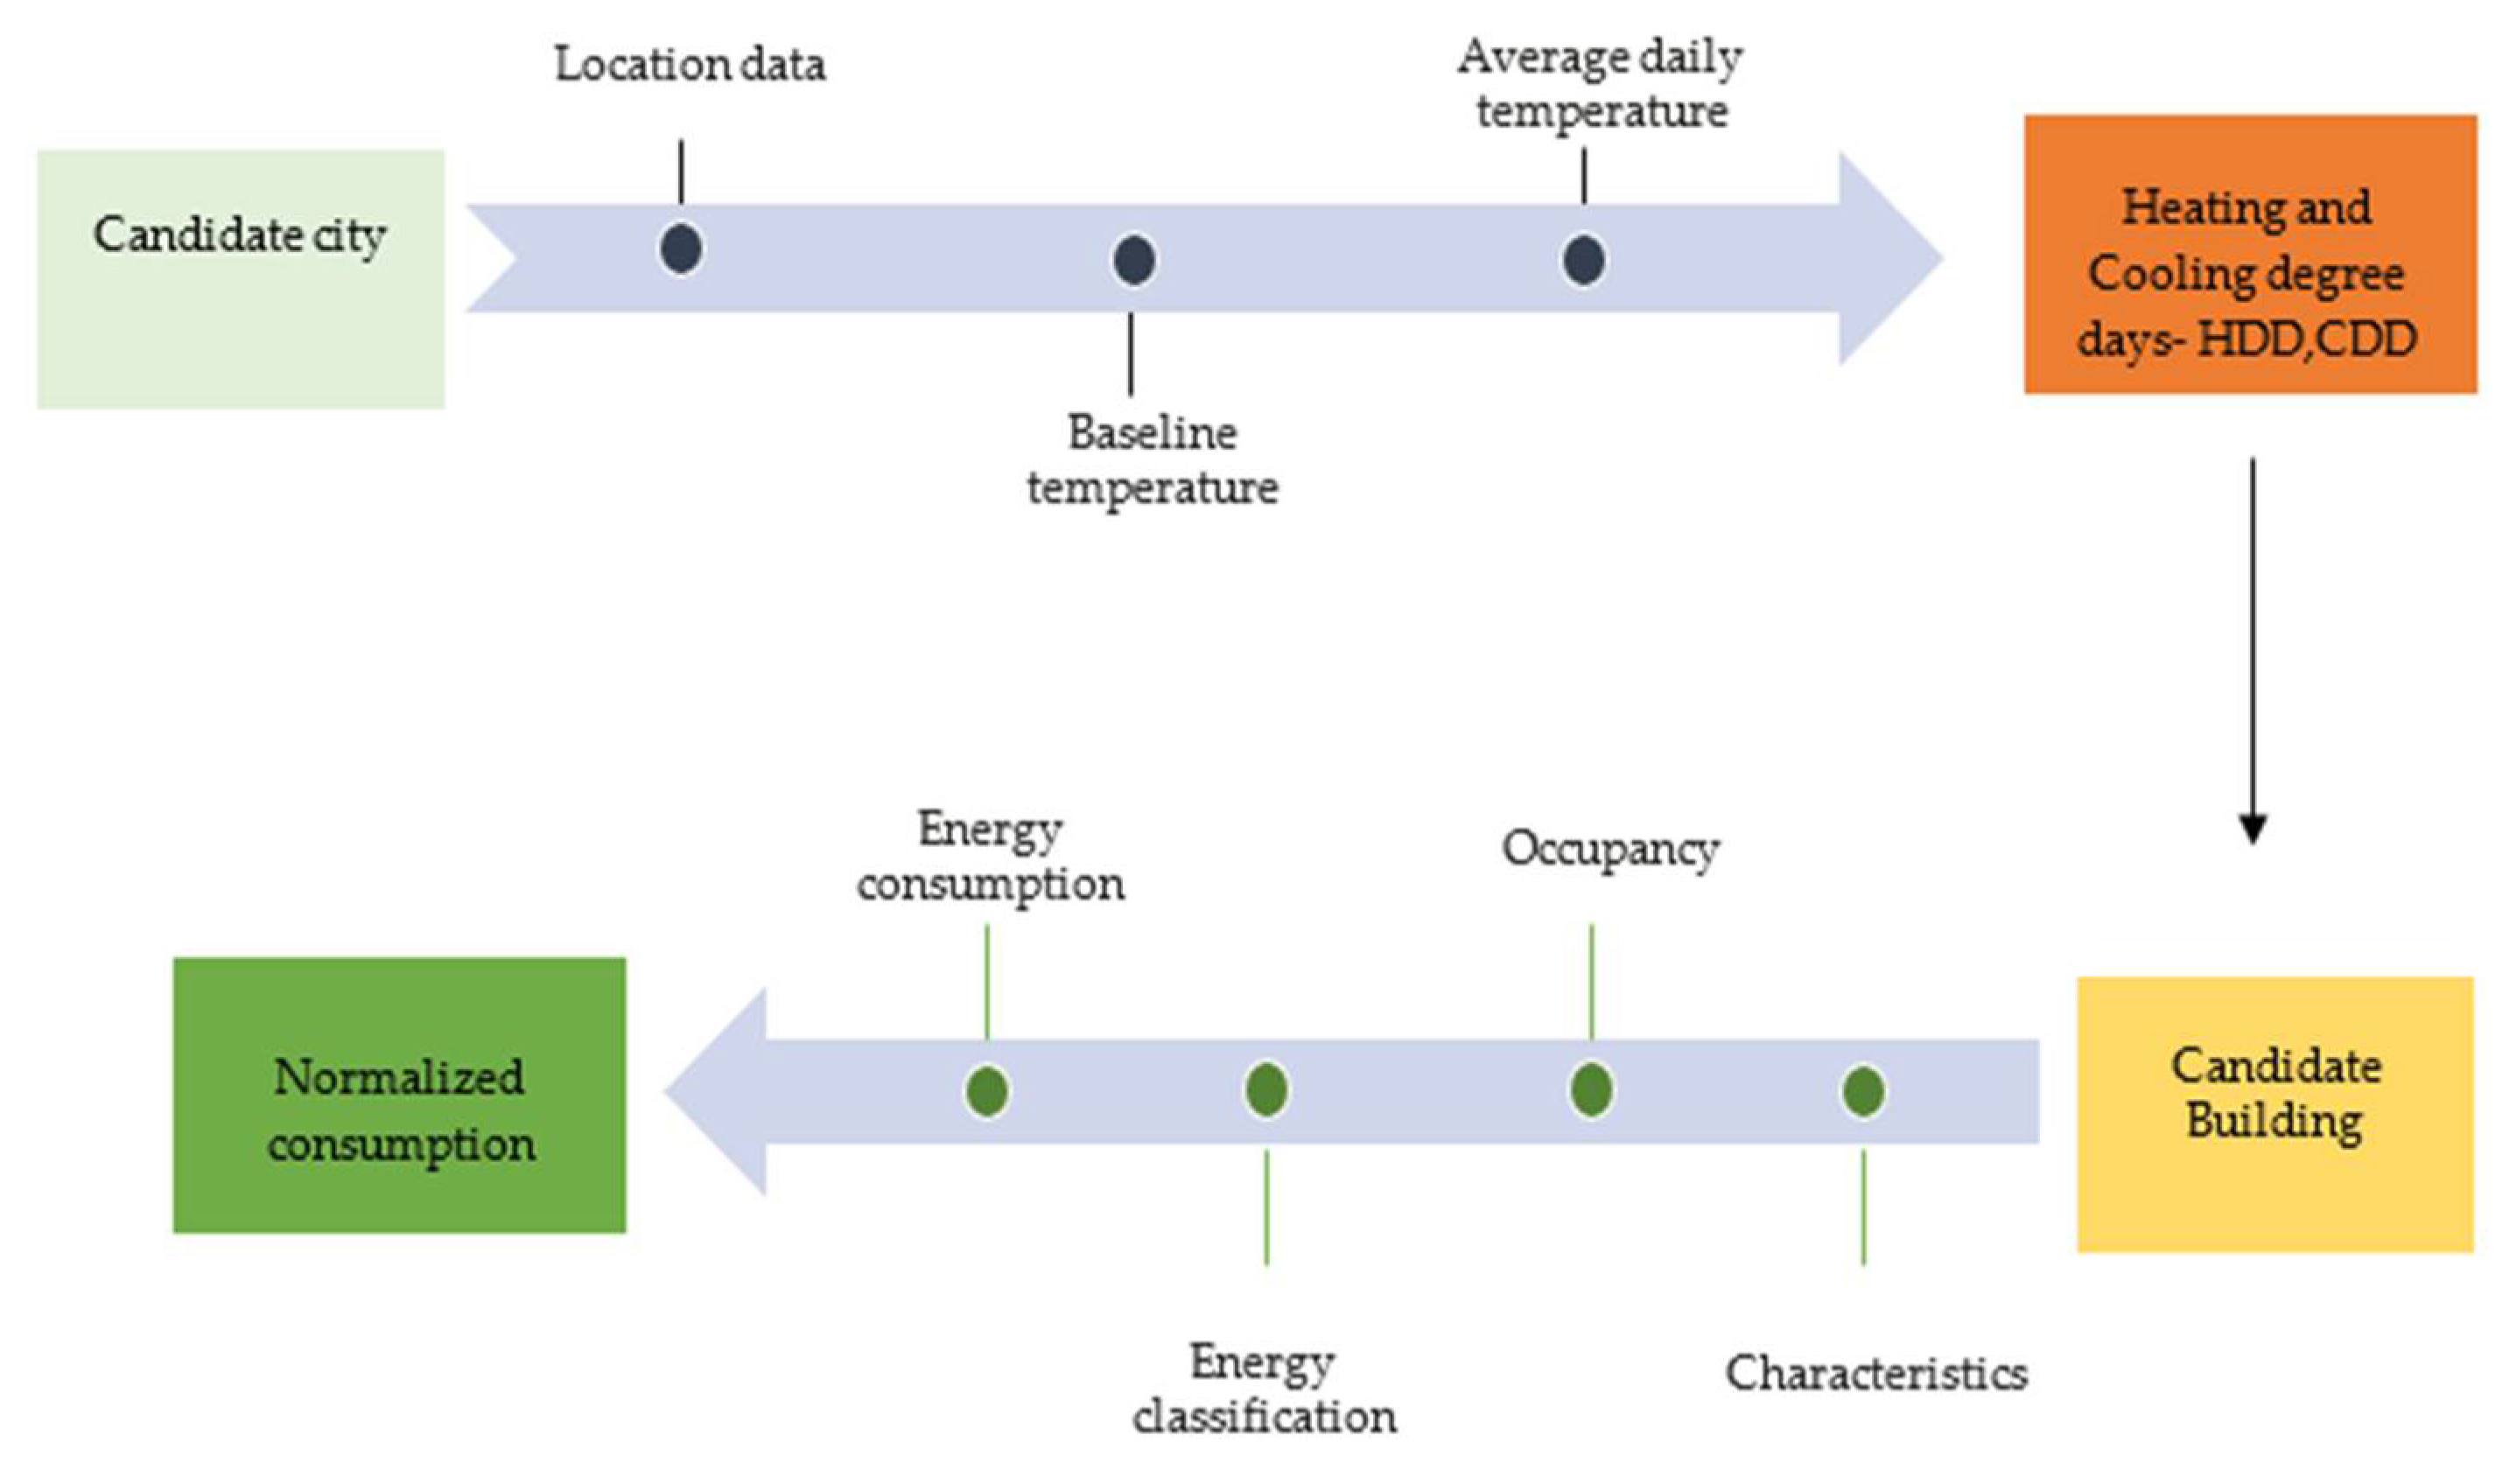
2.7. Normalization Methodology

As mentioned before, KPIs are an important tool for assessing the results of smart city projects, as well as providing valuable information to project managers and city stakeholders. Their use is important for future urban planning, as well as for the development of sustainable strategies, as long as they provide the right information in the right way. In order for the results to be meaningful and objectively comparable to each other, or with similar measurements/findings of relevant projects, they should be normalized, which means that they must be detached from the particularities and exogenous characteristics of cities. To achieve this, a normalization process is proposed that would be valuable for KPI comparisons among smart city projects, as well as to be utilized by individual cities. In this process, two basic approaches to data normalization related to the proposed KPIs are presented. The first approach deals with energy measurements related to areas (buildings or districts), for instance total energy consumption and overall energy reduction, which are influenced by factors such as weather on an annual basis, and geographical locations. The second approach deals with non-energy data, such as transport modes, building equipment management, ICT, etc., which are not affected by geographical location factors.

2.7.1. Energy-Related KPIs

The energy related KPIs of buildings or districts have to be normalized based on weather data, and a typical approach for this in Finland is to compare the data gathered to a 30-year average of weather conditions (which will be used for the calculation of Degree Days), including both early baseline and monitoring consumptions. With this approach, energy data can be more appropriately normalized regardless of the year and the location variables. Degree Days are essentially categorized using ambient air-temperature data and are divided into two distinct parts: the Heating Degree Days (HDD) and the Cooling Degree Days (CDD). These are used for calculations related to the heating and cooling in buildings, respectively. For the calculation of HDD figures, a baseline temperature is needed to provide a measure of how much (in degrees), and for how long (in days), the ambient temperature (as ambient temperature can be used as the daily mean temperature) is below that baseline. The difference of the ambient temperature from the base temperature is actually the number of the HDD for each day. Then, the normalization of energy consumption is performed by calculating the energy (in kWh) per Degree Day for each kWh of energy-consumption data for the selected period. It should be mentioned here that it is necessary to set threshold temperatures in order to determine the limits (meaning the baseline temperature) at which heating or cooling energy is taken into account for the calculations of both HDD and CDD. Another factor to consider when comparing the normalized consumption of buildings should be their energy classification, according to the Energy Performance Certification (EPC). In order to prepare an energy certificate, it is necessary to carry out an energy performance assessment of the characteristics and systems of the building, by gathering information about its components and energy consumption. This information is used as an input to a calculation model that evaluates the building’s energy consumption under local climatic conditions and leads to an A-to-G classification that facilitates the rapid comparison of buildings. Depending on the requirements of each use case, for each KPI, further values that allow appropriate comparisons, such as the size of the building/district or the number of residents/citizens and building occupancy, could be considered. In this context, the general approach proposed could be further enhanced depending on the needs of each use case and the availability of data.
The normalization process is visualized in Figure 4, where the initial normalization on energy data takes place based on the Heating and Cooling Degree Days of the candidate city. As the next step, a second normalization action is performed according to the characteristics of the study area (e.g., apartment, building, district etc.) that leads to the final form of the indicator appropriate for evaluation and comparison.

2.7.2. Non-Energy Related KPIs

There are various aspects that affect KPIs, so the data need to be analyzed ad-hoc and normalized with different factors, such as sunny days, number or total capacity of installed equipment, number of citizens or stakeholders involved, number of buildings participating in specific actions etc. However, the general approach will remain the same. In some cases, the normalization process is either unnecessary or can be done by converting data into units of measurement such as equipment number, measurement time, distance, etc. This simple normalization is usually included on the definition of the KPIs, so no further action is required. On the other hand, in cases where normalization cannot be included in the definition of KPIs, the important factors required in each case are taken into consideration, e.g., the weather conditions for the production of energy from RES are used in such a way that the final result is objective and comparable.

2.8. Process Evaluation

A process evaluation aims to highlight why some measures have succeeded or failed and includes the evaluation of planning, implementation and operation processes, taking into consideration the role of support actions such as information, communication, engagement and participation events. Based on this goal, the process evaluation aims to develop new findings on success factors and strategies for overcoming potential obstacles during the implementation and operation phase, analyzing all relevant information. To achieve this goal, each intervention must be studied in three separate phases, starting from the design phase, proceeding to the implementation phase and ending with the operation phase. Below are specific estimates for each step, as well as how each phase is linked to information, communication and participation activities.

2.8.1. Planning Phase

The planning phase includes activities such as challenge analysis and selection of the intervention that best addresses this challenge. During this process, and having a good understanding of the characteristics and benefits that the intervention will offer, the identification of the target groups and the markets is made first. The different requirements and needs of citizen or clients lead to the adjustment of the features and services that will be offered and define, at the same time, the support actions that must be followed for each intervention. The next step is the conceptualization of activities, such as developing ideas and design approaches, as well as preparing the initial steps. To achieve these goals, support actions are at the center, as they allow the interests of stakeholders and target groups to be validated, as well as opportunities and obstacles to be identified. Examples of measures for the effective implementation of the intervention planning phase are commitment actions to define the requirements, information campaigns to increase awareness and communication and participatory activities with key actors and target groups.

2.8.2. Implementation Phase

During the implementation phase of an intervention, the focus is on monitoring the progress of the individual actions to be followed for the successful implementation of the planned objectives. Monitoring the progress of all actions and the interdependencies between them allows for the detection of delays and the rapid and targeted implementation of alternative procedures, in order to meet the original schedule and avoid obstacles to other interventions. The involvement of stakeholders, as well as the appropriate information and communication activities throughout the implementation phase of the intervention, are of great importance for the successful execution and prevention of conflicts, as defined during the planning phase.

2.8.3. Operational Phase

The implementation phase is the period during which the intervention is made available to the public. Target groups, which are directly affected by the implementation actions, can use the intervention or are influenced by the results of the intervention. During this period, the implementation of the monitoring and evaluation framework, as set out in this document, will allow for an accurate assessment of the impact of operational interventions, measuring their efficiency and effectiveness. For actions that are well underway, emphasis should be placed on continuing and strengthening all ongoing activities. For cases where the impact assessment indicates shortcomings in achieving the expected results, a reassessment of the actions should be considered. It should be noted that the implementation of appropriate corrective actions is a key element of the process evaluation during the operation phase. It takes place after the root cause of the weakness has been identified, and supportive action is needed to bridge potential gaps, such as improving information and communication campaigns.

3. Results

Validation of the Proposed Methodology in the City of Espoo

The methodology proposed in the present paper started to be implemented in the city of Espoo in October 2019 by a European Union’s Horizon 2020 research and innovation program under the project name SPARCS and is still in progress.
The city of Espoo is an integrated part of the Helsinki capital metropolitan area in Finland and is located in the northern shore of the Gulf of Finland. The city covers 528 km2, is divided into seven major districts and has a population of approximately 280,000 inhabitants. Under the SPARCS project, Espoo is a lighthouse city, meaning that several demonstrations are taking place in three districts that are in different phases of development and construction.
  • Kera is an underdeveloped industrial area that will be rebuilt into a new residential district with 14,000 citizens;
  • The Espoonlahti district is the second largest of Espoo’s multiple city centers, with 56,000 residents, and is partially redeveloped; and
  • The Leppävaara district is the largest of Espoo’s five city centers. As an already built area, the center of Leppävaara, with over 65,000 residents, is a major urban activity and transport node.
For the city of Espoo, the first step of the methodology for understanding the objectives of the city has been made by analyzing the key-goals that meet its needs and requirements. The five key goals for the city of Espoo are listed below [48]:
(i)
AThe increased integration of renewable energy in the generation mix;
(ii)
An optimized excess heat management method for the specific city’s needs and existing characteristics and infrastructure;
(iii)
The optimization of local energy systems in the presence of distributed renewables, storage, demand side management and e-mobility energy resources;
(iv)
An improved energy performance of buildings and districts through human-centric building control optimization, advanced retrofitting and optimization of district-wide electrical network operation; and
(v)
The reduction of GHG emissions and improvement of local air quality and urban well-being.
These key targets are captured via general impacts and 11 supplementary impacts, planned to be evaluated in the city of Espoo. In the following Table 3, and by following the SMART criteria—Specific, Measurable, Attainable, Relevant and Timely—[44], KPIs are listed for the city of Espoo, based on the top-down analysis performed. It should be noted here that the KPIs referring to the increase/decrease of a measurement are a comparison with the situation before the implementation of the planned interventions.
Table 4 presents the results of the bottom-up approach concept followed for the activities planned in the city of Espoo. To simplify the presentation of the results, the action level KPIs are already consolidated in the intervention level and, in the first column, the intervention identification and title are listed. In the second column, the number of actions per intervention is provided, while the third column captures the KPIs per intervention, proposed from the city partners responsible for their implementation.
Table 3 illustrates that the actions in the domains of improving energy efficiency, electromobility, improving air quality and citizen well-being, smart governance and ICT infrastructures, as well as citizen engagement were analyzed in depth. This analysis that was performed both in Espoo’s key targets and in specific planned interventions under the SPARCS project generated a list of KPIs that can be proven very useful in assessing the impact of these interventions. A vast amount of proposed KPIs are related to energy production and consumption, as the decrease of energy consumption and the increase of energy efficiency are very critical factors on the way to smart transformation. In parallel, the increased penetration of Renewable Energy Sources (RES) for the production of clean energy and the use of electromobility, both as transport mode and as alternative energy storage source to reduce peak energy demand, are fundamental towards environmental protection and quality-of-life optimization. A very important pillar for the successful urban transformation is the acceptance of solutions from the citizens and the common vision for a future city. Thus, many KPIs related to citizen engagement were defined, covering various domains such as transport preferences, sustainable lifestyle, smart business models and involvement in code signing. In addition, ICT-related KPIs were proposed as part of the digitalization in smart cities.

4. Discussion

The transformation of cities towards more sustainable, healthier and citizen-centric places requires careful analysis of each city’s existing infrastructure, the available resources and policies in place, as well as the determination and projection of the citizens’ needs. In the recent years, attempts have been made towards developing strategic plans and breaking them down into deployable actions; however, we still lack a holistic methodology that defines the roadmap, the distinct steps and the metrics that are needed to develop, manage and control a smart city transformation program. In this work, a thorough review and analysis of such methodologies and metrics was conducted, not only from an academic perspective but also via a practitioner’s view through research on major smart city projects. In addition, a real case study was conducted, utilizing stakeholders from across Europe and locally to the city of Espoo in Finland, to validate our proposed methodology working by implementing specific actions on three demo sites, as well as investigating the impact assessment of the envisaged actions in detail. During this process, we thoroughly analyzed the city’s objectives, as presented in its strategic plan, as well as the planned actions on the demo sites, aiming at identifying several KPIs for the impact evaluation. The process for the definition of these KPIs (the initial number of the KPIs was 134) was challenging, as it was necessary to organize a large number of workshops in which city stakeholders and energy experts participated. A total of 14 workshops were held, during which 18 participants analyzed the proposed KPIs and came up with the final list of 61 KPIs. The adjustments made during that process were based on the availability of data and the identification of responsibilities between the city stakeholders for each demonstration area. It is worth noting that through this process knowledge and experience were transferred among the participants, promoting the ability to build strong connections and collaborations through participants, resulting in confidence towards action implementation and continuous improvement. In addition, as part of the engagement process, the workshops triggered discussions on how Espoo stakeholders could capture the citizens’ awareness and involvement in smart transformation actions, and how these metrics could be further measured and evaluated. The work presented in this paper triggers various future direction areas that start from the validation of our proposed methodology in further cities. Through the SPARCS project, we have, accordingly, planned to validate our methodology in six more European cities that are in different stages of their transformation process. This increased city pool will provide insights on the distinct processes and create further lessons which could be utilized to extend our proposed methodology in four separate but interlinked directions. Clear linkages that may help translate initial strategic plans to specific actions, as well as standardized processes that may contribute to update strategic plans after the definition of actions and impact assessment, could be developed. Impact-monitoring tools that embed real-time functionalities and contain appropriate and transparent metrics that are linked and evaluated at the municipal and national level could be designed to facilitate the appropriate monitoring of national targets and policy evaluation. In addition, the analysis of further domains that are deemed critical parts of urban living (for example, the domains included in the Smart City Index [21]) could contribute towards the multi-dimensional expansion of our proposed methodology to include further priority areas.

5. Conclusions

Smart cities are the result of a transformation process that many cities around the world are undergoing, to increase energy efficiency, facilitate citizen participation and reduce the environmental impact of human activities, while simultaneously digitizing and interconnecting a variety of processes and to simplifying the lives of their citizens. The evaluation of the impact this green innovation generates is a very important part of the smart transformation in order to understand which are the successful interventions and the reason that others failed. Towards this direction, this paper proposes an impact assessment framework for smart cities by introducing a seven-step methodology.
Three different approaches are presented in this paper for the definition of the necessary KPIs that were used as the basic tool for the impact assessment: the in-depth understanding of city targets, a top-down analysis and a bottom-up analysis of planned actions from city stakeholders and energy experts. These approaches assure that all needs of a city will be taken into consideration from different perspectives.
Additionally, the collaboration of all involved parties (energy experts and direct and indirect stakeholders) was proposed so that a final and valid KPIs list is defined and the calculation of all essential metrics is ensured. This process leads the data collection activities and prepares the ground for the normalization of the KPIs in order for them to be a useful tool to objectively compare metrics in different interventions.
As part of the methodology, and in order to highlight new findings about success factors and strategies to overcome possible barriers and obstacles during the implementation and the operation phase, a process evaluation procedure was proposed.
The application of this methodology started in the city of Espoo in 2019 and is still in progress; however, some of the results were presented here in order to validate the accuracy of the framework.

Author Contributions

Conceptualization, A.N., G.P. and P.P.; methodology, A.N., G.P. and P.P.; writing—original draft preparation, A.N. and A.H.; writing—review and editing, A.N., G.P., P.P. and A.H. All authors have read and agreed to the published version of the manuscript.

Funding

The research was funded by the European Union’s Horizon 2020 research and innovation program LC-SC3-SCC-1-2018-2019-2020-Smart Cities and Communities, under the project name SPARCS, grant number 864242.

Data Availability Statement

Not applicable.

Conflicts of Interest

The authors declare no conflict of interest.

References

  1. UN-DESA. United Nations Department of Economic and Social Affairs. 2018. Available online: https://www.un.org/development/desa/en/news/population/2018-revision-of-world-urbanization-prospects.html (accessed on 6 March 2020).
  2. Imasiku, K. Organizational Insights, Challenges and Impact of Sustainable Development in Developing and Developed Nations. In Sustainable Organizations-Models, Applications, and New Perspectives; IntechOpen: London, UK, 2021. [Google Scholar]
  3. Lim, Y.; Edelenbos, J.; Gianoli, A. Identifying the results of smart city development: Findings from systematic literature review. Cities 2019, 95, 102397. [Google Scholar] [CrossRef]
  4. Toli, A.M.; Murtagh, N. The Concept of Sustainability in Smart City Definitions. Front. Built Environ. 2020, 6, 77. [Google Scholar] [CrossRef]
  5. Yigitcanlar, T.; Lönnqvist, A. Benchmarking knowledge-based urban development performance: Results from the international comparison of Helsinki. Cities 2013, 31, 357–369. [Google Scholar] [CrossRef] [Green Version]
  6. Madlener, R.; Sunak, Y. Impacts of urbanization on urban structures and energy demand: What can we learn for urban energy planning and urbanization management? Sustain. Cities Soc. 2011, 1, 45–53. [Google Scholar] [CrossRef]
  7. IEA. Empowering Cities for a Net Zero Future: Unlocking Resilient, Smart, Sustainable Urban Energy Systems; Report; IEA Publications: Paris, France, 2021. [Google Scholar]
  8. European Commission. Directorate General for Internal Policies Policy Department: Economic and Scientific Policy Mapping Smart Cities in the EU Study; Report IP/A/ITRE/ST/2013-02; European Commission: Brussels, Belgium, 2014. [Google Scholar]
  9. EU Smart Cities Information System. The Making of a Smart City: Best Practices across Europe Empowering Smart Solutions for Setter Sities; European Commission: Brussels, Belgium, 2017; 256p, Available online: www.smartcities-infosystem.eu (accessed on 11 November 2021).
  10. Cocchia, A. Smart and Digital City: A Systematic Literature Review. In Smart City; Springer: Cham, Switzerland, 2014; pp. 13–43. [Google Scholar] [CrossRef]
  11. Smart Cities|European Commission. Available online: https://ec.europa.eu/info/eu-regional-and-urban-development/topics/cities-and-urban-development/city-initiatives/smart-cities_en (accessed on 6 March 2020).
  12. Cohen, B. What Exactly Is a Smart City. 2019. Available online: http://www.fastcoexist.com/1680538/what-exactly-is-a-smart-city (accessed on 15 April 2016).
  13. Andone, D.; Holotescu, C.; Grosseck, G. Learning communities in smart cities. Case studies. In Proceedings of the 2014 International Conference on Web and Open Access to Learning (ICWOAL), Dubai, United Arab Emirates, 25–27 November 2014. [Google Scholar] [CrossRef]
  14. Winkowska, J.; Szpilko, D.; Pejić, S. Smart city concept in the light of the literature review. Eng. Manag. Prod. Serv. 2019, 11, 70–86. [Google Scholar] [CrossRef] [Green Version]
  15. Apanaviciene, R.; Vanagas, A.; Fokaides, P.A. Smart building integration into a smart city (SBISC): Development of a new evaluation framework. Energies 2020, 13, 2190. [Google Scholar] [CrossRef]
  16. Tsolakis, N.; Anthopoulos, L. Eco-cities: An integrated system dynamics framework and a concise research taxonomy. Sustain. Cities Soc. 2015, 17, 1–14. [Google Scholar] [CrossRef]
  17. Anthopoulos, L. Defining Smart City Architecture for Sustainability. In Electronic Government and Electronic Participation, Proceedings of the Ongoing Research and Projects of IFIP WG 8.5 EGOV and EPart 2015, (AUGUST 2015), Thessaloniki, Greece, 30 August–2 September 2015; IOS Press: Amsterdam, The Netherlands, 2015; pp. 140–147. [Google Scholar] [CrossRef]
  18. Nam, T.; Pardo, T.A. Conceptualizing smart city with dimensions of technology, people, and institutions. In Proceedings of the 12th Annual International Digital Government Research Conference: Digital Government Innovation in Challenging Times, College Park, MD, USA, 12–15 June 2011; pp. 282–291. [Google Scholar] [CrossRef]
  19. Calvillo, C.F.; Sánchez-Miralles, A.; Villar, J.; Martín, F. Impact of EV penetration in the interconnected urban environment of a smart city. Energy 2017, 141, 2218–2233. [Google Scholar] [CrossRef] [Green Version]
  20. Meijer, A.; Bolívar, M.P.R. Governing the smart city: A review of the literature on smart urban governance. Int. Rev. Adm. Sci. 2016, 82, 392–408. [Google Scholar] [CrossRef]
  21. IMD Smart City Index 2019—IMD Report. Available online: https://www.imd.org/research-knowledge/reports/imd-smart-city-index-2019/ (accessed on 5 January 2021).
  22. Smart City Digital Ecosystem|Shaping Europe’s Digital Future. Available online: https://digital-strategy.ec.europa.eu/en/policies/smart-city-digital-ecosystem (accessed on 11 November 2021).
  23. Caird, S.P.; Hallett, S.H. Towards evaluation design for smart city development. J. Urban Des. 2018, 24, 188–209. [Google Scholar] [CrossRef]
  24. Komninos, N.; Tsampoulatidis, I.; Kakderi, C.; Nikolopoulos, S.; Kompatsiari, I. Projects for intelligent and smart cities: Technology and innovation transforming city ecosystems. Preprints 2021, 2021080080. [Google Scholar] [CrossRef]
  25. Komninos, N.; Bratsas, C.; Kakderi, C.; Tsarchopoulos, P. Smart City Ontologies: Improving the effectiveness of smart city applications. J. Smart Cities 2016, 1, 31–46. [Google Scholar] [CrossRef] [Green Version]
  26. Dameri, R.P.; Garelli, R. Measuring Business Benefits and Performance in Smart Cities. In Proceedings of the European Conference on Innovation and Entrepreneurship, (Ecie 2014), Belfast, UK, 18–19 September 2014; pp. 137–144. [Google Scholar]
  27. Dameri, R.P. Urban Smart Dashboard. Measuring Smart City Performance. In Smart City Implementation; Springer: Cham, Switzerland, 2017; pp. 67–84. [Google Scholar] [CrossRef]
  28. Kourtzanidis, K.; Angelakoglou, K.; Apostolopoulos, V.; Giourka, P.; Nikolopoulos, N. Assessing impact, performance and sustainability potential of smart city projects: Towards a case agnostic evaluation framework. Sustainability 2021, 13, 7395. [Google Scholar] [CrossRef]
  29. Dameri, R.P. Urban Tableau de Bord: Measuring Smart City Performance. Lect. Notes Inf. Syst. Organ. 2015, 5, 173–180. [Google Scholar] [CrossRef]
  30. Tanda, A.; de Marco, A.; Rosso, M. Evaluating the impact of smart city initiatives the torino living lab experience. In Proceedings of the 6th International Conference on Smart Cities and Green ICT Systems, Porto, Portugal, 22–24 April 2017; pp. 281–286. [Google Scholar] [CrossRef]
  31. ISO Standard No 37101; Sustainable Development in Communities—Management System for Sustainable Development—Requirements with Guidance for Use . International Organization for Standardization: Geneva, Switzerland, 2016; p. 32. Available online: https://www.iso.org/standard/61885.html (accessed on 11 November 2021).
  32. ISO Standard No. 37122:2019; Sustainable Cities and Communities—Indicators for Smart Cities. International Organization for Standardization: Geneva, Switzerland, 2019. Available online: https://www.iso.org/standard/69050.html (accessed on 11 November 2021).
  33. Huovila, A.; Bosch, P.; Airaksinen, M. Comparative analysis of standardized indicators for Smart sustainable cities: What indicators and standards to use and when? Cities 2019, 89, 141–153. [Google Scholar] [CrossRef]
  34. Sojda, A.; Wolny, M. The Impact of Standardisation Method on Smart City Ranking. Sci. Pap. Silesian Univ. Technol. Organ. Manag. Ser. 2020, 2020, 83–94. [Google Scholar] [CrossRef]
  35. Akande, A.; Cabral, P.; Gomes, P.; Casteleyn, S. The Lisbon ranking for smart sustainable cities in Europe. Sustain. Cities Soc. 2019, 44, 475–487. [Google Scholar] [CrossRef]
  36. Lazaroiu, G.C.; Roscia, M. Definition methodology for the smart cities model. Energy 2012, 47, 326–332. [Google Scholar] [CrossRef]
  37. Debnath, A.K.; Chin, H.C.; Haque, M.M.; Yuen, B. A methodological framework for benchmarking smart transport cities. Cities 2014, 37, 47–56. [Google Scholar] [CrossRef] [Green Version]
  38. Marketplace of the European Innovation Partnership on Smart Cities and Communities. Available online: https://eu-smartcities.eu/ (accessed on 26 March 2020).
  39. CITYKeys-Home. Available online: http://www.citykeys-project.eu/ (accessed on 9 March 2020).
  40. About the Smart Cities Information System (SCIS)|Smartcities Information System. Available online: https://smartcities-infosystem.eu/content/about-smart-cities-information-system-scis (accessed on 20 January 2020).
  41. Home|CIVITAS. Available online: https://civitas.eu/ (accessed on 11 November 2021).
  42. Triangulum|The Three Point Project Triangulum Is One of Currently Nine European Smart Cities and Communities Lighthouse Projects, Set to Demonstrate, Disseminate and Replicate Solutions and Frameworks for Europe’s Future Smart Cites. Available online: https://triangulum-project.eu/ (accessed on 11 November 2021).
  43. Marijuán, G.; Etminan, G.; Möller, S. Smart Cities Information System-Key Performance Indicator Guide Version 2.0, EU SCIS; 1 February 2017; ENER C2/2013-463/S12.691121. Available online: https://www.smartcities-infosystem.eu/sites/default/files/document/scis_kpi_guide.pdf (accessed on 3 March 2019).
  44. Rooijen, N.; van Nesterova, T. Deliverable 4.10: Applied Framework for Evaluation in CIVITAS PLUS II; Civitas Wiki Project, WP4, May 31 2013, Grant Agreement No.: 296081; Civitas Wiki: London, UK, 2013. [Google Scholar]
  45. Angelakoglou, K.; Nikolopoulos, N.; Giourka, P.; Svensson, I.-L.; Tsarchopoulos, P.; Tryferidis, A.; Tzovaras, D. A Methodological Framework for the Selection of Key Performance Indicators to Assess Smart City Solutions. Smart Cities 2019, 2, 269–306. [Google Scholar] [CrossRef] [Green Version]
  46. About the Covenant of Mayors. Available online: https://www.covenantofmayors.eu/about/covenant-initiative/origins-and-development.html (accessed on 11 November 2021).
  47. Sparcs|Sparcs. Available online: https://www.sparcs.info/ (accessed on 11 November 2021).
  48. Hukkalainen, M.; Zarrin, F.; Klobut, K.; Lindholm, O.; Ranta, M.; Hajduk, P.; Vainio-Kaila, T.; Wanne, E.; Tartia, J.; Horn, H.; et al. Deliverable 3.1: Detailed Plan of the Espoo Smart City Lighthouse Demonstrations; SPARCS project, Grant Agreement No.: 864242. 2020. Available online: https://www.sparcs.info/about/deliverables/d301-detailed-plan-espoo-smart-city-lighthouse-demonstrations (accessed on 11 November 2021).
  49. Huber, M.; André Knottnerus, J.; Green, L.; Van Der Horst, H.; Jadad, A.R.; Kromhout, D.; Leonard, B.; Lorig, K.; Loureiro, M.I.; van der Meer, J.W.M.; et al. How should we define health? BMJ 2011, 343, d4163. [Google Scholar] [CrossRef] [PubMed] [Green Version]
Figure 1. Seven-step impact assessment framework.
Smartcities 05 00006 g001
Figure 2. Development of KPIs at different levels.
Smartcities 05 00006 g002
Figure 3. Collaboration among experts and city representatives.
Smartcities 05 00006 g003
Figure 4. Energy related KPI-normalization process.
Smartcities 05 00006 g004
Table 1. KPIs overview from relevant projects.
SCISCITYkeysCIVITASTriangulum
Number of indicators381013079
Type of indicatorsImpactOutput, ImpactProcess, ImpactImpact
Assessment scaleCity, District, BuildingCity, ProjectCityProject
Impact categories coveredTechnical, Environmental, Economic, ICT, MobilityPeople, Planet, Prosperity, Governance, PropagationGlobal Environment, Quality of life, Economic success, Mobility system performanceEnergy, Transport, Socioeconomic, Citizen engagement, ICT
Table 2. List of study participants involved in the assessment methodology.
Parties InvolvedStage of Involvement
Direct city stakeholders
(typically including employees,
decision makers, technical and financial departments, project managers)
Step 1
Step 3
Step4
Step5
Step7
Indirect city stakeholders
(external stakeholders, subcontractors,
3rd party technology partners, project managers)
Step 1
Step 3
Step4
Step5
Step7
Energy experts
(engineers, energy supply scientists, data scientists, environmental scientists)
Step 1
Step2
Step 3
Step4
Step5
Step6
Step7
Table 3. Top-down analysis.
ImpactsImpact DescriptionKey Performance IndicatorsUnit
General impactsReturn of investments, payback time, debt service coverage ratio, carbon emission reduction, res share, energy savingsReturn of Investment (ROI)%
Payback timeYears
Debt Service Coverage Ratio%
Total electricity demand reductionWh
Total heating demand reductionWh
Reduction of CO2-eq emissionsTones/year
Share of RES increase%
Impact 1Meeting global and EU climate
mitigation and adaptation goals
and national and/or local energy
air quality and climate targets
Reduction of CO2-eq emissionsTones/year
Air qualityPpm
Impact 2Increase of share of renewable energy, excess heat recovery, appropriate storage solutions and their integration into the energy systemShare of RES increase%
Excess Heat recovery ratio%
Increase of integrated systems share%
Energy Storage Increase%
Impact 3Rollout of Positive Energy Districts (PED)Decrease of energy import share%
Impact 4Improvement of energy efficiency, district level self-consumption optimization and energy curtailment reductionIncrease of Citizens participation in market%
Peak load (electricity) reduction%
Peak load (heating) reduction%
Self-consumption rate Increase%
Onsite Energy Ratio (OER)%
Impact 5Increase of E-mobility solutionsEV car sharing rate increase%
Increase of EVs share in local transportation%
Transport behavior
Increase of EV (smart) charging points%
Utilization of charging stations∑Wh charged
Impact 6Air quality improvementReduction of CO2 and NOx emissions, small particulates and volatile hydrocarbons%
Impact 7Maximization of the replicability potentialDevelopment and implementation of a replication strategyNumber of replicated solutions
Impact 8Increase citizens’ quality of life, health and well-beingIncrease citizens’ quality of life health and well-being%
Table 4. Bottom-up analysis.
Interventions
Espoo
Number of ActionsKey Performance IndicatorsUnit
E1—Solutions for positive energy blocks6Onsite energy ratio (OER)%
E2—Boosting E-mobility uptake3kWh charged to EVsWh
Number of different EV charging stationsNumber
E3—Engaging users3Number of people aware of existing solutionsNumber
Did you feel that you had a real possibility to impact current situation/change?Likert scale
E4—Smart business models1How well does the business model(s) cover the four lenses of innovation (desirability, feasibility, viability and sustainability)?Likert scale
E5—Solutions for positive energy blocks3Percentage of locally produced energy (heat, cool, electricity) compared to baseline%
Percentage of onsite RES compared to demand%
Percentage of onsite RES compared to max potential%
E6—ICT for positive energy blocks3Percentage of flexibility compared to baseline%
Prediction accuracy of flexibility%
E7—New E-mobility hub3Percentage of flexibility compared to baseline%
Prediction accuracy of flexibility%
E8—Engaging users3Number of people reached in totalNumber
Number of citizens who contributed to co-created solutionsNumber
E9—Smart business models1Citizens interest in new business models that can be developed and shared as a common vision for value-added proposals, revenue generation and required resultsLikert scale
E10—Solutions for positive energy blocks3On-site energy ratio%
Number of early-stage solutions investigatedNumber
E11—Engaging users1Targeted share of bicycle and pedestrian mobility modeLikert scale
E12—ICT for positive energy blocks3Model developed and cost-benefit analysis completed for blockchain technologyNumber
E13—E-mobility in Kera district2Estimated share of vehicle: km by chargeable vehicles, Hybrid Electric Vehicle (HEV), Battery Electric vehicle (BEV), excl. bicycles%
E14—New economy/smart governance models1Number of stakeholders who contributed to co-created business modelsNumber
Percentage of stakeholder satisfactionLikert scale
E15—Virtual power plant2Number of flexible loads: typology/type, capacity, response delayNumber
Number of blockchain platformsNumber
E16—Smart heating1Number of buildings connected to smart heating serviceNumber
E17—Virtual twin2Increased number of persons using Espoo 3D city modelNumber
Number of innovative energy technologies incorporated in virtual twin for simulation purposesNumber
E18—EV charging effects to grid1How much lower is the peak power demand when using the developed charging strategies compared to the normal case?kWh
Number of innovative energy technologies incorporated in virtual twin for simulation purposesNumber
E19—Sustainable lifestyle2Healthy lifestyle indicators [49]:
Physical health
Emotional health
Financial health
Likert scale
E20—District development1Increase of smart energy infrastructures(Number)
E21—Air quality1PM10NOxPpm
E22—Co-creation for positive energy district development2Number of relevant stakeholders engaged(Number)
Acceptance of smart city Espoo conceptLikert scale
E23—New economy/smart business models2Number of new projects generated and volume of funding(Number)
Publisher’s Note: MDPI stays neutral with regard to jurisdictional claims in published maps and institutional affiliations.

