Communication

Evaluating the Dynamic Impact of Theater Performances and Sports Events on Parking Demand in Downtown Pittsburgh

by
Katsunobu Sasanuma
College of Business, Stony Brook University, Stony Brook, NY 11794, USA
Smart Cities 2021, 4(4), 1391-1402; https://doi.org/10.3390/smartcities4040073
Submission received: 26 August 2021 / Revised: 26 October 2021 / Accepted: 29 October 2021 / Published: 8 November 2021
(This article belongs to the Topic Sustainable Smart Cities and Smart Villages)

Abstract

:
The number of drivers using parking facilities (parking demand) in downtown Pittsburgh is highly variable throughout business operating hours, which makes an efficient operation of parking facilities challenging and results in congestion around the facilities. In this study, we applied an event-based ordinary least squares (OLS) regression model to the parking data set provided from one of the parking facilities, the Theater Square Garage in downtown Pittsburgh. We demonstrated that our model achieved a high R-squared value during time periods when parking demand is highly variable. Using the model, we revealed the dynamic (time-dependent) impact of theater performances and sports events on parking demand. This dynamic information can help facility managers appropriately adjust their operating settings (e.g., the number of staff and fee structure) during surge or vacant time periods accordingly. This model is applicable to various businesses in downtown areas that have increased customer flow from theater performances and sports events, not only parking garages.

1. Introduction

Downtown Pittsburgh is culturally vibrant and offers a multitude of entertainment at facilities and complexes such as theaters, a concert hall, a baseball field, an arena, and a football stadium. As a result, many people visit downtown Pittsburgh by car and the demand for parking is high on event days. This parking demand, the number of drivers using parking facilities, heavily fluctuates every day, making an efficient operation of facilities difficult. Knowing the factors that impact their facilities can help managers adjust the number of facility operators and parking fee structures, so that they can utilize their facilities efficiently while reducing the adverse effects of parking-induced traffic congestion in the downtown area. However, it is not easy to estimate the impact of each single event, because the impact of an event is dynamically changing throughout business operating hours and the combination of events is different every day. Consequently, facility managers often rely on intuitions to cope with heavily fluctuating parking demand.
We took a data analytics’ approach to evaluate parking demand. Specifically, we utilized an event-based ordinary least squares (OLS) regression model to analyze the parking data set provided from one of the parking facilities, the Theater Square Garage in downtown Pittsburgh. The scope of this study was to obtain the dynamic (time-dependent) impact of each event on the number of vacancies (available parking spaces), which reflect parking demand, and to explain the procedure that is easy to implement by practitioners. During times of the day when parking demand highly fluctuates, our event-based model explained the number of available spaces with a high coefficient of determination, greater than 80%.

Related Literature

Many people visit downtown areas using vehicles as a means of transportation. These visitors (drivers) are affected by how efficient parking facilities (both on-street parking and parking garages) are operated. An effective management of parking facilities can boost the economy of businesses in downtown areas, while poor management will not only impose a high travel cost for drivers, but also negatively impact businesses located in downtown areas. In fact, many vehicles cruise for parking spaces, creating congestion as well as hurting the sales of businesses. In [1], it was estimated that between 8 and 74% of the traffic were cruising for parking spaces in congested downtown areas. In [2], it was observed in downtown Boston that about 10–20% of vehicles were cruising for parking spaces; [3] accurately explained this parking behavior using a parking queue model.
To manage the flow of drivers effectively and utilize the limited parking capacity in downtown San Francisco as much as possible, a smart parking initiative called SFpark started in 2011. Using sensors embedded in roads, the city monitored the number of available parking spaces and controlled parking price dynamically following the idea of dynamic pricing [4]. Under this initiative, they successfully reduced the congestion in downtown San Francisco. According to [5], SFpark generated an economic benefit of about $36 million over the duration of the program from 2011 to 2013. Other advanced parking management systems also utilize information technologies; for a review of these systems, please see [6,7,8]. One example of the application of such technologies is [9], where a wireless sensor network was established to implement a smart parking (SPARK) system. Another example of technology-enabled smart parking systems is [10], where available parking spaces were detected by magnetic sensors; the data from these sensors were communicated to the server and then toward social networks such as Twitter and Facebook. As an example of scalable and low-cost car parking frameworks, [11] proposed an integration of networked sensors and radio frequency identification (RFID) technologies to monitor the number of available spaces, which was then informed to drivers via the internet. One final example is a smart parking system in Pittsburgh, ParkPGH, which provides real-time garage parking occupancy information via mobile apps, text messages, and the internet [12]. The parking garage occupancy data at the Theater Square Garage in the Cultural District [13] were utilized for the ParkPGH initiative [14]; we used their data set in this study.
These advanced parking management systems enable an efficient operation of parking facilities using a variety of technology. However, investments in infrastructure of information systems are often difficult to fund for smaller businesses. Furthermore, although facility managers can improve the operation of systems by adopting advanced information technologies, these approaches may not resolve the fundamental issue they face: variability in demand. It is important for managers to understand the source of the variability, as knowing the source can then help them make a change in facility planning, e.g., a change of fee structures for different categories of drivers using their facilities. In this paper, we focus on this fundamental problem—high variability of parking demand—and explain the variability of parking demand by events held in downtown Pittsburgh. Our analysis did not require any sensors or hardware devices. To perform the analysis, we only required the following information: the past demand data (i.e., the number of drivers using the Theater Square Garage in the past), historical events’ data, and weather information. This analysis is easy to conduct for practitioners who want to take advantage of various types of information available on the internet. Following our analysis, practitioners can obtain a time-dependent impact of various events, which can be used to create an efficient capacity plan for their facilities.

2. Data and Method

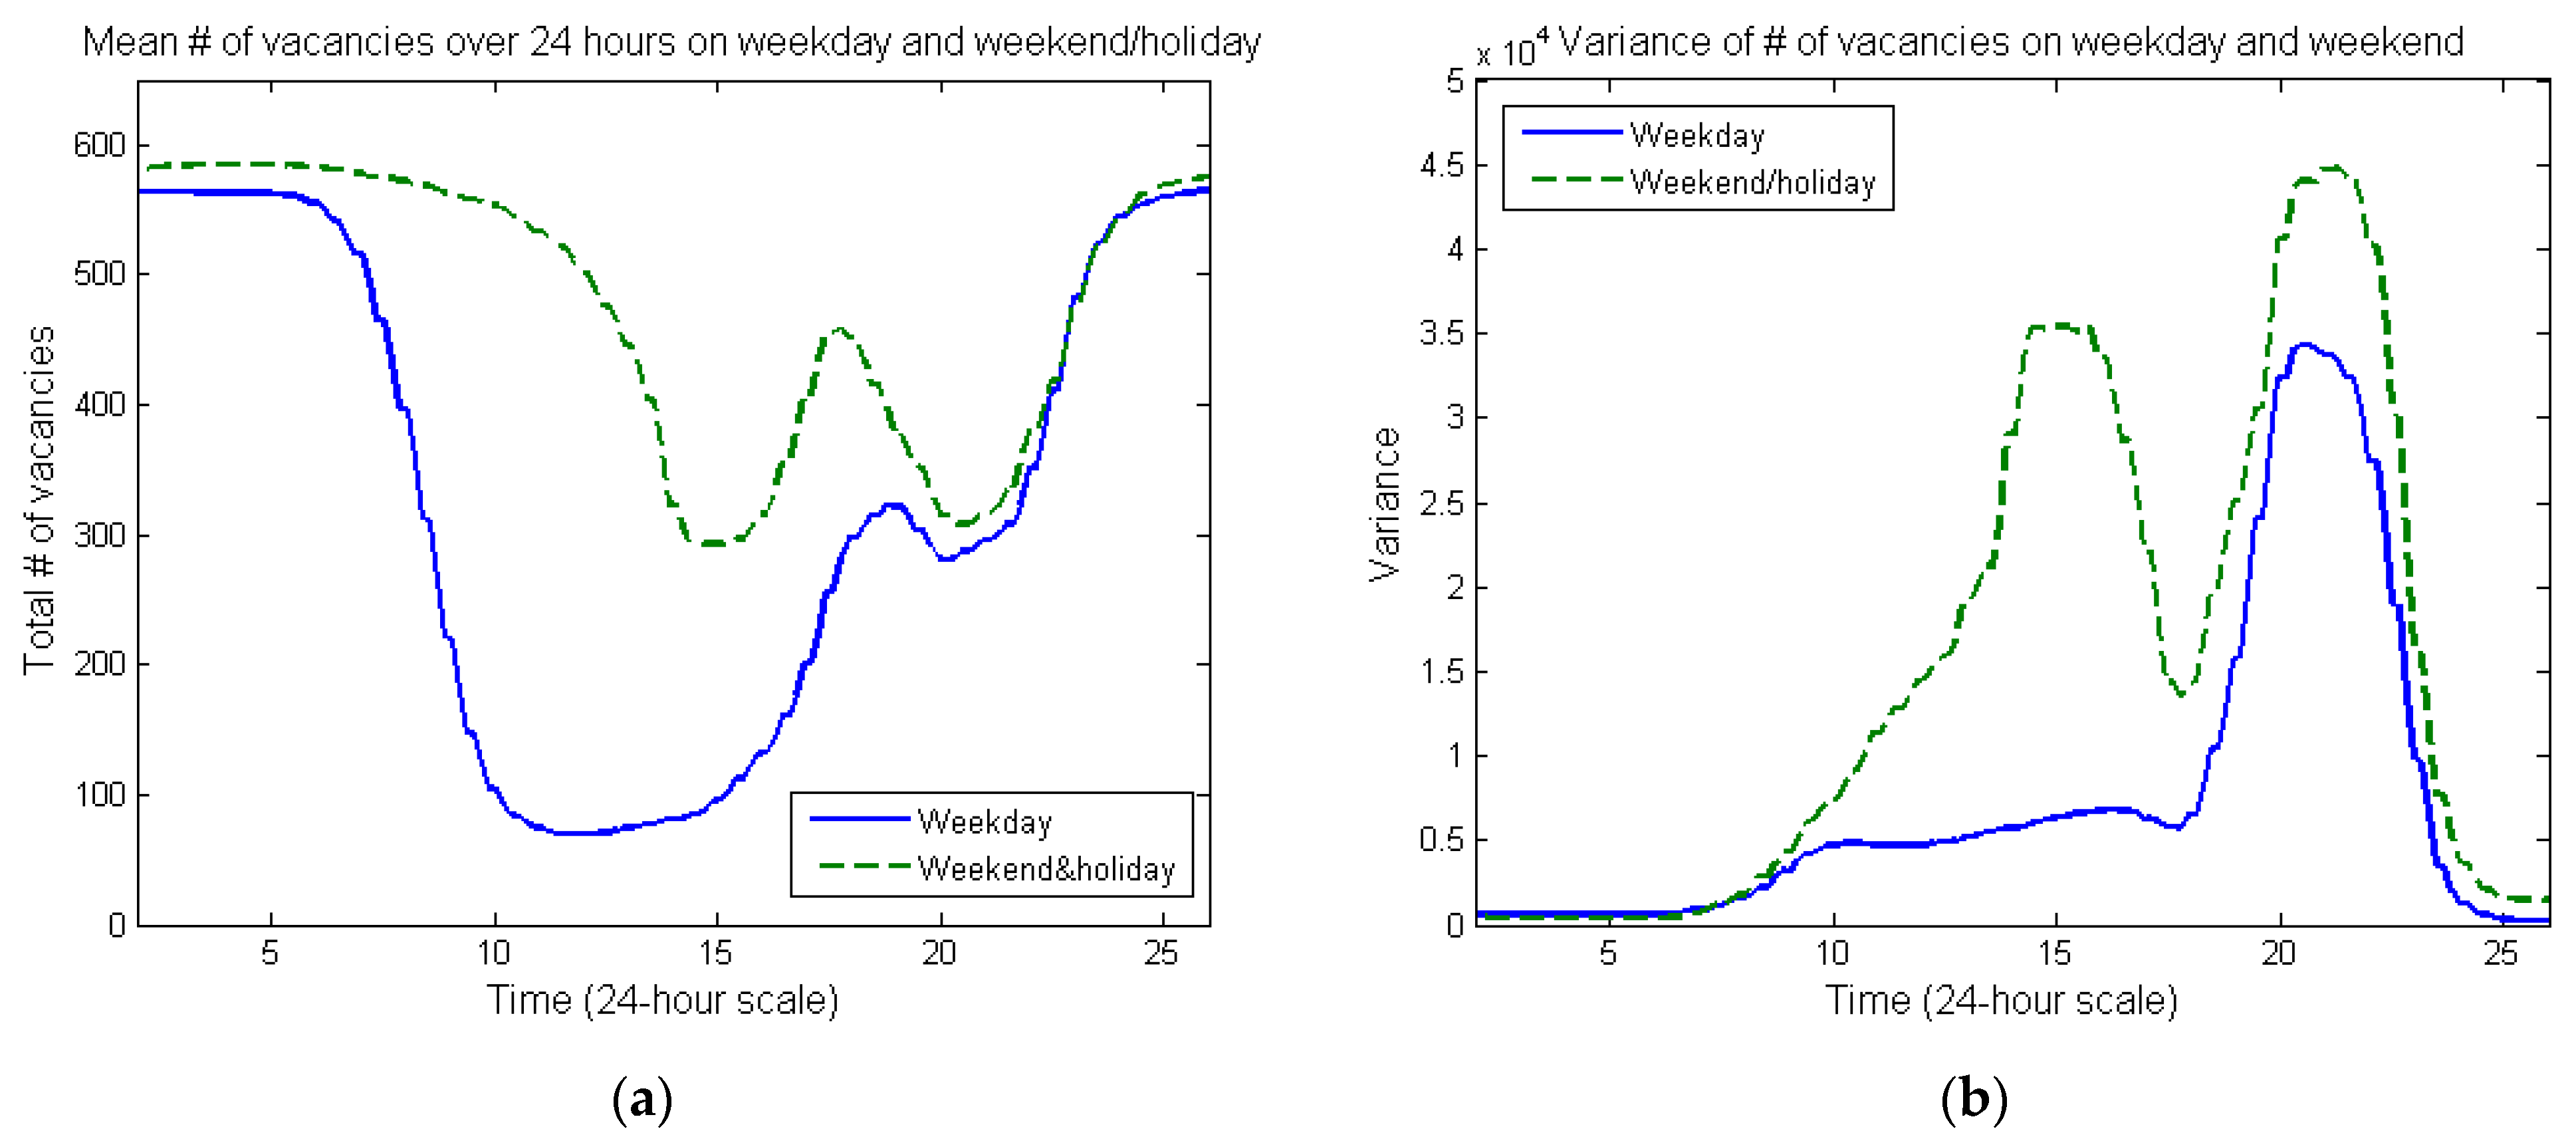
2.1. Data Description

The parking data set was provided from ALCO Parking Theater Square Garage in downtown Pittsburgh [13]. The same data set was used to develop a smart-parking application called ParkPGH [12,14]. In this study, we evaluated the time-dependent impact of various events on the Theater Square Garage. This parking facility has a capacity of 785 spots for vehicles with pricing set as $6, $12, and $240 for an hourly fee (of up to 2 h), an entire-day parking fee, and monthly lease, respectively, as of the period of the parking data set [15]. The facility is open to public 24 h a day and 7 days a week. It is located in the Cultural District of downtown Pittsburgh and is surrounded by a number of other parking garages and theaters. Figure 1 shows the location of the Theater Square Garage (pinned in the map). Figure 1 also shows the surrounding parking garages (indicated as P in the map) as well as various major event venues such as a concert hall, theaters, a baseball field, a football field, and an arena (starred in the map). Table 1 presents the detailed information of these major event venues.
The data set contains the information of the number of available parking spaces collected with a 10-min interval for 24 h (the total number of data per day was 144) from 9 November 2008 to 10 July 2010 excluding 24 September 2009 and 25 September 2009 due to the G-20 summit in Pittsburgh (the total number of days is 607). Figure 2a shows the average number of available parking spaces (i.e., the number of vacancies out of the total capacity of 785 parking spots) for weekdays and weekends/holidays. Figure 2b shows their corresponding variances (note: Figure 2 was originally presented in [14]). Note that the total number of vacancies did not reach 785 because a portion of vehicles on a monthly lease may park overnight.
According to Figure 2a, the average number of vacancies (available parking spaces) is very low (around 90 vacancies; about 11% of the total capacity 785) between 10 a.m. and 3 p.m. on weekdays. This is due to the large number of monthly lease holders using the parking facility on weekdays. However, the small number of available spaces before 3 p.m. on weekdays does not create an issue for the parking facility since the demand for parking is relatively stable. Specifically, Figure 2b indicates that the variability of (the number of) vacancies is low until around 6 p.m. on weekdays: The variance of vacancies is less than around 6,000 or, equivalently, the standard deviation of vacancies is less than around 80 (about 10% of the total capacity). Managers can operate the facility effectively until around 6 p.m. on weekdays because of the low variability of vacancies.
In comparison, the number of vacancies is relatively abundant (around 300 vacancies; about 40% of the total capacity) at around 3 p.m. on weekends/holidays and at around 9 p.m. on weekdays and weekends/holidays. However, during these times, the variability of vacancies is high as well: The variance is around 35,000–45,000 or, equivalently, the standard deviation is around 190–210 (about 24–27% of the total capacity). Due to the high variability of vacancies, managers experience difficulties operating their facility efficiently; the facility often becomes fully occupied and the roads around the facility get extremely congested due to the large number of overflowing vehicles cruising for parking spaces. This situation is undesirable not only for the facility, but also for the surrounding businesses.
The event data set is available online from Pittsburgh Cultural Trust [16]. We cleaned the data set by selecting major events operated in Benedum Center, Byham Theater, O’Reilly Theater, and Heinz Hall. We added the information of sports games such as Pirates baseball games (at PNC Park), Steelers football games (at Heinz Field), University of Pittsburgh football games (at Heinz Field), and Penguins ice hockey games (at Mellon/Civic Arena) (see Figure 1 and Table 1 for their locations and detailed information). The event data set excluded the events held at Convention Center since it has its own on-site parking garage and there are many parking spots nearby.
We split all events into three categories: (1) morning event (–12:00 p.m.), (2) day event (12:10 p.m.–4 p.m.), and (3) night event (4:10 p.m.–). This is because the major events we used in this study had at most one event in each time category (i.e., morning, day, or night) and their event starting times were fixed. Some of the events did not have morning events (e.g., Pirates, Steelers, and Penguins did not have games before noon.) The weather data set included the information about rain precipitation and amount of snowfall, which are measured in inch. The historical weather information and its data set are freely available online [17].

2.2. Event-Based Regression Model

The parking data showed that the number of vacancies was highly variable at night on weekdays and in the afternoon on weekends/holidays. One of the reasons for this high variation of the number of vacancies was various events held in downtown Pittsburgh. Thus, we analyzed the parking data set using an event-based regression model following a standard multiple ordinary least squares (OLS) regression analysis (see [18]). Our goal was to explain the number of vacancies by events.
Let Y ( t ) represent the number of vacancies at time t . (Note that we had 144 time data per day and 607 day data in the data set; thus, Y ( t ) is a column vector in a 607-dimensional space for a given t .) Consider an OLS regression model:
Y ( t ) = X β ( t ) + e ( t ) ,
where X is a set of dummy variables (theater performances, sports events, and the Pittsburgh weather data), β ( t ) is the coefficients of predictors (an average impact on the number of vacancies by the corresponding event) at time t , and e ( t ) is the error term.
Dummy variables in X include four major theater events (Benedum event, Byham event, O’Reilly event, Heinz Hall event), four major sports events (Pirates’ game, Steelers’ game, University of Pittsburgh’s game, Penguins’ game), interaction terms among major events, weather conditions (rainfall and snowfall measured in inches), and day of the week/holiday. For this study, we collected data from [16,17] corresponding to the period from 9 November 2008 to 10 July 2010 and constructed the matrix X representing dummy variables. We regarded events in different time (morning, day, and night) categories as separate events, and represented them using different dummy variables. (For example, we represented the Heinz Hall daytime event and the Heinz Hall nighttime event using different dummies.) We confirmed that the starting times of each event in the same time category were identical or very close to each other (if not identical). We also confirmed that dummies representing performance and sports events were categorical: Each event did not occur more than once in each time category. (For example, no two Heinz Hall events were held during the daytime on the same day.) Thus, we used a single dummy to represent each event (for example, Heinz Hall event) in the same time category.
In this analysis, we first obtained the historical average impact β ( t ) of each event in X on Y ( t ) following a standard OLS regression. To conduct a regression analysis on the parking data set, we defined S S E ( β ( t ) ) , the sum of the squares of the differences between the observed and estimated values of Y ( t ) as a function of β ( t ) . The indicator S S E ( β ( t ) ) represents the level of estimation errors. Let ( · ) represent a transpose of the vector or matrix. Then
S S E ( β ( t ) ) = ( Y ( t ) X β ( t ) ) ( Y ( t ) X β ( t ) ) .
The indicator S S E ( β ( t ) ) is minimized when β ( t ) = β ^ ( t ) = ( X X ) 1 X Y ( t ) . Here, β ^ ( t ) is the OLS estimator of β ( t ) . Using this β ^ ( t ) , we obtain an estimate of Y ( t ) and the minimum S S E ( t ) as Y ^ ( t ) = X   β ^ ( t ) and S S E ( t ) = ( Y ( t ) Y ^ ( t ) ) ( Y ( t ) Y ^ ( t ) ) , respectively.
The goodness of fit of our event-based regression model is evaluated by the coefficient of determination R 2 ( t ) at time t , which is defined as
R 2 ( t ) = S Y Y ( t ) S S E ( t ) S Y Y ( t ) ,
where S Y Y ( t ) is the total variation among Y ( t ) at time t .

3. Results

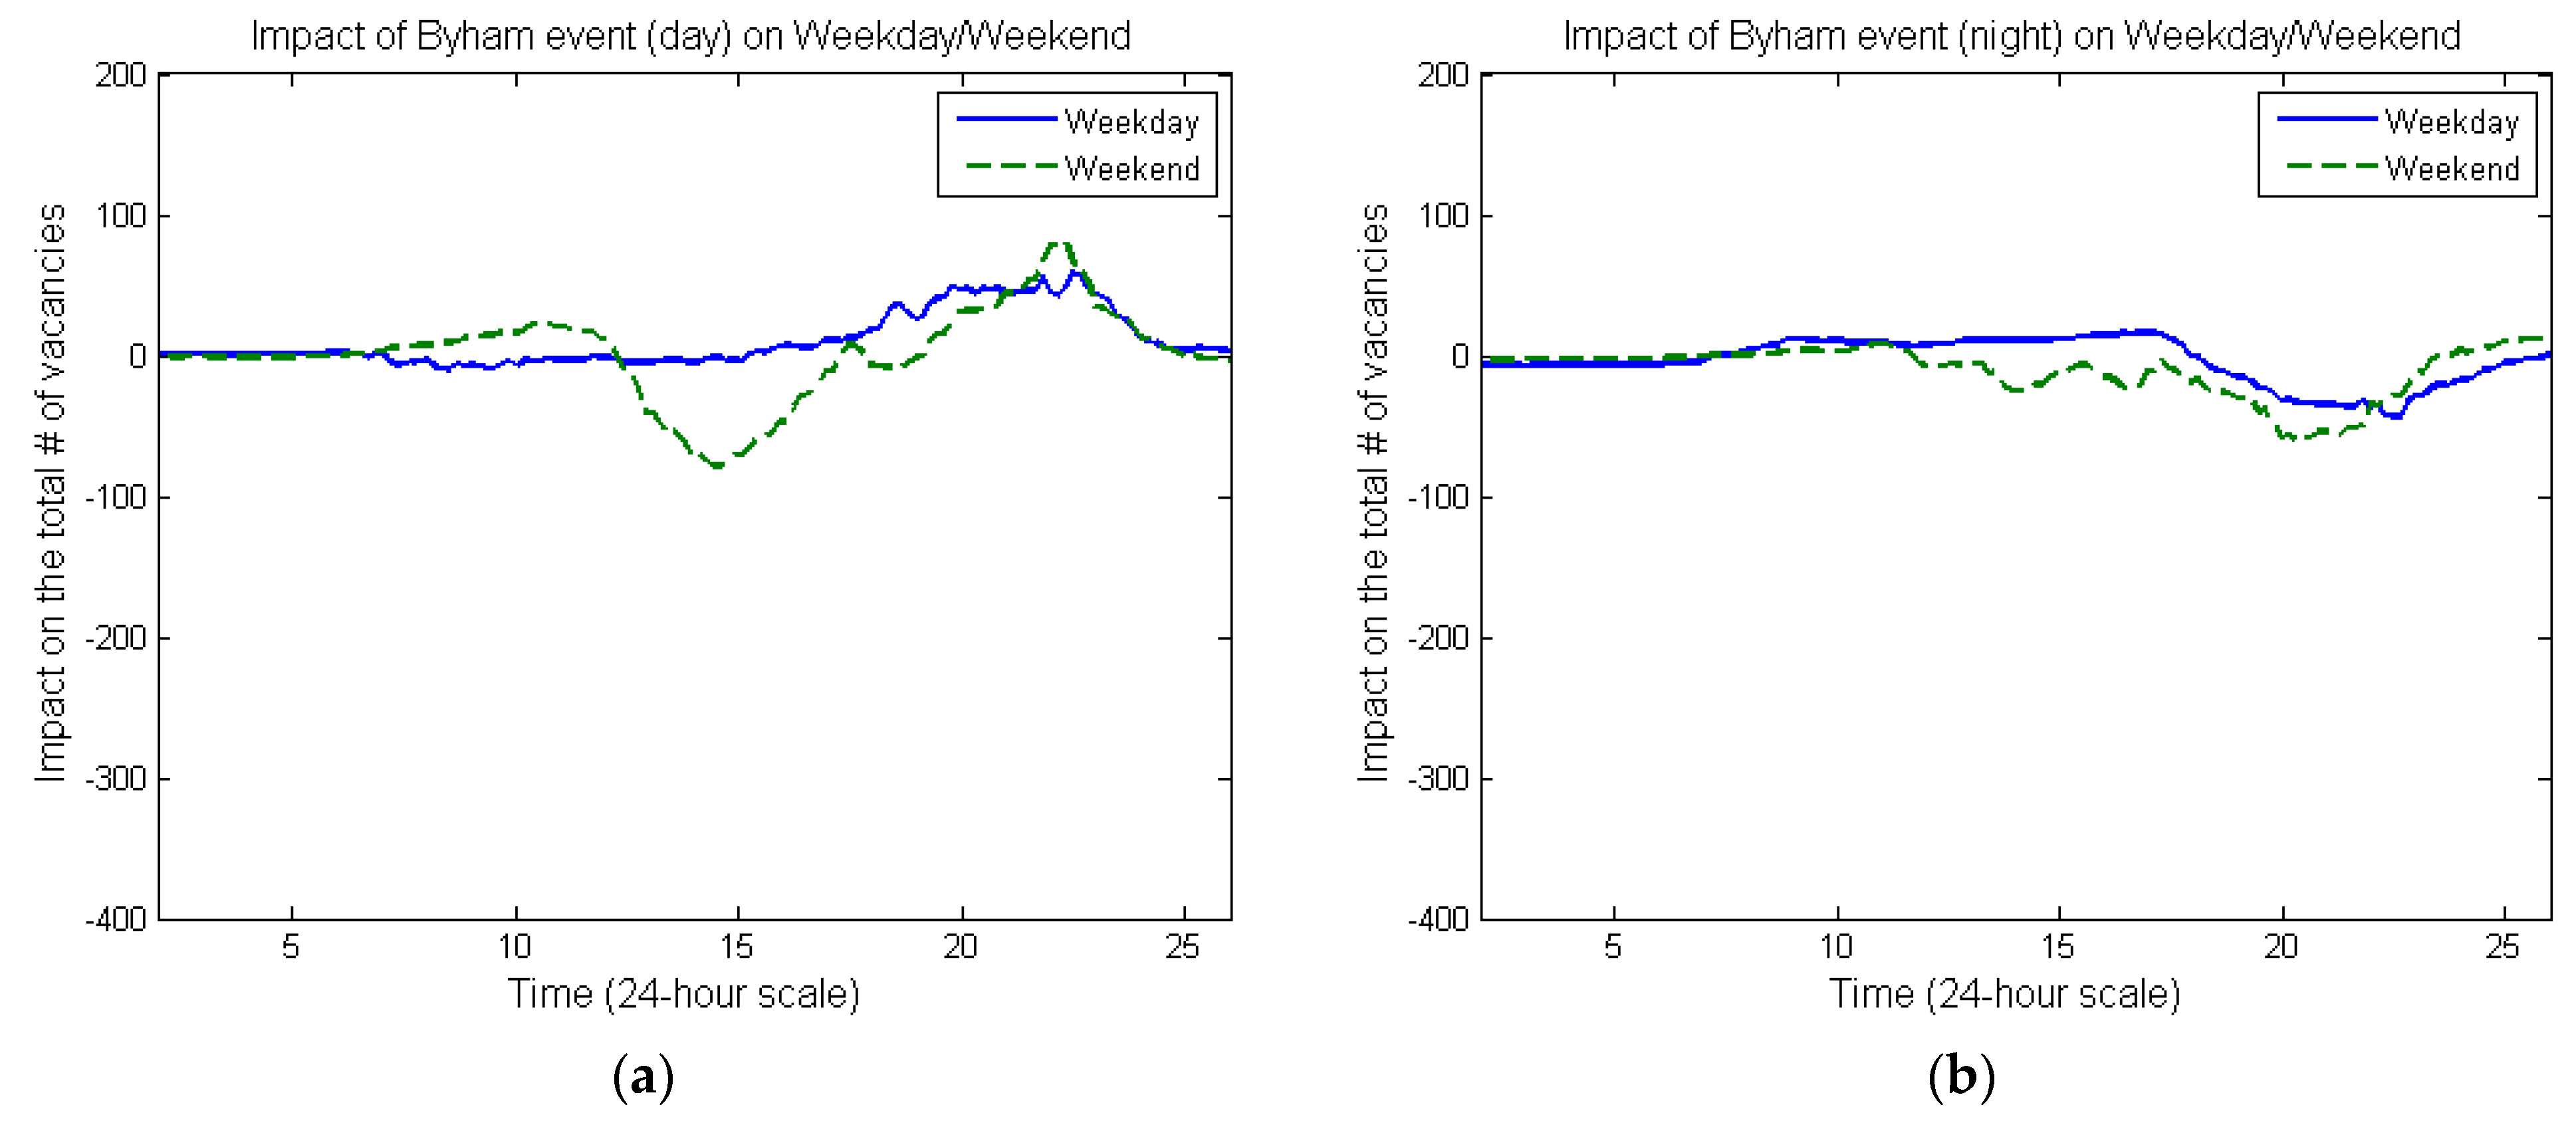
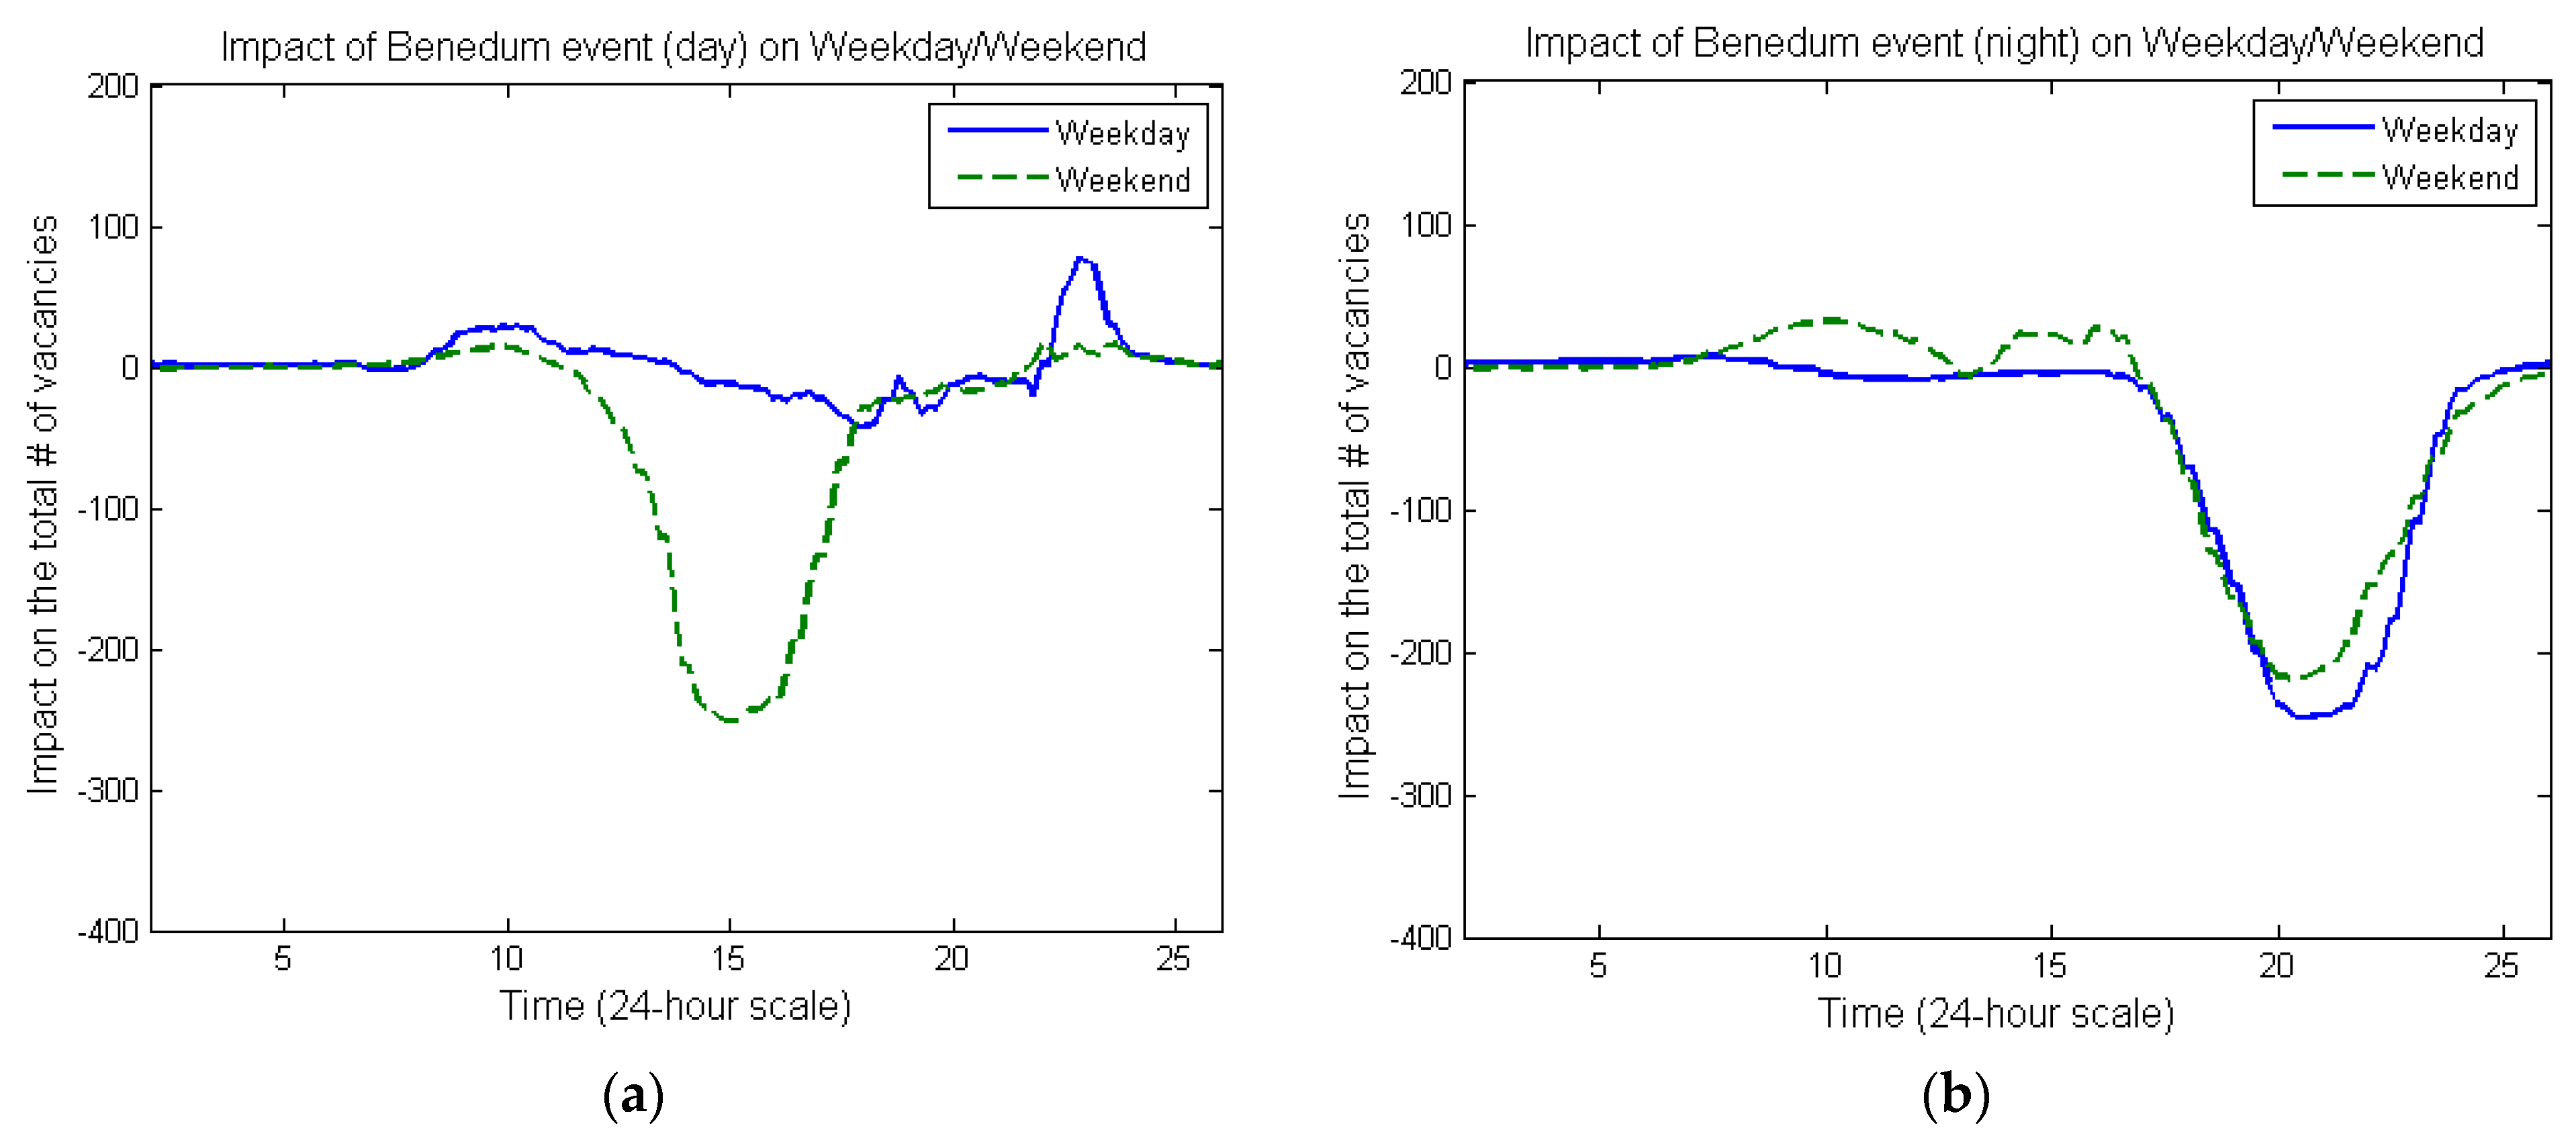
3.1. Oridinary Least Squares’ Coefficients β ^ ( t )

Each element of coefficients β ^ ( t ) corresponding to each predictor (dummy variable) in X can be interpreted as an impact of each event on the total number of available parking spaces. For example, if an element of β ^ is −100 at 8 p.m., it means that the corresponding event reduced the total number of vacancies (available parking spaces) on average by 100. Each 100 corresponds to approximately 13% of the total capacity. We obtained the OLS coefficients β ^ ( t ) for t over 24 h on weekdays and on weekends/holidays, which are presented in Figure 3, Figure 4 and Figure 5.
Figure 3a, Figure 4a, and Figure 5a show that the impacts of daytime events were more or less negligible on weekdays, while the impacts of daytime events were larger in magnitude at around 3 p.m. on weekends/holidays. Figure 3b, Figure 4b, and Figure 5b show the impacts of nighttime events, which were larger in magnitude at around 9 p.m. on both weekdays and weekends/holidays. It is interesting to observe that the magnitude of the peak impact was more or less consistent: For example, Figure 5a shows that the peak impact of Benedum daytime event on weekends was around −250 at 3 p.m., which is similar to the peak impact of Benedum night events on weekends/weekdays at around 9 p.m. This peak impact of Benedum event—a reduction of 250 available spaces (about 32% of the total capacity 785)—is relatively large since the average number of remaining spaces was around 300 (about 38% of the total capacity) during these peak times (see Figure 2a).
We observed that the impacts of events were not only determined by the capacities of event venues, but also strongly affected by their distances to the Theater Square Garage. For example, the capacity of Heinz Field is approximately 24 times bigger than the capacity of Benedum Center (see Table 1). However, the impact of Heinz Field is less than twice of the impact of Benedum Center because Benedum Center is much closer to the Theater Square Garage than is Heinz Field. Another reason is the limited capacity of the facility. It is thus noted that the impacts of events we observed in this study were facility-specific and were likely to be different for other parking facilities in the downtown area due to the strong dependence on distances as well as the capacity of the facility. However, the fact that the result was facility-specific does not mean that the method is specific to the facility; we can apply the same method to any businesses that attract customers visiting any downtown area for theater performances and sports events. For example, if a restaurant is located near the Theater Square Garage, it can utilize the same event dummies X we used in this study. By replacing our parking data Y ( t ) (the number of vacancies on each day and time) with their demand data (the number of customers in their restaurant on each day and time), they can evaluate their restaurant-specific, time-dependent impact of each event on their business using the same OLS regression model and conduct the same analysis specified in Equations (1)–(3).
OLS coefficients β ^ ( t ) also tell us how people change their behavior when it rains or snows. Figure 6 shows the impacts of rain and snow on the number of available parking spaces. We can clearly see that rain suppressed parking demand (because the number of vacancies increased) on weekends, while rain had a very small impact on parking demand on weekdays. We also observed that snow did not affect parking demand on both weekdays and weekends.

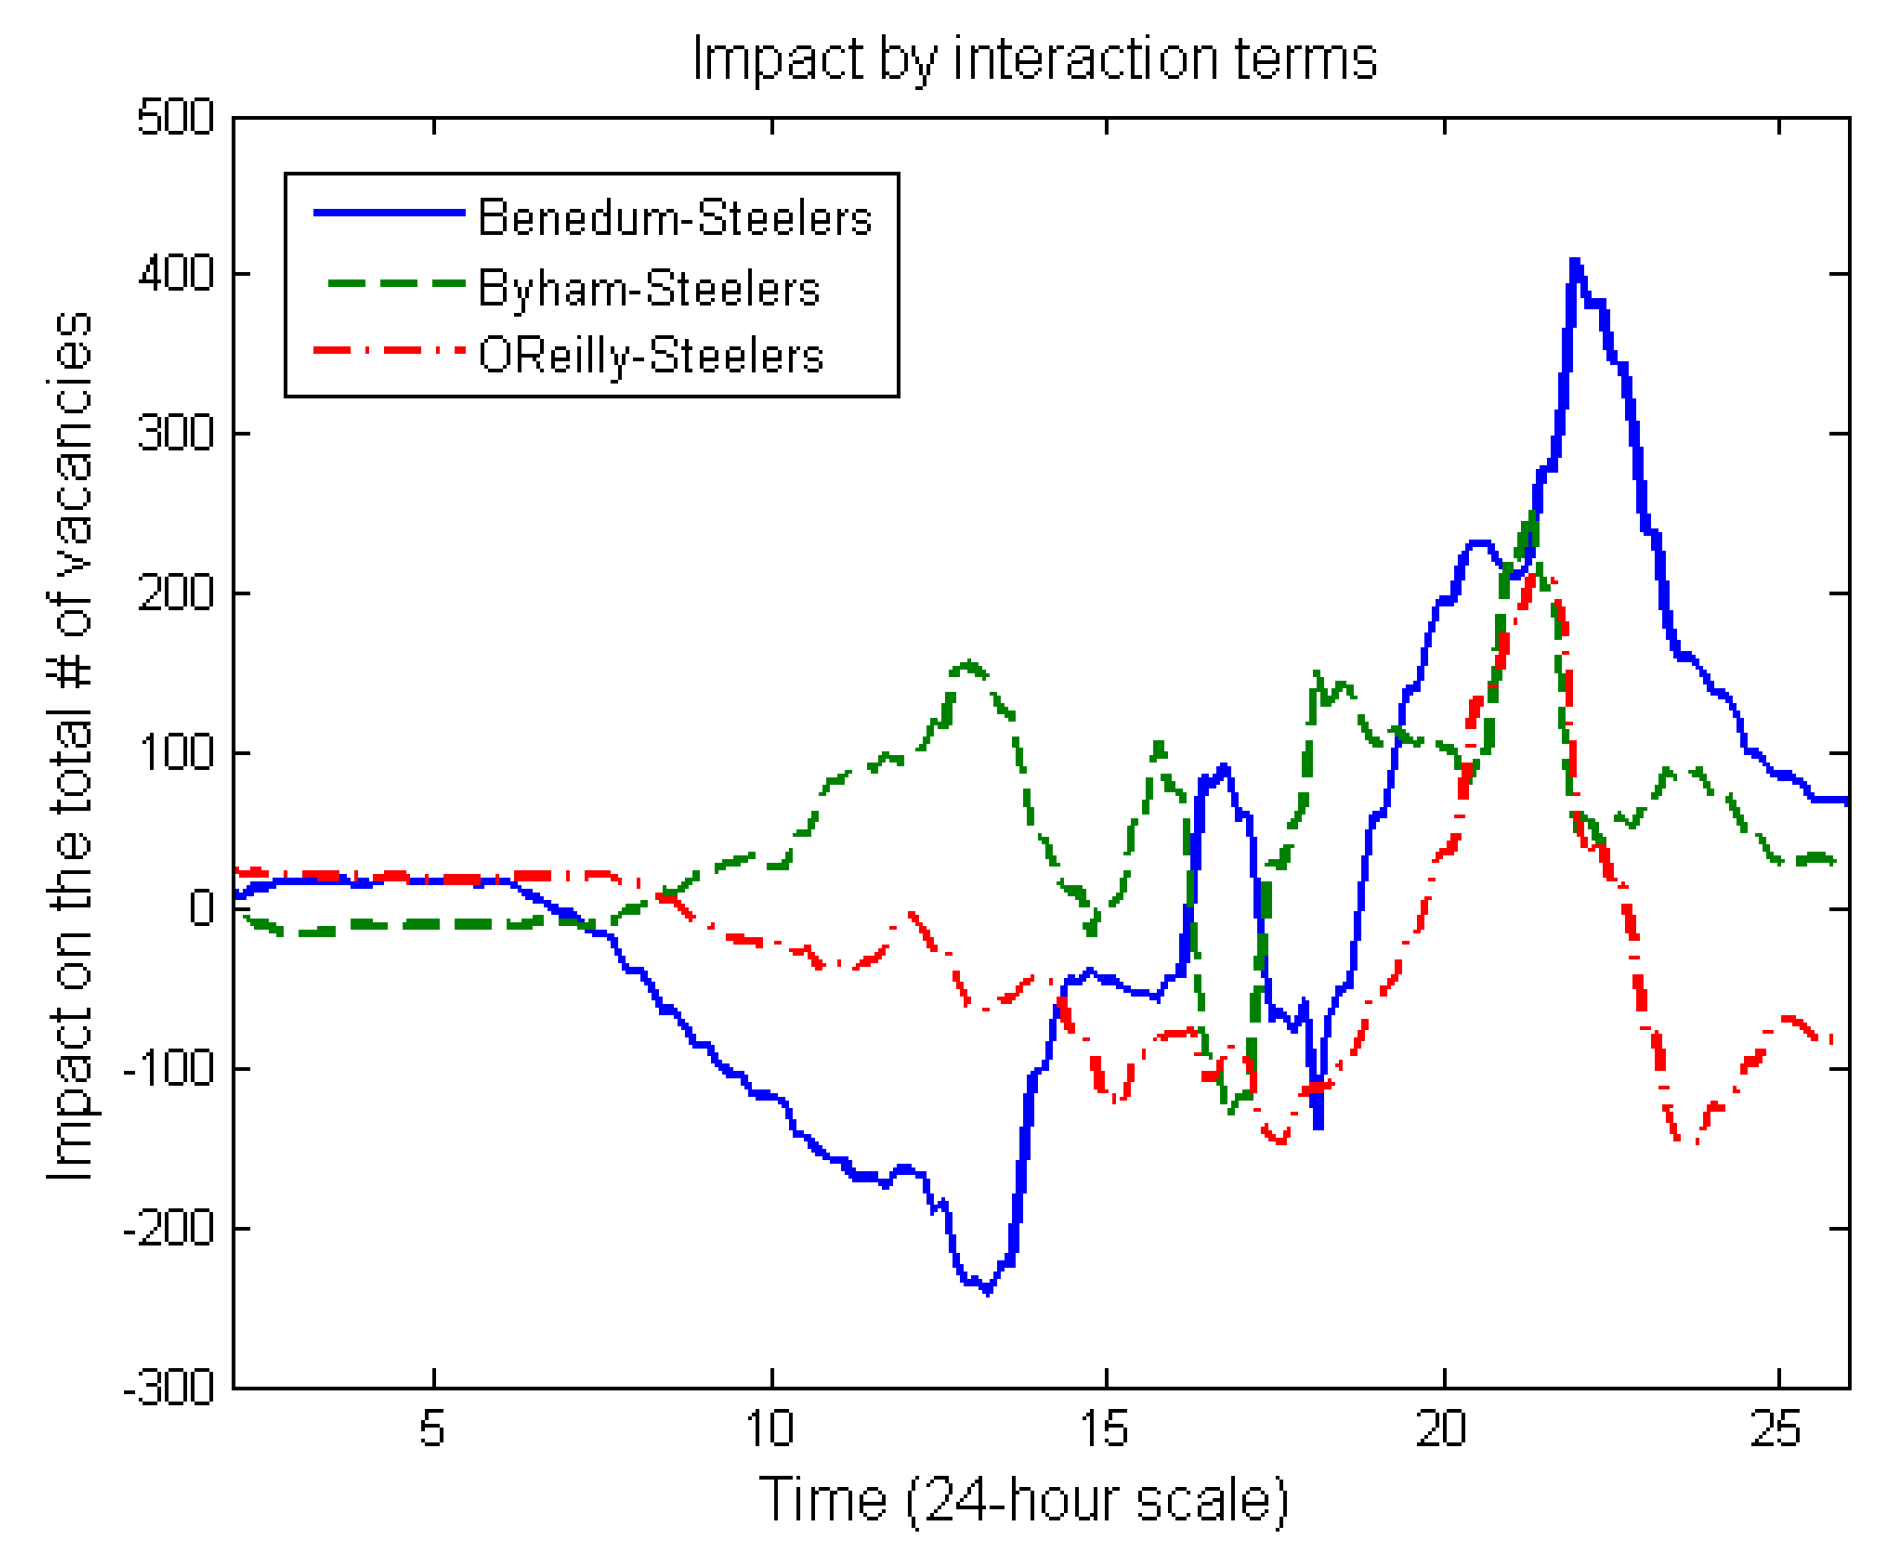
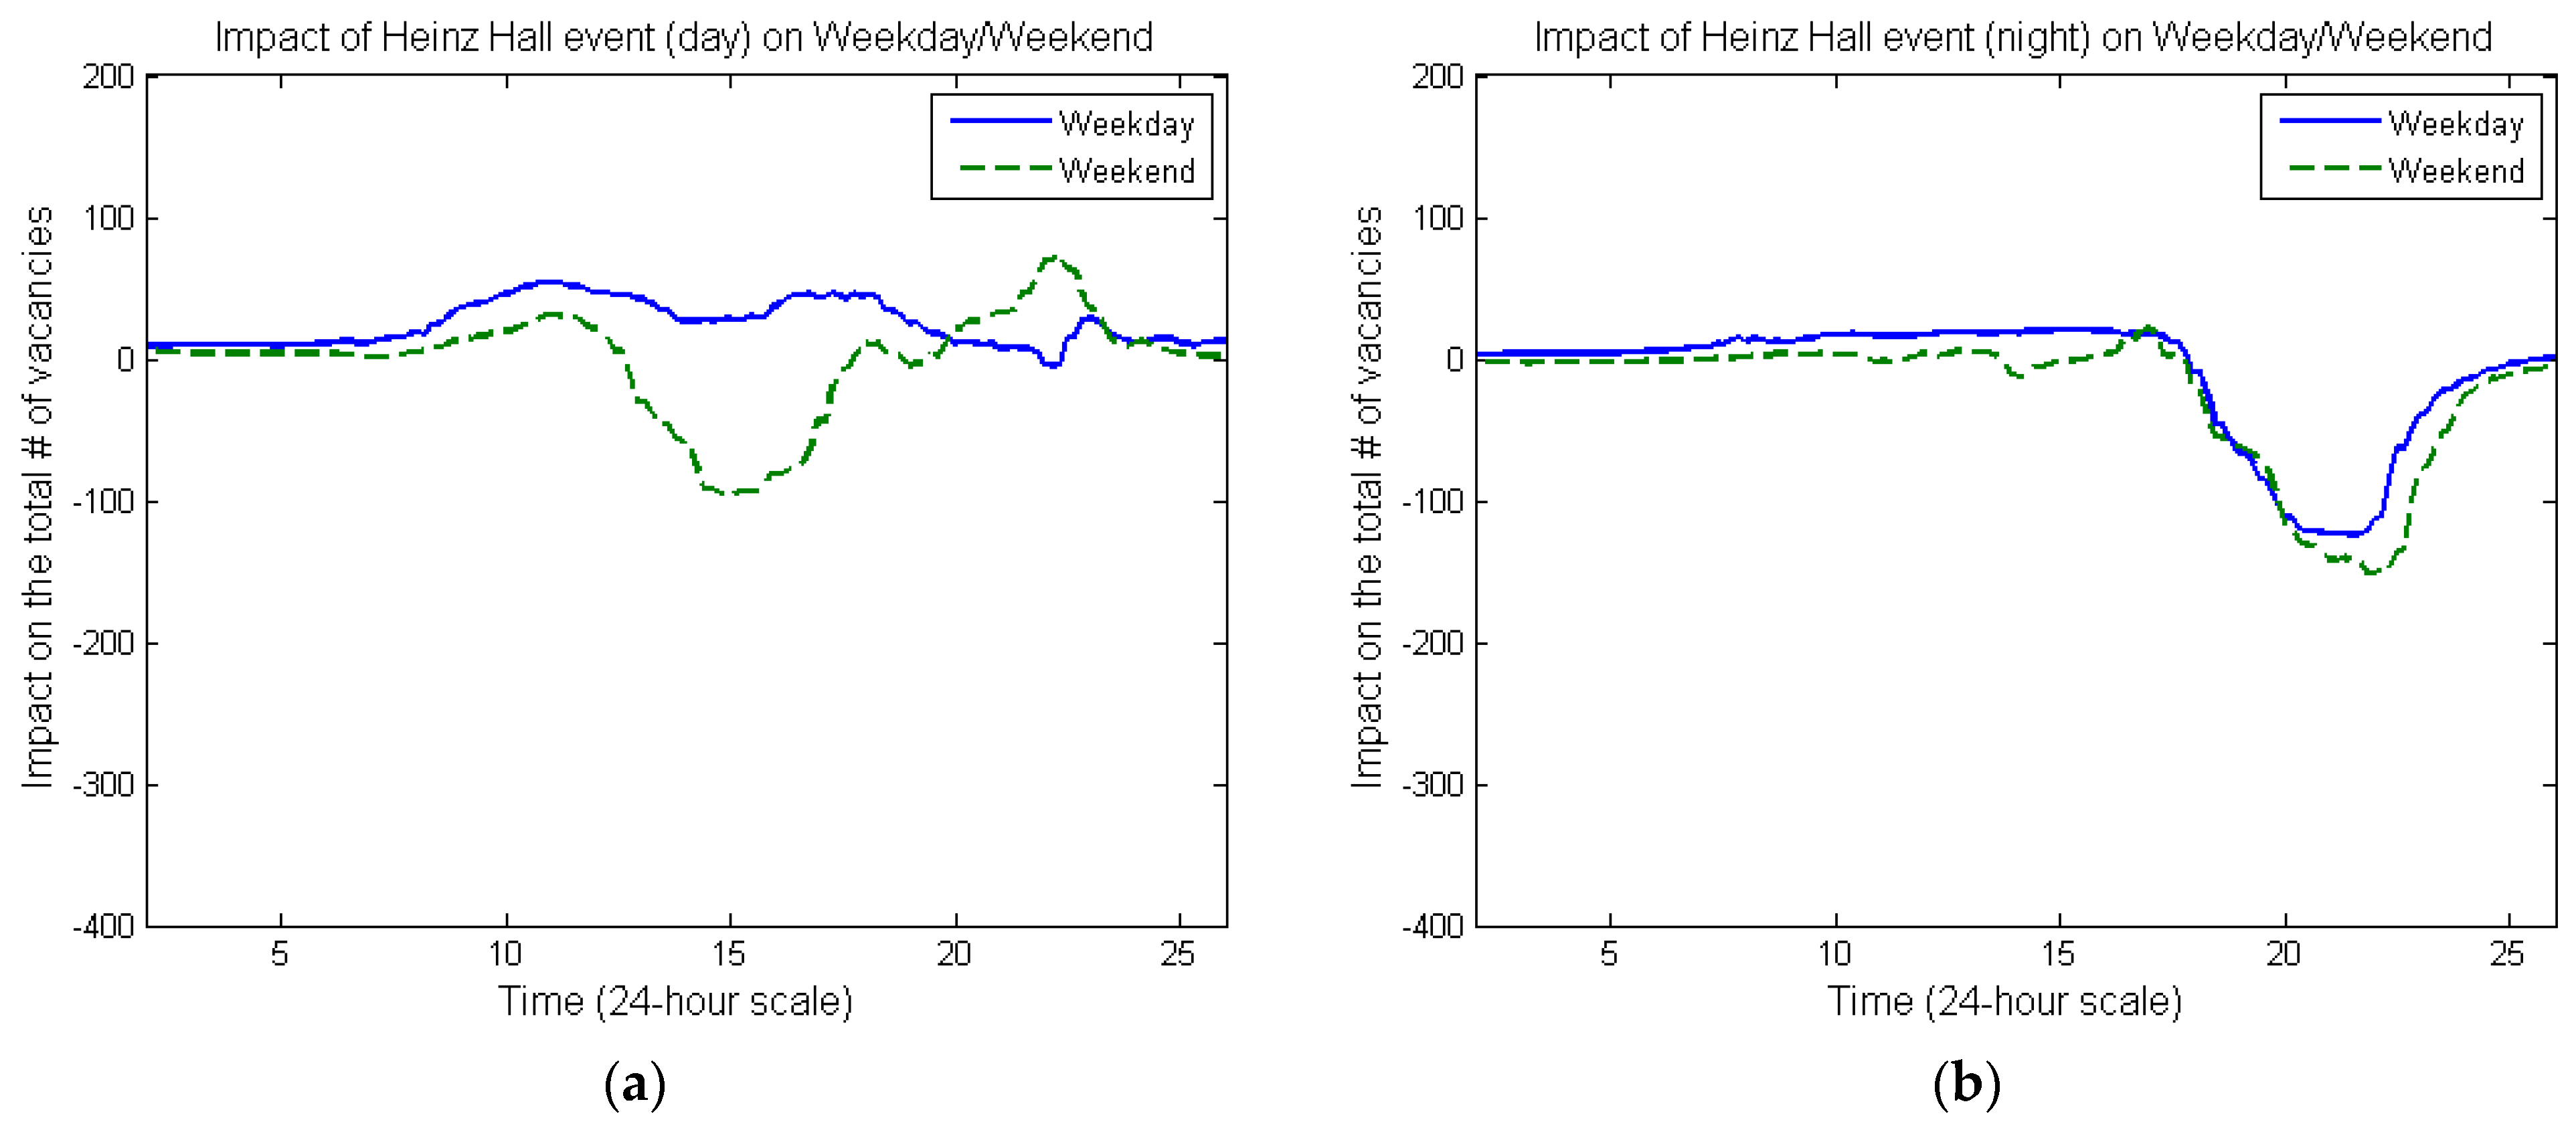
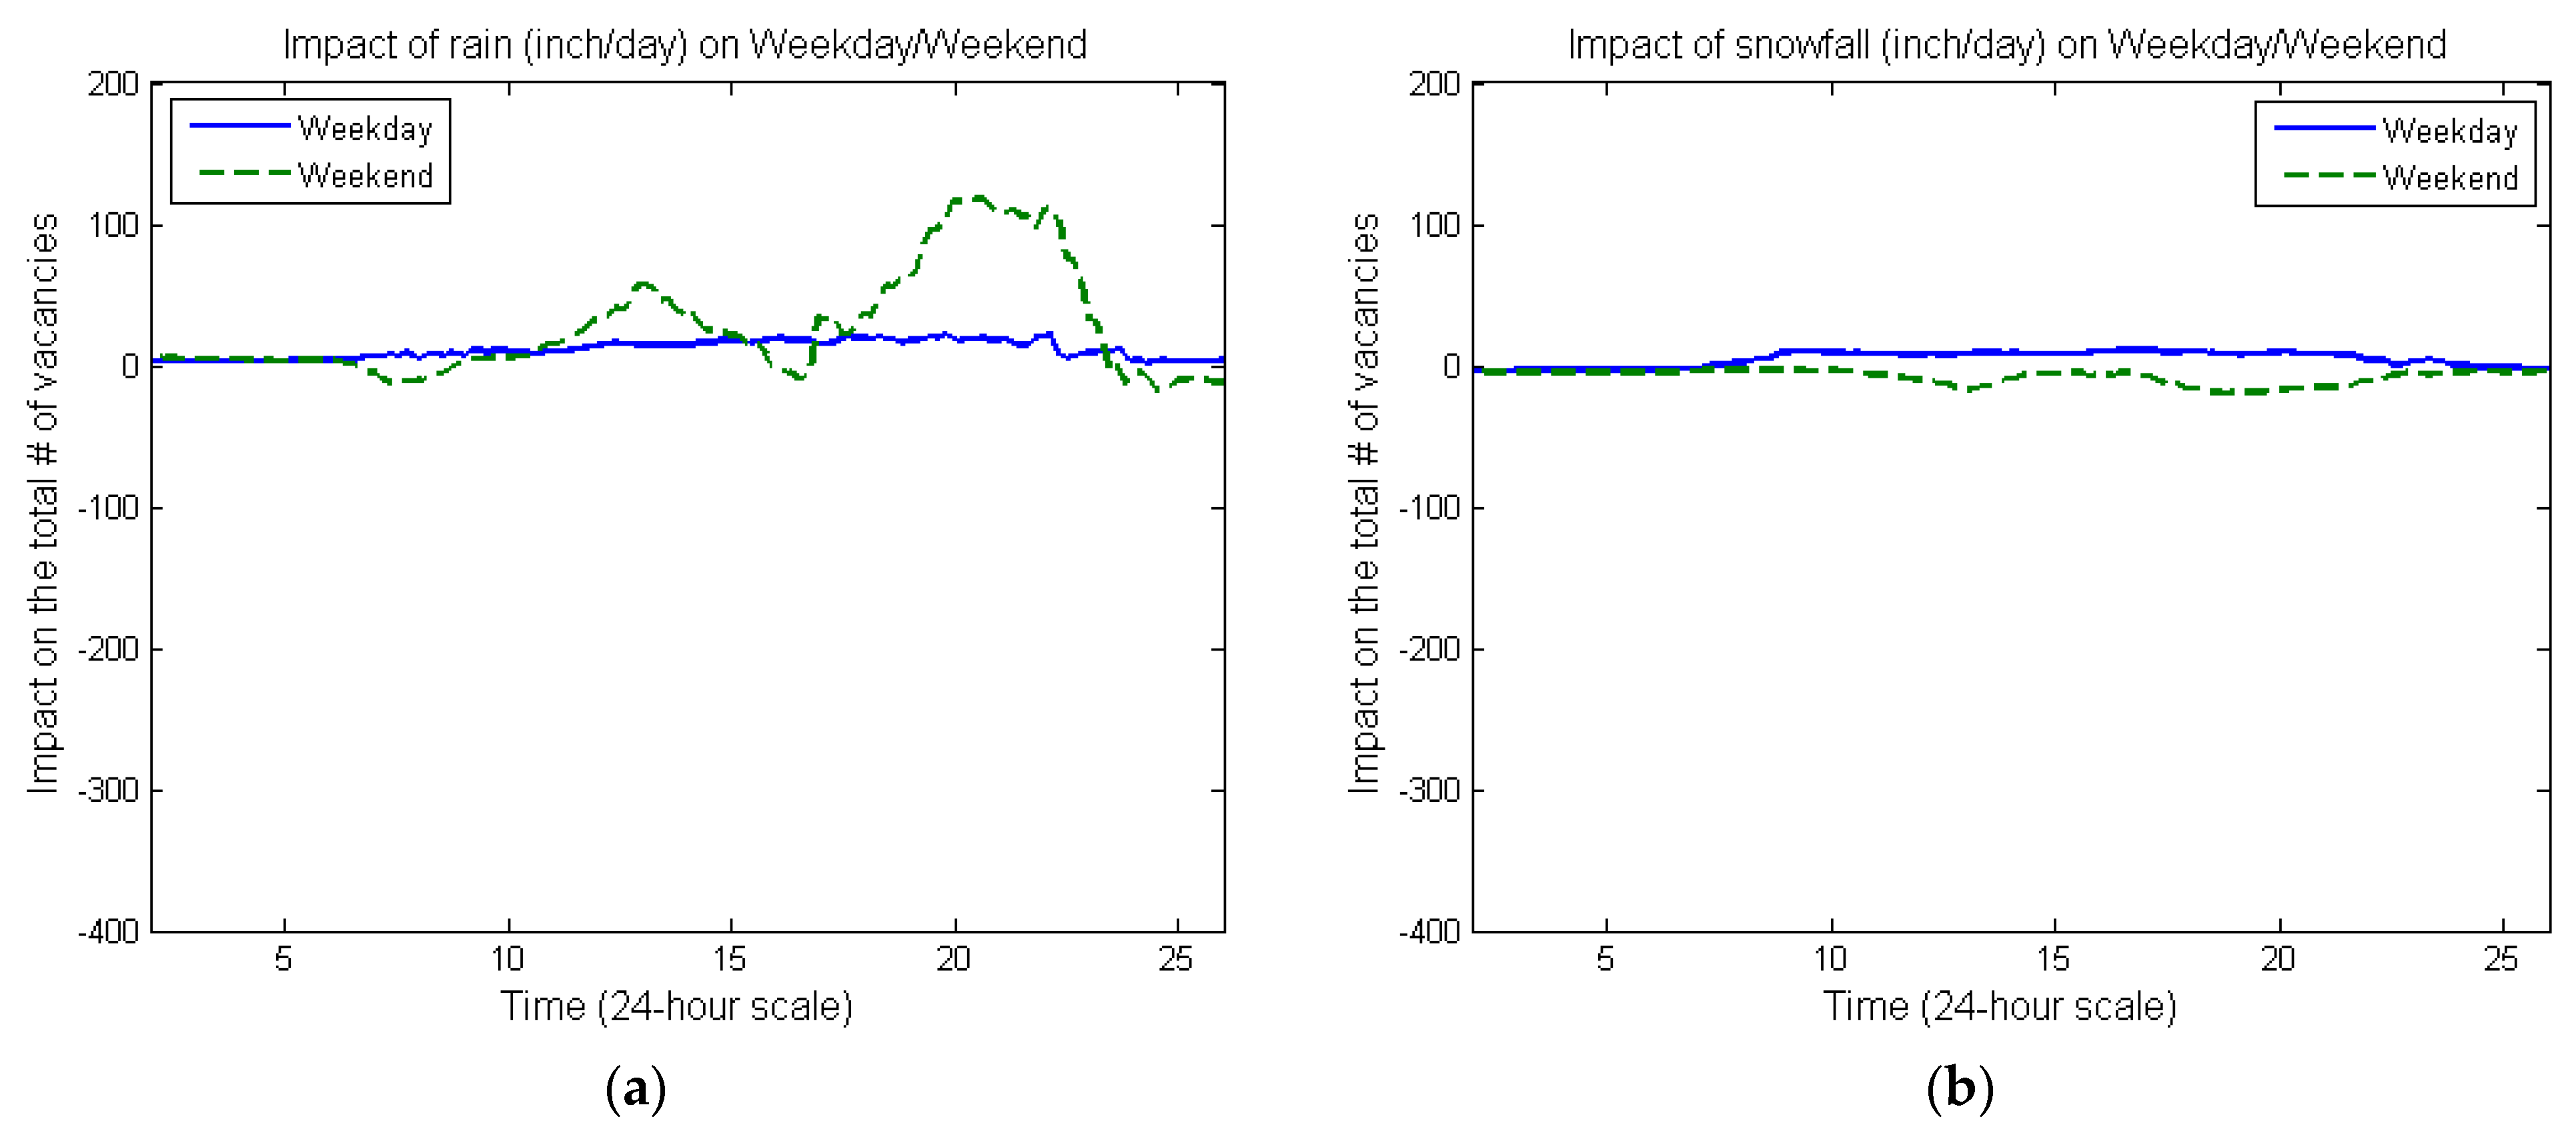
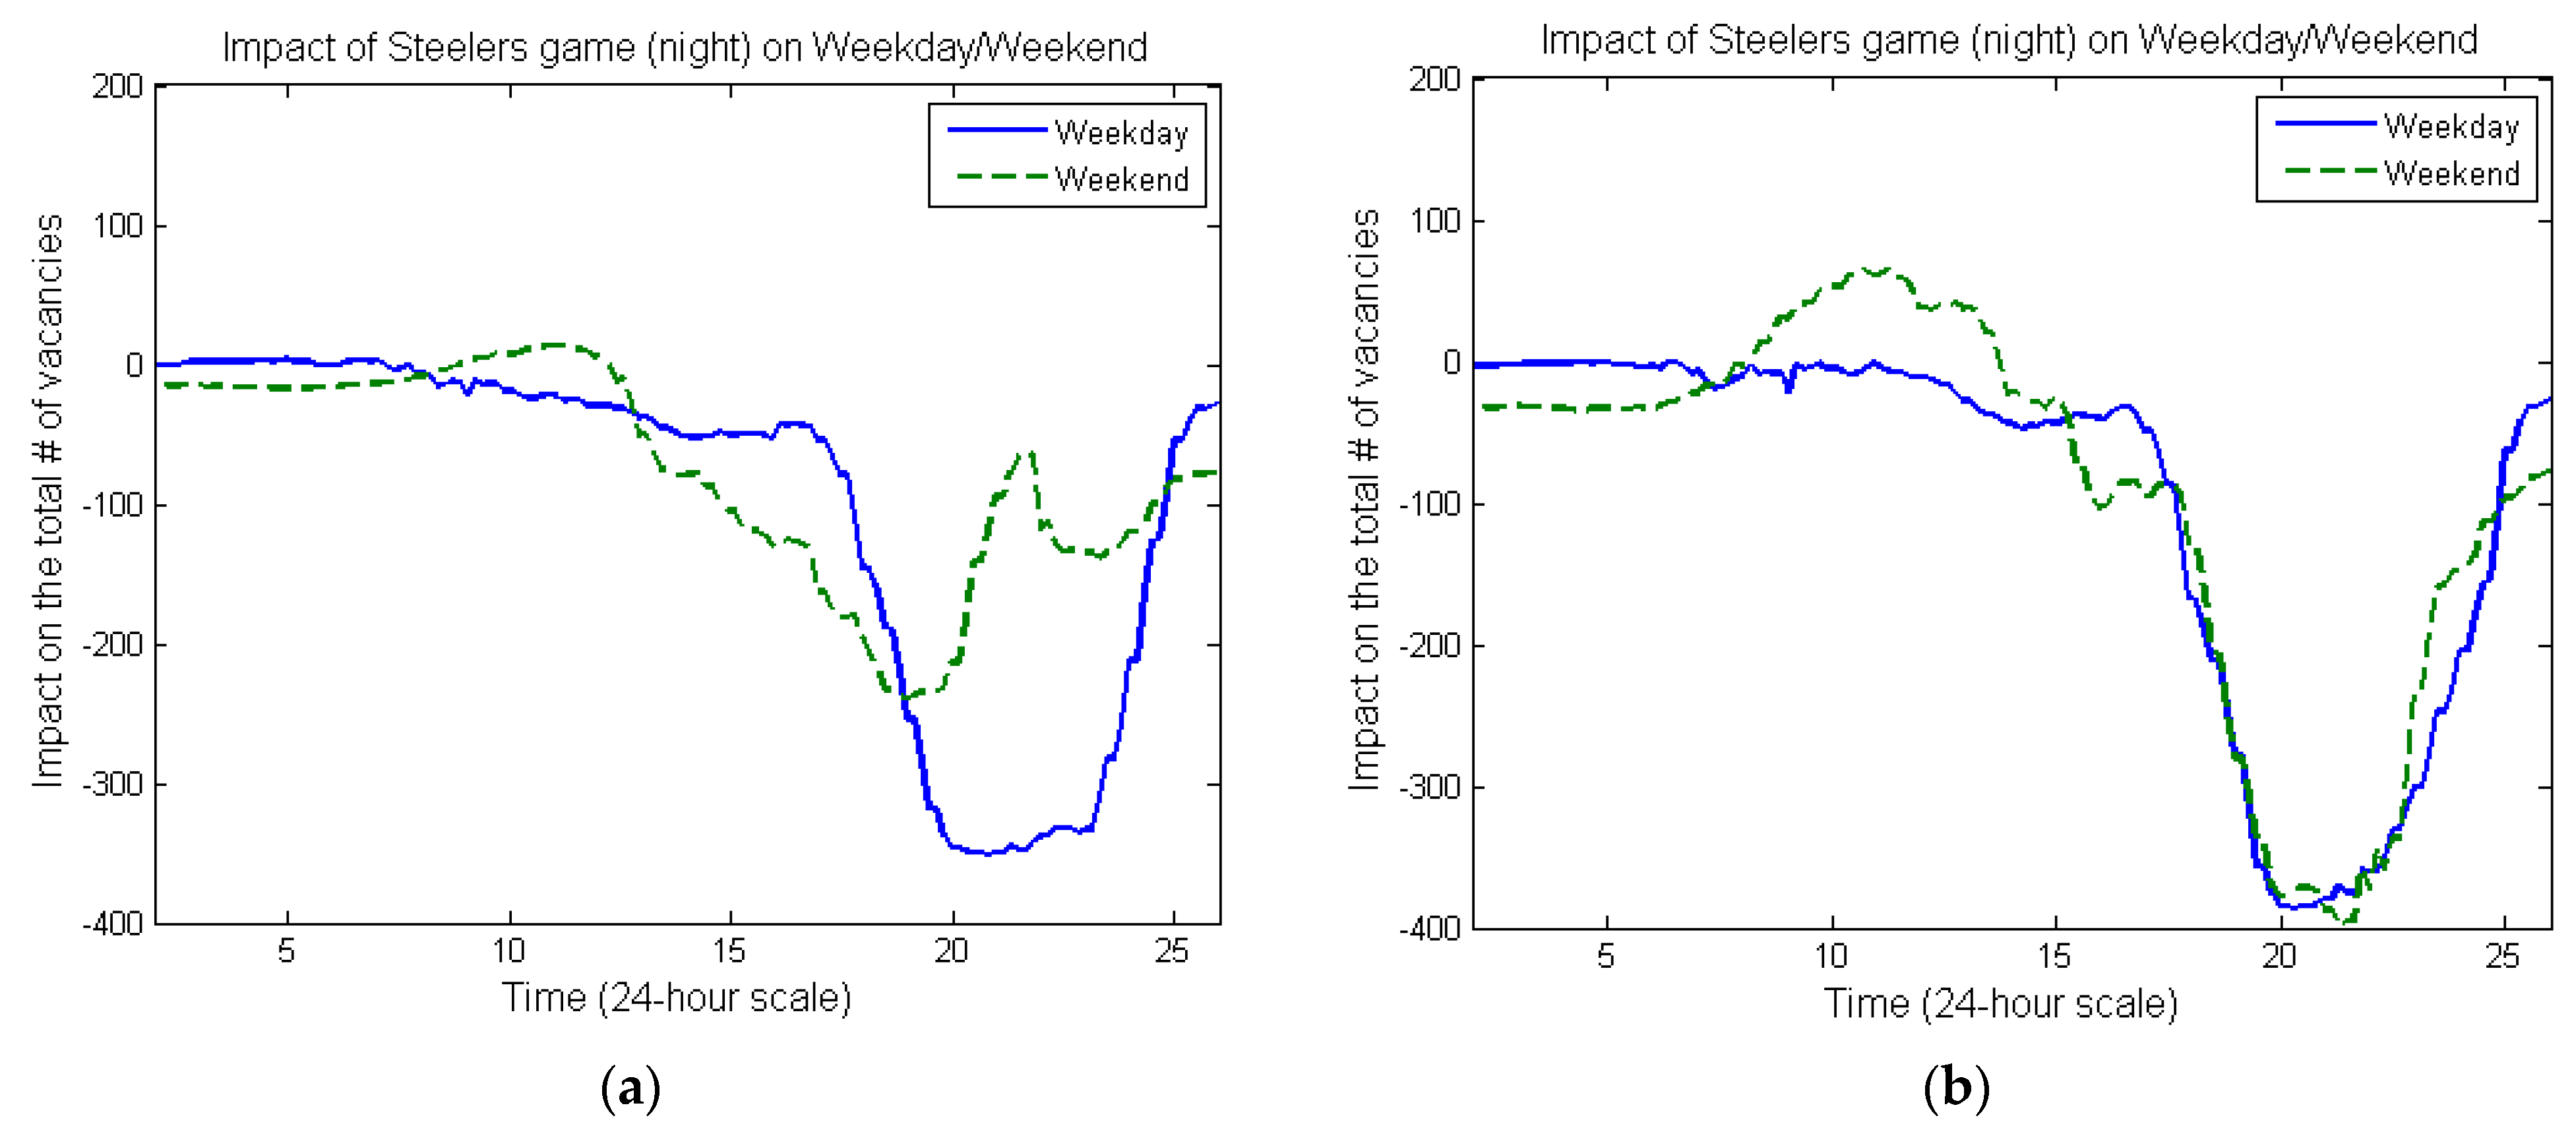
3.2. Interaction Terms

Two or more major events sometimes occur at the same time. Without considering interaction terms that account for joint occurrences, an estimated impact of each major event (coefficients of predictors) could be underestimated. This is because the parking facility has a finite capacity and their operators turn down drivers when the facility is full. Thus, we included in our event-based regression model dummy variables representing interaction terms between major events in the same time slot. Note that these interaction terms had negligible impacts for minor events. However, major events such as Steelers’ football games made a significant impact on the parking availability. Thus, the inclusion of the interaction terms among similar major events was indispensable.
Figure 7 shows the impacts of interaction terms that involve Steelers’ night games. These impacts changed their magnitude throughout the entire day. However, at around 9 p.m., all three interaction terms became consistently high: All of them positively affected the parking capacity by around 200. This number (around 200) corresponded to the number of drivers who were not able to use the facility when a major event was held at the same time as the Steelers’ game. The interaction terms revealed the missed opportunity (lost sales) to earn parking fees from customers due to the limitation of the parking capacity.
We next observed the effects of interaction terms on the impacts of Steelers event. Figure 8 compares the impacts of Steelers’ game events without/with interaction terms.
Figure 8a shows the impact of Steelers’ football games on the availability of parking spaces with no interaction terms, while Figure 8b shows the one with interaction terms among major events. Without interaction terms (Figure 8a), the impact of Steelers’ nighttime games on weekends was smaller (in magnitude) than the impact on weekdays. The impact on weekends was underestimated heavily because Figure 8a was obtained without dummy variables representing joint events on weekends. With interaction terms (Figure 8b), the impacts of Steelers’ games on weekdays and weekends became similar to each other.

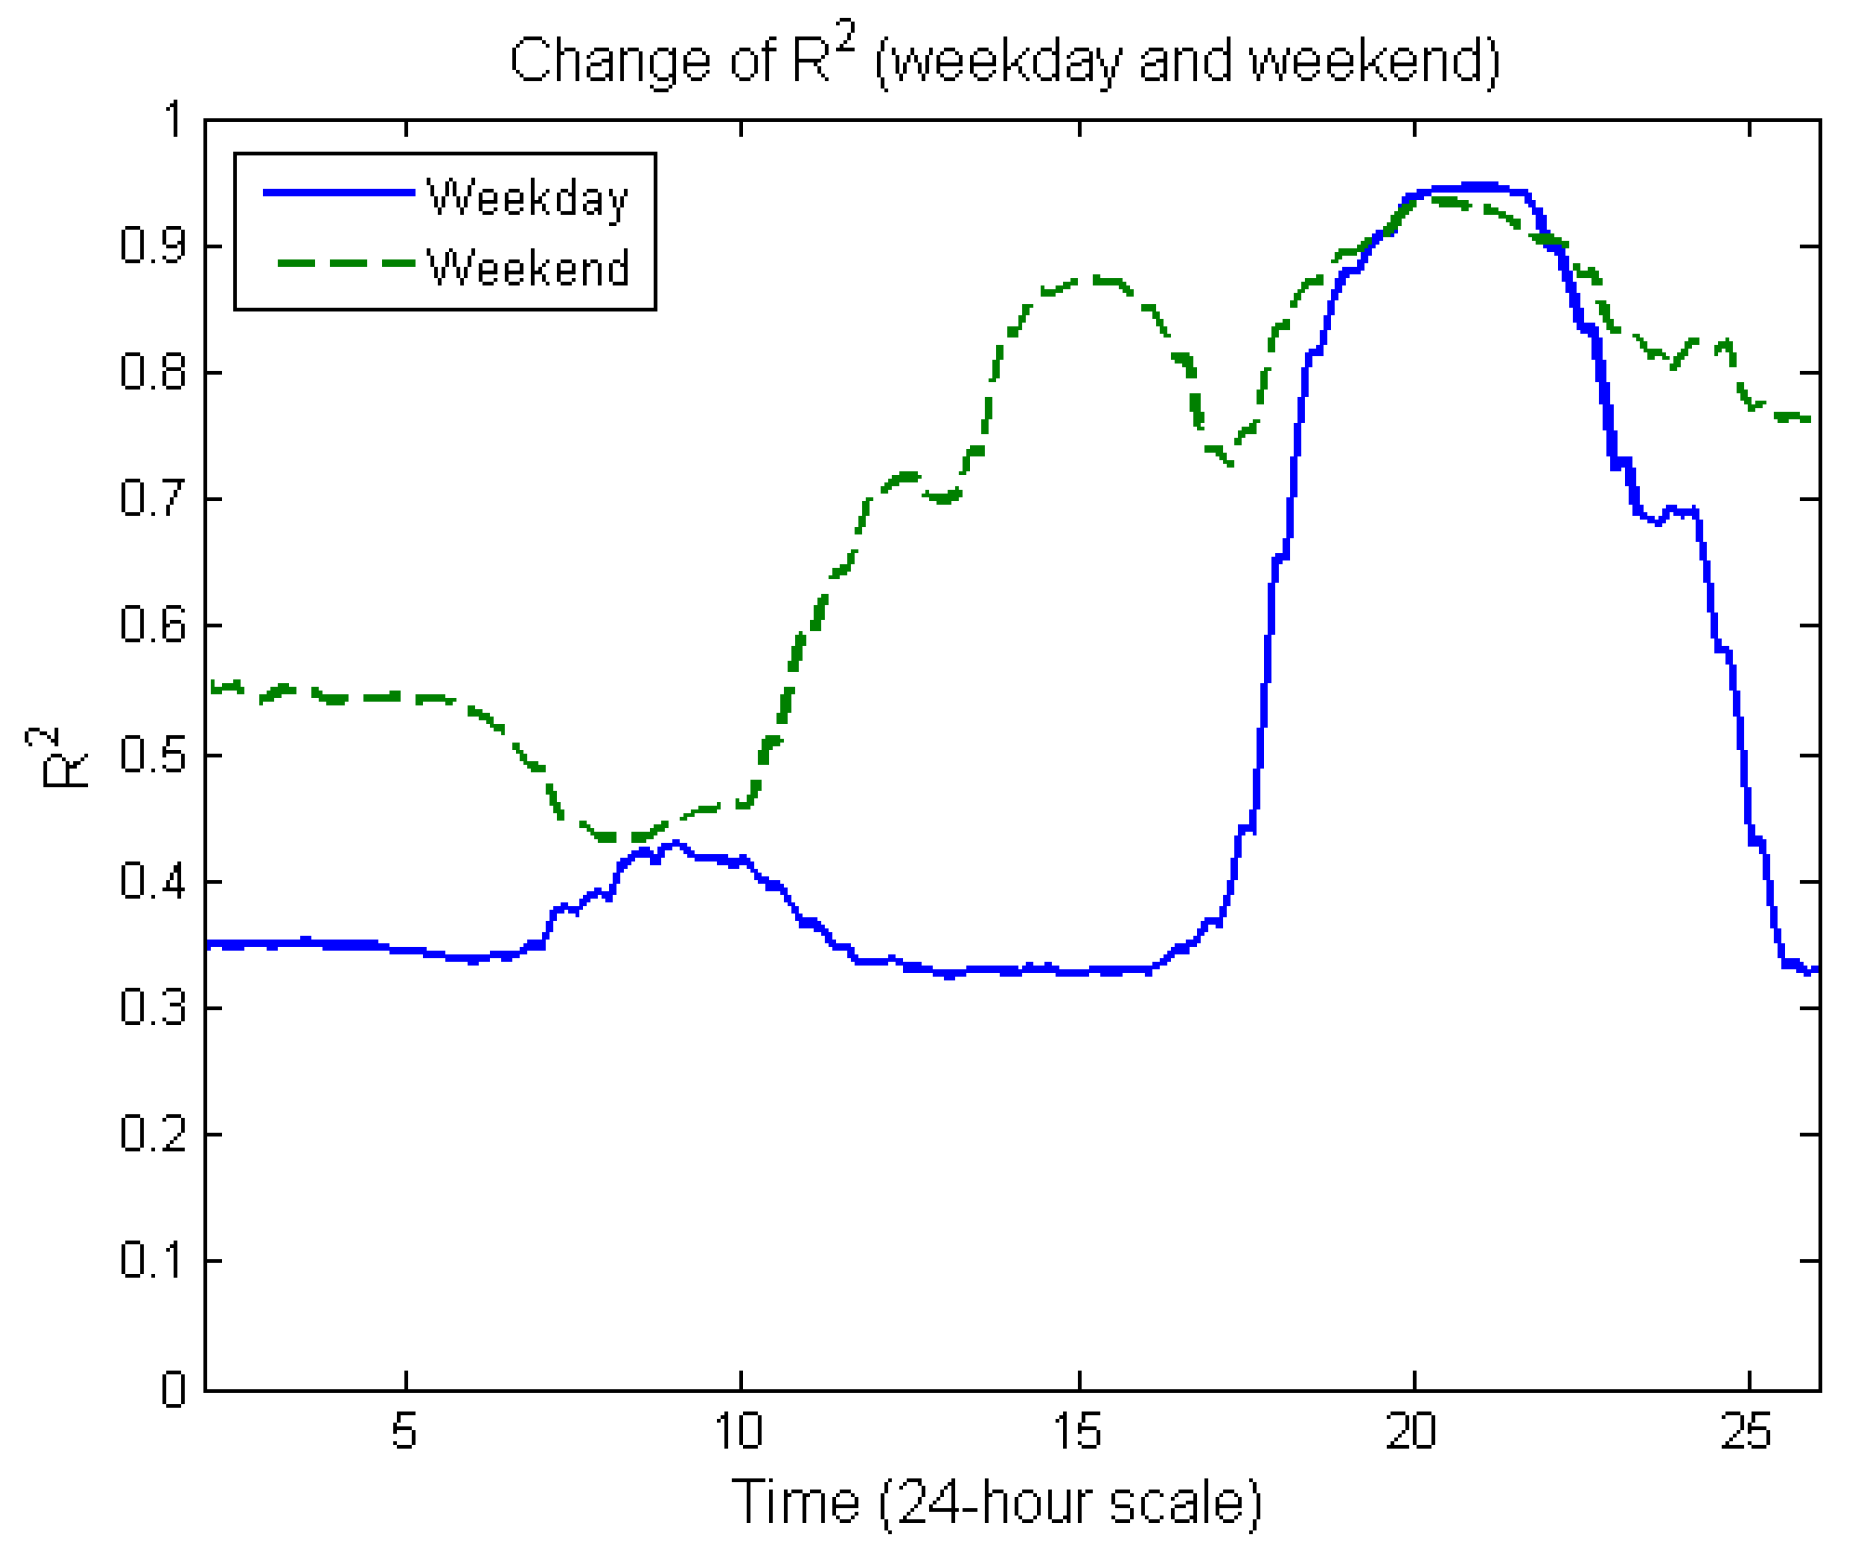
3.3. Coefficient of Determination R 2

The analysis so far suggests that our event-based regression model (which included interaction terms) explained well on weekday nights and weekend days and nights. The coefficient of determination ( R 2 ) graph shown in Figure 9 backs up this conclusion.
Figure 9 shows high R 2 ( > 0.8 ) at around 3 p.m. on weekends/holidays and at around 9 p.m. on both weekdays and weekends/holidays. According to [19], R 2 values of 0.67, 0.33, and 0.19 are considered as substantial, moderate, and weak, respectively. Following this criterion, we concluded that our model maintained at least a moderate level (i.e., R 2 0.33 ) throughout the entire day and achieved R 2 beyond the substantial level during the two peak hours at around 3 p.m. and 9 p.m. These two peaks with high R 2 values matched with the two peaks of high variances of the number of vacancies in Figure 2b. This observation implied that our event-based regression model effectively explained the number of available parking spaces when parking spots were in high demand.
It is worth noting that high R 2 values observed in Figure 9 can be attributed to the selection of our dummy variables X , which represented major events such as performances at theaters and professional sports games at ballpark/field/arena. These major events were mostly (if not all) held at nighttime on weekdays and at day/nighttime on weekends. We chose dummies representing major events because our main objective was to explain the high variability of vacancies observed in Figure 2b, as the high variability of vacancies created issues for the facility. However, during other time slots (that showed lower variability of vacancies), our dummies were not suitable and led to lower values of R 2 ( 0.35 ) . Using our OLS model may not be justified in such a case. For example, it would be perfectly reasonable to use the historical average for predicting the number of vacancies prior to 7 a.m. on any day. From a practical standpoint, facility managers may care less about the time periods when R 2 is low because they correspond to the time periods of low demand variability. Nevertheless, the applicability of our OLS model may need to be checked carefully if facility managers decide to utilize our OLS model in practice for the time period when R 2 is low.

4. Conclusions and Future Research

This study examined the applicability of an event-based OLS regression model to the parking data set at the Theater Square Garage in downtown Pittsburgh. Using weather data and various event information, such as theater performances and sports games in downtown Pittsburgh, our model explained the number of parking vacancies with high R 2 ( > 0.8 ) when the variability of parking vacancies was high. The model can be applied to various businesses such as restaurants in downtown areas, whose visitors are mostly event-related and are likely to be affected by weather. Our model provides practitioners an easy-to-implement tool to gain a deeper understanding of the dynamic movement of people in the downtown area.
Our study will have implications for practice. Since the event schedule may be announced a few weeks in advance, facility managers can evaluate the level of customer demand for each day of the following week based on our OLS model and prepare for the heavy/light customer demand beforehand. Knowing the parking demand in advance, they can set a higher parking fee (which is often called “special event parking rate”) for the days and time periods when a higher demand is expected. This pricing strategy not only increases the revenue of the facility, but also reduces the traffic congestion of surrounding roads by discouraging customers who cruise for parking spaces when all are occupied. Facility managers can post an announcement on a high occupancy period on their website each day. Then, customers could directly visit another parking garage or use a different transportation means (e.g., bus and train), knowing that the facility would be full by the time of their arrival. As another example, restaurant and convenience store managers can evaluate the demand for their peak hours ahead of time and plan to allocate the right number of staff members on each day and time. Furthermore, knowing the demand in advance, they can hold just the right amount of meat and fresh produce, so that they can reduce food wastage.
One of the main advantages of our OLS approach is the applicability of our method. For any businesses whose customers are visitors to the Cultural District of downtown Pittsburgh for viewing theater performances and sports events, the facility managers can utilize the same dummies X that we created. They only need to set up a new matrix Y ( t ) representing their customer demand during the time periods used for X . Following the OLS analysis described in Section 2.2, it is straightforward to obtain the impact of each event (OLS coefficients β ^ ( t ) ), which they can utilize to make their operation more effective than relying on their intuitions. We believe that we can contribute to building smart cities by making a set of major event dummies (for each area and for a given period) publicly available, so that any businesses in the area can make use of such event information, evaluate the possible customer demand for the next day and time, and effectively cope with heavily fluctuating customer demand, which is significantly affected by major events whose combination changes every day and night.
Finally, despite the above-mentioned benefits of our OLS approach, the present study also revealed the limitation of our OLS model. Specifically, we observed lower values of R 2 ( 0.35 ) before 6 p.m. on weekdays. To improve R 2 during the time slots when it is low, we need to include many dummy variables related to minor events held during daytime on weekdays and expand the size of the matrix X correspondingly. This is possible since we can obtain various major and minor events’ information from publicly available resources [16]. However, an introduction of many dummies could raise the risk of data overfitting and must be done carefully. Alternatively, we can consider utilizing a historical time-dependent average to represent the number of vacancies when R 2 is low (before 6 p.m. on weekdays). The challenge in this approach would be to establish a scheme to choose an appropriate method, either our OLS model or a simple time-dependent average, when R 2 is varying from small to high throughout the day. Further studies will be necessary to address these challenges.

Funding

This research received no external funding.

Institutional Review Board Statement

Not applicable.

Informed Consent Statement

Not applicable.

Data Availability Statement

The parking data set was provided by Alco Parking. This data set belongs to Alco Parking and restrictions apply to the availability. The event information is freely available online from the Pittsburgh Cultural Trust website (https://trustarts.org/pct_home/events, (accessed on 1 August 2021)). The weather data are freely available online from the National Centers for Environmental Information website (https://www.ncdc.noaa.gov/cdo-web/, (accessed on 1 August 2021)).

Acknowledgments

The author would like to thank the anonymous review team for their valuable and constructive comments, which helped to substantially improve the content and the presentation of this paper. The author gratefully acknowledges ALCO Parking for its valuable parking data set used in this study. The author appreciates Robert Hampshire and Tayo Fabusuyi for their constructive comments and suggestions throughout the study. The author is also thankful to Jasim Ahmed for his helpful support to revise the paper.

Conflicts of Interest

The author declares no conflict of interest.

References

  1. Shoup, D.C. Cruising for parking. Transp. Policy 2006, 13, 479–486. [Google Scholar] [CrossRef]
  2. Larson, R.C.; Sasanuma, K. Urban Vehicle Congestion Pricing: A Review. J. Ind. Syst. Eng. 2010, 3, 227–242. [Google Scholar]
  3. Larson, R.C.; Sasanuma, K. Congestion Pricing: A Parking Queue Model. J. Ind. Syst. Eng. 2010, 4, 1–7. [Google Scholar]
  4. Vickrey, W.S. Congestion theory and transport investment. Am. Econ. Rev. 1969, 59, 251–260. [Google Scholar]
  5. Krishnamurthy, C.K.; Ngo, N.S. The effects of smart-parking on transit and traffic: Evidence from SFpark. J. Environ. Econ. Manag. 2020, 99, 102273. [Google Scholar] [CrossRef]
  6. Idris, M.I.; Leng, Y.Y.; Tamil, E.M.; Noor, N.M.; Razak, Z. Car park system: A review of smart parking system and its technology. Inf. Technol. J. 2009, 8, 101–113. [Google Scholar] [CrossRef] [Green Version]
  7. Lin, T.; Rivano, H.; Le Mouël, F. A Survey of Smart Parking Solutions. IEEE Trans. Intell. Transp. Syst. 2017, 18, 3229–3253. [Google Scholar] [CrossRef] [Green Version]
  8. Parmar, J.; Das, P.; Dave, S.M. Study on demand and characteristics of parking system in urban areas: A review. J. Traffic Transp. Eng. 2020, 7, 111–124. [Google Scholar] [CrossRef]
  9. Srikanth, S.V.; Pramod, P.J.; Dileep, K.P.; Tapas, S.; Patil, M.U.; Sarat, C.B. Design and Implementation of a prototype Smart PARKing (SPARK) System using Wireless Sensor Networks. Int. Conf. Adv. Inf. Netw. Appl. Workshops 2009, 401–406. [Google Scholar]
  10. Chinrungrueng, J.; Dumnin, S.; Pongthornseri, R. iParking: A parking management framework. In 2011 11th International Conference on ITS Telecommunications; IEEE: New York, NY, USA, 2011; pp. 63–68. [Google Scholar]
  11. Karbab, E.; Djenouri, D.; Boulkaboul, S.; Bagula, A. Car park management with networked wireless sensors and active RFID. In 2015 IEEE International Conference on Electro/Information Technology (EIT); IEEE: New York, NY, USA, 2015; pp. 373–378. [Google Scholar]
  12. Pittsburgh Cultural Trust ParkPGH. Available online: https://trustarts.org/pct_home/visit/directions-parking/parkpgh (accessed on 1 August 2021).
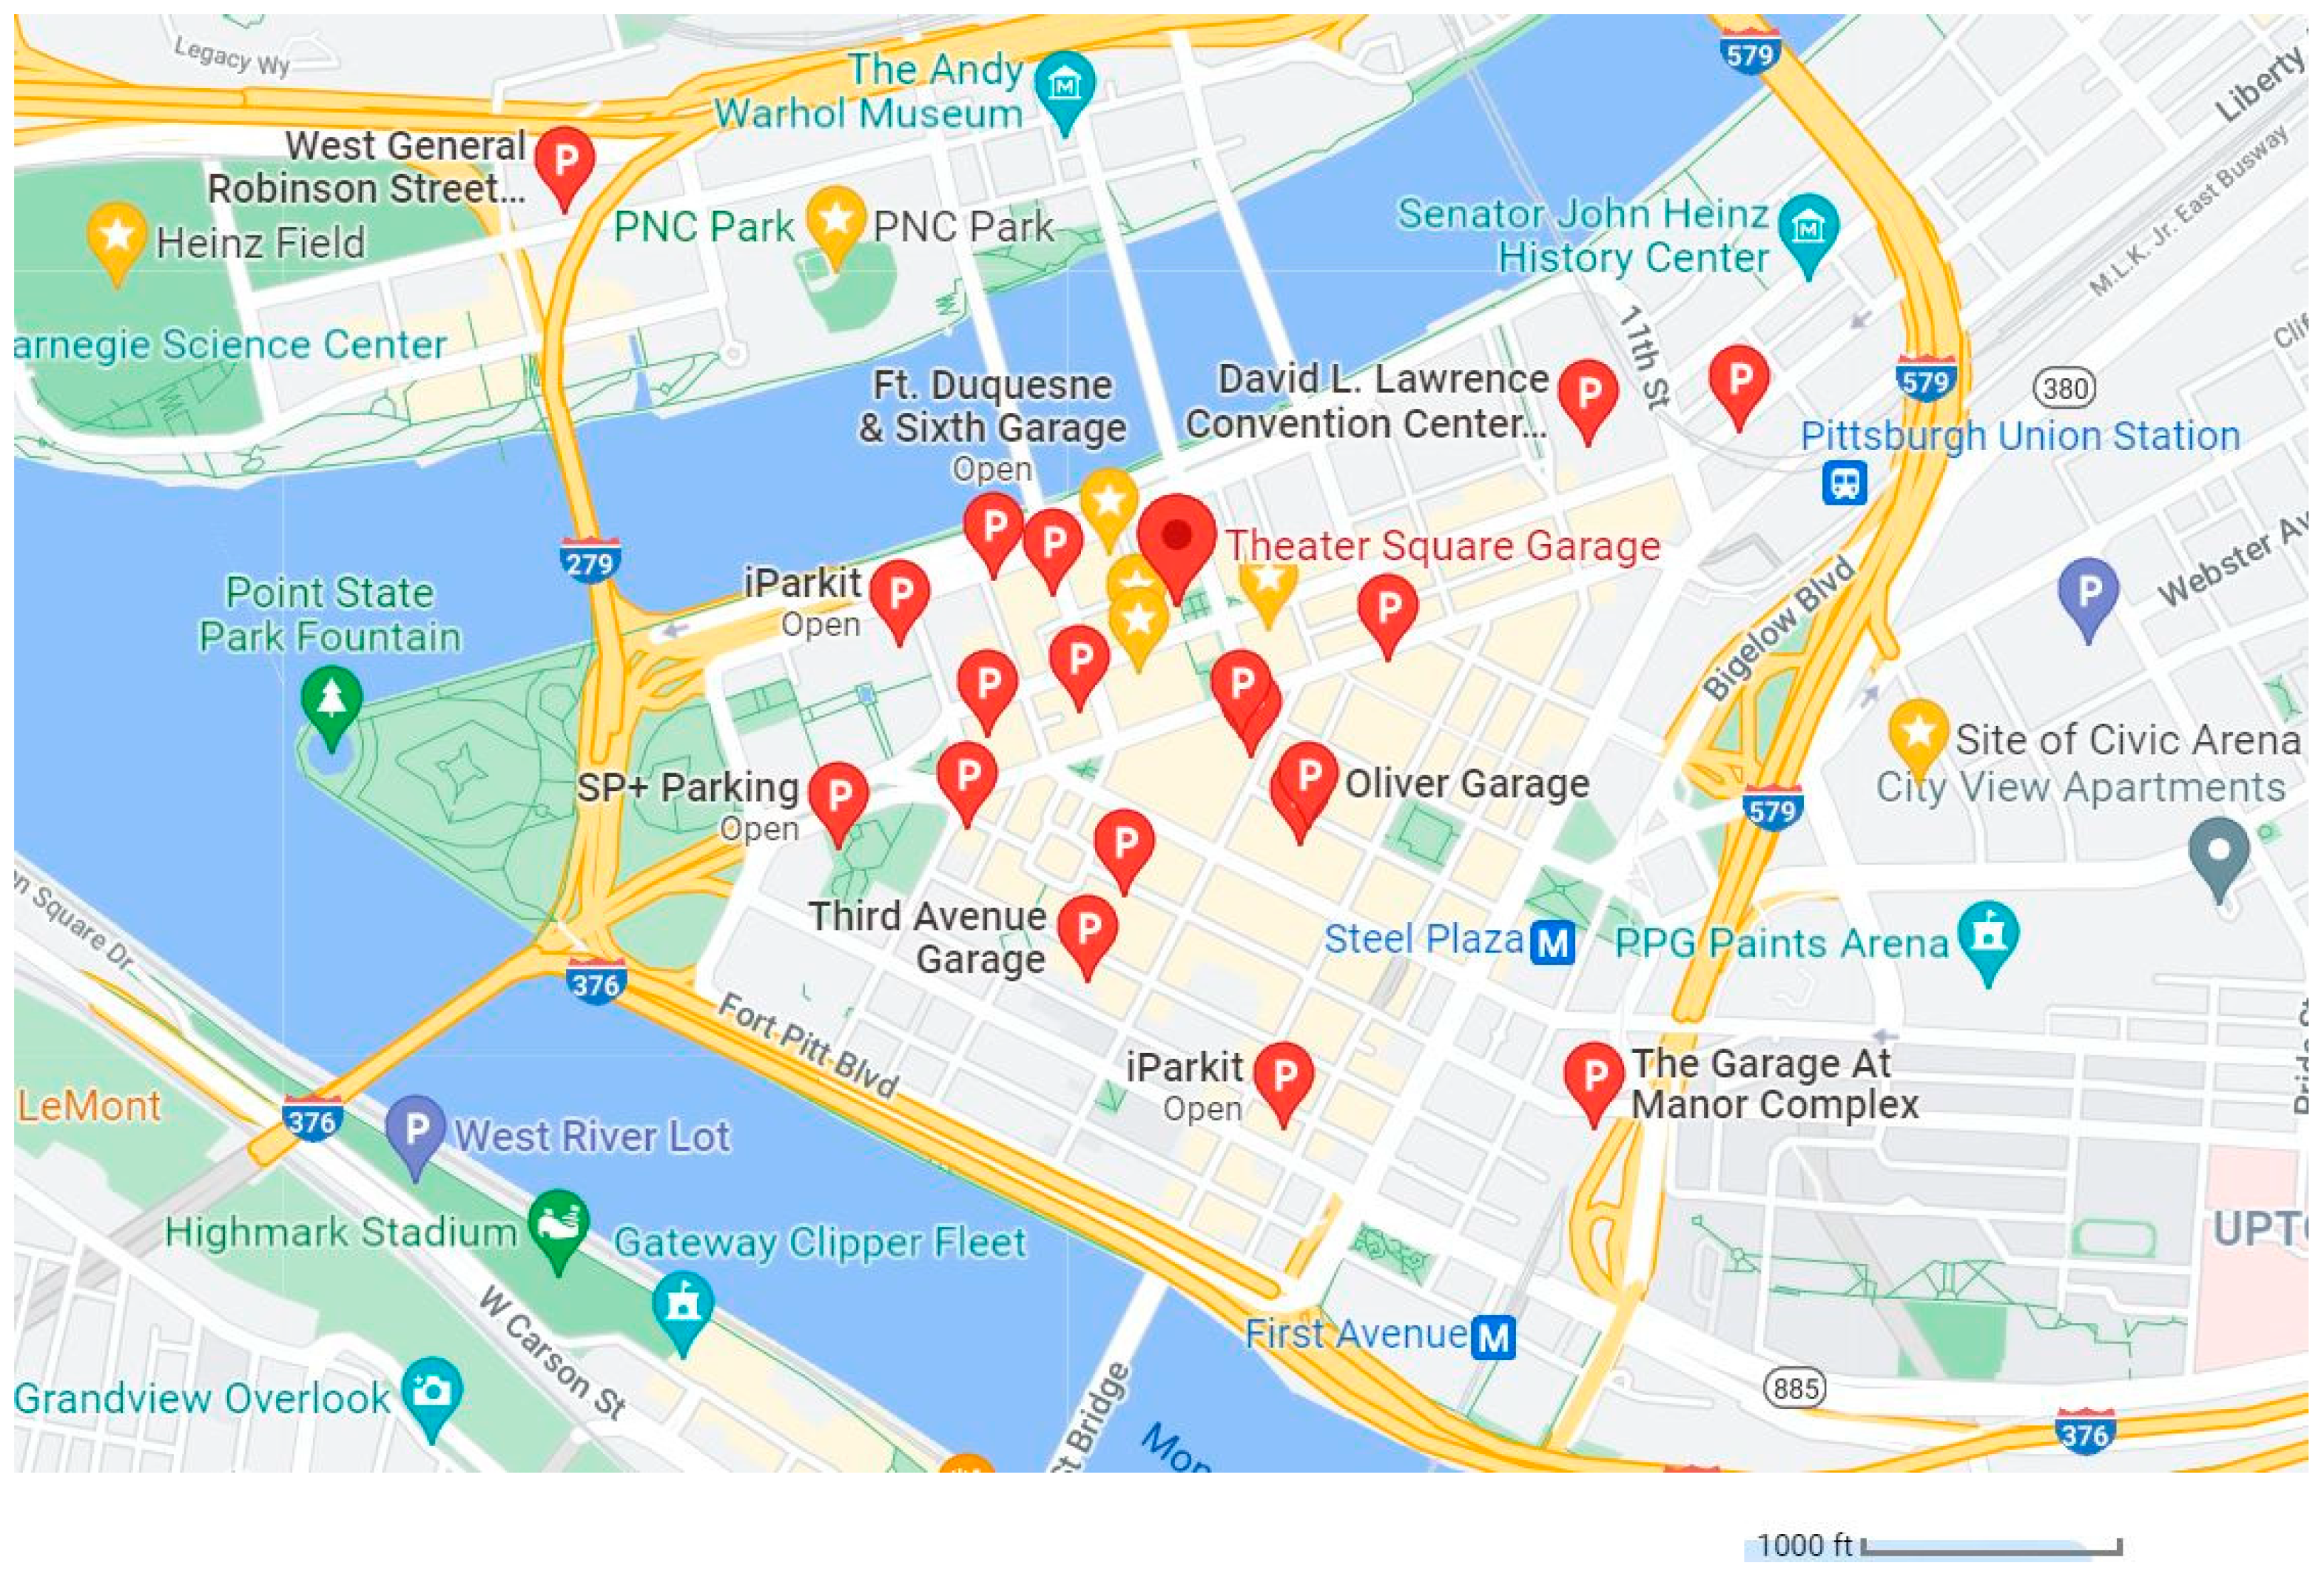
  13. ALCO Parking Theater Square Garage. Available online: https://alcoparking.com/lot-garage/theater-square-garage/ (accessed on 1 August 2021).
  14. Fabusuyi, T.; Hampshire, R.C.; Hill, V.A.; Sasanuma, K. Decision analytics for parking availability in downtown Pittsburgh. Interfaces 2014, 44, 286–299. [Google Scholar] [CrossRef]
  15. Public Parking Authority of Pittsburgh. Parking Market Report of Selected Off-Street Parking Facilities, Pittsburgh, Pennsylvania. April 2010. Available online: https://apps.pittsburghpa.gov/council/garagestudy.pdf (accessed on 1 August 2021).
  16. Pittsburgh Cultural Trust. Available online: https://trustarts.org/ (accessed on 1 August 2021).
  17. National Centers for Environmental Information. Available online: https://www.ncdc.noaa.gov/cdo-web/ (accessed on 1 August 2021).
  18. Wackerly, D.; Mendenhall, W.; Scheaffer, R.L. Mathematical statistics with applications, 7th ed.; Brooks/Cole: Belmont, CA, USA, 2008. [Google Scholar]
  19. Chin, W.W. The partial least squares approach to structural equation modeling. Mod. Methods Bus. Res. 1998, 295, 295–336. [Google Scholar]
Figure 1. Locations of parking garages and major event venues in downtown Pittsburgh. Notes: Theater Square Garage is pinned in the middle of the map. Other garages are indicated as P. Major event venues are indicated as stars. 1 mile = 5280 feet = 1609 m. Map data ©2021 Google.
Smartcities 04 00073 g001
Figure 2. (a) Mean of the number of vacancies (out of the total 785); (b) variance of the number of vacancies.
Smartcities 04 00073 g002
Figure 3. (a) Impact of Heinz Hall event during daytime; (b) impact of Heinz Hall event during nighttime.
Smartcities 04 00073 g003
Figure 4. (a) Impact of Byham Theater event during daytime; (b) impact of Byham Theater event during nighttime.
Smartcities 04 00073 g004
Figure 5. (a) Impact of Benedum Center event during daytime; (b) impact of Benedum Center event during nighttime.
Smartcities 04 00073 g005
Figure 6. (a) Impact of rain (inch/day); (b) impact of snowfall (inch/day).
Smartcities 04 00073 g006
Figure 7. Impact of interaction terms that involved Steelers’ night game.
Smartcities 04 00073 g007
Figure 8. (a) Impact of Steelers’ nighttime game with no interaction terms; (b) impact of Steelers’ nighttime game with interaction terms.
Smartcities 04 00073 g008
Figure 9. Daily fluctuation of Coefficients of Determination on weekdays and weekends.
Smartcities 04 00073 g009
Table 1. Capacity and distance information of major event venues.
Event VenueCapacity 1Distance to Theater Square Garage (Walking Time 2)
Benedum Center2800 seatsLess than 0.1 mile (1 min)
Byham Theater1300 seats0.1 mile (2 min)
O’Reilly Theater650 seatsLess than 0.1 mile (1 min)
Heinz Hall2670 seatsLess than 0.1 mile (1 min)
PNC Park38,000 seats0.6 mile (12 min)
Heinz Field68,400 seats1.1 miles (22 min)
Mellon Arena (Civic Arena) 316,940 seats0.7 mile (17 min)
1 Capacity data are approximate; standing room is not included. 2 Walking time data, which we obtained from Google Map, are estimates. 3 Mellon Arena (also known as Civic Arena) was demolished in 2011–2012.
Publisher’s Note: MDPI stays neutral with regard to jurisdictional claims in published maps and institutional affiliations.

