Article

Concept Drift Adaptation Techniques in Distributed Environment for Real-World Data Streams

by
Hassan Mehmood
1,*,
Panos Kostakos
1,
Marta Cortes
1,
Theodoros Anagnostopoulos
2,
Susanna Pirttikangas
1 and
Ekaterina Gilman
1
1
Center for Ubiquitous Computing, University of Oulu, Pentti Kaiteran katu 1, 90570 Oulu, Finland
2
DigiT.DSS.Lab, Department of Business Administration, University of West Attica, P. Ralli & Thivon 250, Aigaleo, 122 44 Athens, Greece
*
Author to whom correspondence should be addressed.
Smart Cities 2021, 4(1), 349-371; https://doi.org/10.3390/smartcities4010021
Submission received: 30 January 2021 / Revised: 8 March 2021 / Accepted: 11 March 2021 / Published: 14 March 2021
(This article belongs to the Special Issue Intelligent Edge Computing for Smart Cities)

Abstract

:
Real-world data streams pose a unique challenge to the implementation of machine learning (ML) models and data analysis. A notable problem that has been introduced by the growth of Internet of Things (IoT) deployments across the smart city ecosystem is that the statistical properties of data streams can change over time, resulting in poor prediction performance and ineffective decisions. While concept drift detection methods aim to patch this problem, emerging communication and sensing technologies are generating a massive amount of data, requiring distributed environments to perform computation tasks across smart city administrative domains. In this article, we implement and test a number of state-of-the-art active concept drift detection algorithms for time series analysis within a distributed environment. We use real-world data streams and provide critical analysis of results retrieved. The challenges of implementing concept drift adaptation algorithms, along with their applications in smart cities, are also discussed.

1. Introduction

By 2050 it is projected that about 7 billion people will live in urban centres generating a substantial demand and supply for versatile data services [1]. It is estimated that by 2030, 50 billion Internet of Things (IoT) devices and sensors will be connected to the internet over high capacity and lower latency networks. Therefore, more and more intelligent systems, relying on data analysis and ML, will be developed in the future, pushing computing to the cognitive “edge” of the city. Against the superimposition of traditional ML models that assume data distribution to be static [2,3], real-world streaming data often drifts away from the learned distribution, that is, concept drift. Concept drift can be framed as a change in the latent distribution of a target variable for which predictions are made over a certain period of time due to unanticipated reasons, like wearing out of the sensor or its replacement with a differently calibrated one [2,3,4]. The presence of concept drift can make prediction results inaccurate and therefore can lead to sub-optimal decisions. Thus, there is an urgent need to enhance intelligent systems operating on real-world data streams with concept drift-aware learning methodologies, ensuring the validity of model outcomes [5,6].
The scenario of air quality prediction in a smart city could be used as a real example of concept drift, where the latent distribution of a target variable (e.g., levels of pollutants) may change abruptly or gradually over time. For instance, a model that predicts the impact of air pollution in urban boroughs could have been developed on historical data and tested to be accurate. However, there are numerous performance metrics that might affect the predictive accuracy of that model such as weather, seasonality, gentrification, hardware changes in smart sensors, and software updates in big data fusion technologies. Furthermore, everyday social and economic activity can be yet another reason for concept drift in air quality monitoring, as shopping behaviour and urban mobility patterns change either because of weather seasonally or because of exogenous urban development policies. For example, during a winter season with extended wet weather there will be higher sales (and traffic congestion) in neighbourhoods with enclosed shopping areas compared to the summer. Finally, sudden lifestyle changes that require a city “reboot”, such as the COVID-19 lockdown or other disruptive technologies (e.g., gig economy) could dramatically throw off the model. Finally, demographic and socio-economic changes at the city level could unintentionally introduce algorithmic biases which are in turn perpetually institutionalised through public decision making.
The implications of concept drift are observed in various data-intensive smart city applications and in diverse fields such as health care, management, applied science, economics, to name a few [7]. As the volume, variety, and validity of the data continuously evolves [8], new concepts are being introduced in the data over time, making the knowledge of machine learning models obsolete. Furthermore, with the introduction of the 5th generation mobile network (5G), handling concept drift is critical in enabling adaptive decision making applications, that depend heavily on high velocity data generated in low-latency communication networks. Thus, the challenges involved in data mining for voluminous data streams and self-adaptive machine learning solutions are expected to play a pivotal role in future iterations of the smart city. While concept drift can be handled effectively with the incorporation of adaptive learning strategies for big data [7,9], the adaptive models should be supplied with knowledge of forgetting and learning frequencies (when to learn and forget). In this study, multiple concept drift detection algorithms have been implemented considering the ongoing challenges in the field.
The current literature identifies various open challenges for application domains working with real-world data streams where requirements for prediction of dynamic non-stationary streams are faced with concept drift [10,11]. The industries covered range from law enforcement, finance and banking to telecommunications, retails and advertising. Applications requiring continuous learning and adaptation are generally grouped into the following categories [11]: (i) monitoring and control, (ii) information management, and (iii) analytics and diagnostics.
Monitoring and control applications often fit regression and classification models to data streams, enabling detection of anomalous behaviour and adversary activities [4]. Such solutions either seek to enhance existing management processes in domains like transportation, production and energy industry, where overseeing sensory throughput in critical system operations is required, or seek to perform automated control in dynamic environments, like in autonomous and ubiquitous mobile systems [12].
The information management category of applications, where data streams enable various personalised services, also requires usage of concept drift methods. Typical examples in this domain would be the personalised assistance services [4], and recommendation and information retrieval systems [13]. Finally, analytics and diagnostics application category requires concept drift-aware solutions to achieve adequate predictive analytics and diagnostics tasks like in market dynamics [14], healthcare and well-being [6], and in other application domains where human actions, behaviours, and personal preferences can change over time.
As can be seen, handling real-world changes in streaming data is challenging for traditional ML algorithms that assume data is stationary. Evidently, the development of sensing and communication technologies enables the generation of massive amount of data, therefore, distributed processing is required. Moreover, the literature lacks implementations and benchmarking techniques of the existing concept drift methods for time series data. Some previous studies have tested drift detection methods [15,16,17]. However, these benchmarks use traditional single node computational environments, having their downsides for computations with large datasets that could resemble a smart city scenario. To the best of our knowledge, this article is one of the first efforts to implement concept drift methods within multi-node distributed processing environment and which focuses on time series data.
In summary, the article makes the following contributions to the literature on concept drift in large scale distributed smart cities environments. First, we review the state-of-the-art of concept drift methods. Second, we implement and test a number of active concept drift detection algorithms for time series analysis within a distributed environment. Third, we use both synthetic and real-world data streams for validation and testing. Finally, we provide critical analysis of results retrieved.
The paper is organised as follows—Section 2 provides the state-of-the-art on smart cities and concept drift methods. In Section 3, we describe our approach, architecture, algorithms, and technical specifications. Section 4, focuses on implementation, retrieved results, and their analysis from implemented concept drift algorithms within a distributed environment. Lastly, Section 5 discusses the lessons learnt, limitations, and contextualises our findings in smart cities.

2. Literature Review

In this section, we first provide an overview on smart cities and technological advances in the context of its ecosystems. Secondly, we briefly detail the applications of concept drift adaptation in smart cities. Finally, the later sub-section reviews the state-of-the-art on concept drift detection and adaption approaches.

2.1. Overview on Advances in Smart Cities

Emerging technologies have disrupted the way modern cities are being managed and defined. From public buildings, utility services, and health care to transportation networks and public services new technologies have enabled improved connectivity across previously disjointed spaces and places. Such developments not only make cities smarter, but also help in improving life quality of its inhabitants for example, well-being through technology, planning routine with smart applications, e-learning and others. While the concept of the “smart city” still remains elusive, modern cities are increasingly becoming dependant on a symbiotic relationship with proliferating technologies such as, IoT, sensors, distributed cloud, fog/edge computing, smartphones, and others [18,19]. According to recent estimations, the market for solutions and services created for smart cities around the globe will approximately grow over 2 trillion USD [20]. Similarly, the extensive use of sensors, IoTs, economic platforms, and social networks, is expected to improve services for citizens and to help optimise smart city management through the availability of mission-critical data [21].
The rapid expansion of the innovation ecosystem for IoT and sensors has provided many vibrant opportunities in both research and academia. The examples of this trend are evident in areas of energy management, environment control and monitoring, transportation, health care, automotive industry, social networks and applications, and public safety and security [22,23,24]. With these ongoing developments, there are numerous challenges for better governance in cities that demand for improved technological solutions [19,21,25]. According to a study by [26], many cities around the globe already have executed smart city initiatives, however, the enabling technologies in smart cities are still rapidly changing. Four major technologies have been used in smart city platforms, (i) IoT, cloud computing, big data, and cyber-physical systems. Furthermore, opportunities and computational capabilities of edge and fog computing for sustainable smart cities are also explored in a study by [18].
The aforementioned technologies together are providing vast opportunities in various urban domains, to better equip administrators and policy makers with useful information to anticipate future urban issues, achieve sustainable societal goals, and enact new urban management policies. Today, many cities are harnessing data from disparate data sources, aiming to continuously improve citizen’s living standards. For example, the Smart London Project [27] focuses on utilizing the city wide collected data to connect different communities, enhance environment protection, provide improved public security, and enable smarter transport network. Another EU funded project called CUTLER provided evidence-based policy making solution [28] for coastal urban development using big data. Five pilot cities (Thessaloniki, Antalya, Antwerp, Cork, and Vicenza) [19] were involved in the project each with different use case scenario. The CUTLER smart city platform connected heterogeneous data that enabled the users to characterise geographical landscapes, parking scans, parking spot income, vehicle emission, user contributed content, and others. The data from the CUTLER platform was further used by the municipalities in designing new policies (e.g., controlled parking system), considering various urban infrastructure limitations [28]. Similarly, Tokyo plans to be the greenest city in Asia by efficiently managing their transportation, reducing energy consumption, and improving other sectors of the city [29]. Apart from earlier mentioned smart city projects, several other countries have at least one existing smart city initiative for example, United Arab Emirates [30], South Korea [31], and Brazil [32].
The smart city ecosystems are built on top of wide range of sensors, IoTs and many other technological alternatives, making plethora of data sources available for generating insights. However, due to availability of diverse data sources and technological alternatives, processing and analysing data from smart city is a great challenge. Additionally, big data has also contributed in producing such massive amount of data [19]. Initiatives in both research and industry have been taken to mitigate the challenges of data collection, data processing, and storage of data. A hybrid cloud infrastructure consisting of big data technology solutions such as, Apache Hadoop [33], Apache Spark [34], and Elasticsearch [35] was proposed in the CUTLER project [28] to store, process, and analyze large-scale data from smart cities. Similarly, different architectures have been deployed for example, Padova Smart city project that uses a server tier to sense environmental and traffic situations, making the data available for city offices [36]. In addition, projects like CiDAP [37], OpenIoT [38], BASIS [39] use big data technology solutions to process and store large scale data. Apart from the cloud based large-scale data infrastructures, with the adoption of IoT and 5G alternatives like edge and fog based architectures are also being explored [40].
Over time, it is anticipated that ground truth data in many application domains eventually become obsolete—from financial forecasting to efficient energy management, and from intelligent traffic routing to environmental sensing and weather forecasting [23,40,41]. There are various scenarios within a smart city where historical empirical observations can become outworn (concept drift) for example, outdated configurations of devices, calibration difference, change in context of text, maintenance of equipment, and environmental factors [4,42]. In many cases, maintaining the unseen class labels and changes in concepts of low latency big data becomes difficult, expensive, and unfeasible [42]. The presence of concept drift is evident in various application areas of smart cities, where artificial intelligence based prediction, ranking, classification, time series forecasting are commonly aimed, for example, intelligent traffic management in traffic management domain, quality control in industry, autonomous controls among vehicles and robots, intrusion and fraud detection in cyber security and communication, and forecasting energy requirements in energy sector [11,21]. To address this bottleneck, different frameworks for handling concept drift have been proposed by researchers considering both the data and computational challenges. For example, a fog computing based concept drift adaption process has been proposed by [43]. In another study by [44], a Apache Hadoop based concept drift adaption method was implemented. More information on concept drift are detailed in following sections.

2.2. Concept Drift Detection and Adaption: Active and Passive Approaches

This section focuses on the review of concept drift algorithms which are summarised in Table 1. Concept drift is a multifaceted problem which is colloquially binarized into real or virtual drift. Real concept drift is referred as the change in conditional distribution of the target variable while the distribution of the input variable may or may not change, Reference [4]. Virtual drift, also called temporary drift, occurs as a result of an incomplete representation of the data distribution rather than of a change in the underlying concept [3,4]. The handling of real concept drift requires feedback-based techniques to evaluate learner’s performance, whereas virtual drift can perform without such techniques [4]. Depending on how the changes on data occur during time, concept drift can be categorized into sudden (or abrupt), gradual, and recurring [4]. In abrupt drift, a drift can happen suddenly [4]. In gradual drift, concepts in the data are slowly changed over time. In case of recurring drift, the change in newly arriving data instances disappears temporarily and returns after a period of time [17].
Concept drift algorithms for adaptive ML are classified in two main categories: passive and active algorithms. In passive algorithms, learning models are updated with the assumption that concept drift is present in continuously changing data. Whereas active approaches are more focused on detecting the concept drift first and then updating the model at a later stage [3,5].

2.2.1. Active Approaches

Active approaches are mainly classified into three categories [65]: (i) sequential analysis-based approach (ii) approaches based on data distribution (iii) learner/model output-based approach. In sequential analysis-based approaches, newly acquired data patterns are analyzed sequentially as they become available. Alarms for concept drift are generated when the likelihood of observing the data sequence under the new data distribution becomes greater than under the original one [4,65]. For example, the Page Hinckley Test (PHT) [4] detects the change in data sequentially using cumulative difference of observations and their mean till the latest observation.
Data distribution-based approaches for concept drift detection, typically use two different time windows containing distributions of raw data pattern, where a fixed window contains data from past time period and a sliding/open window contains data from recent observations. Then, both windows are compared with each other to test the hypothesis whether the concepts present in the windows are different [65]. Data distribution-based approaches are further classified into parametric and non-parametric. The parametric method assumes the probability distributions of data streams are to be known before and after detection of concept drift [65]. However, their parameters are still considered to be unknown. The multivariate non-parametric method does not require information about probability distributions, which are difficult to know in real-time scenarios [66]. Non-parametric methods are often found useful for categorical data, in cases where individual scores are not necessary, unlike in parametric methods [66]. A number of methods based on data-distribution exist, like semi-parametric log-likelihood (SPLL) detector, that utilizes k-means method to create clusters from available raw data patterns and models the obtained clusters based on Gaussian distributions [47]. Fuzzy competence model (FCM) method is used for empirical representation of data distribution to give the level of concept drift present in data [65]. QuantTree method uses histograms and computing statistics to model the high-dimensional raw data [51]. The major limitation of these methods is the necessity to store the windowed data and setting its length [65].
Finally, model output-based drift detection methods are typically built on top of a learner by tracking the fluctuations in error rate [4]. Many methods have been proposed. For instance, in drift detection method (DDM) [4] the prediction error is given by random variable using Bernoulli trials, and concept drift is detected when the error rate exceeds the set threshold [15]. The early drift detection method (EDDM) [67], an extension of DDM, instead of the error rate uses distance error rate of base learner to identify whether the drift exists in data distribution [15]. The Adaptive Windowing (ADWIN) method monitors the change in distribution of output from learner. It uses partitioned data containing two different disjoint subsets to conclude the possible statistical differences between them, where one subset contains the original observations and the other predicted values [15].
To summarise, sequential analysis-based methods are suitable for single time series with less possibility of tackling real concept drift. Whereas, data distribution-based methods can cope with complex and multi-variate data, but due to the lack of connection with output of the learner, such methods can conduct unnecessary update of the learner [65]. Learner-output based algorithms have gained prominence in detecting concept drift compared to the former stated approaches in different application domains, such as weather prediction, fault-detection, health care [6,65]. In addition, these methods are found to be suitable in cases where data sources are characterised with complex time series or contain non-linear relationships, unlike sequential analysis-based and data distribution-based approaches [65].

2.2.2. Passive Approaches

Passive approaches, when employed continuously, update predictive learner without requiring prior explicit detection of concept drift [10]. The learner’s parameters in passive approaches are adapted continuously each time new data arrives [65]. There are generally two kinds of approaches proposed, (i) single classifier and (ii) Ensemble based [5,10]. Single classifier approaches mainly consist of individual classification models utilised to perform predictive analysis, unlike ensemble-based methods where pool of multiple base models is used [5].
Single classifier approaches are well-suited for analysing large-scale data streams due to their low computational costs [10]. The Hoeffding tree based learning system called very-fast decision tree (VFDT) was specifically developed for data stream classification [5]. Hoeffding bound is utilized to quantify the minimum arriving observations to perform estimations. It guarantees the performance just like other non-incremental learners [58]. VFDT was further improved with concept drift VFDT (CVFDT), by adding adaptive windowing to tackle continuously changing data in non-stationary environments [5,61]. Online information network (OLIN), a fuzzy-logic based single classifier approach, also uses adaptive sliding window to train streaming data [61]. Single classifier approaches are computationally cost-effective compared to ensemble based approaches, which makes them suitable candidates for large-scale data stream processing [10].
Ensemble based approaches are a natural fit for learning in non-stationary environments due to some prominent advantages: (i) they provide much accurate results than single classifiers due to pool-based approach and reduced variance of the error (ii) they are flexible for incorporating newly arriving data (data is added to ensemble as new members) (iii) if previously learnt knowledge becomes irrelevant, the old classifiers can be easily discarded based on dynamic selection and voting techniques [10,68]. The streaming ensemble algorithm (SEA) is one of the very first examples for ensemble based learning in non-stationary settings [3]. SEA adds new classifiers for newly arriving data. When the SEA reaches the predefined limit, classifiers are removed by using measure of quality. For example, a single classifier is examined for the quality of drawn predictions against the predictions from ensemble, this helps SEA in achieving reduced variance and ability to retain or learn new knowledge at the same time [10]. Another approach, called Dynamic Adaption to Concept Changes (DACC), [63] uses Dynamic Weighted Majority (DWM) [63]. In this method, the weakest half of the classifier is removed randomly from the pool after it is replaced by a new one. However, the newly created classifiers are omitted from this elimination process using predefined function. The predictions from the DACC are drawn from the classifier with highest accuracy. Other ensemble based approaches are online non-stationary boosting algorithm (ONSBOOST) and Learn++.NSE algorithm, and online coordinate boosting (OCBoost) [5,10]. Apart from the two main passive approaches described above, neural networks are also gaining significance in non-stationary learning. For example, online extreme learning machine (ELM) based method and online sequential ELM (OS-ELM) methods have been proposed in a recent study [65].
Despite the ability of passive approaches to deal with concept drift in non-stationary environments, it could be onerous to adjust the adaptation speed of the model. In gradual and recurring types of concept drift, passive approaches perform well [10], while active approaches are well-suited for sudden drift scenarios. Furthermore, passive approaches are in general well-suited for batch learning; however, active approaches perform equally well also in online environments [10].

3. Approach

We implement and test a number of state-of-the-art active concept drift detection algorithms for time series analysis in distributed environments. Namely, we test PHT [4], ADWIN [15], DDM [4], and EDDM [67] algorithms, see Section 3.1. We selected these four active concept drift algorithms for this study since they allow to detect and study the existing drifts in data, do not require unnecessary retraining, and have lower computational costs [5]. Passive approaches, however, are able to adapt to the present concept in the data with continuous updates, but they require large computational efforts. Furthermore, the rationale behind selecting these four concept drift method is: (i) they are well studied algorithms, see Section 2.2.1, (ii) their suitability for adapting to different kinds of concept drift (gradual, abrupt, etc.), see Table 1, and (iii) both classification and regression problems are supported by these algorithms, Table 1. However, not all of them have been tested for time series regression problems.
Although concept drift is a well-studied research topic, the implications of concept drift in time series are not well explored, especially for scenarios with larger datasets and use cases that resemble smart city applications [55,69]. To fill in this gap, we focus on time series datasets (two artificially created and two real-world datasets), see Section 3.2. In particular, we experiment with three time series models—the Trigonometric, Box-Cox transform, ARMA errors, Trend, and Seasonal 276 components model (TBATS), Prophet, and Long Short-Term Memory model (LSTM). These models were chosen due to their accuracy, ability to handle complex seasonal patterns, support for long-term forecasts, and tunable parameters, see Section 3.3.
To tackle the computational cost challenges coming from large real-world data streams, big data technology solutions are used in this article [19], details are in Section 3.5. The overall approach for our experimental setup is as follows:
  • Implement selected concept drift methods in distributed environment;
  • Test the performance of implemented algorithms with synthetic datasets;
  • Implement time series prediction models to real-world datasets;
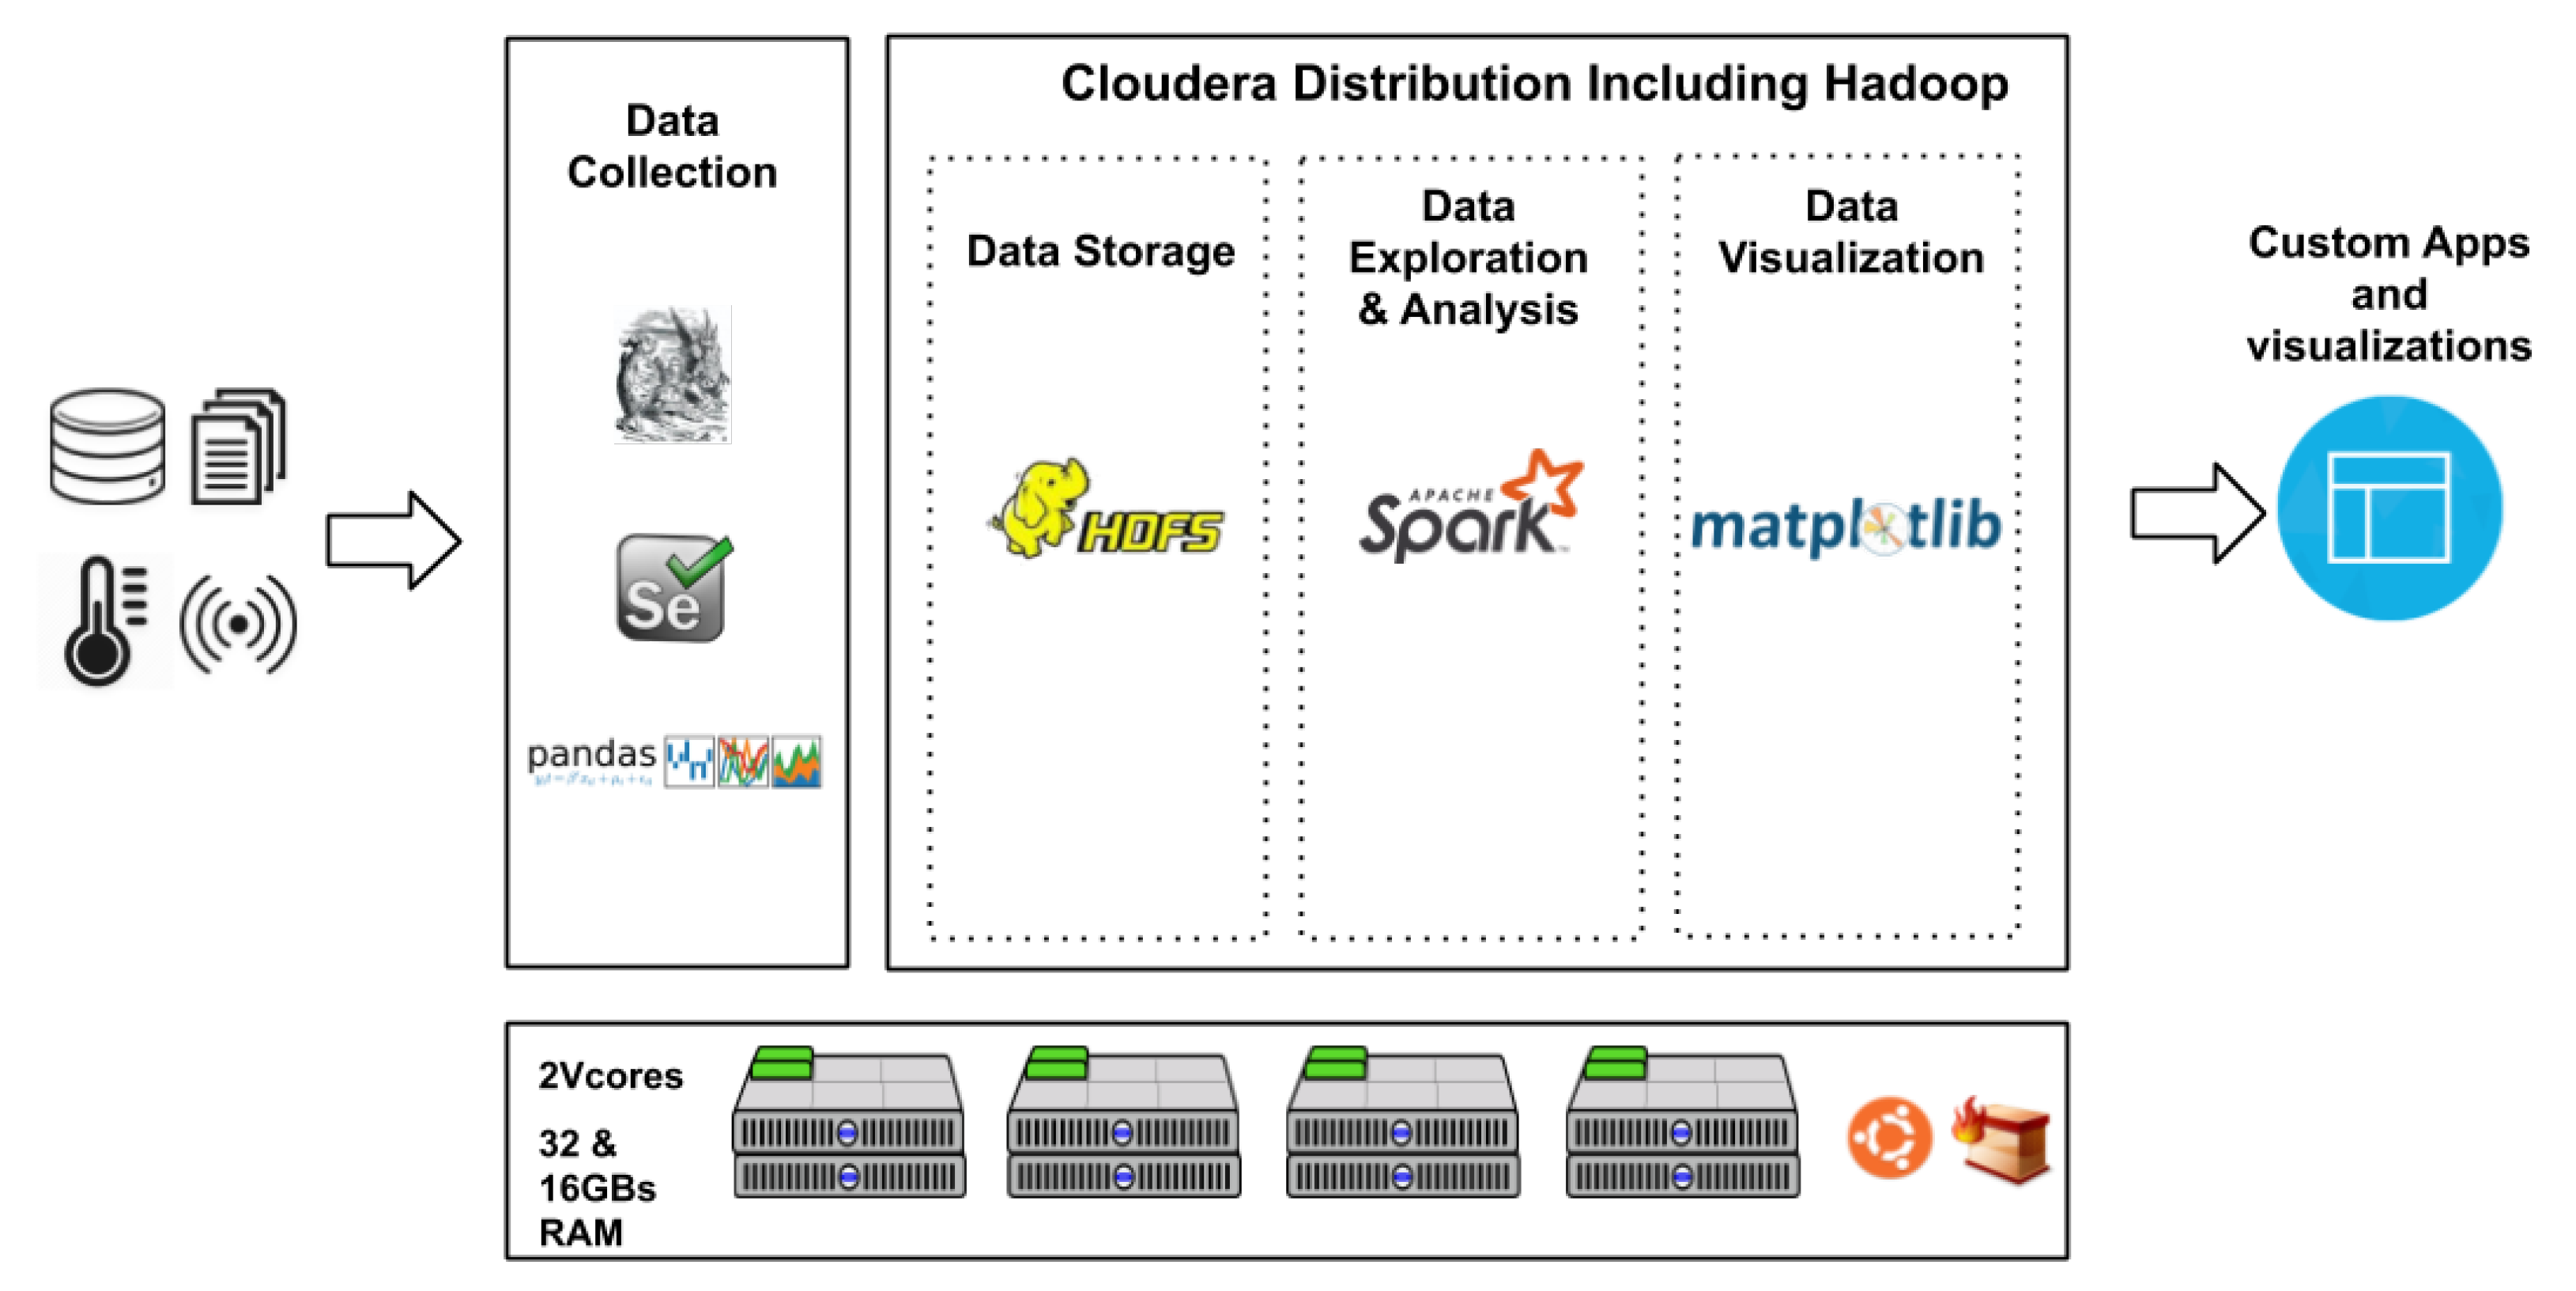
  • Integrate concept drift detection methods with time series prediction models (check Figure 1);
  • Implement time series prediction models integrated with concept drift detection to real-world datasets (refer to item 4);
  • Results analysis.

3.1. Concept Drift Detection Methods

The Page Hinckley Test (PHT) [4] is an alteration of CUSUM [4] and it allows to effectively detect changes in the data, see Section 2.2.1. In this method, a user-defined threshold (allowed magnitude of change) is passed along with input parameter to detect the change in the data [70]. When the mean of new observations exceeds the defined threshold, an alarm is triggered that concept drift has been detected. However, unlike ADWIN [15], DDM [4], and EDDM [67], it does not detect warning zone (i.e., when new observations are close to the threshold).
The Adaptive Windowing (ADWIN) algorithm uses sliding window for detecting the concept drift present in the data [46]. ADWIN requires re-scaling, since the input data sequence is bound to [0, 1] [4]. ADWIN slides a fixed window for detecting the change on the newly arriving data. Whenever, two sub-windows show distinct means in the new observations the older sub-window is dropped. This is done by using Hoeffding bound [4]. The alarm for the detection of concept drift is triggered through a user-defined threshold. If the absolute difference between the two means exceeds the pre-defined threshold, an alarm is generated that concept drift is detected. Furthermore, if the threshold is not exceeded but the value is close to it, a warning alert is triggered [46].
The Drift Detection Method (DDM) is a concept drift method based on the assumption of Probably approximately correct (PAC) learning model. In PAC learning model, if the distribution of the samples is stationary, the error rate of the learner will decrease with the increase in number of the samples [4]. In addition, if the distribution of samples is infinite, the error will be likely bayes error [4]. The DDM detects increase in the error rate, that exceeds the computed threshold, it alerts that concept drift has been detected. A warning zone is detected if the error rate is not exceeded but it can happen in future [4]. The threshold is computed based on two statistics methods, when sum of recorded error rate and standard deviation is minimum, that is, (i) if p i + s i p m i n +2× s m i n (ii) if p i + s i p m i n +3× s m i n , where p is the error rate, i instance, s standard deviation [4].
The Early Drift Detection Method (EDDM) has been developed on the premise of DDM and considers the average distance between two errors instead of keeping track of only the number of errors [67]. In EDDM, it is essential to follow the running distance and running standard deviation, maximum distance and maximum standard deviation of the errors [67]. Just like in DDM, two threshold values are computed to create the borderline between no concept drift, warning zone, and concept drift detected. The method for computing warning zone threshold is: if ( p i +2× s i )/( p m a x +2× s m a x ) < α , where p i is running average distance between two errors and s i is running standard deviation. The examples beyond the defined threshold are stored in advance to tackle the possible concept drift in future. Whereas, if ( p i +2× s i )/( p m a x +2× s m a x ) < β , the examples beyond this condition exhibit that concept drift is detected. In such case, the learner is retrained for adaptation and p m a x and s m a x are reset as well [67].

3.2. Datasets

For testing the implementation of concept drift methods in distributed environment, two artificial datasets are built: one uses Gaussian Process with Matern kernel 3/2 [71] for abrupt drift detection and other one with Sinusoidal signal [72] enriched with red noise for gradual drift detection. Then, we utilize implemented algorithms with two real world datasets: ELEC2 [73] and Fingrid [74].
The ELEC2 dataset [73] includes scheduled electricity flow between different states in Australia and is based on real-world readings. This dataset contains 45,312 records, from 7 May 1996 to 5 December 1998. Each instance of dataset represents a 30 min period, resulting in 48 data instances for each day. The occurrence of the drift in the data is unknown [4].
The Fingrid dataset is a real-world streaming dataset about power consumption in Finland provided by Fingrid company [74], responsible for the electricity transmission in the high-voltage transmission system in Finland. The data used in this article includes timestamps and power consumption rate fluctuating based on country wide demand. This data is updated every 3 min. We have also collected historical data from January 2011 till December 2017 for training purpose and January 2018 to April 2020 for testing purpose.

3.3. Models

In this work, we use three different time series models: Trigonometric, Box-Cox transform, ARMA errors, Trend, and Seasonal components model (TBATS) [75], Prophet [76], and Long Short-Term Memory (LSTM) [77].
TBATS is one of the innovations in the state space modeling frameworks, designed for handling complex time dependent data series [75]. It uses Fourier terms combined with exponential smoothing and Box-Cox transformation in automated fashion. Due to the trigonometric functions in TBATS, it provides the capabilities to model non-integer seasonal frequencies [75].
Some of the main advantages of TBATS are: (i) it can handle non-linearity present in features using Box-Cox transformation (ii) it detects any auto-correlation present in the residuals using ARMA and (iii) and it is capable of accommodating both nested and non-nested seasonal components in time series [75]. Its applications can be seen in some of recent studies [78], such as modelling electricity load demand [79] or seasonality of pathogens [78].
Prophet is a forecasting tool developed by Facebook based on Generalized Additive Models (GAM) [76,80]. It comprehends the provided time series as a curve-fitting task without explicitly considering the temporal dependency. In addition, decomposable time series model is used to characterize the time series with model components trend and seasonality [76,80,81]. The available options to accommodate multiple seasonality factors and demand for effective forecasting favoured for considering Prophet for our analysis.
The main advantages of this model include: (i) observations do not need to be interpolated, regularly spaced, and no additional requirement for removing outliers, and (ii) model fitting is fast and in case of complex time series, different parameters (e.g., seasonality) are easily interpretable [76,81].
Long Short-Term Memory (LSTM) was proposed to tackle the vanishing gradient problem in Recurrent Neural Networks (RNNs) [77]. RNNs have long standing in data-driven based time series prediction approaches [82]. They work on a sequence-based process to analyse information by capturing each time step for predictions. Despite their capabilities to understand short-term dependencies, they are not well-suited for data with long-term dependencies. There are different variations of LSTM available, one of them is Bidirectional LSTM (BLSTM), where both preceding and succeeding data sequences are utilized to exploit the input to achieve effective learning process [83].
Among many neural network methods, LSTM and gated recurrent units (GRU) are the commonly adopted for both regression and classification tasks [84]. Both approaches allow to model and learn complex information from sequential data.

3.4. Evaluation

In order to evaluate the performed experiments, both artificial and real-world data sets have been used (refer to Section 3.2). To measure the performance of the selected concept drift algorithms, we supply these algorithms with data streams from synthetic data sets which have been injected with concept drifts (abrupt and gradual) at known indices. We use this as a metric to evaluate whether the algorithms are capable of detecting concept drift in data. More details are provided in Section 4.1. Subsequently, real-world data is streamed to concept drift detection algorithms integrated with time series learner. The results from this method are evaluated using mean absolute percentage error (MAPE) = 100 n t = 1 n | x t y t | x t % , where x t are original observations and y t predicted values. Finally, performance of the method is evaluated by comparing the original observations and predicted values against each for each method; details are mentioned in Section 4.2.

3.5. Architecture

To accumulate, store, and process large-scale heterogeneous data we utilize the distributed architecture proposed by [19], see Figure 2. It contains a master node with 32 GBs of RAM and 3 worker nodes with 16 GBs of RAM and 100 GBs of disk space each. It relies on Hadoop ecosystem, where the data is collected from APIs and web interfaces using Python-based libraries Beautifulsoup [85], Selenium [86] and Pandas [87]. In data collection, Pandas [87] and Beautifulsoup [85] are used to read responses from APIs, HTML pages, and csv files. However, Selenium is utilized for crawling data when it is available on child pages of a web page or it requires navigation in between pages, for example, data from Fingrid [74] can be read from API or can be downloaded directly by interacting with web page using Selenium [86]).For data storage, Hadoop Distributed File System (HDFS) is used. Tasks related to data pre-processing, data exploration, and data analysis are done using Apache Spark with PySpark [34]. Data visualization is performed using matplotlib [19], also custom application and visualization widgets are supported.

4. Results

This section focuses on the results obtained. The experiments to detect and implement the concept drift adaption within distributed architecture were described in Section 3.

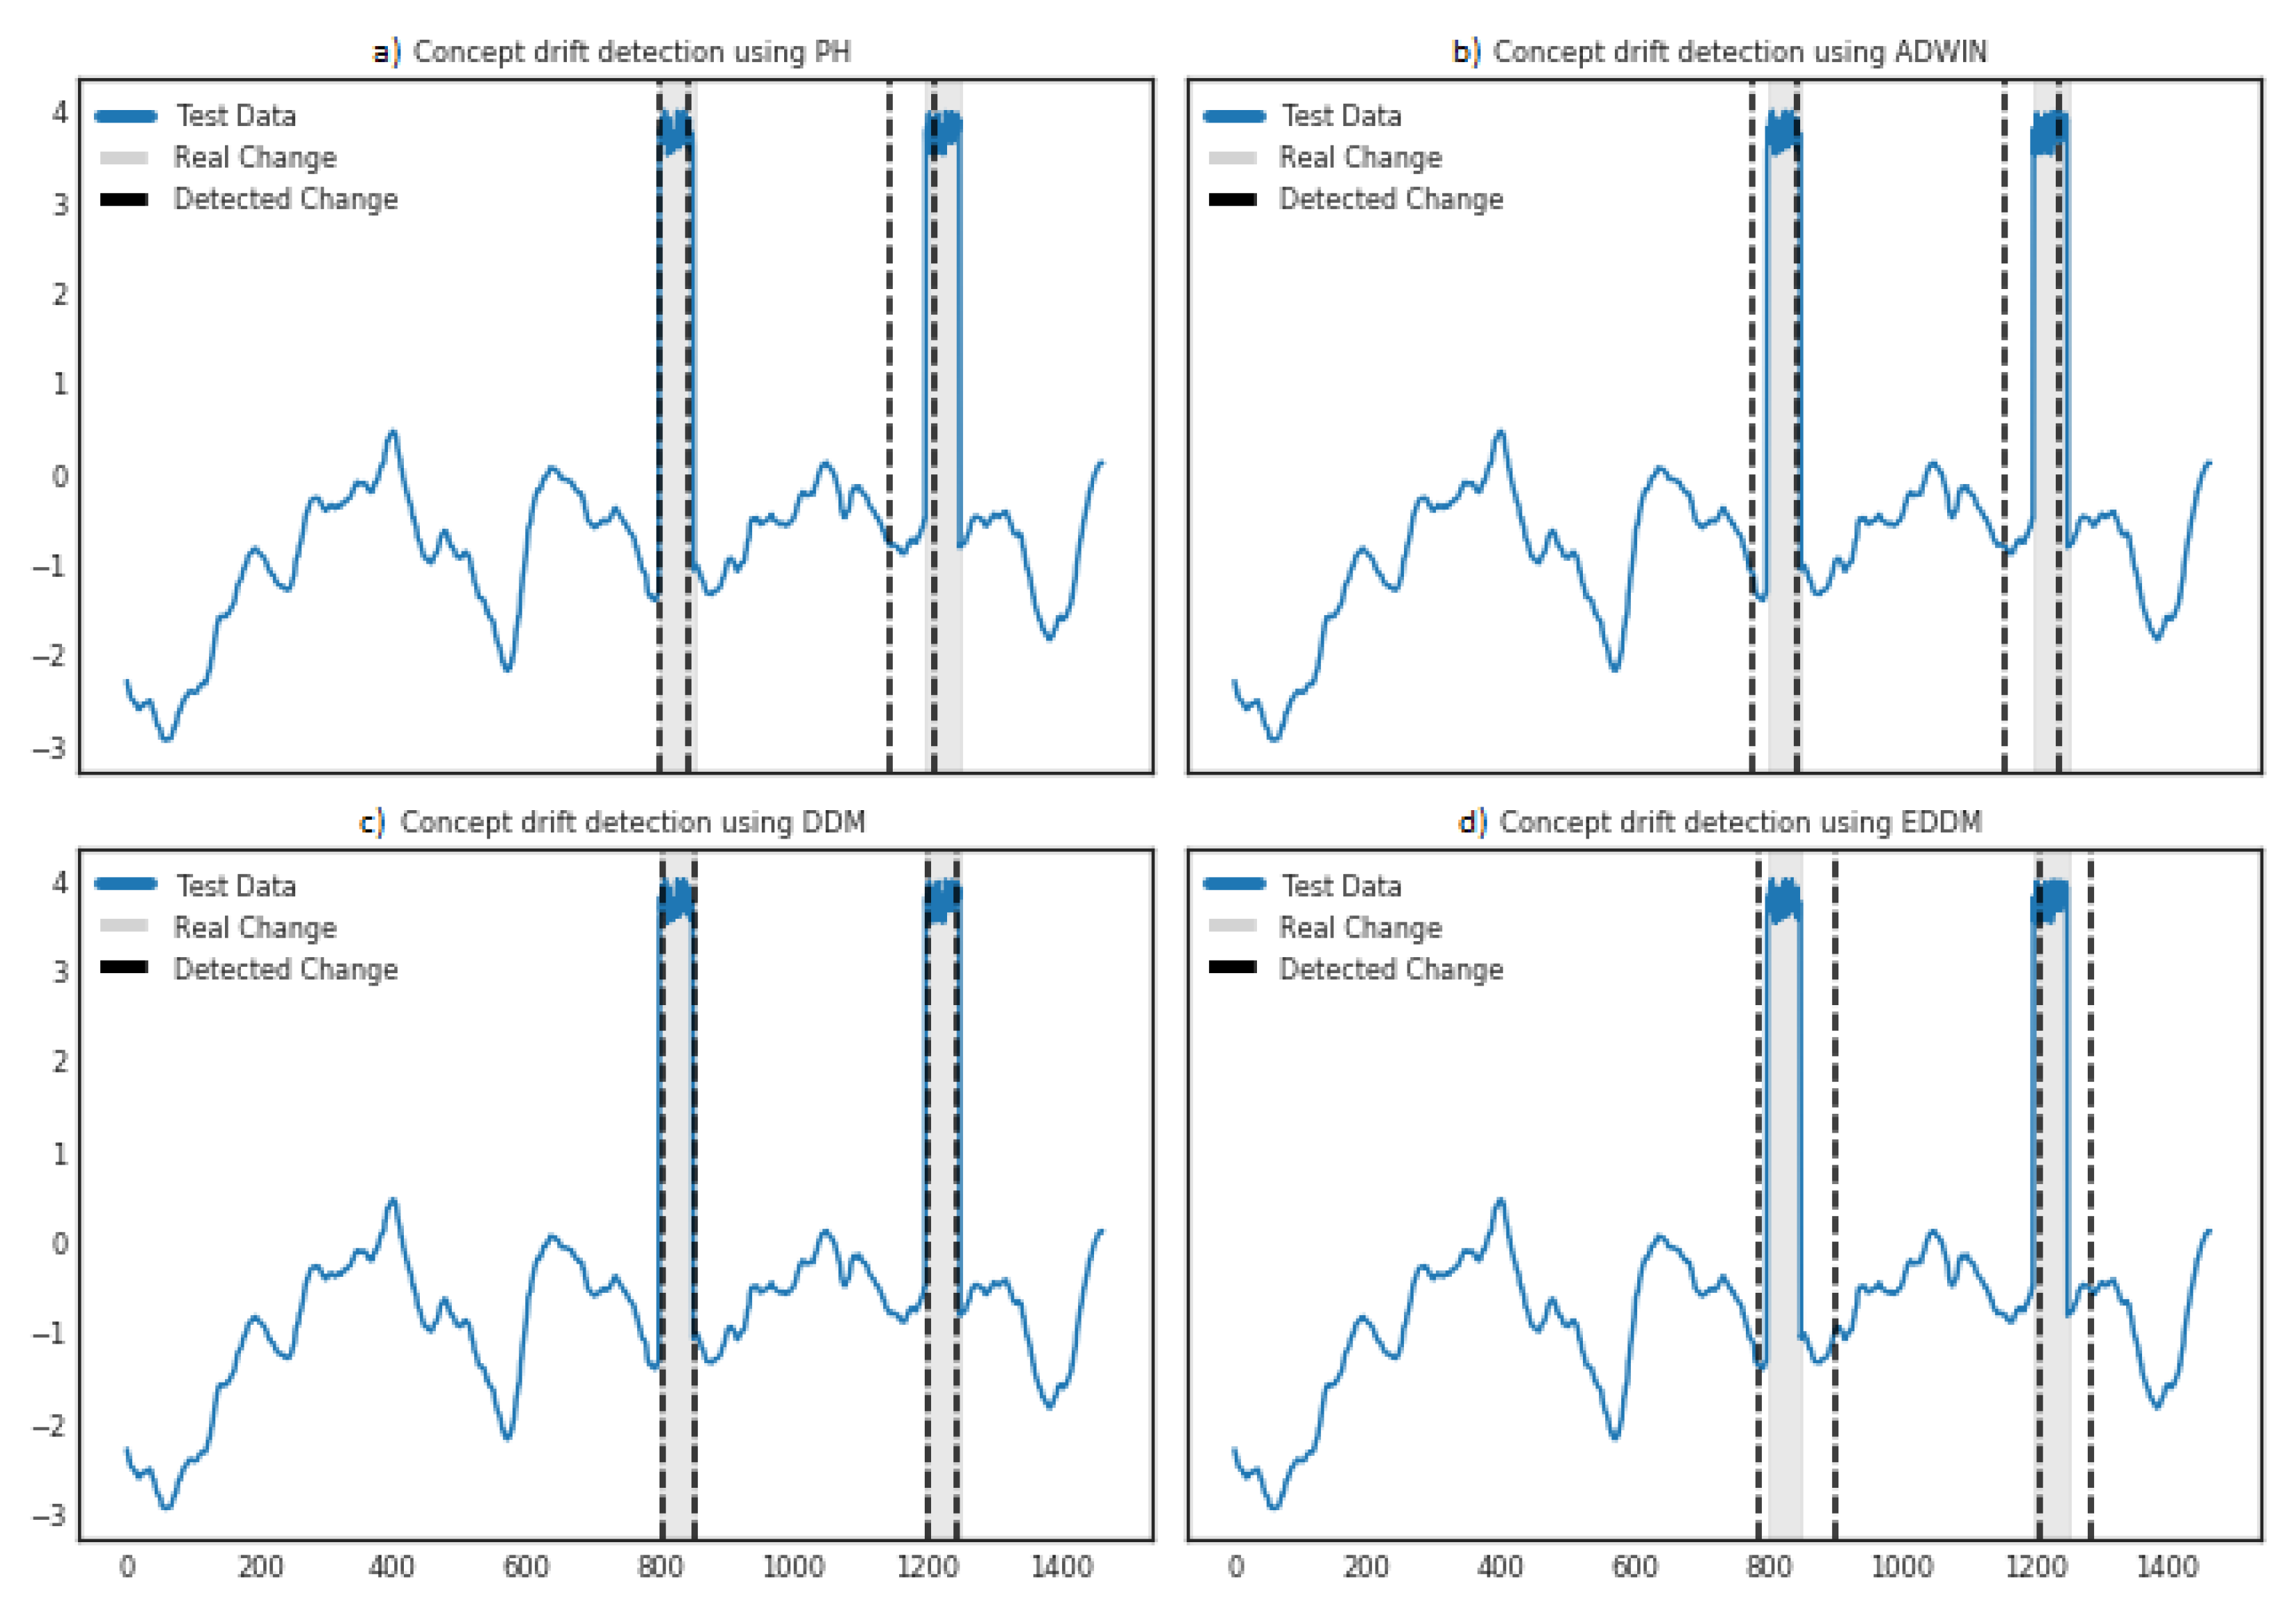
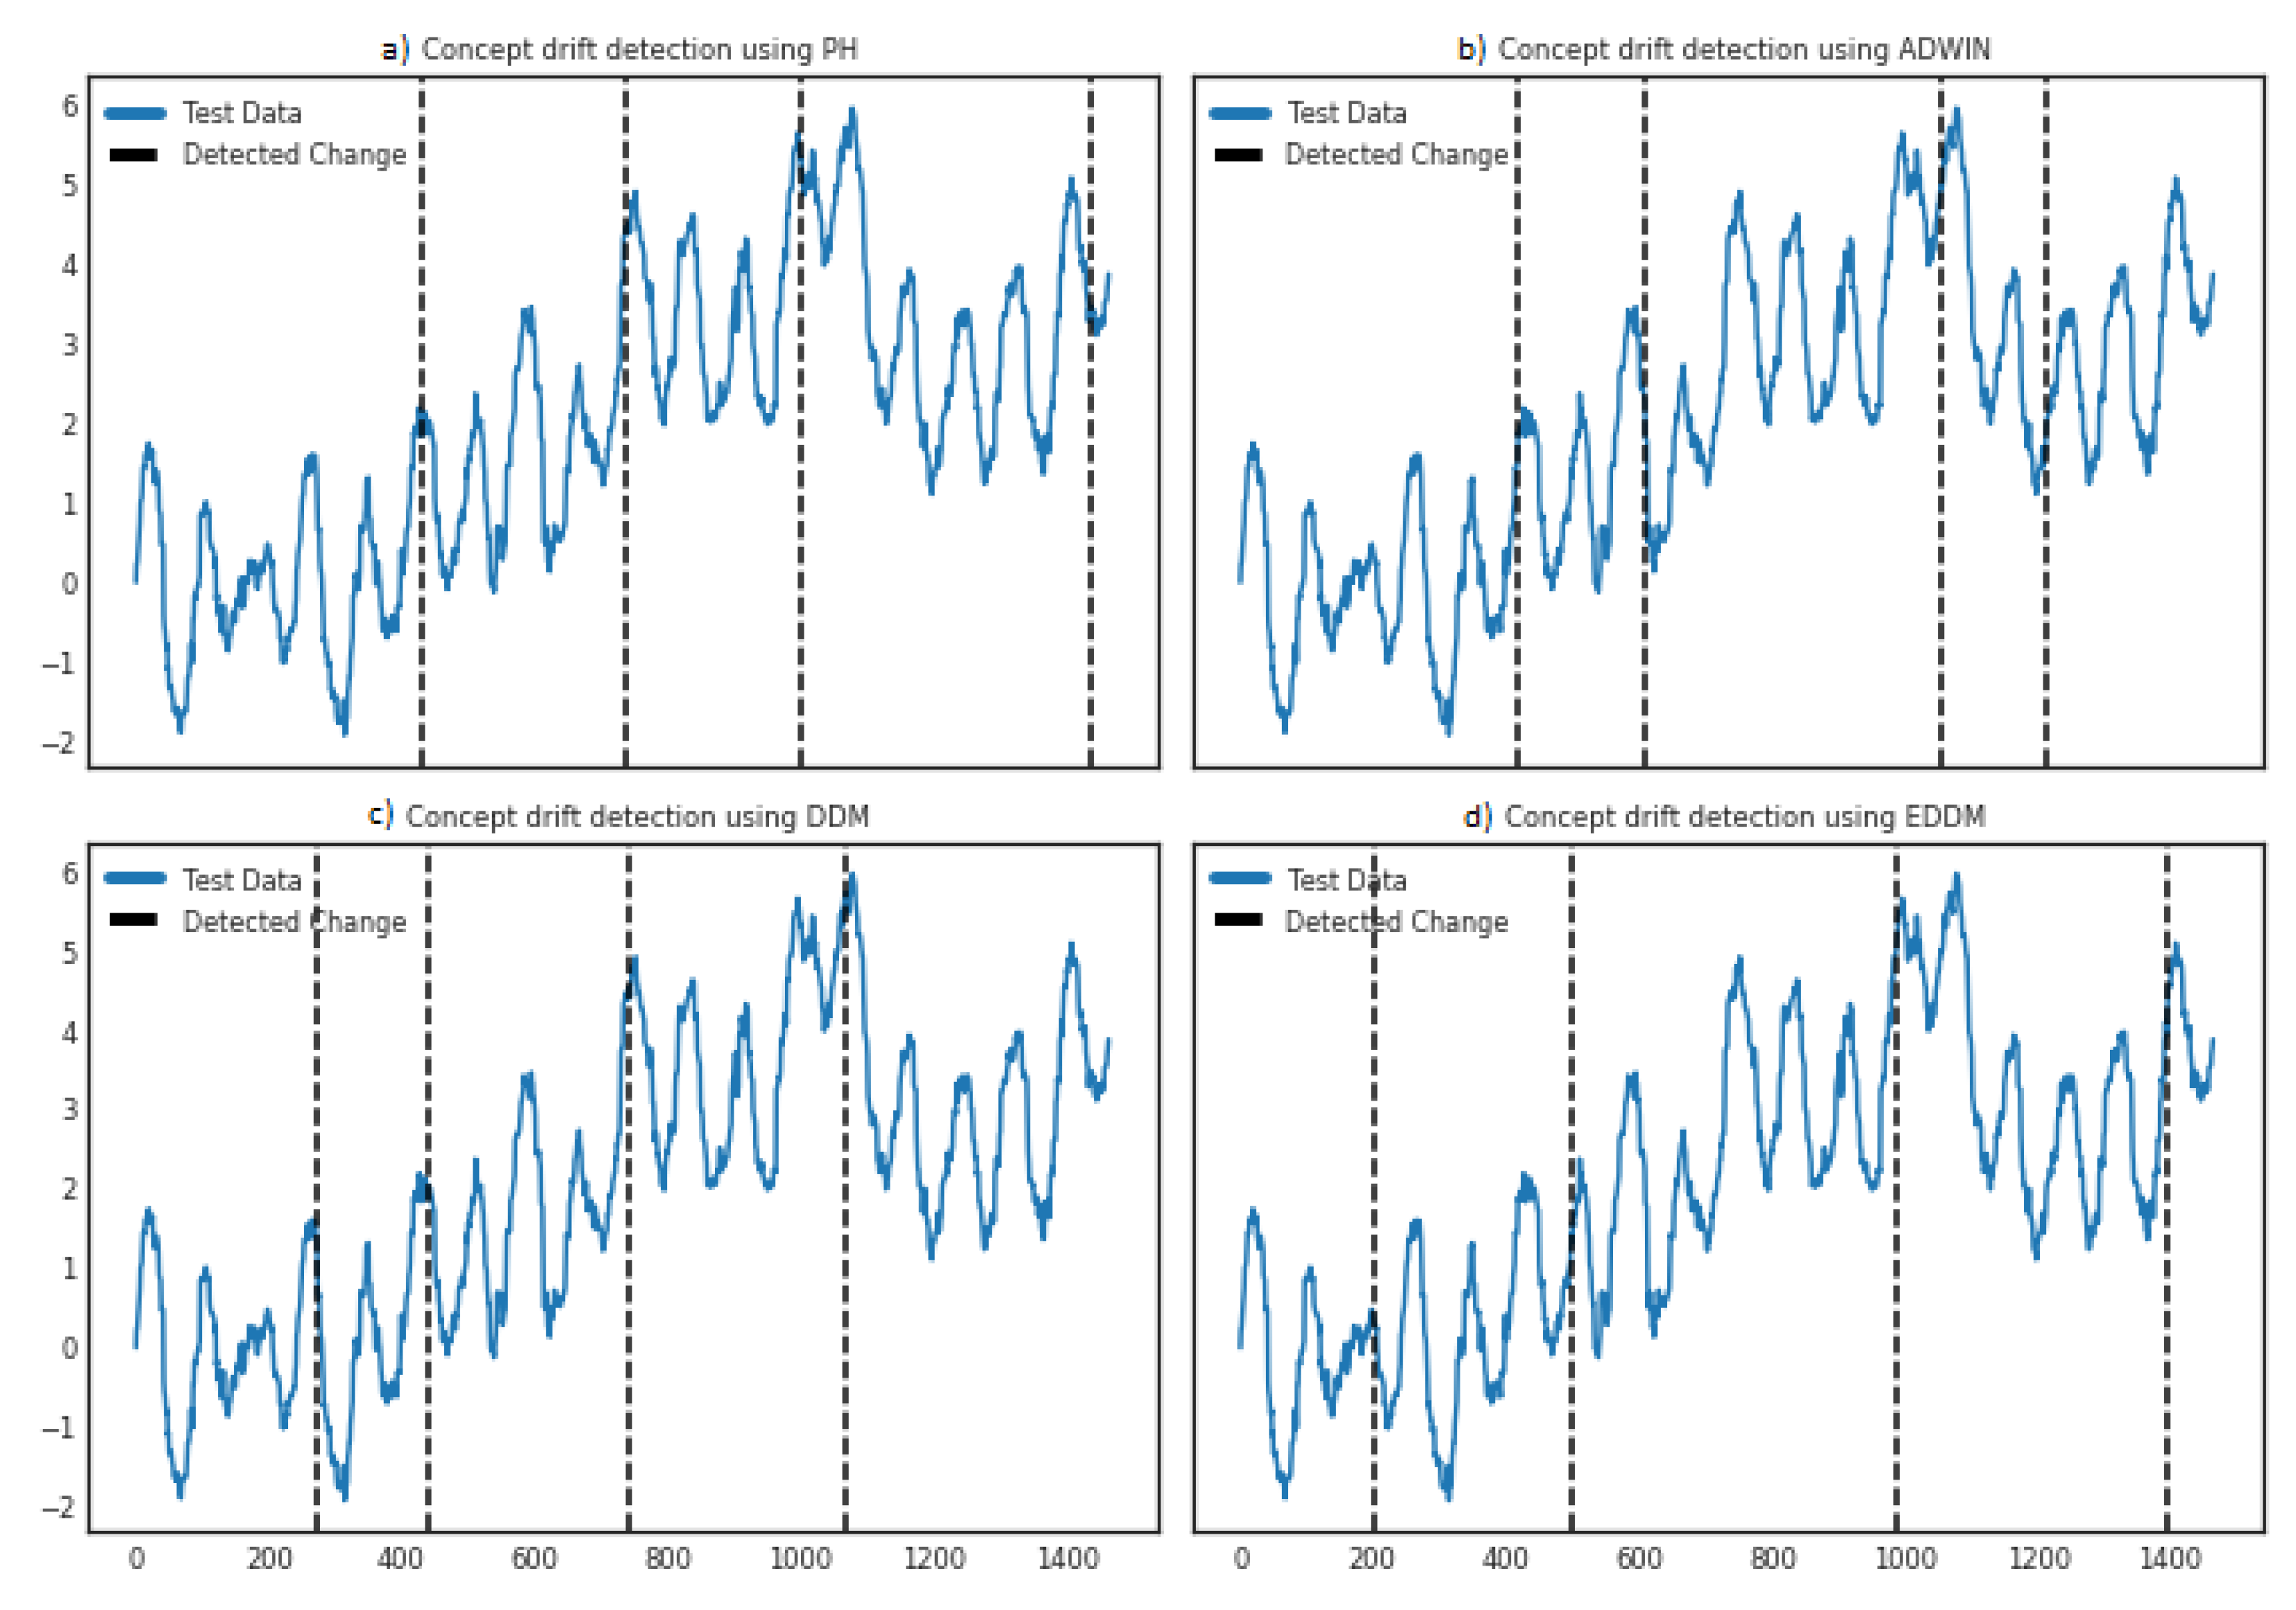
4.1. Implementation Evaluation Using Synthetic Datasets

For this evaluation, two different synthetic regression time series datasets were constructed, see Section 3.2. Concept drift is induced in both of them up to known indices. We then test the performance of four different concept drift detection algorithms (see Section 3.1) implemented in distributed environment using Apache Spark [34].
Abrupt drift detection. Gaussian Proccess with Matern Kernel 3/2 was used to synthesize a dataset to experiment with abrupt drift [71]. The data stream is induced with drift at two different sample ranges—from sample 799 to 850; and from sample 1199 to 1250, see Figure 3. All four implemented concept drift detection algorithms are supplied with this synthetic time series as a data stream. The following settings are used after performing preliminary tests: the minimum number of instances passed to each method is n = 100, Δ = 0.005, threshold for detection ( λ = 1), forgetting factor ( α = 1–0.0001) for the PHT. The parameters for ADWIN are set with Δ = 0.005 and use fixed window setting within the range where drift is expected. For DDM, warning level is set to w = 0.9 and drift control level t = 1, whereas for EDDM α and β are set to 0.9 and 1 respectively. For ADWIN, we first scale the data and then take out the sample indices to be plotted on actual data. The results, illustrated in Figure 3, show that most of the algorithms were able to detect the induced drift in the first sample range. However, the ADWIN and DDM performed better in detecting the drift occurring later, between 1199–1250 sample values. Based on the results retrieved, we verify the correct implementation of drift detection algorithms in distributed environment using Apache Spark.
Gradual drift detection. Harmonic sinusoidal signal [72] is used to synthesize the data for gradual drift detection. The drift induced consists of a steady increase that starts from index 190 and continues till 1060, and then declines again steadily; after that, the gradual drift once more starts from sample 1200, see Figure 4. All the four implemented methods were supplied with this dataset to test if they are able to detect the gradual drift. Here, the settings for the algorithms after initial testing are as follows: the minimum number of instances passed to each method is n = 100, Δ = 0.005, threshold for detection ( λ = 2.5), forgetting factor ( α = 1–0.0001) for the PHT. We use Δ = 0.005 with fixed window setting within the range where drift is expected for ADWIN. For DDM warning level is set to w = 1.5 and drift control level t = 2.5, whereas for EDDM α and β are set to 1.5 and 2.5. The data was scaled for ADWIN and the detected sample indices were used to create a visualization.
The results in Figure 4 show that the PHT and DDM were able to detect the change between those known change points. However, the last incremental change starting from 1200 was not detectable for DDM. EDDM was also able to capture the gradual drift, although the change detected in the last changing sample, which was expected between 1200–1300 indices, occurred at 1395 index. ADWIN also seems to perform good; however, the detection gap between second and third detected change is large, requiring more optimized window settings. The shortcomings in DDM and EDDM are understandable due the design essence for typical classification models. Therefore, the result shows that Apache Spark implementation is able to detect gradual drift in data.

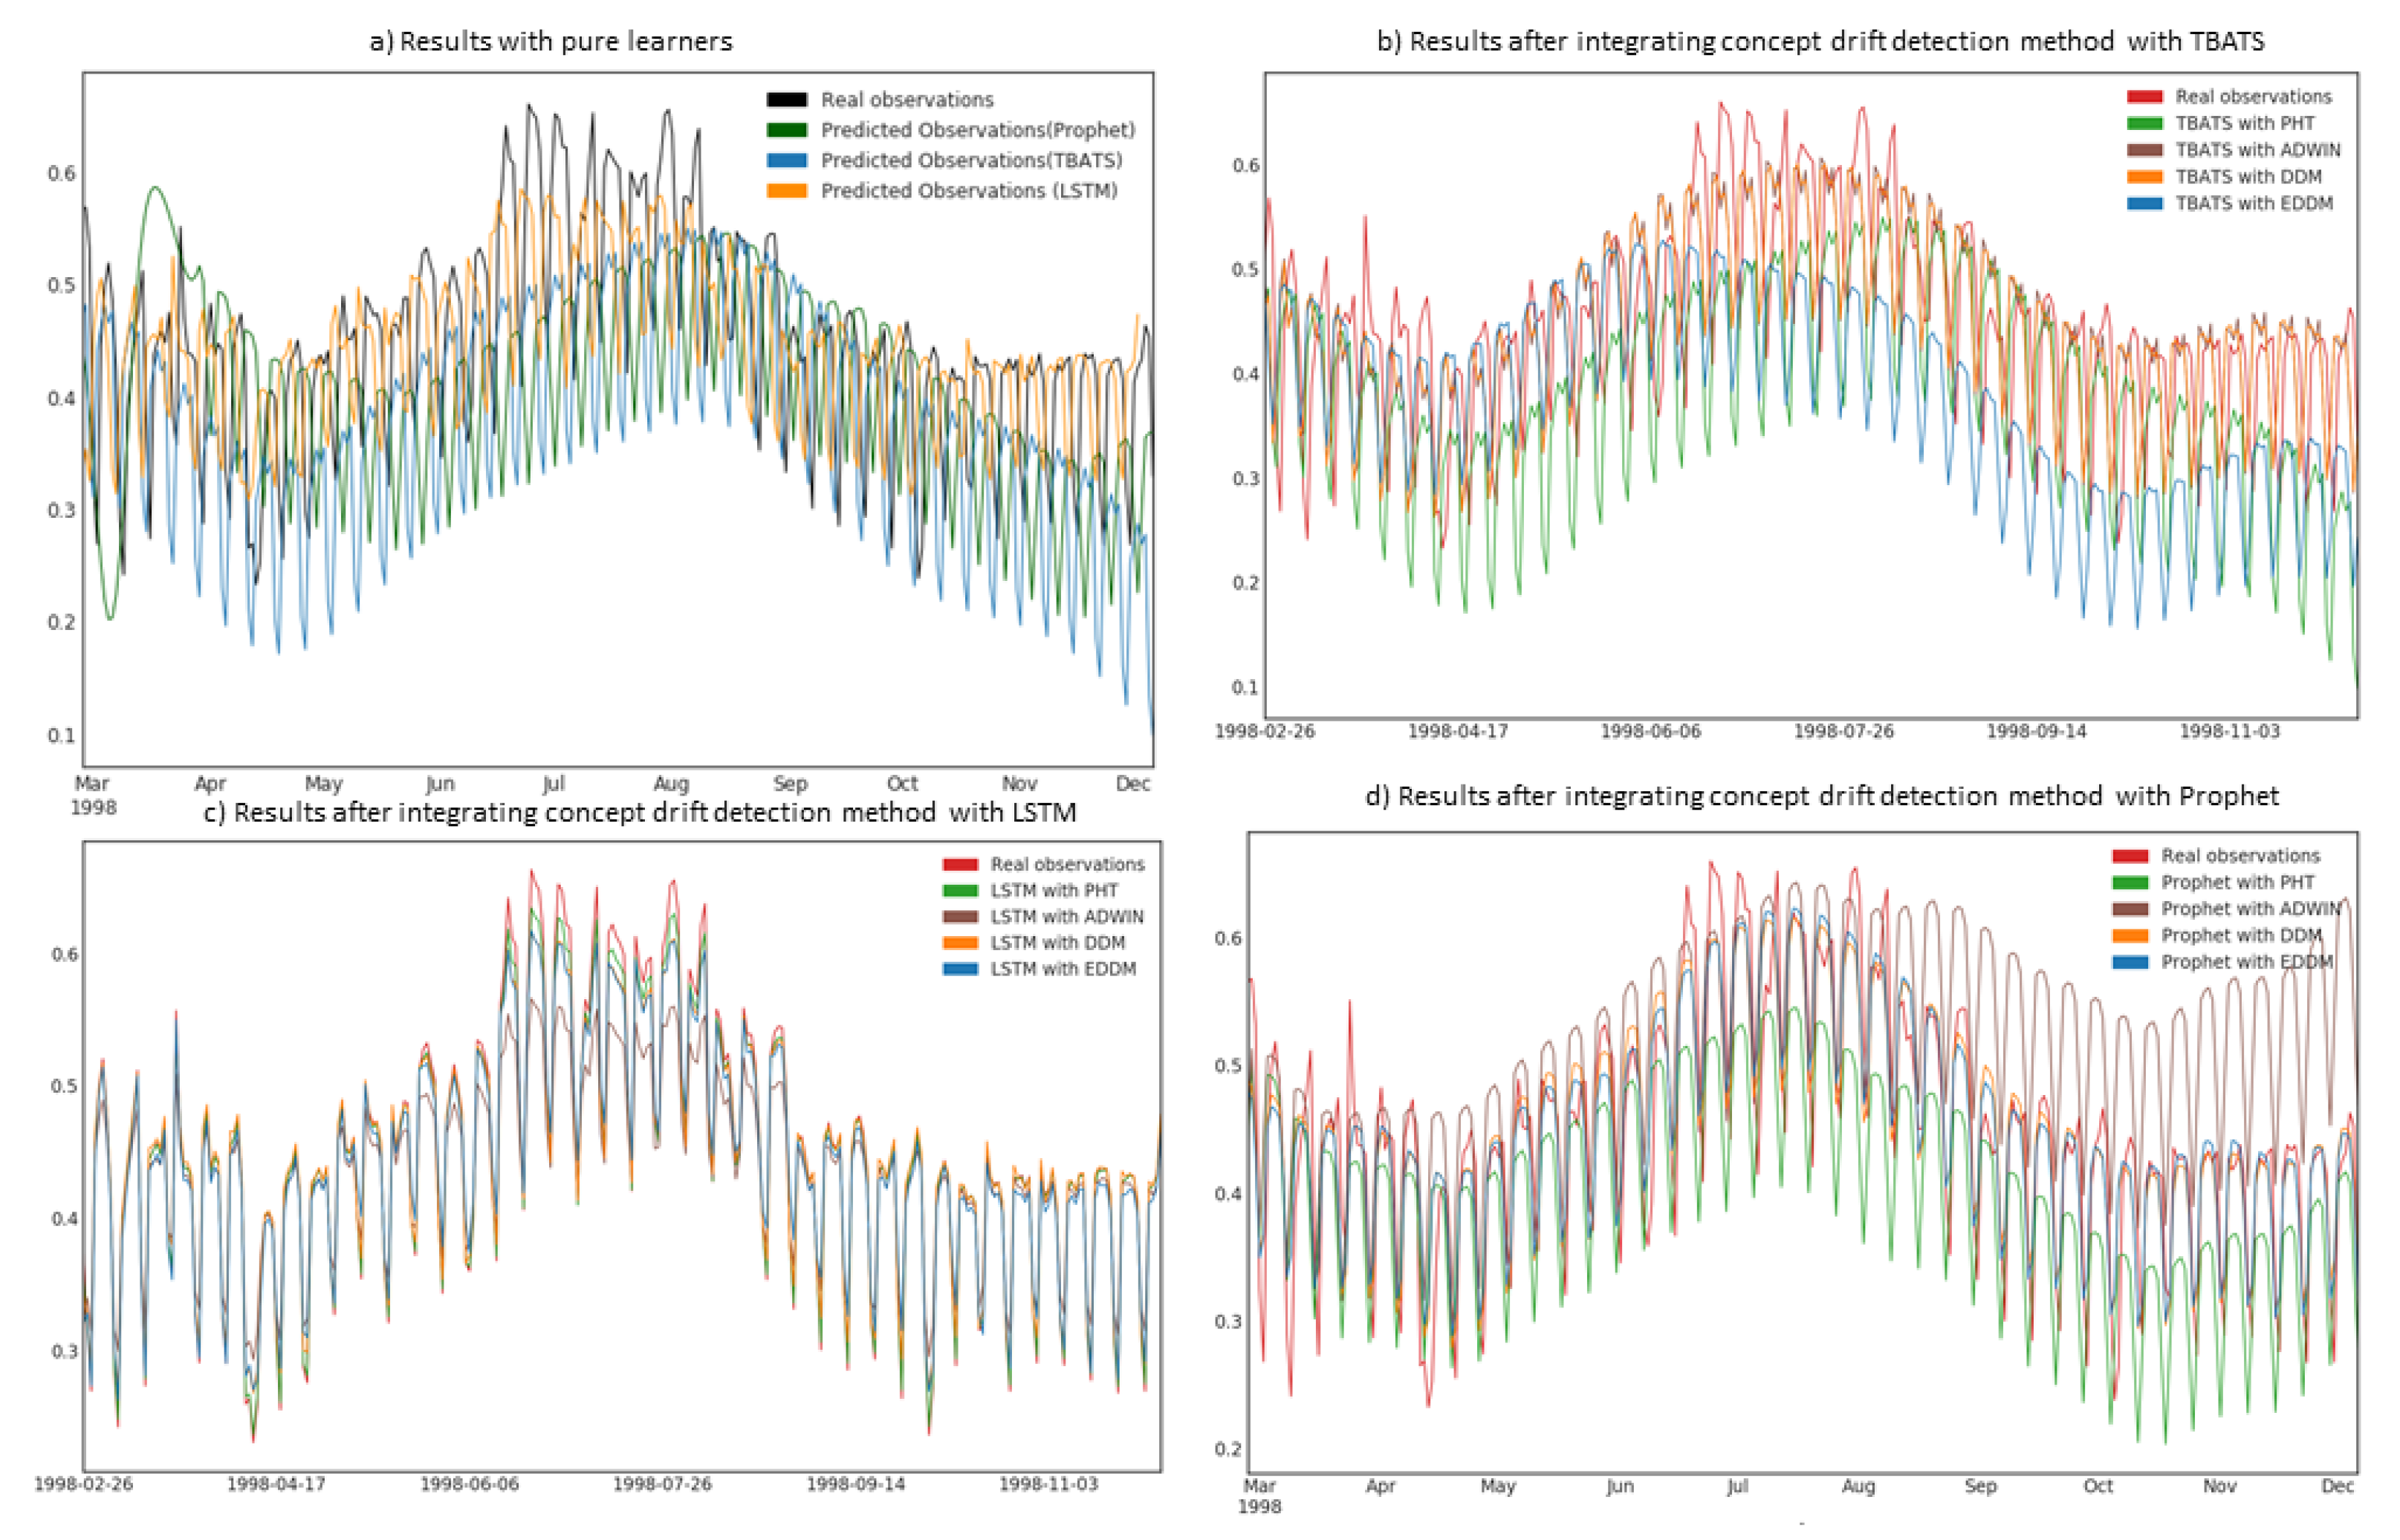
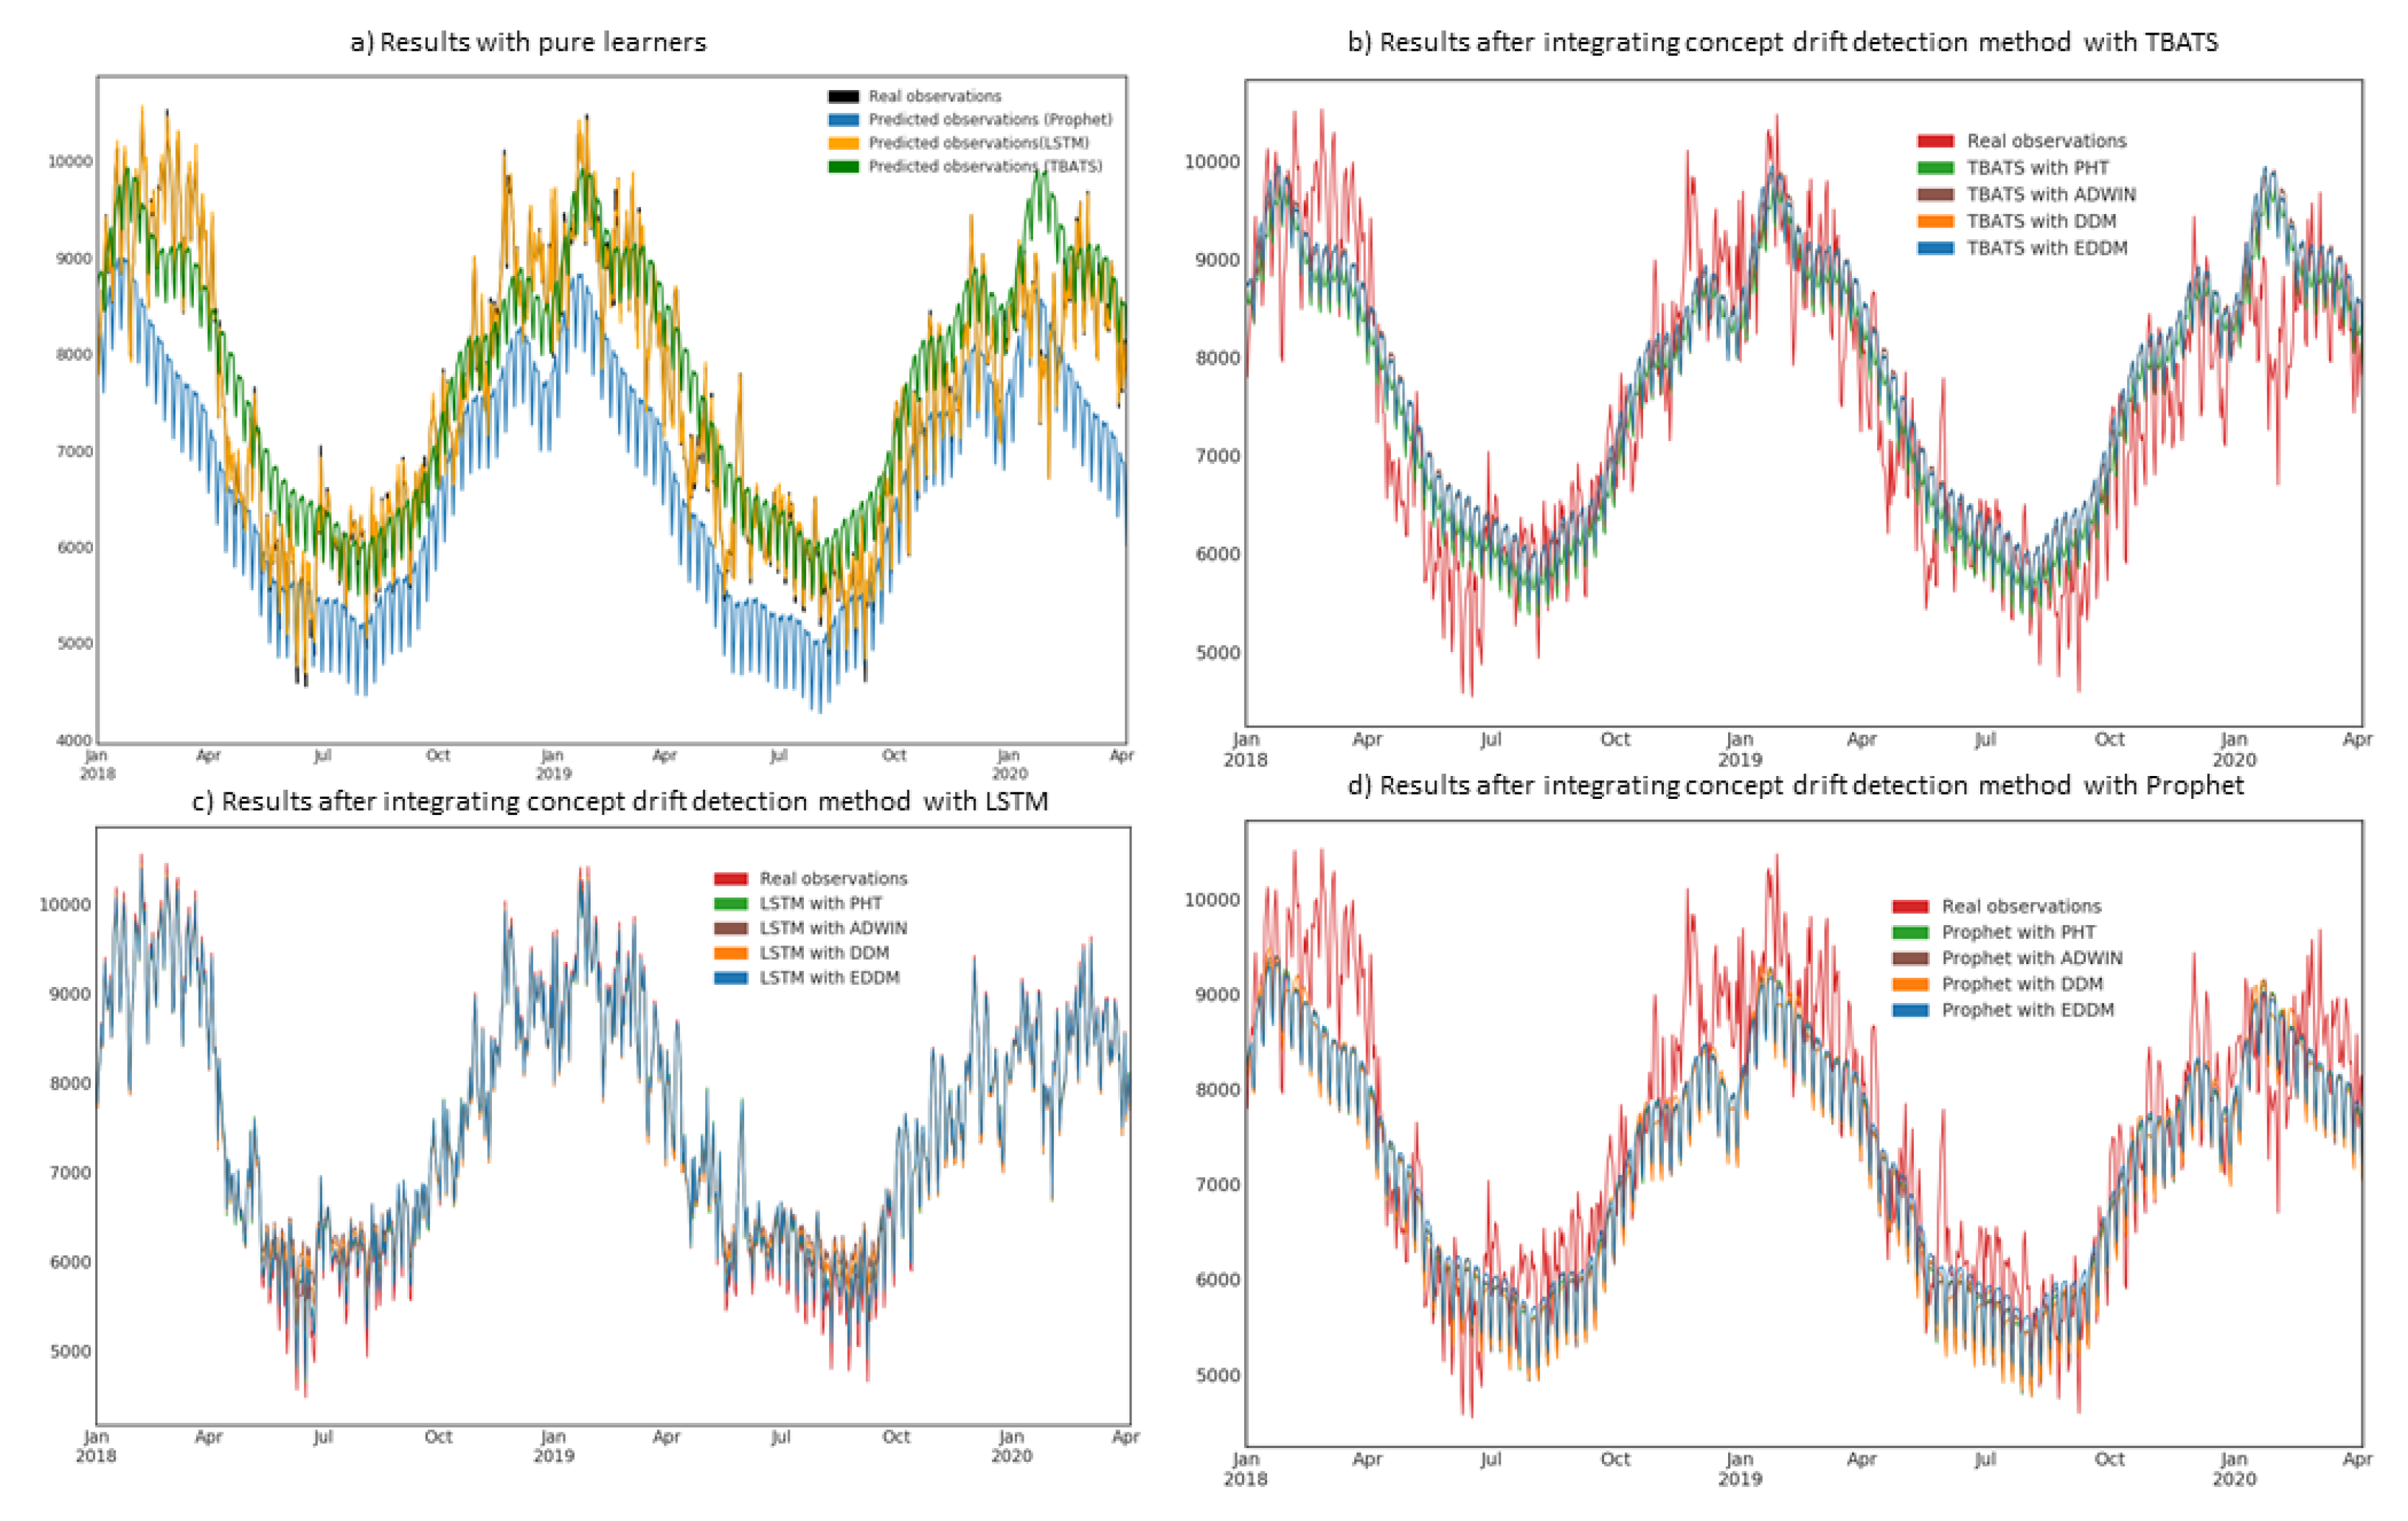
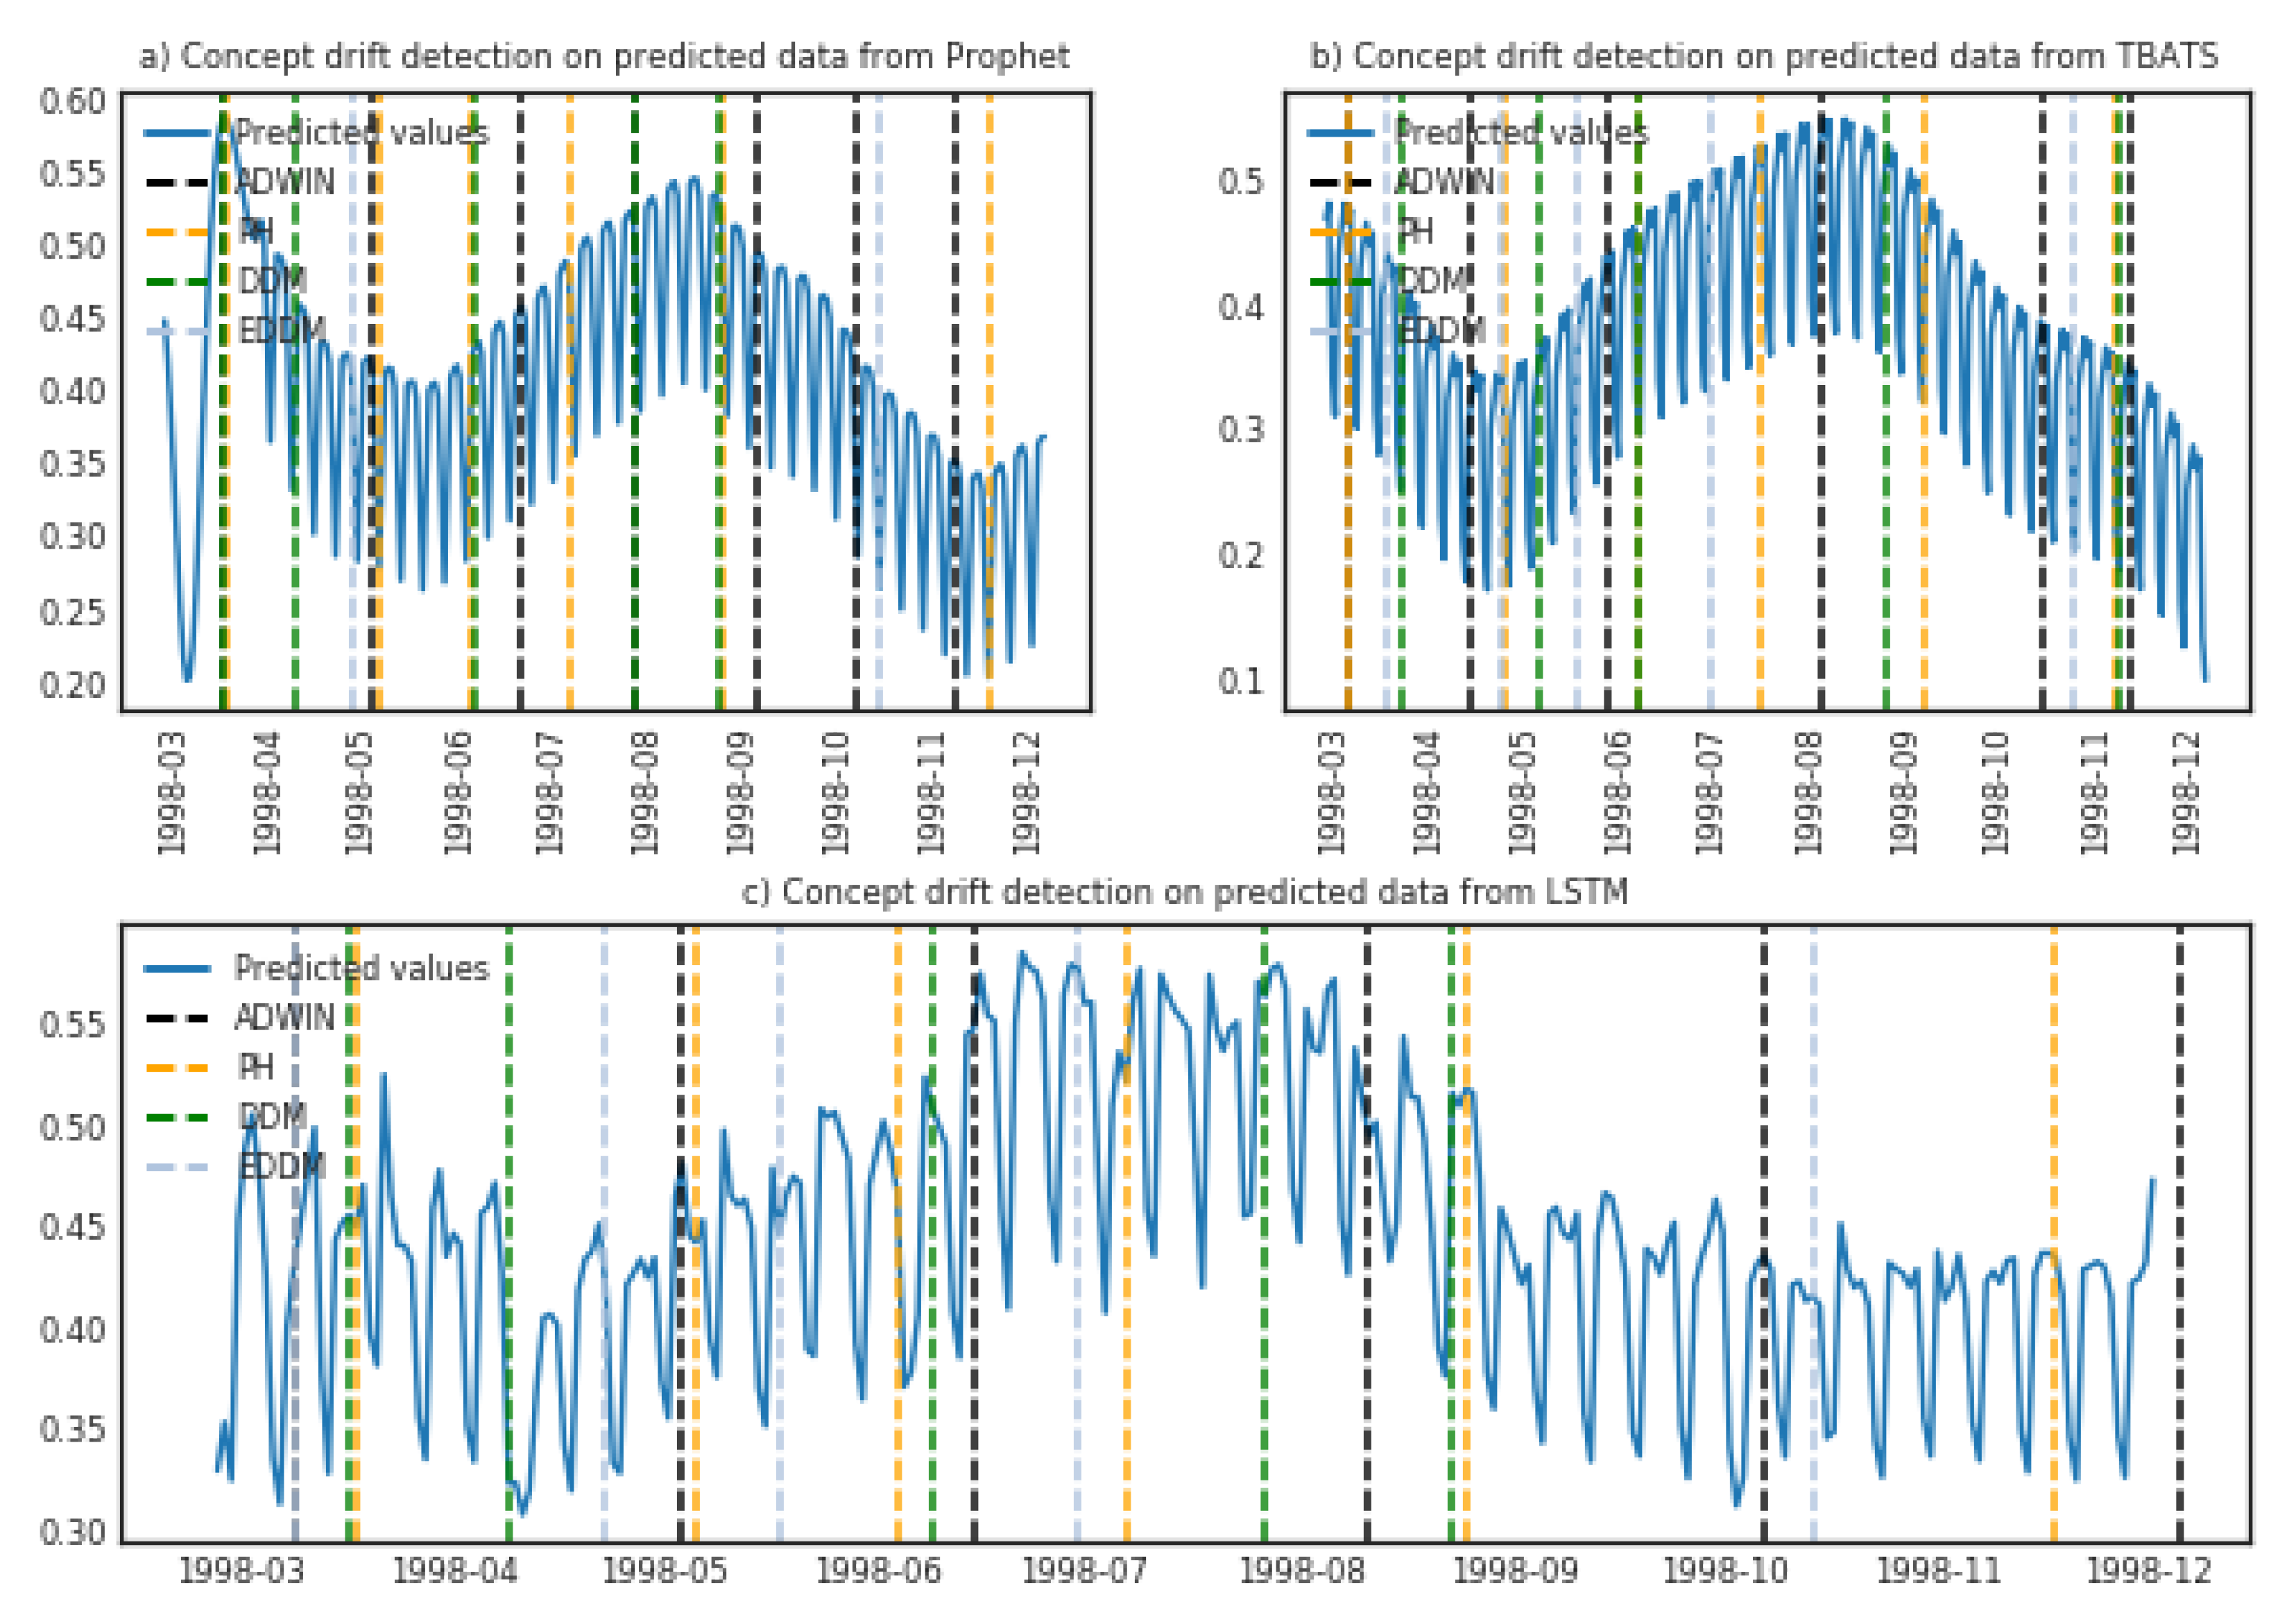
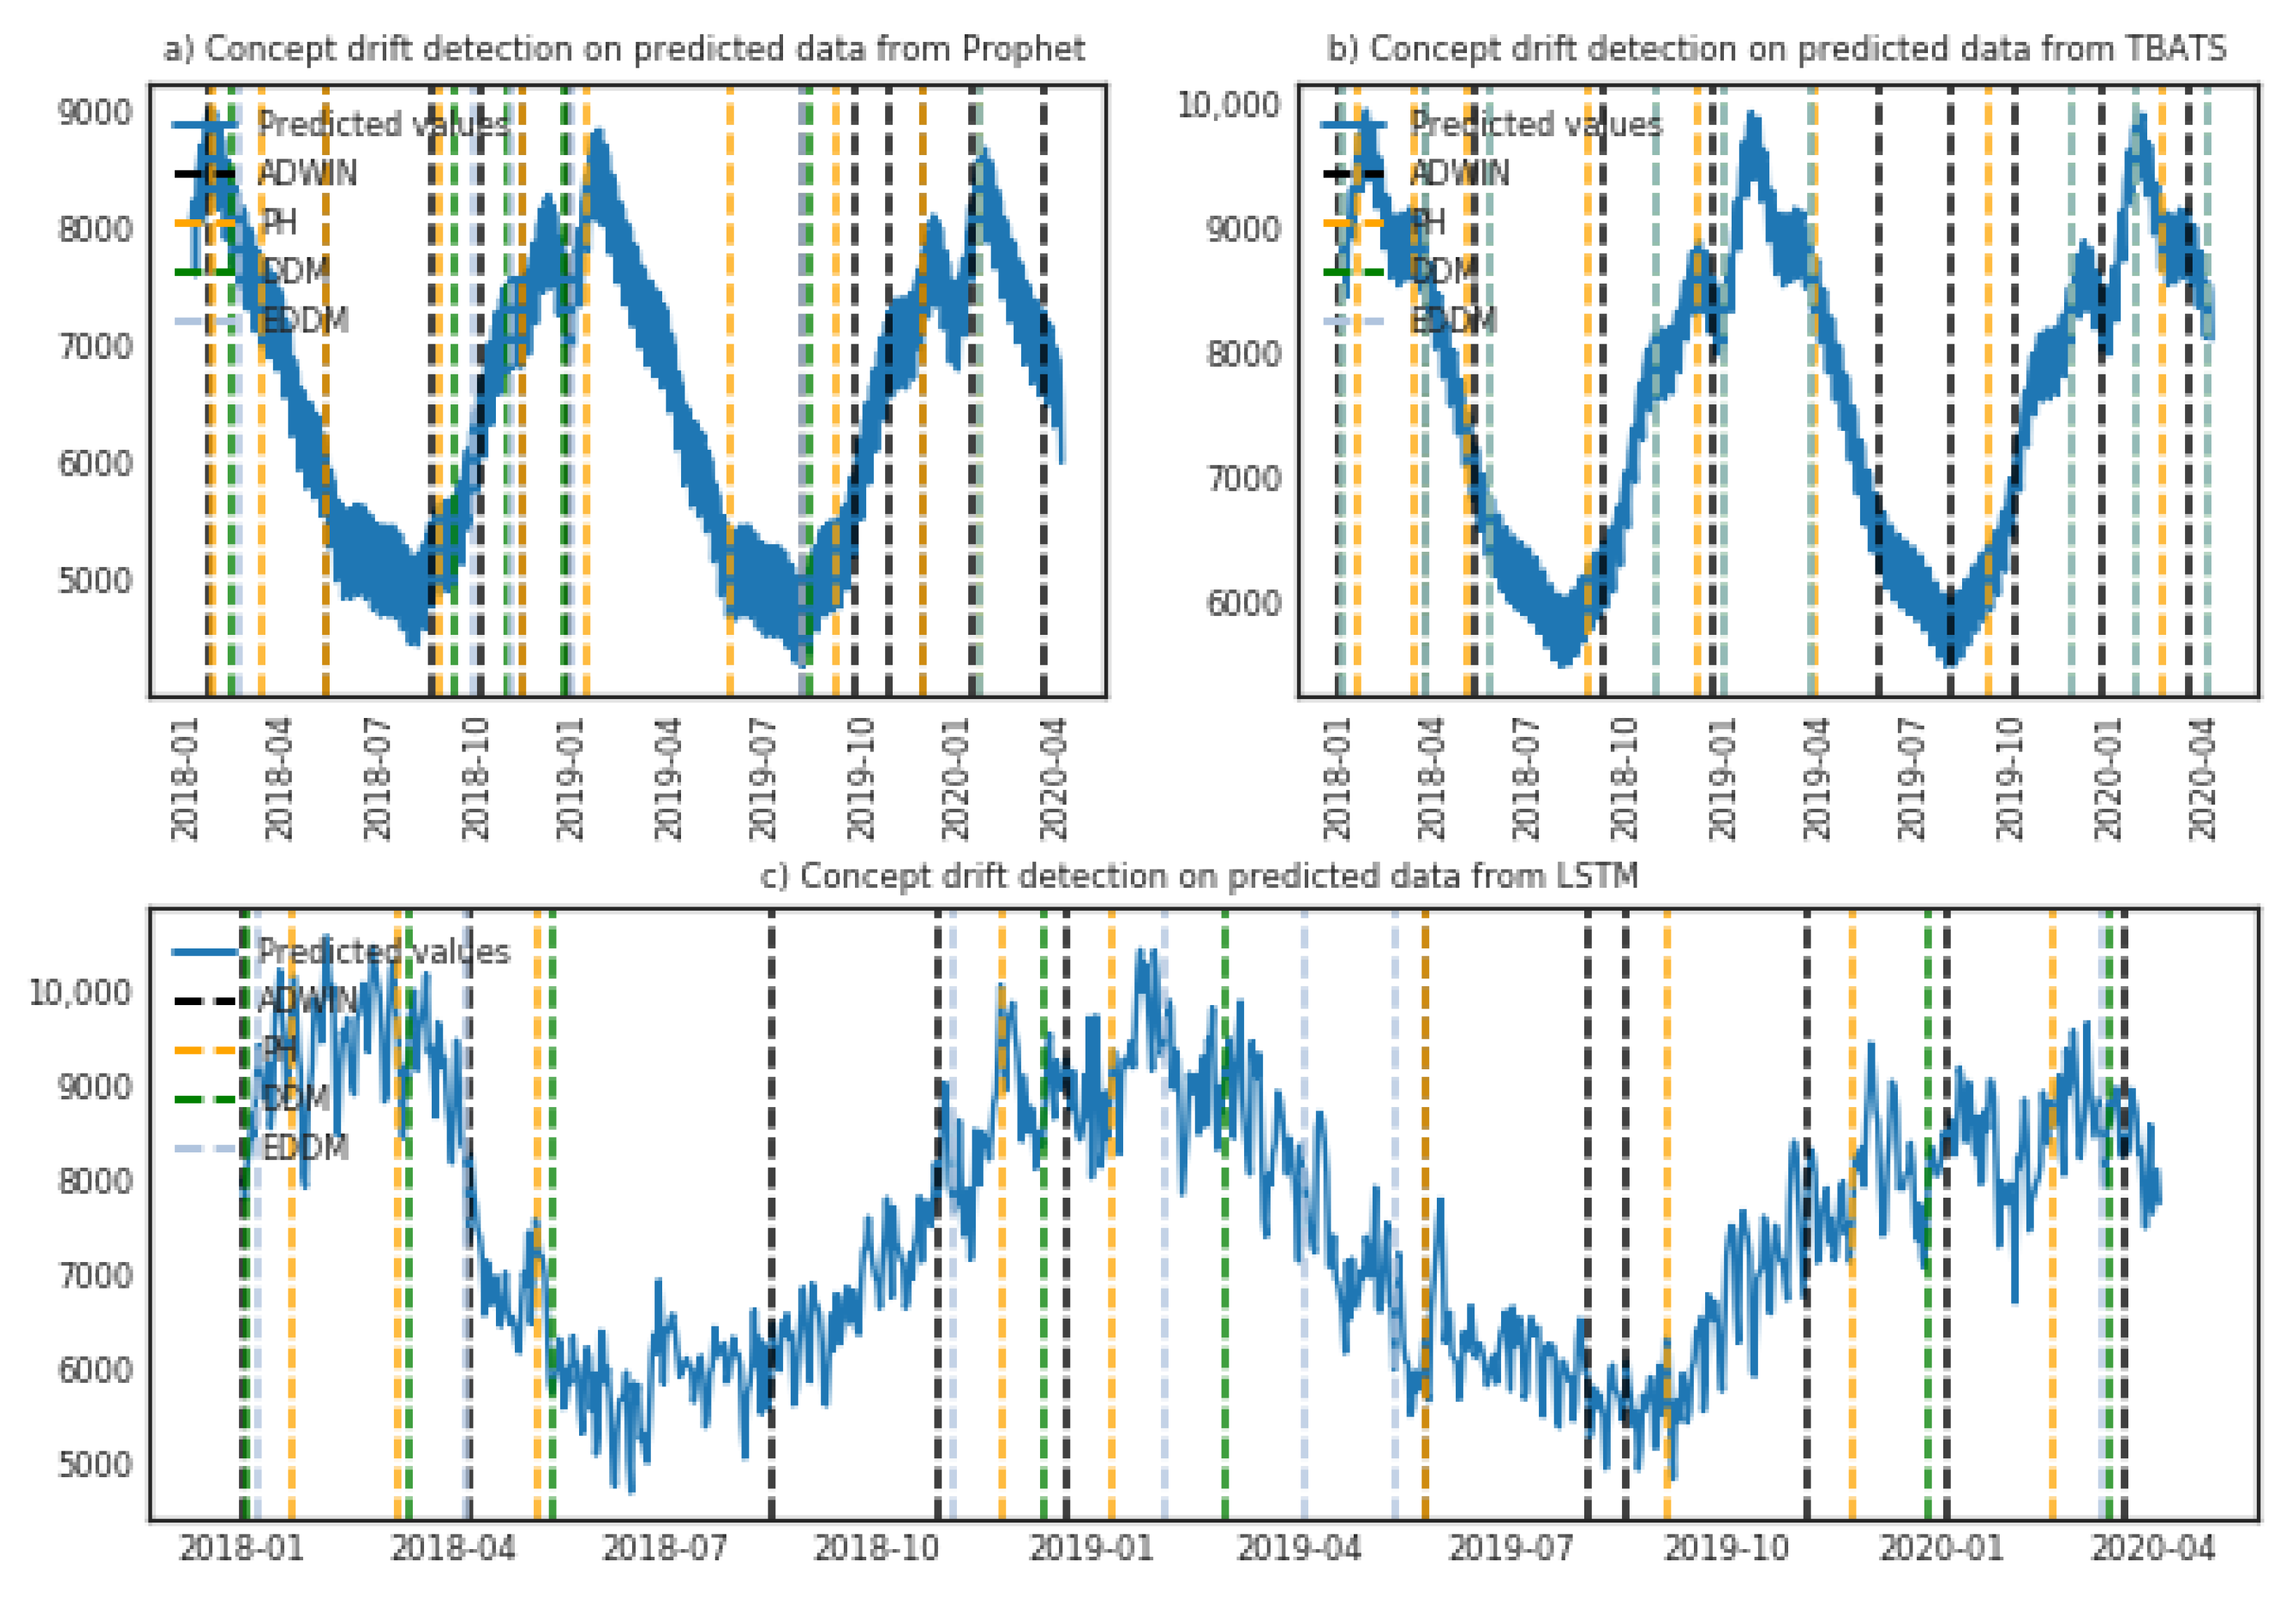
4.2. Prediction Evaluation Using Real-World Datasets

We use three time series learners TBATS, Prophet, and LSTM (see Section 3.3) to forecast electricity supply demand using ELEC2 [73], and power consumption using a real-time data stream from Fingrid [74]. First we explore the performance of the learners on provided datasets alone, and then we integrate the concept drift detection algorithms to the learners, see Figure 1 to address the changes in data. The forecasting accuracy is evaluated with mean absolute percentage error (MAPE) that is normally used to measure the accuracy of different forecasting methods [55].
Performance of “pure” learners. Datasets were analysed to set adequate model parameters, for example, proper seasonality component. Further, we divided the datasets into training and test sets, for model training and analysis correspondingly.
LSTM was implemented by modifying Filonov et al. [82]. The implementation includes a single LSTM layer with linear output layer. For LSTM, the data was scaled in the range of 0–1 and long sequences in the data are transformed to 100 time steps sequences, that are shifted by a single time step. The training is done with learning rate set to 0.001 which is decayed every 5 epochs of a total of 15 epochs.
For ELEC2 dataset [73], the following parameters were selected for the models: daily seasonality = True, yearly seasonality = True were used for both TBATS and Prophet, with an internal width = 0.70 for Prophet, whereas LSTM settings were same as described above. The ELEC2 [73] was split to train set containing values till end of year 1997 and the remaining samples were kept as a test set. Figure 5a demonstrates the performance of the learners on ELEC2 dataset. As can be seen from the figure, models do not perform perfectly on this datasets, however, LSTM follows the data better when compared to others. If we compare mean absolute percentage errors (see Table 2, “pure” learners rows), then actually Prophet learner demonstrates the best result.
For Fingrid dataset, the following parameters were selected for the models: daily seasonality = True, yearly seasonality = True were set both TBATS and Prophet, with an internal width = 0.80 for Prophet, whereas LSTM settings were same as described above. For Fingrid [74] dataset, data from 2011 till January 2018 were used for training, and from January 2018 till April 2020 for testing. Figure 6a shows the performance of learners. We see that LSTM model shows good compliance with the real data, see also Table 2, “pure” learners row.
Performance of learners with integrated concept drift detection. After finalising the models, we integrate the time series learners with tested concept drift detection methods, see Figure 1. Our hypothesis here is that the data may have drifts and, therefore, learners enhanced with drift detection could show better performance.
The ELEC2 observations are by default in range of [0, 1] and Fingrid observations are scaled to [0, 1] range for concept drift detection. We use the following settings after preliminary tests: minimum number of instances passed to each method is n = 100, Δ = 0.005, threshold for detection ( λ = 1), forgetting factor ( α = 1–0.0001) for the PHT. We use Δ = 0.005 for ADWIN and for DDM warning level is set to w = 0.9 and drift control level t = 1, whereas for EDDM α and β are set to 0.9 and 1. Learners have the same parameters as in previous section. The results from Fingrid [74] observations are scaled back to original values from [0, 1] for visualization.
The results for the detected drifts from both datasets are presented in Figure 7 and Figure 8. As can be seen, all the methods implemented find the drifts in our real-world datasets. From Figure 7 and Figure 8 we see that ADWIN and PHT methods stand out when compared to the rest. Also, change points detected with ADWIN and the PHT are quite close to each other, and the average count of detection is also similar, which can also be seen as detection indicator.
Performance results of learners with integrated concept drift adaptation are provided in Table 2 (“with METHOD_ACRONYM” rows) and Figure 5 and Figure 6. First observation is that some learners, enhanced with the drift detection algorithms, indeed have better performance in terms of mean absolute percentage error and in many cases comply better with the data (e.g., compare Figure 6a,d), when compared to their “pure” versions. However, in several cases integration of concept drift resulted in unsatisfactory MAPE and compliance to real data, when compared to pure learners (e.g., compare Figure 5a,b TBATS with EDDM; compare Figure 5a,d Prophet with ADWIN). The reason of such behaviour could be static parameters of the learner, which require tuning with newly arriving data. In such case, techniques for dynamic tuning of learner’s parameters could be utilised, along with suitability check of certain method for the learner.

5. Discussion

Novel smart city projects and advanced technological initiatives in city management have over the past years grown in tandem with the global market for smart city solutions, which is expected to generate over 2 trillion USD by 2025 [20]. The booming innovation ecosystem driven by the proliferation of ubiquitous IoT and sensor technology has enabled citizens, technocrats and city officials to harness and democratise the big data streams created in cities. In this context, a major bottleneck has been the detection and control of the shifting ground truths that can throw off predictive models currently being used in upstream and downstream analytics tasks with smart city applications. This paper explored handling of concept drift in time-series data with four established algorithms (PHT, DDM, EDDM, and ADWIN) in a distributed environment. Below we discuss the key challenges, results, implications, and limitations.
First, smart city initiatives rely increasingly on heterogeneous data sources to perform multi-sensor data fusion that require more computing power and fault tolerant data distribution-based approaches. Implementing concept drift detection methods in a distributed computing environment brings out certain challenges when compared to the centralised computing paradigm. For instance, testing these methods requires efforts in ensuring that data, distributed among multiple cluster nodes, is being read and written by methods properly, and also in keeping track of memory consumption. If a file or record is skipped or not fully read during the computations, in some cases it may truncate the available memory, resulting in task failure. Distributed environments require fault-tolerance and flexibility from the algorithms for example, re-initiation of discontinued processes, since failures are common in large clusters. Even though, most distributed computing frameworks have asynchronous communication possibilities, the rules are to be set carefully, that is, whether the entire or a subset of data stream is to be read in case of failure. Also, checkpoints can be made on an operational data stream that can be traced back to last failure to restart the process. In our implementation, we save the state of the learner and concept drift detection algorithm, along with the data, at different time periods to avoid the re-initiation of the entire process in case of failure, see Figure 1.
Second, with the advent of low-cost and energy efficient IoT and edge devices, smart city initiatives will rely increasingly on real-time streaming analytics and on patterns learned from disaggregated continuous data and micro-batches. These are pivotal requirements that present a potential bottleneck because the selection and tuning of the best method for concept drift detection requires prior knowledge of the data. This means that data patterns should be known a priori, and possible data changes have to be envisioned as well. Particularly, a number of methods utilize user-set thresholds or time windows, which are difficult to control. However, a heuristic-based parameter selection can be performed depending upon the change frequency of data streams. Data containing noise or complex patterns can be hindrance in fine tuning the learners’ pliability. Furthermore, concept drift detection methods with imperfect settings often yields in false alarms, especially when data is noisy, which is a prominent downside of active concept drift methods. However, with some background information, such challenges can be mitigated for example, if algorithm detects concept change about electricity consumption in a certain month, characteristics from this month in previous years could be considered to ensure quality of predictions.
Third, adaptation strategy selection also requires good knowledge of data patterns and understanding possible changes. A number of strategies exist for efficient adaption of algorithms, such as initiation of adaptation after measuring Type I and Type II errors from the detected changes (True and False alarms can be distinguished), request and re-verify approach [88]. Furthermore, meta- and statistical information about the data can help in producing a viable yield from learners. Another challenge in adaptation is the computational effort, that is, how much retraining should be done and on how much data it should be done. In this study, we retained the real observations as historical data for retraining, see Figure 1. Therefore, upon detection of concept change, model retrains on this data for adaptation. However, the possibility of keeping meta information from previously updated models and using it in future models, is still an open question and requires further experimentation. We believe that such approach, if successful, can be beneficial in designing better adaptive strategies for real-time data streams.
Fourth, the integration of concept drift detection may provide additional latency due to additional computations, testing and retraining of the learners. However, if integrated after excessive testing and adjoined with optimal adaptation strategies, computation overhead can be tackled. Moreover, proper evaluation methodology to asses the performance of concept drift solutions must also be in place. MAPE alone cannot be taken as a final metric for evaluation, as stated earlier false alarms can be possible. Therefore, Type I and Type II errors can be helpful, while additional evaluation methods have been proposed to ensure the accuracy of learners [62,88].
The study covers the existing gap in the state-of-the-art for concept drift adaption with time series data [55,69] and provides a relative use case for smart cities using real-time power consumption data from Fingrid [74]. Considering the implications, concept drift can affect use cases with low-latency data streams and applications where the short span of data makes it difficult to access and store historical data, which limits the processing accuracy, especially where true autonomous, monitoring and forecasting solutions, self-aware, and adaptive solutions are in focus. The followed approach in the study mitigates such challenges using a real-time processing and storage methodology, where data is processed in real-time, and in case of detected concept drift, the historical data stays persistent in the respective environment for further usage, see Figure 1. Furthermore, the used architecture and big data technologies enables to tackle the challenges of big data and heterogeneity. The work performed in this study provides an approach for integration of concept drift detection with learning models for real-time and large data streams in context smart city applications for effective predictions and decision-making.
There are certain limitations in our study. First, our analysis zoomed in on a few selected concept drift detection methods and time series prediction models. Moreover, the lack of available or reusable benchmark datasets in the literature did not allow us to fully compare our results with the related work. Also, it is challenging to provide general recommendations on the specific settings or application domains that would be most suitable to deploy the concept drift detection algorithms, since the use case scenarios would heavily depend on the nature of the data. Possible future work could develop a taxonomy of available concept drift methods for smart city data. The evaluation metrics used for the concept drift methods and learners can be enhanced by using more approaches. To the best of our knowledge, this is the first work implementing concept drift detection algorithms in multi-node distributed environment, therefore this article focuses on the implementation and testing of the presented approaches, and algorithm optimization is left for future work.

6. Conclusions

This article presented the implementation and analysis of selected state-of-the-art concept drift detection methods for time series analysis in distributed environment. The methods were verified and analyzed with respect to their behaviour in presence of known abrupt and gradual drift in synthesized datasets. In addition, time series learners were applied to real-world datasets, first without integration of concept drift detection method, and then enhanced with concept drift adaptation. The results indicate that integration of concept drift detection methods do aid in improving forecasting accuracy. However, the selection of learner and methods should be done carefully, considering the nature of data. Also, dynamic tuning of base learners should be considered, as in non-stationary data, patterns change rapidly and old settings can become obsolete with time. The approach followed in the study can however be applied to data streams originating from IoT, sensors, smart cities to develop adequate forecasting solutions, that can assist in evidence-based decision making for policy-makers, government bodies, industrialist, and others.
As future work, we plan to validate the methods with more advanced evaluation metrics, and explore and analyse more concept drift methods aiming to automatically identify drift type. Also, optimisation of algorithms within distributed environment will be explored for increased performance.

Author Contributions

Conceptualization, H.M. and E.G.; methodology, H.M. and E.G.; Data curation, H.M.; software, H.M.; validation, H.M.; formal analysis, H.M.; original draft preparation, H.M., P.K., E.G., M.C.; Writing—Review and editing, H.M., P.K., M.C., T.A., S.P. and E.G. All authors have read and agreed to the published version of the manuscript.

Funding

This research work has been financially supported by Academy of Finland UrBOT project (323630), by Academy of Finland 6Genesis Flagship (318927), by EU Horizon 2020 project CUTLER: Coastal Urban developmenT through the LEnses of Resiliency, under contract no. 770469 (http://www.cutler-h2020.eu/ (accessed on 16 January 2021)), by Riitta ja Jorma J. Takasen Säätiö sr (https://www.rjtsaatio.fi/ (accessed on 16 January 2021)).

Institutional Review Board Statement

Not applicable.

Informed Consent Statement

Not applicable.

Data Availability Statement

Publicly available datasets were analyzed in this study. The data can be found here: https://data.fingrid.fi/en/organization/fingrid (accessed on 16 January 2021).

Conflicts of Interest

The authors declare no conflict of interest.

References

  1. UN. United Nations Department of Economic and Social Affairs, Urban and Rural Population Growth and World Urbanization Prospects; United Nations: Rome, Italy, 2019; pp. 9–31. [Google Scholar] [CrossRef]
  2. Pesaranghader, A.; Viktor, H.L.; Paquet, E. McDiarmid drift detection methods for evolving data streams. In Proceedings of the 2018 International Joint Conference on Neural Networks (IJCNN), Rio de Janeiro, Brazil, 8–13 July 2018; pp. 1–9. [Google Scholar]
  3. Elwell, R.; Polikar, R. Incremental learning of concept drift in nonstationary environments. IEEE Trans. Neural Netw. 2011, 22, 1517–1531. [Google Scholar] [CrossRef]
  4. Gama, J.; Žliobaitė, I.; Bifet, A.; Pechenizkiy, M.; Bouchachia, A. A survey on concept drift adaptation. ACM Comput. Surv. (CSUR) 2014, 46, 1–37. [Google Scholar] [CrossRef]
  5. Ditzler, G.; Polikar, R. Incremental learning of concept drift from streaming imbalanced data. IEEE Trans. Knowl. Data Eng. 2012, 25, 2283–2301. [Google Scholar] [CrossRef]
  6. Beyene, A.A.; Welemariam, T.; Persson, M.; Lavesson, N. Improved concept drift handling in surgery prediction and other applications. Knowl. Inf. Syst. 2015, 44, 177–196. [Google Scholar] [CrossRef] [Green Version]
  7. Lu, J.; Liu, A.; Song, Y.; Zhang, G. Data-driven decision support under concept drift in streamed big data. Complex Intell. Syst. 2020, 6, 157–163. [Google Scholar] [CrossRef] [Green Version]
  8. Mehmood, H. Predicting Parking Space Availability Based on Heterogeneous Data Using Machine Learning Techniques. Master’s Thesis, University of Oulu, Oulu, Finland, 2019. [Google Scholar]
  9. Somasundaram, A.; Reddy, S. Parallel and incremental credit card fraud detection model to handle concept drift and data imbalance. Neural Comput. Appl. 2019, 31, 3–14. [Google Scholar] [CrossRef]
  10. Ditzler, G.; Roveri, M.; Alippi, C.; Polikar, R. Learning in nonstationary environments: A survey. IEEE Comput. Intell. Mag. 2015, 10, 12–25. [Google Scholar] [CrossRef]
  11. Žliobaitė, I.; Pechenizkiy, M.; Gama, J. An overview of concept drift applications. In Big Data Analysis: New Algorithms for a New Society; Studies in Big Data; Springer: Cham, Switzerland, 2016; Volume 16, pp. 91–114. [Google Scholar] [CrossRef] [Green Version]
  12. Kamel, M.; Stastny, T.; Alexis, K.; Siegwart, R. Model predictive control for trajectory tracking of unmanned aerial vehicles using robot operating system. In Robot Operating System (ROS): The Complete Reference (Volume 2); Koubaa, A., Ed.; Springer International Publishing: Cham, Switzerland, 2017; pp. 3–39. [Google Scholar] [CrossRef]
  13. Deshmukh, S.; Dhavale, S. Automated real-time email classification system based on machine learning. In 2020 International Conference on Computational Science and Applications; Springer: Singapore, 2020; pp. 369–379. [Google Scholar]
  14. Suárez-Cetrulo, A.L.; Cervantes, A.; Quintana, D. Incremental Market Behavior Classification in Presence of Recurring Concepts. Entropy 2019, 21, 25. [Google Scholar] [CrossRef] [PubMed] [Green Version]
  15. Gonçalves, P.M., Jr.; de Carvalho Santos, S.G.; Barros, R.S.; Vieira, D.C. A comparative study on concept drift detectors. Expert Syst. Appl. 2014, 41, 8144–8156. [Google Scholar] [CrossRef]
  16. Brzezinski, D.; Stefanowski, J. Reacting to different types of concept drift: The accuracy updated ensemble algorithm. IEEE Trans. Neural Netw. Learn. Syst. 2013, 25, 81–94. [Google Scholar] [CrossRef] [Green Version]
  17. Sun, Y.; Wang, Z.; Bai, Y.; Dai, H.; Nahavandi, S. A Classifier Graph Based Recurring Concept Detection and Prediction Approach. Comput. Intell. Neurosci. 2018, 2018. [Google Scholar] [CrossRef] [Green Version]
  18. Perera, C.; Qin, Y.; Estrella, J.C.; Reiff-Marganiec, S.; Vasilakos, A.V. Fog computing for sustainable smart cities: A survey. ACM Comput. Surv. (CSUR) 2017, 50, 1–43. [Google Scholar] [CrossRef] [Green Version]
  19. Mehmood, H.; Gilman, E.; Cortes, M.; Kostakos, P.; Byrne, A.; Valta, K.; Tekes, S.; Riekki, J. Implementing big data lake for heterogeneous data sources. In Proceedings of the 2019 IEEE 35th International Conference on Data Engineering Workshops (Icdew), Macao, China, 8–12 April 2019; pp. 37–44. [Google Scholar]
  20. Frost & Sullivan. Smart City Adoption Timeline; Global Information, Inc.: Santa Clara, CA, USA, 2018. [Google Scholar]
  21. Morello, R.; Mukhopadhyay, S.C.; Liu, Z.; Slomovitz, D.; Samantaray, S.R. Advances on sensing technologies for smart cities and power grids: A review. IEEE Sens. J. 2017, 17, 7596–7610. [Google Scholar] [CrossRef]
  22. Lim, C.; Maglio, P.P. Data-driven understanding of smart service systems through text mining. Serv. Sci. 2018, 10, 154–180. [Google Scholar] [CrossRef] [Green Version]
  23. Liu, J.; Li, T.; Xie, P.; Du, S.; Teng, F.; Yang, X. Urban big data fusion based on deep learning: An overview. Inf. Fusion 2020, 53, 123–133. [Google Scholar] [CrossRef]
  24. Pandya, A.; Kostakos, P.; Mehmood, H.; Cortes, M.; Gilman, E.; Oussalah, M.; Pirttikangas, S. Privacy preserving sentiment analysis on multiple edge data streams with Apache NiFi. In Proceedings of the 2019 European Intelligence and Security Informatics Conference (EISIC), Oulu, Finland, 26–27 November 2019; pp. 130–133. [Google Scholar]
  25. Bibri, S.E. The IoT for smart sustainable cities of the future: An analytical framework for sensor-based big data applications for environmental sustainability. Sustain. Cities Soc. 2018, 38, 230–253. [Google Scholar] [CrossRef]
  26. Santana, E.F.Z.; Chaves, A.P.; Gerosa, M.A.; Kon, F.; Milojicic, D.S. Software platforms for smart cities: Concepts, requirements, challenges, and a unified reference architecture. ACM Comput. Surv. 2017, 50, 1–37. [Google Scholar] [CrossRef]
  27. london.gov.uk, What We Do | London City Hall. 2020. Available online: https://www.london.gov.uk/what-we-do (accessed on 16 January 2021).
  28. Chalikias, A.P.; Tsampoulatidis, I.; Tsalakanidou, F.; Nikolopoulos, S.; Kompatsiaris, I.; Komninos, N.; Doudouliakis, K.; Papastergios, G.; Papafilis, P.; Karkaletsi, S.; et al. Evidence-driven policy-making using heterogeneous data sources—The case of a controlled parking system in Thessaloniki. Data Policy 2020, 22. [Google Scholar] [CrossRef]
  29. Office of the Governor for Policy Planning. The Action Plan for 2020. 2020. Available online: https://www.seisakukikaku.metro.tokyo.lg.jp/en/basic-plan/actionplan-for-2020/ (accessed on 16 January 2021).
  30. Janajreh, I.; Su, L.; Alan, F. Wind energy assessment: Masdar City case study. Renew. Energy 2013, 52, 8–15. [Google Scholar] [CrossRef]
  31. Liu, P.; Peng, Z. China’s smart city pilots: A progress report. Computer 2013, 47, 72–81. [Google Scholar] [CrossRef]
  32. Fortes, M.Z.; Ferreira, V.H.; Sotelo, G.G.; Cabral, A.S.; Correia, W.F.; Pacheco, O.L.C. Deployment of smart metering in the Búzios City. In Proceedings of the 2014 IEEE PES Transmission & Distribution Conference and Exposition-Latin America (PES T&D-LA), Medellin, Colombia, 10–13 September 2014; pp. 1–6. [Google Scholar]
  33. hadoop.apache.org. Apache Hadoop. Available online: https://hadoop.apache.org/ (accessed on 18 January 2020).
  34. Zaharia, M. Apache Spark™—Unified Analytics Engine for Big Data. Available online: https://spark.apache.org/ (accessed on 16 January 2020).
  35. Gormley, C.; Tong, Z. Elasticsearch: The Definitive Guide: A Distributed Real-Time Search and Analytics Engine; O’Reilly Media, Inc.: Sevastopol, CA, USA, 2015. [Google Scholar]
  36. Cenedese, A.; Zanella, A.; Vangelista, L.; Zorzi, M. Padova smart city: An urban internet of things experimentation. In Proceedings of the IEEE International Symposium on a World of Wireless, Mobile and Multimedia Networks 2014, Sydney, Australia, 19 June 2014; pp. 1–6. [Google Scholar]
  37. Cheng, B.; Longo, S.; Cirillo, F.; Bauer, M.; Kovacs, E. Building a big data platform for smart cities: Experience and lessons from santander. In Proceedings of the 2015 IEEE International Congress on Big Data, New York, NY, USA, 27 June–2 July 2015; pp. 592–599. [Google Scholar]
  38. Petrolo, R.; Loscri, V.; Mitton, N. Towards a smart city based on cloud of things. In Proceedings of the 2014 ACM International Workshop on Wireless and Mobile Technologies for Smart Cities, Philadelphia, PA, USA, 11–14 August 2014; pp. 61–66. [Google Scholar]
  39. Costa, C.; Santos, M.Y. BASIS: A big data architecture for smart cities. In Proceedings of the 2016 SAI Computing Conference (SAI), London, UK, 13–15 July 2016; pp. 1247–1256. [Google Scholar]
  40. Habibzadeh, H.; Kaptan, C.; Soyata, T.; Kantarci, B.; Boukerche, A. Smart city system design: A comprehensive study of the application and data planes. ACM Comput. Surv. (CSUR) 2019, 52, 1–38. [Google Scholar] [CrossRef]
  41. Lau, B.P.L.; Marakkalage, S.H.; Zhou, Y.; Hassan, N.U.; Yuen, C.; Zhang, M.; Tan, U.X. A survey of data fusion in smart city applications. Inf. Fusion 2019, 52, 357–374. [Google Scholar] [CrossRef]
  42. Cerquitelli, T.; Proto, S.; Ventura, F.; Apiletti, D.; Baralis, E. Automating concept-drift detection by self-evaluating predictive model degradation. arXiv 2019, arXiv:1907.08120. [Google Scholar]
  43. Huang, T.; Xu, B.; Cai, H.; Du, J.; Chao, K.M.; Huang, C. A fog computing based concept drift adaptive process mining framework for mobile APPs. Future Gener. Comput. Syst. 2018, 89, 670–684. [Google Scholar] [CrossRef]
  44. Song, X.; He, H.; Niu, S.; Gao, J. A data streams analysis strategy based on hoeffding tree with concept drift on hadoop system. In Proceedings of the 2016 International Conference on Advanced Cloud and Big Data (CBD), Chengdu, China, 13–16 August 2016; pp. 45–48. [Google Scholar]
  45. Alberg, D.; Last, M.; Kandel, A. Knowledge discovery in data streams with regression tree methods. Wiley Interdiscip. Rev. Data Min. Knowl. Discov. 2012, 2, 69–78. [Google Scholar] [CrossRef]
  46. Bifet, A.; Gavalda, R. Learning from time-changing data with adaptive windowing. In Proceedings of the 2007 SIAM International Conference on Data Mining, Minneapolis, MN, USA, 26–28 April 2007; pp. 443–448. [Google Scholar]
  47. Kuncheva, L.I. Change detection in streaming multivariate data using likelihood detectors. IEEE Trans. Knowl. Data Eng. 2011, 25, 1175–1180. [Google Scholar] [CrossRef]
  48. Dong, F.; Zhang, G.; Lu, J.; Li, K. Fuzzy competence model drift detection for data-driven decision support systems. Knowl. Based Syst. 2018, 143, 284–294. [Google Scholar] [CrossRef] [Green Version]
  49. Liu, A.; Lu, J.; Zhang, G. Concept drift detection via equal intensity k-means space partitioning. IEEE Trans. Cybern. 2020. [Google Scholar] [CrossRef] [PubMed]
  50. Carrera, D. Learning and adaptation to detect changes and anomalies in high-dimensional data. In Special Topics in Information Technology; Springer: Cham, Switzerland, 2020; pp. 63–75. [Google Scholar]
  51. Boracchi, G.; Carrera, D.; Cervellera, C.; Maccio, D. Quanttree: Histograms for change detection in multivariate data streams. In Proceedings of the International Conference on Machine Learning, Stockholm, Sweden, 10–15 July 2018; pp. 639–648. [Google Scholar]
  52. Santos, S.G.; Barros, R.S.; Gonçalves, P.M., Jr. A differential evolution based method for tuning concept drift detectors in data streams. Inf. Sci. 2019, 485, 376–393. [Google Scholar] [CrossRef]
  53. Kadwe, Y.; Suryawanshi, V. A review on concept drift. IOSR J. Comput. Eng 2015, 17, 20–26. [Google Scholar]
  54. Harel, M.; Mannor, S.; El-Yaniv, R.; Crammer, K. Concept drift detection through resampling. In Proceedings of the International Conference on Machine Learning, Beijing, China, 21–26 June 2014; pp. 1009–1017. [Google Scholar]
  55. Cavalcante, R.C.; Oliveira, A.L. An approach to handle concept drift in financial time series based on Extreme Learning Machines and explicit Drift Detection. In Proceedings of the 2015 International Joint Conference on Neural Networks (IJCNN), Killarney, Ireland, 12–17 July 2015; pp. 1–8. [Google Scholar]
  56. Patil, M.M. Handling concept drift in data streams by using drift detection methods. In Data Management, Analytics and Innovation; Springer: Singapore, 2019; pp. 155–166. [Google Scholar]
  57. Kaneko, R.; Miyaguchi, K.; Yamanishi, K. Detecting changes in streaming data with information-theoretic windowing. In Proceedings of the 2017 IEEE International Conference on Big Data (Big Data), Boston, MA, USA, 11–14 December 2017; pp. 646–655. [Google Scholar]
  58. Domingos, P.; Hulten, G. Mining high-speed data streams. In Proceedings of the Sixth ACM SIGKDD International Conference on Knowledge Discovery and Data Mining, Boston, MA, USA, 20–23 August 2000; pp. 71–80. [Google Scholar]
  59. Nguyen, H.L.; Woon, Y.K.; Ng, W.K.; Wan, L. Heterogeneous ensemble for feature drifts in data streams. In Pacific-Asia Conference on Knowledge Discovery and Data Mining; Springer: Berlin/Heidelberg, Germany, 2012; pp. 1–12. [Google Scholar]
  60. Kumar, A.; Kaur, P.; Sharma, P. A survey on Hoeffding tree stream data classification algorithms. CPUH-Res. J. 2015, 1, 28–32. [Google Scholar]
  61. Cohen, L.; Avrahami-Bakish, G.; Last, M.; Kandel, A.; Kipersztok, O. Real-time data mining of non-stationary data streams from sensor networks. Inf. Fusion 2008, 9, 344–353. [Google Scholar] [CrossRef]
  62. Ditzler, G. A study of an incremental spectral meta-learner for nonstationary environments. In Proceedings of the 2016 International Joint Conference on Neural Networks (IJCNN), Vancouver, BC, Canada, 24–29 July 2016; pp. 38–44. [Google Scholar]
  63. Cano, A.; Krawczyk, B. Kappa Updated Ensemble for drifting data stream mining. Mach. Learn. 2020, 109, 175–218. [Google Scholar] [CrossRef]
  64. Pocock, A.; Yiapanis, P.; Singer, J.; Luján, M.; Brown, G. Online non-stationary boosting. In International Workshop on Multiple Classifier Systems; Springer: Singapore, 2010; pp. 205–214. [Google Scholar]
  65. Yang, Z.; Al-Dahidi, S.; Baraldi, P.; Zio, E.; Montelatici, L. A novel concept drift detection method for incremental learning in nonstationary environments. IEEE Trans. Neural Netw. Learn. Syst. 2019, 31, 309–320. [Google Scholar] [CrossRef] [PubMed]
  66. Whitley, E.; Ball, J. Statistics review 6: Nonparametric methods. Crit. Care 2002, 6, 509. [Google Scholar] [CrossRef]
  67. Baena-Garcıa, M.; del Campo-Ávila, J.; Fidalgo, R.; Bifet, A.; Gavalda, R.; Morales-Bueno, R. Early drift detection method. In Proceedings of the Fourth International Workshop on Knowledge Discovery from Data Streams. 2006, Volume 6, pp. 77–86. Available online: https://www.researchgate.net/profile/Albert-Bifet/publication/245999704_Early_Drift_Detection_Method/links/53e582cd0cf21cc29fd06017/Early-Drift-Detection-Method.pdf (accessed on 30 January 2021).
  68. Tsymbal, A.; Pechenizkiy, M.; Cunningham, P.; Puuronen, S. Dynamic integration of classifiers for handling concept drift. Inf. Fusion 2008, 9, 56–68. [Google Scholar] [CrossRef] [Green Version]
  69. Hu, Y.; Feng, B.; Zhang, X.; Ngai, E.; Liu, M. Stock trading rule discovery with an evolutionary trend following model. Expert Syst. Appl. 2015, 42, 212–222. [Google Scholar] [CrossRef]
  70. Sebastião, R.; Fernandes, J.M. Supporting the page-hinkley test with empirical mode decomposition for change detection. In International Symposium on Methodologies for Intelligent Systems; Springer: Cham, Switzerland, 2017; pp. 492–498. [Google Scholar]
  71. Melkumyan, A.; Ramos, F. Multi-kernel Gaussian processes. In Proceedings of the Twenty-Second International Joint Conference on Artificial Intelligence, Barcelona, Spain, 16–22 July 2011. [Google Scholar]
  72. Aranovskiy, S.; Bobtsov, A.; Kremlev, A.; Nikolaev, N.; Slita, O. Identification of frequency of biased harmonic signal. Eur. J. Control 2010, 16, 129–139. [Google Scholar] [CrossRef]
  73. Harries, M.; Wales, N.S. Splice-2 Comparative Evaluation: Electricity Pricing; Citeseer: Pennsylvania, PA, USA, 1999. [Google Scholar]
  74. fingrid.fi. Fingrid. Available online: https://data.fingrid.fi/en/organization/fingrid (accessed on 15 December 2020).
  75. Naim, I.; Mahara, T.; Idrisi, A.R. Effective short-term forecasting for daily time series with complex seasonal patterns. Procedia Comput. Sci. 2018, 132, 1832–1841. [Google Scholar] [CrossRef]
  76. Taylor, S.J.; Letham, B. Forecasting at scale. Am. Stat. 2018, 72, 37–45. [Google Scholar] [CrossRef]
  77. Hochreiter, S.; Schmidhuber, J. Long short-term memory. Neural Comput. 1997, 9, 1735–1780. [Google Scholar] [CrossRef] [PubMed]
  78. Cherrie, M.P.; Nichols, G.; Iacono, G.L.; Sarran, C.; Hajat, S.; Fleming, L.E. Pathogen seasonality and links with weather in England and Wales: A big data time series analysis. BMC Public Health 2018, 18, 1067. [Google Scholar] [CrossRef] [PubMed] [Green Version]
  79. Jifri, M.H.; Hassan, E.E.; Miswan, N.H. Forecasting performance of time series and regression in modeling electricity load demand. In Proceedings of the 2017 7th IEEE International Conference on System Engineering and Technology (ICSET), Shah Alam, Malaysia, 2–3 October 2017; pp. 12–16. [Google Scholar]
  80. Fang, W.X.; Lan, P.C.; Lin, W.R.; Chang, H.C.; Chang, H.Y.; Wang, Y.H. Combine Facebook prophet and LSTM with BPNN forecasting financial markets: The Morgan Taiwan Index. In Proceedings of the 2019 International Symposium on Intelligent Signal Processing and Communication Systems (ISPACS), Taipei, Taiwan, 3–6 December 2019; pp. 1–2. [Google Scholar]
  81. Asha, J.; Rishidas, S.; SanthoshKumar, S.; Reena, P. Analysis of temperature prediction using random forest and facebook prophet algorithms. In Proceedings of the International Conference on Innovative Data Communication Technologies and Application, Coimbatore, India, 17–18 October 2019; Springer: Cham, Switzerland, 2019; pp. 432–439. [Google Scholar]
  82. Filonov, P.; Lavrentyev, A.; Vorontsov, A. Multivariate industrial time series with cyber-attack simulation: Fault detection using an lstm-based predictive data model. arXiv 2016, arXiv:1612.06676. [Google Scholar]
  83. Althelaya, K.A.; El-Alfy, E.S.M.; Mohammed, S. Evaluation of bidirectional lstm for short-and long-term stock market prediction. In Proceedings of the 2018 9th International Conference on Information and Communication Systems (ICICS), Irbid, Jordan, 3–5 April 2018; pp. 151–156. [Google Scholar]
  84. Liu, Y.; Wang, Y.; Yang, X.; Zhang, L. Short-term travel time prediction by deep learning: A comparison of different LSTM-DNN models. In Proceedings of the 2017 IEEE 20th International Conference on Intelligent Transportation Systems (ITSC), Yokohama, Japan, 16–19 October 2017; pp. 1–8. [Google Scholar]
  85. Richardson, L. Beautiful Soup Documentation. Available online: https://www.crummy.com/software/BeautifulSoup/bs4/doc/ (accessed on 16 December 2020).
  86. Selenium Automates Browsers. That’s It. Available online: https://www.selenium.dev/ (accessed on 16 December 2020).
  87. Pandas. Available online: https://pandas.pydata.org/ (accessed on 16 December 2020).
  88. Yu, S.; Wang, X.; Principe, J.C. Request-and-reverify: Hierarchical hypothesis testing for concept drift detection with expensive labels. arXiv 2018, arXiv:1806.10131. [Google Scholar]
Figure 1. Concept drift adaptation algorithm, modified from [55].
Smartcities 04 00021 g001
Figure 2. The distributed architecture utilized to collect, store and analyze the data, adapted from [19].
Smartcities 04 00021 g002
Figure 3. Results for abrupt drift detection, see Section 3.1, where X axis shows occurrence count and Y axis the value.
Smartcities 04 00021 g003
Figure 4. Results for gradual drift detection, see Section 3.1, where X axis shows occurrence count and Y axis the value.
Smartcities 04 00021 g004
Figure 5. Prediction results from time series learners (see Section 3) for ELEC2 [73], where X axis shows DateTime and Y axis the value. Figure (a) shows results from pure learners, where figures (bd) show results after integrating concept drift methods.
Smartcities 04 00021 g005
Figure 6. Prediction results from time series learners (see Section 3) for Fingrid [74], where X axis shows DateTime and Y axis the value in megawatt hour (MWh). Figure (a) shows results from pure learners, where figures (bd) show results after integrating concept drift methods.
Smartcities 04 00021 g006
Figure 7. Concept drift detection for ELEC2 [73] dataset, where the X axis shows DateTime and Y axis the value.
Smartcities 04 00021 g007
Figure 8. Concept drift detection for Fingrid [74], X axis shows DateTime and Y axis the value (MWh).
Smartcities 04 00021 g008
Table 1. Summary of selected concept drift methods and their properties.
MethodApproachGoalTask Support
The Page Hinkley Test (PHT)ActiveMethod was developed to detect change from Gaussian signal and is suitable for abrupt drift scenarios [4].classification and regression [45,46]
Semi-parametric log-likelihood (SPLL)ActiveMethod has been tested with abrupt drift. However, it may not be as sensitive to progressive changes in the data distribution [47].classification [47]
Fuzzy competence model drift detection (FCM)ActiveMethod uses competence model to identify the change (abrupt and gradual) in data distribution without any prior knowledge [48]classification and regression [48]
QuantTreeActiveApproach uses a recursive binary splitting strategy to define histograms for change detection; its suitability for drift type that is, abrupt or gradual, still requires experimentation [49,50].classification [51]
Drift detection method (DDM)ActiveThe method is suitable for both abrupt and gradual drift [52], providing increased performance in abrupt drift [53].classification and regression [54,55]
Early drift detection method (EDDM)ActiveIt is an extension of DDM to overcome the limitations of detecting gradual drift in the data [53].classification and regression [54]
Adaptive windowing (ADWIN)ActiveThis method uses a sliding windowing approach with variable size to detect concept drift [15]. Both abrupt and gradual drift scenarios have been tested with this method [56].classification and regression [57]
Very fast decision tree (VFDT)PassiveThe model adapts to changes in streaming data; however, basic incremental learning is not sufficient to handle concept drift in the data [16].classification and regression [16,58]
Concept drift very fast decision tree (CVFDT)PassiveCVFDT is extenstion of VFDT that adapts to concept drift in data [59]. However, it cannot efficiently adapt to sudden drifts [16,59].classification and regression [16,60]
Online information network (OLIN)PassiveThe model learns by building a network using window and detects concept drift through increase in classification error. However, requires higher computational cost [61]classification [61]
Streaming ensemble algorithm (SEA)PassiveThe method may not efficiently react to sudden drift in data. As learners generated from outdated data can still be valid, regardless of their inaccurate weight [16]classification and regression [3,62]
Dynamic Adaption to Concept Changes (DACC)PassiveIt follows higher deletion rate strategy to expel bad learners, entailing higher reactivity to concept drift, and supports sudden and gradual drift [63]classification [63]
Online Non-stationary Boosting (ONSBOOST)PassiveThe method can learn in dynamically changing environments, also it has been tested with hidden contexts (i.e., can be abrupt, gradual) [64]classification [64]
Online Sequential Extreme Learning Machine (OS-ELM)PassiveOS-ELM by [65] has shown superior performance in detecting different kinds of concept drift (sudden, gradual, etc.). Also it is capable of notifying when model needs to be updated.classification and regression [65]
Table 2. Computed mean absolute percentage error (MAPE) for time series learners.
MethodELEC2 [73]Fingrid [74]
LSTMpure LSTM5.100.57
with PHT0.970.24
with ADWIN5.750.45
with DDM2.280.48
with EDDM3.510.83
Prophetpure Prophet15.586.1
with PHT9.865.68
with ADWIN20.666.48
with DDM10.066.80
with EDDM9.946.92
TBATS“pure” TBATS21.357.0
with PHT17.256.45
with ADWIN17.377.05
with DDM16.947.08
with EDDM23.817.11
Publisher’s Note: MDPI stays neutral with regard to jurisdictional claims in published maps and institutional affiliations.

