1. Introduction
With the advent of the internet and smart devices facilitating tracking or surveillance over the last two decades, smart with a capital ‘s’ has increasingly become associated with technological solutions to problems of the built environment, often responsive to the individual needs of end uses [
1,
2]. The emphasis on advancing technology frequently belies an underlying financial incentive that is implicitly or explicitly significant, such as in the Google Sidewalk Labs’ now-defunct Quayside Smart City project in Toronto, Canada [
3]. The financial incentives of ‘if we can’ often overrides common sense considerations of ‘if we should’ when it comes to architecture and urbanism. Of course, this is not the only definition of smart or smartness in buildings and cities. Many continue to advocate for the smartness of embracing and perpetuating thousands of years of received wisdom about the built environment. Their goal is to promote the long-term resilience and sustainability of our homes and urban places [
4,
5,
6].
On the other hand, many continue to promote modular concepts as an example of smart design in buildings, especially in popular media for residential dwellings to address the affordability crisis in many cities around the world [
7]. The appeal of such approaches lies in
ad infinitum replication of individual parts arranged into a coherent whole, which seems so closely aligned to modern, cost-saving processes of mass production in urban development. Most literature on this subject tends to focus on small modular designs for housing needs. However, is a modular design in architecture smart for the people who use more complex building types, usually of a non-residential nature? We examine one such example to help answer this question: the Men’s College of Arts and Science/Corridors A-J complex, more commonly called the BCR Corridors, at Qatar University (QU) in Doha, Qatar on the Arabian Peninsula in the Middle East.
The modular design of the BCR Corridors is notorious for the way-finding difficulties of end-users in the building complex. These navigation problems appear to arise due to the repetitive similarity of individual parts in its modular design, highly localized impediments to readability and visibility such as vertical shading device screens and temporary installations, and the relationship of those different parts composing the collective whole of the BCR Corridors to the surrounding context of the QU campus (
Figure 1). Researchers in the Department of Architecture and Urban Planning (DAUP), College of Engineering (CENG) at QU conducted a Post-occupancy Evaluation (PoE) Study of the BCR Corridors in 2019, in which they directly observed the movement and space use of nearly 2500 people. The “Complexity and Use in Building Evaluation” research project (CUBE
2: QUST-2-CENG-2019-12) builds on the success of the post-occupancy cluster in an initial demonstration project (CUBE
1: QUST-2-CENG-2018-9) to develop detailed post-occupancy datasets of movement and space use in buildings at QU. The goal is to contribute positively to future alterations of existing QU buildings and the design of new university buildings in helping to create a world-class campus for education and research. In this sense, space use, interaction, and innovation would become tactically ‘woven’ into the design and planning of the campus at various scales of the built environment.
Post-occupancy evaluation (PoE) has been a standard part of research into the built environment since the 1960s, mostly originating in the United Kingdom and the United States. With the advent of modern computer technologies over the same time, it has become an increasingly necessary means to measure building performance. However, there still seems to be something of a value gap in the field. Building performance evaluations tend to focus on quantifiable measurements of mechanical systems in buildings such as HVAC and lighting, which relate to the formal elements of physical construction. Post-occupancy evaluations tend to focus on qualitative descriptions—sometimes, quantitative measurements as in space syntax research—of the social networks generated by end-users in buildings. Such networks derive from patterns of movement, static occupation, and formal/casual interactions, which relate to the spatial structure as defined by the built environment [
8,
9]. These social networks tend to only come to the forefront when there is dysfunction in the organization itself. Even then, people will sometimes overlook the role of spatio-social networks in organizational dysfunction because it is difficult to assign an economic cost or value to such things. The financial considerations of building construction and cost take precedent, emphasizing the former at the expense of the latter, sometimes to the long-term detriment, even economic viability of an organization that occupies a building. The ongoing CUBE research studies attempt to address this gap for the educational facilities of the QU campus using space syntax theory and methodology (see
Appendix A). Space syntax is an international research program of academics and practitioners studying the role of built space in society from the single building to entire cities [
8,
9,
10,
11,
12].
In the CUBE
1 study, Major et al. were able to graphically illustrate the building program/use and movement/space use patterns of the QU Women’s Engineering Building [
13]. It included statistically quantifying the relationship between movement and spatial layout as well as the significance of other end-user activities such as sitting and interacting in common areas of the building. The study also identified adaptive re-use of classrooms and storage spaces for laboratory and office uses, leading to a shortage of storage spaces in the building. There was a consistent relationship (R
2 = 0.68,
p < 0.001) between sitting and interacting unrelated to accessibility or metric area, i.e., the availability of seating was the dominant factor for casual encounters, mostly of students [
13,
14]. Finally, there was a weak but consistent relationship (R
2 = 0.38,
p < 0.001) between spatial layout and movement flows using space syntax modeling due to strongly programmatic differences (classrooms vs. faculty offices) in different wings of the building [
13] (
Figure 2).
The PoE findings in the CUBE
1 project were mostly consistent with previous results of space syntax research over the last 30 years for generative layouts such as office buildings, colleges, and research laboratories. Those results include the generative role of spatial layout for movement and casual encounter in buildings. They also include the prescriptive effects of strong programmatic aspects (in this case, classroom location and course schedules) in causing some spaces to overperform/underperform for some types of use. Finally, there is also the importance of providing seating to facilitate the robust use of spaces, whether at the building or urban level [
9,
15,
16,
17].
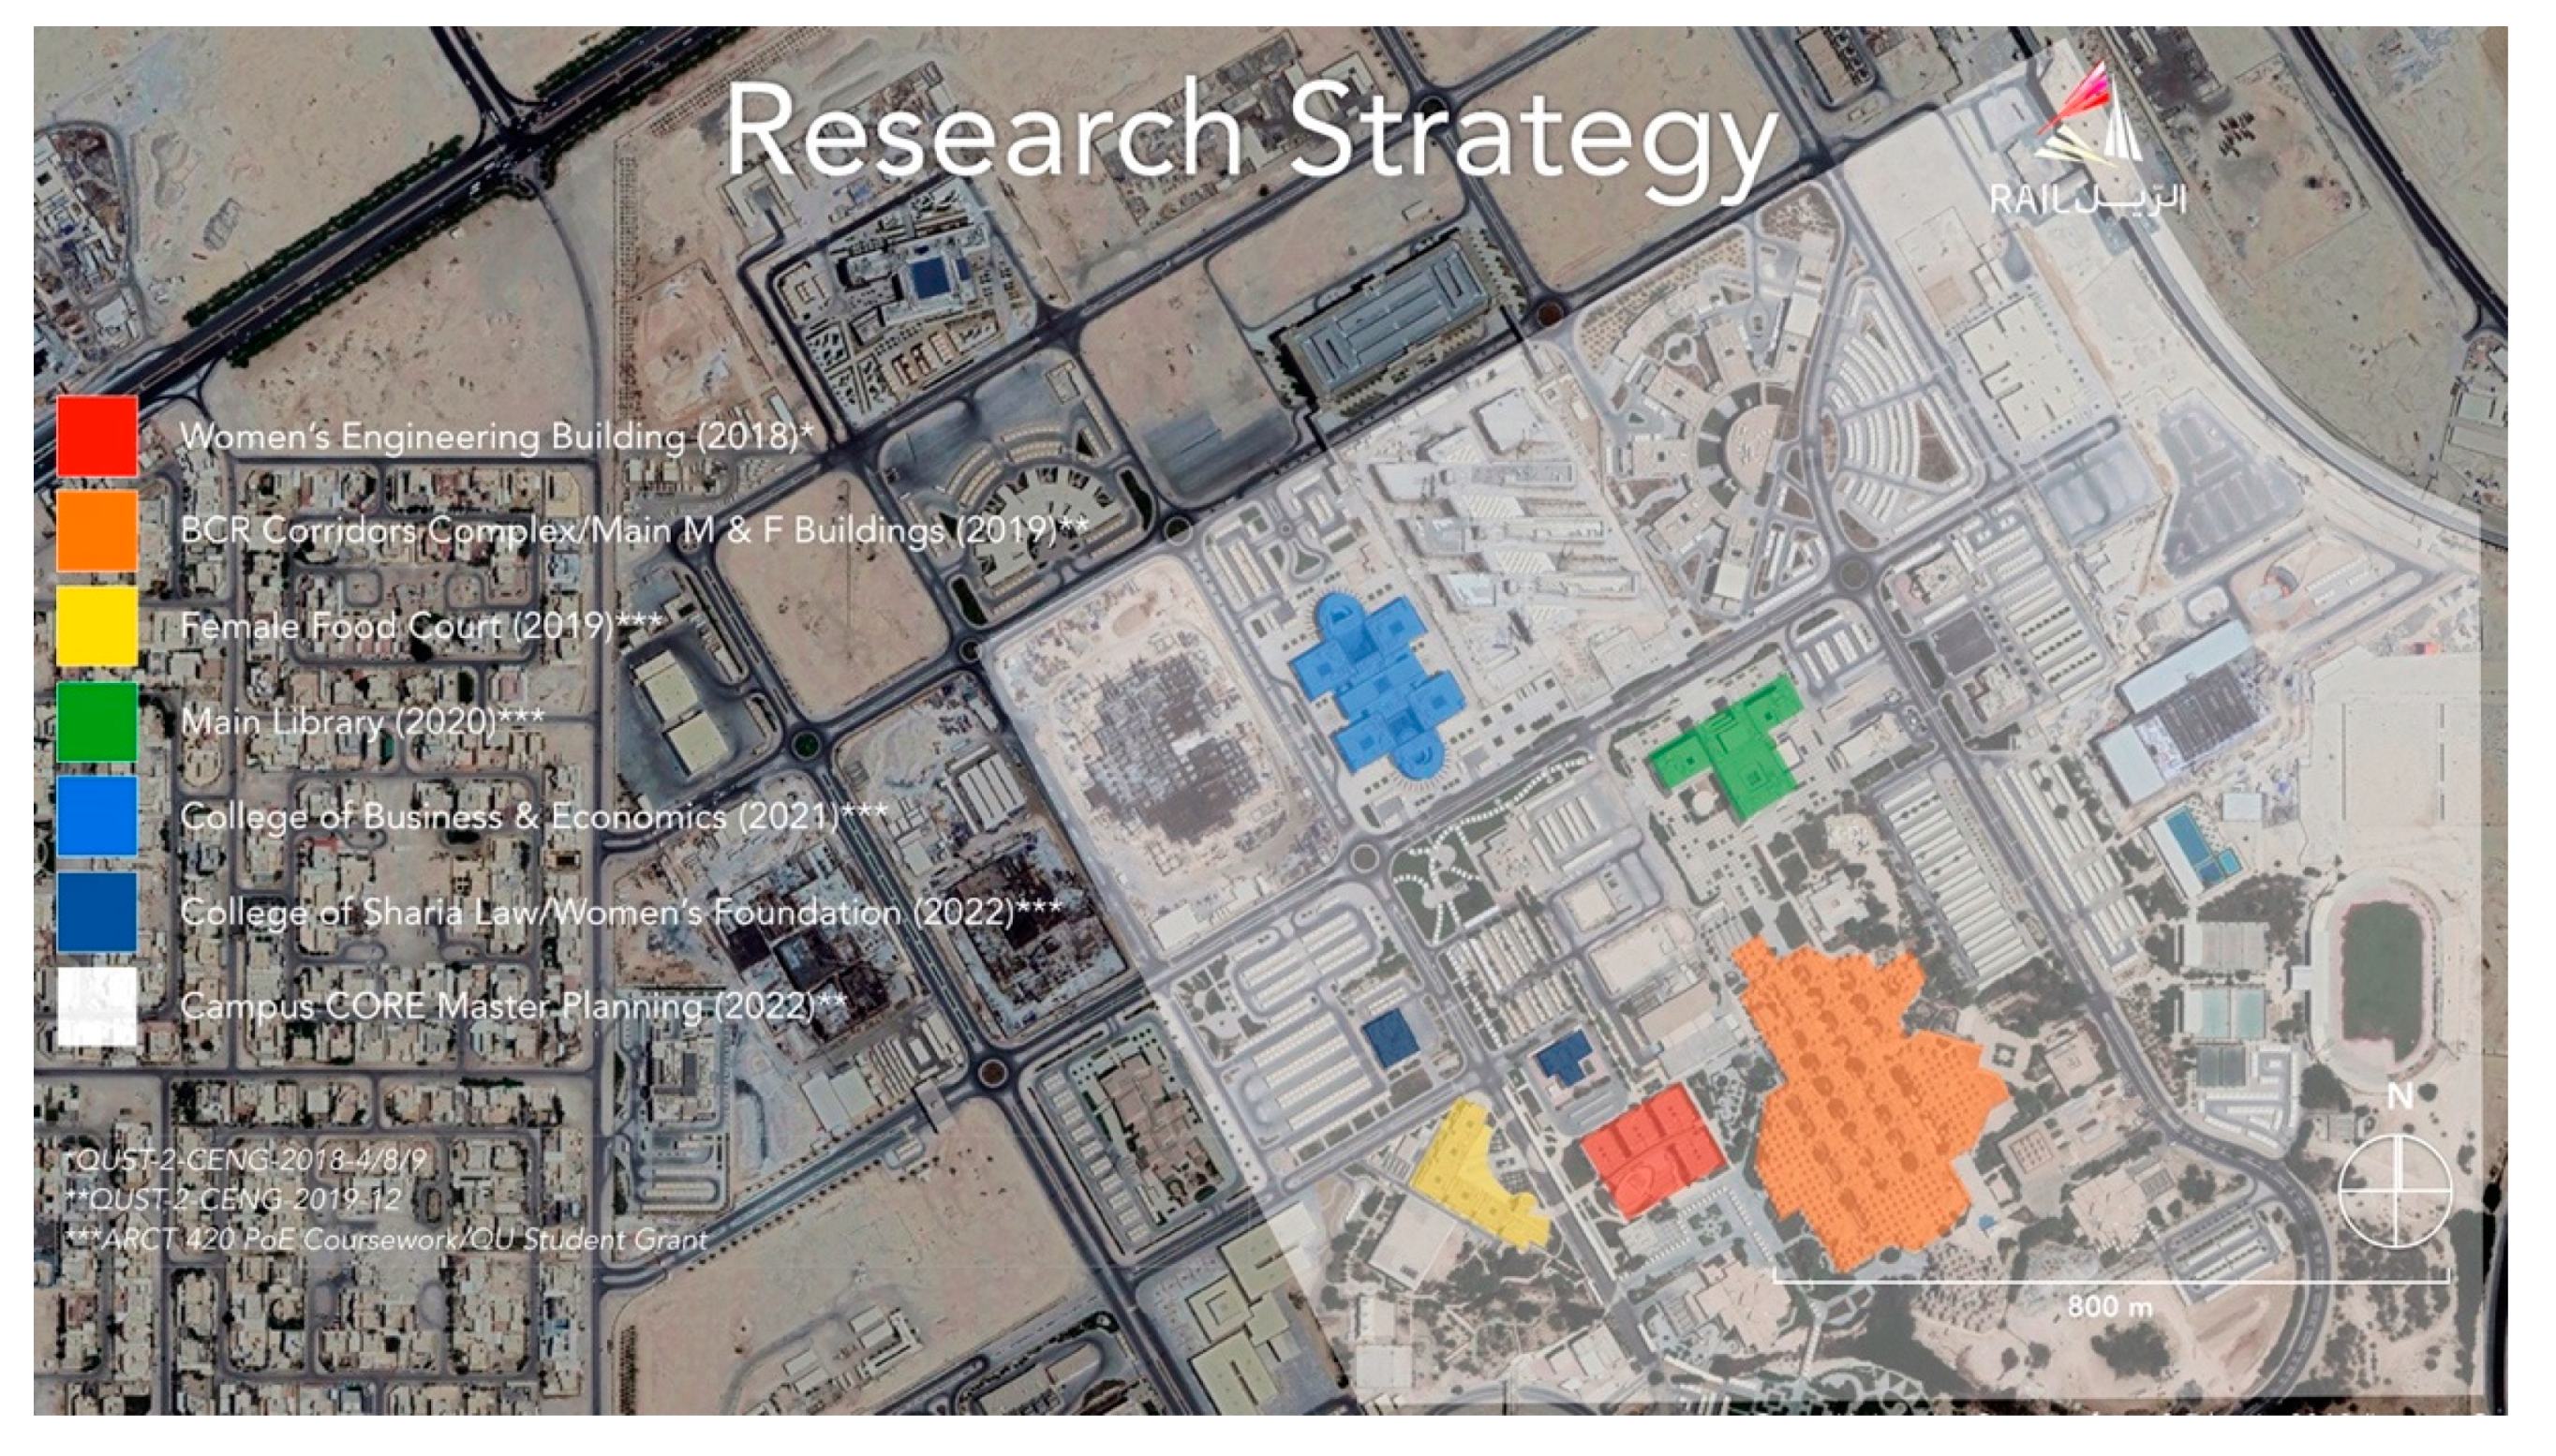
The Comfort/Complexity and Use in Building Evaluation (CUBE) studies in the DAUP-CENG at QU are part of a multi-year research strategy to generate data about movement and space use on an incremental building-by-building and year-by-year basis of the university facilities. The long-term goal is to develop a comprehensive dataset about post-occupancy use and movement flows on behalf of the QU Campus Facilities Department. It also includes deploying space syntax as a design tool in the evaluation of new building designs, design interventions in existing buildings, and campus master planning. The objective is to provide an analytical basis for promoting student performance and faculty research collaboration/innovation based on movement, casual social interaction, and healthy work environments in a world-class campus of higher education. This research strategy includes completed and planned PoE studies of (in order): QU Women’s Engineering Building in 2018; the case study of this paper in 2019; QU Main Library in 2020; and subsequently, the Female Food Court Building, College of Business and Economics, Women’s QU Foundation Building, Main Women’s Building, College of Sharia Law, and other buildings (
Figure 3). Once establishing the dataset for these core buildings, researchers intend to expand the study to the urban level, including evaluation of the impact of the Qatar Rail station on patterns of pedestrian and vehicular movement flows on the campus. The BCR Corridors complex is the second case study of the CUBE research project (
Figure 4).
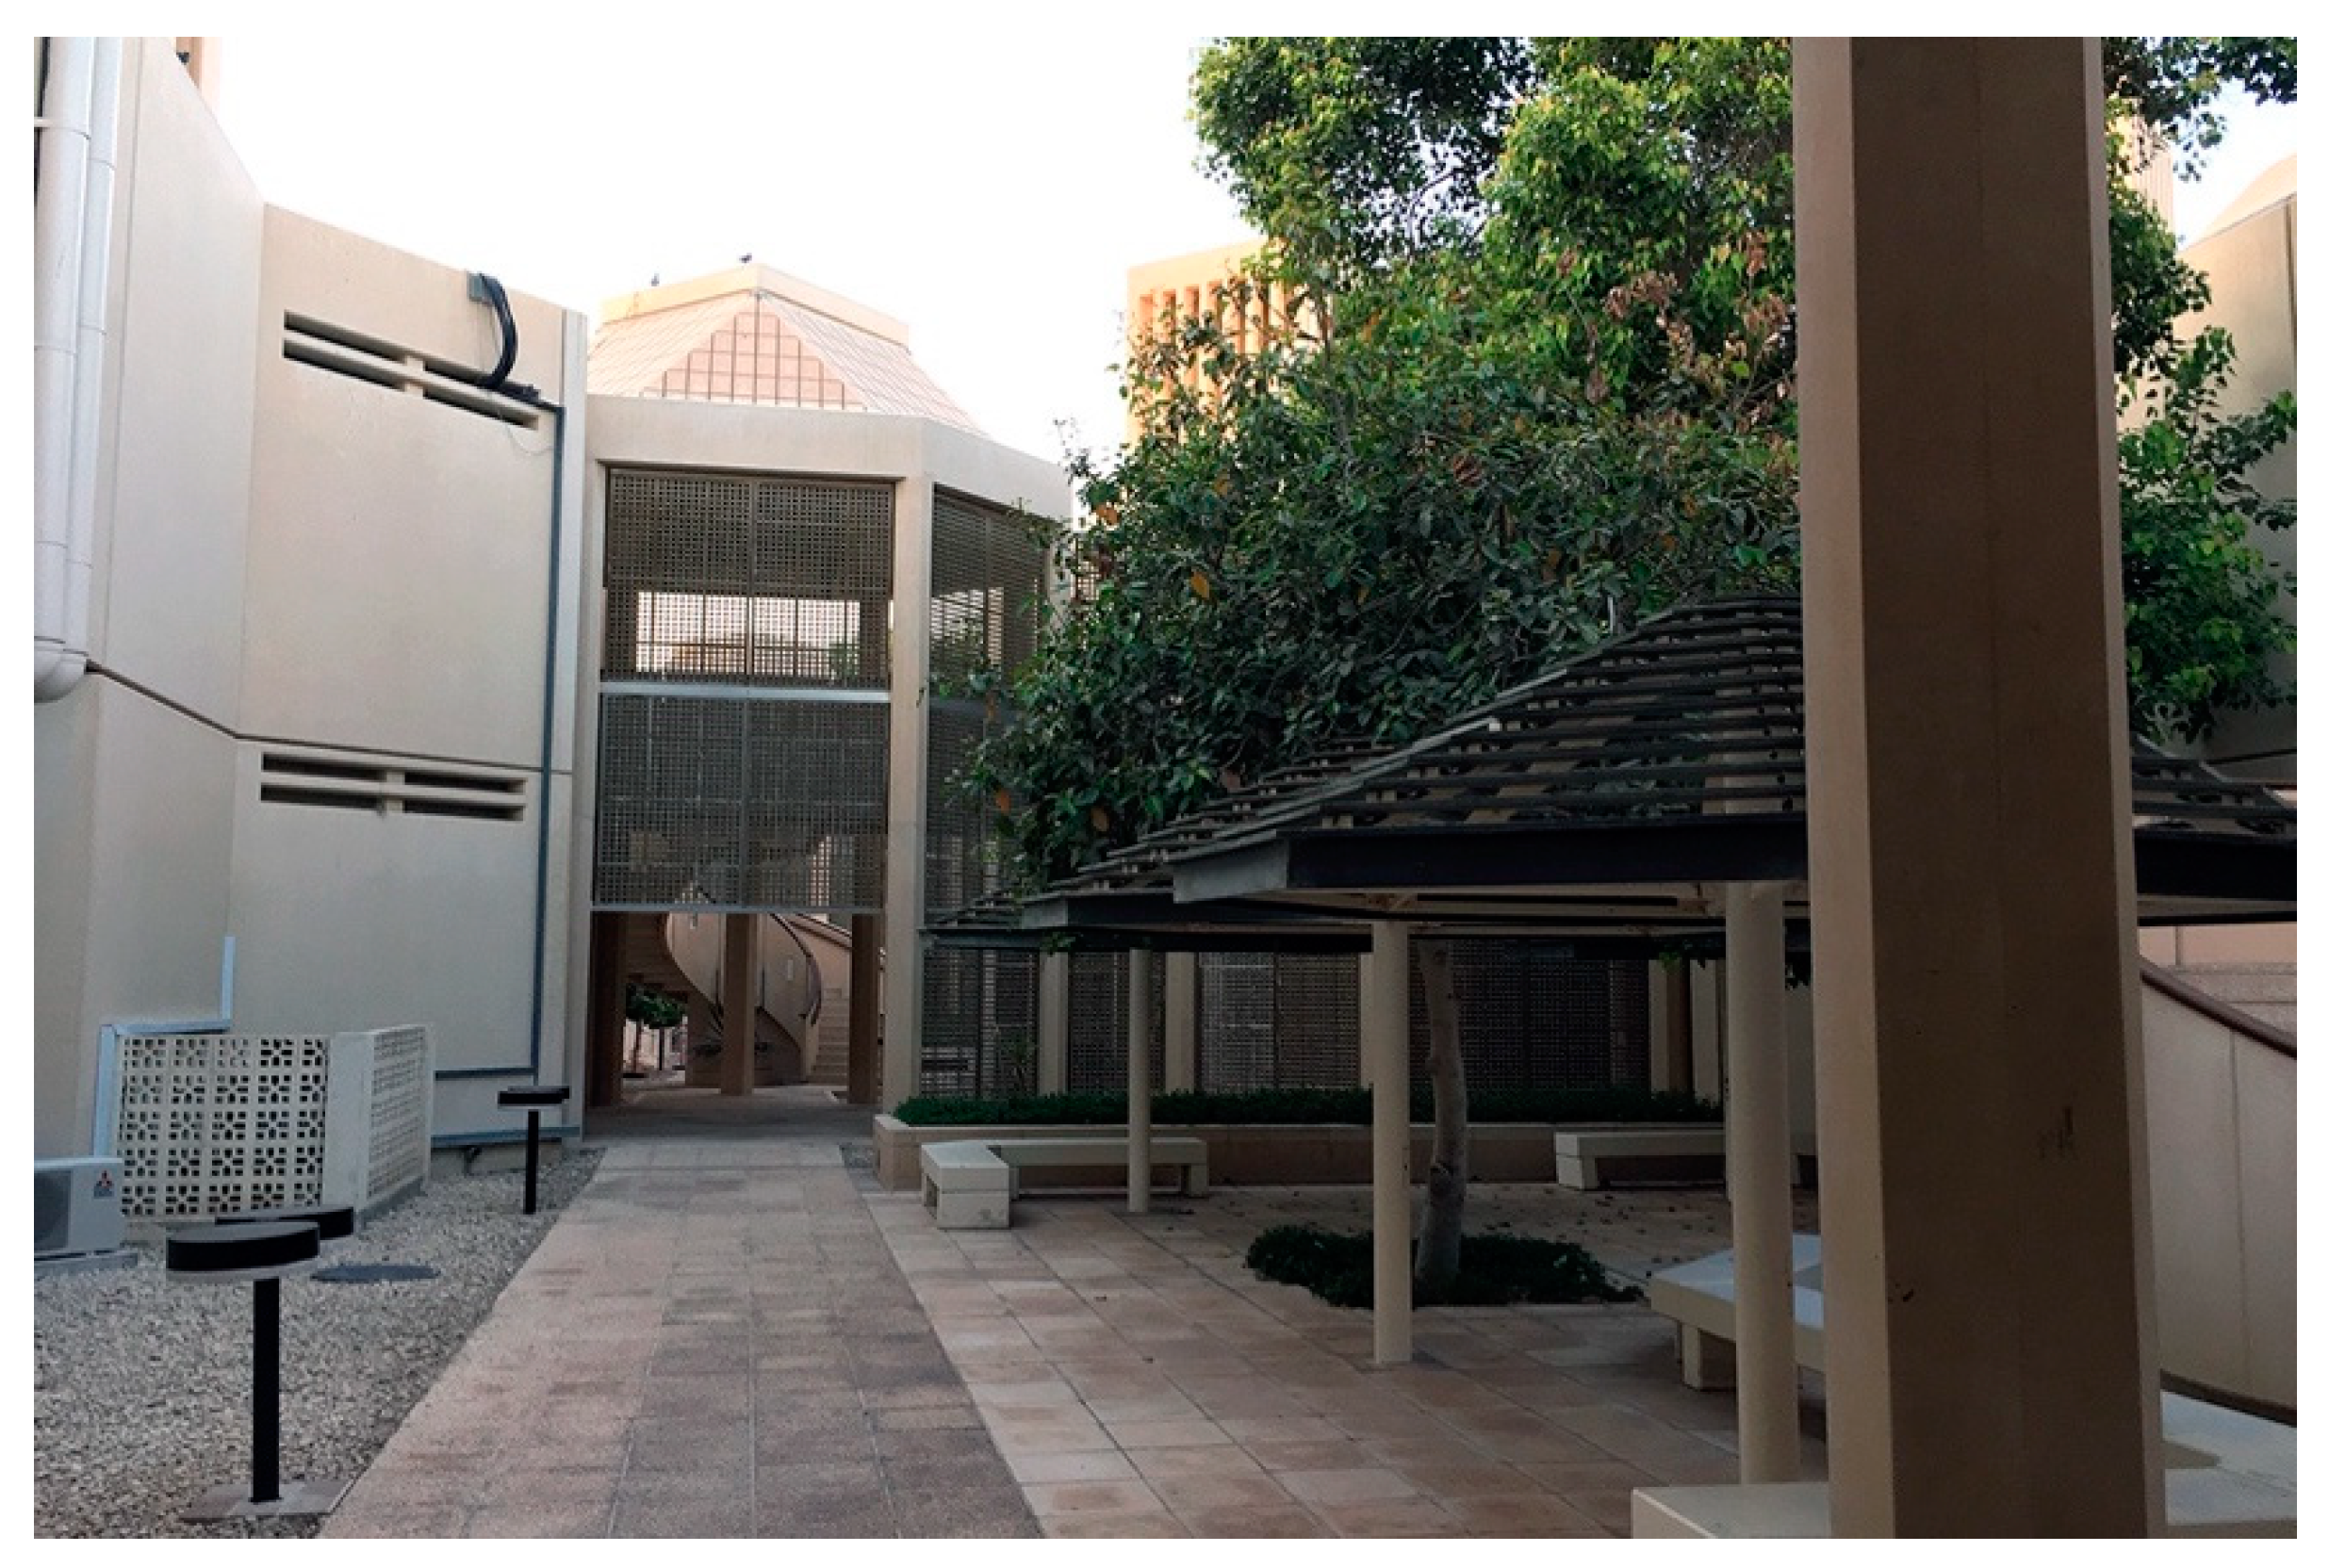
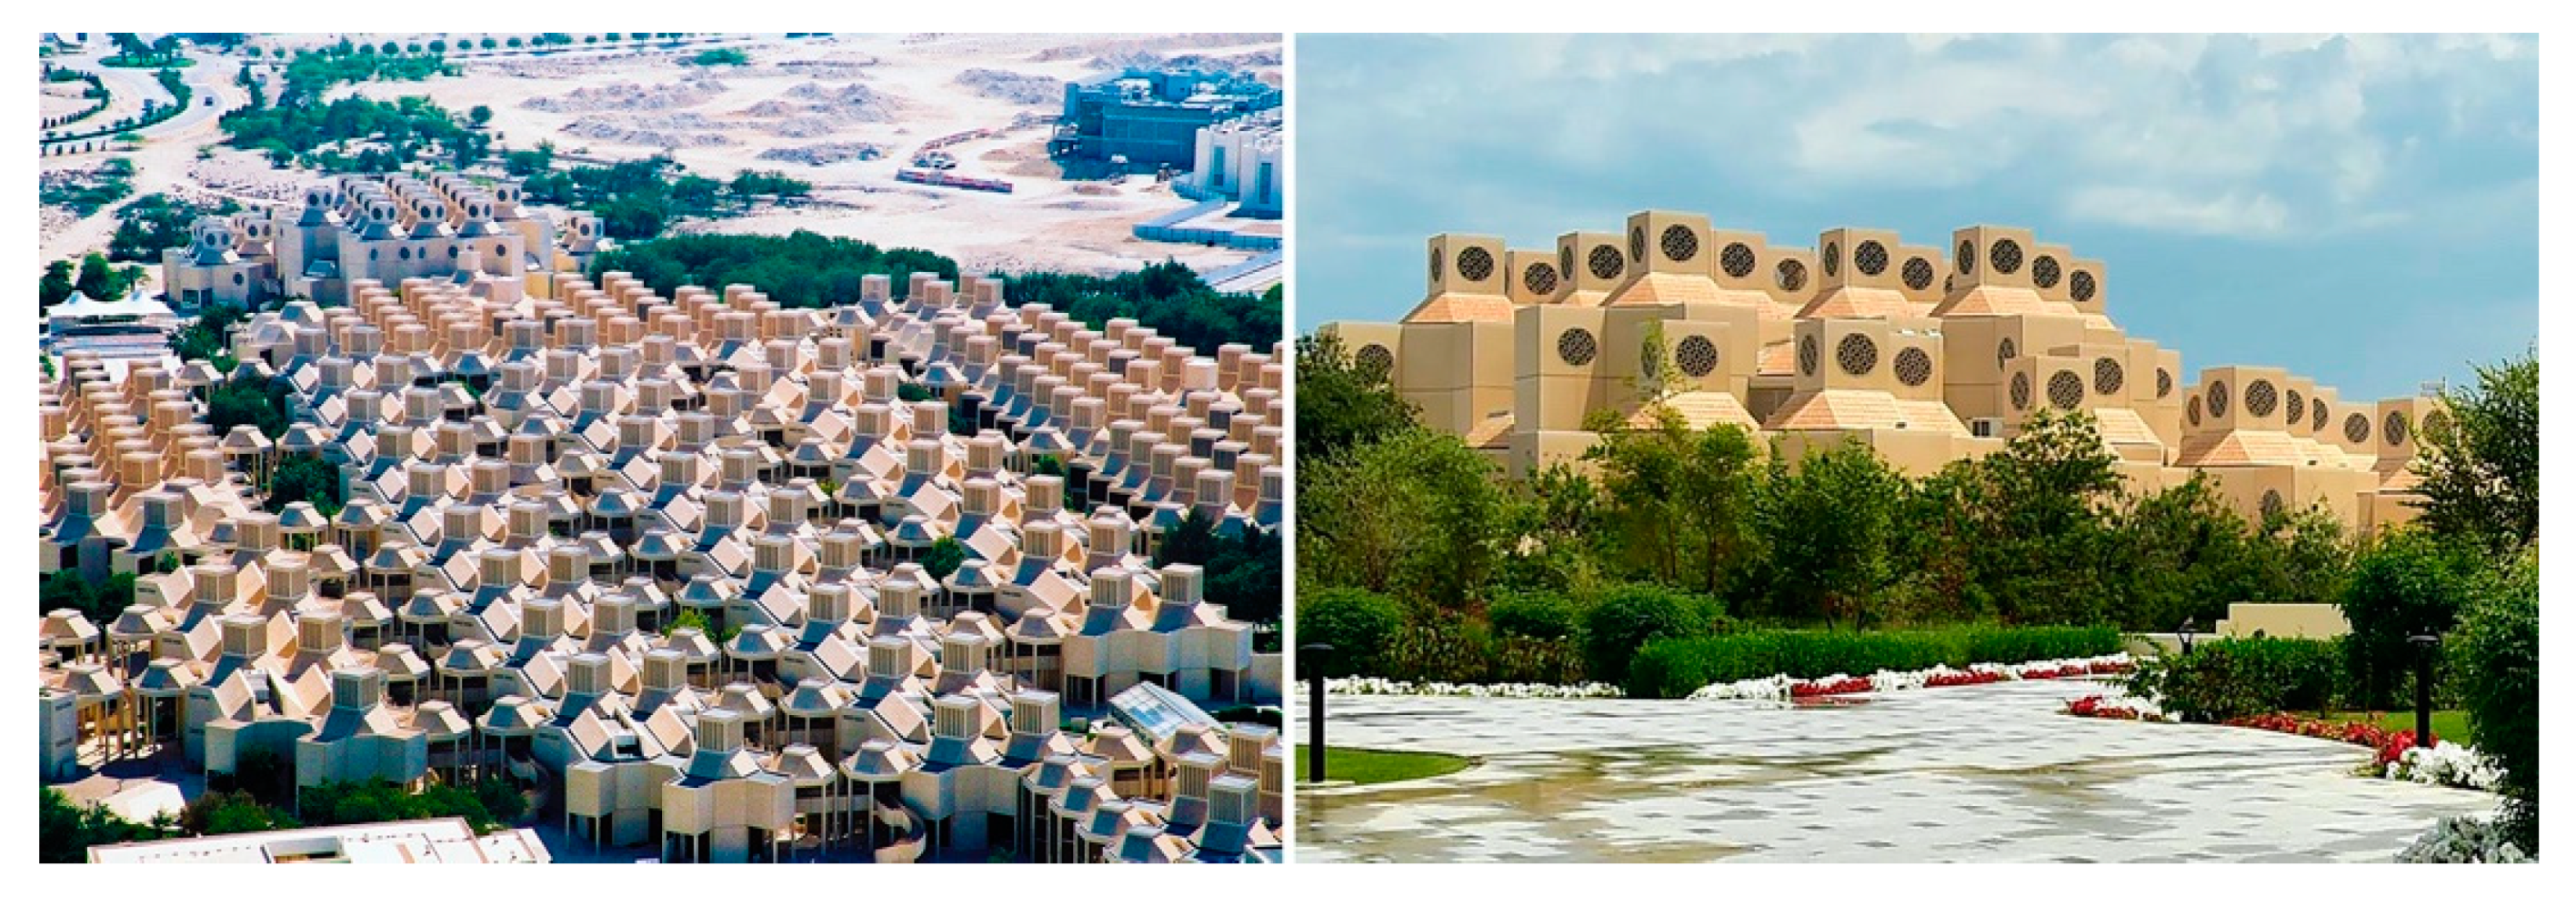
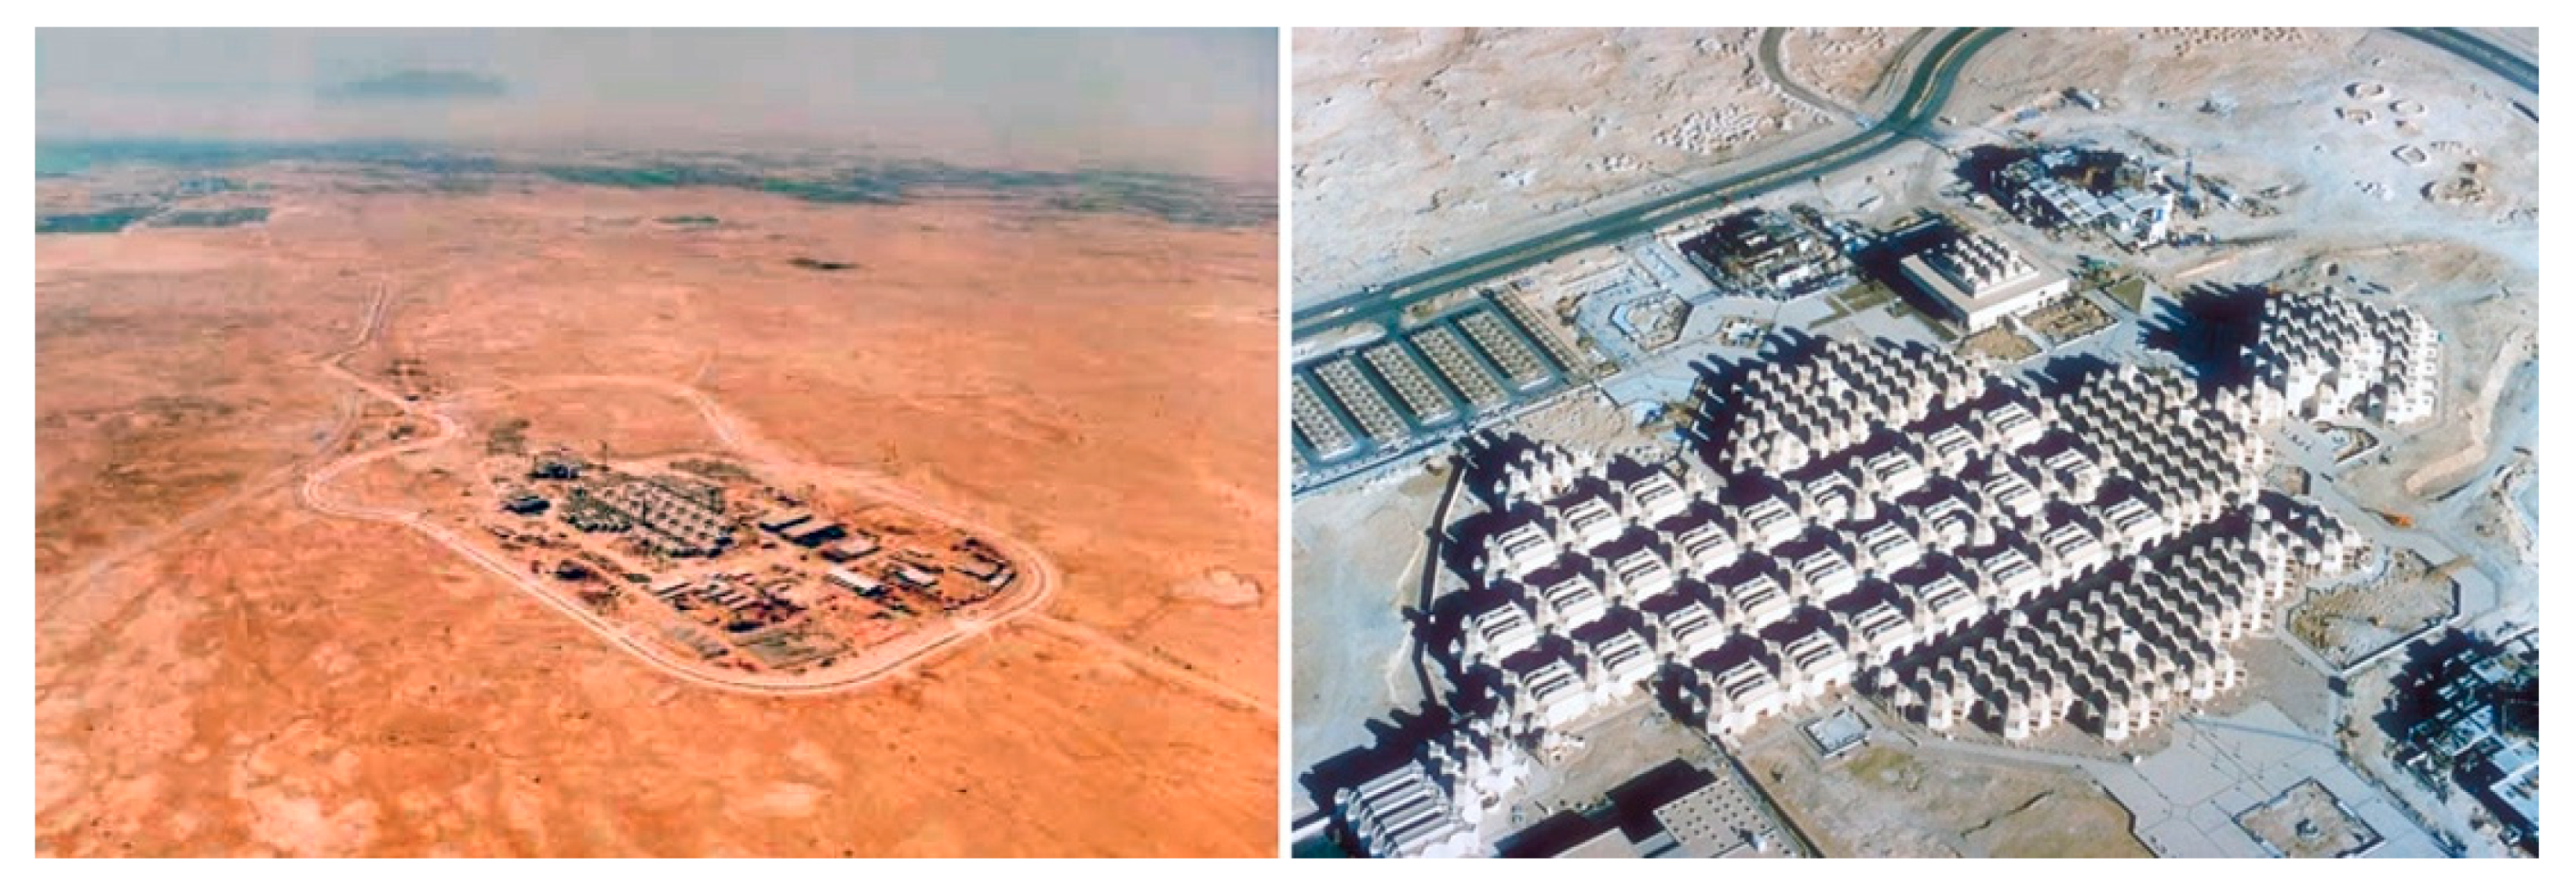
Constructed in the 1980s using a modular design concept by Egyptian architect Kamal El-Kafrawi, the BCR Corridors complex is the most iconic building on the QU campus (
Figure 5). It formed a critical component of the original campus masterplan by El-Kafrawi in consultation with Ove Arup & Partners and United Nations Educational, Scientific and Cultural Organization (UNESCO) on behalf of His Highness Sheikh Hamad bin Khalifa Al Thani, Emir (now Father Emir) of the State of Qatar. The original campus was in planning and construction from 1973–1985. Completion of the first building for the new QU (then Gulf University) occurred in 1982. The BCR Corridors were part of the first set of buildings built on the campus in the early 1980s (
Figure 6). The design was a shortlisted project for the Aga Khan Award for Architecture during the 1989 Cycle [
18,
19,
20,
21]. Today, QU is home to over 9000 students (excluding Foundation Studies students) and over 1100 faculty representing 52 nationalities. At QU, approximately 65% of students are Qatari and more than 70% are female.
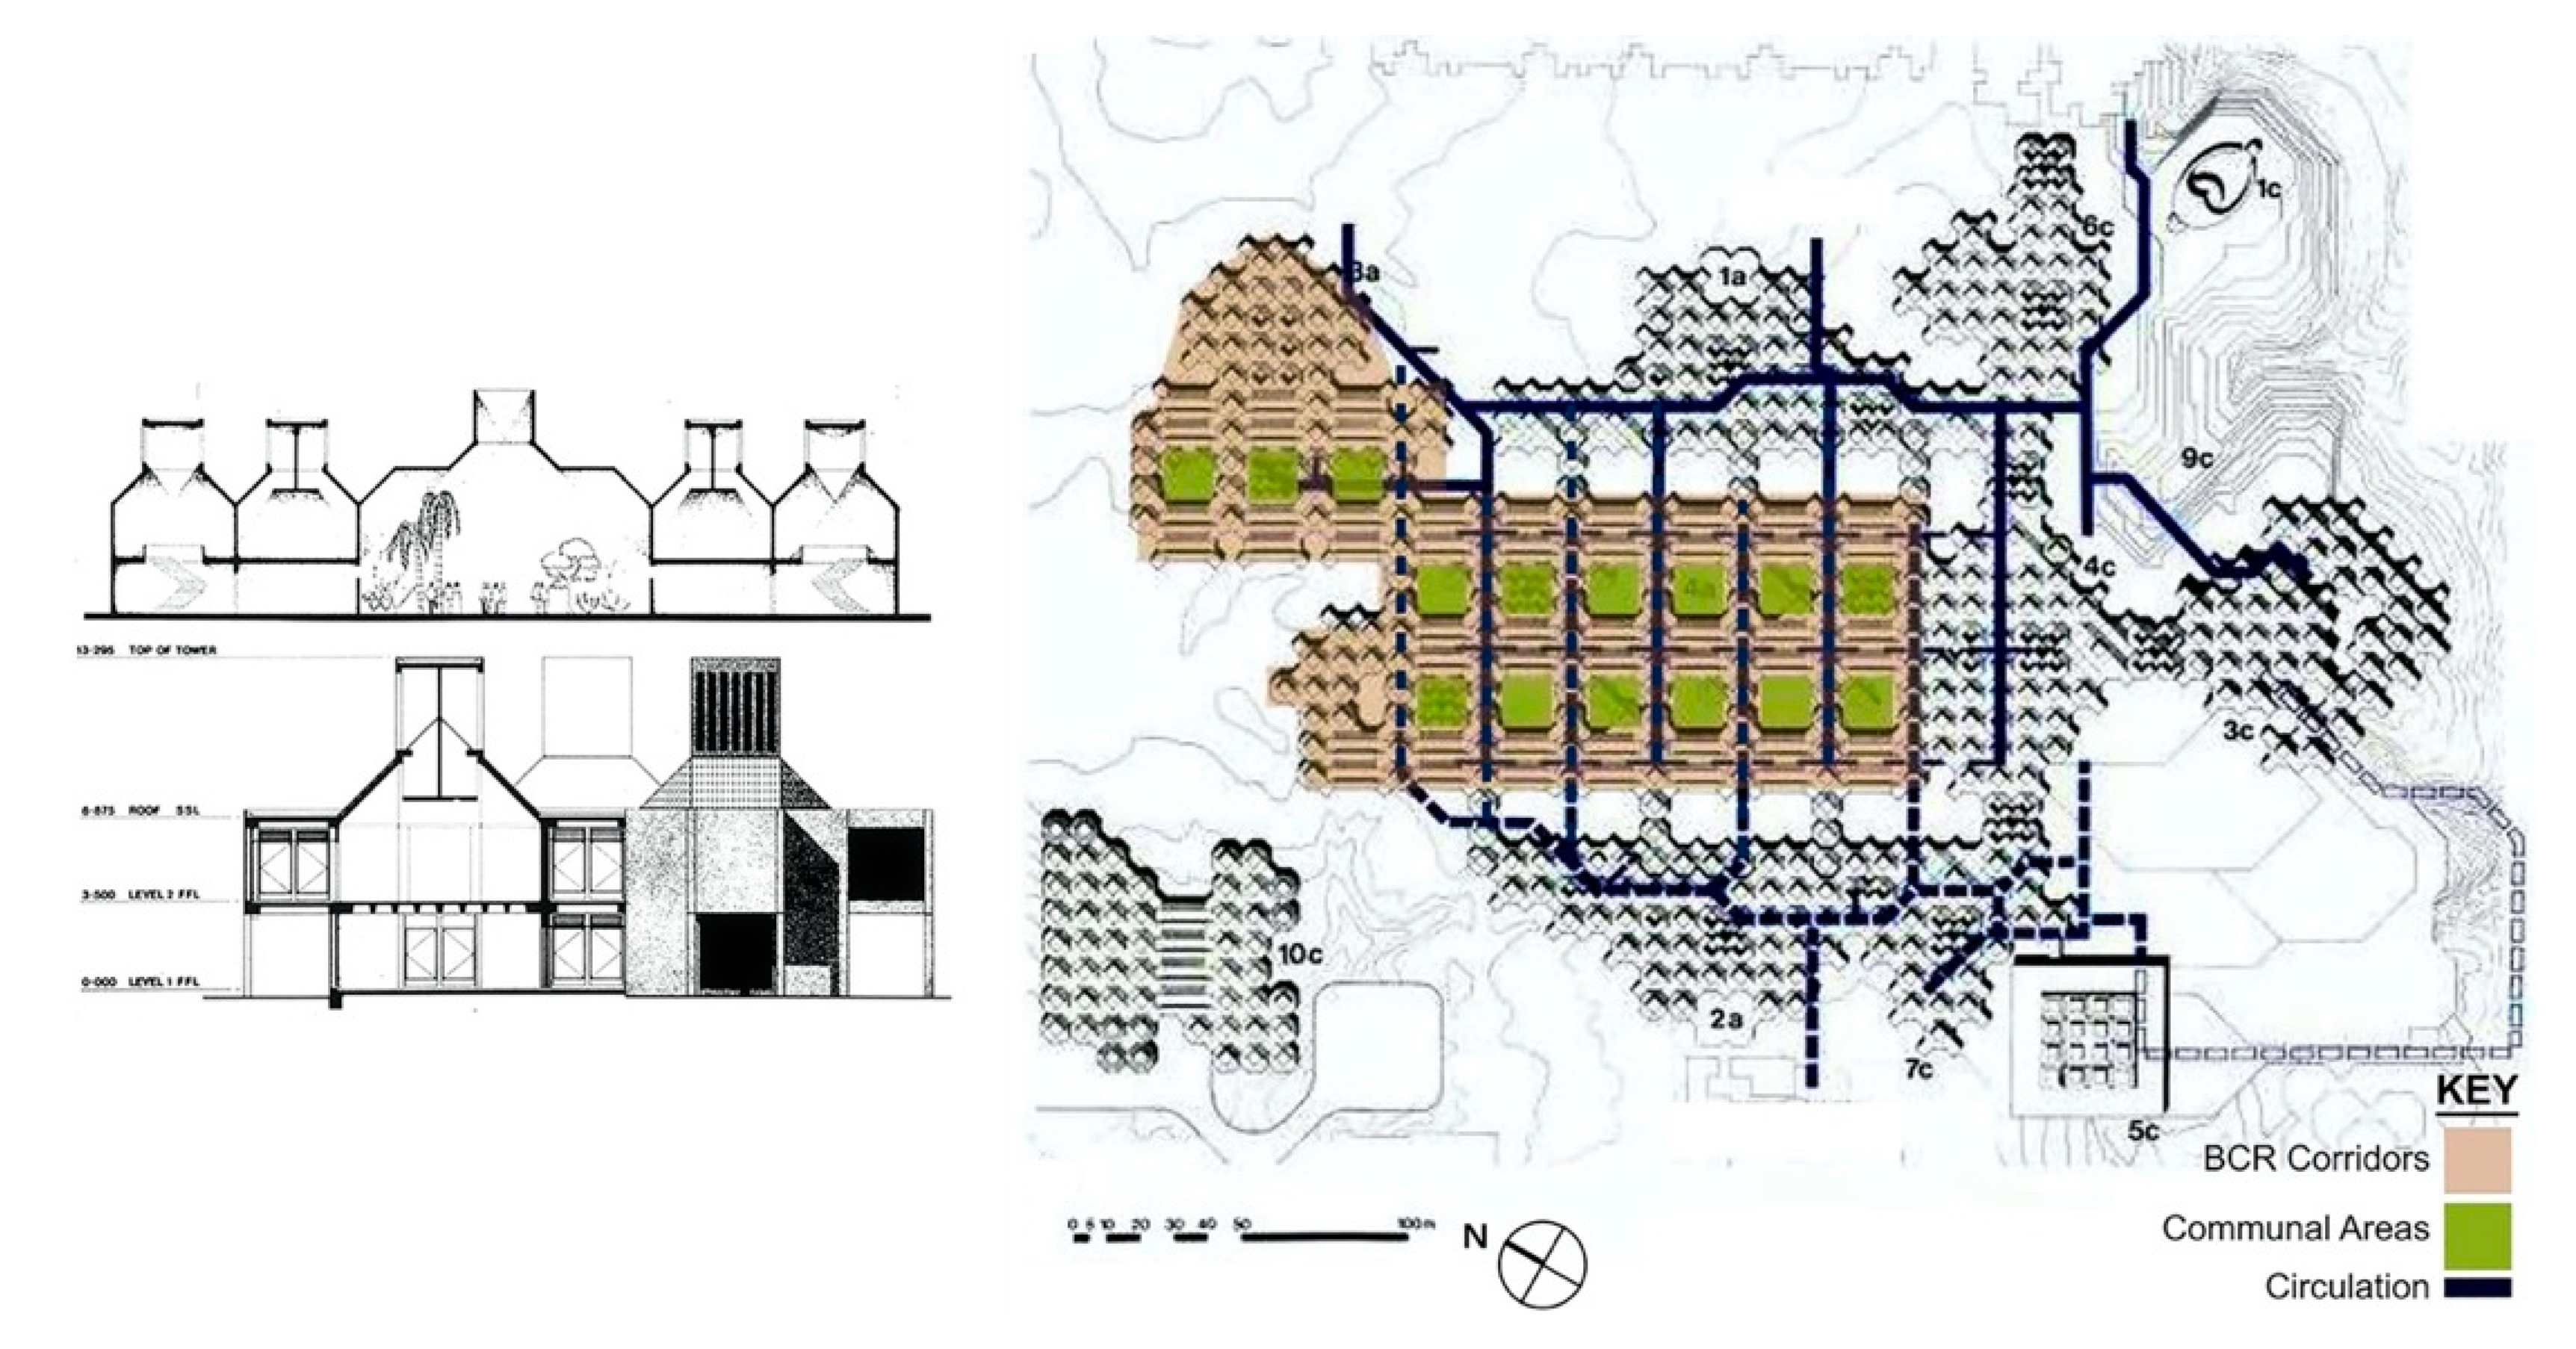
An interconnected grid of octagon forms grouped along ten (A–J) linear corridors composes the modular design of the BCR Corridors (
Figure 7) [
19]. Subdivision of the modules themselves provides for the functional spaces of the complex. The corridors provide the primary circulation in the plan in an approximate east-west direction and access to vertical circulation in section, primarily via multiple outdoor stairwells, but also interior elevators for disabled persons. Many outdoor segments of the corridors have vertical screens serving as shading devices for people in movement through the complex. At ground level between modules, covered (or partially covered) courtyards—most often with tree canopy and covered shading devices—serve as outdoor communal areas and provide a degree of cross-circulation in an approximate north–south direction through the complex. Currently, the BCR Corridors primarily houses the faculty, staff, students, classrooms, research laboratories and academic/service support facilities for much of the CENG at QU.
2. Methodology of the Study
The study proceeded in five stages. The first was a review of the literature, including a search for specific information about the case study, and site visits to develop a plan for observing space use and movement over several days in the BCR Corridors (
Figure 8). The next stage consisted, initially, of observations of entries at the perimeter and an extensive survey of room use in the complex. Second, there were observations of static occupation (sitting, standing, interacting) in the common areas of the BCR Corridors and discreet ‘passive’ following (meaning no interaction) of people entering the complex from every access point, calibrated to the entry counts based on gross percentages of use. During the third stage, researchers conducted extensive computer modeling of the BCR Corridors using space syntax methods, including convex mapping, least-line axial mapping, and auto-generation of ‘all-line’ axial maps and visibility graph analysis. There was also some follow-up fieldwork to verify results, especially for the building use survey. Then, the data collection and modeling of second and third stages fed the spatial analysis in the fourth stage, including developing several design recommendations. These recommendations purposefully included the most realistic options for design alterations, avoiding more radical, disruptive, and costly options due to the historical significance of the BCR Corridors in the Qatari architecture tradition. Researchers completed the last stage by compiling all of this data collection, analysis, and recommendations in their reporting and dissemination to various outlets.
The study effectively took six months spread out over the year with a pause during the summer, so it was limited in scope. It involved two rounds of observation by undergraduate students in February and November 2019. The hot and arid climate of the desert environment of Qatar has a direct bearing on the seasonal use of university buildings. The weather during these two rounds of observations was sunny, pleasant, and 22–27 °C in February with no precipitation, and sunny, warm, and 34–24 °C in November with only two days of intermittent rainfall.
The approximate total metric area of the BCR Corridors is ~42,750 m
2 (460,200 square feet or ‘sqft’), including outdoor communal areas. There is approximately ~28,750 m
2 (309,200 sqft) at ground level and ~14,575 m
2 (150,700 sqft) on the first floor. The building complex occupies a site of about 2.875 hectares (ha) (7 acres or ‘ac’) [
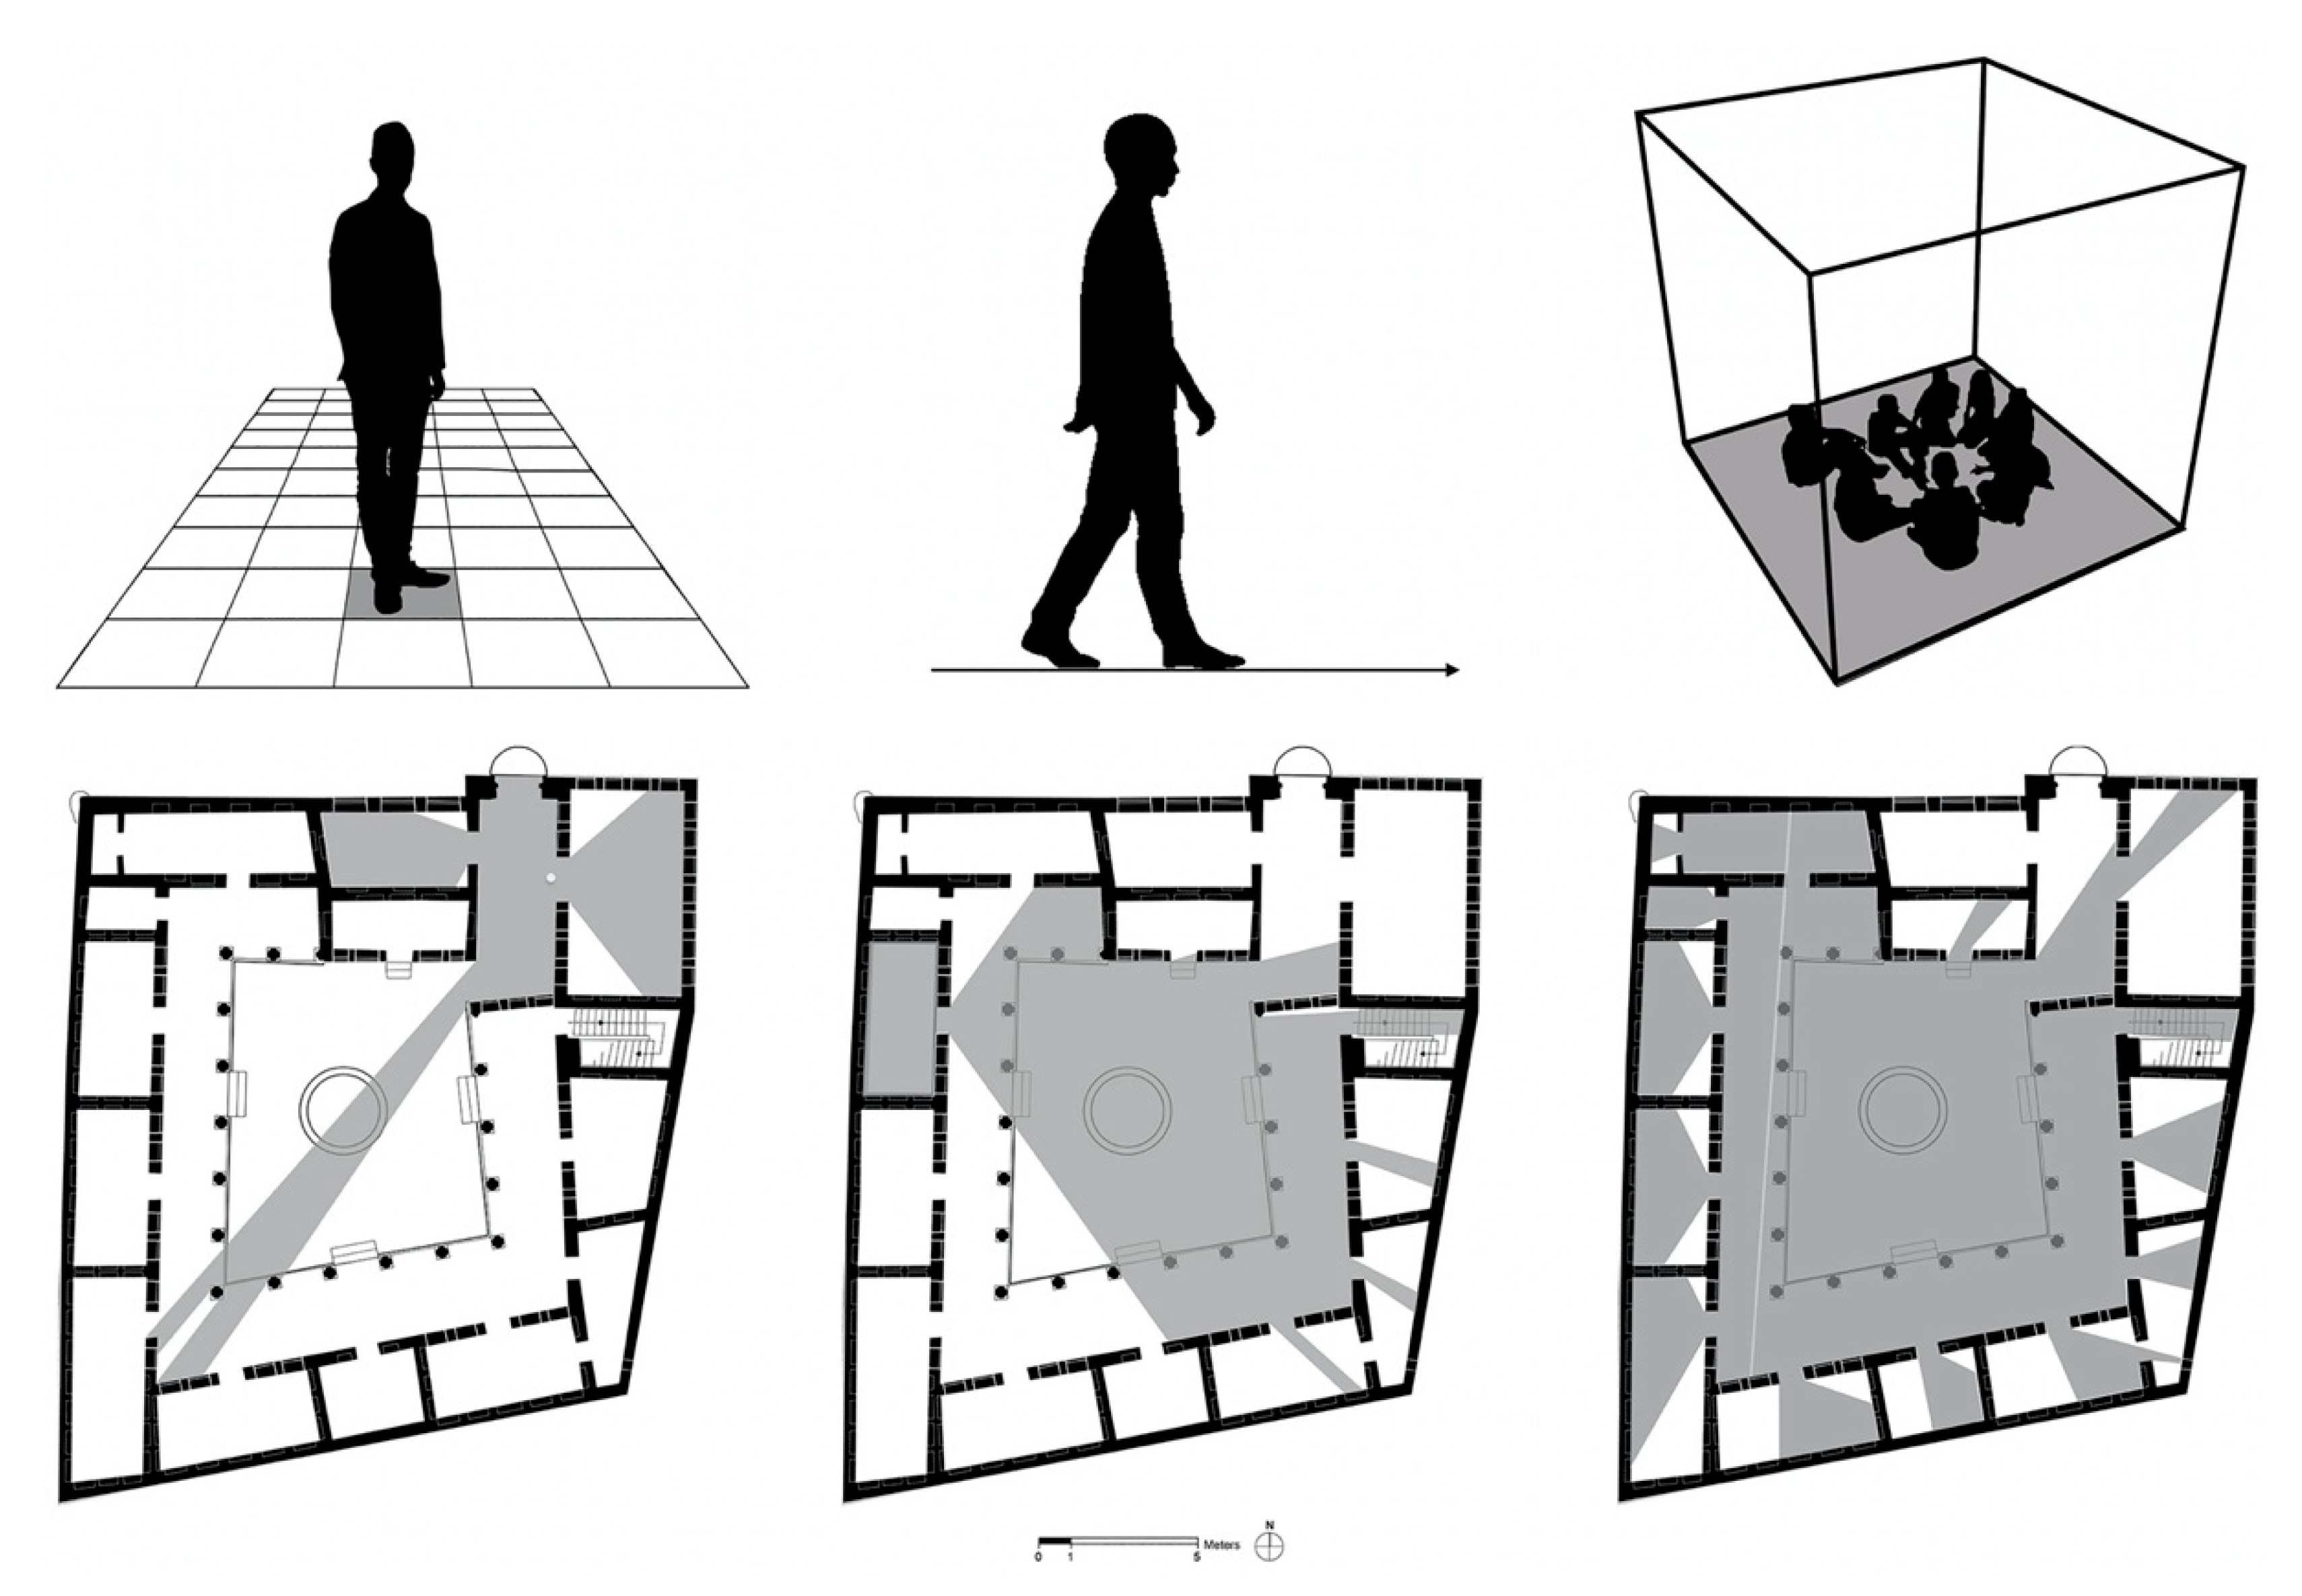
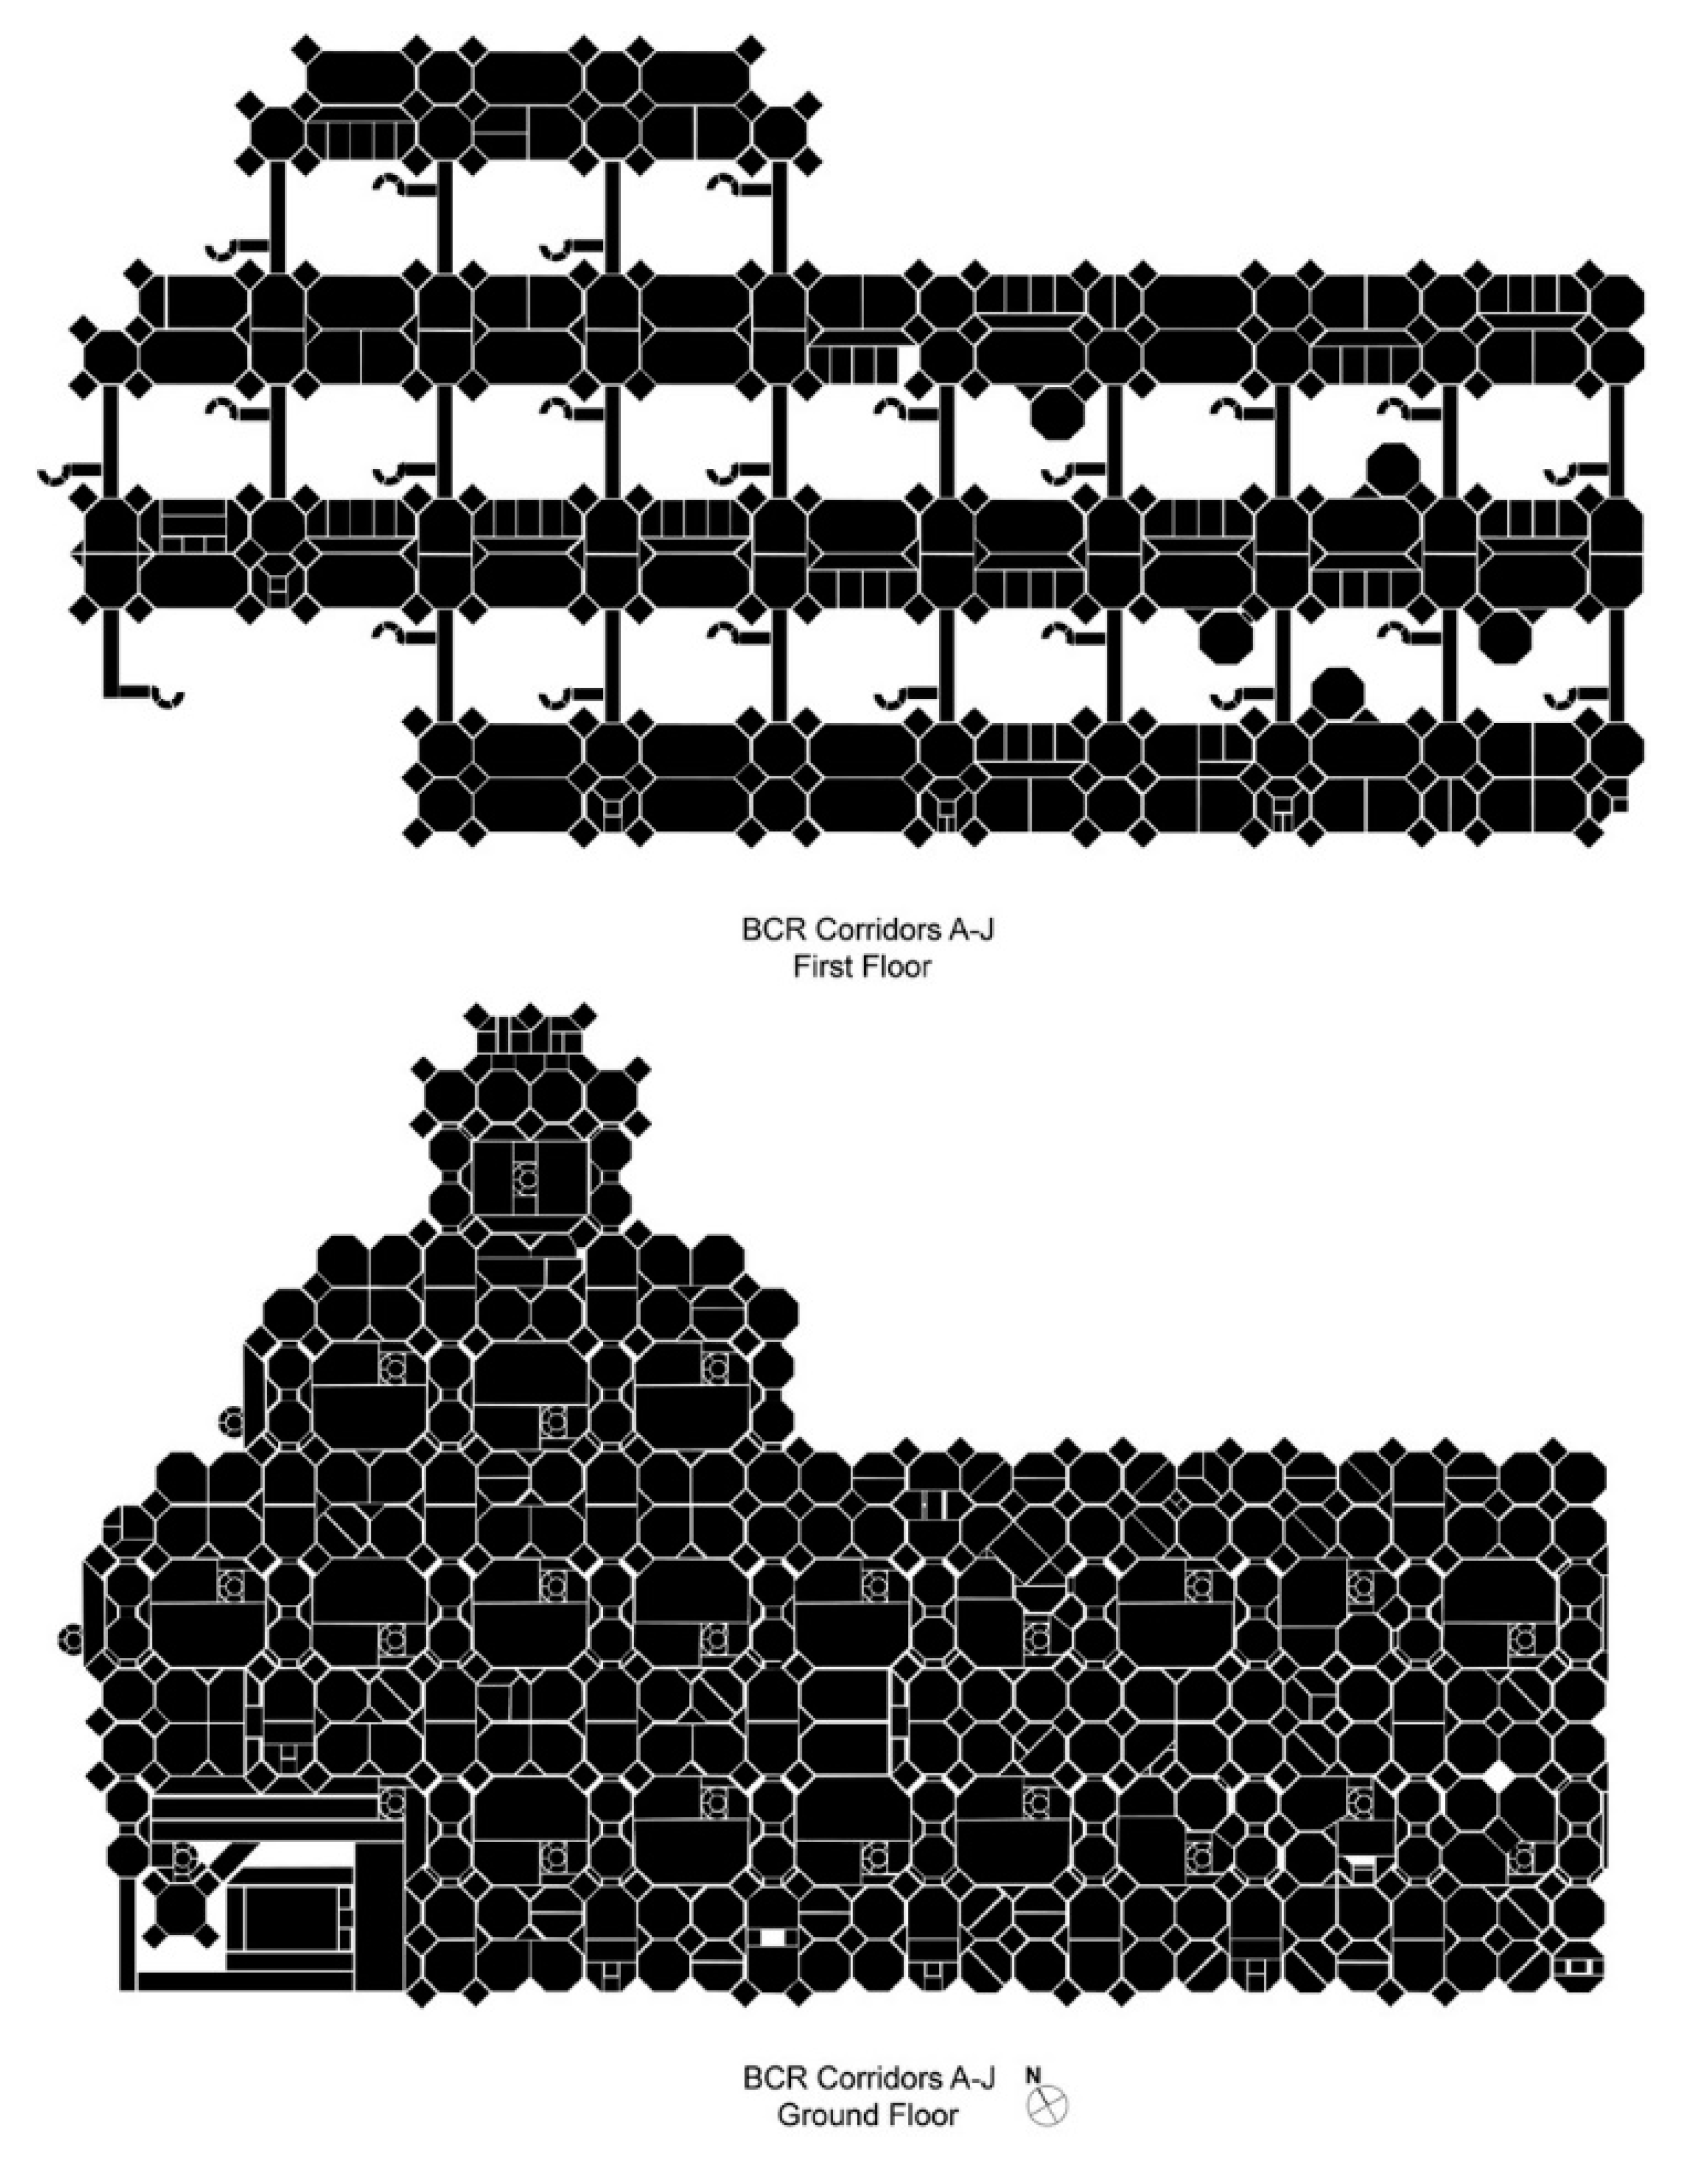
21]. The study included convex mapping of 1575 convex spaces on two floors, including the outdoor communal areas/corridors on both levels: 1045 on the ground floor and 530 on the first floor. The occupation of space tends to be convex where everyone can see and be seen by everyone else, such as a group of people gathered in a circle or a room. A convex space is a defined polygon in the plan where all points are visible to all other points in that space. The collection of all convex spaces in a building is the convex map, which tends to be a useful representation in building design and post-occupancy evaluations using space syntax. In total, this represents an approximate average of about 27.5 m
2 (or <300 sqft) per convex space in the BCR Corridors (
Figure 9).
The largest convex spaces in the BCR Corridors are the 14 outdoor communal areas (all the same size and shape at +/−100 m2 or 1075 sqft) adjacent to the vertical stairwell access points, except between Corridor B and C, which is more broken-up by built protrusions into some communal areas. Outdoor communal areas of this size are available between Corridors A and B (1), C and D (1), D and E (1), E and F (2), F and G (3), G and H (3), H and I (2), and I and J (1). The smallest convex spaces are threshold spaces on the ground floor (47 in total), approximately 0.75 m2 (or 8 sqft) in size defining the transitions from inside-to-outside of the modules along the corridors. This high degree of complexity and repetitive similarly in the convex map of the BCR Corridors significantly contributes to the way-finding problems in the complex. The problem is especially acute at the ground level. The broken-up convexity of the outdoor communal spaces further complicates due to the extrusion of vertical access stairwells, built form protrusions attached to octagon-shaped modules, hardscaping/landscape features requiring deviation around in movement, and the use of vertical screens as shading devices. Because of this, there is almost exactly twice the number of convex spaces at the ground level of the BCR Corridors (1045) compared to its first floor (530).
Fieldwork included a building survey of room usage (discussed in the next section) and counts of people entering the BCR Corridors at 20 access points to the complex. Based on these two-minute counts in the top and bottom 30 min of each hour from 7:00 am to 5:00 pm, representing an entire day of entry into the building, researchers estimate that the BCR Corridors have approximately 14,670 users per day. In gross terms, this is 22% higher than the Women’s Engineering Building (case study for CUBE
1) with a projection of 12,000 users per day. However, the building footprint of the BCR Corridors is nearly four times larger than the Women’s Engineering Building, and the overall floor area is more than two-and-a-half times larger (+/−42,750 m
2 compared to +/−16,000 m
2). It suggests that the BCR Corridors is significantly underperforming for the gross number of users for a building of its size compared to the Women’s Engineering Building. However, the BCR Corridors are also on the male side of the campus, whereas the Women’s Engineering Building is on the female side. More than 70% of QU students are female. On that side of the campus, female students dominate the user profile (91%) of the Women’s Engineering Building. Students represent nearly 48% of all users in the BCR, the overwhelming majority of which are male students (80%). Faculty/administrative personnel represent almost 29% of all users, with males again constituting the majority (82.5%) of this user type. Seven percent (7%) and sixteen percent (16.0%) of the users are security and service personnel, respectively, which again are almost entirely male in both cases (95.5%) (
Table 1). Female students only represent about 10% of all users in the BCR Corridors. However, researchers noted the number of female students appears to increase at the perimeter of the complex in all directions, i.e., on the male and female sides of the campus. At the same time, there seem to be fewer female students actually inside the complex.
Approximately 40% of all users enter the BCR Corridors from the western edges near the greenhouse (
Figure 10). Most of these users (30%) head southeast using the outdoor communal circulation route paralleling the southwestern edge adjacent to the female campus (
Figure 10). There is no discernible difference in the ratio between male and female users (relative to overall university student population) entering from this direction, so it is not an effect of the multiple access points to the female campus in this area. About 27% of all users enter centrally on the northeastern perimeter near the access points for Corridor E and F. More than half of them either use the communal areas—adjacent to the Annex wing—as a cut-through route to travel further to the north to the university mosque, library, or other locations in the vicinity. Similarly, another 10% use the communal areas through the Annex wing further to the northeast as a cut-through route for the same purpose. In both cases, a few people are accessing modules of the Annex wing in the complex. Alternatively, many of these people entering the complex from this direction directly access Corridor F, which passes entirely through the complex from the male to the female campus. Entries at the rest of the additional ten (10) access points to the BCR Corridors have even distributions, representing 4% or less of total entries for each and less than 25% in gross terms.
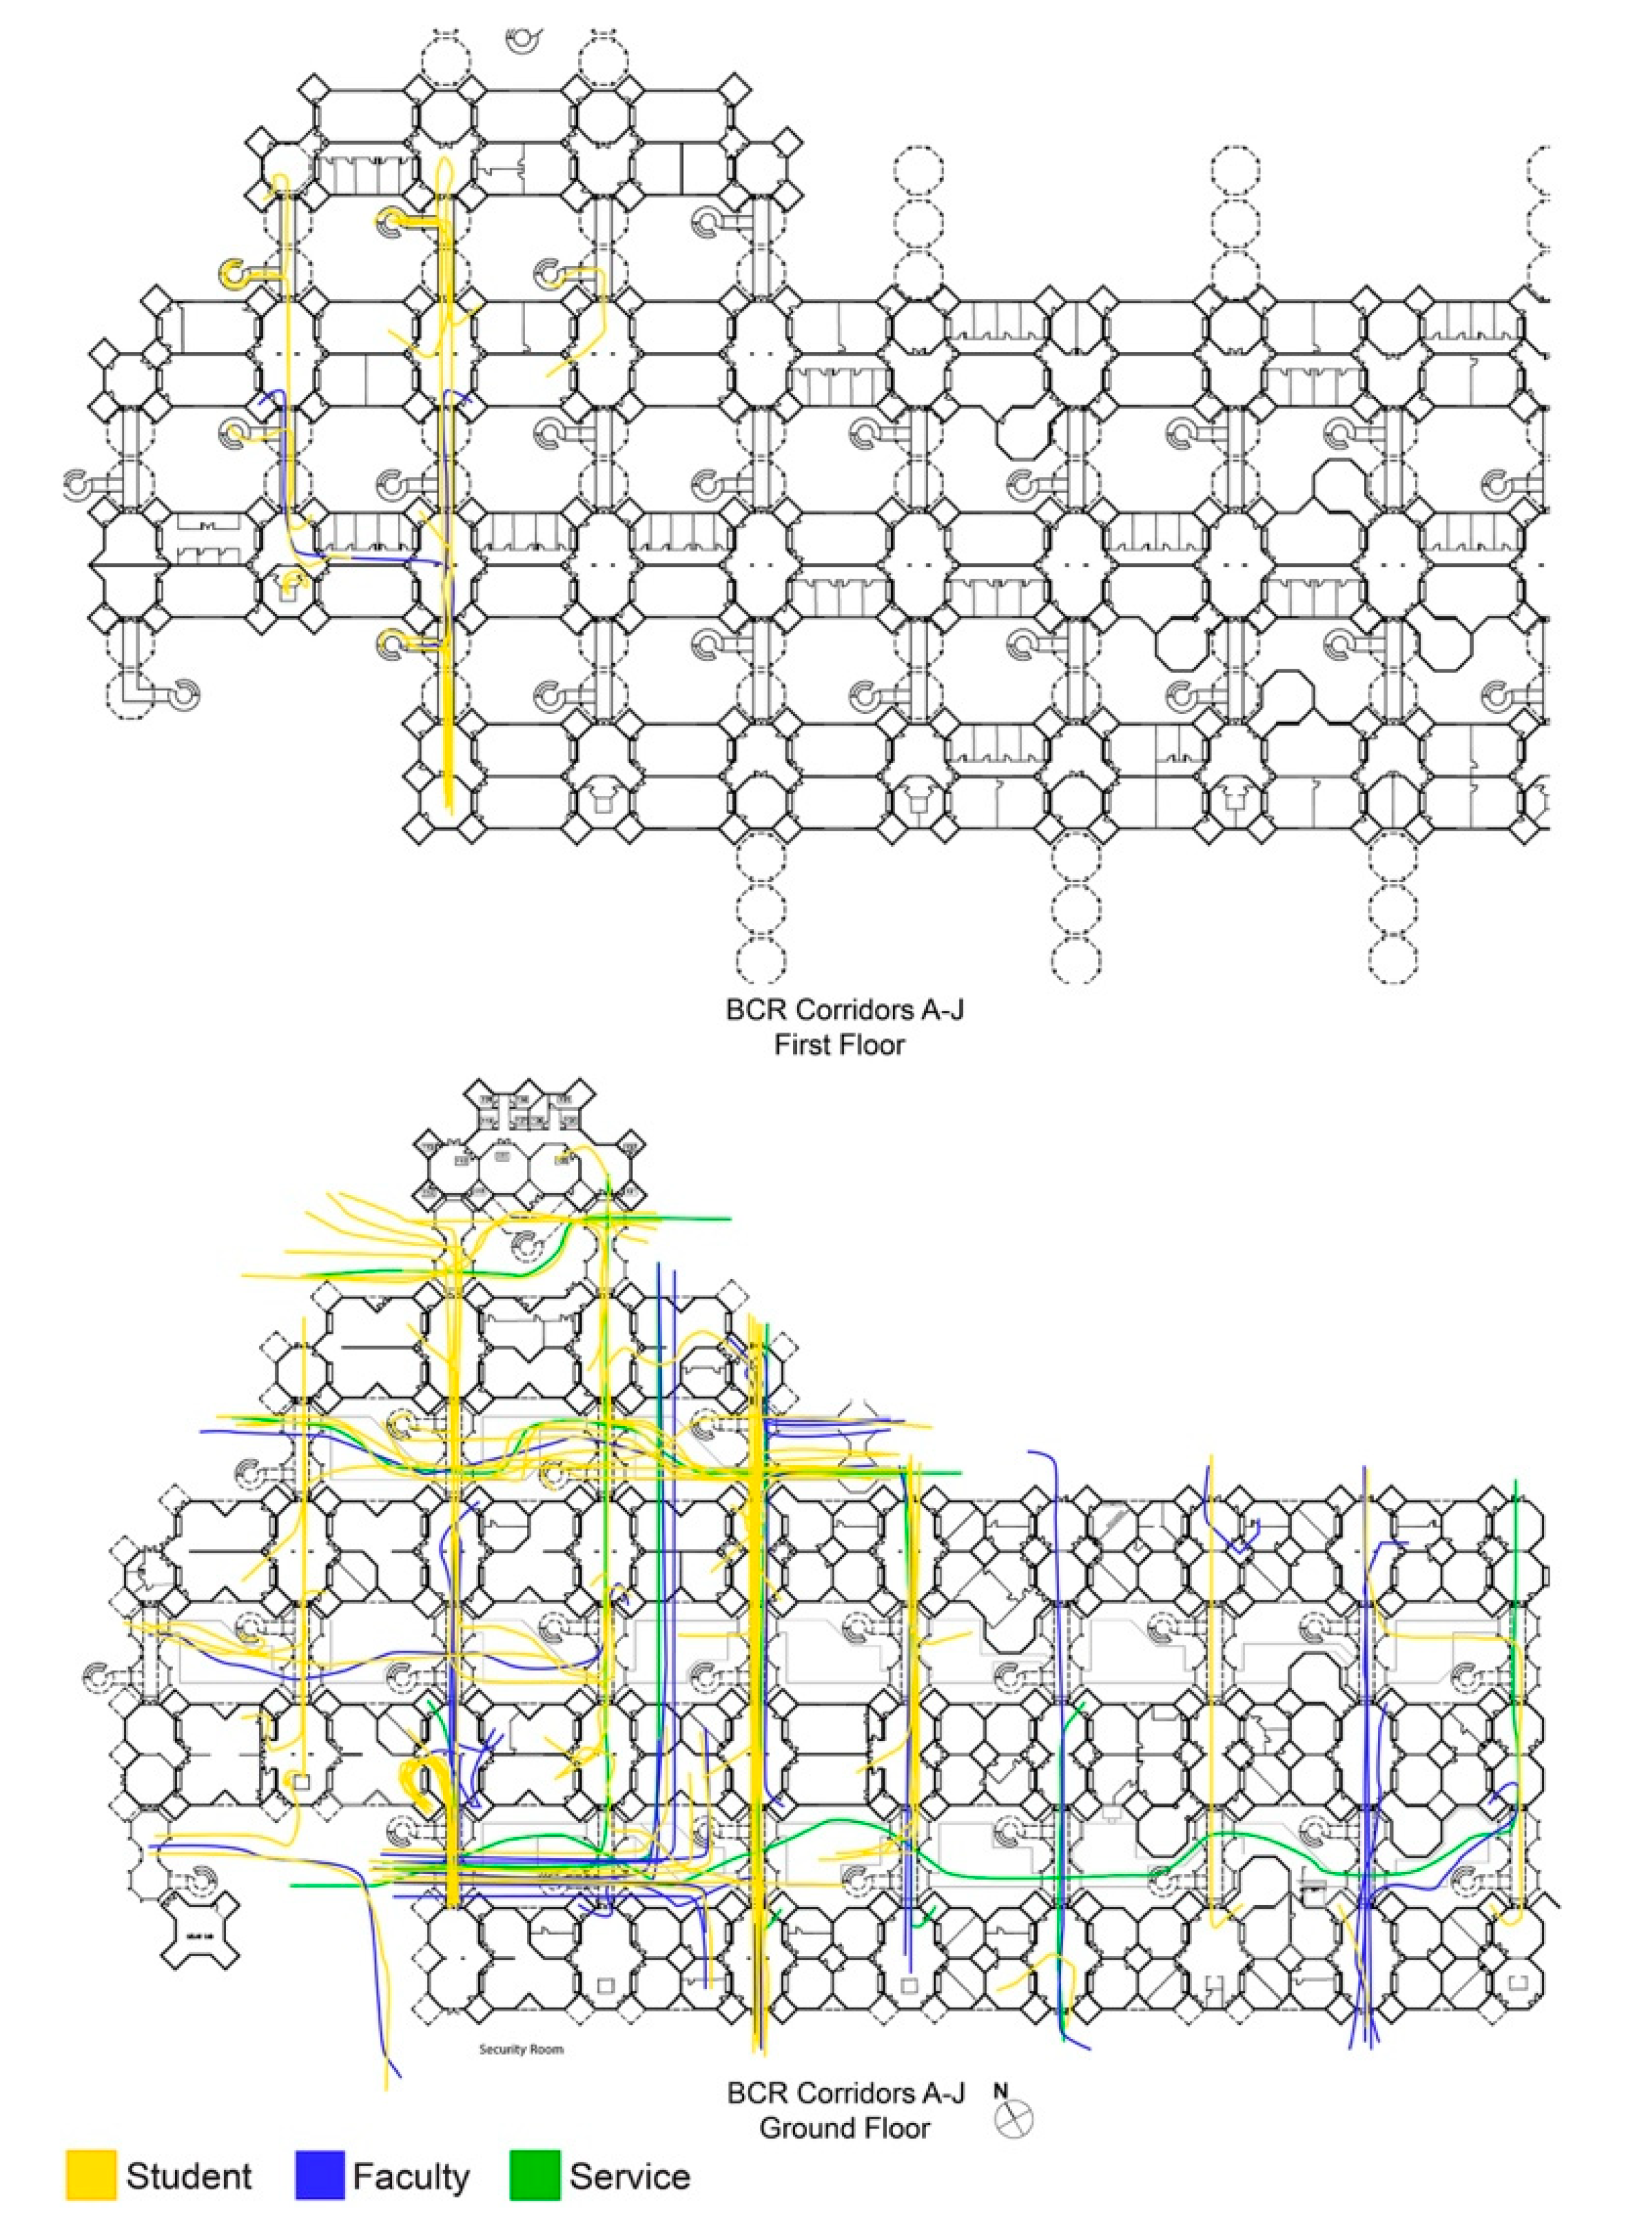
The researchers conducted movement trace observations of a typical 100 people during the first 10 min of a visit or until reaching their destination, whichever came first (
Figure 11). Researchers calibrated these observations from each access point based on percentage usage for the entry counts. The movement traces appear to demonstrate a few things about movement in the BCR Corridors. First, people more heavily use the northern portions of the complex (north of Corridor E) than the southern par (Corridors A–D) since there are more entries from this direction. Second, only a small portion of this movement makes use of the first floor within the first ten minutes of a visit. Accessing the first floor in this manner almost exclusively occurs in Corridor G and I. Finally, the majority of the movement in the BCR Corridors is through-movement, which is accessing some other part of the campus. It seems especially true along Corridor F (main pass-through route from the male to the female campus) and somewhat through Corridor B as well. It also includes a detectable level of cut-through movement in a north–south direction through the outdoor communal areas of the Annex wing, as previously stated. Finally, the researchers conducted non-programmed static use observations of 1225 people based on the static snapshot technique for standing, sitting and interacting people in all common spaces during an entire day from 7:00 am to 5:00 pm. It excluded offices and classrooms since we were interested in the pattern of non-programmed occupation in the building. We discuss the results of these observations in the next section.
3. Results of Post-Occupancy Evaluation
3.1. Building Program and Use
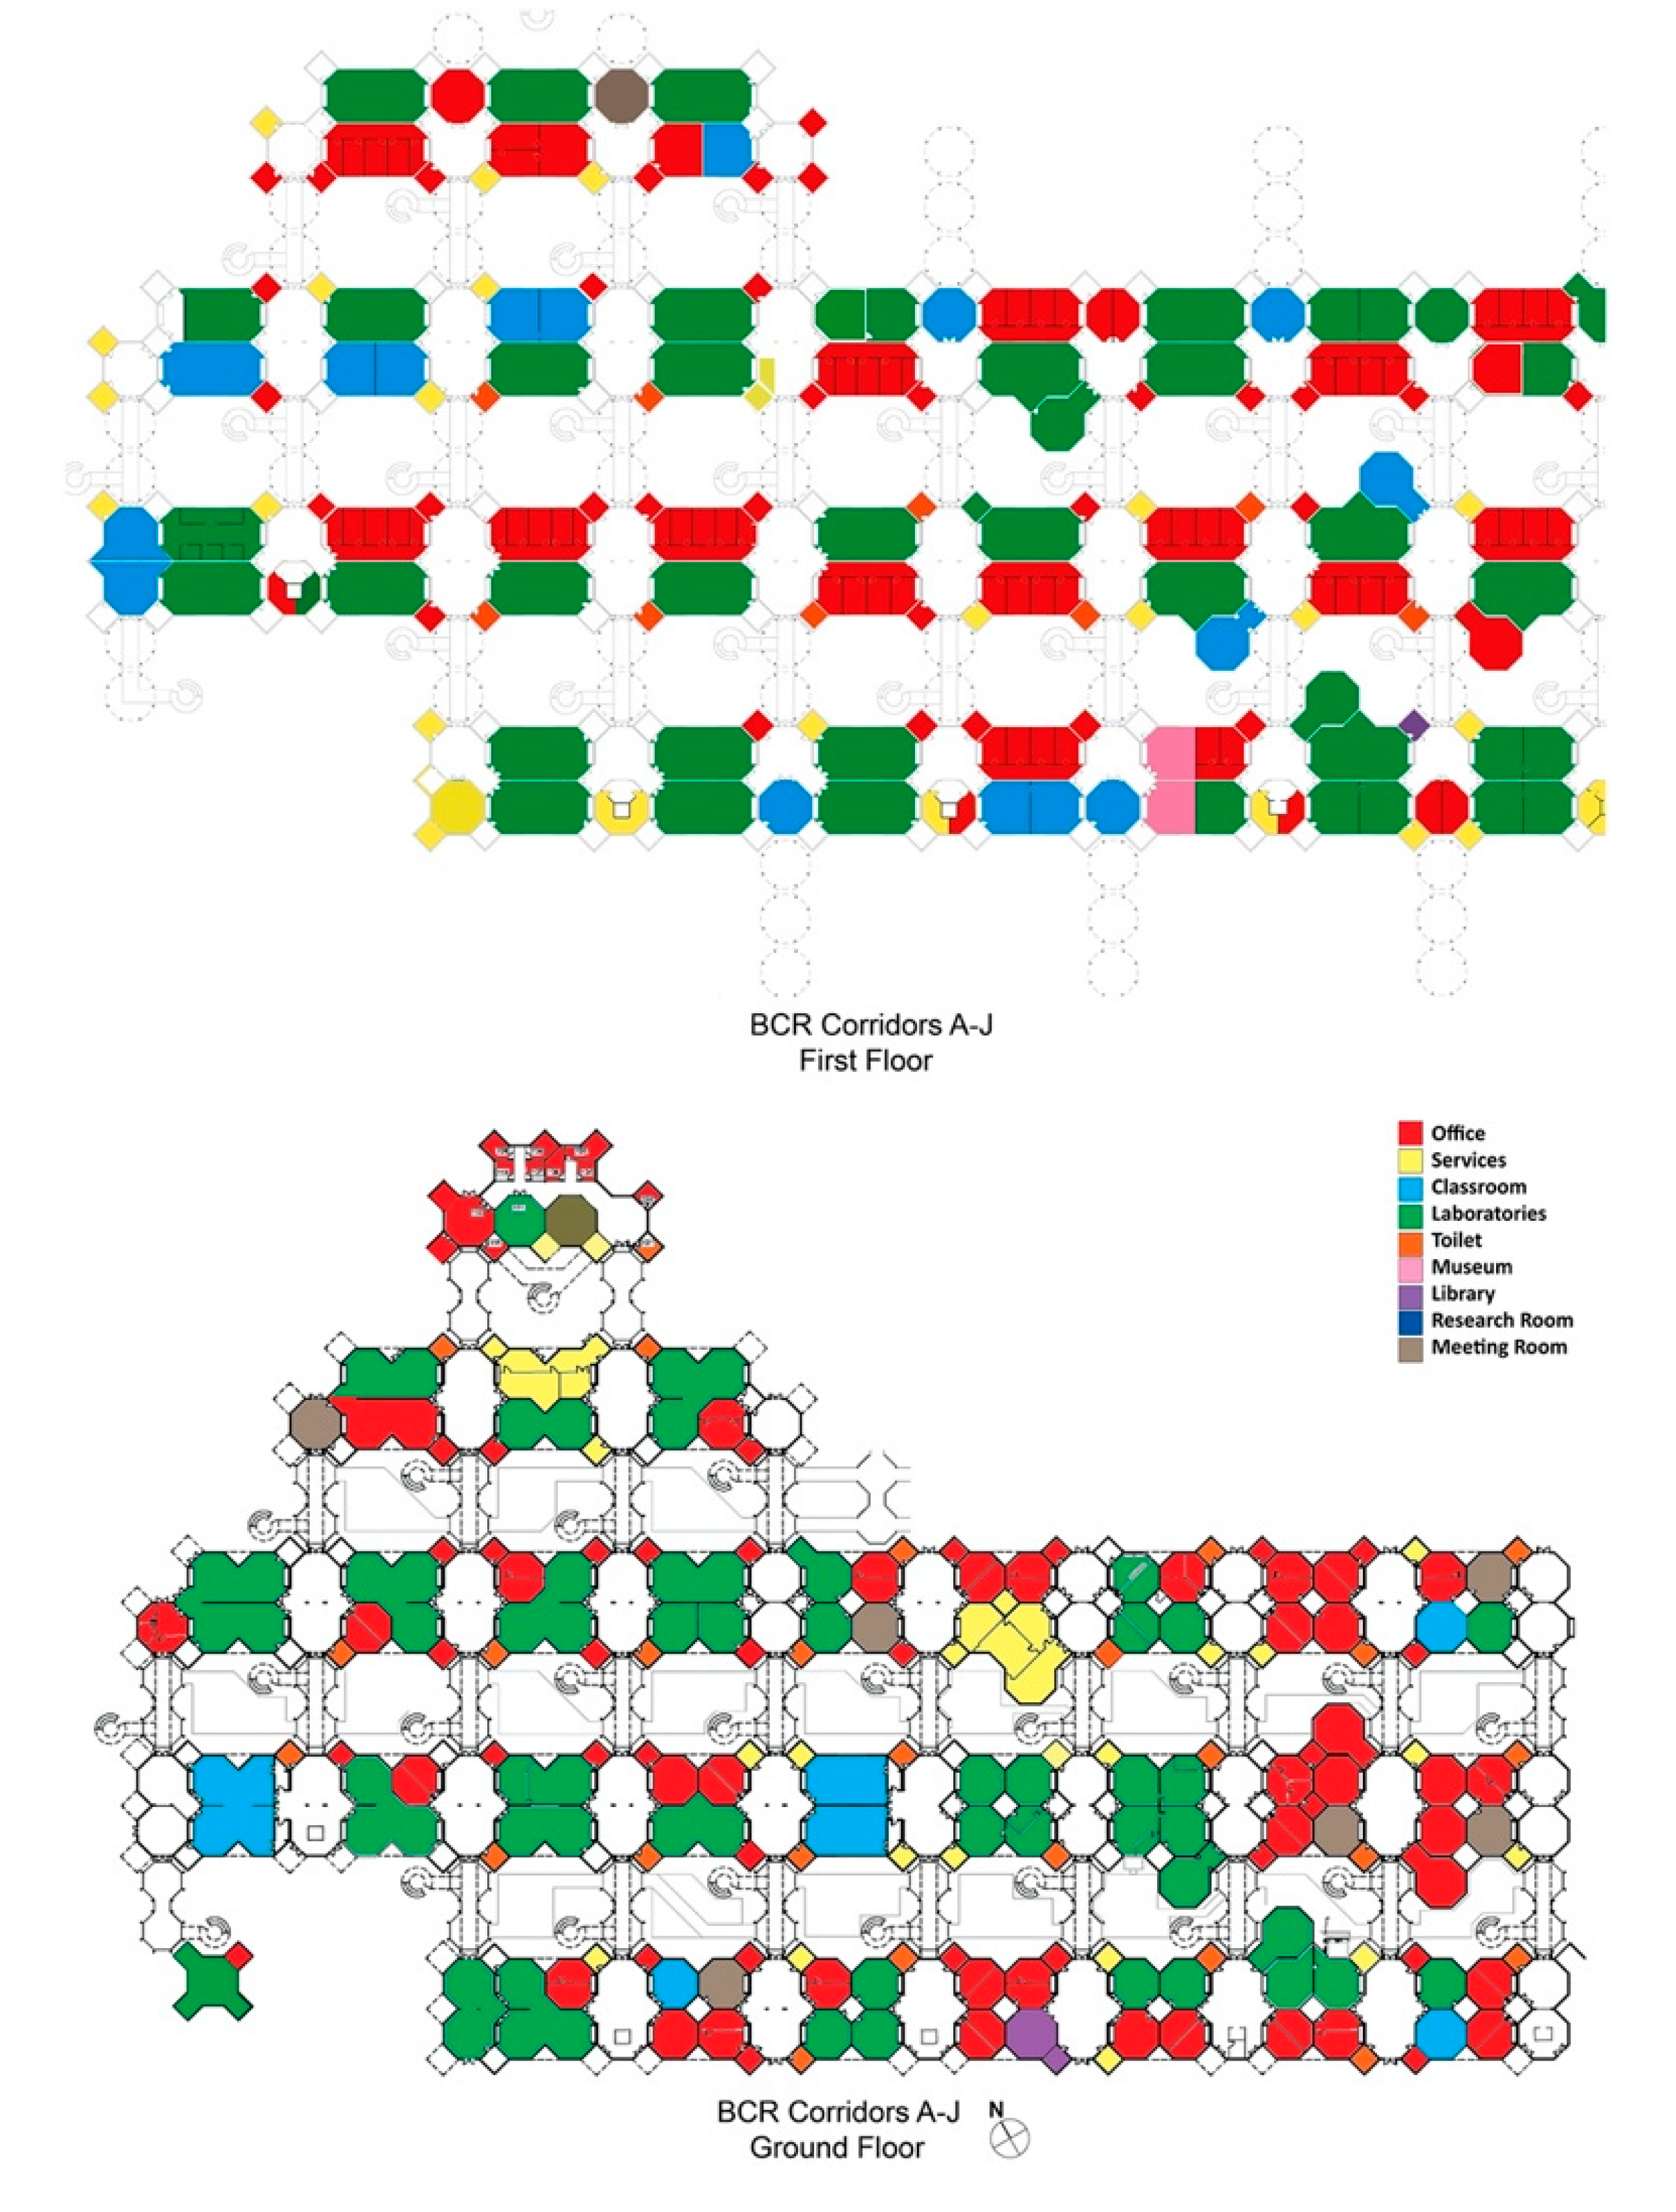
The survey of building use demonstrates a significant allocation of rooms for offices and laboratories, with many of these labs also providing open space work stations for multiple persons (
Figure 12). There appear to be less than 30 dedicated classrooms in the BCR Corridors. Allocation of almost all the primary spaces in each module is for three uses (labs, offices, and classrooms), with other types (service/storage spaces, library, meeting rooms) forming secondary uses in the complex. Given the modular nature of the design concept, it is not easy to discern any overall pattern to the building uses, either along corridors in a northeast-to-southwest direction or a counter direction along the most extended length of the building footprint except on the first floor.
On the first floor, there appears to be an alternating pattern of classrooms, offices, and labs along the most extended length of each module, providing some degree of local cross-circulation from corridor to corridor via these spaces and associated hallways. It is most evident in the use of local hallways for offices and lab spaces in the most central sequence of modules (representing the most extended length of the building in an east-to-west direction) from Corridor A–J on the first floor and the subdivision of small rooms accessed from these hallways. However, this occurs in other parts of the BCR Corridors complex as well, though somewhat less extensively. The results tend to reflect the aggregated nature of the room use in the BCR Corridors over time as one of the oldest buildings on the campus. It means the adaptation of rooms for specific uses when such spaces become available wherever they might be in the layout is the determining factor. A room use strategy for the BCR Corridors might be revised to adopt a more urban-level type of distribution, given the size of its building footprint. For example, classrooms loaded along the most heavily used corridors such as Corridor F. It seems difficult to accomplish this without first completely emptying the complex of occupants and engaging in large-scale alterations/renovations of the entire spatial layout to develop a more logical distribution. The future opening of the new CENG Building north of the QU Main Library might offer such an opportunity. However, this will require considerable foresight and careful planning on behalf of university officials responsible for campus facilities, including identifying beforehand who and what university entities might occupy the BCR Corridors after completion of the new CENG Building.
3.2. Non-Programmed Space Use
Researchers conducted direct observations of non-programmed static use of 1225 people based on the static snapshot technique for standing, sitting and interacting people in all common spaces (each space observed twice every hour) during an entire day from 7:00 am to 5:00 pm (
Figure 13). Classrooms and offices were excluded since researchers were primarily interested in the pattern of non-programmed occupation of common areas in the building.
Sitting is heavily skewed to the common interior areas of the modules themselves. There is a large density of interactive sitting on the first floor at the southwestern edge of Corridor H in an open space laboratory. There is another noticeable cluster of interacting, sitting, and standing occurring at the southwest edge of Corridor B on the ground floor where there is a classroom immediately adjacent, which is the only one in this part of the complex. Otherwise, sitting distributes evenly across the entire complex in the common interior areas of the modules on both floors wherever there is seating available. There is a cluster of interactive standing (primarily male students) occurring on the first floor of Corridor H in the northern portions of the complex where there are two classrooms. This position also provides an excellent view to watch other people passing below, especially the northernmost location. The researchers observed a considerable level of cut-through movement in the ground level communal areas of this area. Finally, the most significant cluster of interactive sitting and (primarily) standing in the entire complex occurs in the southwestern communal area between Corridor G and F.
This ‘hot spot’ appears to occur due to a variety of factors associated with the spatial layout and building use. First, 40% of the users enter the BCR Corridors from this southwest direction. Second, the primary classroom in this part of the complex is adjacent to this location in G122. Finally, both Corridor G and F possess some of the most extended lines of movement in the BCR Corridors from the northeast to the southwest, with Corridor F providing a direct line of movement from the male to the female campus. The combination of these formal and program factors makes this communal area between Corridor G and F into a highly strategic location for causal encounters and brief conversations with colleagues.
Based on the researchers’ experience, this location is also one of the most critical places for way-finding disorientation. It is possible (though not directly observed since we did not seek to overhear conversations) that some of the interactive standing in this area involves frequent users aiding visitors and infrequent users to find specific locations in the complex, especially the G122 classroom. It is due to two factors. First, it is disorienting to discover that Corridor G does not pass entirely through to the female campus. Instead, it terminates on an elevator and enclosed courtyard, which requires people to turn back on themselves and deviate to Corridor F to complete their trip to the female campus. Second, the temporary installation of a large-scale engine in the center of the last module of Corridor F blocks the view to the doors providing access to the female campus (
Figure 14). It initially makes users uncertain whether they are at Corridor G (with its termination) or Corridor F, which appears to terminate due to this installation but continues through to the female campus. It only becomes evident once you enter the last module and move closer to ‘catch a glimpse’ of the doors through the installation. However, the way-finding confusion occurs further away in the outdoor communal space before crossing the threshold into the last module. It is where the highest levels of interactive sitting and (especially) standing occur in the entire complex.
3.3. Space Syntax Modeling of the BCR Corridors
For this study, researchers conducted extensive computer modeling of the spatial layout on both floors in the BCR Corridors using space syntax representations including (1) ‘least-line’ axial analysis of the entire complex, (2) auto-generation of ‘all line’ axial analysis, and (3) visibility graph analysis; the latter two only on the ground floor. Space syntax deploys a set of techniques for the simple representation and mathematical measurement of architectural and urban space (see
Appendix A) [
8,
9,
10,
11,
12,
13,
15,
16,
22]. All models treat every exterior and interior door as if they are open, with all spaces accessible to everyone. We did not statistically correlate space syntax measures with observed levels of use due to the complex size and observing only static occupation of the communal areas.
The most common type of space syntax model is ‘least-line’ mapping of the axial structure in a building or urban layout based on the longest, fewest, and most strategic lines of sight and movement in a built environment. In buildings, researchers connect multiple floors together via all elevators and stairways, enabling vertical circulation in the model. Axial analysis based on the least-line modeling methodology presents a somewhat puzzling picture of the BCR Corridors. The visual patterning for global choice and integration (global and local) appears to offer a realistic view of how the complex operates to one degree or another. Choice and integration focus along the corridors on both floors and perimeter spaces on the ground floors, especially towards the northwest and northeast perimeters where most people enter the complex. Global integration also skews toward Corridor F and H, which offer the most direct connections to-and-from the male and female campuses. As a whole, local integration skews more towards the northwestern portions of the complex (where they are more classes), and there is more segregation in the southeastern part (where there are more offices/research labs). Local integration probably provides the most comprehensive reflection of the use and operation in the BCR Corridors (
Figure 15).
The geometric grid arising from the modular design concept of the BCR Corridors is evident in the axial structure, especially on the first floor. However, in terms of the formal composition of lines of sights and movement, there is some degree of ‘spatial chaos’ on the ground floor. This type of ‘spatial chaos’ emerges out of lines of sight in the room-to-room relationships via interior communal areas of the corridors and in the communal area-to-communal area relationships from interior-to-exterior and vice versa. For example, this can make using the bathrooms located at the corners of the octagon modules in the BCR Corridors very disorienting because you enter by making a simple left or right turn from a corridor. However, due to the inward swing the doors, you exit the bathroom at a 45° angle back into the corridor.
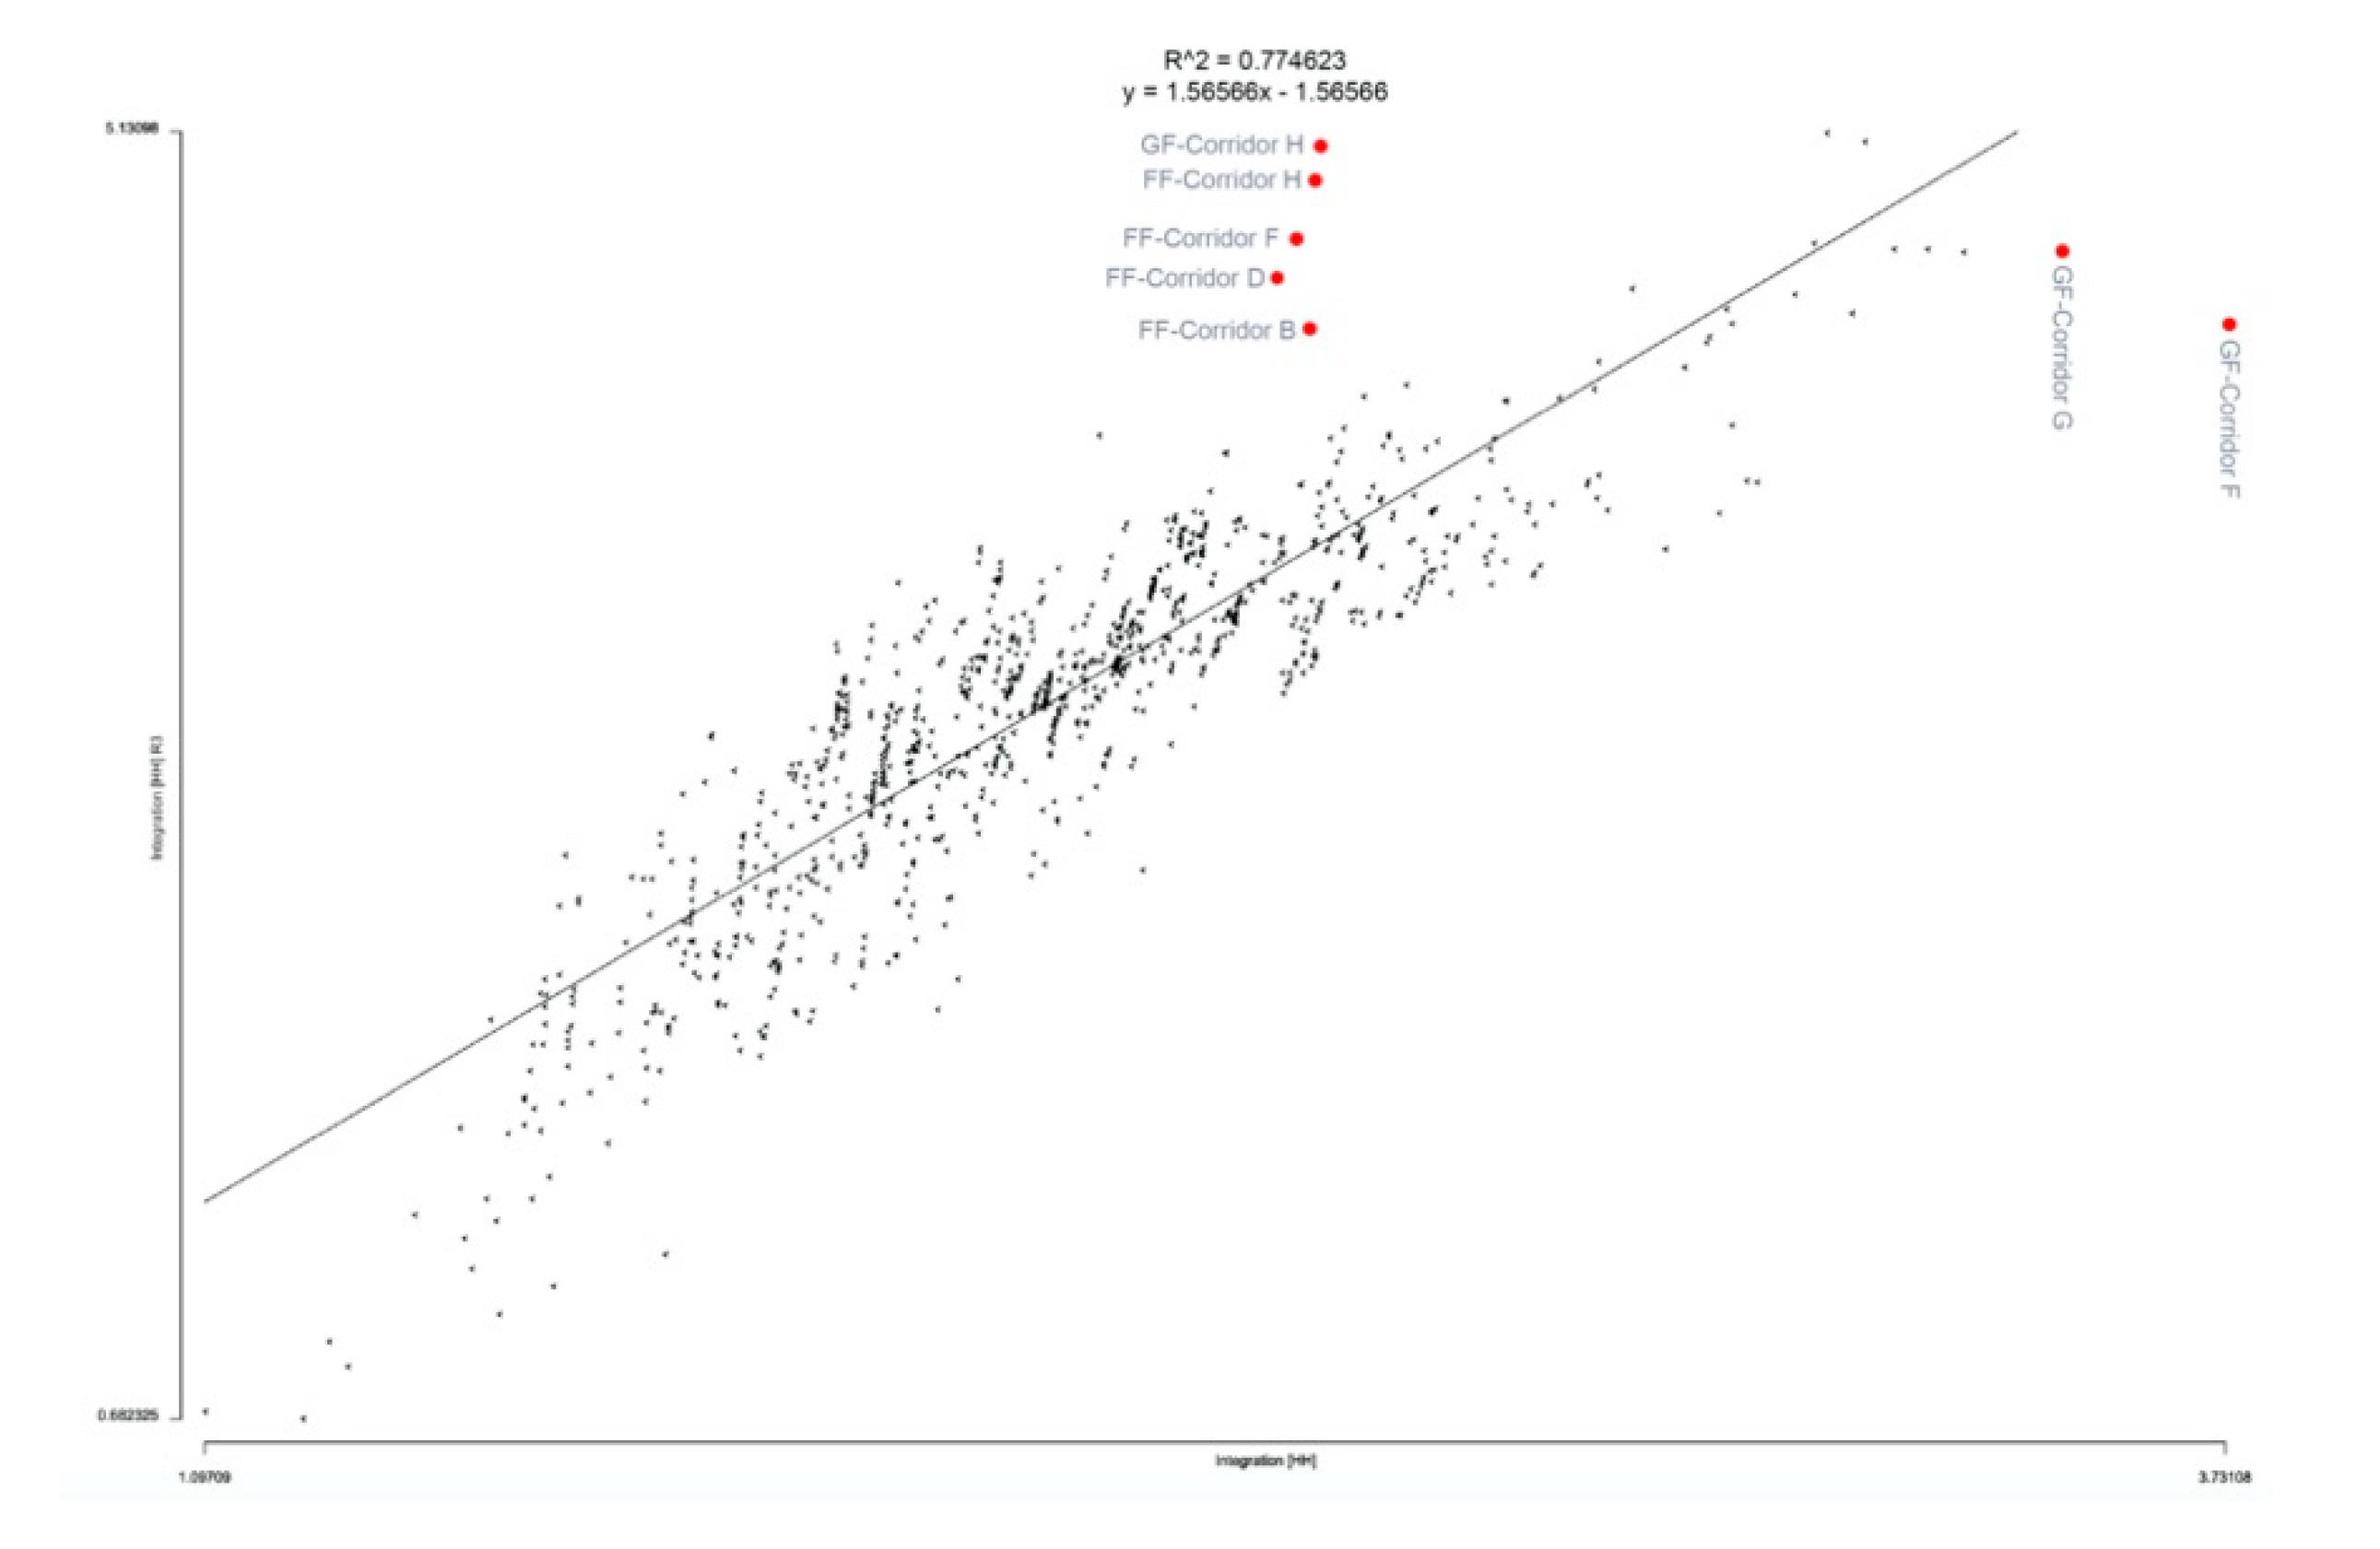
Collectively, this ‘spatial chaos’ is consistent with many users’ perception and experience of the BCR Corridors, mostly because everything looks largely the same no matter where you are in the complex. However, synergy in the BCR Corridors is strong (R
2 = 0.775 in a spatial system with 1103 axial lines) (
Figure 15). Synergy is the correlation between global and local integration in a built environment, i.e., how strongly or weakly where you are relates to everywhere else in the spatial layout. This strong relationship seems inconsistent with user perception and experience. However, there is a notable layering effect along some of the most globally and locally integrated lines of sight in the building (highlighted in red in
Figure 16). For local integration, this occurs on the first floor for (in ascending order) Corridor B, Corridor D, and Corridor F, and on both floors of Corridor H. For global integration, it occurs on the ground floor of Corridor F and Corridor G. In part, this layering effect along the most globally and locally integrated corridors might contribute to some of the wayfinding confusion in the complex, especially on the ground floor of Corridor F, G and H. This is because users on the ground floor might anticipate some degree of equivalency between these corridors. Corridor H is toward the northwestern edge of the complex and thus becomes more locally than globally important within the complex. The ground floor of Corridor F and G seem equally important to users because they constitute the most extended, central, and globally integrated lines of sight in the complex. However, Corridor G appears to provide access to the female campus but does not. Corridor F does not initially appear to connect to the female campus (refer back to
Figure 14 entry sequence) but does provide such access. This disjunction between the perception and reality of these two corridors on the ground floor leads to confusion for users. It is unclear whether this is intentional to add a degree of difficulty for accessing the female campus, or merely happenstance arising out of the strategy of providing vertical access via elevators in alternating corridors (A, C, E, G, and I).
‘All line’ axial analysis involves the computer drawing the furthest extent of one-dimensional lines of sight and movement available in the complex as defined by all vertexes of the physical form visible to each other in the building. The computer measures the relationship of every line to all others in the complex for a variety of spatial variables, including integration, global choice, and connectivity, as well as second-order measures correlating these spatial variables in the space syntax tool kit. The Visibility Graph Analysis (VGA) technique involves defining a grid over the plan of the BCR Corridors complex, i.e., approximately 0.28 m
2 or the personal space of a normal human being in this case. The computer draws the 360° visual field from each grid element. It then measures the configurational relationship of every visual field to all others in the complex in terms of integration (radius = n) [
11]. In this paper, we focus on these two different types of modeling of the ground floor in the BCR Corridors as (1) existing and (2) proposed with the removal of all shading device screens and temporary installations offering impediments to movement and visibility. We do not set these ‘before and after’ maps of global integration in the spatial layout of the BCR Corridors based on ‘all lines’ axial analysis to the same range of values. Doing so makes the effect of the cosmetic changes more dramatic by either representing the existing layout as too segregated (i.e., dominated by greens and blues) or the proposed as too integrated (i.e., dominated by red and oranges). The visibility graph analysis of the existing and proposed layout is set to a standard range precisely to demonstrate the dramatic effect of the cosmetic changes.
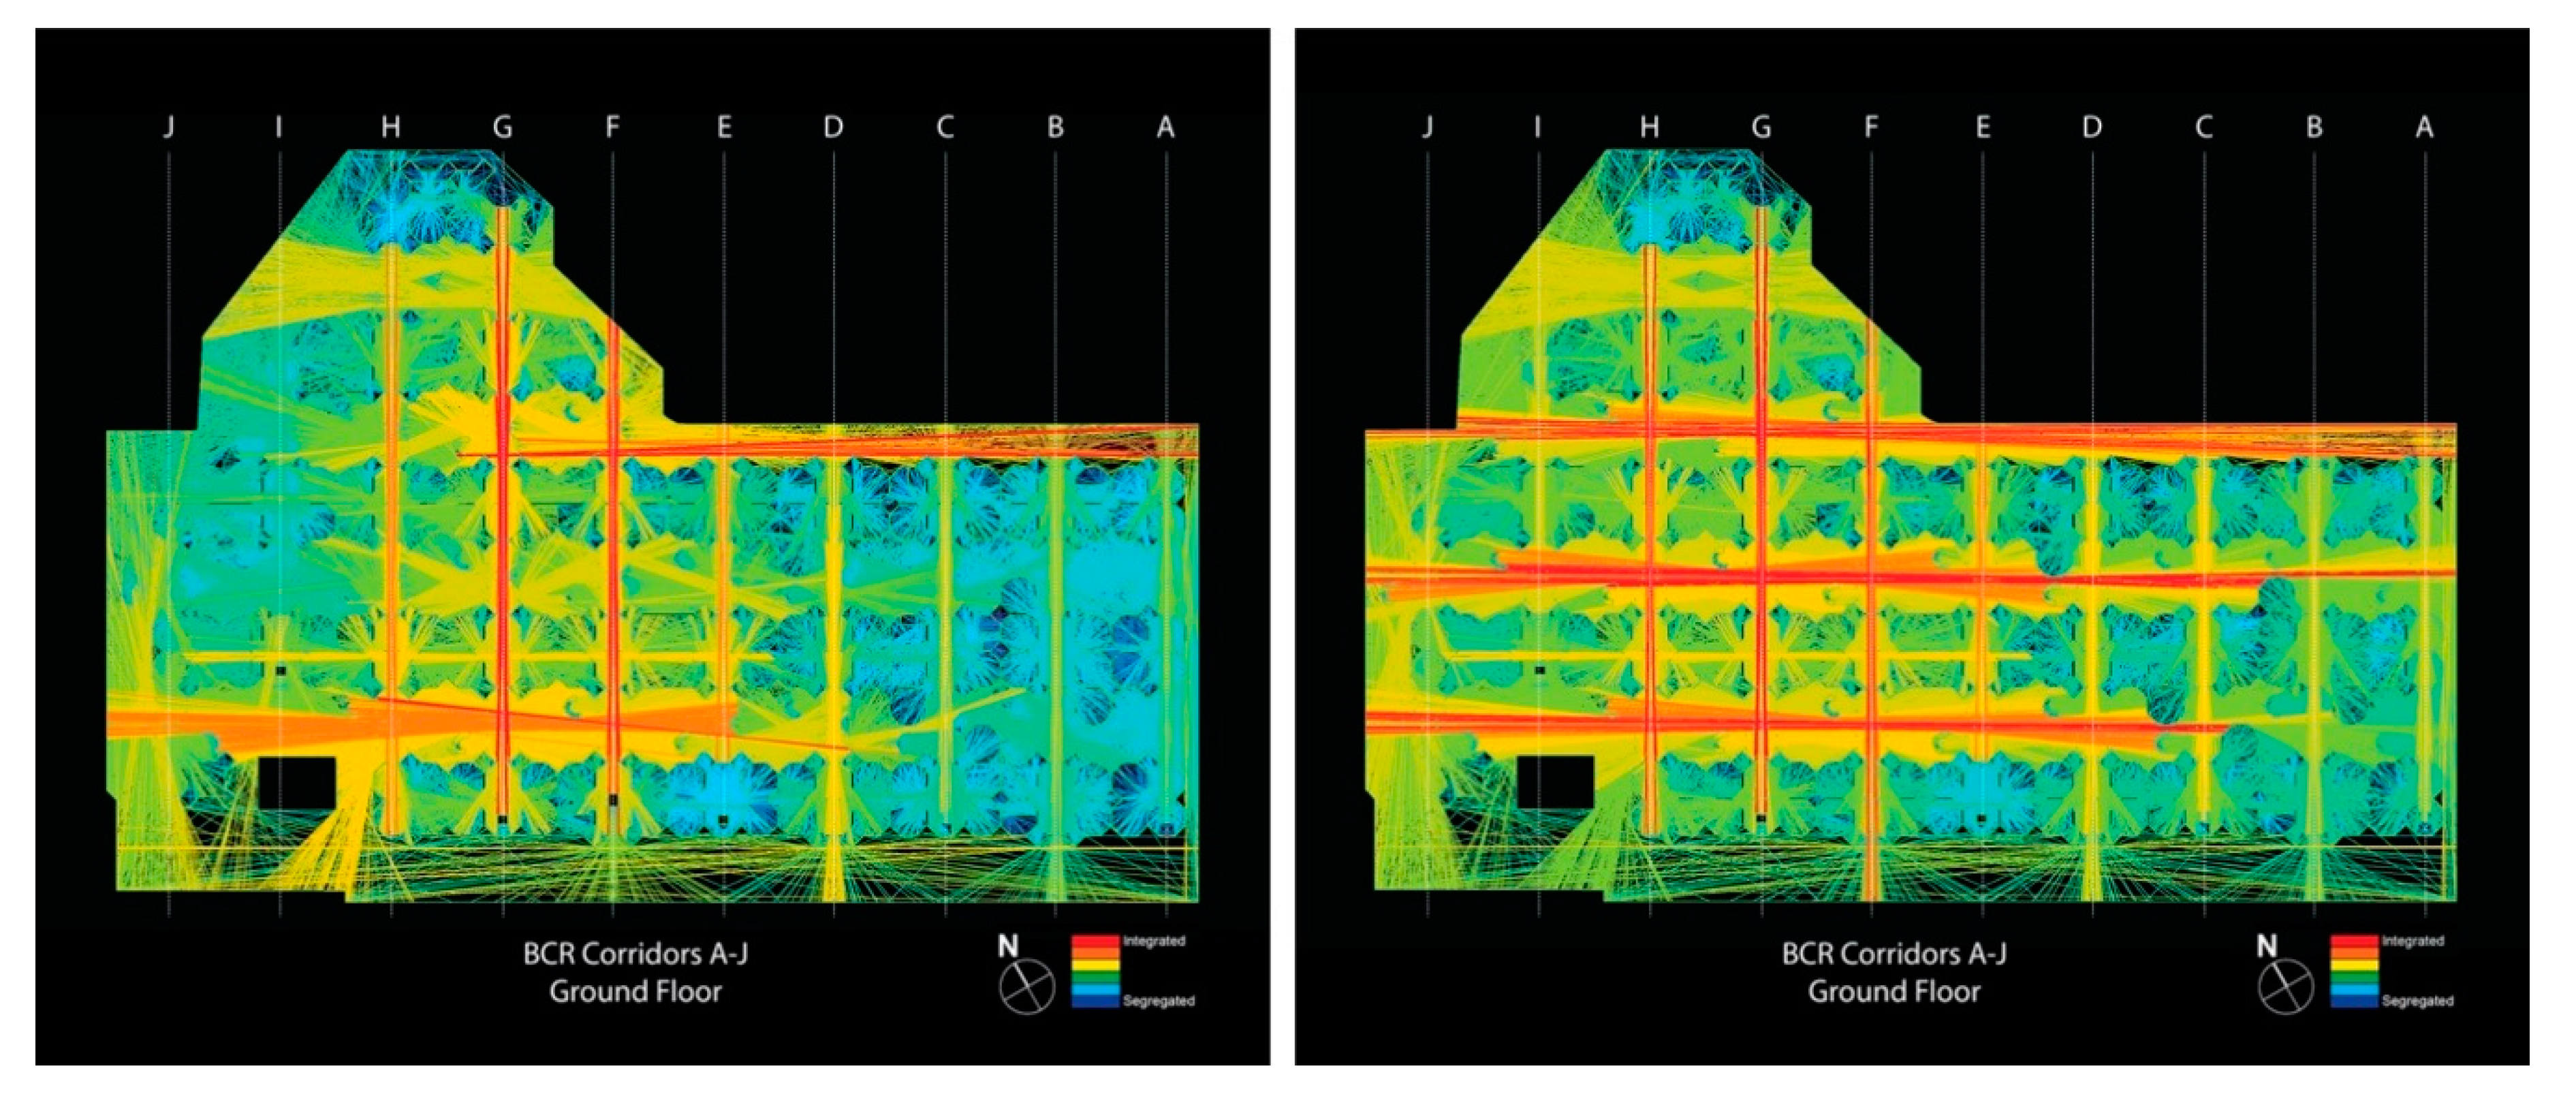
All-line analysis of the existing spatial layout on the ground floor of the BCR Corridors demonstrates the importance of Corridor F and G for circulation from the northeast-to-southwest (
Figure 17, left). It also shows the effect of the elevator/termination point in Corridor G and temporary installation in Corridor F. Both prevent lines of sight and movement from penetrating entirely through the BCR Corridors from the perimeter of the male to the female campus. The lines along Corridors B and D are the only ones to directly access the perimeter of the complex from the male to the female side of the campus. However, these lines are less strategically important than those in Corridors F and E due to the overall shape of the building footprint. Analysis of the existing layout also highlights the importance of the outdoor perimeter spaces. First, on the male side of the campus in the northeast. Second, those in the southwest through the outdoor communal areas associated with Corridors E–I. As we saw, more than 70% of all entries to the BCR Corridors occur in these two locations. By comparison, there is more segregation in all internal and outdoor spaces associated with Corridor A–D, with only those lines passing through Corridor D from one edge of the complex to the other being of moderate integration levels.
Analysis of proposed alterations to the spatial layout demonstrates a more robust level of integration and interconnection of the grid structure in the layout (
Figure 17, right). There are more robust levels of integration in a northwest-to-southeast direction through all outdoor communal areas, especially the most centrally-located one. Levels of integration increase for all corridors in the complex, especially for Corridor F, G, and H. Maximum integration levels increase from 9.16 to 11.84 (+30%) and intelligibility (a second-order measure between connectivity and global integration measuring the relationship between how immediate connections relate to where you are in the entire spatial network) increases from an R
2 = 0.75 to R
2 = 0.95 or +27%. It represents a remarkable improvement for navigation and way-finding possibilities of the plan, relying on a few simple cosmetic changes to open vistas for users of the complex.
Visibility graph analysis of the existing layout on the ground floor of the BCR Corridors again highlights the importance of the perimeter spaces (
Figure 18). It includes the northeast and southwest, where there are the most entries. It also highlights the entire southwest perimeter on the female campus, which, in part, is a function of the metric area of this space. The corridors themselves, with their narrow vistas and numerous interruptions to visibility, are somewhat less important (in relative terms) than the perimeter spaces. However, the analysis still indicates the importance of Corridor F and G, and segregation characterizes most of the internal and outdoor spaces associated with Corridors A–D.
Visibility graph analysis of the proposed layout on the ground floor with the shading screen devices and temporary installations removed demonstrates quite dramatically the benefits of these cosmetic changes on the spatial layout of the complex. It generates a series of highly-integrated northwest-to-southeast visual fields. They pass through all outdoor communal areas and the perimeter spaces on both the male and female sides of the campus. More importantly, the cross-circulation in all corridors become highly integrated by re-constituting a more straightforward and easily understood grid structure in the layout. The interstitial spaces of Corridors A–D remain segregated, still enabling a degree of area-to-area and room-to-room use differentiation. Maximum integration increases from 7.45 to 9.16 (+23%). In contrast, maximum segregation only increases from 1.96 to 2.19 (+12%), indicating that simplifying the layout in this manner introduces more differentiation between spaces, which can help to assist navigation and way-finding for the users.
4. Discussion and Recommendations to Improve Wayfinding
The paper only briefly summarizes some of the findings for the large amount of movement and space use data collected as well as the space syntax modeling of spatial layout in the BCR Corridors (
Table 2). Researchers will continue to mine the observation data and computer modeling of the BCR Corridors for more detailed information over some time in developing future research outputs. Based on this analysis, we made the following design recommendations for the BCR Corridors:
Removal of all vertical shading screen devices at ground level to open more extended vistas in making the BCR Corridors more intelligible and readable for people in movement through the complex.
Removal of all temporary installations for the same purpose, especially the large engine at the end of Corridor F, which impedes the visual field to the doors providing access to the female campus.
Adoption of a more comprehensive room use strategy in the BCR Corridors when vacated by the current occupants upon the opening of the new CENG Building. Such an approach could involve loading of the most heavily-used spaces (classrooms and services including any retail outlets such as cafes and coffee shops) along Corridors F and (possibly) E; see below. It might also include loading quieter spaces such as offices and library spaces in interstitial spaces along Corridors A-D in the more segregated locations. Laboratories can provide for a degree of transition between integrated and segregated locations. Due to the large size of the building footprint, it would involve adopting a more urban-level approach to room usage instead of the aggregate ‘hodge-podge’ associated with the space requirements of individual departments and colleges. It would also require close monitoring by the campus facilities department to ensure that meeting the space requirements of different departments/colleges does not negatively impact the overall room use strategy for the entire BCR Corridors complex in the future.
Consideration for opening additional access to the female campus at the end of Corridor G with a security desk at the new entry point. Most likely, this will involve simultaneous closure of the security gate in the outdoor space at the extension of Corridor H due to its repetitive nature. This additional access point will enable a strongly-integrated, dual-axis with Corridor F from one perimeter of the BCR Corridors to the other in a northeast-to-southwest direction.
Adoption of a new signage system changing from the alphabet-based signage and room numbering to a color-coded version, i.e., Green Corridor, Red Corridor, Blue Corridor, Blue 122, Green 112, etc. Replication in written form would be necessary to enable use by color-blind persons. Subtle painting of common elements as well as color-coded signage could supplement the proposed improvements to the spatial layout. Colors could also be selected to replicate common cultural connotations; for example, green means ‘go’ for Corridor F (most integrated), red means ‘stop’ for Corridor A (most segregated), yellow means ‘caution’ for Corridor D (moderately integrated), purple means ‘quiet or calm’ for Corridor B and so forth (
Figure 19).
The question asked at the beginning of the paper was whether modular design was truly smart design. The case of the BCR Corridors at QU suggests that the answer, in part, depends on the shape, size, and number of individual parts in giving rise to the total size of the collective whole. Architectural and cosmetic detailing at an intermediate level between the part and the whole are also important factors for determining the smartness of such an approach to the built environment. For example, it seems unlikely that wayfinding would be nearly as problematic if square or rectangular building blocks composed the modules of the BCR Corridors. Instead, the octagon shape enables the angular generation of a large number of lines of sight and movement from room-to-room, communal area-to-communal area, and exteriors-to-interiors. The modular design of the BCR Corridors offers almost too much angular choice for users, with the resulting confusion contributing to its notorious problems for wayfinding and navigation. It occurs despite a relative degree of synergetic coherence detectable in the layout of the complex in space syntax terms.
The research in this paper builds on decades of space syntax research into complex buildings (e.g., non-residential buildings), including laboratories, educational facilities, and office buildings [
8,
9,
10,
11,
12,
13,
15,
16,
17]. The originality of the research in the paper pertains to the new case study of the BCR Corridors at QU, not necessarily the methodological approach. In this sense, the research provides a thorough investigation of a large modular building complex based on direct observation of use and extensive computer modeling of spatial layout using techniques standard in the space syntax toolkit. It is potentially of great value to the field of architecture in general and the design of academic facilities in particular. Any architect or institution contemplating a modular solution for a complex building program can apply the findings of this study to avoid potential pitfalls with careful forethought in design or space management during its lifetime. It is especially enlightening by comparison to research findings of another academic facility at QU detailed in a previous paper, some of which we briefly summarized earlier in this paper [
13].

 ,
, 


