Article

Impact of Entrepreneurial Ecosystem Discussions in Smart Cities: Comprehensive Assessment of Social Media Data

VTT Technical Research Center of Finland, Vuorimiehentie 3, P.O. Box 1000, 02044 Espoo, Finland
Smart Cities 2020, 3(1), 112-137; https://doi.org/10.3390/smartcities3010007
Submission received: 30 January 2020 / Revised: 14 March 2020 / Accepted: 16 March 2020 / Published: 18 March 2020

Abstract

:
Discussions on “smart cities” are gaining in popularity in the past two decades and has shown potential in tackling the cities’ environmental, social, and economic challenges. Smart cities are known as a system of physical infrastructure, the information and communications technology (ICT) infrastructure, and the social infrastructure that exchange information that flows between its many different subsystems. The “smart cities” concept has been introduced with various dimensions, among those, the embedded ICT infrastructure in smart cities is playing a decisive role between the functions of the system. One of the important derivatives of ICT is the new communication mediums known as social network services (SNSs), which is emergent and introduces additional functionalities to “smart cities”. This paper seeks to advance the understanding of SNSs in smart cities to evaluate the effects on the innovation and entrepreneurial ecosystem. This agenda has been tackled by a rigorous methodological approach in order to capture and evaluate the presence of entrepreneurially concerned discussions in a popular SNS intermediate (Twitter). Beyond the methodological contribution on handling big data in SNSs for gaining insights on innovation and entrepreneurial aspects in smart cities, the findings distinguished the influence of a certain category of content generators (professionals) that drive the biggest motives of the interactions in SNSs.

1. Introduction

The growth of population, technological development, and urbanization associated with cities are recognized as contemporary challenges that seek novel, efficient, effective, and economic approaches to better governance. Challenges in developing the infrastructure, economy, and services need to be addressed to increase the living standards of communities. The emergence of the “smart city” concept can be considered as a response to such challenges, ensuring that cities can develop economically, whilst protecting the environment and quality of life for citizens. Smart technologies are offering cities with exciting possibilities for the provision of new services and integrated city infrastructure as well as supporting innovation, digital entrepreneurship, and sustainable city development [1,2]. According to the World Economic Forum [3], a growing number of cities around the world are implementing ambitious smart city programs and projects across a range of themes including governance, local economic development, citizen participation, urban living, the natural and built environment, and sustainable transport.
The emergence of the smart city and smart city thinking has escalated in the last two decades in scientific literature and international policies. Cities play a prime role in social and economic aspects worldwide and have a huge impact on the environment [4]. An in-depth analysis of the existing literature revealed that the smart city is a multi-faceted concept with many elements and dimensions [5]. Descriptions of smart cities are now including the qualities of people and communities as well as information and communications technology (ICTs). Smart cities are known as a system of physical infrastructure, the ICT infrastructure, and the social infrastructure exchanging information that flows between its many different subsystems [6]. It might even be noticeable that major cities can serve as a good representation of a nation’s economic success or failure. According to Beattie [7], this is because the tricky business of development and urbanization can play a big role in a country’s economic prosperity. Entrepreneurship and innovation are the major concerns for an economy consequently within the boundary of a city, therefore, the competitiveness of a city today is determined by its innovativeness and economic strength [8]. While researchers have realized that smart cities are more entrepreneurial than others [9,10], an analysis of the detailed characteristics accounting for this higher entrepreneurial activity within smart cities has not been conducted.
One of the major resources connected to the success of smart cities is the societal capital or cultural capital within the city boundaries. The emphasis on the role of social capital in urban development is promoted in parallel to technical aspects of a city [11]. The importance of human and social capital has been recognized by smart city definitions from previous literature, and has been seen as a fundamental aspect of any smart city [6,12,13,14]. Social capital has also been seen as an important dimension for the facilitation of innovation and entrepreneurship in smart cities. Smart cities have the infrastructure to bridge and facilitate the connectivity of society for entrepreneurial activity. According to Anthopoulos [15], residence satisfaction has been discussed and activities have been recommended that facilitates data collection and analytics to enhance municipality planning for this performance improvement. Despite the recognition of the importance of the human and social capital aspect in smart cities, the measurement and assessment of this aspect have remained a challenge. Performance measurement studies on smart cities dimensions, especially on social and human capital, are subject to being outcome indicators that, by their nature, involve a medium- to long-term observation and detection times [16]. The results of this issue are the lack of insight coming from society and incapability to absorb the information coming from society.
In this research, the attempt is on the smart city social and human capital performance measurement concerning innovation and entrepreneurship ecosystem activity. Due to ICT advancements, smart cities have the infrastructure to bridge and facilitate the connectivity of society. Within the broad spectrum of ICT application, the emerging presence of mass media communications such as social network services (SNSs) and social media has not been taken into account for studying innovation and entrepreneurship ecosystems in smart cities. Publicly available data sources such as Twitter have facilitated massive data collection, which can leverage the research at the intersection of social sciences, data sciences, and indicator design, thus informing the research community of major opinions and topics of interest among the general population [17,18] that cannot otherwise be collected through traditional means of research (e.g., surveys, interviews, focus groups) [19]. On the other hand, citizens are empowered to use technology-oriented common platforms to communicate among themselves, which has resulted in the inclusive use of social network services among citizens. Despite this interest, there seems to be a very limited understanding of what “social networking services” or “social media” exactly represent and do to societies. In this presented case, social media discussion is taken as a curtail pillar in regulating entrepreneurial spirit in smart cities. Therefore, this paper explores the role of social network services in smart cities from the innovation and entrepreneurial ecosystem vantage point. The aim is to address the following research questions:
  • Can SNS analytics measure the entrepreneurial ecosystem activities within cities? A methodological approach to utilizing SNSs data to identify the presence of impactful entrepreneurial discussion.
  • From the standpoint of the impact of SNSs on smart cities, what type of content in SNSs is more influential regarding innovation and entrepreneurial ecosystem discussions?
In order to study the presence and impact of SNSs in shaping the entrepreneurial and innovation ecosystem in smart cities, the literature has been reviewed carefully to position the trend and the need. This agenda has been tackled by a rigorous methodological approach in order to capture and evaluate the presence of entrepreneurially concerned discussion in a popular SNS outlet (Twitter). A thorough process of detecting and capturing relevant tweets was performed to evaluate the usage of SNSs in promoting innovation and entrepreneurial related discussions. Based on the recognized Smart City Index, London city was selected to utilize the methods for capturing social capital on innovation and entrepreneurial activity. This investigation obtains advance observations on detecting the promoting stakeholders in SNSs on the matter of innovation and entrepreneurial discussion.

2. Background

In this section, definitions will be provided with evidence from the literature. This section offers a background summary of the interpretation of previous research on smart cities and the role of social network services in innovation and entrepreneurial ecosystems.

2.1. Definition of Smart Cities

The “smart city” concept is becoming more popular in scientific literature and policy reports over the last two decades. A simple search of the “smart city” keyword appearance in the title of articles in Web of Science (WoS) as a scientific literature-indexing engine, revealed slightly over two thousand records as of 25 November, 2019. Figure 1 is an illustration of the publication growth trend of the “smart city” concept over the years, which is noticeable in the sharp growth of the terminology usage since 2012. The decrease in the number of publications in 2019 was because the search was undertaken prior to the end of 2019.
Cities are considered as key role players in social and economic aspects in global perspectives, and therefore, in order to understand the importance of cities as future key elements, the definitions of “smart cities” will be explored in this section.
The United Nations Population Fund indicates that in 2008, about 3.3 billion people, which is more than 50 percent of the global population, lived in urban areas. This estimation is expected to increase to 70 percent by 2050, according to a United Nations report [20]. The urbanization figure in Europe is currently 75 percent of the population and the number is expected to reach 80 flows by 2020 [20].
The term “smart cities” first appeared in the 1990s, the focus of which was on the significance of new ICT with regard to modern infrastructures within cities. Since then, the smart city definition ranges from where ICT facilitates the bridge between information and digital services with the participation of society and communities [21]. An in-depth analysis of the emerging literature revealed that the meaning of a smart city is multi-faceted and concerns the interdisciplinary studies [21,22]. Observation from the WoS publication’s bibliometric analysis indicates domains such as ICT; Computer Science; Urban Studies, and Green Sustainable Science Technology as the top science categories where the “smart cities” concept is contributing. From a systemic point of view, smart cities are encouraged for integrating technologies to disseminate services over their network for future developments. The capabilities of ICT infrastructure as a facilitator for creating new communication mediums becomes crucial, and therefore requires broadband network development, mass communication platform creation, citizen technology skills improvement, and institutional changes [23]. The advantage point of smart cities as a structure to enable the pre-mentioned movements has been seen as an opportunity for information exchange that flows between its many different subsystems [24]. A comprehensive definition of smart cities was provided by Nijkamp and Kourtit [25]: “Smart cities are the result of knowledge-intensive and creative strategies aiming at enhancing the socio-economic, ecological, logistic and competitive performance of cities. Such smart cities are based on a promising mix of human capital (e.g., skilled labor force), infrastructural capital (e.g., high-tech communication facilities), social capital (e.g., intense and open network linkages), and entrepreneurial capital (e.g., creative and risk-taking business activities)”. Hence, a recent classification by Neirotti et al. [26] defined two major domains for the smart city concept with regard to the exploitation of tangible and intangible urban assets: (1) hard domain, which concerns energy, lighting, environment, transportation, buildings, and health care and safety issues, and (2) soft domain, which addresses education, society, government, and economy. Shapiro [27] and Holland [11] argued over the soft domain aspect of smart cities such as human capital rather than hard domain aspects like ICT as the driver of smart city creation. According to Caragliu et al. [14], a city is smart “when investments in human and social capital and traditional (transport) and modern (ICT) communication infrastructure fuel sustainable economic growth and a high quality of life, with a wise management of natural resources, through participatory governance” (p. 70). Descriptions of smart cities are now appreciating the soft domain aspects like the qualities of people and communities as well as ICTs [6,9,28]. The new perspective that aims to inspire the sense of community among citizens gains insights from the previous bottom-up knowledge scheme and recognizes the importance of factors that emulates the concept of smart communities where members and institutions work in partnership to transform their environment [29]. Smart communities make conscious decisions on technology use for tackling societal challenges, which results not only in the increase in quality of life, but also as a means in which to reinvent the city’s capabilities for new communal practices [30]. The California Institute for Smart Communities could be exemplified among the first to focus on how communities could become smart and how a city could be designed to implement information technologies [31].
The vast range of contexts has led to the formation of a diverse and nebulous smart city design space, where there is little consensus over what smart cities are and what form they should take. This inhibits communal discourse and slows down the development and widespread deployment of smart city technologies and policies [11]. More crucially, it is a barrier to citizen engagement and bottom-up design. Communities are unlikely to engage with, identify, and then design solutions for civic problems while the smart city concept is incoherent, unapproachable, and hard to measure. The agenda for this research was to study the bridge between the embedded soft and hard domain aspects of smart cities and smart communities. On one hand, the hard domain side is where infrastructure such as ICT has a decisive role in the functions of the smart city. On the other hand, the term has also been applied to soft domains where approaches toward culture and social inclusion in a smart city are supposed to offer environments for entrepreneurship that are accessible to all citizens. In the study of Barbara-Sancheze [32], the role of smart city as a generator of new entrepreneurial initiatives has been explored in Spain by confirming the relationship between smart cities and the entrepreneurship rate. The taken aspect of the smart cities in this research concerns ICT provided opportunities such as social network services, and therefore social capital utilization for entrepreneurial ecosystem activities. Data in social network services as a communication platform will be utilized to study the content and discussions on the innovation and entrepreneurship in the smart city, while the general procedure to systematically deal with SNS data will be described. Furthermore, with the data analyzed and operationalization of the extracted simplified metrics, an attempt was made to investigate the influential content in SNSs regarding innovation and entrepreneurial discussions. Therefore, the conceptual framework for approaching smart cities within the focus of this research should offer insights regarding the operationalization of social network services data and the effect magnitude of content in SNSs in the context of innovation and entrepreneurship discussions.

2.2. The Role of Social Network Services (SNSs) in Innovation and Entrepreneurial Ecosystems

Innovation and entrepreneurship concepts are highly intertwined and are dependent on each other, and are recognized as the core critical components for the wealth and competitiveness of cities and countries [33]. Innovation is an inherently human endeavor, and successful innovation occurs when people with skills, experience, and capabilities come together to understand or predict, and then address existing challenges, while entrepreneurship is the attempt to set up and scale the efforts [34]. The study by Richter et al. [9] attempted to solidify the connection between the smart city and entrepreneurship by identifying six main characteristics ranging from ICT infrastructure and high-tech industries to social capital and social inclusion. The usage of the addition of ecosystem terminology is to introduce the complex relationships that are formed between actors and entities as stakeholders when studying both innovation and entrepreneurship concepts from a holistic perspective [35,36]. The ecosystem analogy informs the design of system-level innovation and entrepreneurial activities and has been used in the highly intertwined literature of “innovation” and “entrepreneurship”, while the prefix “eco” in innovation ecosystems implies a specifically ecological aspect [37,38]. The recent description of ecosystem by Adner [39] defines “ecosystem” as the alignment structure of the multilateral set of partners that need to interact in order for a focal value proposition to materialize.
Referring to the ecosystem addition to both innovation and entrepreneurship, ecosystems can have many components including the existence of prior ventures, a patent system, a culture tolerating failure, incubators, grant programs, and investments by business angels and/or venture capitalists [40]. An entrepreneurial ecosystem or entrepreneurship ecosystem refers to the human, financial, and professional resources and institutional environment that support and nurture new ventures in a specific geographic location [41]. Entrepreneurship, or the act of entrepreneurs, is crucial in any innovation ecosystem. According to Erikson [42], the dynamics and challenging nature of the innovation ecosystem of smart cities require entrepreneurs to adopt more important roles than usual in terms of identifying and exploiting opportunities. Smart cities are introduced as the territories that connect the physical, the information technology, the social, and the business infrastructure to leverage the capability of learning and innovation, which is built-into the collective intelligence of the city and its population [43]. The smart infrastructure of cities can tackle the existing challenges in innovation and entrepreneurship ecosystems. In particular, the role of ICT services as one of the dimensions of smart cities can enhance the innovation and entrepreneurship ecosystem. Smart cities have the infrastructure to bridge and facilitate the connectivity of society, and in general, the social capital for entrepreneurial activity. With the emergence of social network services in the past decade, a new medium has been created to present the society that has not received the proper attention yet. The social infrastructure such as intellectual and social capital, presented by SNSs, is an indispensable endowment to smart cities as it allows for “connecting people and creating relationships” [6]. ICTs also offer new avenues for openness by providing access to social media content and interactions that are created through the social interaction of users via highly accessible web-based technologies.
Social media platforms have had significant growth over the last decade. According to online statistics and market research source Statista [44], over 70 percent of Internet users were social network users in 2017 and these figures are expected to grow. It is estimated that the number of social media users will increase from 2.34 billion in 2016 to 2.95 billion in 2020 [45]. Social networking is one of the most popular online activities with high user engagement rates that expand mobile possibilities. The growth of the SNSs’ user base is universal and is now being increasingly populated and used by many diverse age groups [46,47]. The growth of social network services is unprecedented that is now so well established and considered a major visited service on the internet that doesn’t change much from year-to-year [48]. The recent evaluation of actively used social networking services by Pew Internet indicates Facebook as the dominant platform including the owned service of Instagram by 76% of the active user’s login while Twitter is reported to have 42% of active user’s logins [49].
It is, therefore, reasonable to say that social media represents a revolutionary new trend that has the potential to enhance existing and foster new cultures of openness [50]. Social media empowers its users by the ability to inexpensively publish or broadcast information as it gives them a platform to effectively democratize information and communication real-time. However, despite all the facilitation of information creation and dissemination, there seems to be a very limited understanding of what “social media” or “social networking services” exactly represent and eventually do to societies. Meanwhile, in smart city programs that have received great publicity, there has been less discussion about the evaluation and measurement regimes of societal and soft domain aspects in smart cities. The lack of metrics for grasping the societal activities has been depicted in the ‘Global Innovators: International Case Studies and Smart Cities’ [51] report, which notes the inadequacy of existing evaluation approaches that tend to be non-standard and focused on implementation processes and investment metrics rather than on city outcomes and impacts.
This paper aimed to investigate the social capital on innovation and entrepreneurship within the smart cities by diving into social networking services as the derivative of one of the major dimensions of smart cities. This research presents the utilization of SNSs in understanding and capturing entrepreneurially related discussions and further investigates the impact of various profile types on SNSs regarding entrepreneurial spirit. Further investigation of this research is to shed some light on how social network services are reshaping contemporary smart cities. The focus is on how smart cities should optimally deploy and exploit data coming from SNSs as part of their competitive strategies as well as how the analytical methods, tools, and techniques are best utilized for supporting operations. Furthermore, in the presented case study, social media discussions are seen as a curtail pillar in regulating entrepreneurially related activities in smart cities. Therefore, the attempt would be to capture and isolate the entrepreneurially related discussions in the smart city case via SNS outlets and evaluate the content and profile type of the content generators’ influence in the overall SNS interactions.

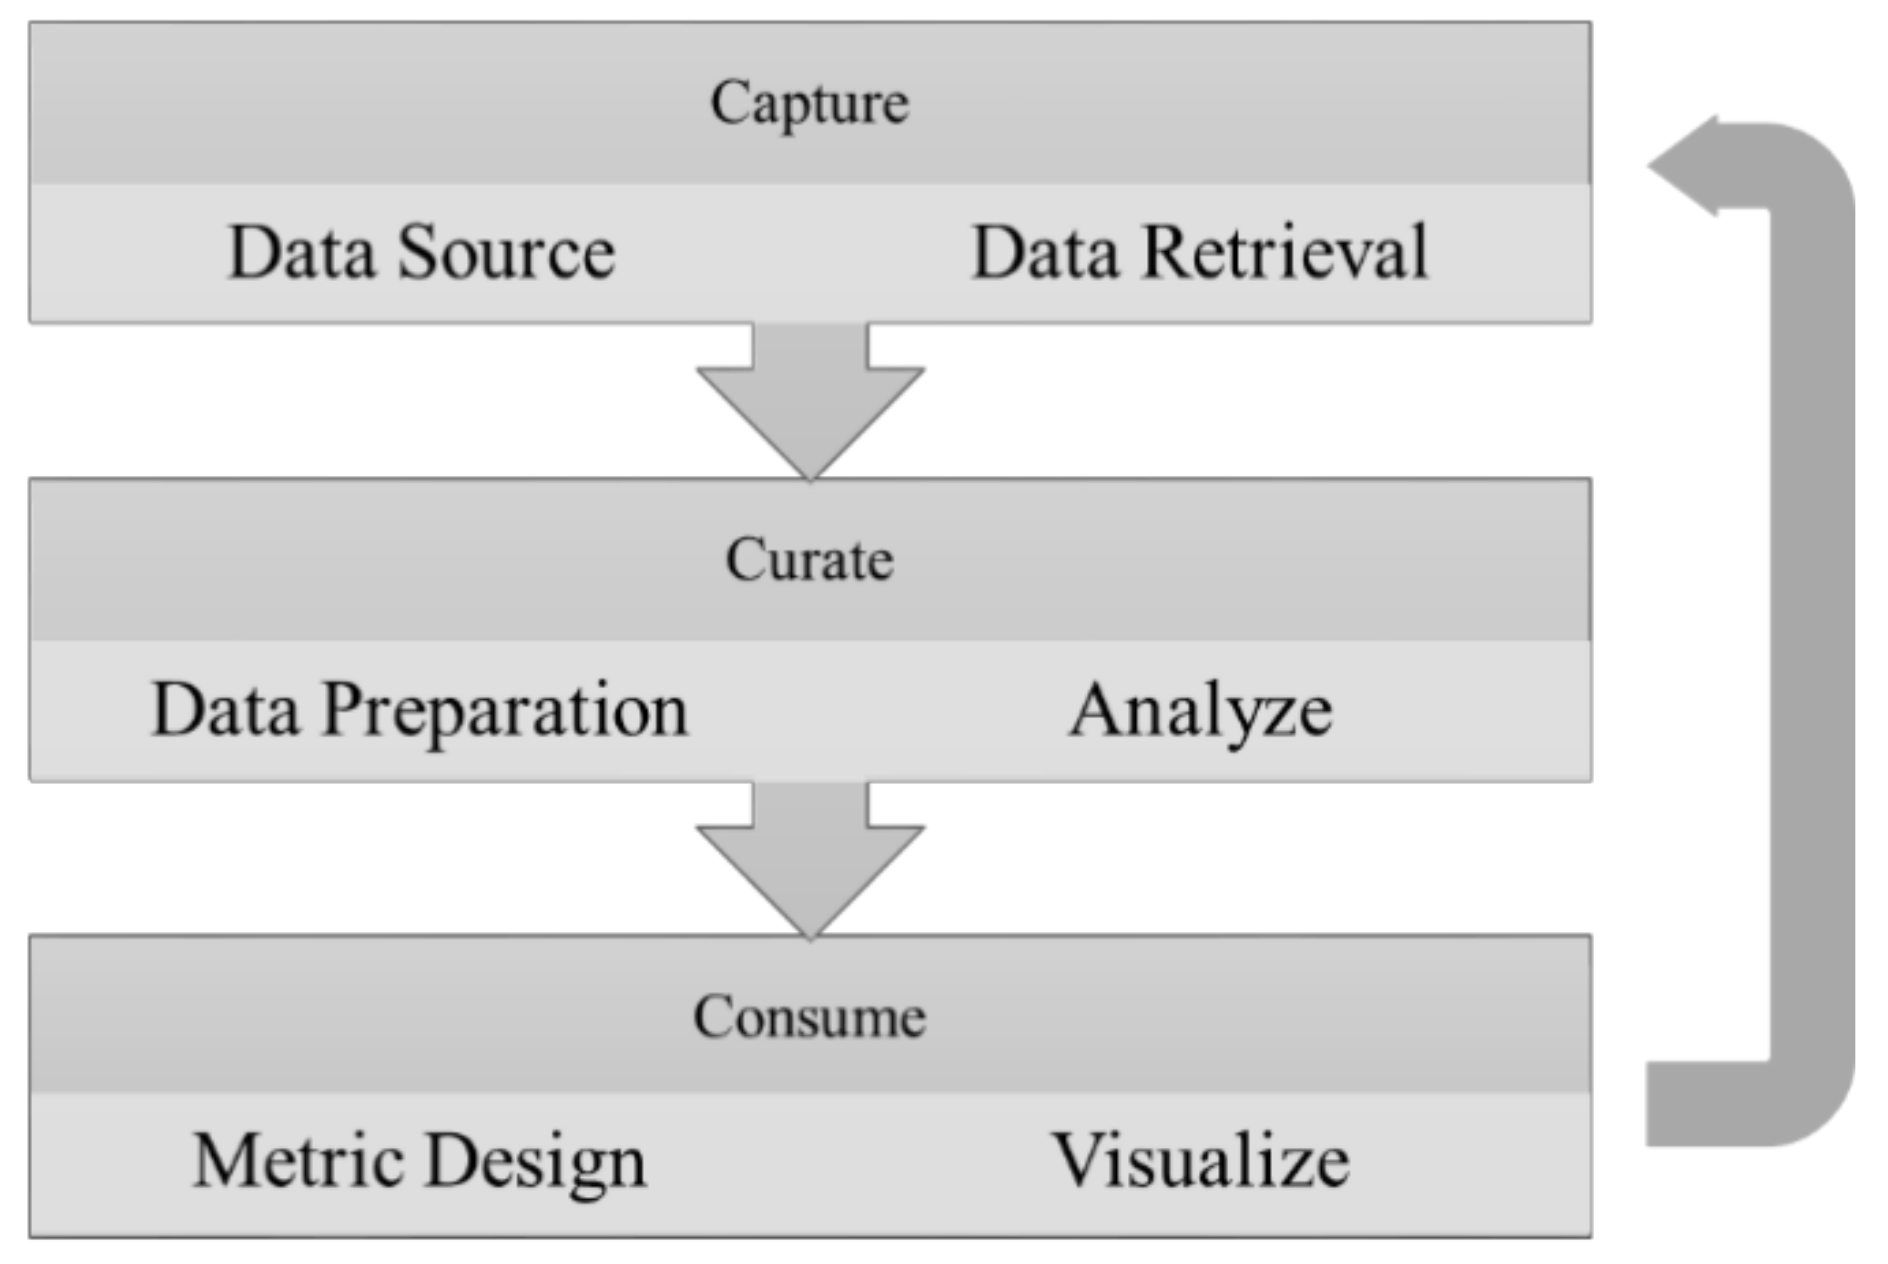
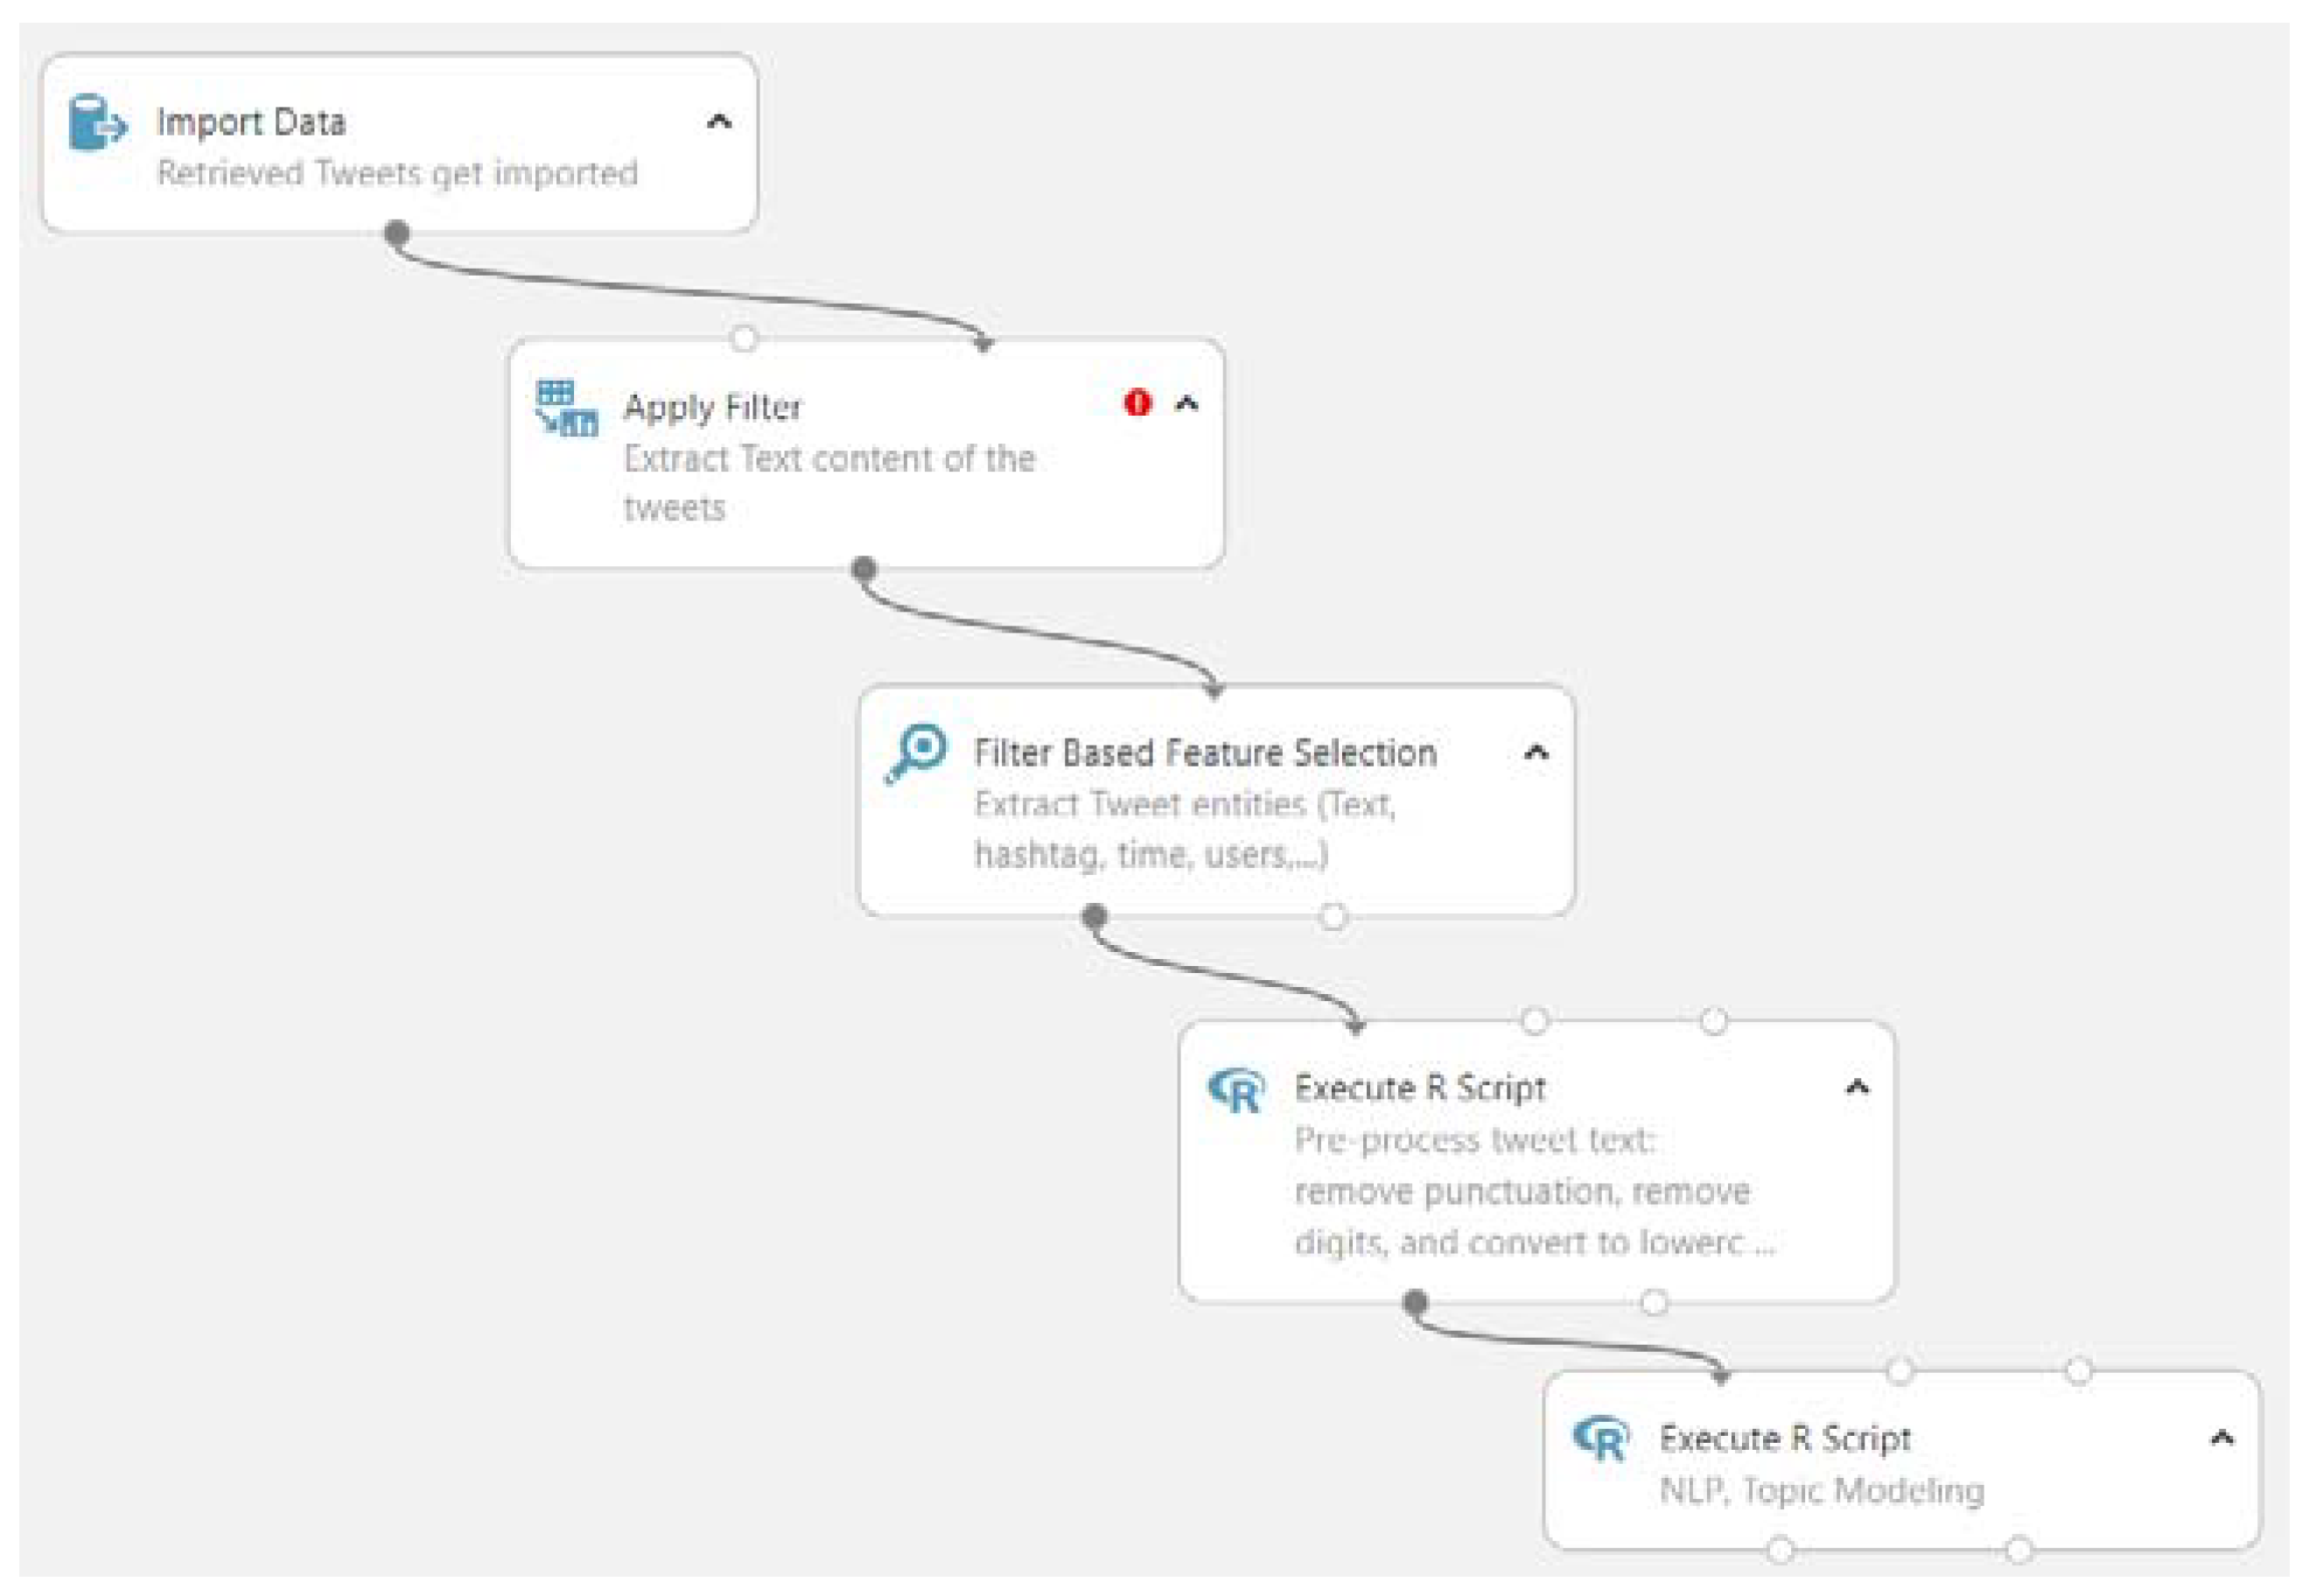
3. Research Methodology

In this section, the approach to utilizing computational advancements for analyzing social network services data in a systematic process is described. The approach uses semantic and linguistic analyses for detecting major topical discussions on Twitter as the SNS platform under study. The following section will describe a systematic approach to analyze social network services data; a general process on SNSs data collection, topic discovery, and topic-content analysis. Furthermore, the analysis interpretation discloses the insightful characteristics of tweets regarding their topic of discussion and the characteristics of the content generator.
Internet data are available in various formats; social network services provide one form of these data. Prior to the availability of such data, in the early 20th century, sociologists used to interview people to understand their social connections and, in this manner, used to form small social networks for analysis. Today, due to the activity on social networking platforms such as Twitter, it is possible to study the live tremendous content of SNSs, in addition to millions of nodes and billions of edges. The rise of computational power in the past decade has opened new opportunities for data analysis. At around the same time, exponential growth in Internet usage has accelerated the generation of enormous amounts of data. The ability to quickly access these multifaceted data and the availability of ever-increasing computational power has led to the rapid development of the field of social data analytics. Gartner [52], a research and advisory firm on information technology, defines social data analytics as the analytical tool of people’s interaction in social contexts, often with data obtained from social networking services. The data in SNSs often comes unstructured as information that is not organized in a pre-defined manner and does not necessarily present a pre-defined data model. Unstructured information is typically text-heavy, but may also contain data such as dates, numbers, and facts. Advancements in data mining and text analytics will be obtained in this study to analyze the SNS data for insightful information.
In this paper, the focus was on obtaining insights from SNSs as a major component in smart cities regarding entrepreneurial ecosystem activity. The overall architecture to process data in SNSs is composed and presented graphically in Figure 2. For the data collection platform, Twitter (twitter.com) was considered as it is a microblogging platform used by millions of users. However, the process has a high extent of generalizability to most of the data in SNSs platforms. The present process included three major phases: capture, curate, and consume. In addition, each phase had two sub-phases, according to Figure 2.
Capture: This is the process of collecting data, which contains the selection of the data source, searching for the data, and collecting data for other usage. Inputting the search query is the primary way to specify the content, which is of any interest to retrieve. Various specifications can be implemented such as keywords, length, date, etc. in order to target the topic of interest. In other words, the required data is obtained by a set of criteria embedded with the search query. Some SNS platforms such as Twitter offer the possibility of retrieving data via the live stream.
Curate: Data curation is a broad term used to indicate processes and activities related to the organization and integration of data collected from various sources. Data retrieval methods are often loosely controlled, resulting in out-of-range values. The data preparation task is performed to reduce the irrelevant and redundant data present in the collected set. This task is necessary for the forthcoming steps to normalize the data for better knowledge discovery results. Data analysis can be very subjective to the context of the study and expected results, but the two primary tasks in analysis can be mentioned as data feature extraction and data classification. The intent for feature extraction is to facilitate further distinctions and categorization of the data. This task will drive values (features) from the data regarding the context of the knowledge discovery process. Classification of the data occurs in order to reduce the dimensionality of the data. It is an approach derived from the general hypothesis of the knowledge discovery task to distinguish the best-fit data points from the mass. In this case study, topic modeling has been performed in order to understand the major important cluster of discussions regarding their topics. Topic modeling is a type of statistical modeling for discovering the abstract “topics” that occur in a collection of documents. Latent Dirichlet allocation (LDA) is an example of a topic model and was used in this study to classify a tweet’s text to a particular topic.
Consume: This refers to publishing a presentable format of the information derived from the data. The insights from the results can be provided in a visually appealing way or can be used as a metric to be combined with other data points for further interpretations. In the case of this study, the major topical structure of the text was extracted for simplification and capture of the dominant theme of the discussions.
Having the systematic social network services data analysis explained, the next section will explain the utilization of the presented procedure using a case study.

4. Evaluating Entrepreneurial Ecosystem Activity on Twitter: London City Case Experiment

The background literature discusses the importance of emerging social network services in smart cities and the need to investigate the effect of entrepreneurial discussions in the innovation ecosystem. In this section, the emphasis will be on a systematic approach to analyzing data from SNSs and emphasize new ways of benchmarking for social capital by focusing on social network services. In order to solidify the objective, an experiment was conducted to detect and capture entrepreneurial discussions on one of the dominant social network services called Twitter. A popular microblogging tool, Twitter, has seen a lot of growth since it launched in October 2006 and is an online news and social networking service where users post and interact with messages called ”tweets” that are restricted to 140 characters. Twitter users can post their opinions or share information about a subject to the public. Twitter has 316 million users worldwide [53], providing a unique opportunity to understand societal discussions, and in this study case, a way to comprehend entrepreneurially related discussions.
The initial interest of the study was to capture innovation and entrepreneurial related discussion from social network services as one of the major themes that need studying in smart cities. Startups are considered as a good representation of the societal practice of entrepreneurship. Startups are increasingly seen as significant contributors to national job-creation [54]; employment and gross national product data demonstrate the shift to an innovative startup-dominated economy [54]. Therefore, fostering the startup ecosystem is seen as a measure for improving the national economy [55]. The study case experiment was conducted to collect the activity related to the startup ecosystem in the studied country to capture the relevant societal discussions oriented toward innovation and entrepreneurship.
Twitter is an SNS platform, which well represents and acts as a support infrastructure for startups, which organically are socially active. The study took the initiative of collecting a sample of tweets from a region (city) and extracted features (words and hashtags) related to startup activities; additionally to decompose hashtags, analyze them, and reuse the information extracted for classification purposes. The operationalization of connectedness in Twitter is performed by hashtags, as it is the most common feature for users to connect and relate within a larger networked discourse [56]. Hashtags in Twitter have been used to separate the stream of tweets and unite the discussion streams. This functionality of Twitter has been studied in political science, communication studies, and social sciences [57,58,59].
Twitter provides an application programming interface (API) to access tweets and information about posted content and users. The potential bias of the Twitter API has been discussed by recent research [60]. Twitter data have been used for a wide range of studies such as the stock market [61], brand analysis [62], and election analysis [63]. The unique characteristics and features of Twitter as a microblogging service are illustrated in Figure 3.
With respect to Twitter’s characteristics, a multi-component semantic and linguistic framework was developed to collect Twitter data, prepare and analyze the data, and discover insightful information. In order to demonstrate the steps for utilizing SNSs data for valuable insights, a high ranked smart city was selected. Exploiting Cities in Motion Index (CIMI), Berrone et al. [64] evaluated 181 cities in more than 80 countries to determine the smartest cities around the world. According to the index results, the city of New York (USA), London (UK), and Paris (France) topped the list, respectively. London has been considered as one of the top smart cities in other global scale rankings [65,66]. In this study, the city of London was selected for further analysis due to its high ranking as a smart city and the use of English language, which will facilitate the text analytics tasks. With respect to Twitter’s characteristics, the search queries were constructed in a way that captures the most relevant content regarding the startup scene and the entrepreneurial activity.

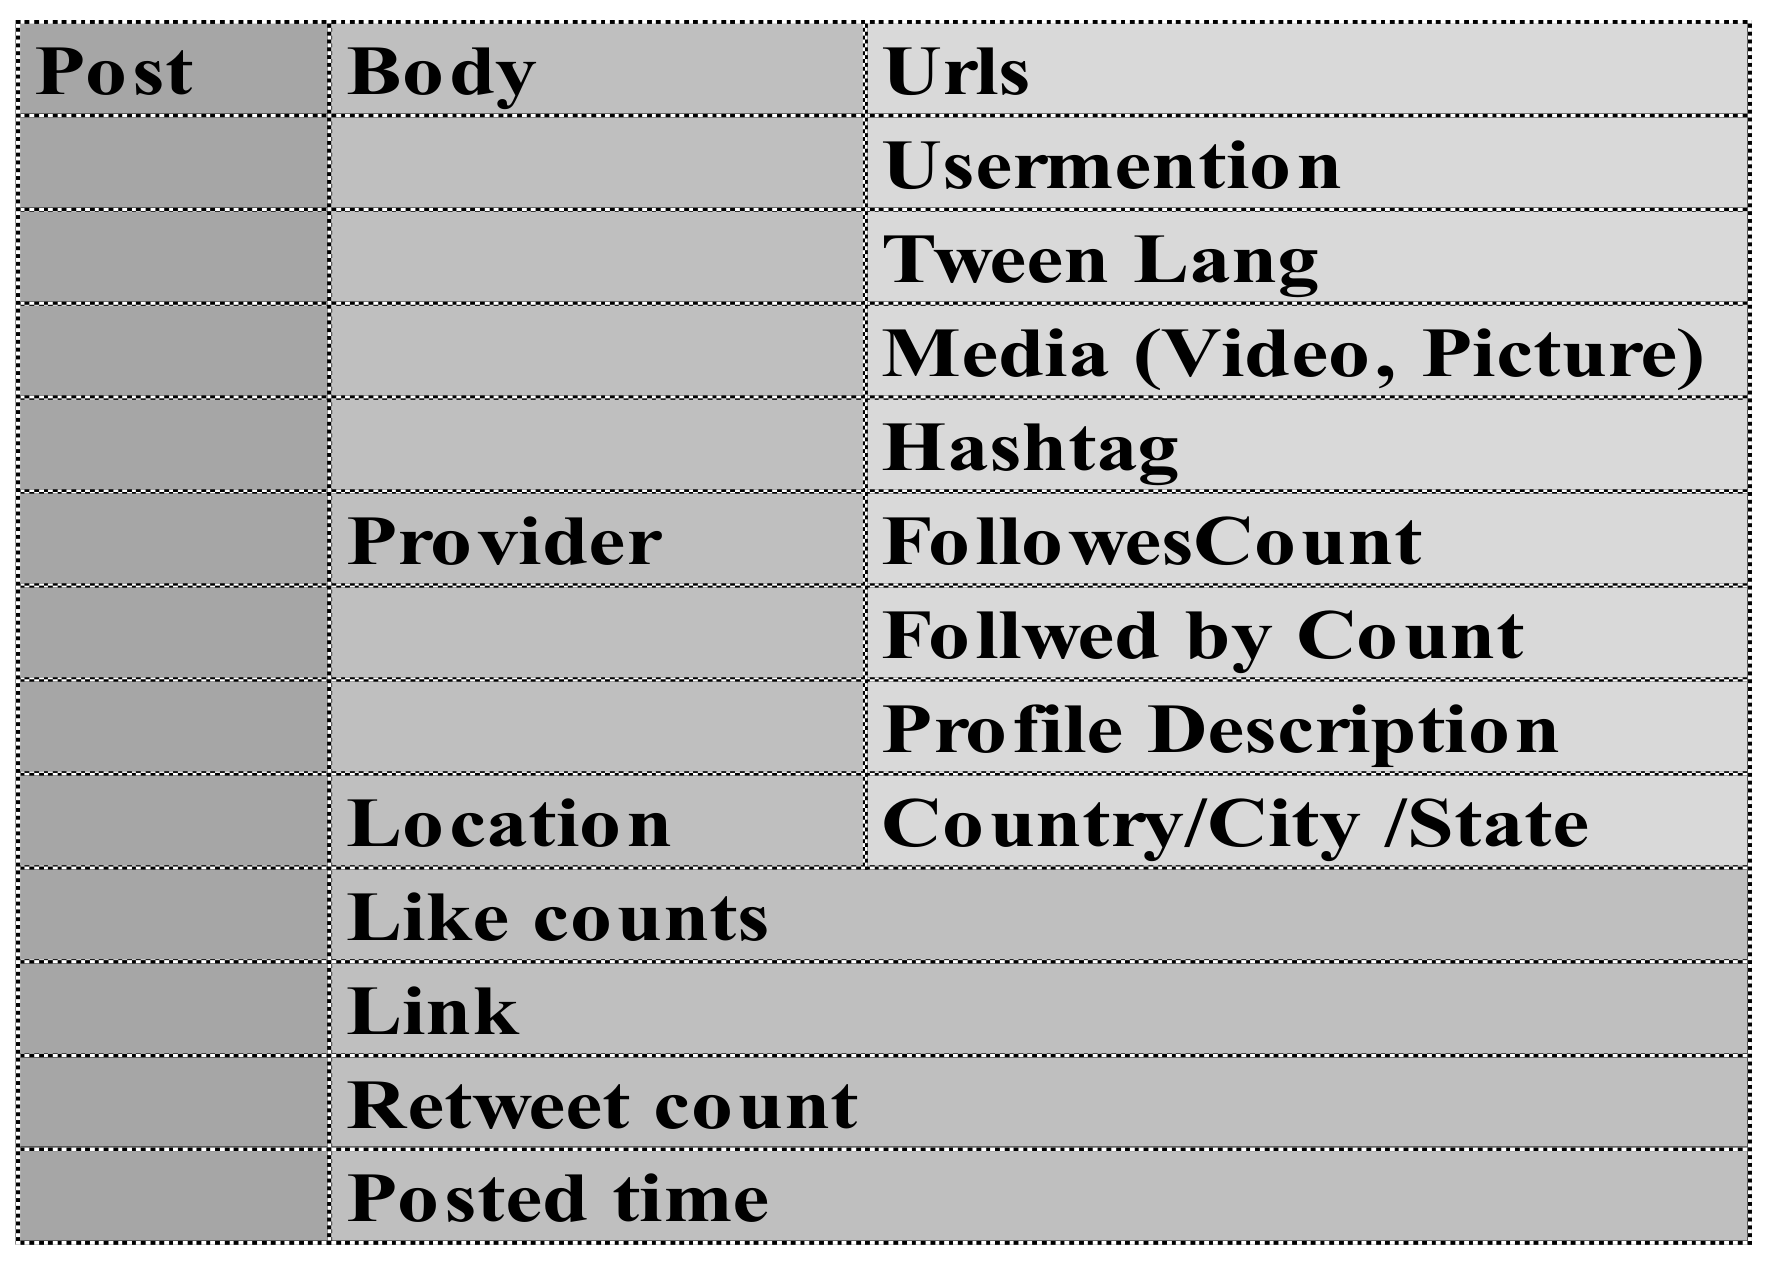
4.1. Data Collection

This phase attempted to collect relevant tweets using Twitter’s application programming interface (API) [67]. Based on the background literature, major keywords have been identified to capture entrepreneurial ecosystem activity in Twitter (e.g., Entrepreneurship, Startup, Innovation). Popular hashtag recommender toolkits were used such as “http://hashtagify.me, https://ritetag.com and “https://www.trendsmap.com to discover the relevant hashtags and their proximities to the innovation and entrepreneurial related discussions. The toolkits encounter the co-occurrence network of tweets, and accordingly their hashtags. Therefore, by inputting a keyword, the toolkits are able to recommend related hashtags based on their background information. Figure 4 illustrates the hashtags’ proximity with the subject of the initial search (#startup #startups #entrepreneur #tech #sme #innovation #entrepreneurship #startuplife #hackathon), which were obtained to detect the extended hashtags and relevant discussions.
Twitter’s API provides both historic and real-time data collections. The latter method randomly collects 10% of publicly available tweets. The real-time method was used to randomly collect publicly available English tweets using several pre-defined hashtags related queries mentioned previously within a specific period. The extended query was used to collect approximately 4000 related tweets between 06/01/2017 and 08/30/2017 in the city of London (the geolocation of retrieved tweets are specified as London city). The crude data are available at the following link “https://goo.gl/mZumDp. Table 1 shows a sample of the textual content of the processed and collected tweets, the users, and the overall interaction (sum of likes and retweets) for each tweet in this research.

4.2. Curate

In this phase, the analysis of tweets was advanced by Data feature extraction and data classification. Regarding the SNSs data collected from Twitter, the investigations began with an empirical analysis of the dynamics of the discussions on Twitter. The topical structure of the discussions will be studied. Furthermore, the investigating will continue to extract the characteristics of the major content producers. The Twitter analytic process was facilitated by the Azure cloud computing platform [68], and the pipeline of the process can be seen in Figure 5.
After importing the retrieved tweets as the input data, a total number of 4014 single tweets were considered for the analysis. A filtering process was applied to the structure and reduce the noise of the data meaning to extract the natural language text within the tweet from other data types (i.e., hashtags, mentions, URLs, non-English tweets if they exist). In addition, the data feature extraction distinguishes the valuable data points such as the number of retweets, likes, and profile identifications as well as the textual content of the tweets, as later on, these data points will be leveraged for further insights. The process involves using R which is a programming language and free software environment for statistical computing by the R Foundation for Statistical Computing. The R script will further process the tweet’s natural language text for tokenizing, lemmatizing, and stop words removal. The steps are necessary for the raw tweet’s content preparation for classification and topic extraction. The R script for handling text preprocessing and topic modeling has been inspired by Dmitriy Selivanov [69] compiled packages, which offers solutions for fast vectorization, topic modeling, distances, and word embeddings in the R language. One classification task for analyzing tweets, topic modeling, was utilized in order to reveal the topical formation of the discussions. Topic modeling can be described as a method for finding a group of words (i.e., topic) from a collection of documents (in this case, tweets) that best represents the information in the collection. It can also be thought of as a form of text mining, a way to obtain recurring patterns of words in textual material [70]. The technique used to obtain topic models in this study was the latent Dirichlet allocation (LDA) and the consequent visualization toolkit (LDAviz) was leveraged to visually show the major Twitter discussion topics [71]. The next section illustrates the results and findings (known as “consume”, according to the research methodology process), which represent the classification calculation results visually.
Following the three-step procedure for SNS systematic data analysis described in +-
*, the ‘Consume’ layer is presented as the “Results and Findings” in the next section.

5. Results and Findings

So far, the research process was able to encapsulate the entrepreneurial ecosystem activity via focusing on the startup scene in the smart city of London. The dynamic relevant discussions in social network services (in this study, Twitter) were captured and curated to transform the SNSs data into insightful information. The dynamic discussions and interactions on SNSs regarding entrepreneurially oriented matters can represent the social capital as explained in earlier sections. In this section, the task was to dive deeper into the SNSs data in order to detect the most influential content and type of associated content generator profiles. A categorization analysis task was performed into the textual content of the SNSs data in order to gain a broad overview and distinguish the general topic of discussions. Next, a statistical model was applied to capture the content type impression on the SNS.

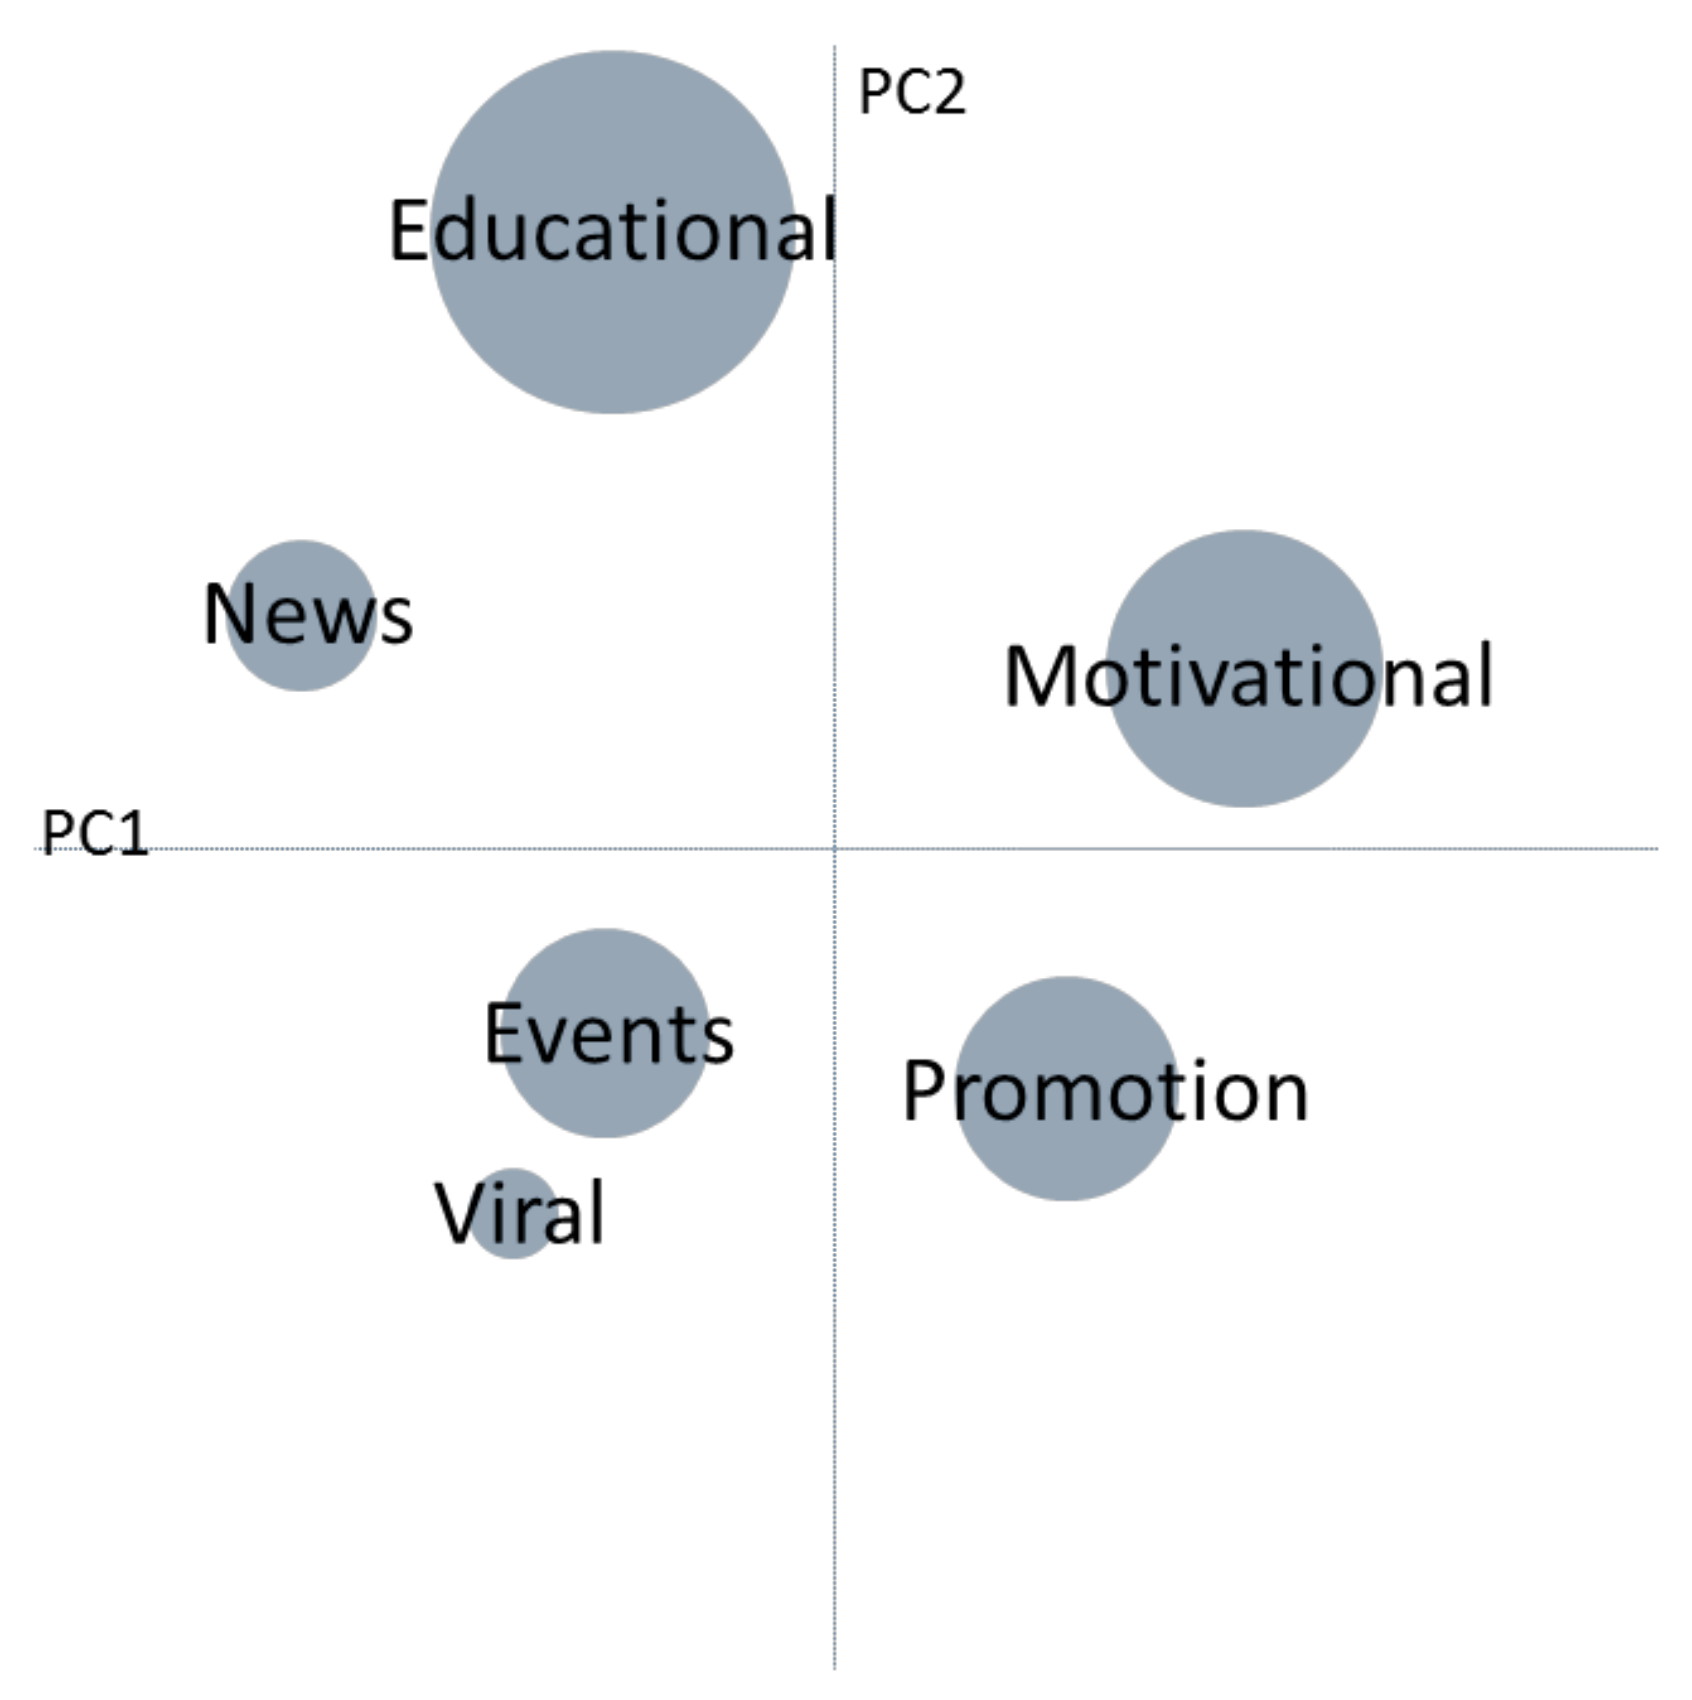
5.1. Content Type Categorization

The analysis of the topical structure of SNS discussion with LDA is visualized in Figure 6, which illustrates the general topical theme of the discussion. The six major clusters were named based on the major keywords mentioned under each topic. The visualization also revealed the size of the discussion proportional to other topics via their circle size and indicates the distance of topics in a two-dimensional distance map.
As part of the data consumption and insight generation task, by having the metadata of each posted tweet and the associated profile under each of the topics, influential profiles based on their overall interaction (number of retweets and likes received for the post) can be detected. This information will reveal how contents (tweets) receive attention in different topics regarding their content generators. The motivation for content generators in twitter profile categorization stems largely from the fact that humans as intelligent individuals impose complex factors on the consumption and dissemination of information on SNSs [72,73]. Therefore, as the different profile types have different purposes and cater to different needs, the categorization of content generators in each of the six topical discussions will be helpful in measuring the impact and influence each category makes. The categorization definitions and process was inspired by Uddin et al. [74] and due to the study intentions, three different major types of Twitter profile were defined and developed as follows:
Personal profiles: These accounts contain personal content, have no ties to business, and do not mention corporate or brand information. They are created by individuals who do not wish to be identified with their employer. Technically, the accounts have been created to acquire news, learn, have fun, etc. Generally, these individuals exhibit low to mild behavior in their social interaction.
Professional profiles: Personal users who communicate their professional views on Twitter. They share useful information on specific topics and are involved in healthy discussion related to their specialist interests and expertise. Professional users tend to be highly interactive: they follow many and are also followed by many.
Corporate and business profiles: Unlike personal and professional users in that they follow a marketing and business agenda on Twitter. Their profile description accurately describes their motives, and similar behavior can be observed in their tweeting patterns. Frequent tweeting and less interaction are the two key factors that separate business users from both personal and professional users. The type of content will primarily be corporate. Such accounts are often managed by company teams working under a specific brand name related to the company, providing corporate news and support.
Under each of the six discussion topics, profiles ranked based on their tweet interaction ratio (number of retweets + number of likes) were manually observed and categorized, according to the three major profile descriptions. Figure 7 is an illustration of the manual categorization of the top content generators or in other words, Twitter accounts based on their tweet’s interaction ratio. The cut of point decided to include 60 Twitter accounts to cover all tweets in the six categories of content. The 60 top content producers in Twitter generated a total of 1170 interactions, where their tweets’ contents were manually reviewed to identify the profile type.
As can be observed from Figure 7, professional users have more influence overall. In topical content categories, professional users generate the largest influence in educational, motivational, promotional, and events types of topics. Corporate and business profiles tend to be more influential in the news, educational, and promotional categories after professional users. Counting the likes, the calculation revealed that professional users have more interaction, especially in educational and motivational content category, while business profiles had a higher interaction in the news category and motivational category in second ranking. Personal profiles have the lowest influence among the other two profile categories in both retweets and count of likes. The difference in the distribution of interaction is that the motivational and educational categories received the highest retweets and in the calculation of like counts, the high-interacted categories shifted to events and news.

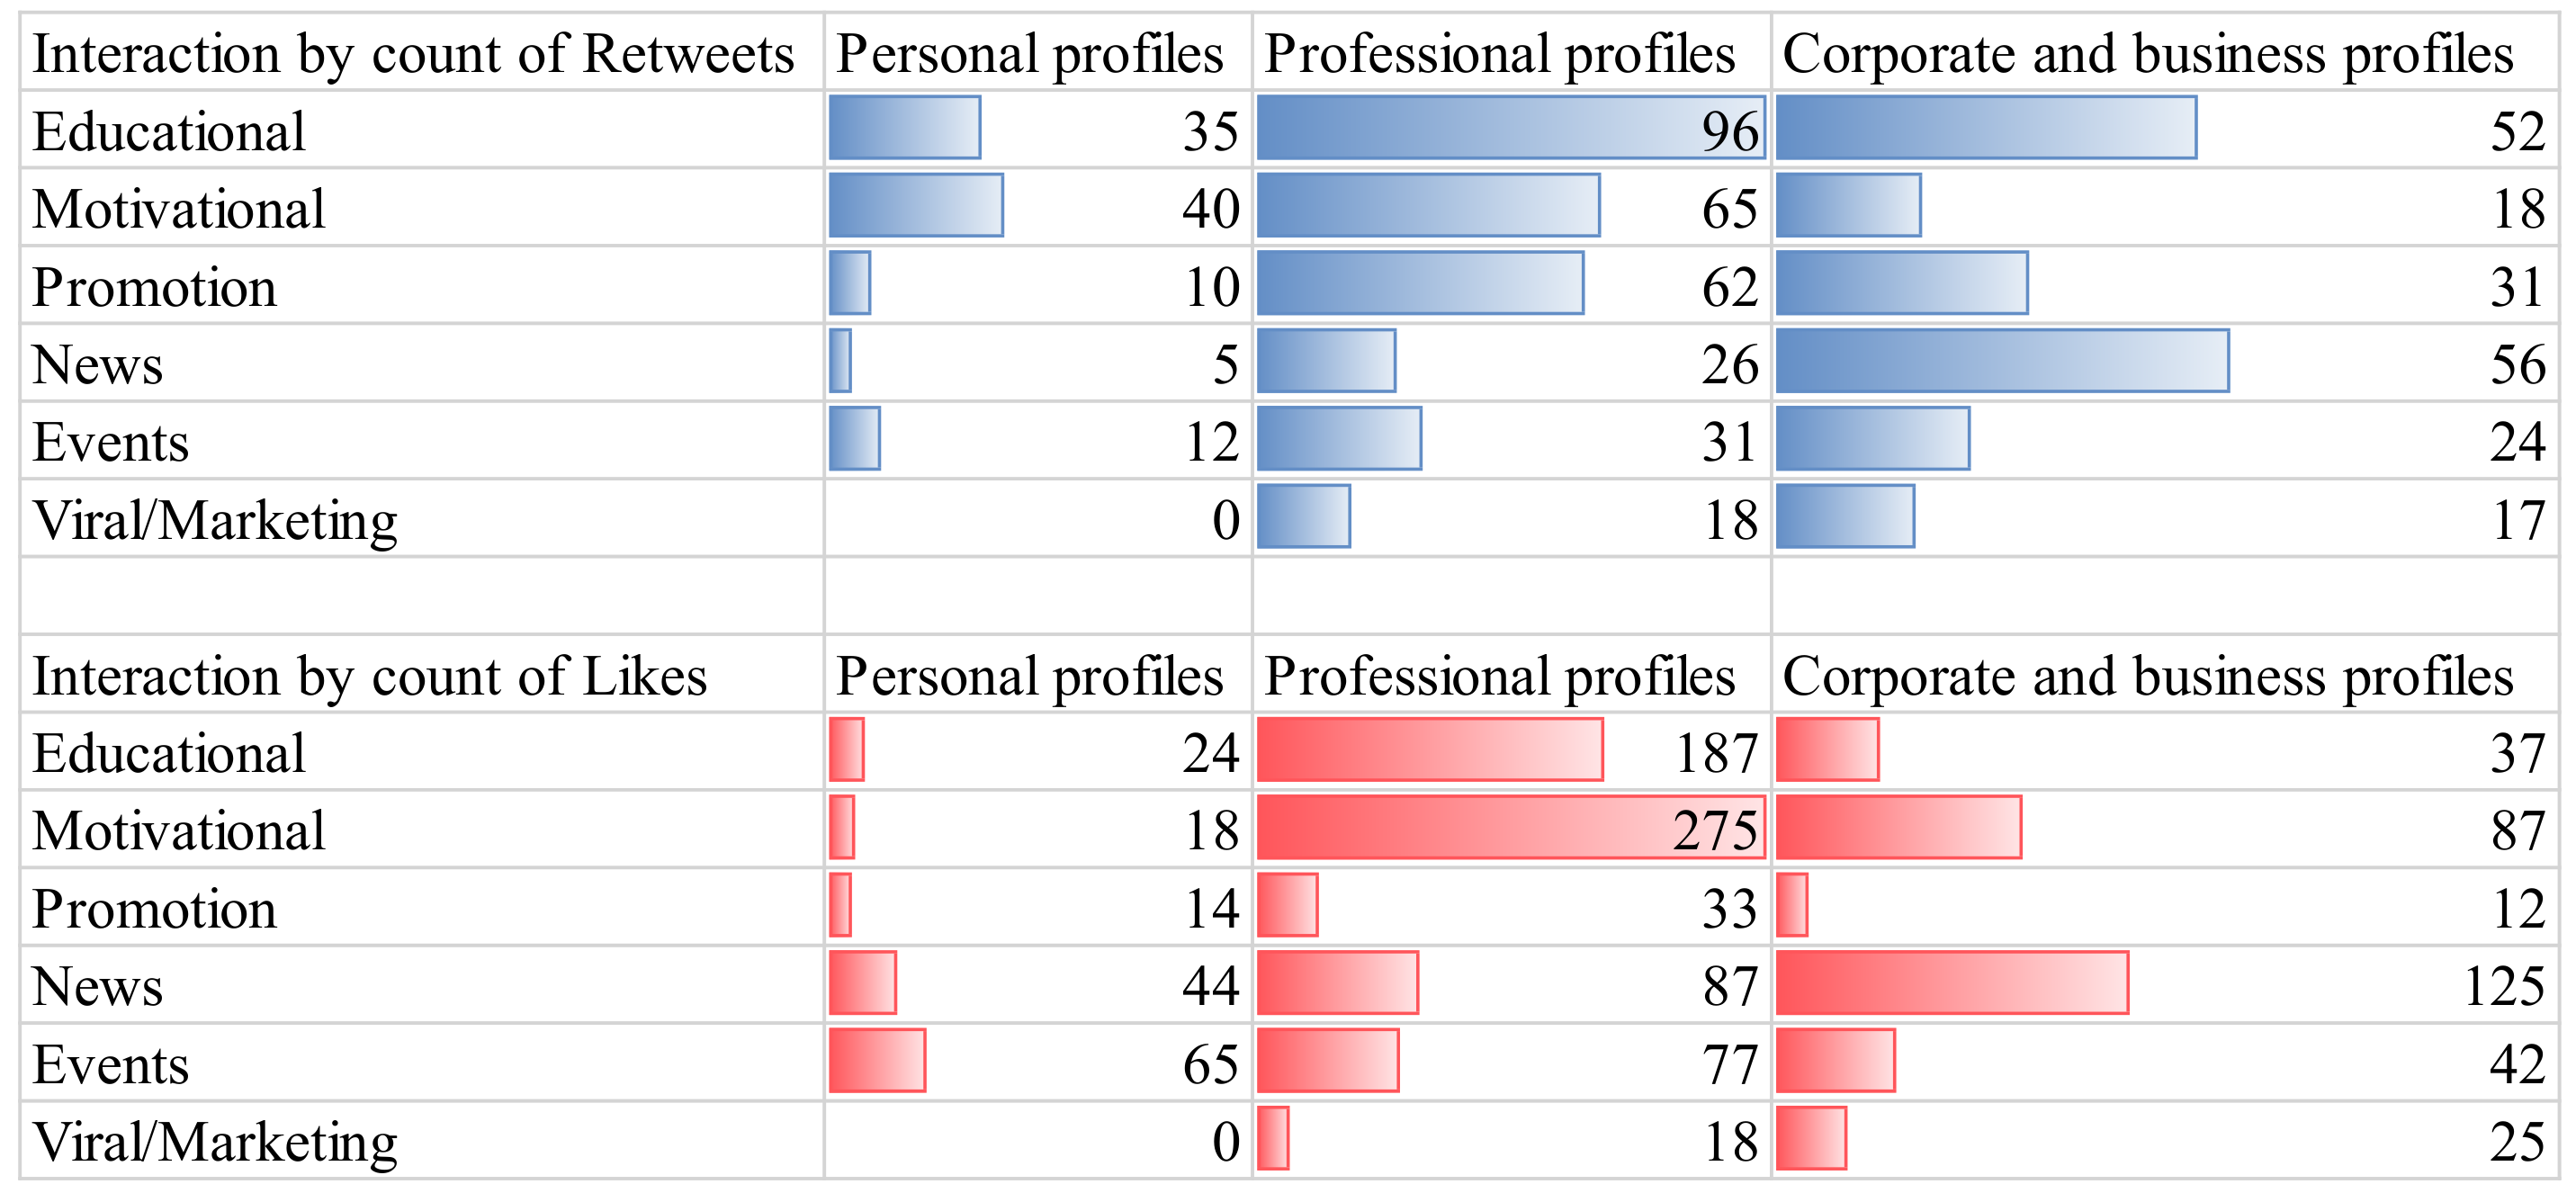
5.2. Content Type Impression in SNSs

Following the description of the tweets’ content type and profile category interaction, in this section, the goal was to capture if the type of tweet content and the type of Twitter profile that generated the content had any significant effect on the tweet’s received interaction/impression. In other words, the interest in this experiment was to determine how much of the variation in the dependent variable (tweet’s received interaction/impression) can be explained by all of the independent variables (tweets’ content type and profile category).
Multiple regression analysis is most often used to (a) predict new values for the dependent variable given the independent variables as well as (b) determine how much of the variation in the dependent variable is explained by the independent variables. As such, multiple regression extends simple linear regression, which is used when there is only one continuous independent variable (in this case, the tweets’ interaction). Multiple regression allows for a relationship to be modeled between multiple independent variables and a single dependent variable where the independent variables are being used to predict the dependent variable. Considering, for example, four independent variables to be “X1” through to “X4” and the dependent variable to be “Y”, the multiple regression models will be the following:
Y = β0 + β1X1 + β2X2 + β3X3 + β4X4+ ε
where β0 is the intercept (also known as the constant); β1 is the slope parameter (also known as the slope coefficient) for X1, and so forth, and ε represents the errors. In this experiment, the dependent variable was the tweet’s received interaction/impression and for the dependent variable, there were 18 dichotomous variables, which describes the six tweet content type (Educational, Motivational, Promotion, Events, News and Viral) and three profile categories (Personal, Professional, and Corporate & Business).
Before initiating the regression model, a check was undertaken for multicollinearity to decide among the highly correlated variables on which to drop and proceed. Otherwise, this leads to problems with understanding which variable contributes to the variance explained and technical issues in calculating a multiple regression model. In order to provide accuracy in interpretation based on the regression model, a check was undertaken for other required assumptions for performing the multiple regression model such as the independence of observations, testing for linearity using scatterplots, and the assumption of homoscedasticity (the detailed information for these checks can be seen in Appendix A).
The multiple regression procedure was initiated using SPSS Statistics software. Twelve variables were input to the model (the viral type of tweet was eliminated as it had a low number of observations and the test for including them did not improve the general explanatory power of the regression model). R squared for the overall model was 37.4% with an adjusted R2 of 32.5%, which is a moderate size effect according to Cohen [75]. The statistical significance of the model can be observed via the analysis of variance or ANOVA from Table 2.
Concluding from the test, it can be said that the 12 variables statistically significantly estimated the independent variable (interaction) F(12, 155) = 7.706, p < 0.0005. The value of these coefficients can be ascertained by inspecting the Coefficients table, as highlighted below: (full statistical summary including the coefficients table for all variables can be found in the the detailed information for these checks can be seen in Appendix A Table A1, Table A2, Table A3, Table A4, Table A5, Table A6 and Table A7 and Figure A1 and Figure A2).
Intercept for variables (ed-prof, mot-pers, mot-prof, and new-crop) was statistically significant (i.e., p < 0.0005). With the slope coefficients statistically significant for four of the independent variables, an interpretation can be performed to say that a positive increase in the interacting variable will be caused if more of the category profile type tweets are generated. For example, referring to the coefficients in Table 3, an increase of approximately 21 interactions is expected if one motivational tweet is generated by professional users, which is the highest expected interaction increase among the other independent variables.

6. Discussion and Conclusions

In this paper, an attempt was made to capture social capital on entrepreneurial ecosystem activity in smart cities’ infrastructure by utilizing SNSs data. By doing so, several key contributions to ongoing research and theory are proposed.
As noted previously, prior research has identified the smart city definition from various perspectives. Based on the soft domain classification of smart cities narrated by Neirotti et al. [26], which mainly considers society, government, and economy, this paper seeks to advance the understanding of the soft domain aspect of smart cities. In particular, the human and social aspects, which are empowered by ICT, were observed in pursuance of capturing and evaluating the effects on the innovation and entrepreneurial ecosystems within smart cities. Capturing and evaluating the presence of entrepreneurial related discussion took place by looking at a social network services platform (in this study, Twitter). The process for utilizing the SNSs data was explained in a systematical manner and the procedure was put into practice by applying it to a case study. The city of London was selected as a smart city in which the systematic process of retrieving information from SNSs was applied to startup discussions as the major community representing innovation and entrepreneurial related discussions. The aim was to identify the presence of influential forces in SNS, which promote and reinforce entrepreneurial related discussion in smart cities.
Prior research has conceptualized multitude dimensions of smart cities and have paid attention to social networking services for smart urban planning ([76,77,78,79]). This study attempts to advance approaches to analyzing social network services data and the addition it can provide regarding the soft domain features of smart cities. In this study, the focus was to give part of this picture more color by concentrating our attention on one important aspect of smart city design: How smart cities can leverage the presence of SNSs for entrepreneurial ecosystem activities in the innovation ecosystem. The use of technologies to generate intelligence from SNSs data is important as smart city services are increasingly based on the collection and analysis of complex datasets. In this study, a systematic process was demonstrated where the innovation and entrepreneurial discussions in the city of London were retrieved from Twitter for a three-month period. The data curation phase was accompanied with topic modeling techniques to extract the six major topical discussions (Educational, Motivational, Promotion, Events, News, and Viral). Furthermore, the categorization of three profiles (Personal, Professional, and Corporate & Business) gave an insightful illustration through high interaction tweets based on the generated profile and topical theme. In order to investigate the significant effect of profile and content type with received interaction, multiple regression modeling was adopted. Multiple regression was benefited to determine the proportion of the variation in the dependent variable (interaction) explained by the independent variables (Twitter profiles and content type). Multiple regression models provided an understanding that educational content generated by professional users, motivational content generated by personal and professional users, and news content generated by corporate users have a significant contribution toward the interaction by general users in SNSs.
The theoretical arguments developed here may potentially inform future efforts to understand how various types of content in SNSs may interact and influence the users. The level of interaction received for a type of content in SNSs, which was due to their profile characteristics in the context of entrepreneurially related discussion, may contribute significantly to emerging theory in the field of entrepreneurship in this manner. The results also provide context to the debate regarding having a shift of emphasis in smart city design, away from the mass installation of smart technologies and toward making citizens smarter, so that they can use technology. Previous studies have attempted to bring some clarity to the smart city design space by categorizing how cities negotiate physical space [80], generate and manage development policy [28], and balance their human, technological, and institutional dimensions [81,82]. The use of SNSs as a platform for mass communication is able to provide an environment to increase engagement between citizens and other major stakeholders such as companies and various agencies. It can be concluded that the latest ICTs and SNSs have transformed the traditional meaning of citizen participation. A smart city is a place with high social inclusion of its inhabitants widely due to ICT infrastructure, which facilities communication and information dissemination. This new understanding of citizen participation through SNSs has important implications for the planning and design of cities of the future. Utilizing SNSs in city planning will made city planning a collective challenge and responsibility to both governments and citizens [83].

7. Limitations and Future Research

The novelty of this research lies in the proposed strategy for addressing the opportunities with systematically comprehending social network services data. However, there are limitations and difficulties associated with the process of retrieving, validating, classifying, and generalizing the SNSs data, which is also addressed in the literature [84,85]. In the following, a detail description of each of the limitations found in this study and how we approached the question to be solved is presented.
The Twitter API service promises a random sample of their data for researchers, journalists, consultants, and government analysts to study human behavior. While there is not much available data on the Twitter company sampling mechanism, it has been communicated that the randomness of a sample is so that each element has an equal probability of being chosen [86]. While the scientific community agrees that this is a potential limitation, in this study, the attempt was to take a longer period for the data collection. Another potential limitation when it comes to Twitter is the applicability and popularity of the tool when performing urban level studies. Although the city case selection in this study was carefully considered, the methodology is offered in such a way that it can be replicable for other similar types of SNS applications in other city cases. In terms of validation and the reliability of the automized text analytics and natural language processing, there has been an incorporation of human judgment and intervention to make sure that any major biases do not occur.
Despite these limitations, this work considers a contribution to the literature as a starting point in an empirical analysis, with SNSs quantitative data impact calculations on the discussion of entrepreneurial ecosystem. The propositions advanced in this paper lend themselves to more empirical testing on social network services platforms. The application of systematized SNS data analysis and the templates used to highlight differences in the interaction with content in the SNS takes places considering the theme and the generating profiles. The applications from this study can be used in benchmarking SNS activity by a new metric design, which can initiate more “citizen-led” smart city perspective studies and promote large-scale population-wide initiatives in smart city research agendas.

Funding

The author is honored and thankful to have the support of the Foundation for Economic Education (grant number 14-7729) to conduct this study.

Conflicts of Interest

The author declares no conflicts of interest.

Appendix A

Table A1. Descriptive Statistics.
MeanStd. DeviationN
interact12.6612.079168
ed-pers0.080.268168
ed-prof0.050.226168
ed-corp0.050.214168
mot-pers0.070.248168
mot-prof0.070.248168
mot-corp0.050.214168
pro-pers0.030.170168
pro-prof0.030.170168
pro-corp0.080.268168
new-pers0.050.214168
new-prof0.080.268168
new-corp0.050.226168
Table A2. Correlations.
interacted-persed-profed-corpmot-persmot-profmot-corppro-perspro-profpro-corpnew-persnew-profnew-corp
Pearson Correlationinteract1.000−0.2080.237−0.0170.1910.415−0.003−0.117−0.097−0.112−0.142−0.0970.127
ed-pers−0.2081.000−0.069−0.065−0.077−0.077−0.065−0.051−0.051−0.084−0.065−0.084−0.069
ed-prof0.237−0.0691.000−0.053−0.063−0.063−0.053−0.042−0.042−0.069−0.053−0.069−0.057
ed-corp−0.017−0.065−0.0531.000−0.059−0.059−0.050−0.039−0.039−0.065−0.050−0.065−0.053
mot-pers0.191−0.077−0.063−0.0591.000−0.070−0.059−0.046−0.046−0.077−0.059−0.077−0.063
mot-prof0.415−0.077−0.063−0.059−0.0701.000−0.059−0.046−0.046−0.077−0.059−0.077−0.063
mot-corp−0.003−0.065−0.053−0.050−0.059−0.0591.000−0.039−0.039−0.065−0.050−0.065−0.053
pro-pers−0.117−0.051−0.042−0.039−0.046−0.046−0.0391.000−0.031−0.051−0.039−0.051−0.042
pro-prof−0.097−0.051−0.042−0.039−0.046−0.046−0.039−0.0311.000−0.051−0.039−0.051−0.042
pro-corp−0.112−0.084−0.069−0.065−0.077−0.077−0.065−0.051−0.0511.000−0.065−0.084−0.069
new-pers−0.142−0.065−0.053−0.050−0.059−0.059−0.050−0.039−0.039−0.0651.000−0.065−0.053
new-prof−0.097−0.084−0.069−0.065−0.077−0.077−0.065−0.051−0.051−0.084−0.0651.000−0.069
new-corp0.127−0.069−0.057−0.053−0.063−0.063−0.053−0.042−0.042−0.069−0.053−0.0691.000
Sig. (1-tailed)interact 0.0030.0010.4140.0060.0000.4850.0650.1060.0740.0330.1050.050
ed-pers0.003 0.1870.2020.1620.1620.2020.2570.2570.1400.2020.1400.187
ed-prof0.0010.187 0.2470.2090.2090.2470.2960.2960.1870.2470.1870.233
ed-corp0.4140.2020.247 0.2230.2230.2600.3070.3070.2020.2600.2020.247
mot-pers0.0060.1620.2090.223 0.1830.2230.2750.2750.1620.2230.1620.209
mot-prof0.0000.1620.2090.2230.183 0.2230.2750.2750.1620.2230.1620.209
mot-corp0.4850.2020.2470.2600.2230.223 0.3070.3070.2020.2600.2020.247
pro-pers0.0650.2570.2960.3070.2750.2750.307 0.3470.2570.3070.2570.296
pro-prof0.1060.2570.2960.3070.2750.2750.3070.347 0.2570.3070.2570.296
pro-corp0.0740.1400.1870.2020.1620.1620.2020.2570.257 0.2020.1400.187
new-pers0.0330.2020.2470.2600.2230.2230.2600.3070.3070.202 0.2020.247
new-prof0.1050.1400.1870.2020.1620.1620.2020.2570.2570.1400.202 0.187
new-corp0.0500.1870.2330.2470.2090.2090.2470.2960.2960.1870.2470.187
Ninteract168168168168168168168168168168168168168
ed-pers168168168168168168168168168168168168168
ed-prof168168168168168168168168168168168168168
ed-corp168168168168168168168168168168168168168
mot-pers168168168168168168168168168168168168168
mot-prof168168168168168168168168168168168168168
mot-corp168168168168168168168168168168168168168
pro-pers168168168168168168168168168168168168168
pro-prof168168168168168168168168168168168168168
pro-corp168168168168168168168168168168168168168
new-pers168168168168168168168168168168168168168
new-prof168168168168168168168168168168168168168
new-corp168168168168168168168168168168168168168
Table A3. Variables Entered/Removed.
ModelVariables EnteredVariables RemovedMethod
1 new-corp, pro-prof, pro-pers, mot-corp, ed-corp, new-pers, ed-prof, mot-prof, mot-pers, ed-pers, new-prof, pro-corp a Enter
Dependent Variable: interact. a All requested variables entered.
Table A4. Model Summary.
ModelRR SquareAdjusted R SquareStd. Error of the EstimateDurbin-Watson
10.611 a0.3740.3259.9221.556
Dependent Variable: interact. a Predictors: (Constant), new-corp, pro-prof, pro-pers, mot-corp, ed-corp, new-pers, ed-prof, mot-prof, mot-pers, ed-pers, new-prof, pro-corp.
Table A5. Coefficients.
ModelUnstandardized CoefficientsStandardized CoefficientstSig.95,0% Confidence Interval for BCorrelationsCollinearity Statistics
BStd. ErrorBetaLower BoundUpper BoundZero-orderPartialPartToleranceVIF
1(Constant)10.8361.338 8.1000.0008.19413.479
ed-pers−6.8363.060−0.152−2.2340.027−12.881−0.792−0.208−0.177−0.1420.8771.141
ed-prof13.8303.5680.2593.8770.0006.78320.8780.2370.2970.2460.9081.101
ed-corp0.9143.7540.0160.2430.808−6.5038.330−0.0170.0200.0150.9171.091
mot-pers10.5273.2770.2163.2120.0024.05417.0010.1910.2500.2040.8921.121
mot-prof20.7093.2770.4256.3190.00014.23527.1830.4150.4530.4020.8921.121
mot-corp1.6643.7540.0290.4430.658−5.7539.080−0.0030.0360.0280.9171.091
pro-pers−6.2364.635−0.088−1.3460.180−15.3922.919−0.117−0.107−0.0860.9451.058
pro-prof−4.8364.635−0.068−1.0440.298−13.9924.319−0.097−0.084−0.0660.9451.058
pro-corp−2.8363.060−0.063−0.9270.355−8.8813.208−0.112−0.074−0.0590.8771.141
new-pers−5.8363.754−0.103−1.5550.122−13.2531.580−0.142−0.124−0.0990.9171.091
new-prof−2.2213.060−0.049−0.7260.469−8.2653.823−0.097−0.058−0.0460.8771.141
new-corp8.2753.5680.1552.3190.0221.22715,3220.1270.1830.1470.9081.101
Dependent Variable: interact.
Table A6. Collinearity Diagnostics.
ModelDimensionEigenvalueCondition IndexVariance Proportions
(Constant)ed-persed-profed-corpmot-persmot-profmot-corppro-perspro-profpro-corpnew-persnew-profnew-corp
111.8201.0000.090.030.020.020.020.020.020.010.010.030.020.030.02
21.0001.3490.000.040.010.000.080.020.220.160.010.040.070.200.00
31.0001.3490.000.010.130.020.000.010.180.010.30 0.160.010.040.00
41.0001.3490.000.210.010.070.060.210.020.210.000.050.010.010.00
51.0001.3490.000.070.140.020.130.030.200.090.040.010.040.090.00
61.0001.3490.000.020.000.010.000.020.020.000.000.010.000.000.77
71.0001.3490.000.180.230.050.070.070.070.060.030.040.030.020.01
81.0001.3490.000.000.000.000.060.040.020.020.060.260.090.280.00
91.0001.3490.000.000.080.120.230.330.010.030.040.010.010.000.00
101.0001.3490.000.050.060.270.010.030.050.020.070.040.240.030.00
111.0001.3490.000.140.080.170.120.000.010.270.020.000.040.010.00
121.0001.3490.000.000.040.080.000.000.030.020.310.110.250.030.00
130.1803.1810.910.260.190.170.230.230.170.110.110.260.170.260.19
Dependent Variable: interact.
Table A7. Residuals Statistics.
MinimumMaximumMeanStd. DeviationN
Predicted Value4.0031.5512.667.384168
Std. Predicted Value−1.1732.5580.0001.000168
Standard Error of Predicted Value1.3384.4372.5880.962168
Adjusted Predicted Value2.2534.1012.667.438168
Residual−25.54534.6360.0009.559168
Std. Residual−2.5753.4910.0000.963168
Stud. Residual−2.7003.661 0.0001.002168
Deleted Residual−28.10038.1000.00010.346168
Stud. Deleted Residual−2.7573.8180.0031.015168
Mahal. Distance2.04232.40611.929 8.395168
Cook’s Distance0.0000.1030.0060.015168
Centered Leverage Value0.0120.1940.071 0.050168
Dependent Variable: interact.
Figure A1. Histogram.
Smartcities 03 00007 g0a1
Figure A2. Normal P-P Plot of Regression Standardized Residual.
Smartcities 03 00007 g0a2

References

  1. Caird, S.; Hudson, L.; Kortuem, G. A Tale of Evaluation and Reporting in UK Smart Cities. 2016. Available online: http://oro.open.ac.uk/46008/7/__userdata_documents4_ctb44_Desktop_Tales_Smart_Cities_Final_2016.pdf (accessed on 25 February 2019).
  2. Bibri, S.E. A foundational framework for smart sustainable city development: Theoretical, disciplinary, and discursive dimensions and their synergies. Sustain. Cities Soc. 2018, 38, 758–794. [Google Scholar] [CrossRef]
  3. World Economic Forum. The Competitiveness of Cities: A report of the Global Agenda Council on Competitiveness. 2014. Available online: http://www3.weforum.org/docs/GAC/2014/WEF_GAC_CompetitivenessOfCities_Report_2014.pdf (accessed on 3 April 2019).
  4. Mori, K.; Christodoulou, A. Review of sustainability indices and indicators: Towards a new City Sustainability Index (CSI). Environ. Impact Assess. Rev. 2012, 32, 94–106. [Google Scholar] [CrossRef]
  5. Bibri, S.E.; Krogstie, J. Smart sustainable cities of the future: An extensive interdisciplinary literature review. Sustain. Cities Soc. 2017, 31, 183–212. [Google Scholar] [CrossRef]
  6. Albino, V.; Berardi, U.; Dangelico, R.M. Smart Cities: Definitions, Dimensions, Performance, and Initiatives. J. Urban. Technol. 2015, 22, 3–21. [Google Scholar] [CrossRef]
  7. Beattie, A. False Economy: A Surprising Economic History of the World; L. Penguin: London, UK, 2009. [Google Scholar] [CrossRef]
  8. Anttiroiko, A.V. City-as-a-platform: The rise of participatory innovation platforms in finnish cities. Sustainability 2016, 8, 922. [Google Scholar] [CrossRef] [Green Version]
  9. Richter, C.; Kraus, S.; Syrjä, P. The Smart City as an opportunity for entrepreneurship. Int J. Entrep. Ventur. 2015, 7, 211. [Google Scholar]
  10. Lombardi, P.; Giordano, S.; Farouh, H.; Yousef, W. Modelling the smart city performance. Innovation 2012, 25, 137–149. [Google Scholar] [CrossRef]
  11. Hollands, R.G. Will the real smart city please stand up? City 2008, 12, 303–320. [Google Scholar] [CrossRef]
  12. Thuzar, M. Urbanization in Southeast Asia: Developing SMart Cities for the Future? Reg. Econ. Outlook 2012, 96–100. [Google Scholar]
  13. Kourtit, K.; Nijkamp, P. In praise of megacities in a global world. Reg. Sci. Policy Pract. 2013, 5, 167–182. [Google Scholar] [CrossRef]
  14. Caragliu, A.; del Bo, C.; Nijkamp, P. Smart cities in Europe. J. Urban. Technol. 2011, 18, 65–82. [Google Scholar] [CrossRef]
  15. Anthopoulos, L.G. Understanding Smart Cities: A Tool for Smart Government or an Industrial Trick? Springer International Publishing: Cham, Switzerland, 2017. [Google Scholar] [CrossRef]
  16. Zuccardi Merli, M.; Bonollo, E. Performance Measurement in the Smart Cities. In Smart City: How to create public and economic value with high technology in urban space; Springer: Cham, Switzerland, 2014; pp. 139–155. [Google Scholar]
  17. Wiebe, J.; Breck, E.; Buckley, C.; Cardie, C. Recognizing and Organizing Opinions Expressed in the World Press. In Working Notes - New Directions in Question Answering (AAAI Spring Symposium Series US. 2003, pp. 12–19. Available online: https://www.cs.cornell.edu/home/cardie/papers/aaai-ss-overall-03.pdf (accessed on 29 January 2020).
  18. Yi, J.; Nasukawa, T.; Bunescu, R.; Niblack, W. Sentiment analyzer: Extracting sentiments about a given topic using natural language processing techniques. In Proceedings of the Third IEEE International Conference on Data Mining, Melbourne, FL, USA, 22 November 2003; pp. 427–434. [Google Scholar]
  19. Eichstaedt, J.C.; Schwartz, H.A.; Kern, M.L.; Park, G.; Labarthe, D.R.; Merchant, M.; Sneha, J.; Ungar, H.; Emiliy, E.; Weeg, C.; et al. Psychological Language on Twitter Predicts County-Level Heart Disease Mortality. Psychol. Sci. 2015, 26, 159–169. [Google Scholar] [CrossRef] [Green Version]
  20. UNPD. World Urbanization Prospects: The 2007 Revision Population Database. Published Online First. 2007. Available online: http://esa.un.org/unup/ (accessed on 3 June 2019).
  21. Anthopoulos, L.G.; Vakali, A. Urban planning and smart cities: Interrelations and reciprocities. In The Future Internet: Future Internet Assembly 2012: From Promises to Reality; 2012; Springer: Berlin, Germany; Volume 7281, pp. 178–189. [Google Scholar]
  22. Anthopoulos, L.G. Understanding the smart city domain: A literature review. In Stakeholder Engagement in the Smart City: Making Living Labs Work; Springer: Berlin, Germany, 2015; pp. 9–21. [Google Scholar]
  23. Schaffers, H.; Komninos, N.; Pallot, M.; Trousse, B.; Nilsson, M.; Oliviera, A. Smart cities and the future internet: Towards cooperation frameworks for open innovation. In The Future Internet Assembly 2011: The Future Internet; Springer: Berlin, Germany, 2011; Volume 6656, pp. 431–446. [Google Scholar]
  24. Gartner. Hype Cycle for Smart City Technologies and Solutions. 2011. Available online: https://www.gartner.com/doc/1754915/hype-cycle-smart-city-technologies (accessed on 12 March 2019).
  25. Nijkamp, P.; Kourtit, K. The “New Urban Europe”: Global Challenges and Local Responses in the Urban Century. Eur. Plan. Stud. 2013, 21, 291–315. [Google Scholar] [CrossRef]
  26. Neirotti, P.; De Marco, A.; Cagliano, A.C.; Mangano, G.; Scorrano, F. Current Trends in Smart City Initiatives: Some Stylised Facts; Elsevier: Porto, Portugal, 2014. [Google Scholar] [CrossRef] [Green Version]
  27. Shapiro, J. Smart Cities: Quality of Life, Productivity, and the Growth Effects of Human Capital. Harvard College: Cambridge, MA, USA, 2005. [Google Scholar] [CrossRef]
  28. Nam, T.; Pardo, T.A. Smart city as urban innovation. In Proceedings of the 5th International Conference on Theory and Practice of Electronic Governance - ICEGOV ’11; ACM Press: New York, NY, USA, 2011; p. 185. [Google Scholar]
  29. Berardi, U. Sustainability Assessments of urban Communities through Rating Systems. Environ. Dev. Sustain. 2013, 15, 1573–1591. [Google Scholar] [CrossRef]
  30. Eger, J.M. Smart Growth, Smart Cities, and the Crisis at the Pump A Worldwide Phenomenon. I-Ways 2009, 32, 47–53. [Google Scholar] [CrossRef]
  31. Alawadhi, S.; Aldama-Nalda, A.; Chourabi, H.; Ramon, G.G.; Walker, S.; Hans, J.; Pardo, T.A.; Naam, T.; Leung, S.; Mellouli, S. Building understanding of smart city initiatives. In International Conference on Electronic Government 2012: Electronic Government; Springer: Berlin, Germany, 2012; Volume 7443, pp. 40–53. [Google Scholar]
  32. Barba-Sáncez, V.; Arias-Antúnez, E.; Orozco-Barbosa, L. Smart cities as a source for entrepreneurial opportunities: Evidence for Spain. Technol. Forecast. Soc. Chang. 2019, 148, 119713. [Google Scholar] [CrossRef]
  33. World Economic Forum. Entrepreneurial Ecosystems Around the Globe and Company Growth Dynamics; World Economic Forum: Colony, Switzerland, 2013; p. 36. [Google Scholar]
  34. Drucker, P. Innovation and Entrepreneurship; Routledge: Abingdon, UK, 2012. [Google Scholar]
  35. Jackson, D. What is an Innovation Ecosystem. pp. 1–11. Available online: http://erc-assoc.org/sites/default/files/topics/policy_studies/DJackson_Innovation%20Ecosystem_03-15-11.pdfext-link-type= (accessed on 23 March 2019).
  36. Autio, E.; Thomas, L.D.W. Innovation Ecosystems; Oxford University Press: Oxford, UK, 2014. [Google Scholar] [CrossRef]
  37. Ritala, P.; Almpanopoulou, A. In defense of ‘eco’ in innovation ecosystem. Technovation 2017, 60–61, 39–42. [Google Scholar] [CrossRef]
  38. Hajikhani, A. Emergence and Dissemination of Ecosystem Concept in Innovation Studies: A Systematic Literature Review Study. In Hawaii International Conference on System Sciences (HICSS); University of Hawai’i at Manoa: Honolulu, HI, USA, 2017; pp. 1–12. [Google Scholar]
  39. Adner, R. Ecosystem as Structure. J. Manag. 2017, 43, 39–58. [Google Scholar] [CrossRef]
  40. Isenberg, D.J. The big idea: How to start an entrepreneurial revolution. Harv. Bus. Rev. 2010, 88. [Google Scholar] [CrossRef]
  41. Thomas, L.D.W.; Sharapov, D.; Autio, E. Linking entrepreneurial and innovation ecosystems: The case of AppCampus. In Entrepreneurial Ecosystems and the Diffusion of Startups; Edward Elgar Publishing, 2015; pp. 35–64. ISBN 9781784710057. [Google Scholar]
  42. Erikson, T. “The Promise of Entrepreneurship As a Field of Research”: A Few Comments and Some Suggested Extensions. Acad. Manag. Rev. 2001, 26, 12–13. [Google Scholar] [CrossRef]
  43. Harrison, C.; Eckman, B.; Hamilton, R.; Hartswick, P.; Kalagnanam, J.; Paraszczak, J.; Williams, P. Foundations for Smarter Cities. IBM J. Res. Dev. 2010, 54, 1–16. [Google Scholar] [CrossRef]
  44. Statista, T. The Statista Portal. 2019. Available online: https://comwww.statista.com (accessed on 15 September 2019).
  45. Statista. Number of social network users worldwide from 2010–2018. Statista. 2017. Available online: https://www.statista.com/statistics/278414/number-of-worldwide-social-network-users/ (accessed on 12 June 2019).
  46. Kaplan, A.M.; Haenlein, M. Users of the world, unite! The challenges and opportunities of Social Media. Bus. Horiz. 2010, 53, 59–68. [Google Scholar] [CrossRef]
  47. Peters, K.; Chen, Y.; Kapplan, A.M.; Ognibeni, B.; Pauwels, K. Social media metrics—A framework and guidelines for managing social media. J. Interact. Mark. 2013, 27, 281–298. [Google Scholar] [CrossRef]
  48. Chaffey, D. Global social media research summary 2017. smartinsights. 2017. Available online: http://www.smartinsights.com/social-media-marketing/social-media-strategy/new-global-social-media-research/ (accessed on 2 October 2017).
  49. Center, P.R. Social Media Fact Sheet. 2017. Available online: http://www.pewinternet.org/fact-sheet/social-media/ (accessed on 1 October 2017).
  50. Bertot, J.C.; Jaeger , P.T.; Grimes, J.M. Using ICTs to create a culture of transparency: E-government and social media as openness and anti-corruption tools for societies. Gov. Inf. Q. 2010, 27, 264–271. [Google Scholar] [CrossRef]
  51. Departament for Business innovation & Skills. Global Innovators: International Case Studies on Smart Cities Smart Cities Study (Bis research paper no 135. 2013. Available online: https://www.gov.uk/government/publications/smart-cities-international-case-studies-global-innovators (accessed on 20 June 2019).
  52. Gartner. Social Analytics. 2017. Available online: https://www.gartner.com/it-glossary/social-analytics (accessed on 5 March 2018).
  53. Olanoff, D. Twitter Monthly Active Users Crawl To 316M, Dorsey: We are not satisfied. 2015. Available online: http://apps.who.int/iris/bitstream/10665/204871/1/9789241565257_eng.pdf (accessed on 10 June 2019).
  54. Sohl, J.E. Angel investing: Changing strategies during volatile times. J. Entrep Financ Bus. Ventur 2006, 11, 27–47. [Google Scholar]
  55. Melo, L.D.J.; Ozorio, L.; de La Rovere, R.L. Entrepreneurship in BRICS; Springer: New York, NY, USA, 2015. [Google Scholar] [CrossRef]
  56. Bruns, A.; Burgess, J. Twitter Hashtags from ad hoc to calculated publics. In Hashtag Publics: The Power and Politics of Discursive Networks; Digital Formations, 2015; pp. 13–28. ISBN 10:1433128985. [Google Scholar]
  57. Bennett, W.L.; Segerberg, A. THE LOGIC OF CONNECTIVE ACTION. Information, Commun Soc. 2012, 15, 739–768. [Google Scholar] [CrossRef] [Green Version]
  58. Chang, H.C. A new perspective on Twitter hashtag use: Diffusion of innovation theory. Proc. Am. Soc. Inf. Sci. Technol. 2010, 47, 1–4. [Google Scholar]
  59. Ince, J.; Rojas, F.; Davis, C.A. The social media response to Black Lives Matter: How Twitter users interact with Black Lives Matter through hashtag use. Ethn. Rac. Stud. 2017, 40, 1814–1830. [Google Scholar] [CrossRef]
  60. González-Bailón, S.; Wang, N.; Rivero, A.; Borge-Holthoefer, J.; Moreno, Y. Assessing the bias in samples of large online networks. Soc. Netw. 2014, 38, 16–27. [Google Scholar] [CrossRef]
  61. Bollen, J.; Mao, H.; Zeng , X. Twitter mood predicts the stock market. J. Comput. Sci. 2011, 2, 1–8. [Google Scholar] [CrossRef] [Green Version]
  62. Hajikhani, A.; Porras, J.; Melkas, H. Brand Analysis in Social Network Services: Results from Content Analysis in Twitter Regarding the US Smartphone Market. Int. J. Innov. Technol. Manag. 2016, 1740008. [Google Scholar] [CrossRef]
  63. Tumasjan, A.; Sprenger, T.; Sandner, P.; Welpe, I. Predicting elections with Twitter: What 140 characters reveal about political sentiment. In Proceedings of the Fourth International AAAI Conference on Weblogs and Social Media, Washington, DC, USA, 23 – 26 May 2010; pp. 178–185. [Google Scholar]
  64. Silva, B.N.; Khan, M.; Han, K. Towards sustainable smart cities: A review of trends, architectures, components, and open challenges in smart cities. Sustain. Cities Soc. 2018, 38, 697–713. [Google Scholar] [CrossRef]
  65. Gray, A. These are the best-run cities in the world. World Econ Forum. 2017. Available online: https://www.weforum.org/agenda/2017/10/worlds-best-run-cities-jll/ (accessed on 17 July 2019).
  66. Forbes. Forbes. 2017. Available online: https://www.forbes.com/sites/iese/2017/05/31/the-smartest-cities-in-the-world-for-2017 (accessed on 23 December 2019).
  67. Twitter. Twitter developer documentation. Available online: 2017.https://dev.twitter.com/docs (accessed on 21 November 2019).
  68. Microsoft Azure Cloud Computing Platform. Available online: azure.microsoft.com (accessed on 5 January 2019).
  69. Selivanov, D. Topic modeling. Available online: http://text2vec.org/topic_modeling.html (accessed on 1 March 2019).
  70. Sievert, C.; Shirley, K. LDAvis: A method for visualizing and interpreting topics. In Proceedings of the workshop on interactive language learning, visualization, and interfaces, Baltimore, ML, USA, 27 June 2014; pp. 63–70. [Google Scholar]
  71. Blei Blei, D.M. Latent dirichlet allocation. J. Mach. Learn. Res. 2003, 3. [Google Scholar]
  72. Khan, L.M. Social media engagement-What motivates user participation and.pdf. Comput. Hum. Behav. 2017, 66, 236–247. [Google Scholar] [CrossRef]
  73. Lussier, J.; Raeder, T.; Chawla, N. User Generated Content Consumption and Social Networking in Knowledge-Sharing OSNs. Int. Conf. Soc. Comput. Behav. Model. Predict. 2010. [Google Scholar]
  74. Uddin, M.M.; Imran, M.; Sajjad, H. Understanding Types of Users on Twitter. 2014, 6. [Google Scholar]
  75. Cohen, J. Statistical Power Analysis for the Behavioral Sciences. Lawrence Erlbaum Associates, Inc.: New York, NY, USA, 1988. [Google Scholar]
  76. Mora, H.; Pérez-delHoyo, R.; Paredes-Pérez, J.F.; Mollá-Sirvent, R.A. Analysis of social networking service data for smart urban planning. Sustainability 2018, 10, 4732. [Google Scholar] [CrossRef] [Green Version]
  77. Moustaka, V.; Theodosiou, Z.; Vakali, A.; Kounoudes, A.; Anthopoulos, L.G. Enhancing social networking in smart cities: Privacy and security borderlines. Technol. Forecast. Soc. Chang. 2019, 142, 285–300. [Google Scholar] [CrossRef]
  78. Appio, F.P.; Lima, M.; Paroutis, S. Understanding Smart Cities: Innovation ecosystems, technological advancements, and societal challenges. Technol. Forecast. Soc. Chang. 2019, 142, 1–14. [Google Scholar] [CrossRef]
  79. Sandoval-Almazan, R.; Cruz, D.V.; Armas, J.C.N. Social media in smart cities: An exploratory research in mexican municipalities. In Proceedings of the 2015 48th Hawaii International Conference on System Sciences, Kauai, HI, USA, 5–8 January 2015; 2015; pp. 2366–2374. [Google Scholar]
  80. Angelidou, M. Smart city policies: A spatial approach. Cities 2014, 41, S3–S11. [Google Scholar] [CrossRef]
  81. Chourabi, H.; Nam, T.; Walker, S.; Ramon Gil-Garcia, J.; Mellouli, S.; Nahon, K.; Prado, T.A. Understanding Smart Cities: An Integrative Framework. In 2012 45th Hawaii International Conference on System Sciences; IEEE: Piscataway, NJ, USA, 2012; pp. 2289–2297. [Google Scholar]
  82. Cardullo, P.; Kitchin, R. Being a ‘citizen’ in the smart city: Up and down the scaffold of smart citizen participation in Dublin, Ireland. GeoJournal 2019, 84. [Google Scholar] [CrossRef]
  83. Goldsmith, S.; Crawford, S. The responsive city: Engaging communities through data-smart governance. Public Adm. Rev. 2014, 208. [Google Scholar]
  84. Ruiz Soler, J. Twitter research for social scientists: A brief introduction to the benefits, limitations and tools for analysing Twitter data. Dígitos Rev. Comun Digit. 2017, 1, 17–32. [Google Scholar]
  85. Martí, P.; Serrano-Estrada, L.; Nolasco-Cirugeda, A. Social Media data: Challenges, opportunities and limitations in urban studies. Comput. Environ. Urban. Syst. 2019, 74, 161–174. [Google Scholar] [CrossRef]
  86. Pfeffer, J.; Mayer, K.; Morstatter, F. Twitter’s Tampered Samples and the Limitations of Big Data Sampling. Biomedcentral 2019. [Google Scholar] [CrossRef]
Figure 1. “Smart City” concept in publication volume over the years.
Smartcities 03 00007 g001
Figure 2. Social network services (SNSs) systematic data analysis.
Smartcities 03 00007 g002
Figure 3. Twitter meta data illustration.
Smartcities 03 00007 g003
Figure 4. Twitter hashtag proximity map.
Smartcities 03 00007 g004
Figure 5. Twitter content analysis with the Azure cloud computing platform.
Smartcities 03 00007 g005
Figure 6. Intertopic distance map.
Smartcities 03 00007 g006
Figure 7. Categorization of tweet’s interactions based on topic and generator.
Smartcities 03 00007 g007
Table 1. Sample of retrieved tweets.
UserBodyInteractionHashtagsURLsMentionsFollowers CountFollowing CountProfile Description
@JonGarciaElevate your strategic approach. Master these & become unstoppable #success #wealth #startup #business #moneymaker1#success #wealth #startup #business #moneymakerNONO1736NO
@obinformatics1 reason startups fail is that they don’t have the resources at the beginning. Don’t be afraid to ask for help #startup #tip #resource #help0#startup #tip #resource #helpNONO1073YES
@Ryan_EPNeed to summize performance of your #startup? ARR growth can be misleading, choose @salesforce’s strategy of booking.6#startupNOYES13242543NO
@AAINaggarWhat’s #Cognitive #Tech? #AI #Robotics #BigData #defstar5 #Mpgvip #SMM #Startup #IoT #makeyourownlane #Marketing #Deeplearning #ML #M2M 54#Cognitive #Tech #AI #Robotics #BigData #defstar5 #Mpgvip #SMM #Startup #IoT #makeyourownlane #Marketing #Deeplearning #ML #M2MNONO5321345YES
@CoffeeSpaceHQFuelling the #startup community @techdayhq with good stuff. With @KERB_ and the delicious…Instagram.com/p/Ba39R5oBOP-/5#startup YESYES312645YES
@elliottldenham#techday #london in full swing! Absolutely buzzing! #tech #startup16#techday #london #tech #startupNONO159867NO
@AbadesiGreat session yesterday @Google talking all things #startup and #Entrepreneurship #blackhistorymonthUK #PocTech20#startup #Entrepreneurship #blackhistorymonthUK #PocTechNOYES4327312YES
@siyatechventureDon’t Build a Startup, Build a Movment Medium.com/swlh/don’t-buil… #entrepreneur #startup #venture #growthhacking #contentmarketing #sales12#entrepreneur #startup #venture #growthhacking #contentmarketing #salesNOYES12430YES
Table 2. ANOVA model descriptive.
ModelSum of SquaresdfMean SquareFSig.
Regression9104.19512758.6837.7060.000 a
Residual15,259.46615598.448
Total24,363.661167
Dependent Variable: interaction. a Predictors: (Constant), new-corp, pro-prof, pro-pers, mot-corp, ed-corp, new-pers, ed-prof, mot-prof, mot-pers, ed-pers, new-prof, pro-corp.
Table 3. Description of the coefficients.
Unstandardized CoefficientsStandardized CoefficientsSig.
BStd. ErrorBeta
(Constant)10.8361.338 0.000
ed-prof13.8303.5680.2590.000
mot-pers10.5273.2770.2160.002
mot-prof20.7093.2770.4250.000
new-corp8.2753.5680.1550.022

