Article

Optimal DG Placement to Find Optimal Voltage Profile Considering Minimum DG Investment Cost in Smart Neighborhood

by
Mohammadreza Fathi
1 and
Mohammad Ghiasi
1,2,*
1
Power Control Center (PCC), Tehran Metro, Tehran Urban and Suburban Railway Operation Co, Tehran 11318-13131, Iran
2
Department of Electrical and Electronics Engineering, Shiraz University of Technology, Shiraz 71557-13876, Iran
*
Author to whom correspondence should be addressed.
Smart Cities 2019, 2(2), 328-344; https://doi.org/10.3390/smartcities2020020
Submission received: 18 May 2019 / Revised: 14 June 2019 / Accepted: 21 June 2019 / Published: 25 June 2019

Abstract

:
Distributed Generations (DGs) have a productive capacity of tens of kilowatts to several megawatts, which are used to produce electrical energy at close proximity to consumers, which of the types of DGs can be named solar cells and Photovoltaics (PVs), fuel cells, micro turbines, wind power plants, and etc. If such kinds of power plants are connected to the network in optimal places, they will have several positive effects on the system, such as reducing network losses, improving the voltage profile, and increasing network reliability. The lack of optimal placement of DGs in the network will increase the costs of energy production and losses in transmission lines. Therefore, it is necessary to optimize the location of such DGs in the network so that the number of DGs, installation locations, and their capacity are determined to which the maximum reduction in network losses occurs. Besides, by applying an appropriate objective function, the evolutionary algorithm can find the optimal location of renewable units with respect to the constraints of the issue. In this paper, the Genetic Algorithm (GA) and the Particle Swarm Optimization (PSO) algorithm are used to address the placement of wind and photovoltaic generators simultaneously in two states: With and without considering the effects of greenhouse gas emission. In this regard, first, an analytical method for optimal DG (wind and PV) placement is presented, then, the proposed approach is applied over a real study case, and the simulation carried out using the MATLAB program; hence, the placement problem was solved using GA and PSO and implemented in the IEEE 33-bus radial distribution system. The obtained results were compared and analyzed. The results of the simulation show the improvement of the voltage profile and the reduction of losses in the network.

1. Introduction

1.1. Background and Literature Review

The access of developing countries to a variety of new energy sources is essential to their economic developments; new research shows that there is a direct relationship between the level of development of a country and its energy consumption. Given the limited energy reserves in the current world, it is no longer possible to rely solely on existing energy sources. Also, given the increasing need for energy resources and the reduction of fossil fuel resources, the need to keep the environment healthy and reduce greenhouse gas emission is necessary. Besides, due to electricity and fuel supply constraints for remote areas and villages, the need to using renewable energies such as wind, solar, hydrogen, and geothermal energy is needed [1,2].
Global trend and attention to the operation of Renewable Energy (RE) and the positive environmental impacts has required that organizations and centers in many countries be interested in implementing projects in this field. Although these activities are necessary and effective, are these actions carried out according to internationally agreed planning and research, or are these projects passively applied? Obviously, this kind of development process, especially in developing countries, will not be sustainable without a comprehensive and modern program [3,4]. Hence, the development of a comprehensive strategy for better energy efficiency requires a complete understanding of the current situation and the accurate determination of its desirable situation throughout the world. With the development of the use of RE, based on a codified strategy and program, it is expected that many challenges can be identified and appropriate choices made. The most important issues for planning and construction of renewable power plants are:
  • The potential of each of the RE carriers
  • Identification and selection of suitable areas (site-finding)
  • A revised perspective for the future of REs
  • Economic justification according to various factors
  • Planning, mode and capacity of investment, with prioritization of each RE
  • A proper planning to develop technology
  • Capacity and substitution capability
A number of methods and algorithms have been provided in the past for the technical and economic quantification of various renewable generations in power and smart grids; also, several studies analyzed the impact of reducing greenhouse gases on the environment. For instance, in papers [5,6], authors proposed a comprehensive review regarding smart distribution networks. The authors of the paper [7] proposed an integrated method that relies on cleverly cooperation of time rate-based Demand Response Program (DRP) and heterogeneous distributed energy resources (DERs) deployment with an aim to reliability-oriented planning of multiple Micro-Grids (MGs), and reference [8] presented a new robust optimization method for the optimum design of MGs considering reconfigurable topology. In [9], a data center MG including conventional units, energy storage, and renewable generation has been modeled to optimize its electricity bill and carbon footprint. In [10], authors presented a novel risk-based bi-level model for optimal planning of MGs under uncertainty. Additionally, two different risks neutral and risk averse strategies were defined for MGs operators to investigate the impact of risk strategies on the MG planning problem.
In reference [11], an efficient planning algorithm for MGs in remote isolated communities has been presented. Different from the existing research that assumes a specific MG topology, the authors presented a planning algorithm that jointly specifies the optimal grid topology, namely AC, DC, or hybrid AC/DC, along with the optimal locations and sizes of distributed energy resources, energy storage systems, and AC-DC converters; and in reference [12], Mostafa F. Shaaban and et al. proposed an efficient planning algorithm for allocating smart electric vehicle (EV) charging stations in remote communities. The planning problem jointly allocated and sized a set of DGs along with the EV charging stations to balance the supply with the total demand of regular loads and EV charging.
On the other hand, cities currently encounter several considerable concerns, such as increasing safety, facing healthy social interactions, improving energy efficiency, increasing the quality of air, and developing the standard of living for residents. The urge to tackle such concerns depend on the momentum to make cities smarter [13]. Besides, technology affects the way individuals live and work. Research findings and innovation in many areas of digitization, robotics, and Artificial Intelligence (AI) are a few advances which have the potential to reshape urbanization and cities, connect humanity, and increase human capability holistically [14]. Superfast and high-capacity broadband networks like 5G will be able to monitor and automate operations and applications in utilities [13]. In this way, smart technologies can make cities more efficient; for instance, the use of smart grids and smart meters for power and water transmission have reduced waste and increased the transparency and reliability of services. Information and Communication Technology (ICT) connects providers of public services closely with consumers, increases security and safety, and also optimizes efficiency of source usage to generally better people’s lifestyles by smartening cities [15,16]. A typical overview of smart grid in a neighborhood area network is presented in Figure 1.

1.2. Importance and Necessity of the Research

Today, the effects of human intervention in the environment are more than ever evident. The concept of development with respect to environmental protection is synonymous, and in economic indicators, while considering resources such as Gross Domestic Product (GDP), consideration is also given to natural and environmental resources. Energy is a fundamental requirement for the continuation of economic development, the provision of welfare and the upsurge of human life. At present, world energy consumption is about 10 billion tons of crude per year, and it is expected that these figures will increase over the next few years [17,18,19,20]. Hence, the key question is whether these sources of fossil fuels will meet the world’s energy needs for survival, evolution, and development in the coming century. At least for three main reasons, the answer to this question is negative and new energy resources should be replaced by old resources. These are the limitations and, at the same time, the quality of fossil fuels that are logically better than combustion, as well as environmental issues, so that atmospheric preservation is one of the most important prerequisites for sustainable global economic development [17,21,22].
REs are essentially compatible with nature and do not have contamination, and there is no end to them either. Other features of these resources, such as their scattering and spread throughout the world and the need for lower technology, have increased the attractiveness of RE, especially for developing countries. Hence, in international programs and policies, including in the United Nations programs, a special role has been devoted to RE sources in the context of global sustainable development. Given the current human technology, nuclear energy and hydroelectric power are two alternative types of energy instead of fossil fuels. It is noteworthy that the potential of hydroelectricity is limited in the world and, on the other hand, in almost all of Europe, the construction of nuclear power plants has been stopped [17].
Nowadays, new energy is rapidly expanding and penetrating in many parts of the world. Solar, wind, water, biomass, biogas, and geothermal energy are among the most important sources of clean energy. In 1995, a turning point for REs, wind energy was found. In many countries, the existence of suitable climate and sunlight in most areas and in most seasons, as well as the existence of highlands along the water courses, having high potential wind and geothermal power generation facilities has provided the necessary ground for the use and expansion of RE [23]. In this regard, considering the increasing power of engineering in the construction of hydroelectric power plants, the use of hydroelectric potential can be a priority in the construction of new power plants. Also, using wind power, geothermal, and thermal energy from solar purpose are close to economical. Table 1 shows a summary of characteristics of distributed generation sources.

1.3. Optimal Placement of Distributed Generators in Power Distribution Systems

The proper use of DG sources can be an effective way to get rid of some problems, such as high losses, low power quality, and power density. The connection of DG units with their proper location in the network will result in various effects such as increasing network reliability, reducing losses, improving the voltage profile, reducing transmission costs and distributing energy, and improving the power quality parameters and voltage sags. Considering most research focused on allocation of DGs has been more in balanced systems, one of the important issues in DG studies can be the problem of positioning and determining their optimal capacity. The necessity for smart grid electrical systems having minimum technical loss and environmental effects is providing incentive to go for DGs that might offer multiple other advantages including reduced transmission and distribution system resources, better power quality, and increased reliability [38,39].
The significance of this discussion is that with the proper determination of these quantifiers, the cost of generating energy and network losses can be reduced. Recent developments in the field of renewable resource technology, coupled with increased demand and the need for clean and less expensive energy, have led to a growing trend towards distributed generations. The presence of DG units in the power system, if done correctly, will increase system stability, increase reliability, reduce losses, and reduce the final cost of production.

1.4. Motivation and Main Contribution

In this paper, we use a variable-type matrix using an evolutionary algorithm. Variable-type matrix is a changeable matrix; this means that in the first case all bases are PQ (Load Bus), and only the first bus is SLAK. Once the values and location of the DGs are identified and connected to the power grid, the buses are transferred from PQ to PV (Generator Bus); as a result, our matrix can be upgraded permanently. If the DG is placed on either of the buses, that bus switches from mode 1 to mode 2 (since it becomes PV bus). Besides, in this study, we use simultaneous wind and solar DG in the network and also use the PSO algorithm to compare the operation of the genetic algorithm.

1.5. Paper Structure

The rest of the paper is organized as follows: Section 2 gives ways to reduce losses and voltage stability in distribution networks; Section 3 states materials and method for problem formulation, objective function and constraints of the problem; Section 4 provides the results of optimal placement of DGs in our assumed IEEE 33-buss networks test case and discussion of the simulation. Finally, Section 5 concludes the present work for DG optimization for the loss minimization and the voltage profile improvement.

2. Voltage Stability and Reducing Losses in Distribution Networks

2.1. Voltage Stability

In order to analyze the voltage stability for a given state of the system, it should be investigated from two directions: Firstly, the proximity to voltage instability, and secondly, the mechanism of voltage instability. Usually, system dynamics that affect voltage stability are slow; therefore, many aspects of the problem can be effectively analyzed using static methods; these methods examine the capabilities of the equilibrium point represented by a specific point of the power system. Using static analysis methods, we can examine a wide range of system conditions and if they are used properly, they can get a better idea of the nature of the problem, identify the key factors affecting instability. On the other hand, dynamic analysis will be useful for a detailed study of certain situations of voltage collapse, protection coordination and controllers, and other effective measures. Here, in addition to static analysis methods, we also examine dynamic methods.

2.2. Important Benefits of Using Distributed Generatiors in Power Network

2.2.1. Power Supply

Power companies provide peak power in normal network operating conditions, which is considered as “power supply”. Maintaining the network power nominal values, by reducing the amount of load seen from the manufacturer’s view, is one of the advantages of distributed generations in the network services. In other words, electricity production in peak hours consumed by DGs in countries that benefit from multi-rate policies in their electricity grids is cost-effective for consumers and this will reduce network load at peak times; in addition to the owners of DGs, it is also useful for network users who do not use distributed generation.

2.2.2. Reserved Power

The reserved power is similar to the normal capacity supply, with some differences; in this case, distributed generation is used to provide emergency power of the network once one of the network segments is in trouble. In other words, DG’s ability will be able to reduce the number of consumers who are in a state of definite mode and disturb the network from the circuit. Usually, the network’s reserve values are calculated based on the thermal constraints of the power system components and can only be defined for specific periods of time.

2.2.3. Load Flow Analysis

DG usage improves the distribution of load on the network. Research findings confirm that rational implementation of the installation of DG units for the flow has changed, and unbalanced load distribution is dramatically improved [40,41].

2.2.4. Improving Power Quality and Reliability

DG units improve the quality of the power and increase reliability. The IEA has identified trusted power supply as the most important face of the future electricity market for distributed generation. If these units are directly connected to the substation, the power distribution network may also supply the island as a power supply if the power supply is interrupted. In the case of network connection, it can also be exchanged with the electricity company based on the approved rate [42].

2.2.5. Improving Voltage Profile

In the DG connection to distribution networks, if the optimal placement occurs, it will improve the network voltage profile. This issue is of particular importance in large-sized feeders, where the voltage drop is sensible.

2.2.6. Increasing the Life of Equipment

One of the advantages of using DGs in power distribution systems is the reduction of peak-to-peak values in the network. The equipment used in the electrical industry all has a thermal and operational limitation of current and voltage limits. In other words, the performance of the power components in excessive states, which will cause heat problems, will cause their aging and exhaustion.

2.2.7. Reducing Losses

Using of DGs in distribution stations reduces the current rate of lines from large manufacturers to distributed transformers. The losses in transmission lines and other elements of the network are proportional to the squared current, and, as a consequence, using DGs will reduce losses in transmission lines; this effect is evident especially during peak times. Obviously, this loss reduction will also have other benefits that will be effective in sub-services and network costs.

2.2.8. Distributed Generation and Environmental Issues

One of the other topics to be considered in the dispersed production is the lack of greenhouse gas emission. Greenhouse gases are one of the most important factors in global warming and climate change, resulting from the burning of fossil fuels to generate heat. Reducing the use of fossil fuels will sparkly improves the condition of land heating and climate change. In order to solve this problem, the main focus should be on the use of Renewable Energy Sources (RES) of distributed generation.

3. Proposed Tools for DG Allocation to Reduce Losses and Increase Voltage Stability

3.1. Reasons for the Use of Evolutionary Algorithms

Evolutionary algorithms are superior to other optimization algorithms, which have led to widespread use. For example, these algorithms do not require a complete introduction of the problem, and they can work only with a lot of information about the problem definition. Also, there are no restrictions on the function of suitability. As a result of this feature, evolutionary algorithms are said to work well on “void” populations. These populations have a large number of local optimizations. Evolutionary algorithms do not engage in these optimizations and can usually ultimately achieve the optimal response [43]. These algorithms are divided into three general categories:
  • Genetic Algorithms (GA) provided by Holland and studied by Goldberg
  • Evolutionary Strategies (ES) presented by Rechenberg and Schwefel
  • Evolutionary Planning (EP) provided by L.J. Fogel et al. modified by D.B. Fogel
All of the above three methods have proven to be almost optimal with the complex, continuous, and multi-modal problem space. The first and foremost strength of these algorithms is that genetic algorithms are intrinsically parallel. Since GA has several starting points, it can instantly search the problem space in a number of different ways. If one does not succeed, other ways will continue, and they will provide more resources.
One of the strengths of using GAs, which initially seem to be a shortage, are that GAs do not know anything about solving problems, and so-called “blind watchmaker”. They give random variations in their candidate solutions, and then use the fitness function to determine if they have made any progress. Another advantage of using algorithm is that they can change several parameters simultaneously. Many real issues cannot be limited to a feature so that that property is maximized, and they have to be considered multilaterally. GA is very helpful in solving such issues. In fact, the functionality of their parallel operation gives them this property; and one or two solutions may be found for an issue, each of which answers a particular parameter by considering it. The Particle Swarm Optimization algorithm is inspired by the massive accumulation of particles, which is inspired by the collective movement of fish birds, and so on. In the collective movement of each component, it does not have intelligence, but the behavior of the group follows intelligence [44].
Initially, this algorithm was used to discover patterns governing the simultaneous flight of birds and their sudden change of direction and optimal deformation. In PSO, particles are flowing in the search space. The shift of particle in the search space is influenced by the experience and knowledge of themselves and their neighbors; therefore, the other particle mass influences the search for an object. The result of the modeling of this social behavior is the search process that sends particles toward successful regions. Particles learn from each other and based on their knowledge they go to their best neighbors. The PSO is based on the principle that each moment each particle has its place in the search space, according to the best place ever contained in it, and the best place to sit around in its entire neighborhood. The strength of these algorithms is their lack of need for a global control. Each particle (factor) in these algorithms has relative autonomy that can move across the space of the answers; and should work with other particles [45].

3.2. Objective Function Optimizer Algorithm

The most important part of the optimization problem is selecting the optimal target function. This is much more evident when the Objective Function (OF) consists of several parts. In fact, in this research, the goal is to find the optimal voltage profile while at the same time installing DGs at a minimal cost. On the other hand, given that the measurement unit is different from each other, it should be normalized to both types in terms of total losses and the total cost of installing the possible DGs, respectively. This makes the two variables mapped from two spaces with different measurement units to another common area, in which case linear operations can be performed on them. The OF is composed of two weighted components, the first part of which is the ratio of power losses per total generated power, and the second part relates to the ratio of the cost of installing DGs to the total cost of installing all possible DGs on the bus. Additionally, by weighing in either of the two parts, we will be able to determine the importance of each of them; for example, for (w = weighting factor), if the minimizing of losses is more important than the cost spent on installing and operating DGs, w1>w2 should be selected.
But in order to ensure that the convergence of a goal function to the optimal solution is guaranteed, it can be as quick as possible to respond to the optimal response by imposing fines on inappropriate responses. There are different types of penalties that we use to fine the fines here; so that we multiply the response of each cost in a penalty function. The penalty for each response is its inappropriateness, or in other words, it exceeds the limits for the effective parameters in the response, such as current, voltage, and so on. The penalty function is considered as Equation (1).
V = ( α + β × V i o l a t i o n )
where V is the penalty function, α and β are the penalty coefficients and Violation is the rate of rape response from the range of space defined by the constraint. So, by multiplying this function in our main OF, we will achieve our goal. In fact, the weighting coefficients are equal to each of the fines. In other words, the innovative idea that can be used to model optimization problems is to limit the objective function using finite coefficients; applying the penalty coefficients means that the algorithm is diverted from the search for undesirable responses (defined by the problem constraints) and directed towards the target function. To this end, the constraints of the problem are applied to different target weights and, if the algorithm chooses answers on this margin, the cost of the target function is added; another part is also defined as a penalty, which is given by Equation (2).
V i o l a t i o n = α × V L + β × V U + γ × P r e s
where α, β, and γ are the penalty coefficients, VL is low voltage threshold, VU is high voltage threshold, Pres is reserve limitation; these values are often set according to the standard of different networks.

3.3. Problem Modeling without Considering Greenhouse Gas Costs

In this paper, we first study and model the problem without considering the cost of greenhouse gases. The OFs for problem modeling without considering the cost of greenhouse gases are presented in Equations (3) and (4).
C o s t = min { w 1 × i = 1 n | V i V r | V r + w 2 × D G I n s C m S m }
T o t a l C o s t = min { ( w 1 × i = 1 n | V i V r | V r + w 2 × D G I n s C m S m ) + ( α + β × V i o l a t i o n ) }
where Cost and Total Cost define OFs; w1 and w2 are weighting coefficients; Sm is maximum power of buss; DGIns is the number of installed DG unit; Cm is maximum production cost per megawatt for DG; Vi is voltage for i buss; and Vr is nominal voltage.
As can be seen, the OF consists of two basic parts, the first part is related to losses, and the second part concerns the cost of installing of DG unit. On the other hand, due to the fact that the non-homogeneous values of cost, power and voltage can be combined together in a function, it is necessary to normalize the values to their units.

3.4. Problem Modeling Considering the Cost of Greenhouse Gases

In order to model the problem by considering the cost of greenhouse gases, the OFs presented in Equations (5) and (6) are presented.
C o s t = min { w 1 × i = 1 n | V i V r | V r + w 2 × D G I n s C m S m + w 3 × S d S D G S d }
T o t a l C o s t = min { ( w 1 × i = 1 n | V i V r | V r + w 2 × D G I n s C m S m + w 3 × S d S D G S d ) + ( α + β × V i o l a t i o n ) }
where w1, w2, and w3 are weighting; Sm is maximum power of buss; Cm is maximum production cost per megawatt for DG; Vi is voltage for i buss; Vr is nominal voltage; Sd is total power demanded; DGIns is the number of installed DG unit, and SDG is total generated by DG unit. In fact, to determine the OF and to add the cost of greenhouse gas emission to it, we calculated the total power generated by fossil fuel power stations, and therefore, by minimizing it, the cost of greenhouse gas emission will be reduced significantly.
In our assumed study case, for each branch, we consider the current limitation. Also, for each bus, we consider the voltage constraints so that the voltage profile of each bus should be in the range of 0.8 to 1.2 per unit; and any violation of this range will result in penalties in equations. We also set the maximum power and cost of installation for each DG.
Each variable in the optimization algorithm, which represents the particle position, consists of three basic parts:
  • Determining the buses that DGs are installed on; (33 variables per 33 buses);
  • Determining the type of DGs that are assigned on the buses defined in item 1; (33 variables for 33 buses);
  • Determining the working range of each of the DGs installed in item 2; (33 variables for 33 buses);
It should be noted that the results of the simulation for the network with the desired model have been obtained. Therefore, as an application, it is possible to change the network model as n bus type by selecting the most optimal location for the installation of DGs in each power network.

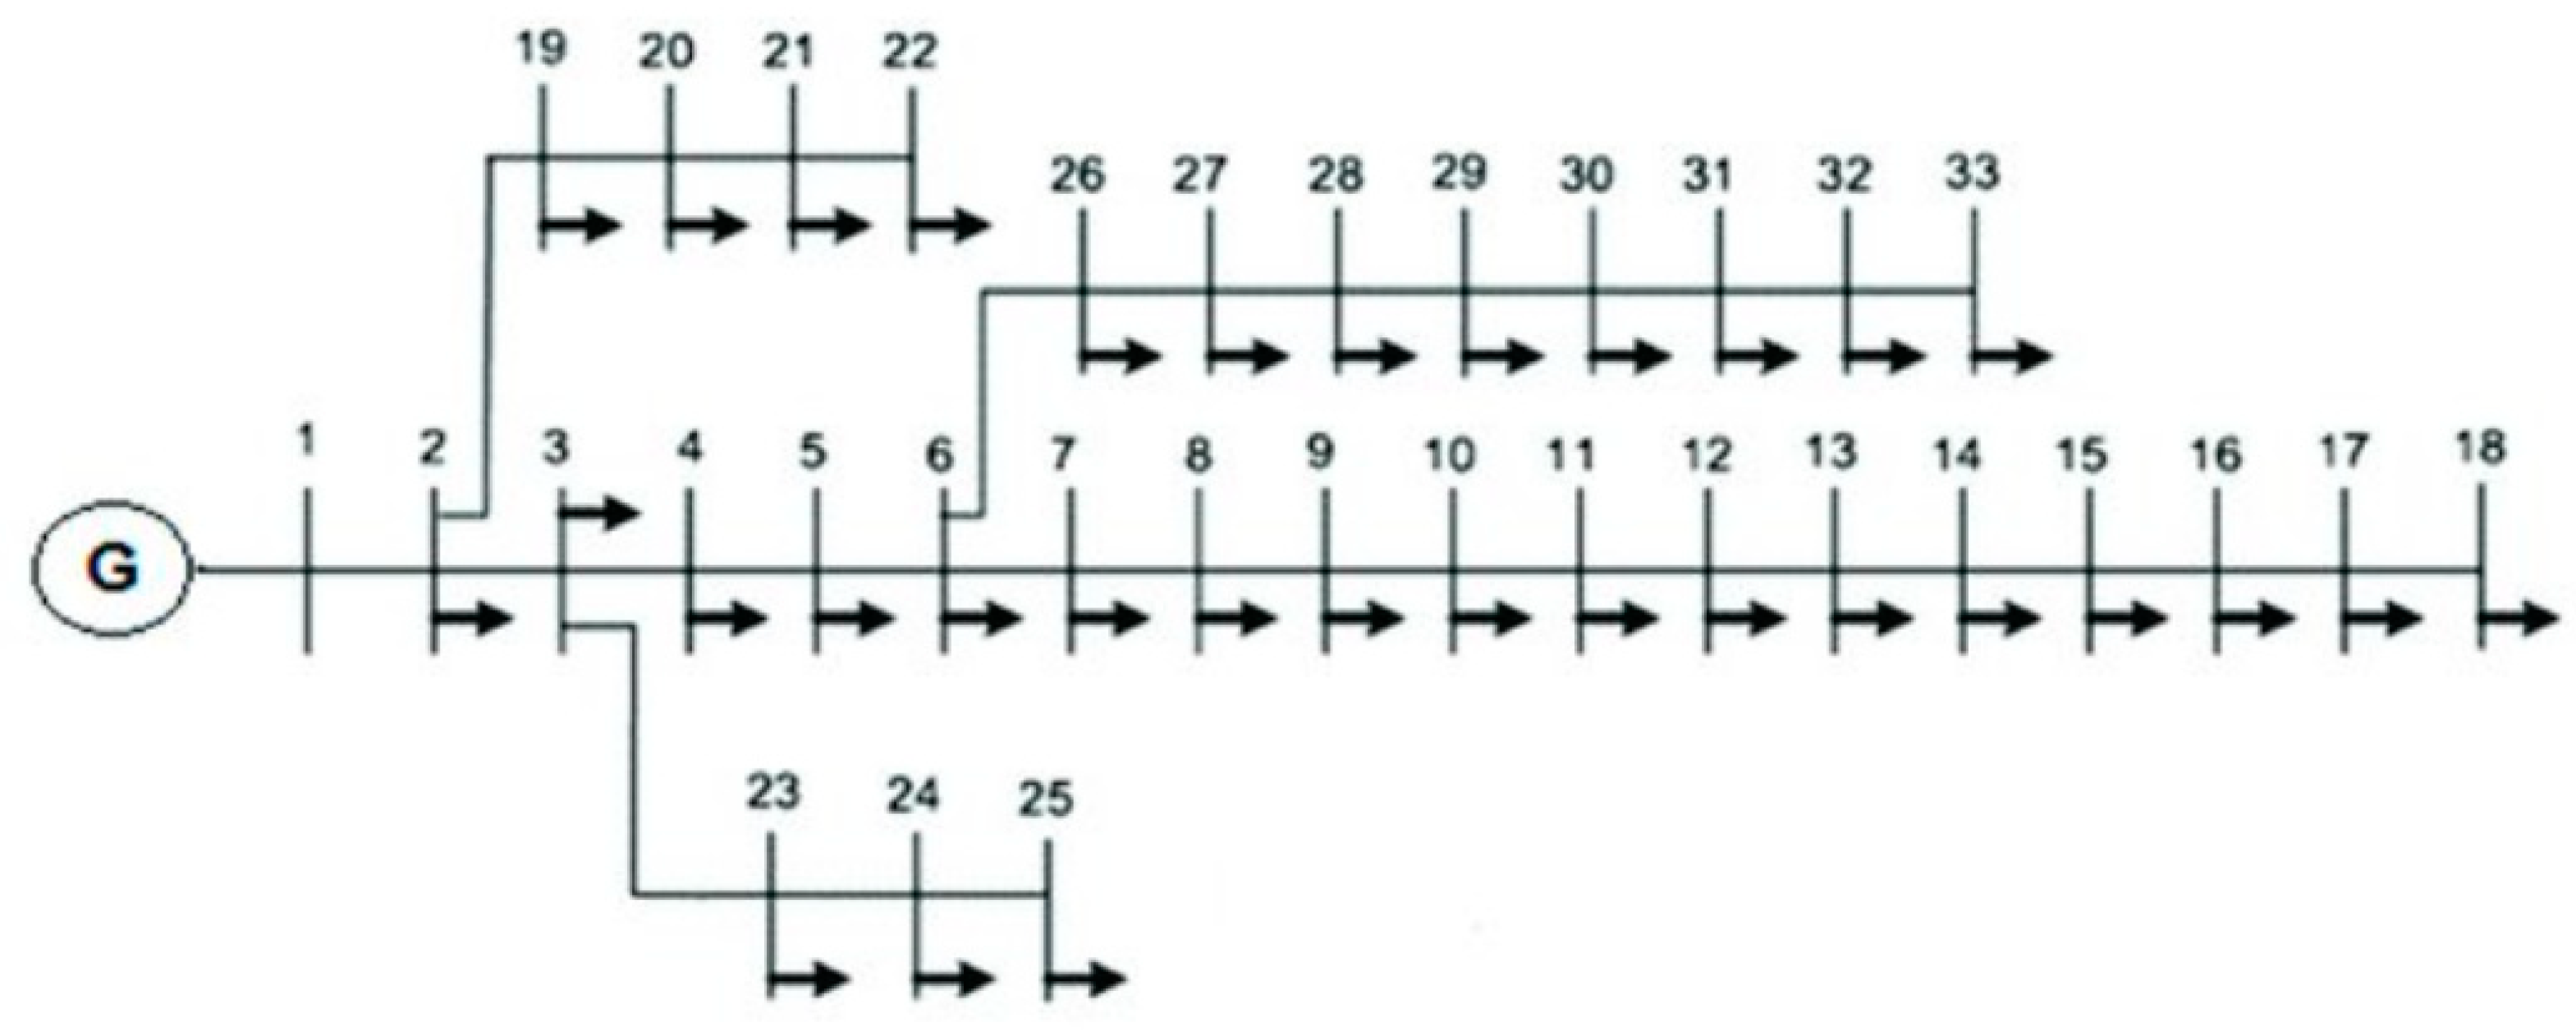
3.5. Optimal Placement of DGs in 33-Bus Network

In order to simulate proposed model in the power network, we need matrixes and vectors that are defined in Matlab to help the evolution algorithm by applying the appropriate objective function to find the optimal response according to the constraints of the issue. According to this, the following steps should be taken to find the best answer in Matlab software:
  • The first step is to create a 33-base model of the IEEE standard with the aid of matrixes;
  • The second step is to create various constraints on the system specification in order to make the model more realistic;
  • Step three is generating random responses and calculate the extent to which responses are violated from the problem space;
  • Step four is applying random answers to the target function and the penalty function to calculate the cost of each response;
  • Step five is comparing responses and find the lowest cost among all the search methods
  • The sixth stage is displaying the output response as to which DG type with a few percent of the maximum power on which bus to use.
In our assumed case study; the corresponding impedance parameters of each network branch are shown in Table 2. Where, the rows represent the branches, and columns respectively represent the number of transmitted buses, the number of received buses, the number of branches linking between the two busses, the ohmic resistance value, and the corresponding inductance of the network.
As can be seen from the Table 2, each of the bus bars (2 to 33) is PQ bus; and bus bar 1 is Slack bus; after the optimal location of the DGs, each bus bar on which the DG is installed will turn into the PV bus bar.

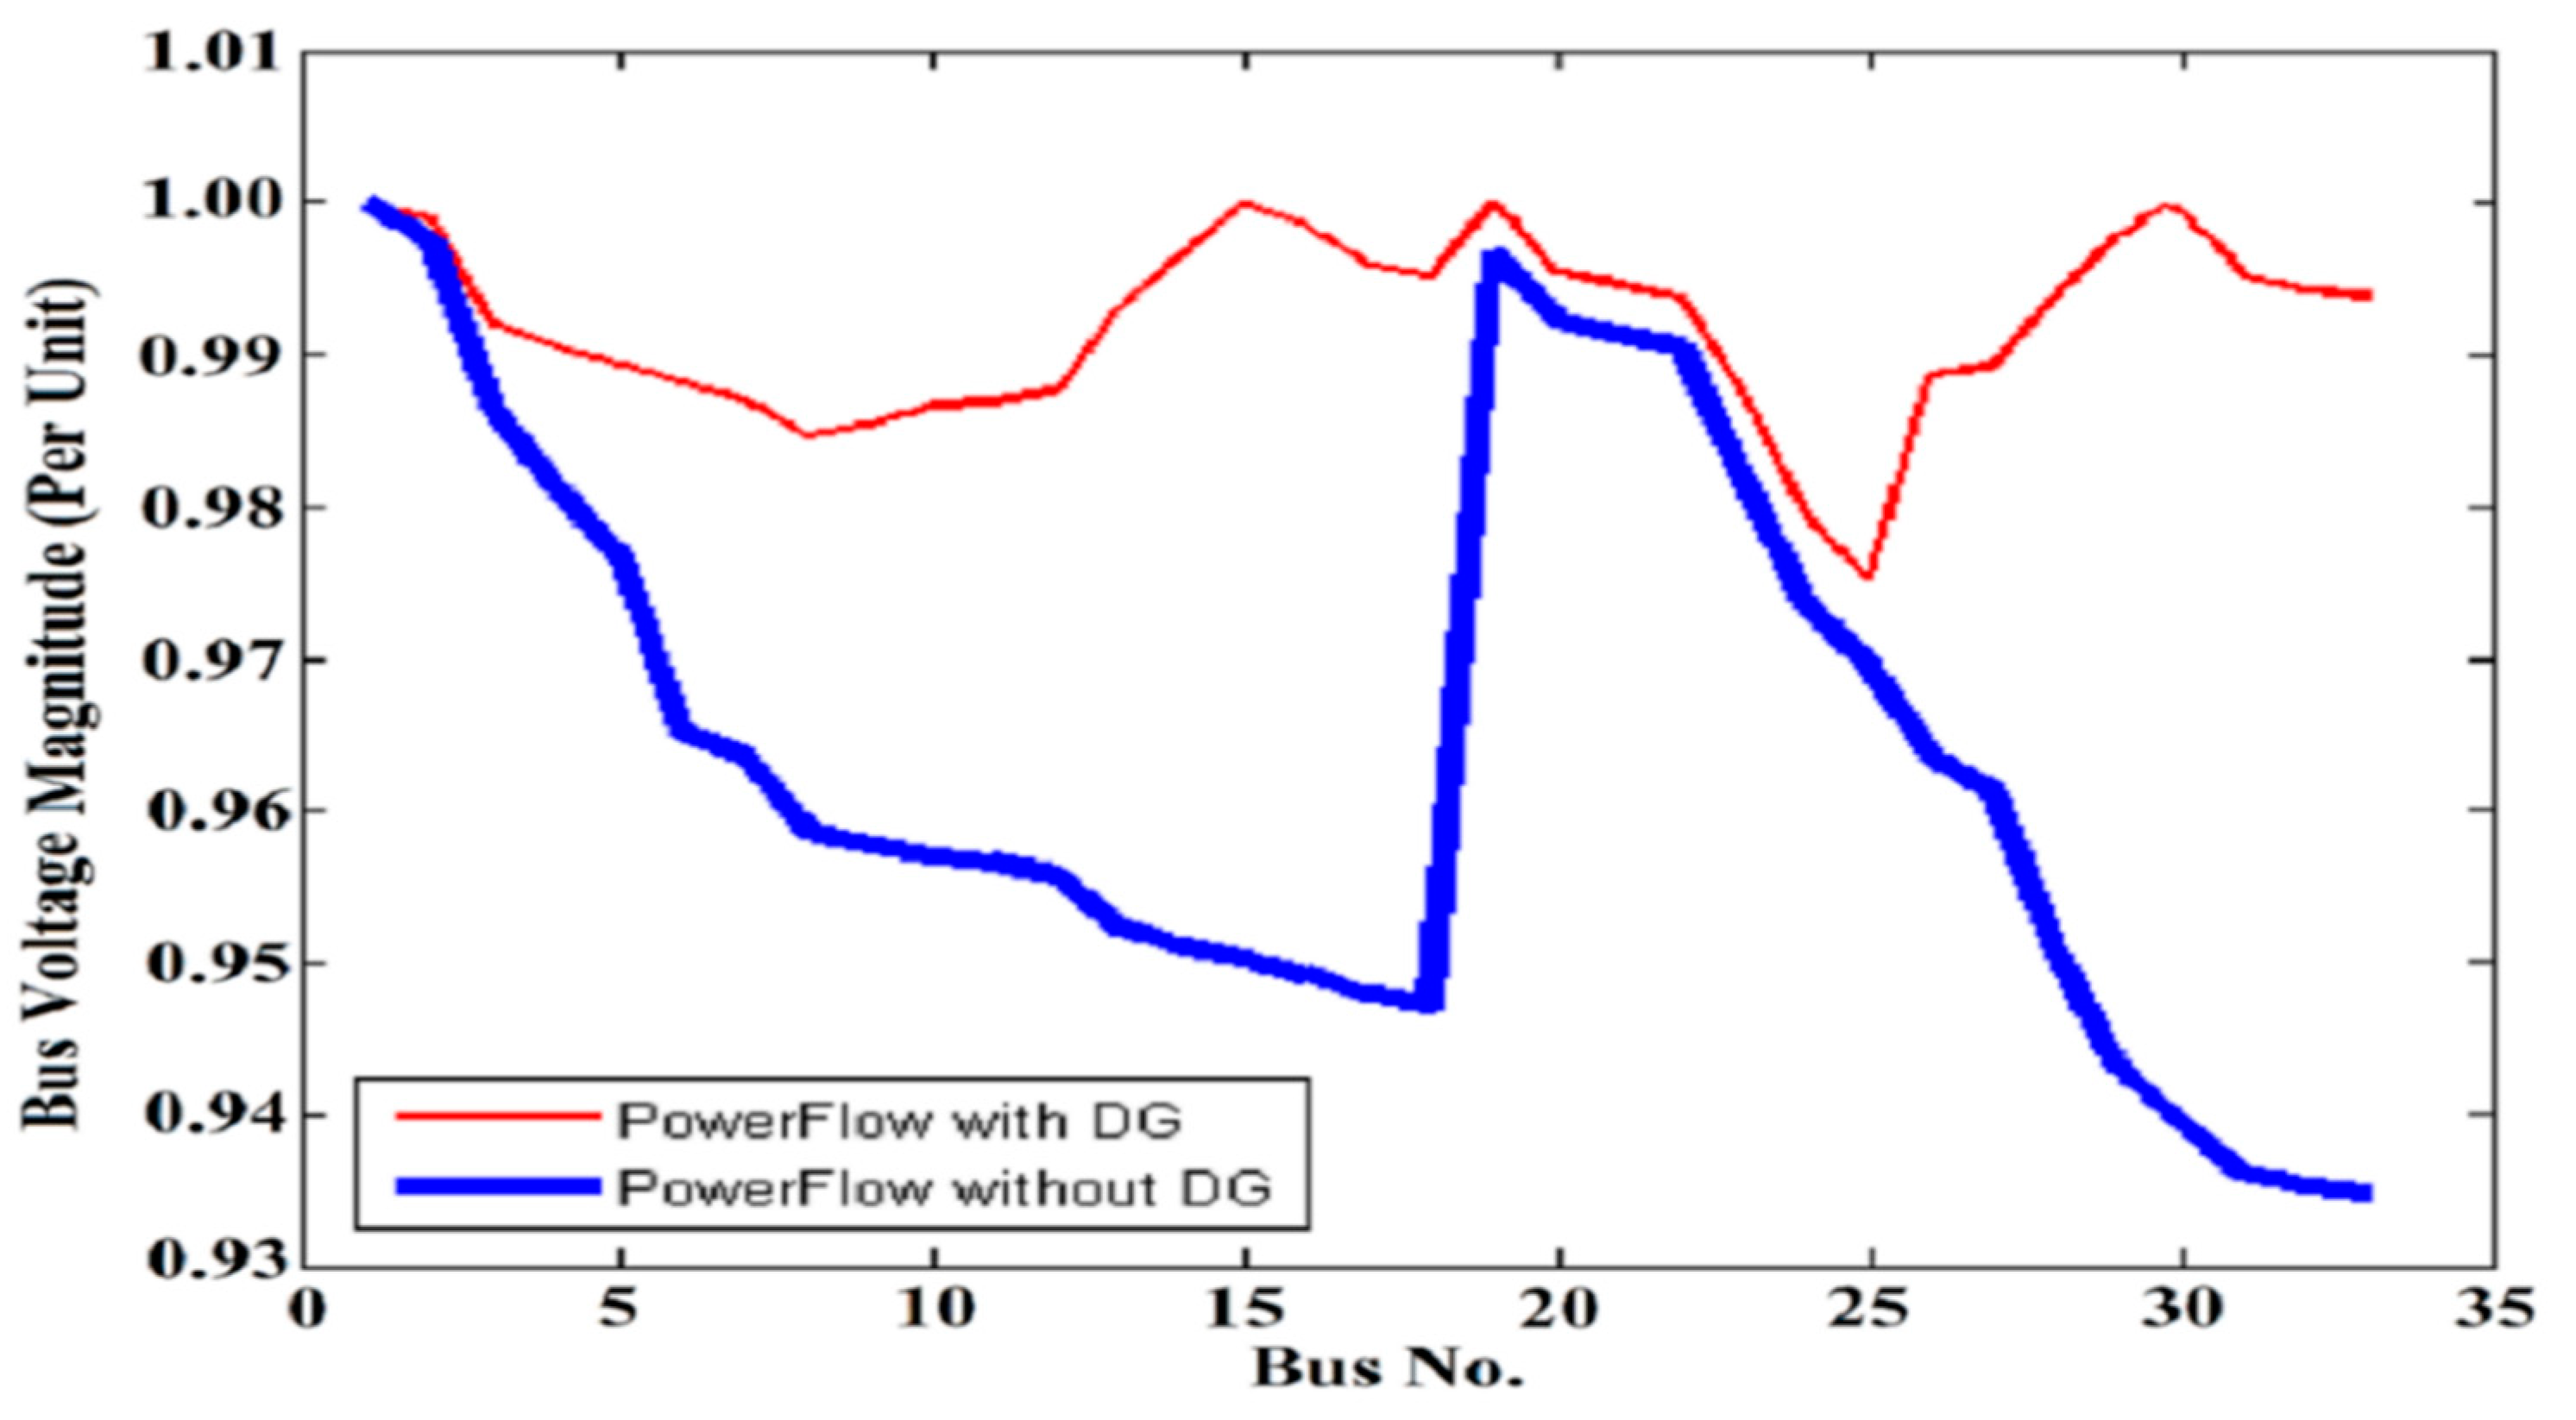
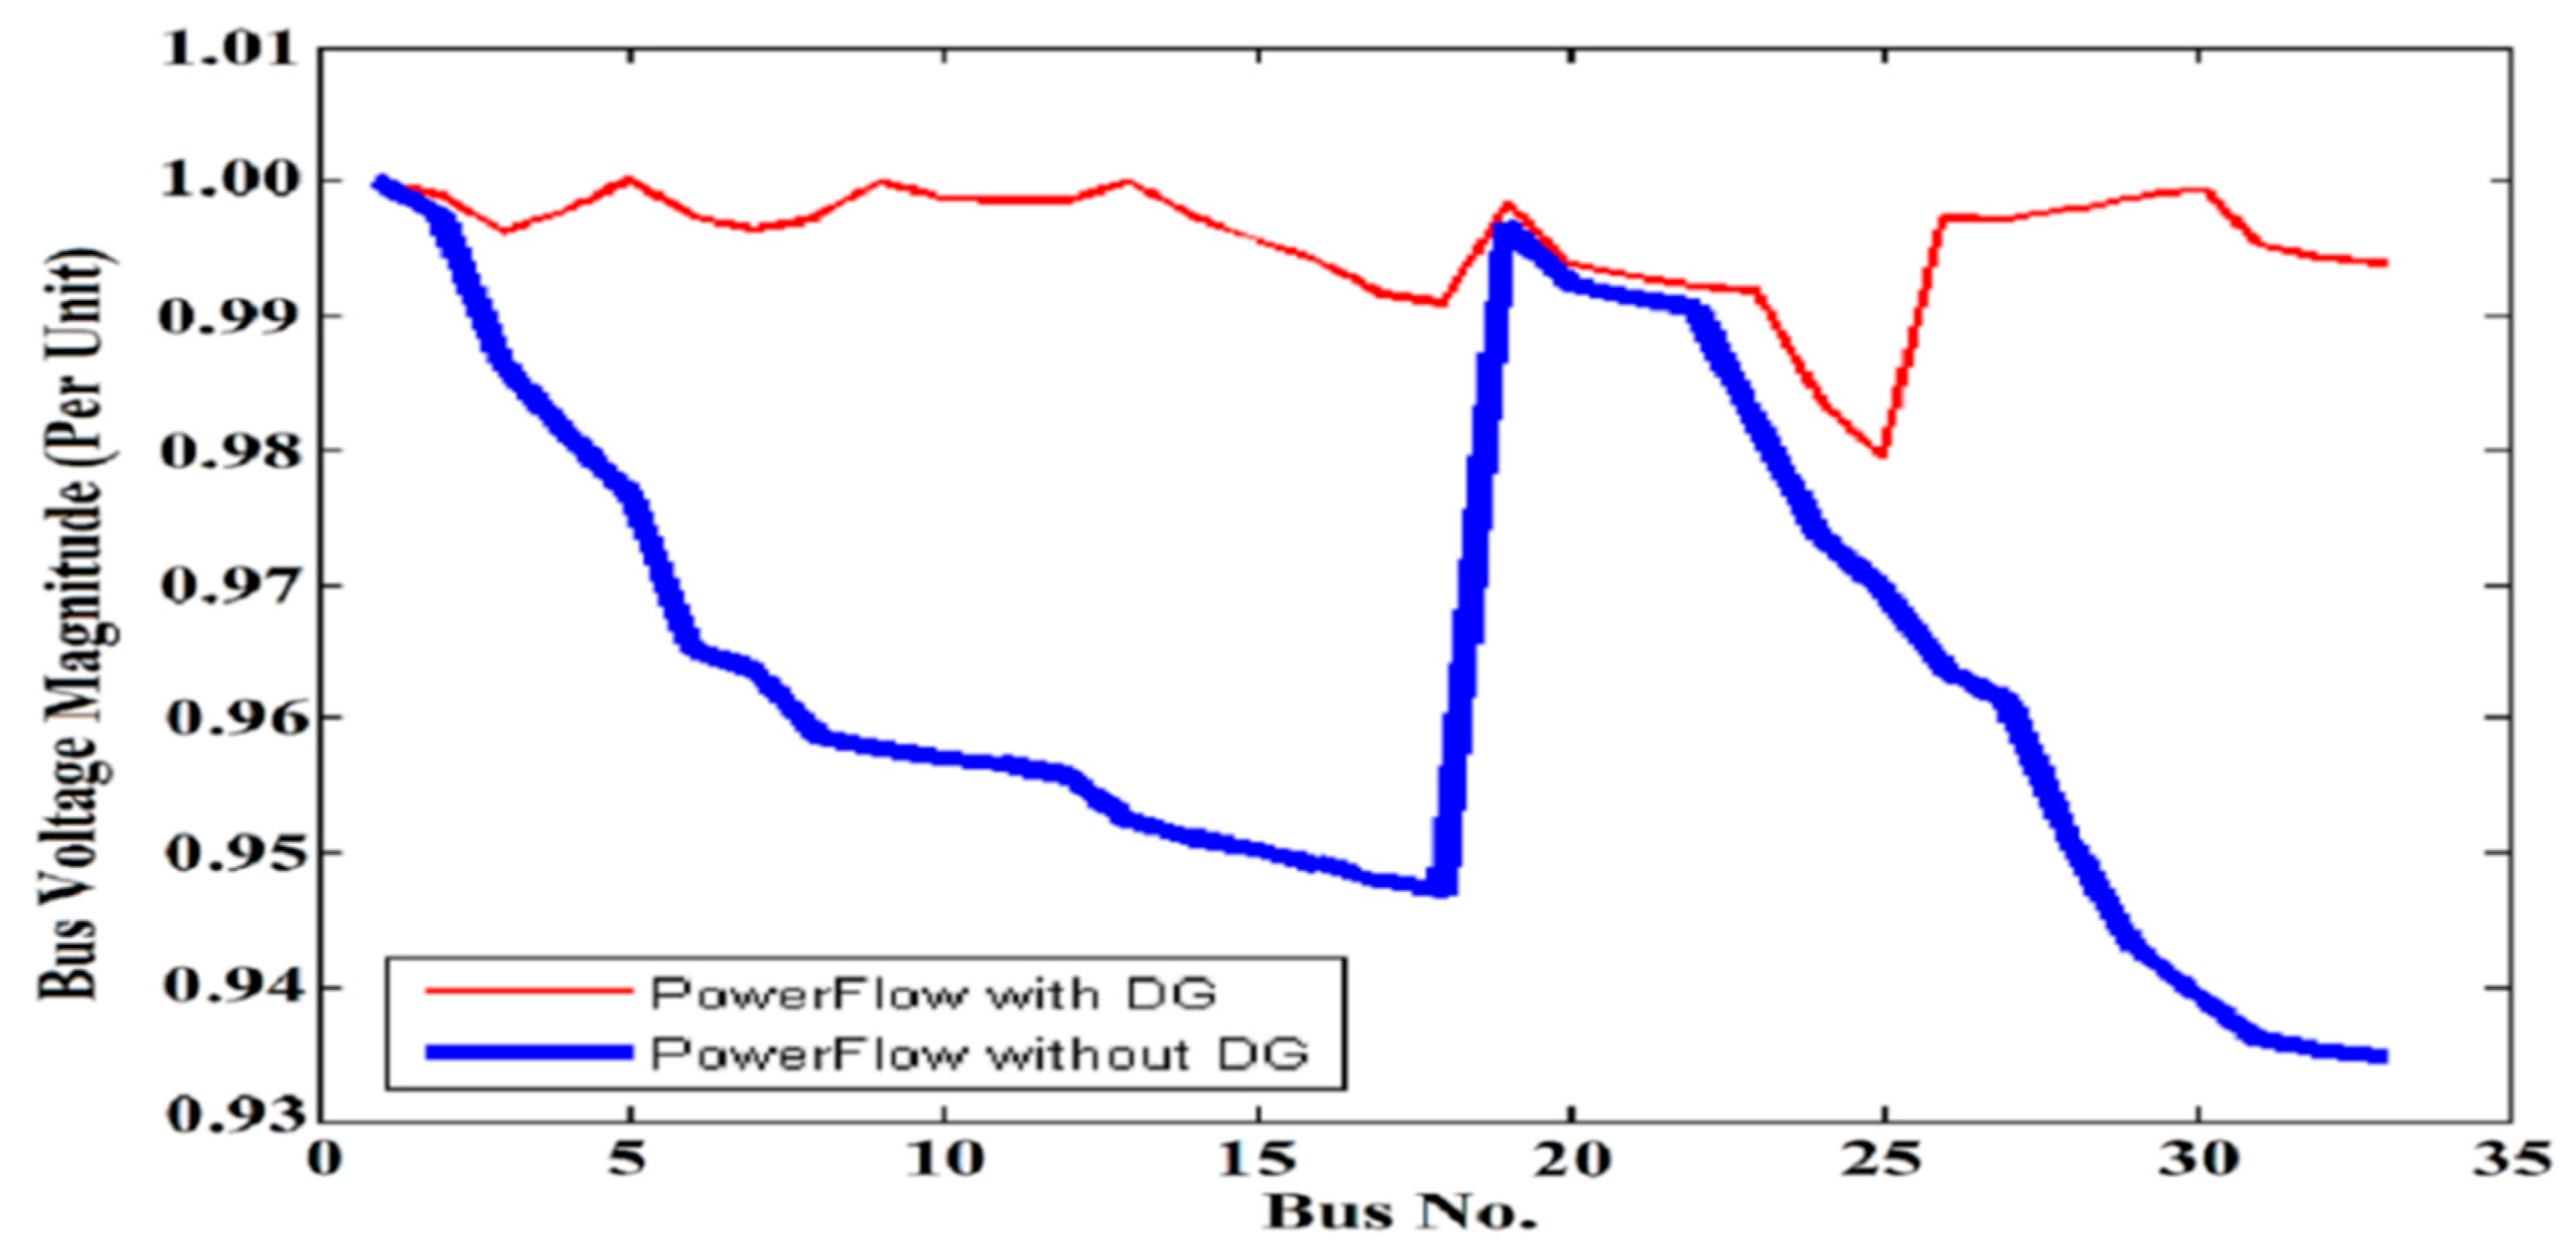
4. Results of Optimal DGs Placement in the IEEE 33-Buss Networks

In order to validate the proposed method, simulation has been performed on the IEEE 33-bus network, the results of which are presented in this Section. Figure 2 depicts the single line diagram of the IEEE 33-bus radial distribution system. Information of the production and consumption power of each bus bar which is used in the case study is given in Table 3. Also, Figure 3 shows the comparison of the voltage profile before and after the installation of DG units without considering the costs of greenhouse gas emission of units using GA. Figure 4 displays the voltage profile before and after the installation of DG units without considering the costs of greenhouse gas emission of units using PSO algorithm.
The results of simulation of the optimal DGs location regardless of greenhouse effects are presented in Table 4; and Table 5 shows the results of optimal location of DG units, considering the cost of greenhouse gas emission of units.
Figure 5 and Figure 6 show the cost function graph of the system (convergence curve of objective function for IEEE 33-bus) without considering the cost of units’ greenhouse gas emission using GA and PSO algorithm, respectively.
By analyzing the results obtained in Table 2, it is clearly seen that because the objective is to reduce the amount of power purchased from fossil units, the power absorbed by the DG units has been increased extensively; accordingly, the cost of purchasing of DG units has also been increased. Besides, by comparing Figure 5 and Figure 6, when the cost of greenhouse gas emission of fossil fuels is taken into account, the optimal final cost is a little higher than this limitation is not considered. In this situation, since the algorithm seeks answers to get closer to the answer of practical problem, therefore, the final cost should increase slightly. Figure 7 shows the voltage profile before and after optimal installation of DG units with considering the cost of greenhouse gas emission of units using GA; and Figure 8 displays the voltage profile before and after installation of DG units with considering the cost of greenhouse gas emission of units using PSO algorithm. And finally, Figure 9 and Figure 10 show the cost function graph of the system with considering the cost of units’ greenhouse gas emission using GA and PSO algorithm, respectively.
By comparing Figure 7 and Figure 8, it is clearly seen that in the absence of a greenhouse gas emission’s cost for fossil fuels, the voltage profile will be smoother. In other words, the cost of loss of power will be lower; however, with considering this constraint, the inequality of the voltage profile is much higher. GA has behaved similarly in the problem of optimal placement of DG units in a distributed network in both cases, with and without the cost of greenhouse gas emissions from fossil units, and has been able to search for the optimal response to the problem. Meanwhile, this algorithm is inherently similar to the behavior of the PSO algorithm. However, a comparison between the behaviors of these two algorithms are presented in Figure 7 and Figure 8, which clearly represents a comparison between the behavior and the final value optimized by the two algorithms; here, the comparison shows that the GA is more efficient than the PSO algorithm, and these results in less processing for simulation.

5. Conclusions

One of the most important part of an optimization problem would be finding the optimal OF; this is more evident when the OF is composed of several parts. Researchers in all domains, in addition to ideas for solving a problem, are always looking for an optimal method to find the best answers, In the field of power systems, because of the high level of risk, researchers and network designers are looking for the most optimal response, and that’s because of the configuration of power grids, even at very small dimensions, which are not optimally designed, the service provider will suffer from irreparable losses.
One of the most important and perhaps most up-to-date discussions of power systems is adding or using DG sources adapted to the original power system. Owing to the random nature of distributed generation systems, designers have always been wary of using such sources in power systems.
For this reason, in this paper, we aimed to provide an optimal method by considering a modeling power system, and applying one of the most powerful evolutionary meta-analysis algorithms to solve the problem of proper load distribution in order to have the lowest losses in the presence of DG sources. In fact, the goal in this research is to find the optimal voltage profile and simultaneously minimize the cost of installing DGs. In this regard, GA and PSO algorithms were used to solve the problem in two states: With, and without taking into account the effects of greenhouse gases. After providing the proposed method for optimal DG placement, the simulation was carried out using the MATLAB program, and the placement problem was solved using GA and PSO and implemented in the IEEE 33-bus radial distribution system. The results were compared and the advantages and disadvantages were presented. Therefore, we found the optimal places to install DGs in the network. The results of the simulation confirmed the improvement of the voltage profile and the reduction of losses in the network.
As a proposed work for the future, this optimization can be implemented for a real power grid to actually compare the results with theoretical values, because in practice there are other parameters involved in the optimization problem, which are neglected here. Besides, we can consider the dynamic problems of DGs. With a variable considering the power of DG resources, optimization can be done dynamically at the same moment, and the percentage of power input from any DG source will be instantly determined.

Author Contributions

The present article is addressed by M.F. and M.G., each of whom being responsible for various aspects of the work, specifically for conceptualization, formal analysis, investigation & writing.

Funding

This research received no external funding.

Conflicts of Interest

The authors declare no conflict of interest.

References

  1. Gazijahani, F.S.; Ravadanegh, S.N.; Salehi, J. Stochastic multi-objective model for optimal energy exchange optimization of networked microgrids with presence of renewable generation under risk-based strategies. ISA Trans. 2018, 73, 100–111. [Google Scholar] [CrossRef]
  2. Yazdi, S.S.H.; Milimonfared, J.; Rouzbehi, K. Incorporation of synchronous power controlled energy storage system in wind farms to provide inertial and primary frequency support. In Proceedings of the Iranian Conference on Electrical Engineering (ICEE), Mashhad, Iran, 8–10 May 2018; pp. 1379–1384. [Google Scholar]
  3. Ghiasi, M. Detailed study, multi-objective optimization, and design of an AC-DC smart microgrid with hybrid renewable energy resources. Energy 2019, 169, 496–507. [Google Scholar] [CrossRef]
  4. Javadi, M.S.; Razavi, S.-E.; Ahmadi, A.; Siano, P. A novel approach for distant wind farm interconnection: Iran South-West wind farms integration. Renew. Energy 2019, 140, 737–750. [Google Scholar] [CrossRef]
  5. Pourbehzadi, M.; Niknam, T.; Aghaei, J.; Mokryani, G.; Shafie-khah, M.; Catalão, J.P.S. Optimal operation of hybrid AC/DC microgrids under uncertainty of renewable energy resources: A comprehensive review. Int. J. Electr. Power Energy Syst. 2019, 109, 139–159. [Google Scholar] [CrossRef]
  6. Pirouzi, S.; Aghaei, J.; Vahidinasab, V.; Niknam, T.; Khodaei, A. Robust linear architecture for active/reactive power scheduling of EV integrated smart distribution networks. Electr. Power Syst. Res. 2018, 155, 8–20. [Google Scholar] [CrossRef]
  7. Gazijahani, F.S.; Salehi, J. Reliability constrained two-stage optimization of multiple renewable-based microgrids incorporating critical energy peak pricing demand response program using robust optimization approach. Energy 2018, 161, 999–1015. [Google Scholar] [CrossRef]
  8. Gazijahani, F.S.; Salehi, J. Robust design of microgrids with reconfigurable topology under severe uncertainty. IEEE Trans. Sustain. Energy 2018, 9, 559–569. [Google Scholar] [CrossRef]
  9. Ding, Z.; Xie, L.; Lu, Y.; Wang, P.; Xia, S. Emission-aware stochastic resource planning scheme for data center microgrid considering batch workload scheduling and risk management. IEEE Trans. Ind. Appl. 2018, 54, 5599–5608. [Google Scholar] [CrossRef]
  10. Gazijahani, F.S.; Salehi, J. Optimal bilevel model for stochastic risk-based planning of microgrids under uncertainty. IEEE Trans. Ind. Inf. 2018, 14, 3054–3064. [Google Scholar] [CrossRef]
  11. Mohamed, S.; Shaaban, M.F.; Ismail, M.; Serpedin, E.; Qaraqe, K.A. An efficient planning algorithm for hybrid remote microgrids. IEEE Trans. Sustain. Energy 2019, 10, 257–267. [Google Scholar] [CrossRef]
  12. Shaaban, M.F.; Mohamed, S.; Ismail, M.; Qaraqe, K.; Serpedin, E. Joint planning of smart EV charging stations and DGs in Eco-friendly remote hybrid microgrids. IEEE Trans. Smart Grid 2019. [Google Scholar] [CrossRef]
  13. Bolívar, R. Smart Technologies for Building Smart Cities; A Synthesis of the Contributions; Smart Technologies for Smart Governments; Springer International Publishing: Berlin/Heidelberg, Germany, 2018. [Google Scholar]
  14. David, N.; McNutt, J.G.; Justice, J.B. Smart cities, transparency, civic technology and reinventing government. In Smart Technologies for Smart Governments; Springer: Berlin/Heidelberg, Germany, 2018; pp. 19–34. [Google Scholar]
  15. Al-Thani, S.; Skelhorn, C.; Amato, A.; Koc, M.; Al-Ghamdi, S. Smart technology impact on neighborhood form for a sustainable Doha. Sustainability 2018, 10, 4764. [Google Scholar] [CrossRef]
  16. Amini, M.H.; Arasteh, H.; Siano, P. Sustainable Smart cities through the lens of complex interdependent infrastructures: Panorama and state-of-the-art. In Sustainable Interdependent Networks II: From Smart Power Grids to Intelligent Transportation Networks; Amini, M.H., Boroojeni, K.G., Iyengar, S.S., Pardalos, P.M., Blaabjerg, F., Madni, A.M., Eds.; Springer International Publishing: Cham, Switzerland, 2019; pp. 45–68. [Google Scholar]
  17. Kashem, M.; Le, A.D.; Negnevitsky, M.; Ledwich, G. Distributed generation for minimization of power losses in distribution systems. In Proceedings of the 2006 IEEE Power Engineering Society General Meeting, Montreal, QC, Canada, 18–22 June 2006; p. 8. [Google Scholar]
  18. Farmad, H.S.; Mozayyani, M.R. Power quality customer financial impact/risk assessment tool. In Proceedings of the 22nd International Conference and Exhibition on Electricity Distribution (CIRED 2013), Stockholm, Sweden, 10–13 June 2013. [Google Scholar]
  19. Villarreal, S.; Jimenez, J.A.; Jin, T.; Cabrera-Rios, M. Designing a sustainable and distributed generation system for semiconductor wafer fabs. IEEE Trans. Autom. Sci. Eng. 2013, 10, 16–26. [Google Scholar] [CrossRef]
  20. Muttaqi, K.M.; Le, A.D.; Negnevitsky, M.; Ledwich, G. An algebraic approach for determination of DG parameters to support voltage profiles in radial distribution networks. IEEE Trans. Smart Grid 2014, 5, 1351–1360. [Google Scholar] [CrossRef]
  21. Antony, N.R.; Baby, S. Optimal DG placement considering voltage stability enhancement using PSO. In Proceedings of the 2013 International Conference on Control Communication and Computing (ICCC), Thiruvananthapuram, India, 13–15 December 2013; pp. 394–399. [Google Scholar]
  22. Mollah, M.B.; Chowdhury, C. Comparative study of biogas generation from different sources in Bangladesh. In Proceedings of the 2nd International Conference on the Developments in Renewable Energy Technology (ICDRET 2012), Dhaka, Bangladesh, 5–7 January 2012; pp. 1–5. [Google Scholar]
  23. Hedayati, H.; Nabaviniaki, S.A.; Akbarimajd, A. A method for placement of DG units in distribution networks. IEEE Trans. Power Deliv. 2008, 23, 1620–1628. [Google Scholar] [CrossRef]
  24. Ghazvini, A.M.; Olamaei, J. Optimal sizing of autonomous hybrid PV system with considerations for V2G parking lot as controllable load based on a heuristic optimization algorithm. Sol. Energy 2019, 184, 30–39. [Google Scholar] [CrossRef]
  25. Abedinia, O.; Amjady, N.; Ghadimi, N. Solar energy forecasting based on hybrid neural network and improved metaheuristic algorithm. Comput. Intell. 2018, 34, 241–260. [Google Scholar] [CrossRef]
  26. Bagheri, M.; Nurmanova, V.; Abedinia, O.; Naderi, M.S.; Ghadimi, N.; Naderi, M.S. Renewable energy sources and battery forecasting effects in smart power system performance. Energies 2019, 12, 373. [Google Scholar] [CrossRef]
  27. Ghiasi, M.; Ahmadinia, E.; Lariche, M.; Zarrabi, H.; Simoes, R. A new spinning reserve requirement prediction with hybrid model. Smart Sci. 2018, 6, 212–221. [Google Scholar] [CrossRef]
  28. Khayatian, A.; Barati, M.; Lim, G.J. Integrated microgrid expansion planning in electricity market with uncertainty. IEEE Trans. Power Syst. 2018, 33, 3634–3643. [Google Scholar] [CrossRef]
  29. Davarikia, H.; Barati, M. A tri-level programming model for attack-resilient control of power grids. J. Mod. Power Syst. Clean Energy 2018, 6, 918–929. [Google Scholar] [CrossRef] [Green Version]
  30. Zhou, Y.; Arghandeh, R.; Zou, H.; Spanos, C.J. Nonparametric event detection in multiple time series for power distribution networks. IEEE Trans. Ind. Electr. 2019, 66, 1619–1628. [Google Scholar] [CrossRef]
  31. Senemar, S.; Seifi, A.R.; Rastegar, M.; Parvania, M. Probabilistic optimal dynamic planning of onsite solar generation for residential energy hubs. IEEE Syst. J. 2019. [Google Scholar] [CrossRef]
  32. Nikoobakht, A.; Aghaei, J.; Khatami, R.; Mahboubi-Moghaddam, E.; Parvania, M. Stochastic flexible transmission operation for coordinated integration of plug-in electric vehicles and renewable energy sources. Appl. Energy 2019, 238, 225–238. [Google Scholar] [CrossRef]
  33. Bahrami, S.; Amini, M.H.; Shafie-Khah, M.; Catalão, J.P.S. A decentralized renewable generation management and demand response in power distribution networks. IEEE Trans. Sustain. Energy 2018, 9, 1783–1797. [Google Scholar] [CrossRef]
  34. Gandoman, F.H.; Ahmadi, A.; Sharaf, A.M.; Siano, P.; Pou, J.; Hredzak, B.; Agelidis, V.G. Review of FACTS technologies and applications for power quality in smart grids with renewable energy systems. Renew. Sustain. Energy Rev. 2018, 82, 502–514. [Google Scholar] [CrossRef]
  35. Mehrdad, S.; Mousavian, S.; Madraki, G.; Dvorkin, Y. Cyber-physical resilience of electrical power systems against malicious attacks: A review. Curr. Sustain./Renew. Energy Rep. 2018, 5, 14–22. [Google Scholar] [CrossRef]
  36. Mehrasa, M.; Pouresmaeil, E.; Sepehr, A.; Pournazarian, B.; Catalão, J.P.S. Control of power electronics-based synchronous generator for the integration of renewable energies into the power grid. Int. J. Electr. Power Energy Syst. 2019, 111, 300–314. [Google Scholar] [CrossRef]
  37. Mehrjerdi, H.; Rakhshani, E. Vehicle-to-grid technology for cost reduction and uncertainty management integrated with solar power. J. Clean. Prod. 2019, 229, 463–469. [Google Scholar] [CrossRef]
  38. Singh, S.N. Distributed generation in power systems: An overview and key issues. In Proceedings of the 24th Indian Engineering Congress, Surathkal, India, 10–13 December 2009. [Google Scholar]
  39. Ghiasi, M. Technical and economic evaluation of power quality performance using FACTS devices considering renewable generations. Renew. Energy Focus 2019, 29, 49–62. [Google Scholar] [CrossRef]
  40. Ghiasi, M. A comparative study on common power flow techniques in the power distribution system of the Tehran metro. Tehnički Glasnik 2018, 12, 244–250. [Google Scholar] [CrossRef]
  41. Ghiasi, M. A detailed study for load flow analysis in distributed power system. Int. J. Ind. Electr. Control Optim. 2018, 1, 159–160. [Google Scholar]
  42. Ghiasi, M.; Ghadimi, N.; Ahmadinia, E. An analytical methodology for reliability assessment and failure analysis in distributed power system. SN Appl. Sci. 2018, 1, 44. [Google Scholar] [CrossRef] [Green Version]
  43. Nasrolahpour, E.; Ghasemi, H.; Monsef, H.; Khoub, E. DG placement considering voltage sag and losses. In Proceedings of the 2012 11th International Conference on Environment and Electrical Engineering, Venice, Italy, 18–25 May 2012; pp. 909–913. [Google Scholar]
  44. Ghiasi, M.; Olamaei, J. Optimal capacitor placement to minimizing cost and power loss in Tehran metro power distribution system using ETAP (A case study). Complexity 2016, 21, 483–493. [Google Scholar] [CrossRef]
  45. Lopes, J.P. Integration of dispersed generation on distribution networks-impact studies. In Proceedings of the 2002 IEEE Power Engineering Society Winter Meeting. Conference Proceedings (Cat. No. 02CH37309), New York, NY, USA, 27–31 January 2002; pp. 323–328. [Google Scholar]
Figure 1. A typical overview of smart grid in a neighborhood area network.
Smartcities 02 00020 g001
Figure 2. Single line diagram of the IEEE 33-bus radial distribution system.
Smartcities 02 00020 g002
Figure 3. Voltage profile before and after DG installation using the Genetic algorithm (GA) without considering gas emission costs.
Smartcities 02 00020 g003
Figure 4. Voltage profile before and after DG installation using Particle Swarm Optimization (PSO) without considering gas emission costs.
Smartcities 02 00020 g004
Figure 5. Cost function graph without considering the cost of units’ gas emission using GA.
Smartcities 02 00020 g005
Figure 6. Cost function diagram without considering the cost of the units’ gas emission using PSO algorithm.
Smartcities 02 00020 g006
Figure 7. Voltage profile before and after optimal DGs placement with considering gas emission cost using GA.
Smartcities 02 00020 g007
Figure 8. Voltage profile before and after optimal DGs placement with considering gas emission cost using PSO.
Smartcities 02 00020 g008
Figure 9. Cost function diagram with considering the cost of the units’ gas emission using PSO algorithm.
Smartcities 02 00020 g009
Figure 10. Cost function diagram with considering the cost of the units’ gas emission using PSO algorithm.
Smartcities 02 00020 g010
Table 1. Summarized characteristics of Distributed Generations (DGs) [24,25,26,27,28,29,30,31,32,33,34,35,36,37].
Power Plant TypeHydroelectricSeaBiomassGeothermalWindSolar
Characteristics
Amount, Distribution, Variation, IntensityHigh worldwide, seasonal, medium to lowVery high in coastal, seasonal, tidal, lowVery high worldwide, weather dependent, medium to lowMedium, cross-plate, up to 600 degrees, low averageHigh In coastal and mountainous shores, very variable, low averageExtremely high worldwide, daily, seasonal, low pick
Technology; OptionsDams and turbines with different altitudeLow temperature thermodynamic cycles, mechanical wave oscillators, tidal damsBurning, fermenting, digestion, gas production, liquidationSteam and double thermodynamic cycles, total current turbines, ground pressure, lavaHorizontal and vertical wind turbines, wind pumps, sail powerThermal systems with low to high temperature, PVs, inactive systems, biological transformation
Current StatusOften commercialIn developmentSome commercial, some in developmentMany commercial, some in developmentMany commercial, some in developmentIn development, some commercial
Coefficient, CapacityDiscontinued to base loadDiscontinued to base loadBased on the need for short-term storageHigh, basic loadVariable, 30–15%No storage less than 25%, medium
Ways of ProgressionTurbine, cost, design, informationTechnologically, materials, cost per sourceTechnologically, agricultural management and forestryExploration, extraction, use of hot stonesMaterial, layout, installation location, information about the sourceMaterial, cost, efficiency, information about the source
Specifications: Environmental CharacteristicsVery clean, effect on local aquatic environment, use of the earthVery clean, effect on local aquatic environment, effect on landscapeClean, effects on animals and other poisonous waste plantsClean, soluble gases, water and salt consumptionVery clean, affecting the visibility, noise, the mortality of the birdsVery clean, affecting the landscape and local air, producing Photovoltaic (PV) modules
Table 2. Resistance and linking information regarding assumed case study (IEEE 33-bus).
Number of Transmitted BusesNumber of Received BusesNumber of Transmission LinesOhmic ResistanceInductive Resistance
1210.09920.0447
2310.4930.2511
3410.3660.1864
4510.38110.1941
5610.8190.707
6710.18720.6188
7811.71141.2351
8911.030.74
91011.040.74
101110.19660.065
111210.37440.1238
121311.4681.155
131410.54160.7129
141510.5910.526
151610.74630.545
161711.2891.721
171810.7320.574
181910.1640.1565
192011.50421.3554
202110.40950.4784
212210.70890.9373
222310.45120.3083
232410.8980.7091
242510.8960.7011
252610.2030.1034
262710.28420.1447
272811.0590.9337
282910.80420.7006
293010.50750.2585
303110.97440.963
313210.31050.3619
323310.3410.5302
Table 3. Information of the production and consumption power of each bus bar.
Number of Buses1234567891011
P3.80.10.090.120.060.060.20.20.060.060.045
Q2.40.060.040.080.030.020.10.020.020.030.03
Number of Buses1213141516171819202122
P0.060.060.120.060.060.060.090.090.090.090.09
Q0.0350.0350.080.010.020.020.040.040.040.040.04
Number of Buses2324252627282930313233
P0.090.420.420.060.060.060.120.20.150.210.06
Q0.050.20.20.0250.0250.020.070.60.070.10.04
Table 4. Results of the simulation of the optimal DGs location regardless of greenhouse effects.
Bus Number of DGType of DGInstalled Capacity (MVA)
5PV1.12
13Wind1.54
15Win7.62
Table 5. Results of the optimal DGs location considering the cost of gas emission of units.
Bus Number of DGType of DGInstalled Capacity (MVA)
5PV6.173
13PV6.204
19PV6.192
30Wind6.204

