1. Introduction
The approach of managing waste is a problem across the globe and often overlooked. Even the rate of garbage production is increasing at an alarming rate in both the developed and underdeveloped countries. The situation gets worse in urban areas than that of rural areas. Different statistics prove this statement, such as
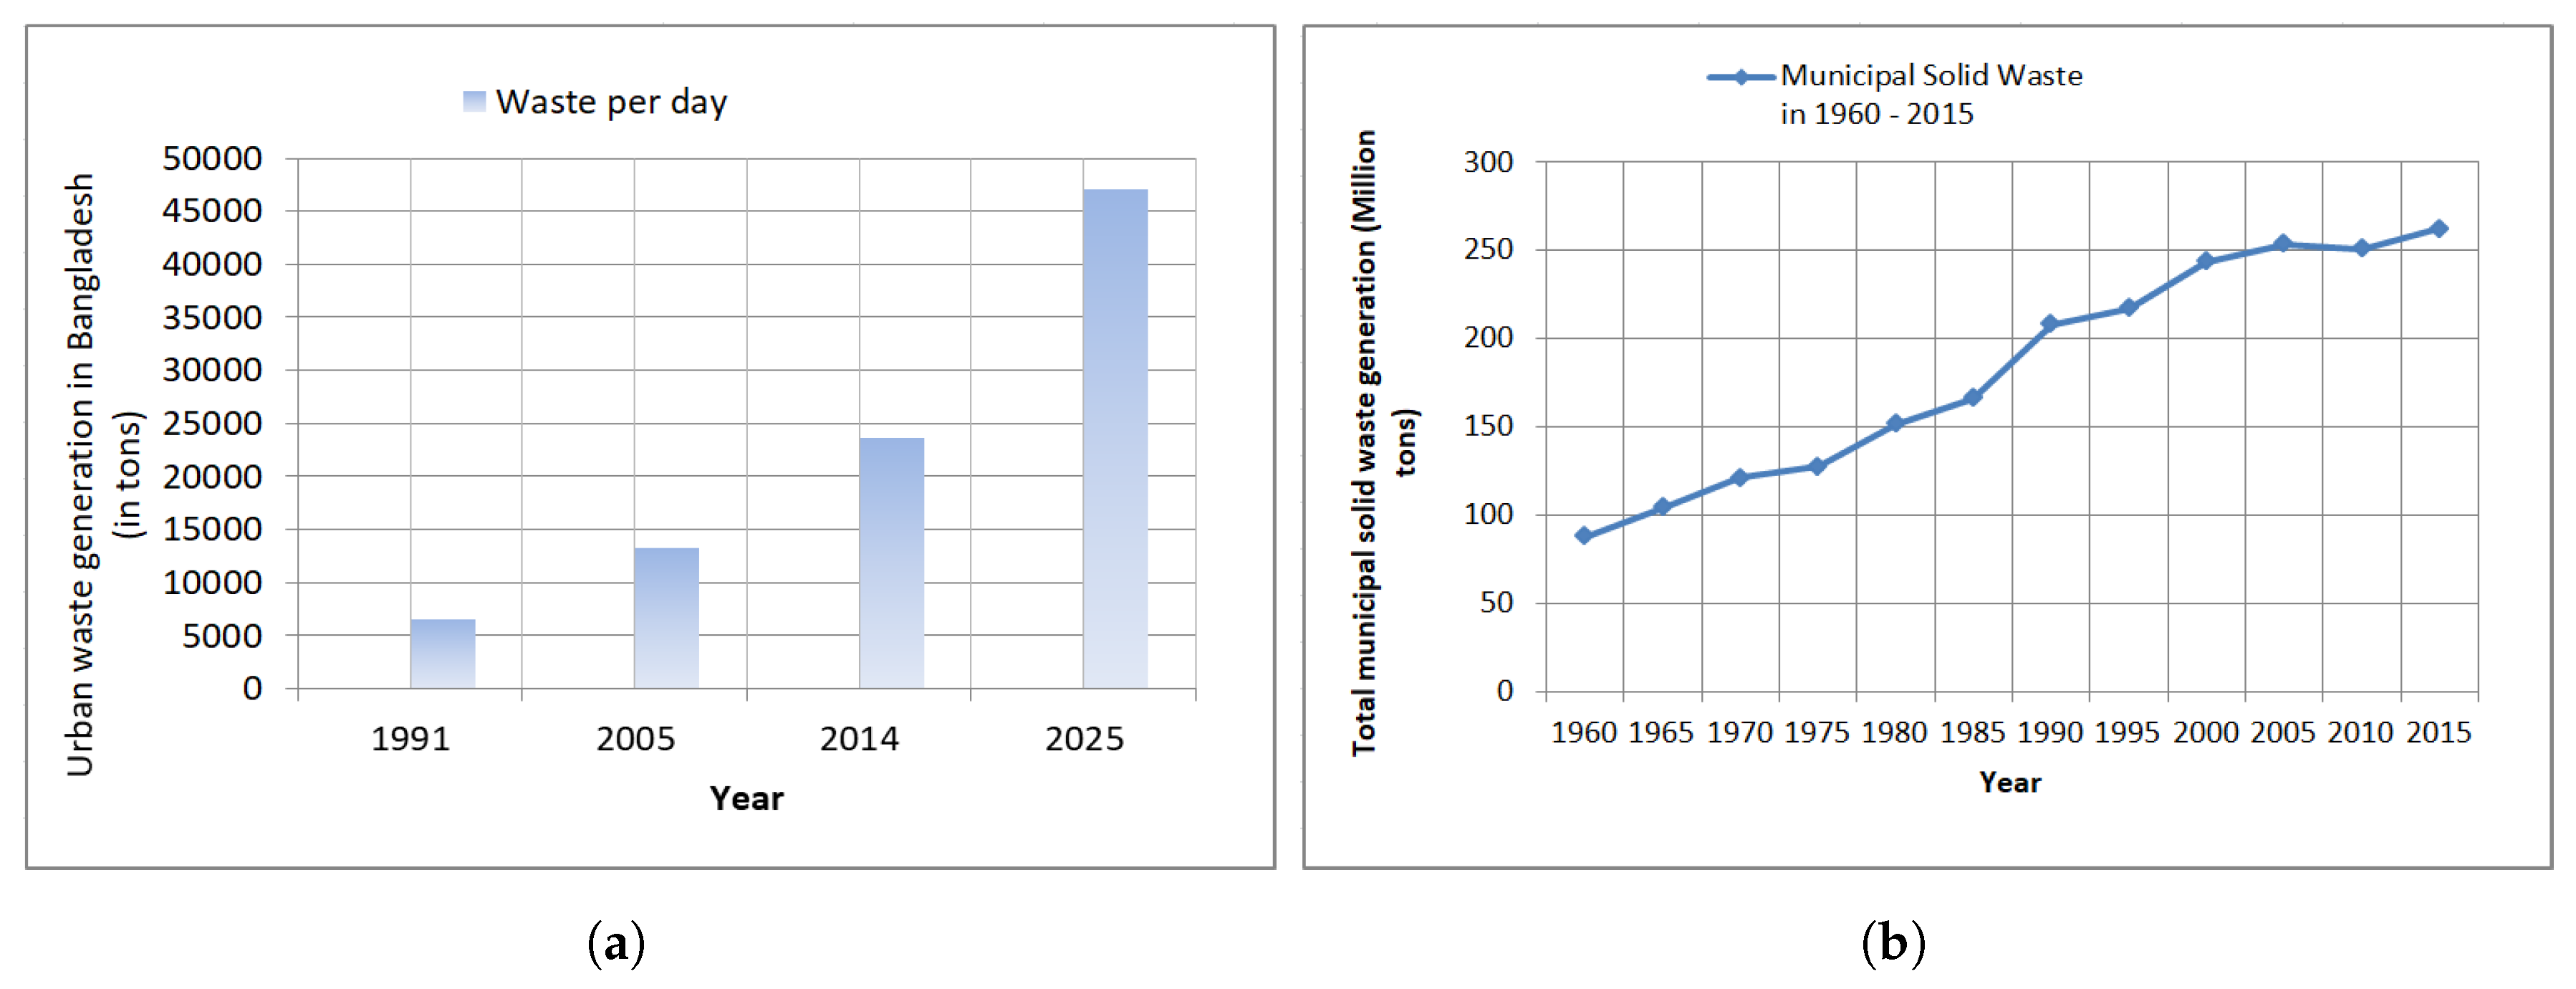
Figure 1a shows the current generation of the garbage along with an estimation of 2025, and the rapid formation of scrap for a developing country, for instance, Bangladesh [
1]. The graph illustrates that the garbage production rate per day for 1991 is 6,493 tons and for 2014 it is 23,688 tons, which means approximately four times. However, with an estimation for 2025, it can be 47,000 tons, and this rate is still increasing exponentially. It is a great challenge to deal with this dilemma, therefore, inevitable to practice a better management system. In a developed country, the waste generation is still pretty high, and most of them are solid-waste of industries, for instance, the United States of America [
2]. We can see from
Figure 1b that the solid waste generation for the USA from the year 1960 to 2015, and this rate is rising over time. We can observe from the figure that in the year 1960, the total formation of solid waste was 88.1 million tons (lowest) and for 2015 it was 262.4 million tons (highest). There was a slight improvement in 2010 considering previous data, whereas, from the year 1985 to 1990 the slope raised a lot. Still, the production of solid waste in the municipality area is increasing at an alarming rate. This excess garbage necessitates extra consideration for monitoring.
Nevertheless, this garbage spreads out an unbearable odour. Because of this odour rats, flies and other pests get attracted by it that causes two major quandaries to occur. Here, the first quandary is environmental pollution, such as air pollution, water pollution etc. The other one is fatal diseases like Diarrhoea, Cholera, and skin infections. It is a prominent difficulty to obtain solutions to these dilemmas. An effective garbage monitoring system is crucial to keep the environment neat and clean as there is an increase in all kinds of rubbish. Every year a tremendous amount of money and place get wasted for the collection of trash from cities.
A traditional waste management system, containing some static containers and human-operated vehicles is not sufficient to solve this difficulty of waste generation. Whereas, a smart, as well as a technological solution, might be a satisfying one. Blessings of technology in all sectors motivate reason to find resolutions to the garbage management problem. Considering the benefits of the proposed system, we can classify them into two main categories. One is advantages in social perspective, and the other is beneficial in the economic aspect. The former one includes a better waste management system and, mitigation of environmental pollution. The latter entails the reduction of the exercise of excessive human resources.
The internet has been available since 1989 and connecting things with it was an ongoing process ever since. Connecting any physical device with the internet is regarded as the ‘Internet of Things’ or in short IoT. P. Suresh et al. [
3] stated that Trojan Room coffee pot possibly considered as the first application of IoT. In 1990, John Romkey [
4] first introduced a toaster that could be on or off with the help of the internet, which was the first IoT device. Keeping this in mind dustbins were connected to the internet as well. These bins are monitored through webpages and named ‘Smart Bin’.
With this motivation, N. Sharma et al. [
5] made an intelligent garbage monitoring system. Their vision was to prepare a garbage monitoring system for a green city where they used an ultrasonic sensor to sense the garbage level in the bins and connected through a cellular network which then stored in a database with time and date. K. Mahajan et al. [
6] employed Zigbee and Global System for Mobile communication system (GSM) to transmit messages to the truck driver to collect garbage as a notification of saturation of containers. The dustbins used Zigbee to connect to the server. S. Abdoli [
7] worked with Radio Frequency Identification (RFID) technology for the containers. He used low-frequency RFID tag which includes an antenna, and each one has its unique identity. RFID tags were attached to the containers which broadcasted their unique identity whenever these containers became full. For data transmission, it uses a computer network that used a server. A. Jain et al. [
8] developed a system where ultrasonic, and force sensor have used in the bin to measure the level of garbage. They used the ‘Internet of Things’ (IoT) and an android application to monitor the containers where scraps had dumped. Finally, the data transmitted through GSM/GPRS (General Packet Radio Service) to the control room.
However, all these systems have some constraints, such as they cannot use the money, space, and time efficiently, moreover, all of them are just simple integration of IoT technology. Overcoming these issues this paper, proposed an advanced level of solution integrated with IoT, a rotational garbage bin and an autonomous cleaning system. This rotational garbage bins system is introduced for proper space management along with RFID tags to locate them. Therefore, it is allowing us to use more volume of trash cans keeping the same land used mentioned in the above papers. Besides, the proposed system prevents overflow of garbage in the bins, which makes the system more environment-friendly. Also, the autonomous cleaning section includes an autonomous car [
9,
10,
11,
12], which finds its path towards the trash bin and returns to its station, collecting the garbage without any human’s assistance. The overall improvement we discussed is presented in
Table 1.
Table 1 shows that all the literature we reviewed covers the integration of IoT with trash cans. They lack decent land use and autonomous cleaning approach, which inspires us to develop our system. To do so, in
Section 1 this paper introduced state-of-the-art garbage management and monitoring techniques.
Section 2 describes the overall methodology of our work that fundamentally shows how the system accomplishes its purpose.
Section 3 defines the layout of containers as well as ‘Smart Bin’ where we considered two separate forms of the bin. Then we measured the performance of these two cases.
Section 4 illustrates the design of an autonomous car and its line-following capabilities.
Section 5 discusses the Central Monitoring System (CMS) of the waste management system that controls the overall mechanism for both ‘Smart Bin’ and the autonomous car.
Section 6 represents our finding, with a comparison with the traditional approach of managing waste. Finally,
Section 7 concludes the whole paper and the work itself.
2. Methodology
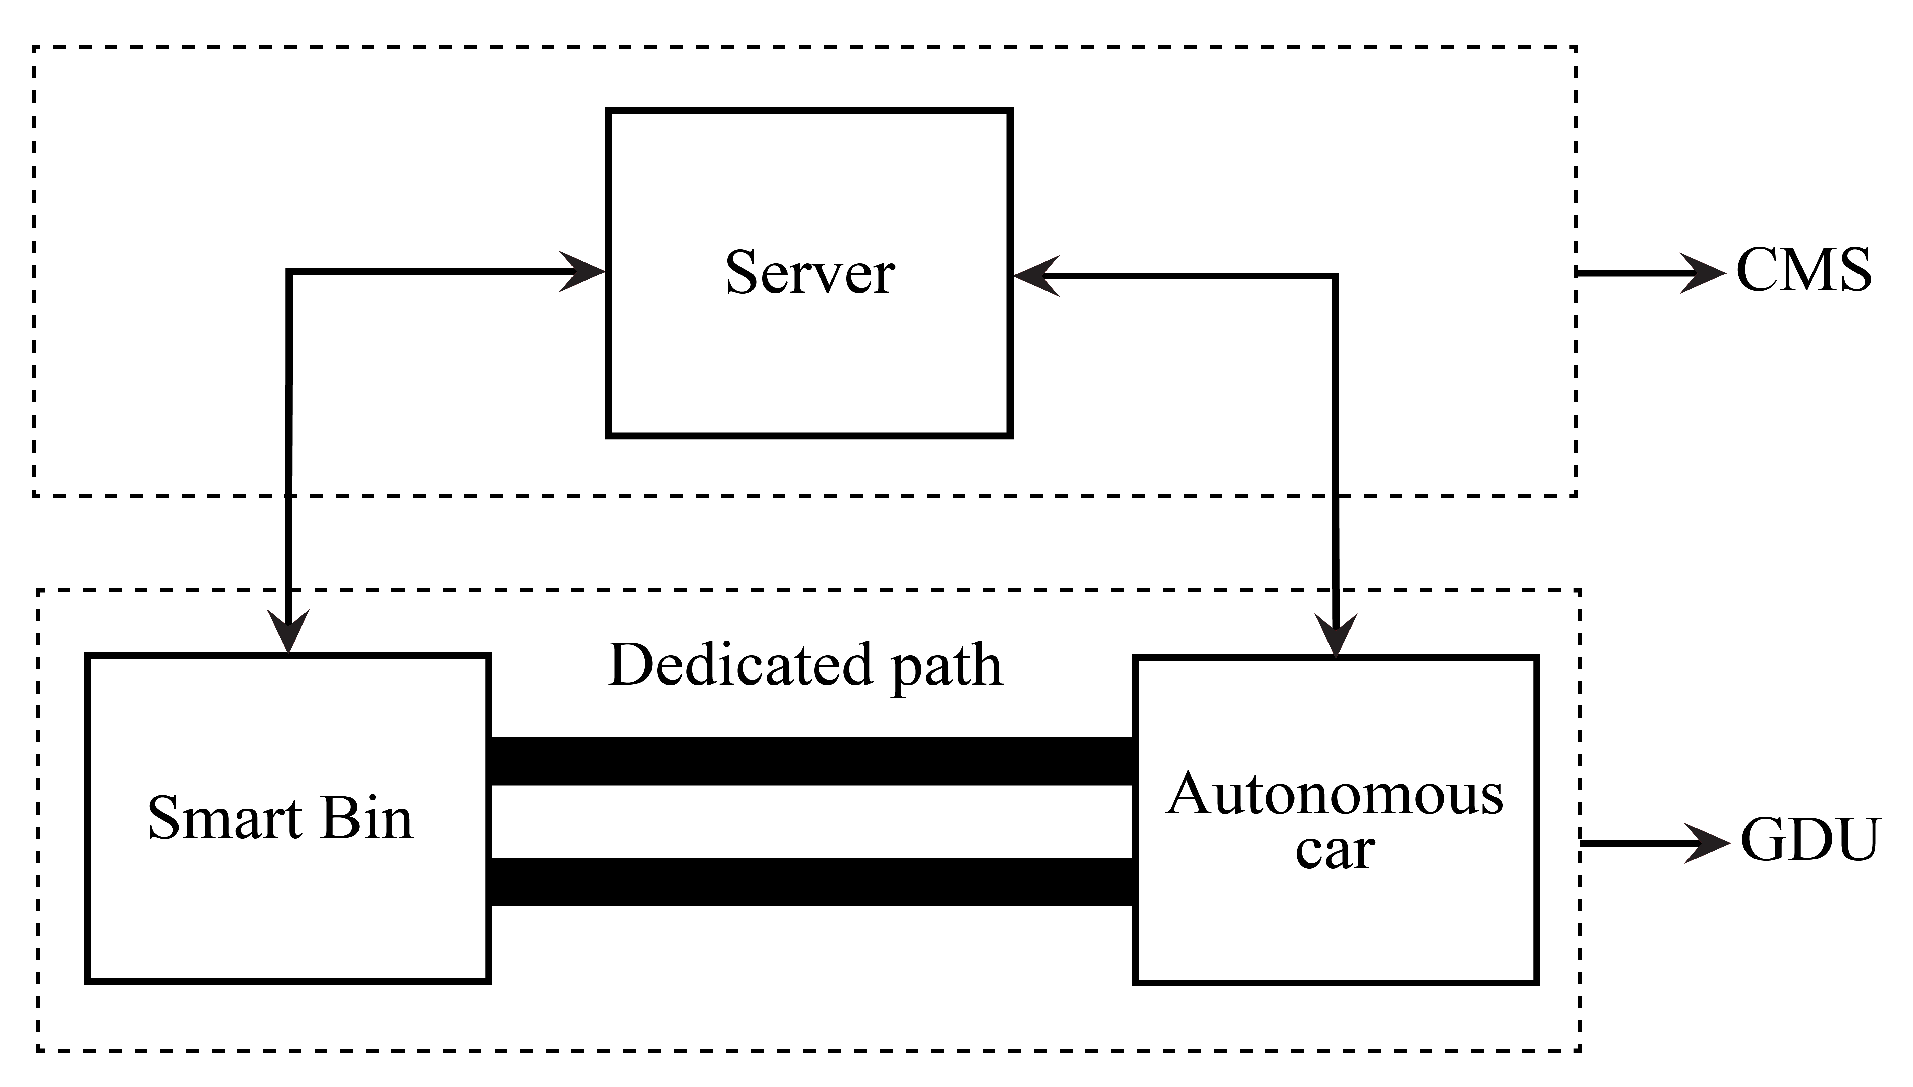
A conventional waste management scheme consists of containers with various sizes and shapes, where some vehicles are used to collect trash from them. For developed countries, the waste management system can be considered as satisfying. On the contrast, it is done manually in a scheduled manner. The case becomes worst in developing countries, where this management becomes a concerned issue. This paper is offering a solution to this, which introduces a rotational containers system (named ‘Smart Bin’) and an autonomous line-following vehicle with a robotic hand for garbage collection. Altogether this is named, ‘Garbage Disposal Unit’ or GDU. Each GDU has connected with a central server through the internet.
Figure 2 illustrates overall IoGB technique where GDU and CMS can both communicate with each other.
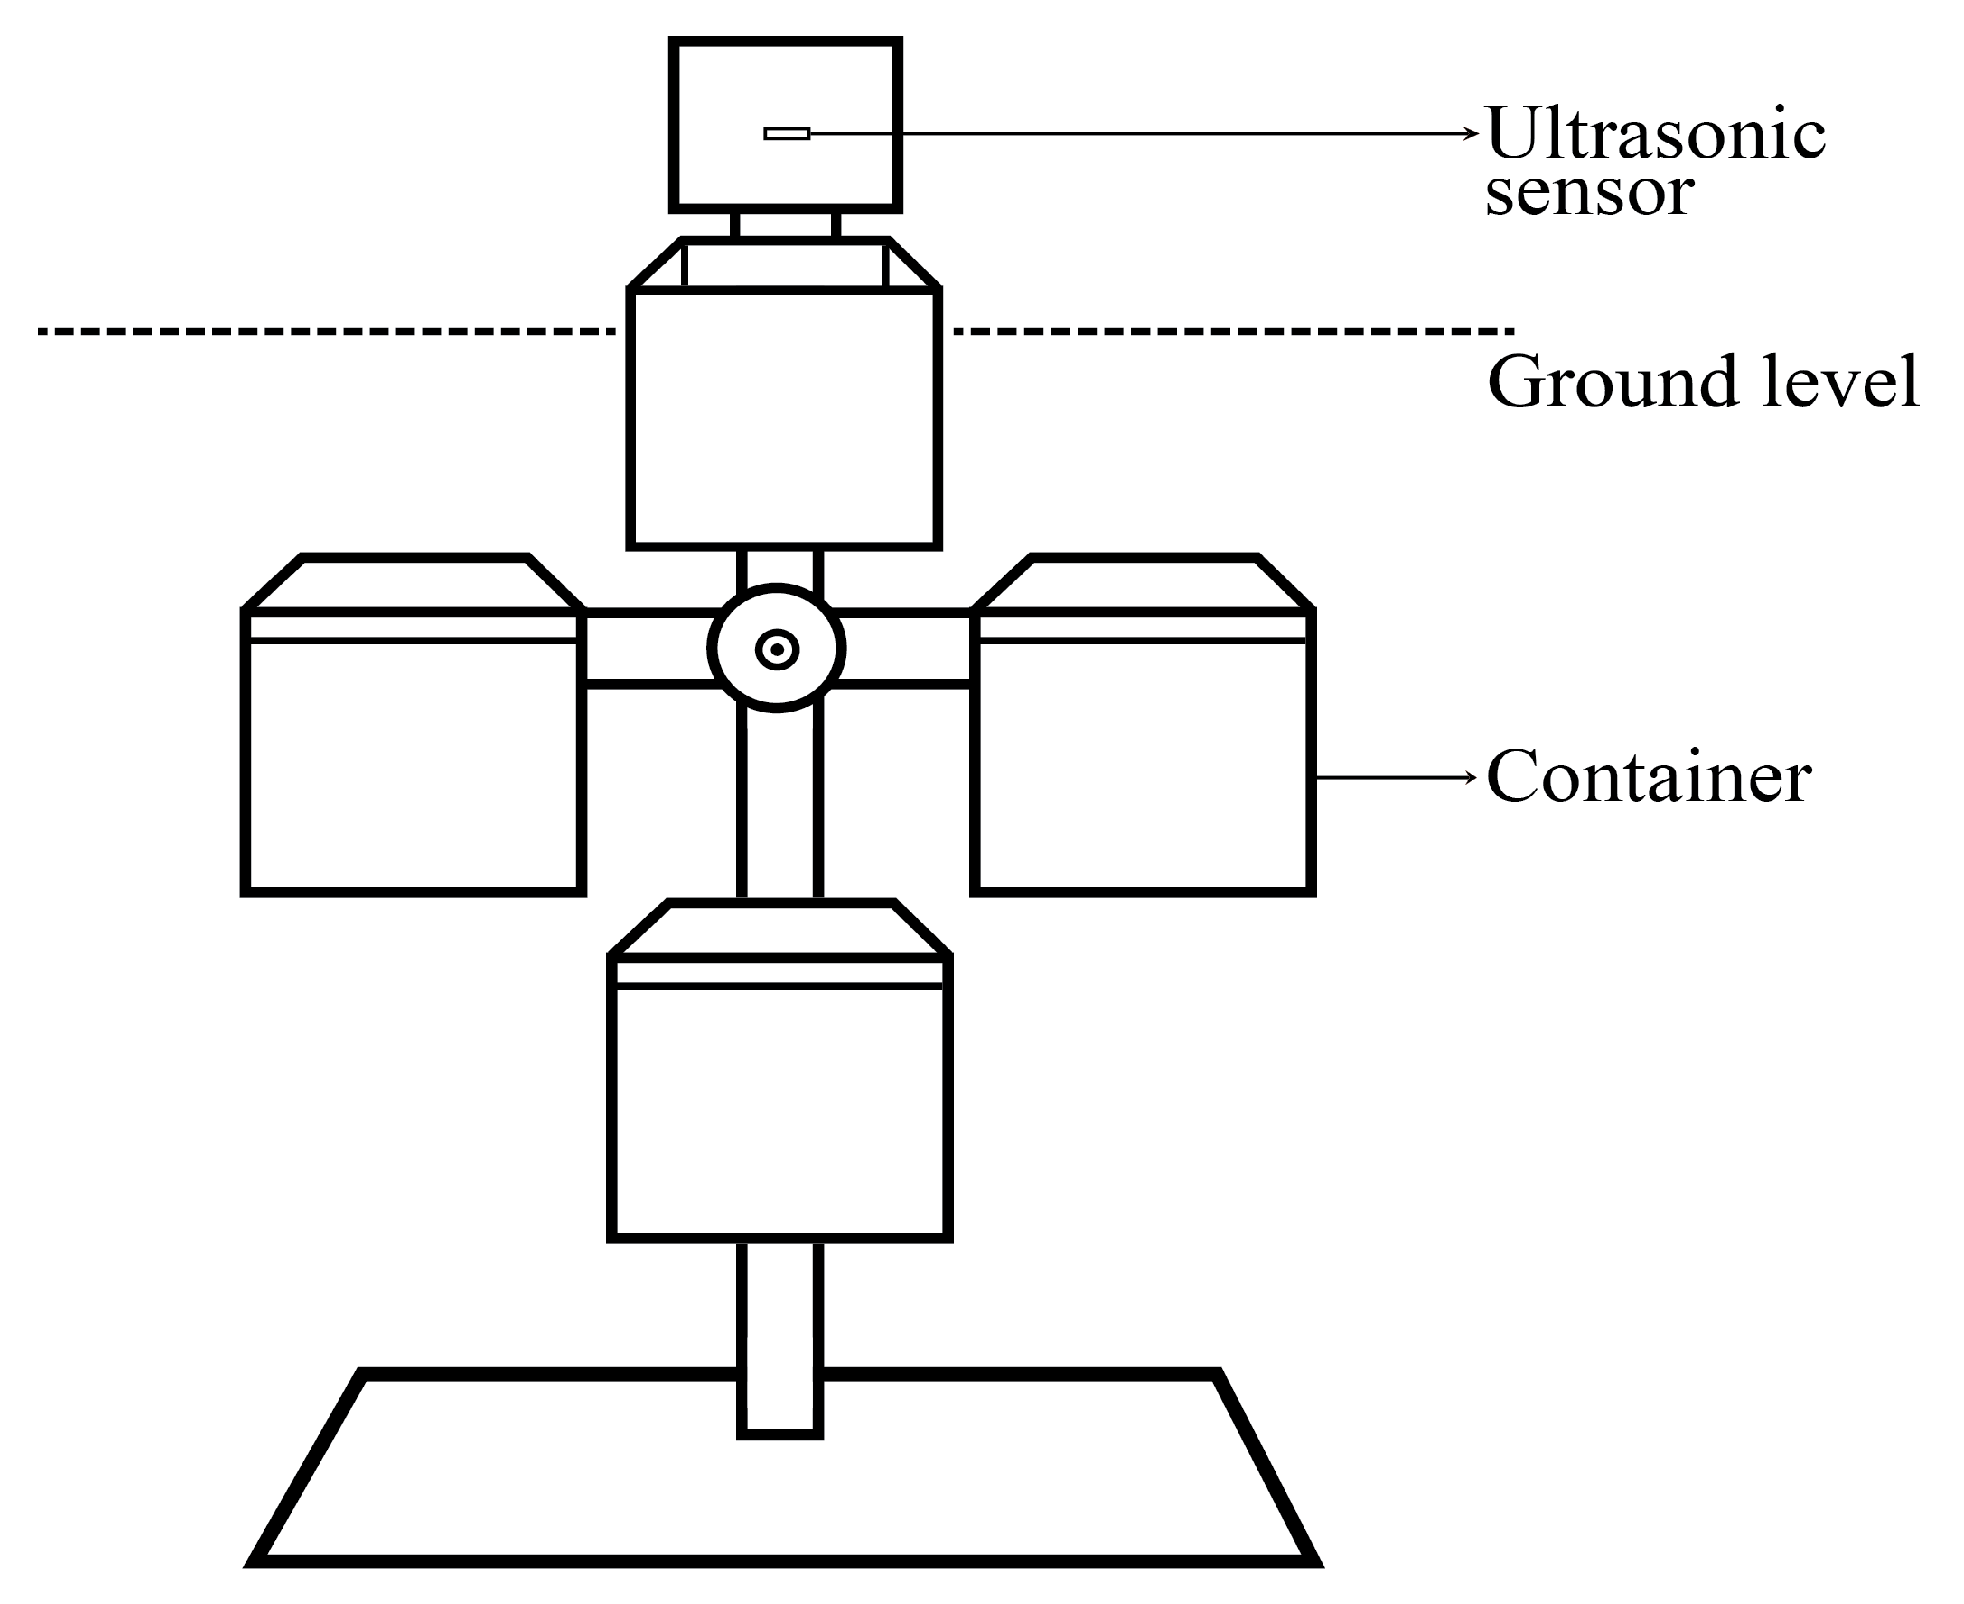
For this paper, ‘Smart Bin’ is a system which carries up to four containers, each remains 90° apart. The whole system lies below ground level, where only one appears above ground at once. After all of them gets full, it sends the data to the server. Meanwhile, the autonomous car receives this data, follows a dedicated path, and come towards the containers. It then empties all of the trash cans and returns to its station (
Figure 3).
Ultrasonic sensors do the job of measuring garbage level in containers and convey the data to a microcontroller (Arduino MEGA 2560 board). These sensors generate ultrasonic sound waves and transmits them. It has a mechanism of receiving the echo of the transmitted sound. Using this characteristic distance has measured along with a defined threshold value for garbage level for a trash can, which later used in decision-making. If a sensor senses this mentioned value, the microcontroller makes a decision that the container has become full. Afterwards, the required steps have done by the microcontroller, either by rotating while closing the lid with the help of servo motors (SG90 and MG996) or by conveying to a server that Smart Bin is full through ESP8266 ESP-01 Wi-Fi module. This Wi-Fi module serves the purpose of communication between GDU and CMS. Here the processing unit, microcontroller, is like the brain for the system. No sooner the server had notified that a Smart Bin is full than it launched an autonomous car to collect the garbage. This car applies an analog infrared (IR) sensor array 10 to perform the line-follow technique. IR sensor is a combination of an emitter and a detector, the former one emits infrared ray, and the latter one receives the reflection. The intensity of the reflection defines the output of this sensor besides infrared radiation is invisible to humans. Again servo motors have been used to create the robotic hand even a Wi-Fi module is attached to it for communication with the server. Finally, the car collects the garbage with the assistance of this robotic hand [
13,
14], updates the server that Smart Bin has cleared, and returns to the station.
Table 2 describes the used components for the design of the system has shown:
For designing the front-end of the server, we used Hypertext Markup Language (HTML), Cascading Style Sheet (CSS). HTML is like a simple structure for a webpage, and CSS beautifies it. JavaScript has provided back-end support that runs the entire server as well. However, the webpage is not capable of storing data alone, hence aid of database is necessitated. Therefore, MySQL database has introduced that works as a repository for data. Further, we need the data from database tables, and there Structured Query Language (SQL) comes into consideration. SQL being a dedicated query language for MySQL database, it has adopted for querying purposes. It determines the necessary information, which then transmitted to webpages, Smart Bin and an autonomous car.
3. Architecture of the Bins
Our system proposes a solution to mitigate the problem of waste management for which we used a rotational containers system (
Figure 4). Each one contains an ultrasonic sensor to read the garbage level in them. Besides, the sensor senses whether they are full or not. A microcontroller performs the decision-making part for the bins. Servo motors have used to rotate the containers as well as to close the lids. These servos are more trustworthy than induction motors. The container coming at the end of the process has a ‘Radio Frequency IDentity’ (RFID) tag attached to it. This component serves the objective of the identification of the ‘Smart Bin’. Mainly the ‘Smart Bin’ sends the bin number corresponding the unique RFID identity of its RFID tag to the server as becomes full and waits for cleaning. This whole mechanism has represented as an algorithm in Algorithm 1.
Algorithm 1 describes the Smart Bin’s working mechanism:
| Algorithm 1: Algorithm for working and monitoring of ‘Smart Bin’. |
| Step 1: Start nth bin’s ultrasonic sensor [Here, n = 1] |
| Step 2: Read value of the ultrasonic sensor |
| Step 3: Define threshold value for container as |
| if value < δ then |
| | Close the lid |
| else |
| | Go back to step 2 |
| end |
| step 4: check is it nth bin? [Here, n = 4] |
| if false then |
| | Rotate the container; Start its ultrasonic sensor; Go to step 2 |
| else |
| | Send RFID identity to the CMS |
| end |
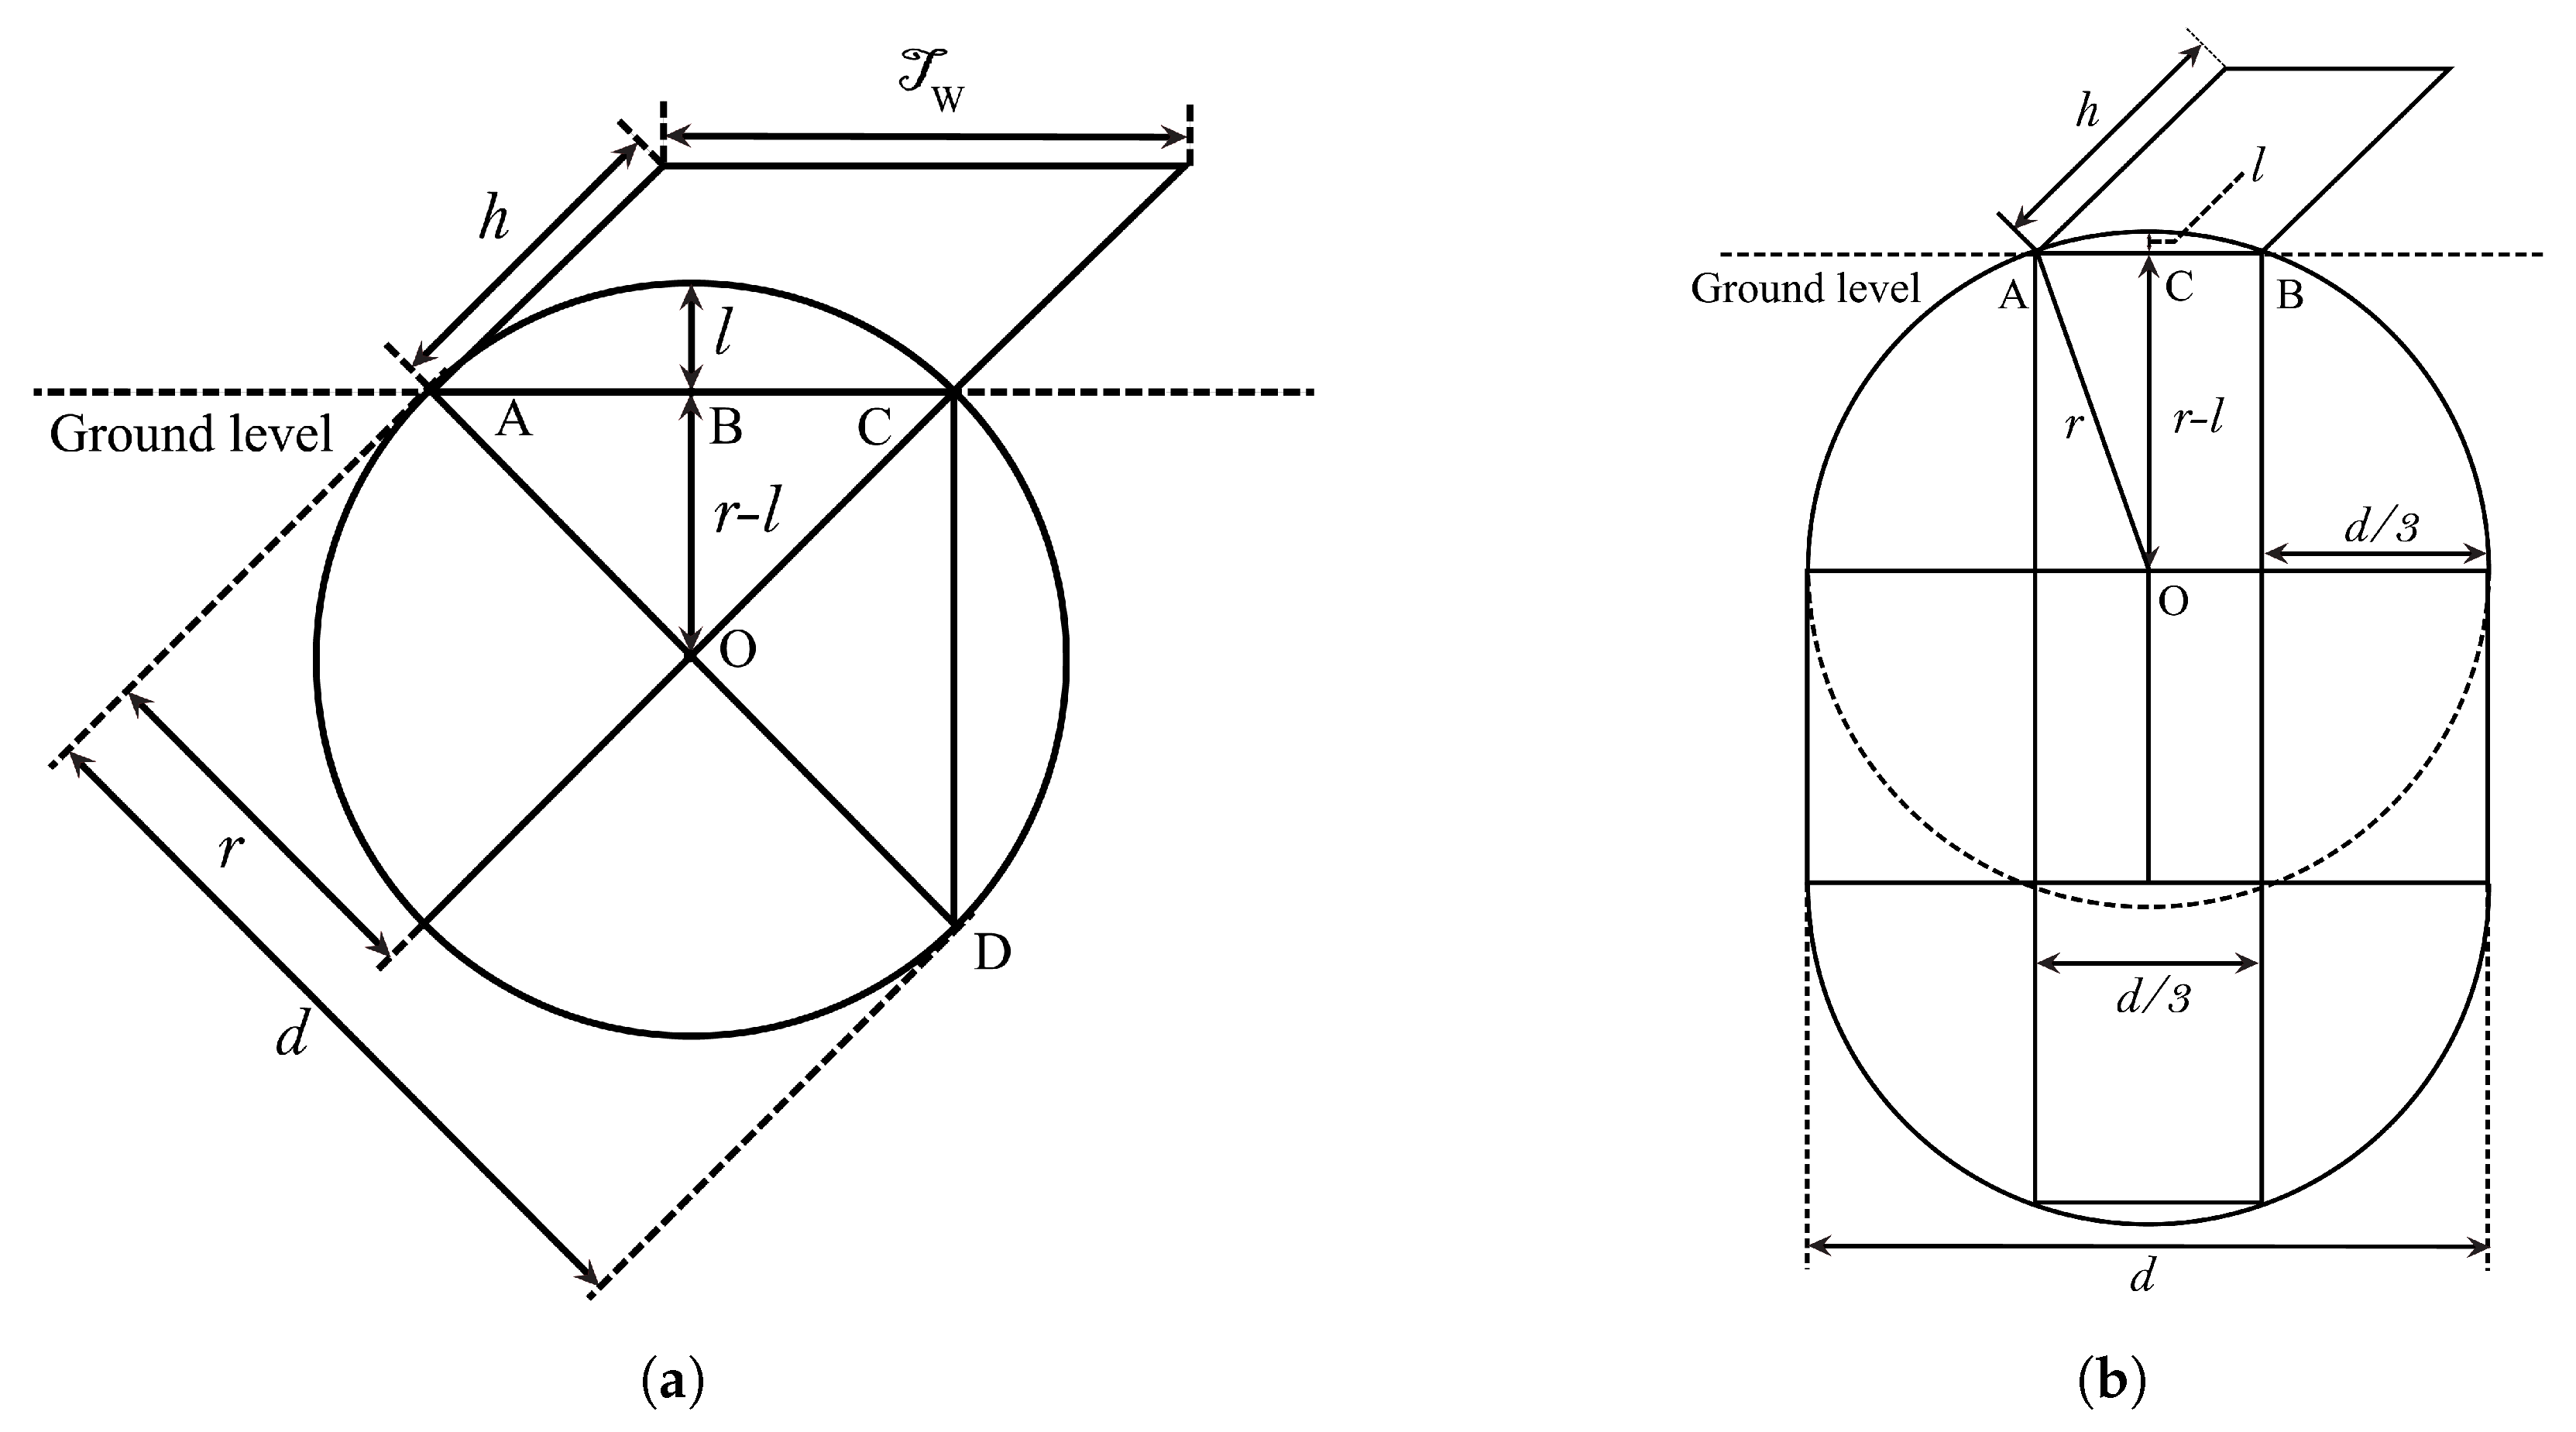
For the design of container, here we considered two cases:
Case 1: System with round containers (
Figure 5a)
Case 2: System with cuboid containers (
Figure 5b)
Both l and r are significant parameters for Cases 1 and 2. Thus two parameters maintain a constant relationship which has represented as Lemmas 1 and 2.
Lemma 1. For the round containers case the l and r maintains a relationship of Lemma 2. For the cuboid containers case the l and r maintains a relationship, Appendix A contains both the proof of Lemmas 1 and 2.
Table 3 summarizes the finds from Lemmas 1 and 2.
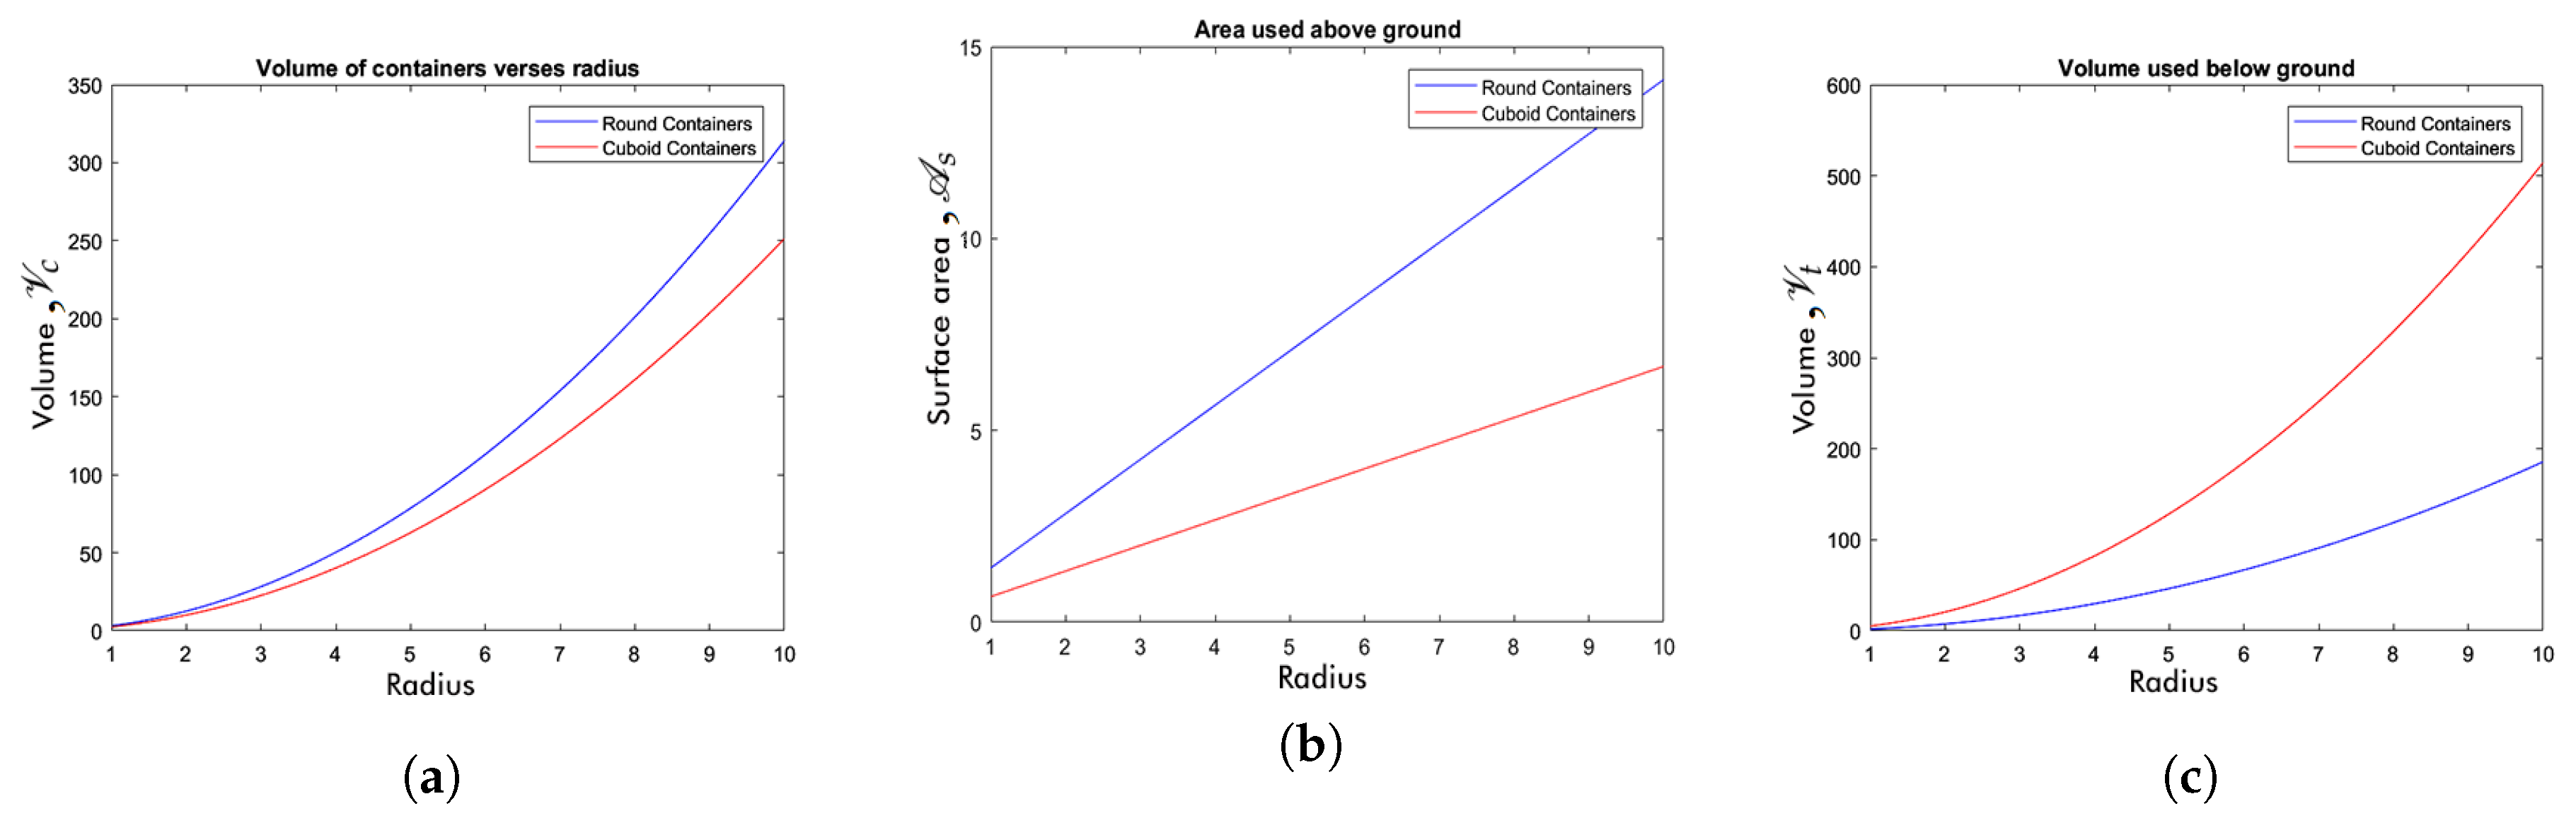
Figure 6a shows the relationship between the radius of the system versus the total volume of the four containers where both curves are non-linear. Here the cuboid and round container system always maintain a ratio of 1:1.24956. Therefore, round one provides much volume to use, hence from the graph we observe, in a range between 1 to 3 unit both give the same results. Next
Figure 6b describes the relation between the radius of the system versus the total surface area used above ground which is our main concern. These curves show linear relations where cuboid and round container system always maintain a ratio of
:1. These two curves are plotted from 1 because if the radius starts with zero there will be no physical existence of the system.
Figure 6c shows the relation between the radius of the system versus the total volume used by the system below ground that shows a non-linear property. The relationship between cuboid and round system is
.
The graphs indicate that the surface area used above ground is less in the cuboid case compared to the round case (
Figure 6b). On the other hand, the volume of the container and volume used by the system below ground is less in the round one. However, we can observe that the two cases give almost the same outputs in a small range (
Figure 6a,c). Therefore, we can undoubtedly say that for the design of the containers cuboid shape is better.
5. Central Monitoring System (CMS)
As the central monitoring system, we intend a website connected to a database. Fundamentally, it is the communication channel for the GDU. Since our system interacts remotely, it requires internet connectivity and a server. HTML has been used to construct the primary structure of the webpages. While running the server either on a user terminal or admin terminal, we see the output of HTML syntax along with CSS to enhance the website visibility. Next for the three main parts of the back-end-server, an application, and database we adopted JavaScript, more specifically Node.js. Data cannot appear on a webpage without the assistance of a database named ‘MySQL’. Later the required data have collected from MySQL to apply them to the webpages. SQL has been employed to handle the database as a query language.
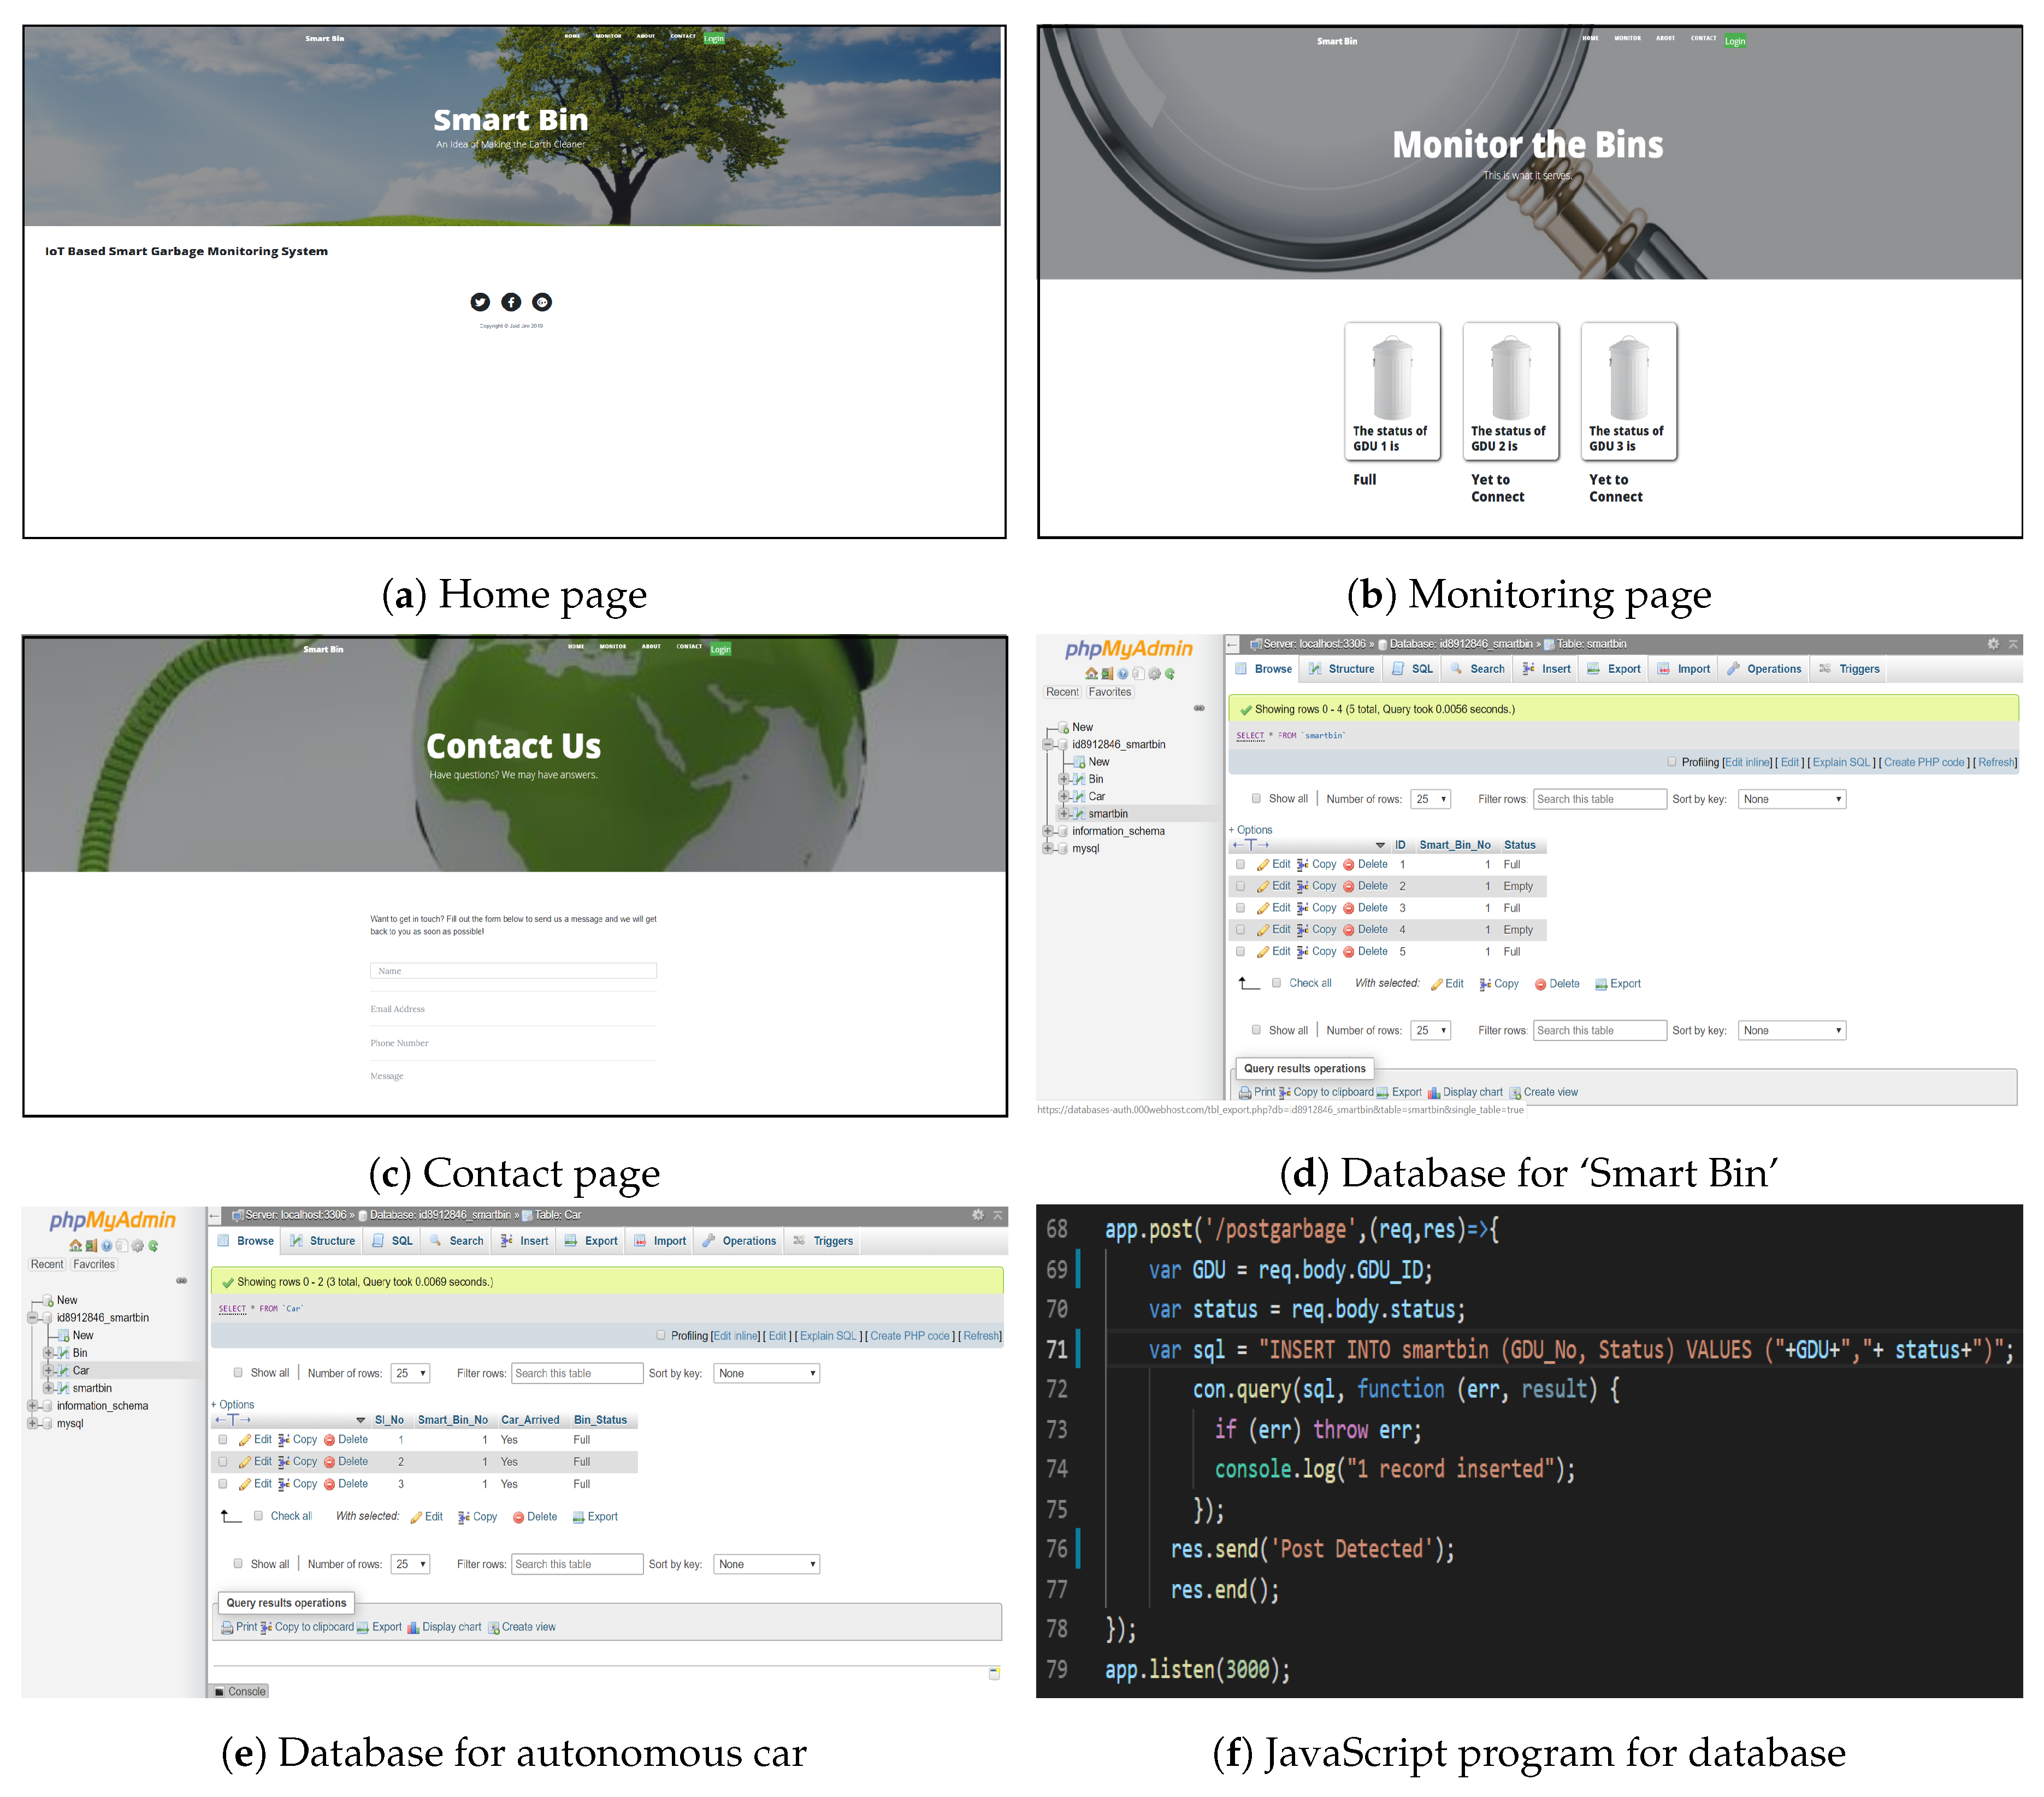
Figure 8 shows layout of our webpages, which is subcategorised as Home page (
Figure 8a), Monitoring page (
Figure 8b), Contact page (
Figure 8c), Database for ‘Smart Bin’ (
Figure 8d), Database for autonomous car (
Figure 8e), and JavaScript program for database (
Figure 8f). Whenever a user entered into the website of ‘Smart Bin’, the very next webpage appears to him is the ‘Home page’. It is similar to an introductory or start-up page for the website. The ‘Monitor page’ is the foremost concern for both authority and general users, as all the statuses of the containers have shown here. However, some facilities are none but for authority, for instance, adding a new GDU to the system, removing a GDU from the system, etc. A webpage named ‘Contact page’ have introduced for querying purposes or for sending any message for the authority. As of MySQL database stores data in tables, we required two tables—one for the Smart Bin and another for the autonomous car. If any data comes to the database the table gets updated, later SQL query language finds the latest data and shows it to the Monitor page with the assistance of JavaScript.
The GDU communicates with each other by sending the container’s RFID identity and its status (Empty or Full). Whenever the bin goes full, it adds a new entry in the table and updates the database. Immediately after the new data has inserted the webpages modify their contents as well. These data afterwards get transferred to the autonomous car, and it acknowledges the containers’ status.
6. Result
Assuming a traditional garbage container mentioned earlier, has a length of l, a width of r, and a height of h, and the Smart Bin’s container has the same parameters. The traditional one, consumes a surface area (above ground) of and yields a volume of , which can be used for garbage collection (Maximum). More often, these types of containers become full of garbage and cause an overflow polluting our environment.
On the other hand, the Smart Bin’s container uses the same surface area of
. As one Smart Bin consists of four of these containers each with a volume of
, the total volume is
. One Smart Bin yields four times additional volume than a regular one still practising the same surface area. Besides this proposed system solves the overflow dilemma, simply by introducing an ultrasonic sensor. Defining a threshold value for each sensor in a Smart Bin and measuring their performance, we came up with
Table 4.
For the prototype, we created a Smart Bin with four containers each with a length of 15 cm, width of 15 cm, and height of 20 cm. We set a threshold value for each one, which is less than the original height of the container. Whenever the garbage level crosses the preset value, the container’s lid closes. Performing this activity five times with additional measurement, we obtained
Table 4. This table shows that Smart Bin is capable of solving this mentioned garbage overflow problem.

 ,
, 


