Public Preferences and Willingness to Pay for Shared Autonomous Vehicles Services in Nagoya, Japan


Abstract
:1. Introduction
1.1. Autonomous Technology and Shared Autonomous Vehicles (SAVs)
1.2. Public Preference
1.3. Aims of the Study
1.4. Research Structure
2. Survey Design and Materials
2.1. Survey Design
2.2. Participants
2.3. Intention on SAV Services
3. Methodology
3.1. Partitioning Clustering Algorithm
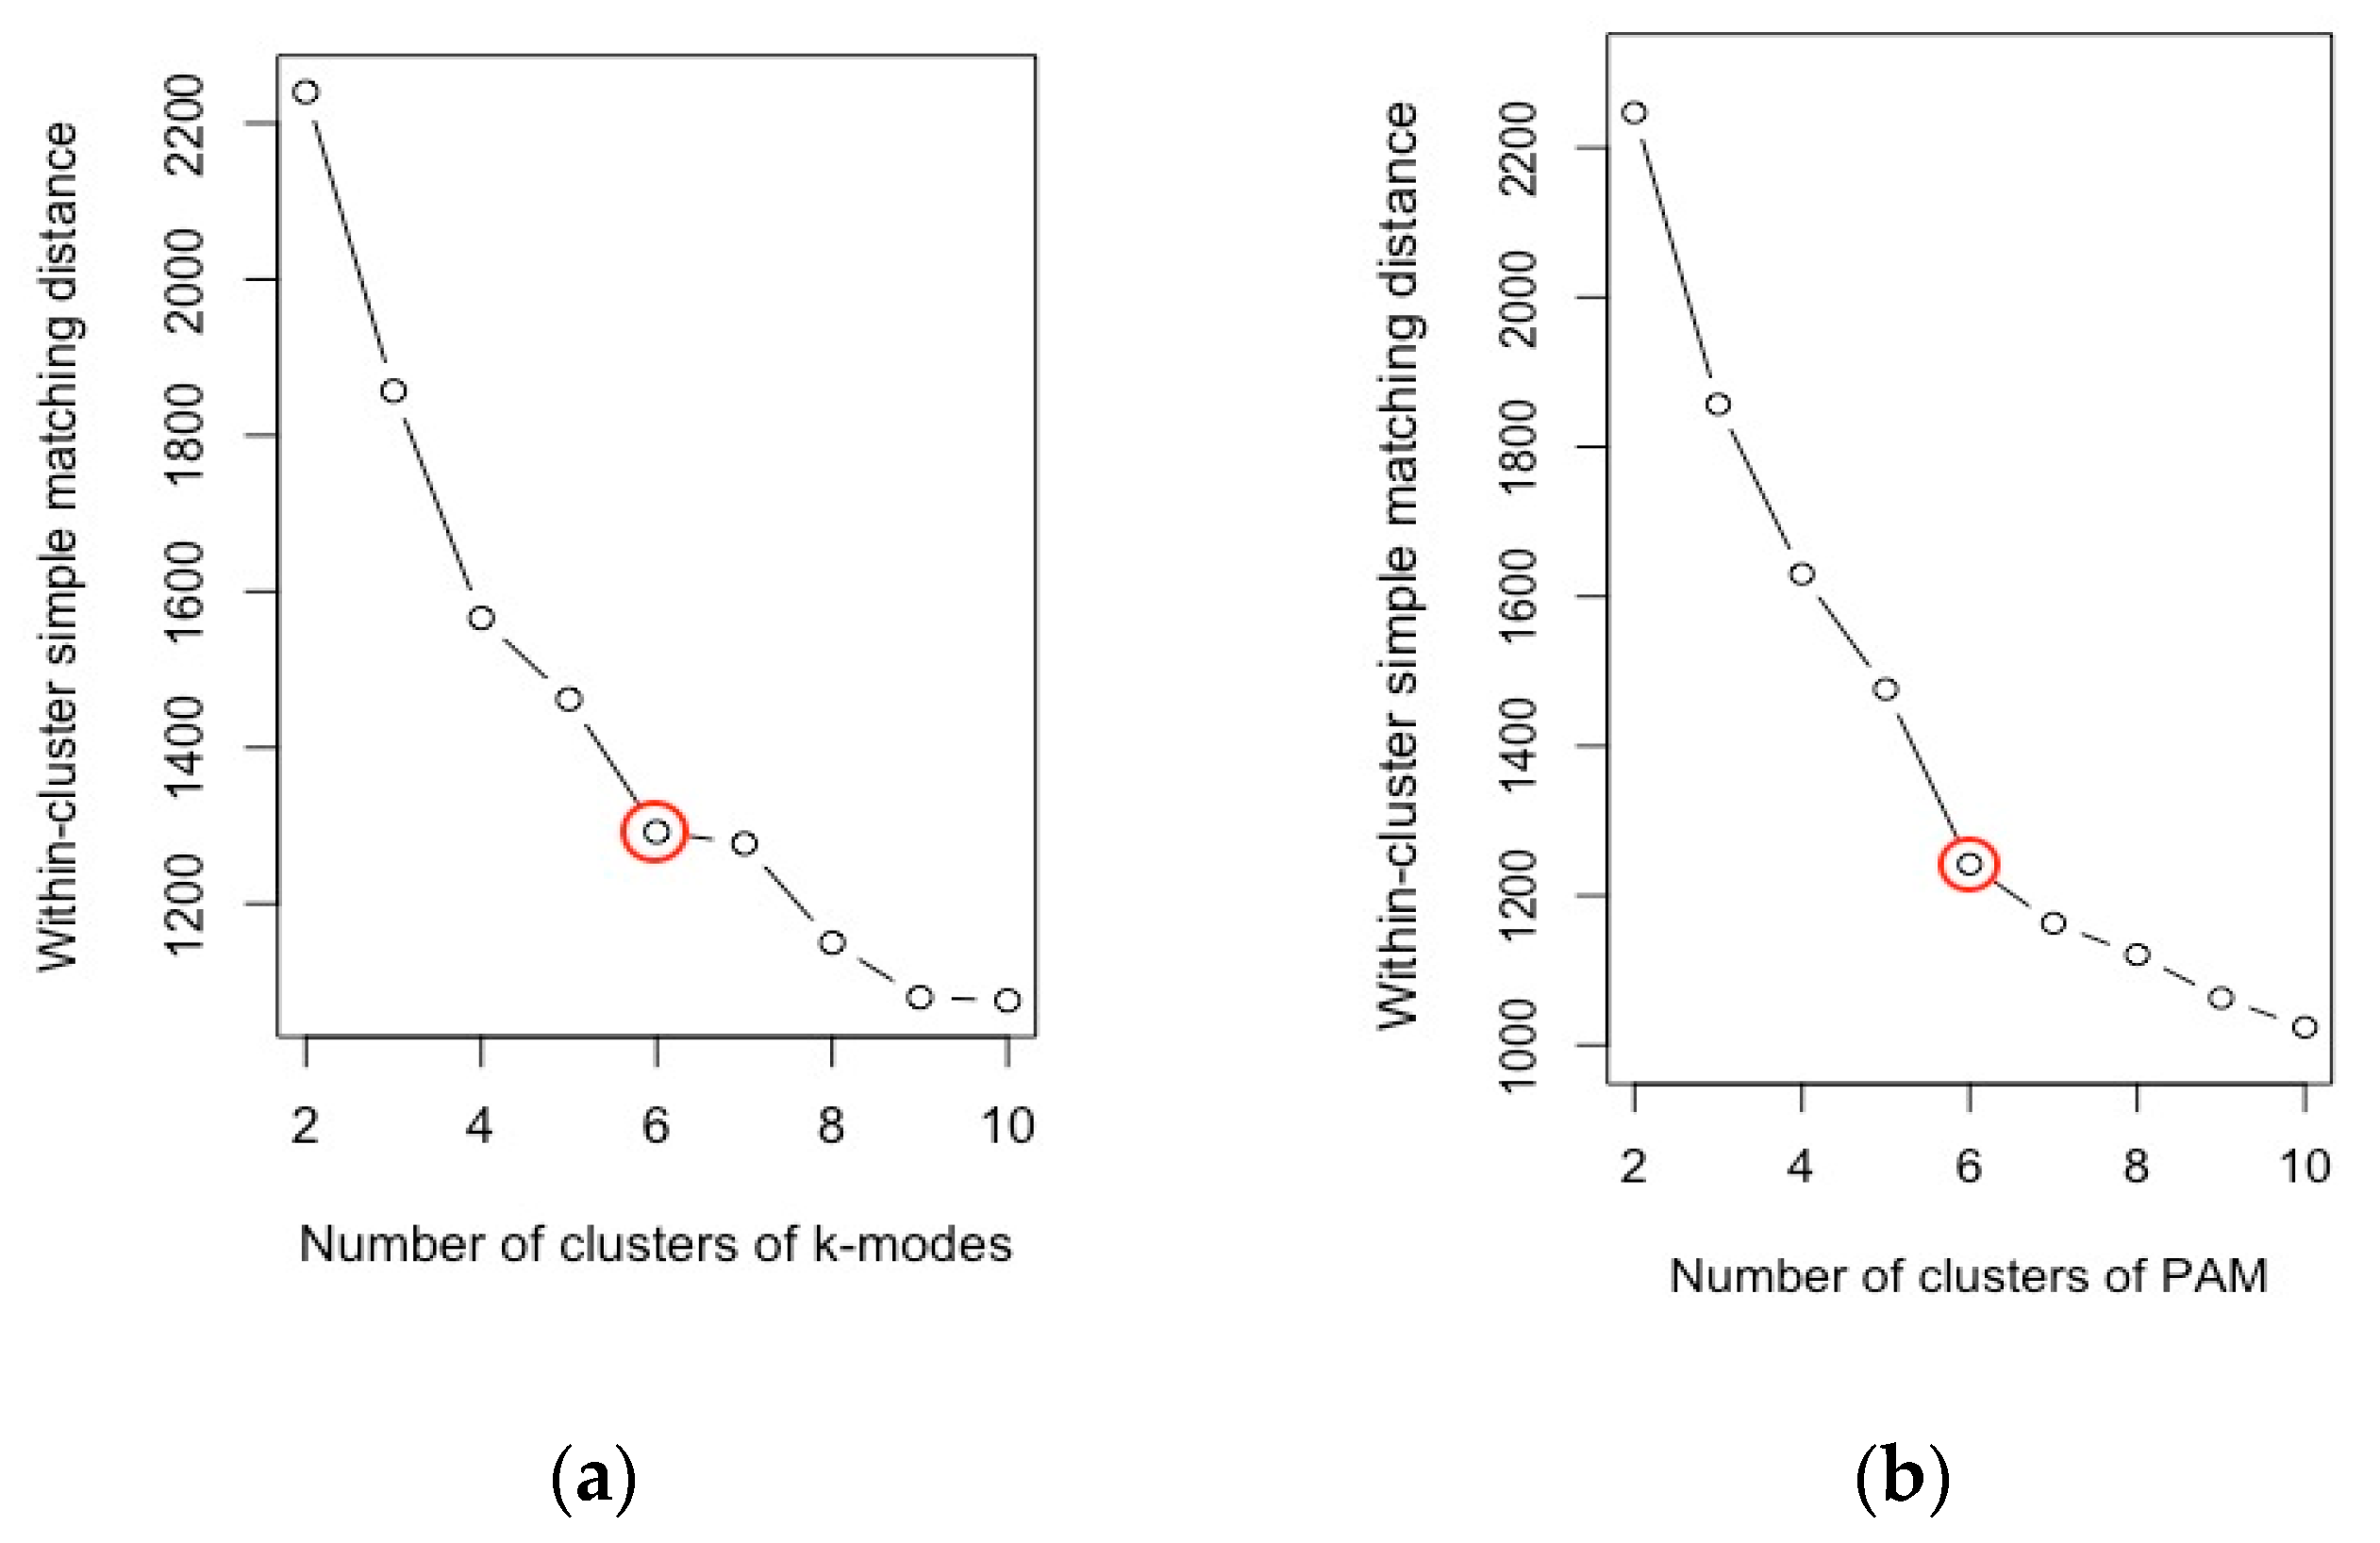
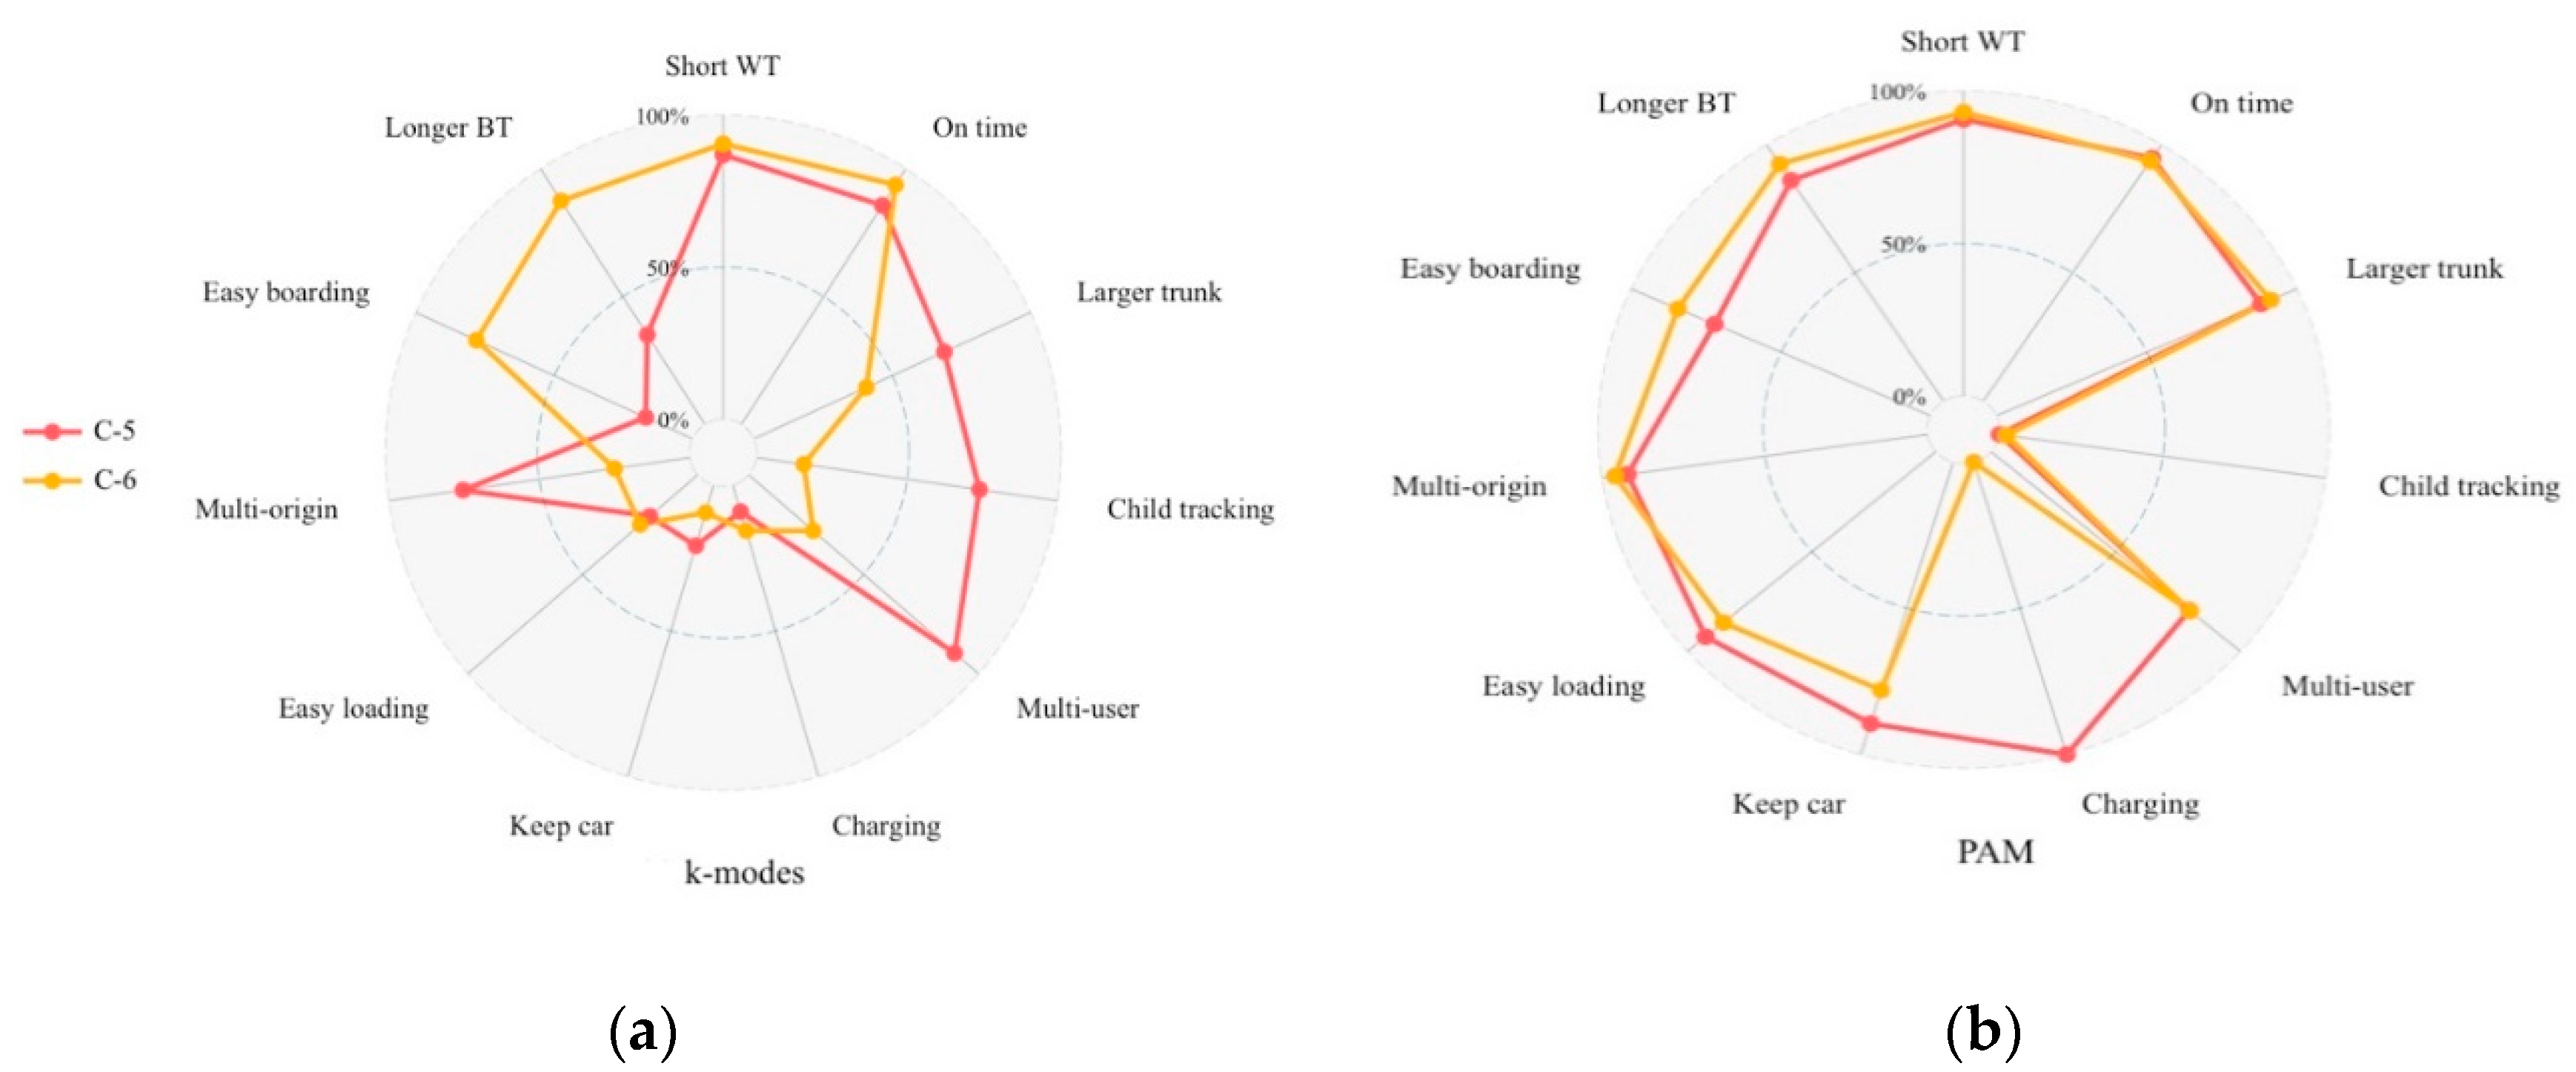
3.2. Clustering Algorithm Comparison
4. Results and Discussion
4.1. Clustering Results
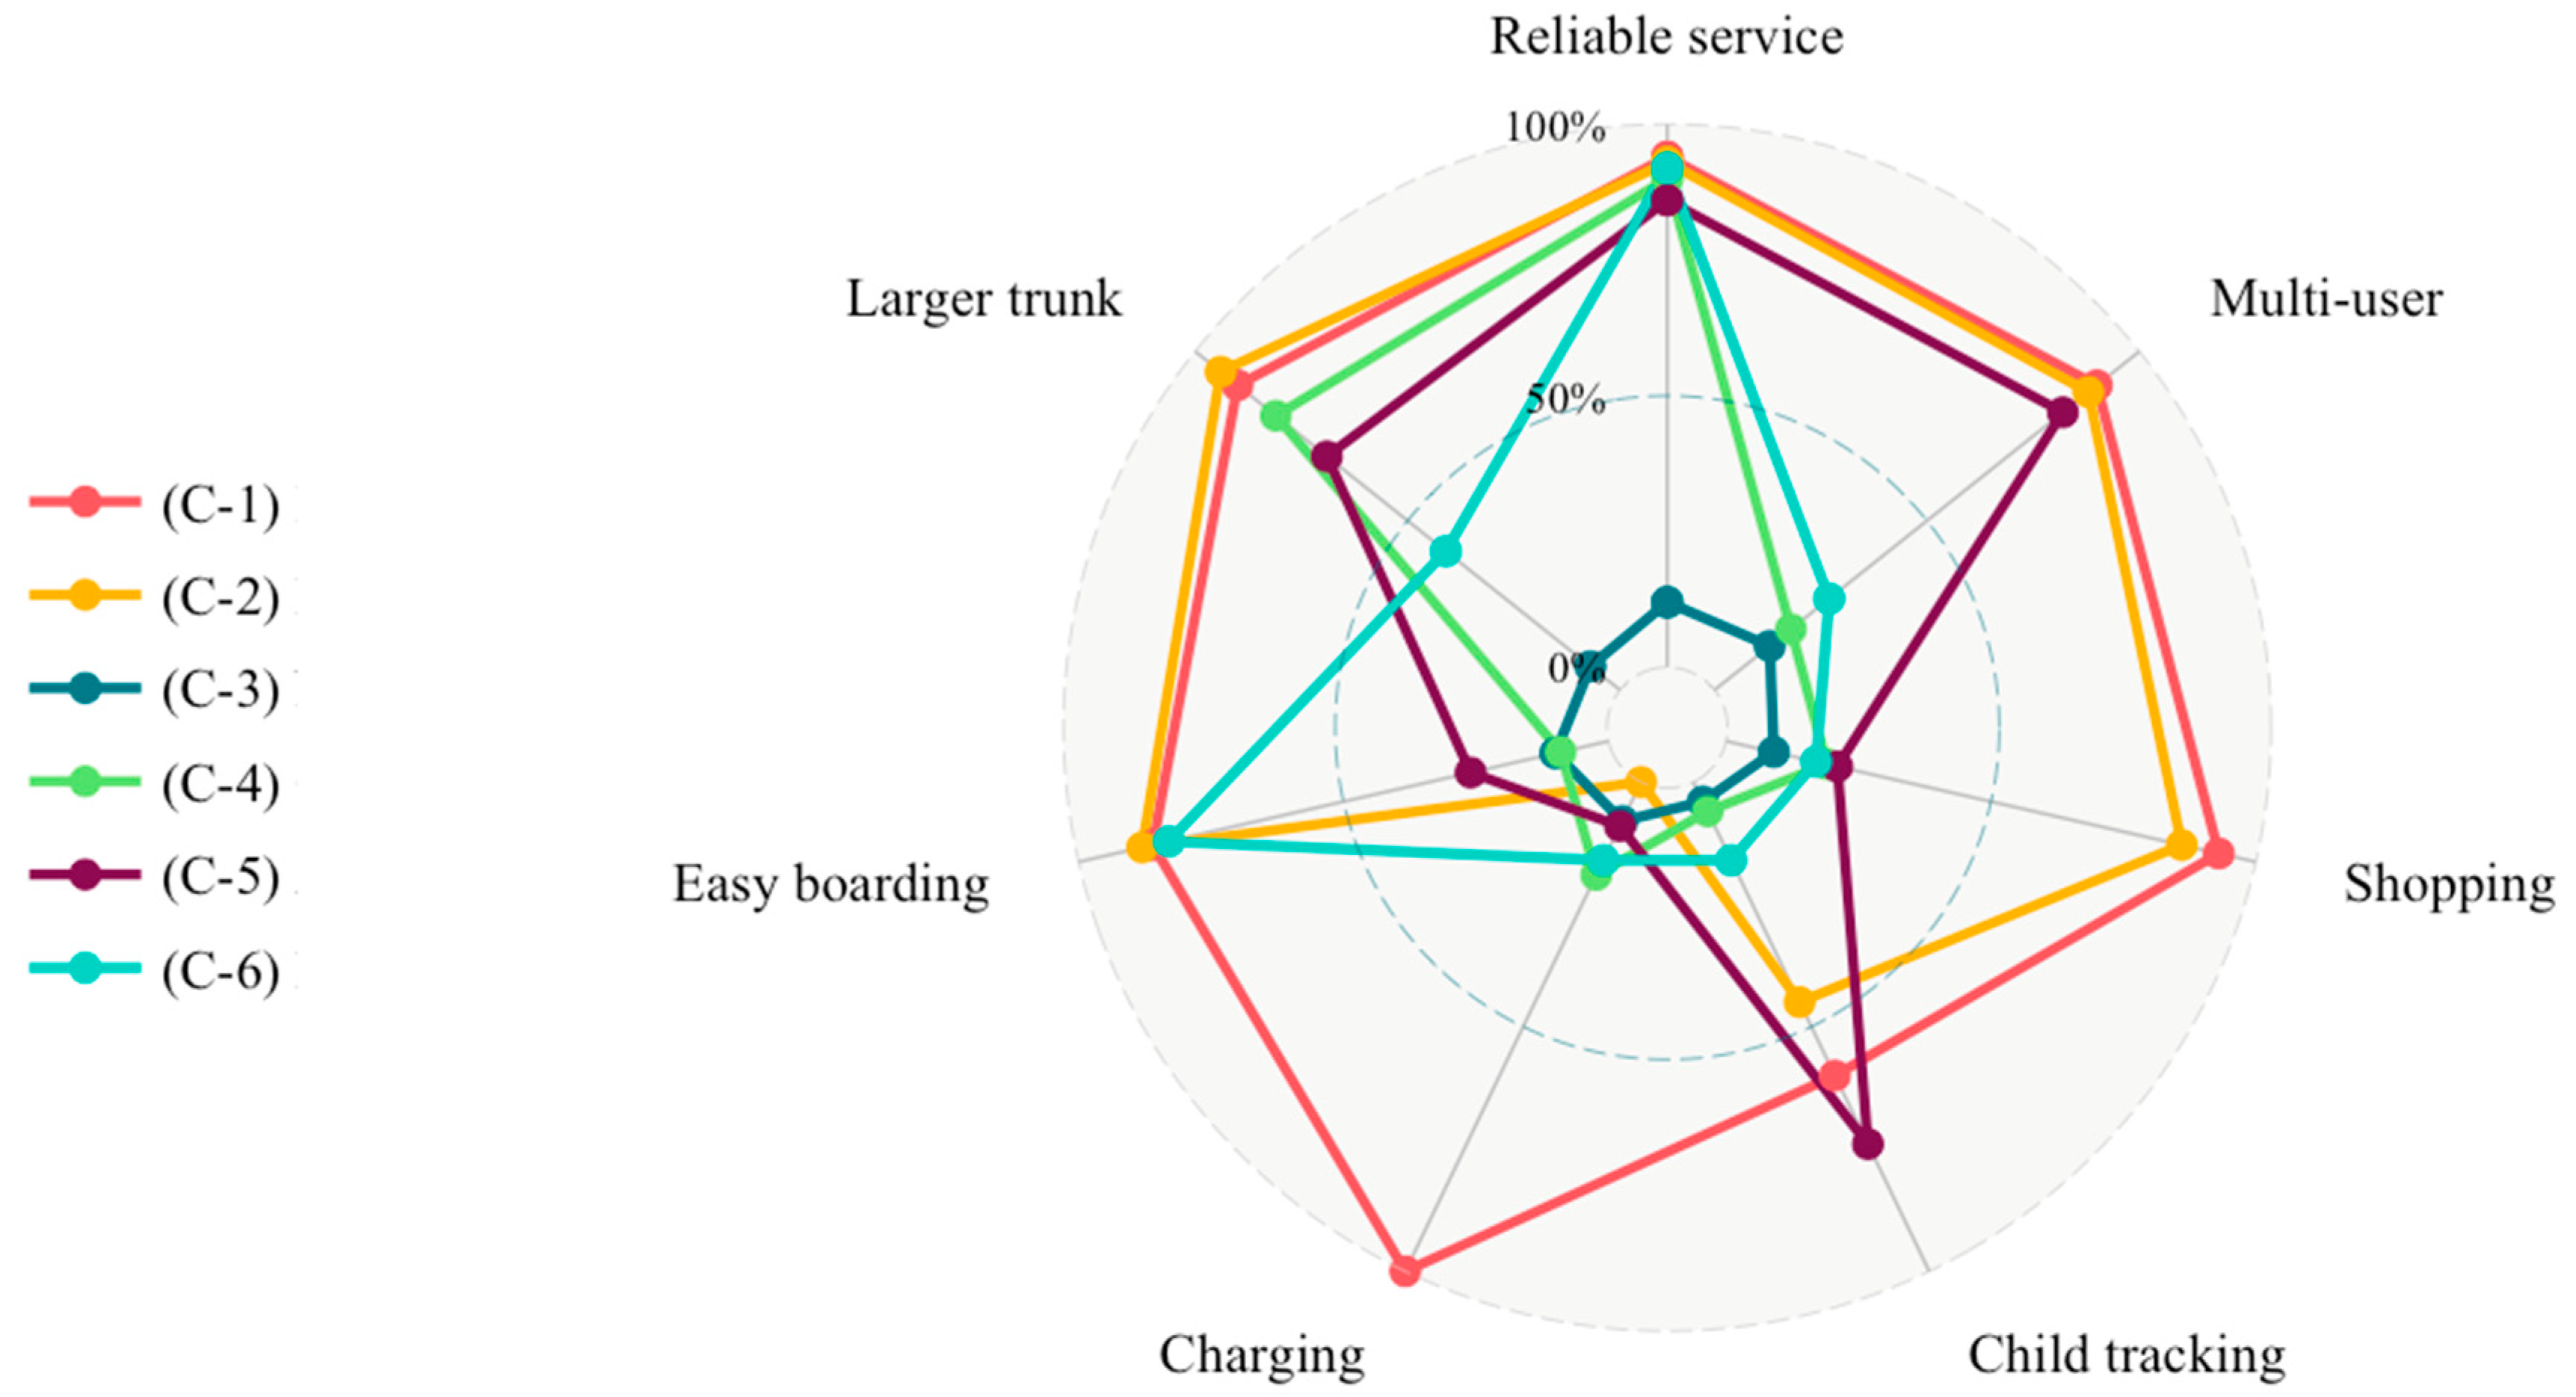
4.2. Cluster Name Definition
4.3. Statistical Interpretation
- Higher proportion of the younger generation (38%) than other clusters.
- Relatively high interest in SAVs (45%).
- Tends to express leisure-used function.
- This group has more elder-people (16%) than the others.
- Fewer single trips (17%) can be observed in this group compared to the remaining clusters.
- Employed occupation proportion (45%) in this cluster is the lowest among all groups.
- Corresponds to the relatively lower interest compare to the other groups.
- This cluster comprises mainly middle-aged people (73%).
- Relatively high proportion of employed people (63%).
- Low interest in SAVs (15%) compared to other groups.
- Corresponds to a more conservative way of use since only basic services are preferred.
- People in this cluster express a relatively high interest in SAVs (25%) compared to the “LI (C-3)” group (15%), while the statistical characteristics of the other variables are demonstrated to be similar.
- Higher incidence of having children (25%) than other clusters.
- Middle-aged (68%) people dominate this cluster.
- A certain percentage of people exhibit a high interest in SAVs (44%).
- People drive more frequently (40%) in this group than others.
- Consists of respondents who are generally middle-aged (72%), employed (72%), take trips alone (44%).
- Having some interest in SAVs (38%).
4.4. Correlation Analysis
- Young-generation customers, part-time workers, and students expressed positive correlations by selecting all services.
- Indicated interest in almost every service, with people in this cluster tending to travel with children or elders, which corresponds to the multi-user and multi-origin services.
- Homemakers and unemployed people showed a positive correlation with selecting shopping-related services.
- Positive coefficient of elders and the negative correlation of having children appeared to affect people’s decision of not selecting child tracking and in-vehicle charging services.
- Negative significant correlation of interest in SAVs.
- Middle-aged people, particularly employed respondents, were found to be less likely to select any services when considering SAVs.
- Expressed a similar inclination among all variables, with people in this cluster exhibiting a relatively small correlation coefficient of interest in SAVs
- Basic fundamental services were applied in this context (shorter waiting time, on time, and larger trunk were selected for this cluster).
- Having children tended to affect people when selecting SAV services.
- Positive influence on high frequent car use and homemakers compared to other clusters, although the correlation was weak at this point.
- Multi-user, multi-origin, and child tracking systems may be reasonable for this group when first attempting SAVs, particularly for households with children.
- Basic fundamental services for families, including shorter waiting time, on time, and larger trunk should also be provided for this group to maintain their daily obligations.
- People who are employees and usually take trips by themselves are more likely to be identified as this group.
- The selected services (shorter waiting time, on time, longer boarding time, and easy boarding) revealed that only functional services will be accepted by this cluster.
- Services that can ensure that the trip is on schedule and improvement of boarding services could eliminate the probability of missing SAVs, particularly for users who are heading to work places.
4.5. WTP for Services
5. Conclusions and Limitations
5.1. Conclusions
5.2. Limitations
Author Contributions
Funding
Acknowledgments
Conflicts of Interest
References
- Taxonomy, S.A.E. Definitions for Terms Related to On-Road Motor Vehicle Automated Driving Systems; J3016; SAE International Standard: Warrendale, PA, USA, 2014. [Google Scholar]
- Hao, M.; Yamamoto, T. Shared Autonomous Vehicles: A Review Considering Car Sharing and Autonomous Vehicles. Asian Trans. Stud. 2018, 5, 47–63. [Google Scholar]
- Fagnant, D.J.; Kockelman, K. Preparing a nation for autonomous vehicles: Opportunities, barriers and policy recommendations. Trans. Res. Part A Policy Pract. 2015, 77, 167–181. [Google Scholar] [CrossRef]
- Burns, L.D. Sustainable mobility: A vision of our transport future. Nature 2013, 497, 181–182. [Google Scholar] [CrossRef] [PubMed]
- Kek, A.; Cheu, R.; Chor, M. Relocation simulation model for multiple-station shared-use vehicle systems. J. Trans. Res. Board 2006, 1986, 81–88. [Google Scholar] [CrossRef]
- Barth, M.; Boriboonsomsin, K. Traffic congestion and greenhouse gases. Access Mag. 2009, 1, 26. [Google Scholar]
- Ford, H.J. Shared Autonomous Taxis: Implementing an Efficient Alternative to Automobile Dependency. Ph.D. Thesis, Princeton University, Princeton, NJ, USA, 2012. [Google Scholar]
- Kornhauser, A. Uncongested Mobility for All: New Jersey’s Area-Wide aTaxi System; Operations Research and Financial Engineering, Princeton University: Princeton, NJ, USA, 2013; Volume 23. [Google Scholar]
- Fagnant, D.J.; Kockelman, K.M.; Bansal, P. Operations of Shared Autonomous Vehicle Fleet for Austin, Texas, Market. J. Trans. Res. Board 2015, 98–106. [Google Scholar] [CrossRef]
- Howard, D.; Dai, D. Public perceptions of self-driving cars: The case of Berkeley, California. In Proceedings of the Transportation Research Board 93rd Annual Meeting, Washington, DC, USA, 12–16 January 2014; pp. 1–16. [Google Scholar]
- Kyriakidis, M.; Happee, R.; De Winter, J.C.F. Public opinion on automated driving: Results of an international questionnaire among 5000 respondents. Trans. Res. Part F Traffic Psychol. Behav. 2015, 32, 127–140. [Google Scholar] [CrossRef]
- König, M.; Neumayr, L. Users’ resistance towards radical innovations: The case of the self-driving car. Trans. Res. Part F Traffic Psychol. Behav. 2017, 44, 42–52. [Google Scholar] [CrossRef]
- Krueger, R.; Rashidi, T.H.; Rose, J.M. Preferences for shared autonomous vehicles. Trans. Res. Part C Emerg. Technol. 2016, 69, 343–355. [Google Scholar] [CrossRef]
- Bansal, P.; Kockelman, K.M.; Singh, A. Assessing public opinions of and interest in new vehicle technologies: An Austin perspective. Trans. Res. Part C Emerg. Technol. 2016, 67, 1–14. [Google Scholar] [CrossRef]
- MacQueen, J. Some methods for classification and analysis of multivariate observations. In Proceedings of the Fifth Berkeley Symposium on Mathematical Statistics and Probability, Berkeley, CA, USA, 18–21 July 1965; Volume 1, pp. 281–297. [Google Scholar]
- Huang, Z. Clustering large data sets with mixed numeric and categorical values. In Proceedings of the 1st Pacific-Asia Conference on Knowledge Discovery and Data Mining (PAKDD), Singapore, 23–24 February 1997; pp. 21–34. [Google Scholar]
- Huang, Z. Extensions to the k-means algorithm for clustering large data sets with categorical values. Data Min. Knowl. Discov. 1998, 2, 283–304. [Google Scholar] [CrossRef]
- Kaufman, L.; Rousseeuw, P.J. Partitioning around medoids (program pam). In Finding Groups in Data: An Introduction to Cluster Analysis; John Wiley & Sons, Inc.: Hoboken, NJ, USA, 1990; pp. 68–125. [Google Scholar]
- Ahmad, A.; Dey, L. A k-mean clustering algorithm for mixed numeric and categorical data. Data Knowl. Eng. 2007, 63, 503–527. [Google Scholar] [CrossRef]
- Sharma, N.; Gaud, N. K-modes Clustering Algorithm for Categorical Data. Int. J. Comput. Appl. 2015, 127, 1–6. [Google Scholar] [CrossRef]
- Kumar, V.; Kumar, S.; Singh, A.K. Outlier Detection: A Clustering-Based Approach. Int. J. Sci. Mod. Eng. (IJISME) 2013, 1, 16–19. [Google Scholar]
- Huang, J.Z. Clustering categorical data with k-Modes. In Encyclopedia of Data Warehousing and Mining, 2nd ed.; IGI Global: Hershey, PA, USA, 2009; pp. 246–250. [Google Scholar]
- R Core Team. R: A Language and Environment for Statistical Computing. R Foundation for Statistical Computing, Vienna, Austria. 2015. Available online: http://www.R-project.org/ (accessed on 10 June 2019).

| Variables | Levels | Percentage |
|---|---|---|
| Gender | Male | 47% |
| Age | Young (16 to 34 years old) | 29% |
| Middle age (35 to 64 years old) | 60% | |
| Elder (over 65 years old) | 11% | |
| Job | Employee | 51% |
| Part-time | 14% | |
| Student | 9% | |
| Homemaker | 21% | |
| Unemployed | 5% | |
| Have child | Yes | 14% |
| Trip with | Family member (less than 6 years old) | 13% |
| Family member (6 to 60 years old) | 41% | |
| Family member (over 60 years old) | 14% | |
| Friends | 8% | |
| Alone | 21% | |
| Others | 3% | |
| Car use frequency | High (at least 4 to 5 days per week) | 32% |
| Medium (1 to 3 days per week) | 29% | |
| Low (less than 1 day per week) | 39% | |
| Interest in SAVs 1 | High | 40% |
| Low | 60% |
| Service | Description | % 1 | WTP 2 | |
|---|---|---|---|---|
| M 3 | SD 4 | |||
| Short waiting time | Passengers wait for less than one minute to be picked up | 83% | 0.37 | 0.37 |
| On time | Difference between actual and expected arrival time is less than one minute | 82% | 0.39 | 0.38 |
| Larger trunk | Extra space for large luggage | 78% | 0.41 | 0.42 |
| Multi-origin | Sharing the same autonomous car with friends or colleagues from different origins to the same destination | 73% | 0.41 | 0.44 |
| Easy boarding | Providing a specially designed car for comfortable getting in/out | 72% | 0.30 | 0.45 |
| Multi-user | More than one users share one SAV to the same destination | 69% | 0.40 | 0.46 |
| Easy loading | Providing special equipment or design to assist with loading luggage | 69% | 0.30 | 0.46 |
| Keep car while shopping | Keeping your belongings in the autonomous car while shopping | 64% | 0.40 | 0.48 |
| Longer boarding time | Providing longer boarding time for passengers who have difficulty getting in/out (default boarding time is 20 s). | 60% | 0.26 | 0.49 |
| Child tracking | Tracking the movement of children (≥12 years old) when they are using AVs | 43% | 0.45 | 0.50 |
| Charging | Providing a charging service for electronic devices | 39% | 0.22 | 0.49 |
| Variables | Levels | C-1 | C-2 | C-3 | C-4 | C-5 | C-6 |
|---|---|---|---|---|---|---|---|
| Age | Young | 2% | 0% | 1% | 4% | 7% | 16% |
| Middle age | 2% | 1% | 0% | 6% | 14% | 16% | |
| Elder | 0% | 1% | 1% | 2% | 7% | 0% | |
| Job | Employed | 3% | 0% | 1% | 4% | 9% | 12% |
| Part-time | 1% | 1% | 1% | 3% | 17% | 1% | |
| Student | 0% | 1% | 1% | 1% | 6% | 2% | |
| Homemaker | 3% | 2% | 2% | 9% | 5% | 19% | |
| Unemployed | 0% | 1% | 1% | 1% | 14% | 0% | |
| Have child | Yes | 3% | 3% | 1% | 2% | 8% | 19% |
| Trip with | Child | 3% | 0% | 1% | 9% | 1% | 5% |
| Elder | 1% | 2% | 1% | 1% | 2% | 4% | |
| Alone | 3% | 2% | 1% | 3% | 8% | 10% | |
| Car frequency | High | 1% | 6% | 3% | 6% | 1% | 1% |
| Medium | 2% | 3% | 2% | 3% | 6% | 4% | |
| Low | 0% | 2% | 1% | 0% | 4% | 4% | |
| Interest in SAVs | Yes | 5% | 4% | 0% | 7% | 3% | 0% |
| Cluster | Size | Interest Services |
|---|---|---|
| C-1 | 36% | Interest in all SAV services |
| C-2 | 33% | Short waiting time; on time; larger trunk; multi-user; keep car while shopping; easy loading; multi-origin; longer boarding time; easy boarding |
| C-3 | 12% | No interest in selecting any SAV services |
| C-4 | 9% | Short waiting time; on time; larger trunk |
| C-5 | 7% | Short waiting time; on time; larger trunk; child tracking; multi-user; multi-origin |
| C-6 | 3% | Short waiting time; on time; longer boarding time; easy boarding |
| Variables | Levels | HI (C-1) | ESRMS (C-2) | LI (C-3) | SR (C-4) | SRMC (C-5) | ER (C-6) |
|---|---|---|---|---|---|---|---|
| Age | Young | 38% | 26% | 18% | 23% | 23% | 19% |
| Middle age | 52% | 58% | 73% | 68% | 68% | 72% | |
| Elder | 10% | 16% | 9% | 9% | 9% | 9% | |
| Job | Employed | 48% | 45% | 63% | 58% | 49% | 72% |
| Part-time | 17% | 14% | 11% | 13% | 12% | 09% | |
| Student | 12% | 7% | 9% | 9% | 5% | 9% | |
| Homemaker | 19% | 27% | 12% | 13% | 27% | 6% | |
| Unemployed | 4% | 8% | 5% | 7% | 6% | 3% | |
| Have child | Yes | 11% | 13% | 18% | 17% | 25% | 19% |
| Trip with | Child | 14% | 17% | 7% | 7% | 9% | 9% |
| Elder | 12% | 19% | 12% | 11% | 12% | 9% | |
| Alone | 19% | 17% | 27% | 26% | 18% | 44% | |
| Car frequency | High | 32% | 31% | 29% | 31% | 40% | 34% |
| Medium | 26% | 30% | 33% | 30% | 26% | 34% | |
| Low | 8% | 0% | 7% | 7% | 6% | 9% | |
| Interest in SAVs | Yes | 45% | 48% | 15% | 25% | 44% | 38% |
| Variables | Levels | HI (C-1) | ESRMS (C-2) | LI (C-3) | SR (C-4) | SRMC (C-5) | ER (C-6) |
|---|---|---|---|---|---|---|---|
| Age | Young | 15 | −4 | −9 | −4 | −3 | −4 |
| Middle age | −11 | −3 | 10 | 5 | 4 | 4 | |
| Elder | −5 | 10 | −3 | −2 | −2 | −1 | |
| Job | Employed | −4 | −8 | 9 | 5 | −1 | 8 |
| Part-time | 6 | −1 | −4 | −1 | −2 | −2 | |
| Student | 8 | −6 | 0 | 0 | −4 | 0 | |
| Homemaker | , | 12 | −8 | −6 | 5 | −6 | |
| Unemployed | −6 | 6 | −1 | 2 | 1 | −2 | |
| Have child | Yes | −7 | −3 | 4 | 2 | 9 | 2 |
| Trip with | Child | 1 | 9 | −6 | −5 | −3 | −2 |
| Elder | −5 | 10 | −2 | −3 | −2 | −3 | |
| Alone | −3 | −6 | 5 | 4 | −2 | 10 | |
| Car frequency | High | −1 | −1 | −2 | 0 | 5 | 1 |
| Medium | −4 | 2 | 3 | 1 | −2 | 2 | |
| Low | 0 | 3 | −3 | −1 | −2 | 1 | |
| Interest in SAVs | Yes | 7 | 11 | −19 | −10 | 2 | −1 |
| HI (C-1) | ESRMS (C-2) | LI (C-3) | SR (C-4) | SRMC (C-5) | ER (C-6) | |
|---|---|---|---|---|---|---|
| On time | 0.38 | 0.34 | 0.15 | 0.39 | 0.38 | 0.67 |
| Short waiting time | 0.39 | 0.35 | 0.13 | 0.38 | 0.37 | 0.60 |
| Multi-user | 0.49 | 0.50 | 0.18 | 0.36 | 0.45 | 0.39 |
| Multi-origin | 0.49 | 0.50 | 0.11 | 0.30 | 0.48 | 0.53 |
| Keep car while shopping | 0.46 | 0.50 | 0.22 | 0.35 | 0.40 | 0.44 |
| Easy loading | 0.40 | 0.41 | 0.10 | 0.29 | 0.29 | 0.27 |
| Easy boarding | 0.39 | 0.38 | 0.10 | 0.28 | 0.30 | 0.35 |
| Charging | 0.30 | 0.23 | 0.13 | 0.22 | 0.19 | 0.24 |
| Child tracking | 0.58 | 0.50 | 0.41 | 0.49 | 0.39 | 0.36 |
| Longer boarding time | 0.29 | 0.32 | 0.07 | 0.31 | 0.24 | 0.32 |
| Larger trunk | 0.50 | 0.51 | 0.16 | 0.44 | 0.44 | 0.40 |
| Bundle 3 | 4.67 | 4.54 | 1.76 | 3.81 | 3.93 | 4.57 |
© 2019 by the authors. Licensee MDPI, Basel, Switzerland. This article is an open access article distributed under the terms and conditions of the Creative Commons Attribution (CC BY) license (http://creativecommons.org/licenses/by/4.0/).
Share and Cite
Hao, M.; Li, Y.; Yamamoto, T. Public Preferences and Willingness to Pay for Shared Autonomous Vehicles Services in Nagoya, Japan. Smart Cities 2019, 2, 230-244. https://doi.org/10.3390/smartcities2020015
Hao M, Li Y, Yamamoto T. Public Preferences and Willingness to Pay for Shared Autonomous Vehicles Services in Nagoya, Japan. Smart Cities. 2019; 2(2):230-244. https://doi.org/10.3390/smartcities2020015
Chicago/Turabian StyleHao, Mingyang, Yanyan Li, and Toshiyuki Yamamoto. 2019. "Public Preferences and Willingness to Pay for Shared Autonomous Vehicles Services in Nagoya, Japan" Smart Cities 2, no. 2: 230-244. https://doi.org/10.3390/smartcities2020015
APA StyleHao, M., Li, Y., & Yamamoto, T. (2019). Public Preferences and Willingness to Pay for Shared Autonomous Vehicles Services in Nagoya, Japan. Smart Cities, 2(2), 230-244. https://doi.org/10.3390/smartcities2020015