Article

Ambient Vibration Testing of a Pedestrian Bridge Using Low-Cost Accelerometers for SHM Applications

School of Civil and Environmental Engineering, National University of Sciences and Technology, Sector H-12, Islamabad 44000, Pakistan
*
Author to whom correspondence should be addressed.
Smart Cities 2019, 2(1), 20-30; https://doi.org/10.3390/smartcities2010002
Submission received: 17 November 2018 / Revised: 25 December 2018 / Accepted: 27 December 2018 / Published: 3 January 2019

Abstract

:
Damage detection and structural health monitoring have always been of great importance to civil engineers and researchers. Vibration-based damage detection has several advantages compared to traditional methods of non-destructive evaluation, such as ground penetrating radar (GPR) or ultrasonic testing, since they give a global response and are feasible for large structures. Damage detection requires a comparison between two systems states, the baseline or “healthy state”, i.e., the initial modal parameters, and the damaged state. In this study, system identification (SI) was carried out on a pedestrian bridge by measuring the dynamic response using six low-cost triaxial accelerometers. These low-cost accelerometers use a micro-electro-mechanical system (MEMS), which is cheaper compared to a piezoelectric sensor. The frequency domain decomposition algorithm, which is an output-only method of modal analysis, was used to obtain the modal properties, i.e., natural frequencies and mode shapes. Three mode shapes and frequencies were found out using system identification and were compared with the finite element model (FEM) of the bridge, developed using the commercial finite element software, Abaqus. A good comparison was found between the FEM and SI results. The frequency difference was nearly 10%, and the modal assurance criterion (MAC) of experimental and analytical mode shapes was greater than 0.80, which proved to be a good comparison despite the small number of accelerometers available and the simplifications and idealizations in FEM.

1. Introduction

Engineers and researchers have always been concerned with the damage identification and health monitoring of structures [1,2]. Damage is described as changes in a system that adversely affects the structure’s future and current performance. Damage is not limited to changes in the material level but also in the boundary conditions and system connectivity [3]. Structural health monitoring has been defined in the literature as “the use of in-situ, non-destructive sensing and analysis of system characteristics, including structural response, for the purpose of detecting changes, which may indicate damage or degradation” [4]. Structural health monitoring has the purpose of verifying whether damage exists, locating the damage, determining its type, and intensity [5].
Non-destructive evaluation (or damage detection techniques) is categorized as either local or global damage detection techniques. Traditional damage detection techniques, such as ground penetrating radar (GPR)and ultrasonic testing, gives only a local response of a structure, where damage location is known a priori, and is not feasible for large structures. Vibration-based damage detection (VBDD) conquers the aforementioned problems by giving a global response, being suitable for large structures, and having the ability to carry out continuous health monitoring. The main theoretical background behind vibration-based damage detection is that the properties of a structure, i.e., mass, stiffness, and damping, are affected by induced damages. These damages change the observable modal parameters, i.e., natural frequencies and mode shapes [6]. VBDD has been successfully implemented in aerospace structures, offshore oil rigs, and civil structures, such as bridges and buildings. Several widely accepted fundamental axioms of structural health monitoring (SHM) have also been identified which state that each material has inherent flaws or defects [7]. Therefore, damage detection requires a comparison of the two system states [8]. In order to identify structural parameters and structural responses, system identification is carried out based on a set of inputs and outputs in a system [9].
Some basic steps for carrying out the system identification of structures have been stated in the literature [10]. The steps include a priori modelling, testing, processing of data, calibration, and utilization of the developed model [11]. Experimental modal analysis needs to be carried out to find out the modal parameters, i.e., the mode shapes and natural frequency. There are two types of experimental modal analysis: (i) Traditional modal analysis, which uses the correlation between the input excitations and output response acceleration signals to find out the modal parameters; and (ii) operational modal analysis (OMA), which only uses output response signals to find out the modal properties. It is also known as “output only” and “ambient modal analysis” [12]. Operational modal analysis has various benefits compared to traditional modal analysis, as the input does not need to be measured, forced vibration is not required, and it is cheaper and more feasible. OMA is divided into two domains, i.e., the time and frequency domain. The frequency domain is further divided into techniques such as peak picking, frequency domain decomposition [13], and enhanced frequency domain decomposition [14]; whereas the time domain has algorithms and techniques such as stochastic sunspace identification (SSI) [15], the natural excitation technique (NeXT) [16], etc.
With the recent advances in electronics, new types of sensors for structural health monitoring and modal analysis are being manufactured and utilized [17]. Wired communication is being replaced using wireless communication sensors, as they significantly reduce the cost of the health monitoring system [18] and have reached a level where they can be implemented on full-scale structures [19]. Class A, B, and C accelerometers have been defined by Advanced National Seismic System (ANSS) according to their performance. The cost of a Class A accelerometer ranges from $2000–4000, Class B from $500–1000, and Class C from $100–200. [20] Similarly, micro-electro-mechanical systems (MEMS) are also being developed, and are said to be the future of vibration analysis as they are cheaper compared to piezoelectric sensors but show similar results [21]. MEMS have been considered as suitable for machinery fault detection, with the benefits of being cheaper, smaller in size, more mobile, and more flexible compared to the current sensors [22,23]. Piezoelectric sensor transducers are also increasingly being used at the laboratory scale for experimental modal analysis [24,25]. Similarly, the cost of health monitoring is also being decreased by using a limited and optimum number of sensors [26,27].
In the current study, System Identification (SI) was carried out on a 9.8 meter-long, double-tee beam used as a Pedestrian Bridge at the National University of Science and Technology (NUST) in Islamabad, Pakistan for the purposes of structural health monitoring. The dynamic response of the bridge was measured using low-cost Class C MEMS tri-axial accelerometers. The details of testing, including instrumentation, use of FEM in SI, application of load, and data preprocessing are discussed. The only significant problem faced in this study by using low-cost, wireless USB-type accelerometers was the issue of time lag or synchrony between different accelerometers, as each accelerometer had its own internal time clock. This issue was successfully resolved by realigning the time histories using cross-correlation, which will be discussed later. Frequency domain decomposition (FDD) was used to obtain the modal properties, i.e., natural frequencies and mode shapes. The mode shapes and frequencies found using system identification were further compared with the FEM of the bridge.

2. Bridge Description

The bridge selected for system identification was a pedestrian bridge linking hostels with the cafeteria/departments located at the NUST Campus in Islamabad. The bridge was used by a number of pedestrians commuting daily from hostels located at the south of the bridge to their respective departments and cafeteria which are located north of the bridge. The bridge was a precast, double-tee reinforced concrete beam simply supported at the ends. The bridge had a clear span of 9.8 m, and the cross-section was as shown in Figure 1a.

3. System Identification

3.1. Finite Element Model

A well-defined finite element model is the basis of VBDD. The finite element model is conventionally used to figure out the frequency bandwidth of interest and the corresponding mode shapes. [28] A finite element model for this bridge was developed on Abaqus, a commercial finite element (FE) software with pin–pin end conditions and by using linear isotropic properties of concrete. The properties of concrete were taken as shown in Table 1.
A simplified one-dimensional model was developed, as the aim and scope were to capture only the vertical mode shapes of the bridge. The software did not support the desired cross-section of the bridge, i.e., double T with the tapering web, when a beam element is used. Therefore, a generalized beam section was used by the calculation of Moments of Inertias and Torsional Coefficient. The bridge was modeled as an Abaqus type B21 beam element. The beam was divided into 98 elements with 295 nodes and an approximate global size of 0.1 m.

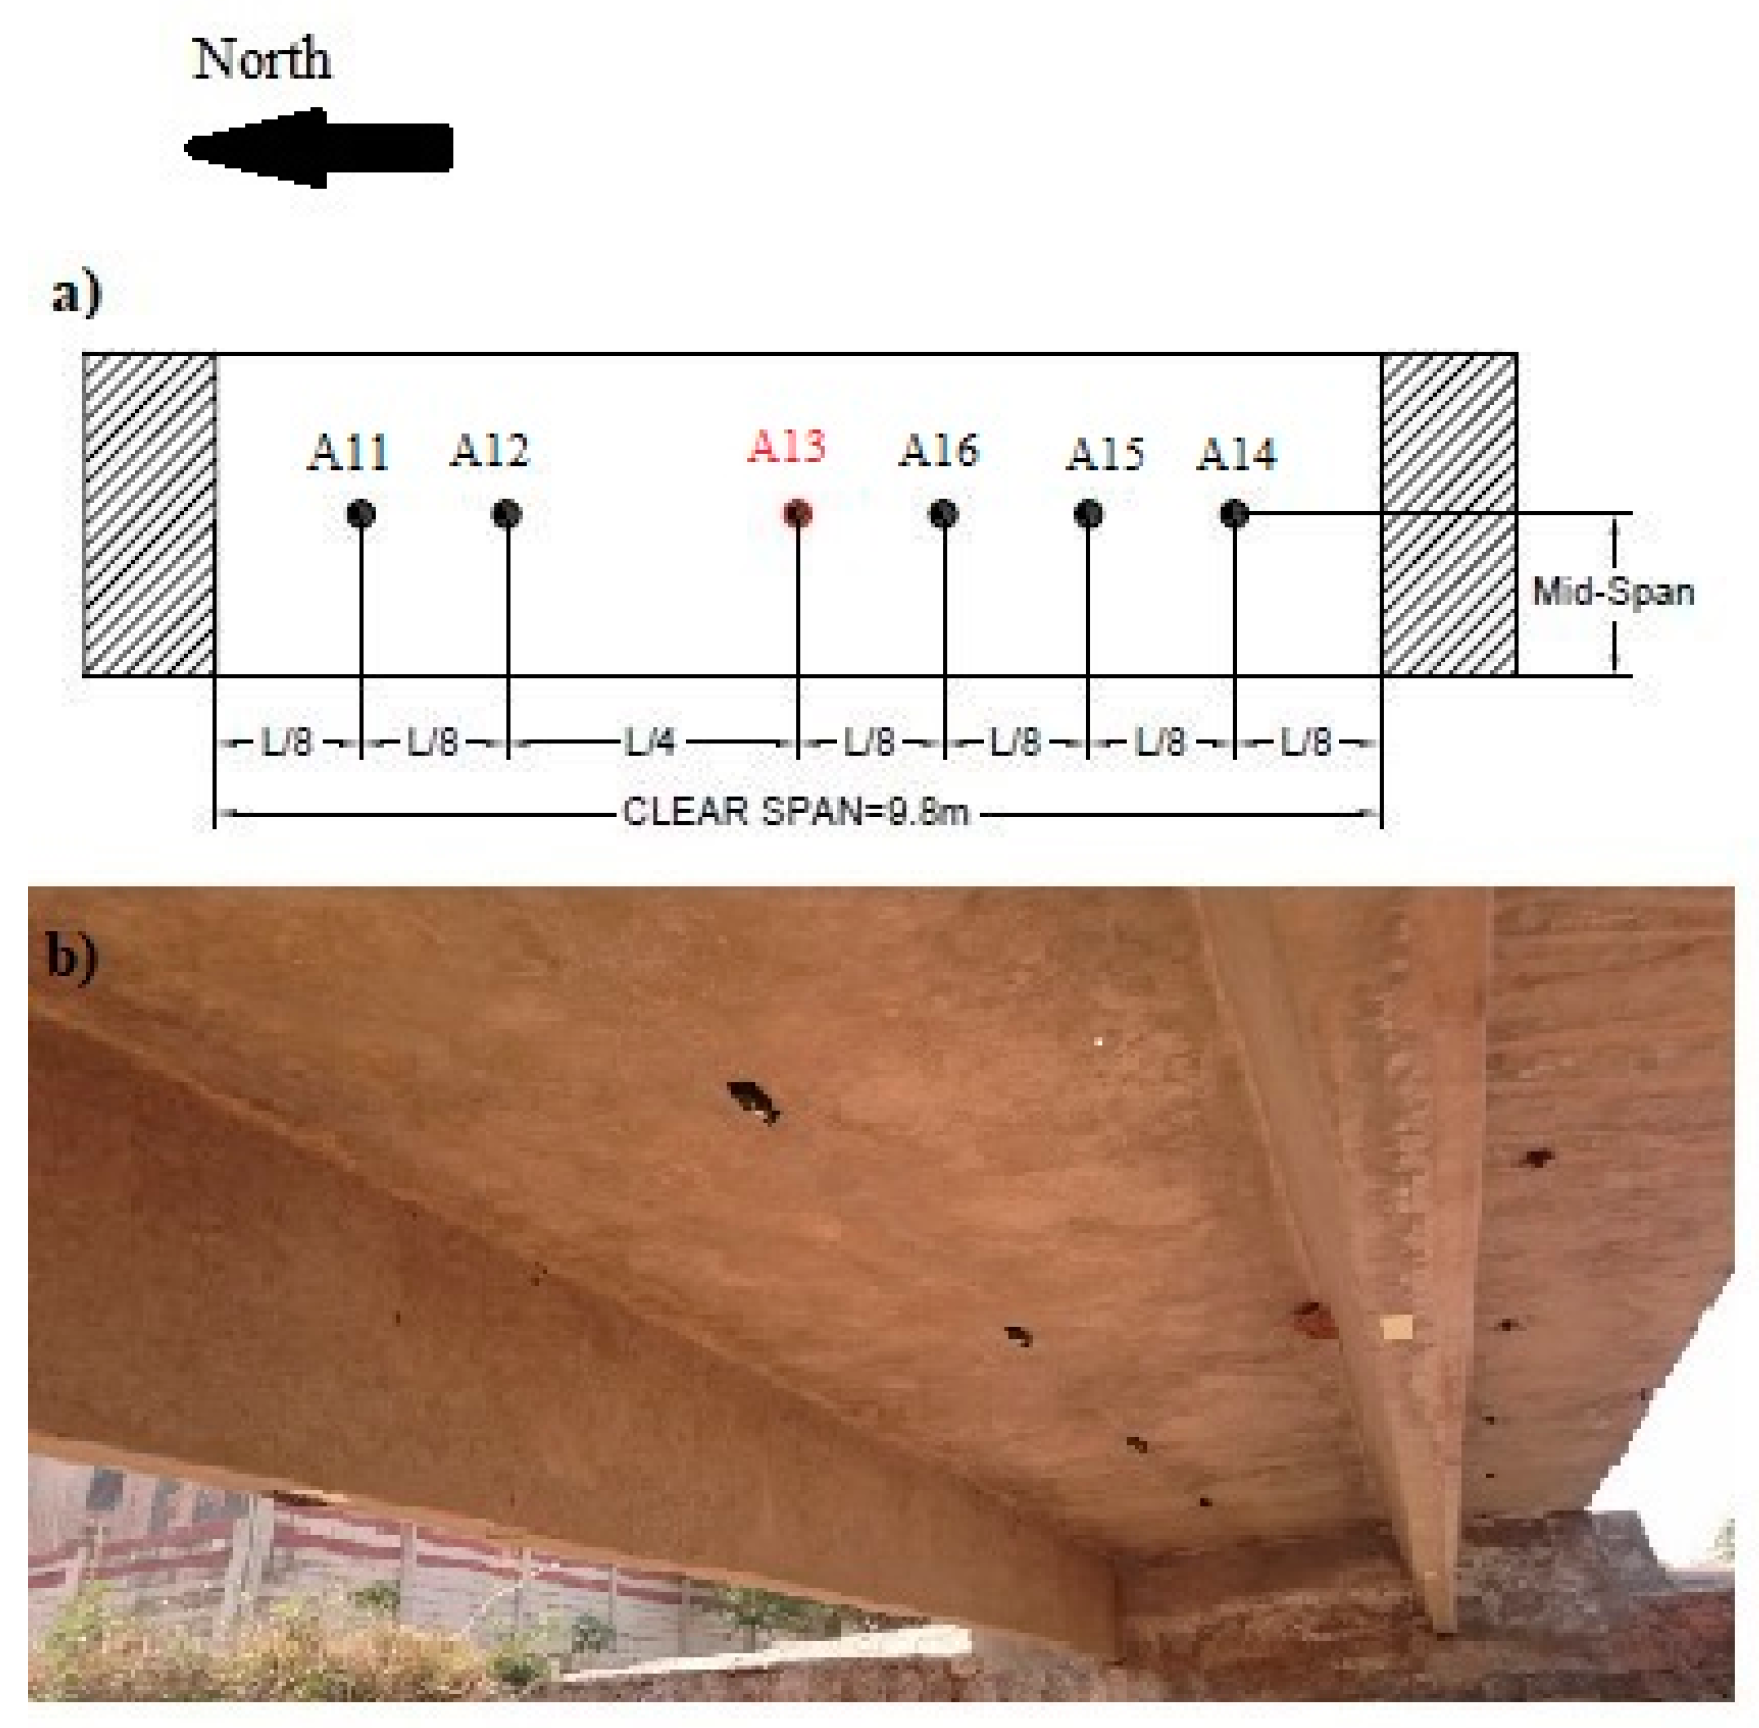
3.2. Instrumentation
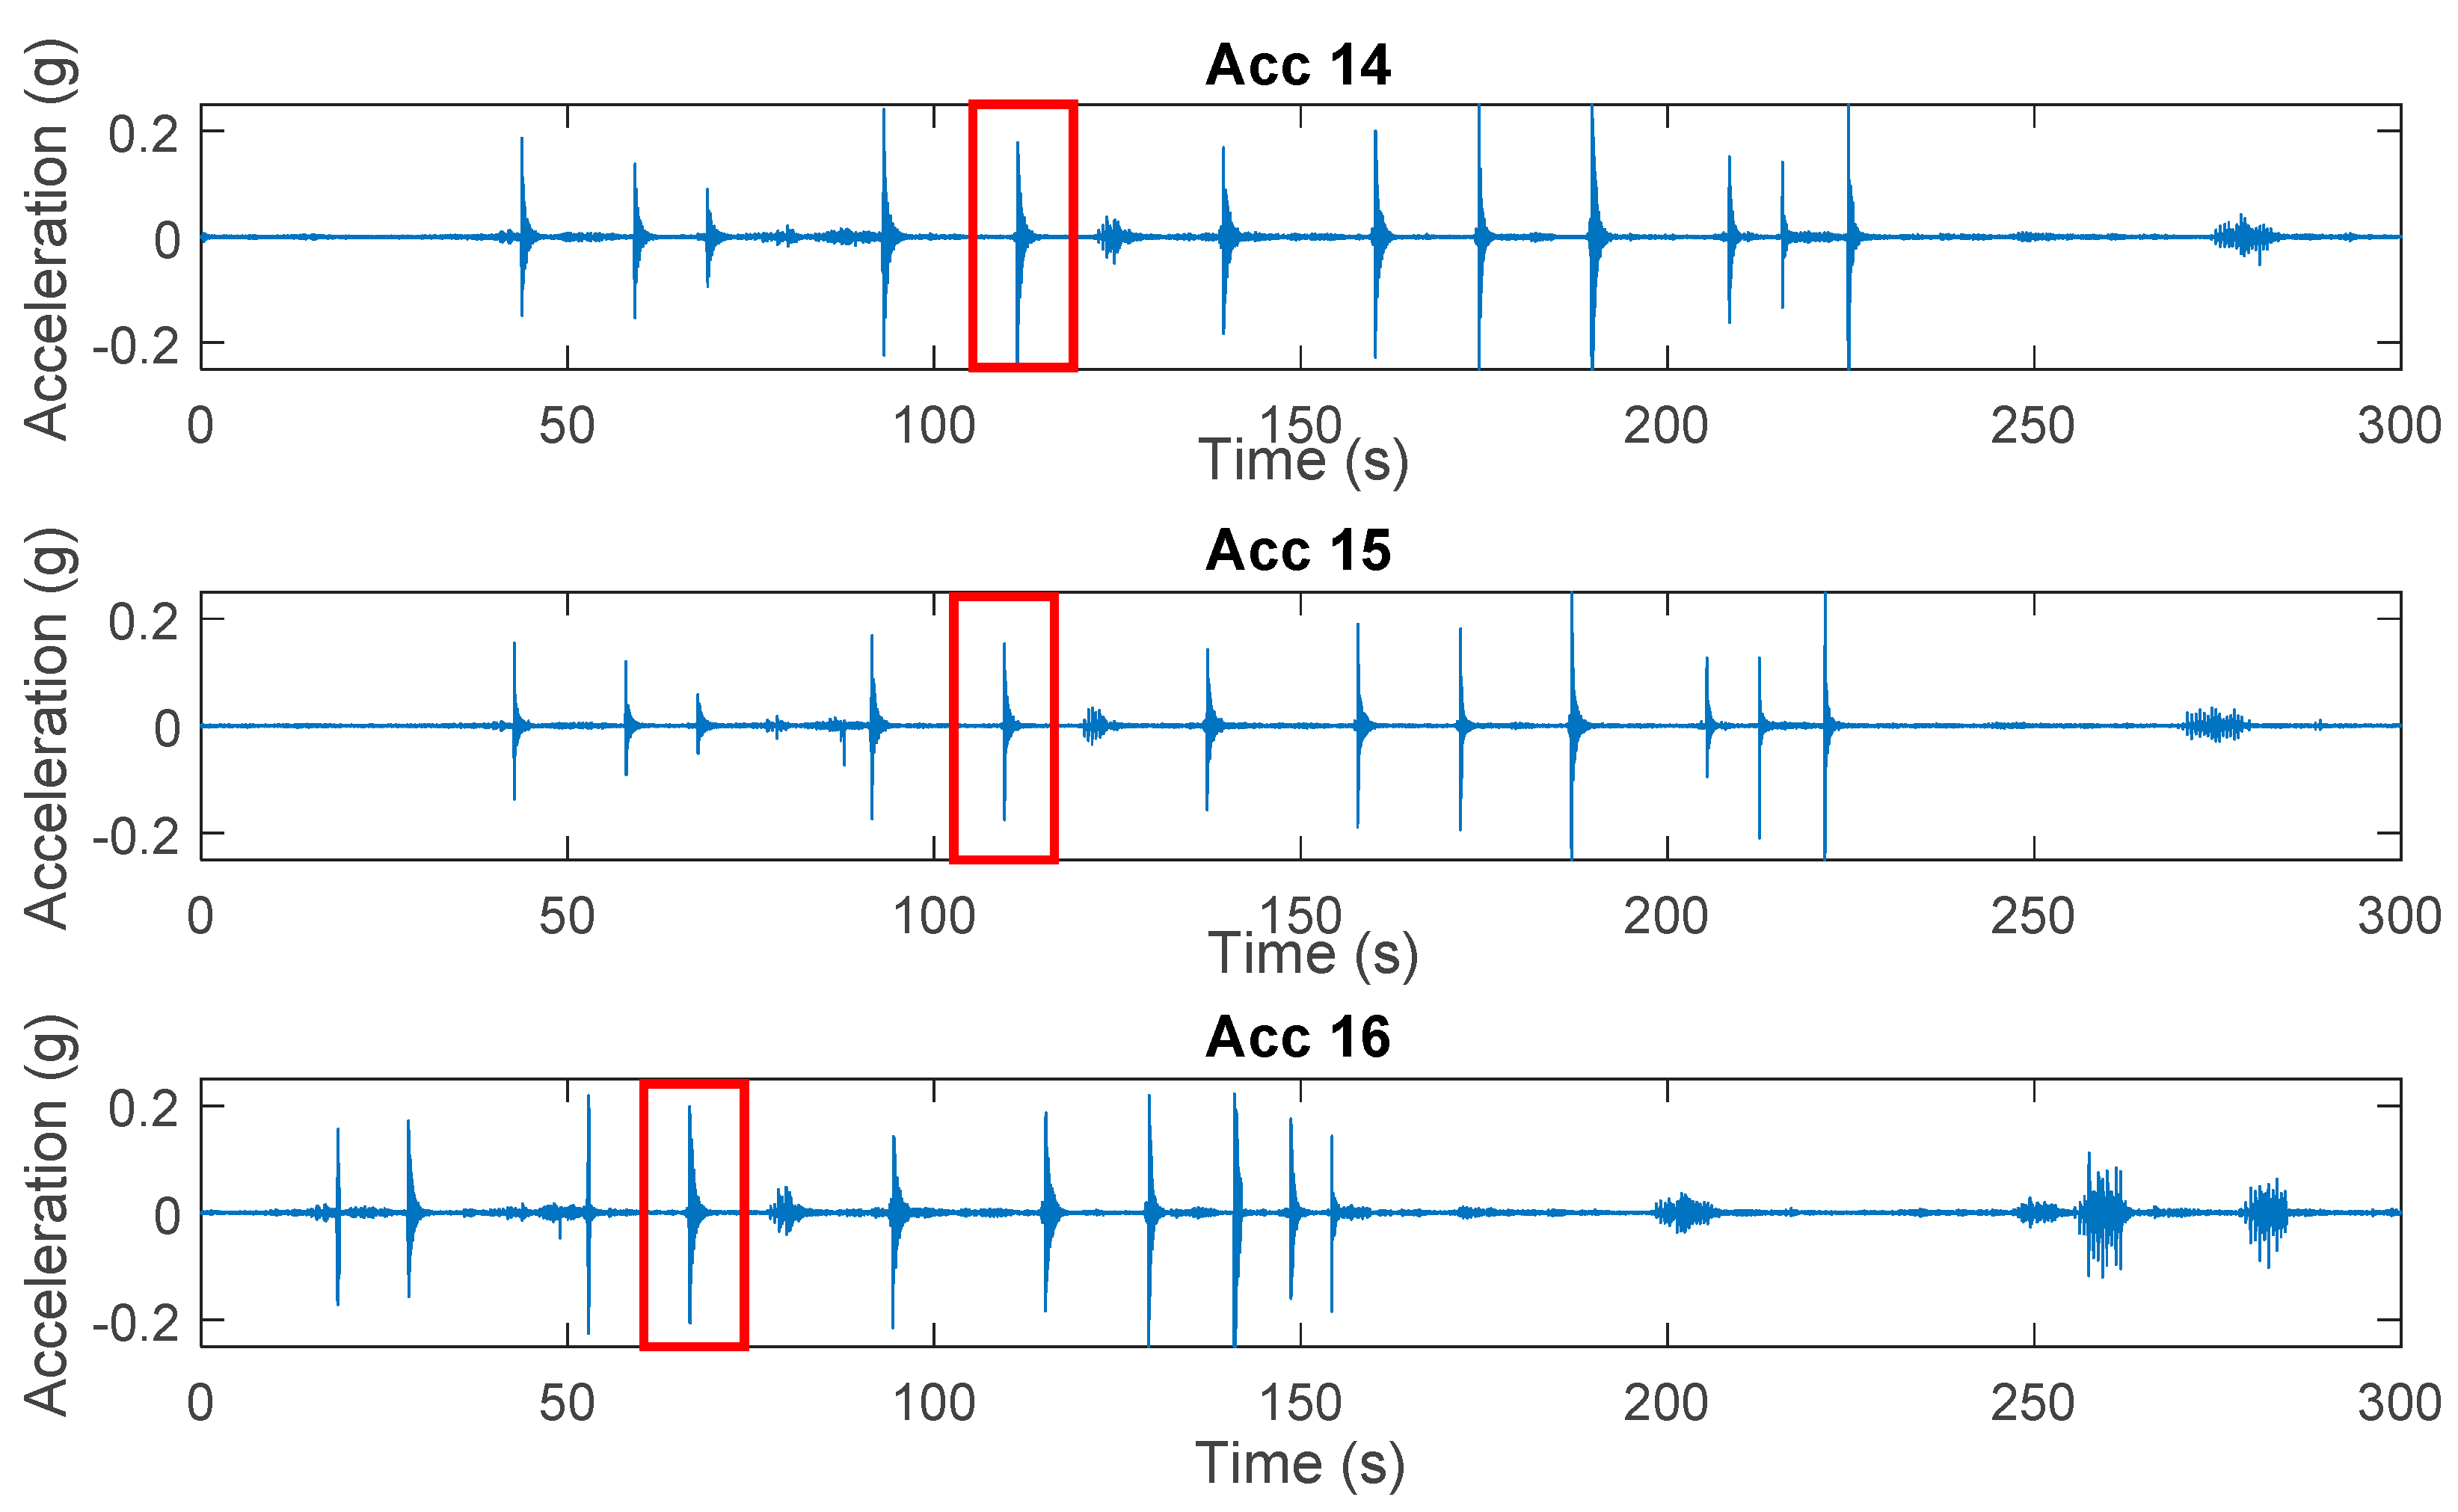
The Accelerometer Model X2-2 was used in this study, which is manufactured by Gulf Coast Data Concepts, and is a Class C MEMS accelerometer at a price of $150 [29]. Model X2-2 is a triaxial accelerometer with high sensitivity and an adjustable sampling rate with a maximum of 512 samples per second and a minimum of 8 samples per second. The model uses a Kionix KXRB5-2050 3-axis accelerometer sensor where the output is oversampled and passed through a high-pass Finite Impulse Response (FIR) filter. Data is stored in a removable secure digital (SD) card in the form of comma-separated values CSV files and is transferred to a computer using a USB port.
Experimentation was carried out using six accelerometers. They were attached using double-sided tape on the bottom side of the bridge and were attached in the center of the bridge to avoid any torsion and to capture only the vertical mode shapes. There were no issues of attachment, as the bridge surface was rough. Therefore, the adherence of accelerometers using double-sided tape was rigid and close to ideal conditions. The FEM mode shapes of the bridge showed maximum deformation occurring at the mid-span for the first mode shape, 0.25 and 0.75 of the bridge length for the second mode shape, and at 0.33, 0.66, and 0.5 of the bridge length for the third mode shape. As the sensors were to be placed at the critical nodes, the accelerometers were attached on the quarters and mid-span of the bridge, and the remaining three accelerometers were attached with equal spacing, as shown in Figure 2.

3.3. Testing

Experimentation was carried out for 30 min at a sampling rate of 256 Hz. Time was calculated using Equation (1), i.e., the recommended time required for operational modal analysis, as suggested by Brincker and Rune [30].
T r e c o m m e n d e d = 200 ζ f m i n
The damping ratio ( ζ ) was assumed to be 5%, which is an empirical for civil engineering structures such as bridges. The least frequency ( f m i n ) was found out to be 9.858 Hz from the FEM, giving a recommended total testing time of approximately 400 s. However, as pedestrians are not always walking on the bridge and in order to have more data, the test was carried out for 30 min. Similarly, Brincker and Rune [30] also suggested that the sampling rate should be kept at least 2.4 times the highest frequency being captured. Therefore, the sampling rate was set to 256 Hz, the highest targeted frequency being 85.42 Hz.
Ambient excitation needed to be provided to the bridge. Bridges are usually excited by traffic, i.e., the movement of cars and vehicles; pedestrian bridges are excited in a similar manner, i.e., by the movement of pedestrians. In order to excite the selected pedestrian bridge, artificial loading was applied by jumping, running, and walking on the bridge [31]. The best decay response was due to a single person jumping. The overloading of the bridge due to high pedestrian traffic caused the accelerometer to capture a lot of noise and the frequency response had less sharp and identifiable peaks.

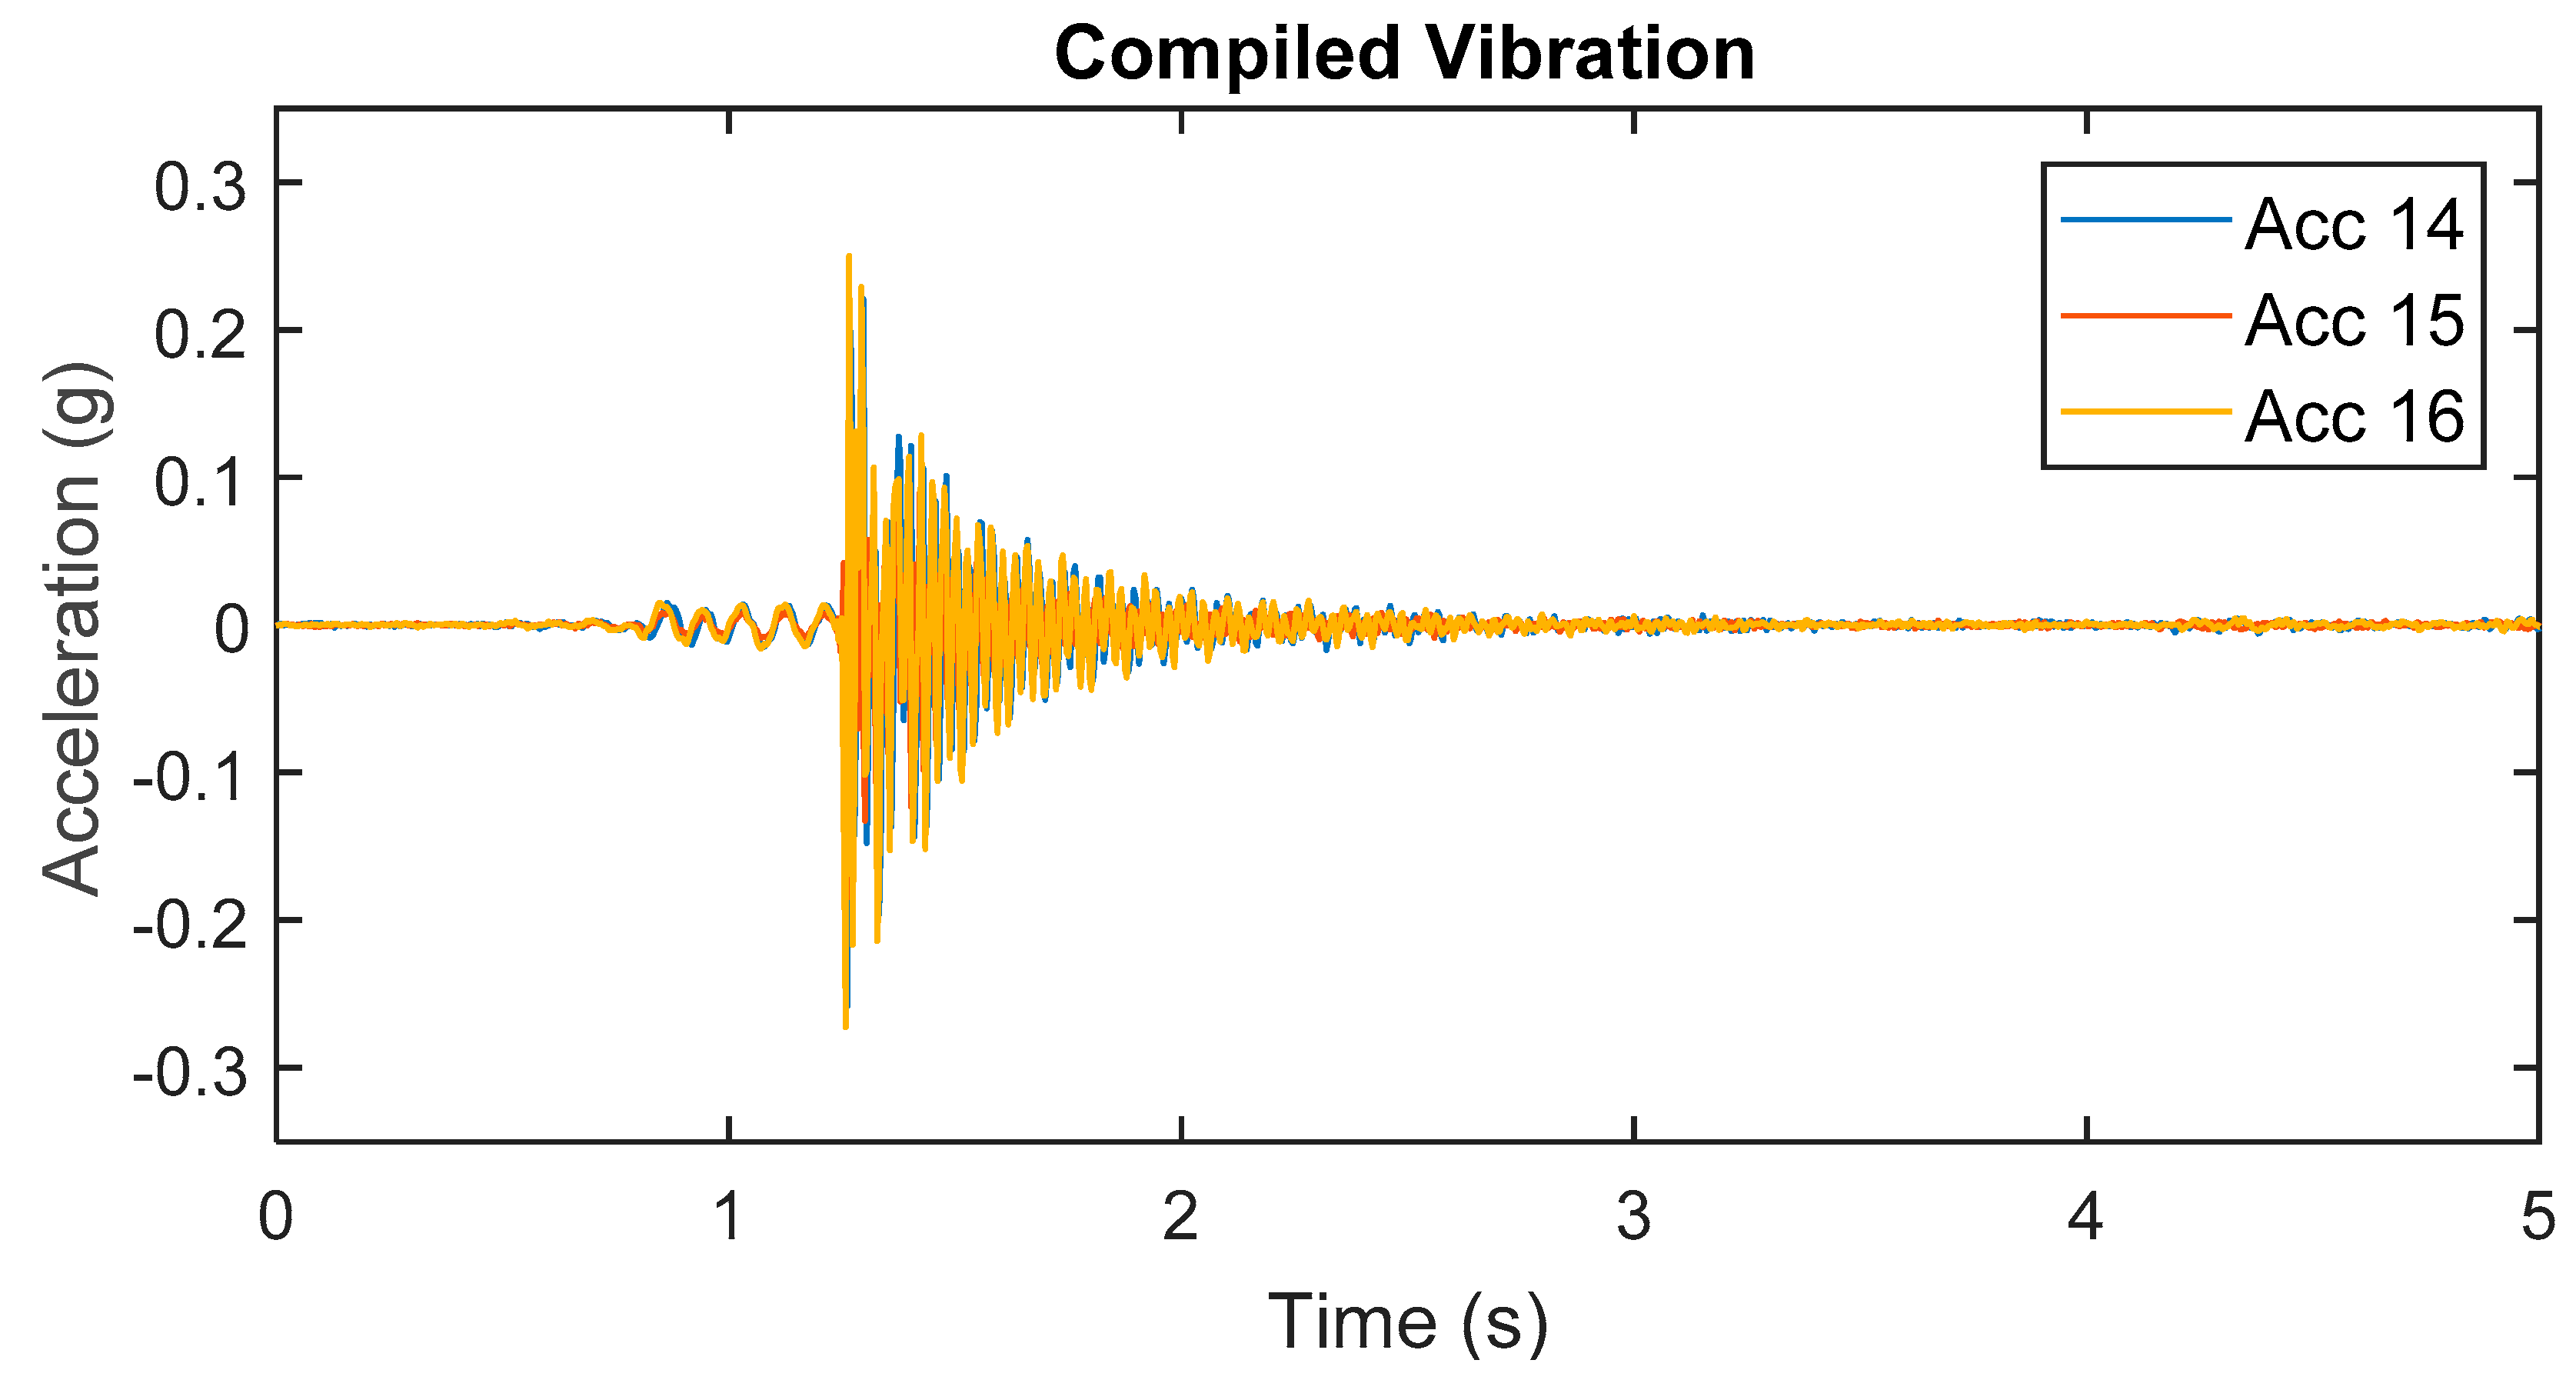
3.4. Data Pre-Processing

After the experimentation was carried out, the data from the accelerometers was extracted to a workstation. The data was stored in a CSV file, which contained 5 min of acceleration data in voltage units with X, Y, and Z axis headers. The first step was to import the relevant data into MATLAB® and concatenate a file of 5 min long to obtain a complete time history of the given accelerometer in a particular axis. The initial processing step was to remove the linear trend and the initial bias in the data by using the detrend function in MATLAB; the accelerometer voltage counts were then converted into acceleration units (g). At high sensitivity, 1 g (gravitational unit) was represented by 13,108 voltage counts. After individual time histories from different accelerometers were compiled, there was an issue of time lag and synchrony, as each accelerometer had its own internal time clock and a time drift.
In order to overcome time lag, vibration chunks were cut from the complete time history and the time lag was found for each different vibration. There are various techniques available to find out the time delay [32]. The time domain approximation method is used by selecting a reference accelerometer and finding out the cross-correlation between the reference and other accelerometers, which gives the time lag for each accelerometer. This time lag is used to realign the time history of the vibration chunks from different accelerometers. Cross-Correlation (XCOR in MATLAB) finds out the time delay for the impulse to start. Therefore, this method worked accurately on decay response, which was caused by jumping on the bridge. Several vibrations were picked, realigned, and then concatenated to be used for system identification. The red box in Figure 3 shows a selected vibration chunk, and Figure 4 shows the realigned vibration chunk for the same accelerometers, i.e., A14, A15, and A16. The accelerometer A13’s (marked as red in Figure 2) data was discarded due to high levels of noise, leaving behind the data of five accelerometers.

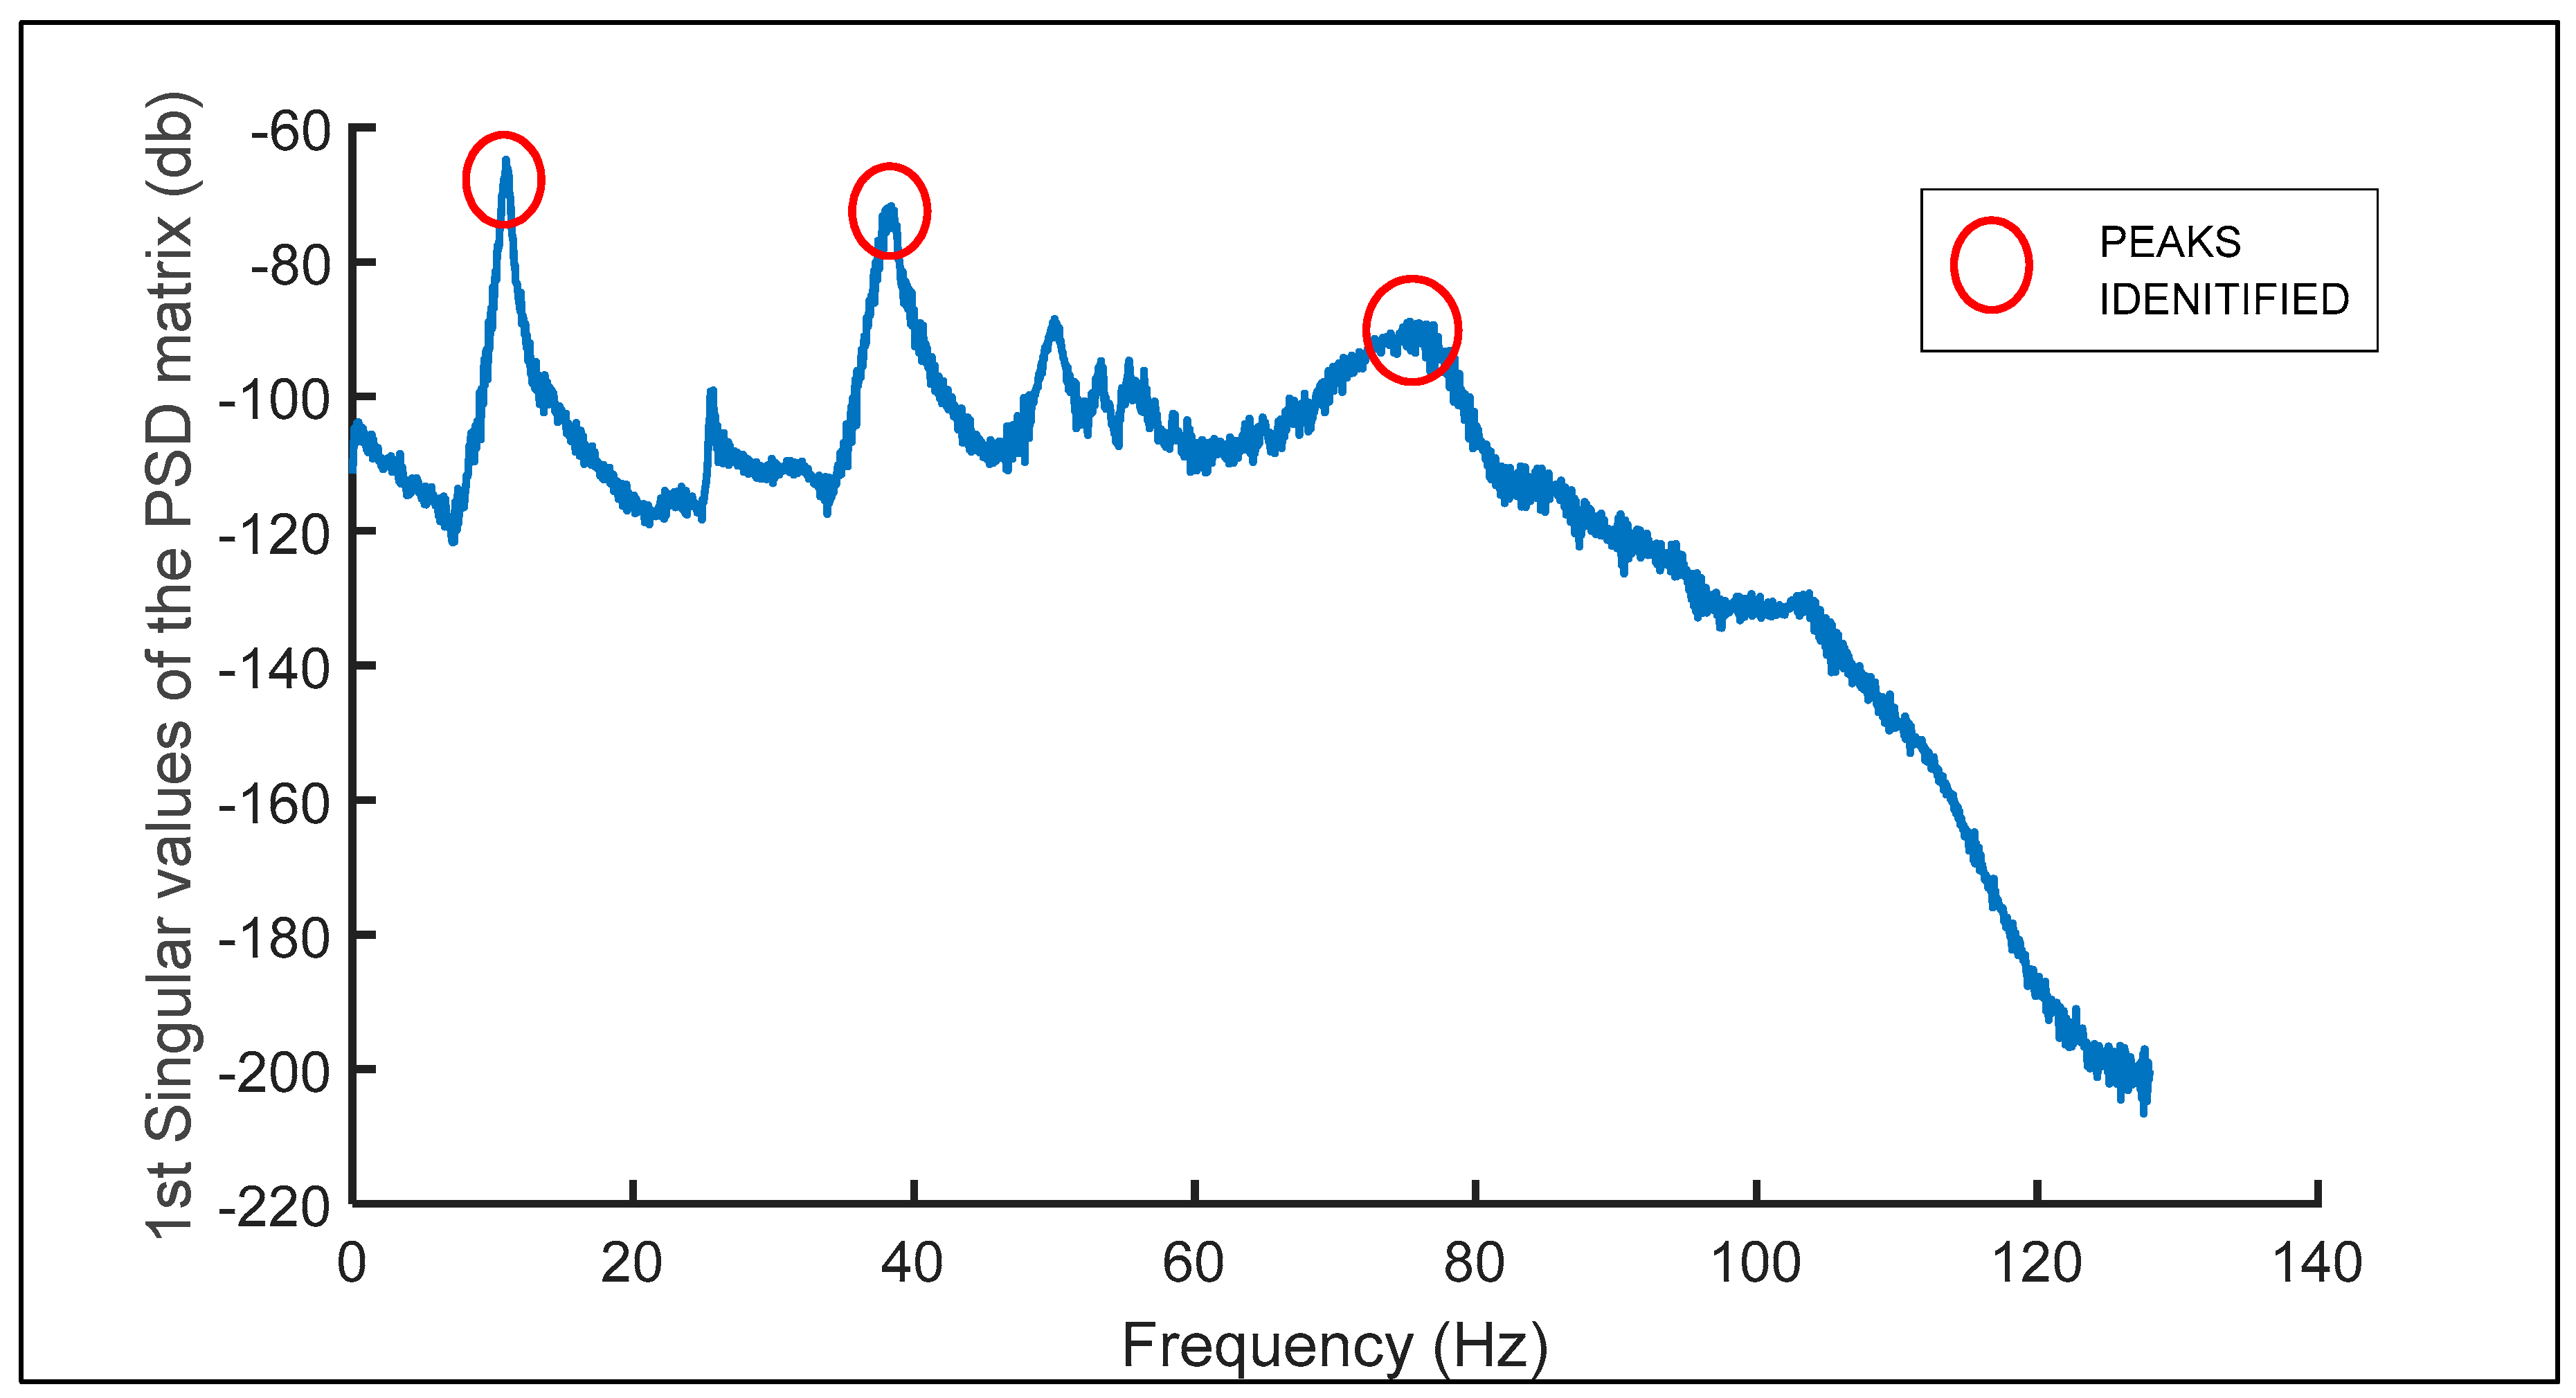
3.5. Frequency Domain Decomposition

Frequency Domain Decomposition (FDD) is an easy, simple-to-use identification algorithm which overcomes the problems of peak picking but keeps the user-friendliness of the peak picking method intact. The first step in carrying out FDD is to make a power spectral density matrix of the response accelerometers. Power spectral density calculates the energy content of each frequency bandwidth. The second step is to carry out Singular Value Decomposition at the discrete frequencies and plot the singular values. At the peaks of the singular values plot, the corresponding singular vectors correspond to the mode shapes’ ordinates. [13]
After the accelerometer data was processed, System Identification was carried out using a MATLAB code developed for the Frequency Domain Decomposition. A Hanning window of 4096 points was applied, which gave a spectral resolution of 0.03125 Hz. The overlap was set to be 2730 points, i.e., 66%. This window was chosen as it reduced leakage and removed biases when going from the time to frequency domain [33]. In Figure 5, we can see three clearly identified peaks and some minor peaks corresponding either to local mode shapes or noise. After the identification of the natural frequency, the corresponding mode shapes ordinates were found out, normalized, and then plotted using cubical interpolation, as shown in Figure 6.
Because important data of Accelerometer 13—a critical node located mid-span of the bridge—was missing, the interpolation was biased, as the highest expected point was missing. In the first and second experimental modes, it is clear that the deformation near the right support was positive for the first mode and negative for the second mode, though this is theoretically unlikely. This is due to the fact that interpolation was carried out using a limited number of ordinates. If the number of accelerometers increased, the mode shapes would be more similar to the analytical mode shapes.

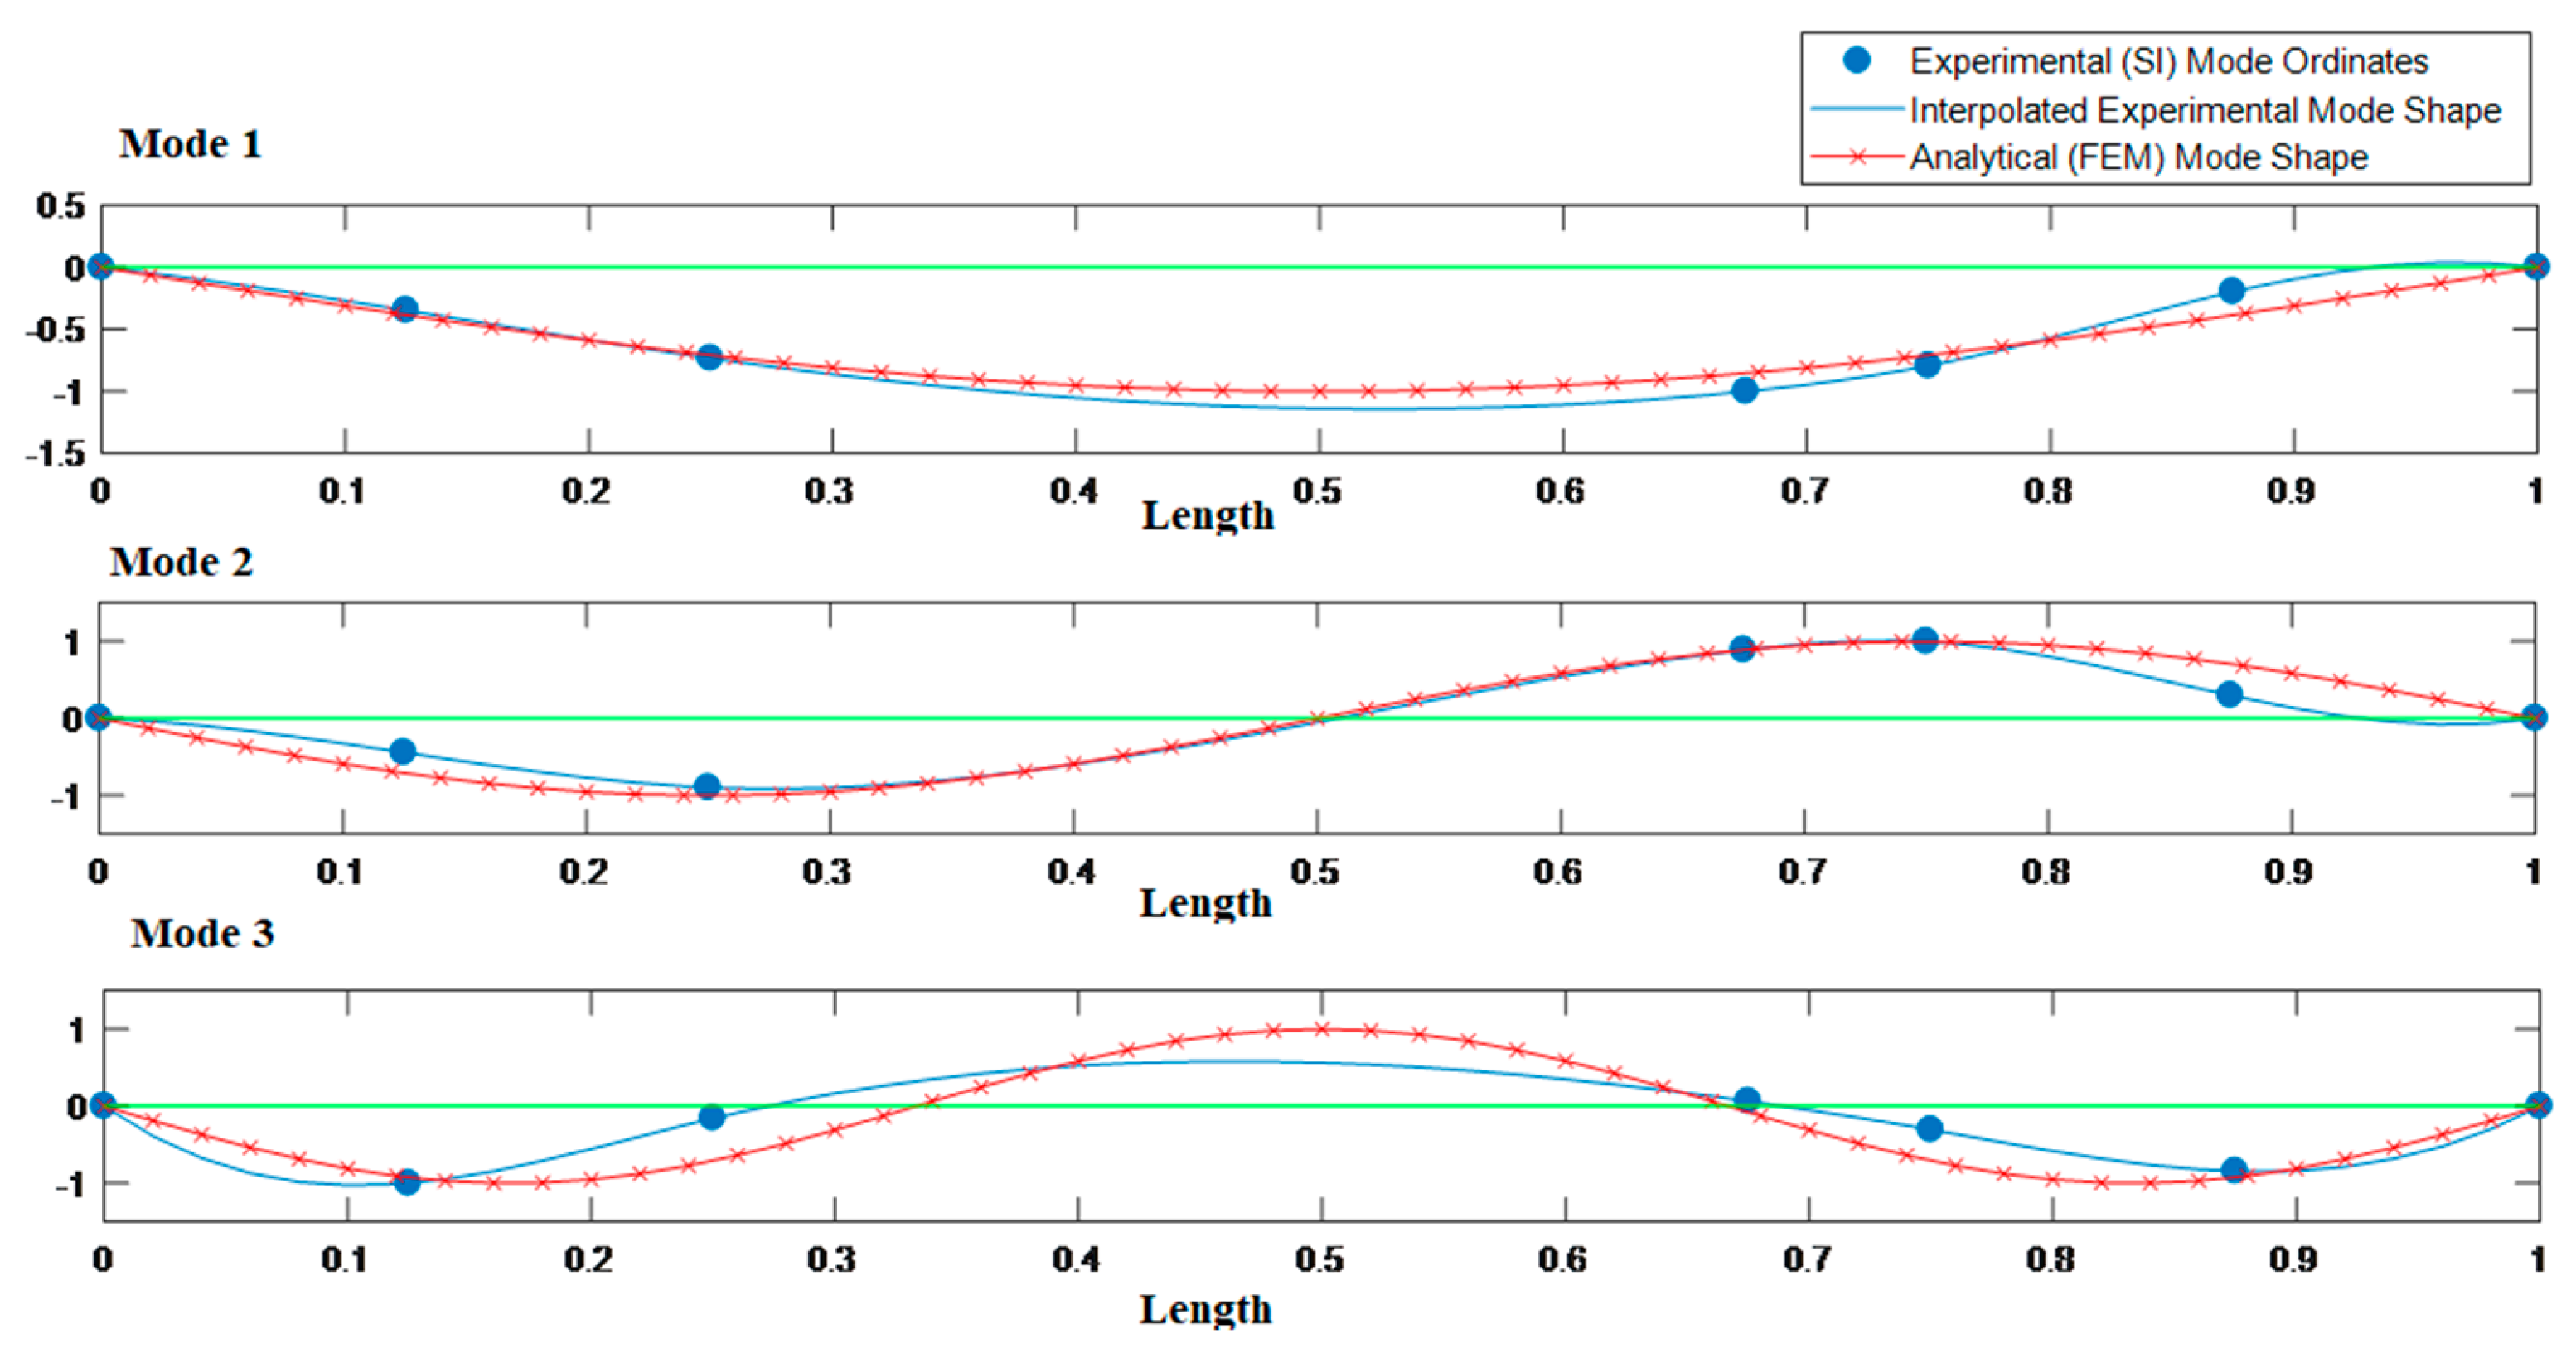
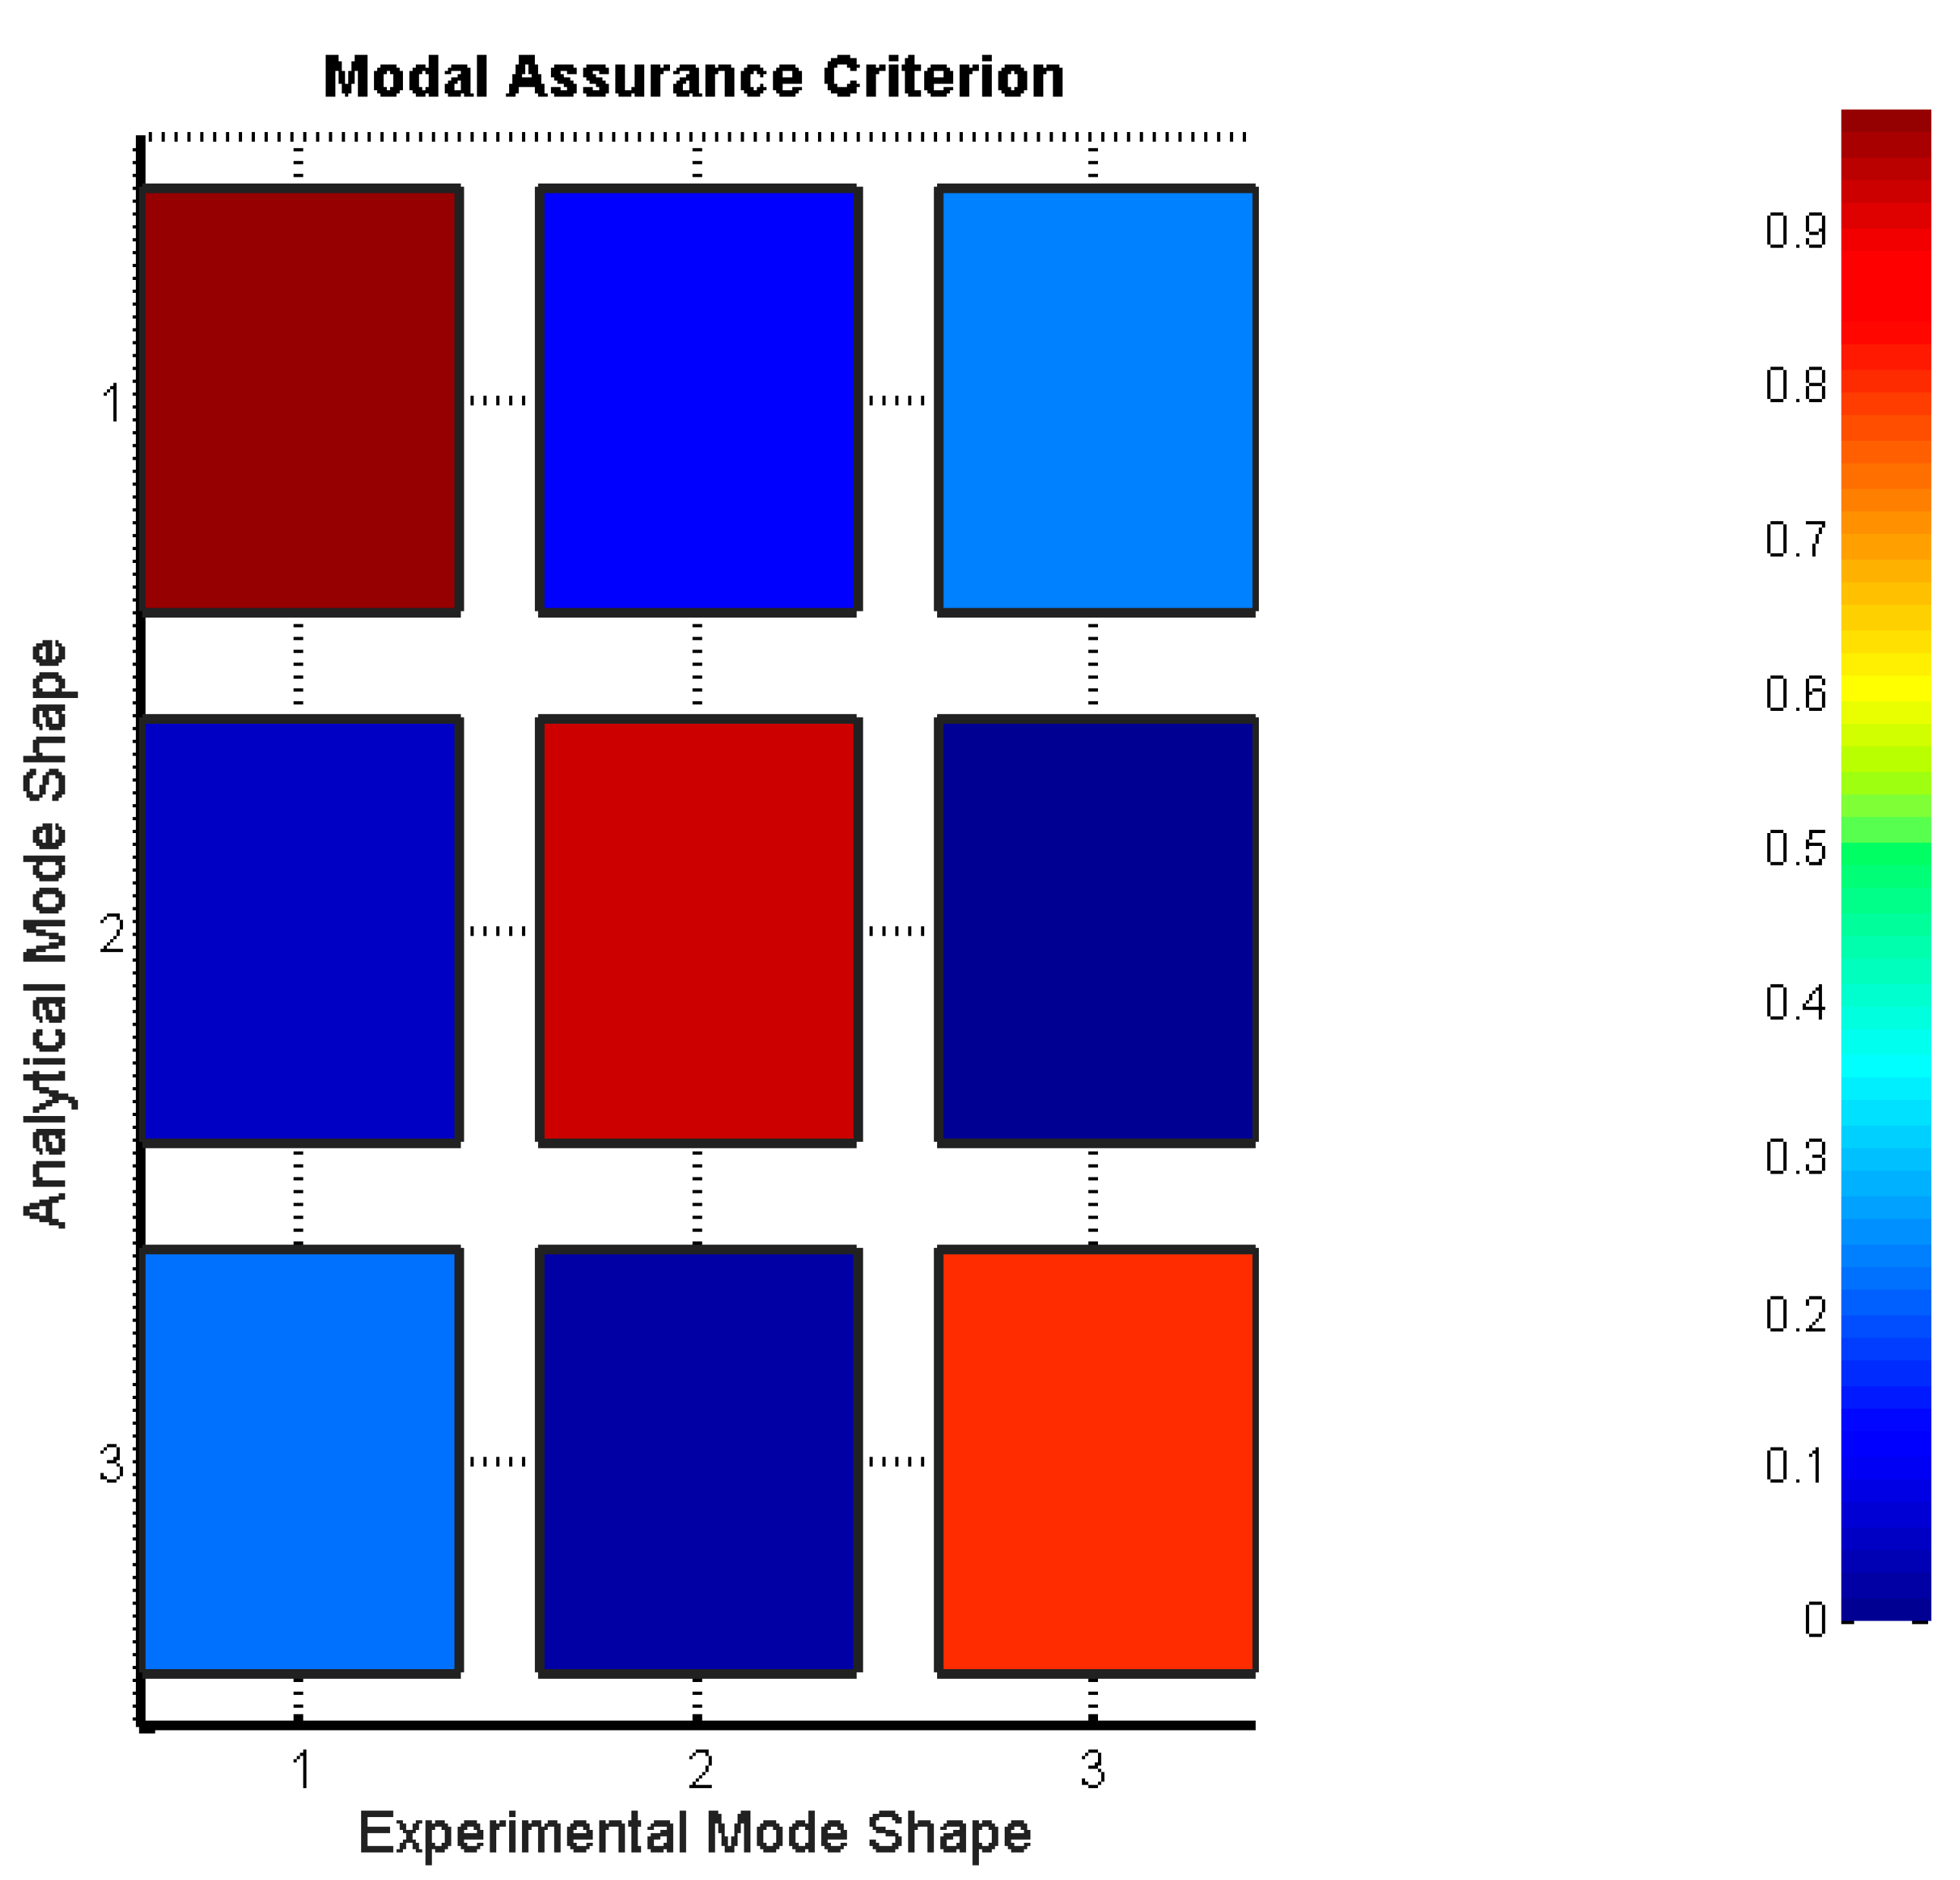
4. Comparison of Finite Element Model and System Identification

The system identification results can be validated by using two methods—by comparing the frequencies of the analytical and experimental modes and by comparing the Mode shapes using the Modal Assurance Criterion (MAC) [34]. MAC is a quantitative measure between two vectors used to compare the experimental and analytical mode shape vectors. A value of 1 shows complete similarity, and 0 shows no similarity between the mode shapes. [35] MAC is sensitive to major differences and insensitive to minor differences between the mode shape vectors. A value greater than 0.80 shows good similarity and is deemed acceptable for system identification [28].
The difference of frequencies of experimental and analytical which can be seen in Table 2 is nearly 10%, which is acceptable, keeping in mind the fact that the structure is a reinforced concrete structure, i.e., non-homogenous, and also keeping in view the FEM assumptions and idealizations. The comparison of experimental and analytical mode shapes can be viewed in Table 3 and a color coded Figure 7. The comparison of the fundamental mode shapes or the first mode shape shows close similarity, with a value of 97.9%. Similarly, the second mode shape comparison is also accurate, with 92.3% similarity. However, for the third mode shape, the MAC comparison value decreases to 80.7% but is still deemed acceptable.

5. Conclusions

In this study, system identification was carried out using low-cost sensors, on a 9.8 m-long, double-tee beam used as a pedestrian bridge. The only significant problem faced in this study was the issue of the time lag between different accelerometers, which was successfully resolved by realigning the time histories using cross-correlation. A good comparison was found between the FEM and SI results which not only validated the use of low-cost accelerometers in health monitoring studies, but also in the experimentation procedure. The modal parameters of the bridge were also discovered, which could be used as a baseline or a benchmark for future SHM studies. FEM cannot serve as the baseline for structural health monitoring, as each FEM has idealizations and as a structure is constructed and is in service, it experiences different loads leading to damages. Therefore, system identification or experimental validation of the FEM is a must. There are only a few examples where the Class C accelerometers were used in SHM. As a good comparison was found between the FEM and SI results, not only was the use of low-cost accelerometers in health monitoring studies validated, but the experimentation procedure also. All in all, low-cost sensors were found to significantly reduce the costs associated with carrying out structural health monitoring, enabling the wider use of such sensors in the industry.

Author Contributions

Conceptualization, M.U.; Methodology, M.U.; Software, A.A.; Validation, M.U.; Formal Analysis, A.A. and T.Y.S.; Investigation, A.A. and T.Y.S.; Resources, M.U.; Writing-Original Draft Preparation, A.A.; Writing-Review & Editing, M.U.; Visualization, M.U.; Supervision, M.U.; Project Administration, M.U.

Funding

This research received no external funding.

Acknowledgments

The authors acknowledge the support extended by all of their peers, friends and families during this study.

Conflicts of Interest

The authors declare no conflict of interest.

References

  1. Pan, H.; Azimi, M.; Gui, G.; Yan, F.; Lin, Z. Vibration-Based Support Vector Machine for Structural Health Monitoring. In International Conference on Experimental Vibration Analysis for Civil Engineering Structures; Springer: Cham, Switzerland, 2018; pp. 167–178. [Google Scholar]
  2. Rasheed, A.; Farooq, S.H.; Usman, M.; Hanif, A.; Khan, N.A.; Khushnood, R.A. Structural reliability analysis of superstructure of highway bridges on China-Pakistan Economic Corridor (CPEC): A case study. J. Struct. Integr. Maint. 2018, 5314, 197–207. [Google Scholar] [CrossRef]
  3. Farrar, C.R.; Worden, K. An introduction to structural health monitoring. Phil. Trans. R. Soc. A 2007, 365, 303–315. [Google Scholar] [CrossRef] [PubMed] [Green Version]
  4. Housner, G.W.; Bergman, L.A.; Caughey, T.K.; Chassiakos, A.G.; Claus, R.O.; Masri, S.F.; Skelton, R.E.; Soong, T.T.; Spencer, B.F.; Yao, J.T.P. Structural control: Past, present, and future. J. Eng. Mech. 1997, 123, 897–971. [Google Scholar] [CrossRef]
  5. Rytter, A. Vibrational Based Inspection of Civil Engineering Structures. Doctoral Dissertation, Aalborg University, Aalborg, Denmark, 1993. [Google Scholar]
  6. Seo, J.; Hu, J.W.; Lee, J. Summary Review of Structural Health Monitoring Applications for Highway Bridges. J. Perform. Constr. Facil. 2016, 30, 04015072. [Google Scholar] [CrossRef]
  7. Worden, K.; Farrar, C.R.; Manson, G.; Park, G. The fundamental axioms of structural health monitoring. Proc. R. Soc. A 2007, 463, 1639–1664. [Google Scholar] [CrossRef] [Green Version]
  8. Mukhopadhyay, S.; Luş, H.; Betti, R. Probabilistic Structural Health Assessment with Identified Physical Parameters from Incomplete Measurements. ASCE-ASME J. Risk Uncertain. Eng. Syst. Part A 2015, 2, B4015003. [Google Scholar] [CrossRef]
  9. Sirca, G.F.; Adeli, H. System identification in structural engineering. Sci. Iranica 2012, 19, 1355–1364. [Google Scholar] [CrossRef] [Green Version]
  10. Brownjohn, A.E.; Brownjohn, J.M.W. Structural Identification: Opportunities and Challenges. J. Struct. Eng. 2013, 139, 1639–1647. [Google Scholar] [Green Version]
  11. Zhou, Y.; Zhang, J.; Yi, W.; Jiang, Y.; Pan, Q. Structural Identification of a Concrete-Filled Steel Tubular Arch Bridge via Ambient Vibration Test Data. J. Bridge Eng. 2017, 22, 04017049. [Google Scholar] [CrossRef]
  12. Zhang, L.; Brincker, R.; Andersen, P. An Overview of Operational Modal Analysis: Major Development and Issues 1. Major Developments of OMA. In Proceedings of the 1St International Operational Modal Analysis Conference, Copenhagen, Denmark, 26–27 April 2005; p. 12. [Google Scholar]
  13. Brincker, R.; Zhang, L.; Andersen, P. Modal identification of output-only systems using frequency domain decomposition. Smart Mater. Struct. 2001, 10, 441–445. [Google Scholar] [CrossRef] [Green Version]
  14. Ventura, C.E. Aalborg Universitet Damping Estimation by Frequency Domain Decomposition. In Proceedings of the 19th International Modal Analysis Conference, Orlando, FL, USA, 5–8 February 2001. [Google Scholar]
  15. Peeters, B.; de Roeck, G. Reference-based stochastic subspace identification for output-only modal analysis. Mech. Syst. Signal Process. 1999, 13, 855–878. [Google Scholar] [CrossRef]
  16. Azimi, M. Design of Structural Vibration Control Using Smart Materials and Devices for Earthquake-Resistant and Resilient Buildings. Master’s Thesis, North Dakota State University, Fargo, ND, USA, 2017. [Google Scholar]
  17. Piana, G.; Lofrano, E.; Manuello, A.; Ruta, G. Natural frequencies and buckling of compressed non-symmetric thin-walled beams. Thin Walled Struct. 2017, 111, 189–196. [Google Scholar] [CrossRef]
  18. Asadollahi, P.; Li, J. Statistical analysis of modal properties of a cable-stayed bridge through long-term structural health monitoring with wireless smart sensor networks. In Proceedings of the Sensors and Smart Structures Technologies for Civil, Mechanical, and Aerospace Systems 2016, Las Vegas, NV, USA, 21–24 March 2016; Volume 22, p. 98030G. [Google Scholar]
  19. Spencer, B.F.; Jo, H.; Mechitov, K.A.; Li, J.; Sim, S.H.; Kim, R.E.; Cho, S.; Linderman, L.E.; Moinzadeh, P.; Giles, R.K.; et al. Recent advances in wireless smart sensors for multi-scale monitoring and control of civil infrastructure. J. Civ. Struct. Health Monit. 2016, 6, 17–41. [Google Scholar] [CrossRef]
  20. Evans, J.R.; Allen, R.M.; Chung, A.I.; Cochran, E.S.; Guy, R.; Hellweg, M.; Lawrence, J.F. Performance of Several Low-Cost Accelerometers. Seismol. Res. Lett. 2014, 85, 147–158. [Google Scholar] [CrossRef] [Green Version]
  21. Roberto, F.; Alves, D.E.C. Low-Cost Vibration Sensors: Tendencies and Applications in Condition Monitoring of Machines and Structures. Ph.D. Thesis, Instituto Superior de Engenharia de Lisboa, Lisbon, Portugal, 2015. [Google Scholar]
  22. Son, J.D.; Ahn, B.H.; Ha, J.M.; Choi, B.K. An availability of MEMS-based accelerometers and current sensors in machinery fault diagnosis. Measurement 2016, 94, 680–691. [Google Scholar] [CrossRef]
  23. Piana, G.; Lofrano, E.; Manuello, A.; Ruta, G.; Carpinteri, A. Compressive buckling for symmetric TWB with non-zero warping stiffness. Eng. Struct. 2017, 135, 246–258. [Google Scholar] [CrossRef]
  24. Piana, G.; Lofrano, E.; Carpinteri, A.; Paolone, A. Experimental modal analysis of straight and curved slender beams by piezoelectric transducers. Meccanica 2016, 51, 2797–2811. [Google Scholar] [CrossRef]
  25. Usman, M.; Hanif, A.; Kim, I.; Jung, H. Experimental validation of a novel piezoelectric energy harvesting system employing wake galloping phenomenon for a broad wind spectrum. Energy 2018, 153, 882–889. [Google Scholar] [CrossRef]
  26. Pachón, P.; Castro, R.; García-Macías, E.; Compan, V.; Puertas, E.E. Torroja’s bridge: Tailored experimental setup for SHM of a historical bridge with a reduced number of sensors. Eng. Struct. 2018, 162, 11–21. [Google Scholar] [CrossRef]
  27. Pan, H.; Azimi, M.; Yan, F.; Lin, Z.; Asce, M. Time-Frequency-Based Data-Driven Structural Diagnosis and Damage Detection for Cable-Stayed Bridges. J. Bridge Eng. 2018, 23, 1–22. [Google Scholar] [CrossRef]
  28. Morassi, A.; Tonon, S. Dynamic Testing for Structural Identification of a Bridge. J. Bridge Eng. 2008, 13, 573–585. [Google Scholar] [CrossRef]
  29. Na. 2015. Available online: http://www.gcdataconcepts.com/x2-1.html (accessed on 1 November 2018).
  30. Brincker, R. Some Elements of Operational Modal Analysis. Shock Vib. 2014, 2014, 1–11. [Google Scholar] [CrossRef]
  31. Perez-Ramirez, C.A.; Amezquita-Sanchez, J.P.; Adeli, H.; Valtierra-Rodriguez, M.; Romero-Troncoso, R.D.J.; Dominguez-Gonzalez, A.; Osornio-Rios, R.A. Time-frequency techniques for modal parameters identification of civil structures from acquired dynamic signals. J. Vibroeng. 2016, 18, 3164–3185. [Google Scholar]
  32. Bjorklund, S.; Ljung, L. A review of time-delay estimation techniques. In Proceedings of the 42nd IEEE International Conference on Decision and Control, Maui, HI, USA, 9–12 December 2003; pp. 2502–2507. [Google Scholar]
  33. Magalhães, F.; Cunha, Á. Explaining operational modal analysis with data from an arch bridge. Mech. Syst. Signal Process. 2011, 25, 1431–1450. [Google Scholar] [CrossRef] [Green Version]
  34. Chen, G.W.; Omenzetter, P.; Beskhyroun, S. Operational modal analysis of an eleven-span concrete bridge subjected to weak ambient excitations. Eng. Struct. 2017, 151, 839–860. [Google Scholar] [CrossRef]
  35. Allemang, R.J. The modal assurance criterion—Twenty years of use and abuse. Sound Vib. 2003, 37, 14–21. [Google Scholar]
Figure 1. (a) Picture and (b) cross-section of the pedestrian bridge.
Smartcities 02 00002 g001
Figure 2. (a) Location of accelerometers, and (b) picture of the attached acceleromters.
Smartcities 02 00002 g002
Figure 3. Time history of Accelerometers A14, A15, and A16, with red boxes indicacting a selected vibration chunk.
Smartcities 02 00002 g003
Figure 4. One complete compiled vibration after removal of the time lag.
Smartcities 02 00002 g004
Figure 5. First Singular Value plot, along with identified peaks.
Smartcities 02 00002 g005
Figure 6. Comparisons of the first three mode shapes of both system identification (SI) and FE.
Smartcities 02 00002 g006
Figure 7. Graphical representation of modal assurance criterion (MAC) comparison.
Smartcities 02 00002 g007
Table 1. Concrete properties used in the Finite Element Model.
Concrete Properties
Density2500 ( kg / m 3 )
Poisson Ratio0.15
Modulus of Elasticity30 GPa
Shear Modulus13.4 GPa
Table 2. Comparison of Experimental and Analytical mode shapes.
Experimental (SI) Analytical (FEM) Absolute Difference (%)
1st Mode10.94 Hz9.858 Hz10.98 %
2nd Mode38.34 Hz38.857 Hz1.33 %
3rd Mode75.31 Hz85.422 Hz11.84 %
Table 3. Modal assurance criterion (MAC) values of Experimental and Analytical mode shapes.
Experimental Mode
Analytical Mode 1st2nd3rd
1st0.9790.1140.241
2nd0.0540.9230.000
3rd0.2160.0190.807

