Article

EEG-Based Analysis of Motor Imagery and Multi-Speed Passive Pedaling: Implications for Brain–Computer Interfaces

by
Cristian Felipe Blanco-Diaz
1,*,
Aura Ximena Gonzalez-Cely
2,
Denis Delisle-Rodriguez
3 and
Teodiano Freire Bastos-Filho
2
1
Department of Excellence in Robotics and AI, The BioRobotics Institute, Scuola Superiore Sant’ Anna, 56127 Pisa, Italy
2
Postgraduate Program in Electrical Engineering, Federal University of Espirito Santo, Vitória 29075-910, Brazil
3
Postgraduate Program in Neuroengineering, Edmond and Lily Safra International Institute of Neuroscience, Macaiba 59288-999, Brazil
*
Author to whom correspondence should be addressed.
Signals 2025, 6(4), 52; https://doi.org/10.3390/signals6040052
Submission received: 31 July 2025 / Revised: 4 September 2025 / Accepted: 19 September 2025 / Published: 1 October 2025
(This article belongs to the Special Issue Advances in Biomedical Signal Processing and Analysis)

Abstract

Decoding motor imagery (MI) of lower-limb movements from electroencephalography (EEG) signals remains a challenge due to the involvement of deep cortical regions, limiting the applicability of Brain–Computer Interfaces (BCIs). This study proposes a novel protocol that combines passive pedaling (PP) as sensory priming with MI at different speeds (30, 45, and 60 rpm) to improve EEG-based classification. Ten healthy participants performed PP followed by MI tasks while EEG data were recorded. An increase in spectral relative power around Cz associated with both PP and MI was observed, varying with speed and suggesting that PP may enhance cortical engagement during MI. Furthermore, our classification strategy, based on Convolutional Neural Networks (CNNs), achieved an accuracy of 0.87–0.89 across four classes (three speeds and rest). This performance was also compared with the standard Common Spatial Patterns (CSP) and Linear Discriminant Analysis (LDA), which achieved an accuracy of 0.67–0.76. These results demonstrate the feasibility of multiclass decoding of imagined pedaling velocities and lay the groundwork for speed-adaptive BCIs, supporting future personalized and user-centered neurorehabilitation interventions.

1. Introduction

Stroke rehabilitation remains a major clinical challenge despite advances in therapeutic interventions [1]. Recovery of motor and cognitive function is influenced by the timing of intervention, the severity of the neurological damage, and the patient’s physical and mental condition [1]. Neurorehabilitation relies on mechanisms of experience-dependent plasticity, where focused, intensive, and repetitive training can promote synaptic reorganization and motor improvement [1]. Furthermore, additional physical and cognitive practice can enhance movement speed, endurance, and accuracy in stroke survivors. Recent strategies have explored the use of assistive and robotic devices to restore neural function and optimize rehabilitation outcomes [1].
Lower-limb rehabilitation is critical for restoring functional mobility in patients with neuromotor impairments. Among several assistive technologies—such as robotic exoskeletons, orthoses, and smart walkers—Mini-Motorized Exercise Bikes (MMEBs) have gained recognition as a solution due to their portability, low complexity, and ability to facilitate repetitive and rhythmic lower-limb movements [2,3,4]. MMEB-based interventions allow patients to engage in physical exercise from a seated or semi-upright position, minimizing physical strain while promoting muscle activation [2,3,5]. Furthermore, pedaling tasks may support the reorganization of motor and cognitive circuits through continuous flexion–extension cycles, which have been associated with improved gait and motor coordination [3,4,6]. These features make MMEBs particularly well-suited for integrating into neurorehabilitation interventions.
Mental practice techniques, such as motor imagery (MI), have shown promise in enhancing conventional rehabilitation by promoting neuroplastic changes in sensorimotor areas associated with lower-limb movements [7]. MI involves the mental simulation of movement without physical execution, activating cortical networks similarly to real movement while bypassing peripheral muscle activity. This approach leverages mechanisms of synaptic plasticity, reinforcing neural pathways involved in motor control. To integrate MI effectively in clinical practice, Brain–Computer Interfaces (BCIs) have been developed to decode brain information, process it, and convert it into an artificial output [8]. In this sense, for lower-limb-based BCIs, users usually perform MI tasks while receiving visual or kinesthetic feedback based on their neural activation, facilitating learning and motor recovery.
Several studies have explored the use of MI-based BCIs in conjunction with lower-limb robotic systems to support neurorehabilitation in patients with motor impairments [2,7,8,9,10]. Among these, MMBEs have been used to deliver kinesthetic feedback through passive pedaling (PP), which is often followed by MI tasks in an effort to reinforce sensorimotor activation [2,10]. This combination may help induce neuroplastic changes by replicating brain activation patterns observed during active pedaling [11]. Additionally, active and passive pedaling data have been employed to calibrate MI-based BCIs, with the aim of improving classification accuracy [4,12,13]. These pedal-driven BCI paradigms have shown promise for restoring motor and sensory function in stroke survivors, particularly those with additional cognitive impairments that affect attention and motor planning [14].
Electroencephalography (EEG) is widely used to study brain activity during motor imagery (MI) tasks because it is non-invasive, portable, and offers high temporal resolution [15,16]. However, EEG decoding of lower-limb movements remains challenging due to physiological artifacts, environmental noise, and the relatively low signal-to-noise ratio of motor-related rhythms [17,18]. Traditional approaches, such as power spectral density (PSD) analysis, Common Spatial Patterns (CSPs), and Riemannian Geometry (RG), have been applied to extract features from EEG, often combined with machine learning classifiers to improve accuracy. While these techniques have achieved some success, their performance remains limited for complex or lower-limb MI tasks. More recently, deep learning methods have emerged as powerful alternatives for EEG decoding, providing improved performance in various mental state classification tasks [19]. Nonetheless, their application to pedaling-related MI has not yet been explored.
Despite progress in motor imagery-based BCIs for lower-limb rehabilitation, the influence of pedaling speed on cortical activation during MI remains underexplored. Understanding this relationship could inform more personalized rehabilitation strategies and provide physiotherapists with versatile tools that better reflect functional daily activities. In this study, we investigated EEG responses during kinesthetic MI of pedaling at three distinct speeds, preceded by passive pedaling to facilitate sensorimotor engagement. We evaluated the discriminability of these speed-specific MI signals using both conventional feature-based methods and deep learning approaches. By addressing the role of movement speed in MI decoding, this work contributes to the development of more adaptive and effective lower-limb BCI applications.

2. Materials and Methods

2.1. Participants

The required sample size for this study was estimated using G*Power 3.1 [20]. Because G*Power does not include a direct option for the Friedman test, the sample size was approximated using the repeated-measures ANOVA and within-factors module. A small effect size (f = 0.4), an alpha level of α = 0.05 , and a desired power of 0.8 were used. Based on these parameters, the minimum number of participants required was calculated to be 10. Furthermore, similar approaches to sample size estimation have been reported in EEG studies with comparable designs [18,21,22].
Ten healthy participants (mean ± standard deviation (SD): 27 ± 5 yrs, five male and five female) voluntarily participated in this study. The experiment was conducted according to the Declaration of Helsinki and the guidelines of the Ethics Committee of the Federal University of Espírito Santo under the approval CAAE: 46099421.9.0000.5542, on 14 July 2021. All subjects were instructed on the experimental design regarding the correct execution of the experiment, the duration of each phase, and instructions.

2.2. Experimental Setup

An in-house database for PP and pedaling MI at different speeds was recorded using the experimental setup shown in Figure 1A. Eight channels from EEG signals were acquired at a 250 Hz sampling rate with a Cython Biosensing Board (OpenBCI, US) and OpenViBE software, where the 10–20 international system was used. The primary motor region in which cortical changes are expected during lower-limb action was considered [23], as follows: FC1, FC2, C3, CZ, C4, CP1, CP2, and PZ. The ground (GND) and reference (REF) electrodes were clipped to the right A1 and left A2 earlobes (Figure 1B).
Previous studies have shown that covariance-based features can achieve high accuracy with fewer channels, while helping optimize MI-based systems [24,25]. In this study, channels were selected for their relevance to the cortical motor areas associated with lower-limb activity [12,13,18].
To generate cortical responses to pedaling MI at different speeds, the Mini Exercise Bike model 7101 (ACTIVCycle, UK) device was used to generate passive movements. The hardware of this device was customized to be controlled using commands delivered via a Personal Computer (PC) with an Intel Core i5-8250U @ 1.6 GHz, RAM 24 GB, and an Operating System (OS) of 64 bits. This computer was also used for signal processing and classification. The MMEB’s motor operates with a power supply of 100 VDC; therefore, a full-wave rectifier circuit was implemented using a 127 VAC power line source. A filter configuration with a Metal–Oxide–Semiconductor Field-Effect Transistor (MOSFET) IRF740 (Vishay Intertechnology, Malvern, PA, USA) was used to switch at high velocities while controlling the motor. Moreover, an optoisolator MOC3021 (ISOCOM, Inc., Hartlepool, UK) was used to send control signals to the motor through an ESP32 (Espressif Systems, Shanghai, China) microcontroller board. MOC3021 was powered at 5 VDC using a voltage regulator and a pull-down connection. ESP32 and PC communicated using a User Datagram Protocol (UDP), which is compatible with Python 3.7.8 and OpenViBE. Each speed has an associated voltage between 0 and 3.3 V using Pulse-Width Modulation (PWM), which allowed for the assignment of the MMEB speeds: 30, 35, 40, 45, 50, 55, 60, and 70 rpm. Based on prior studies in post-stroke patients showing cortical activation at these speeds and their suitability for neurorehabilitation [4,26,27], this study used 30, 45, and 60 rpm. These values were selected to represent low, medium, and high but clinically feasible velocities within the MMEB’s operational range, with the goal of maximizing discriminability while maintaining relevance for patient training.

2.3. Experimental Protocol

The protocol was composed of two sessions, each of which was implemented in four phases (Figure 1C):
1.
The participant rested their feet on the minibike pedals and fixed their eye gazes on a black screen for 60 s without performing mental tasks (baseline).
2.
Following this, the MMEB provided PP for a period of time ranging between 7 and 10 s at one of the three configured speeds: 30 (low), 45 (medium), and 60 rpm (high). Trial durations were pseudorandomized while maintaining equal representation of each length.
3.
The subject was instructed to imagine pedaling movements for the same period of time as aforementioned. The individual was instructed to perform the mental task simulating the same speed that was passively received in stage 2.
4.
A break of approximately 2 s, without mental tasks, was taken by the subject, indicated by a beep. This interval was included to reduce carry-over and anticipatory effects between consecutive trials, as commonly implemented in MI protocols [28,29].
5.
Stages 2 to 4 were repeated until 10 trials per class were performed, completing a total of 30 trials.
The number of trials was chosen based on reports linking repetitive movements to improved MI performance [2,30]. However, excessive trials may decline MI performance because of mental fatigue, and in the case of pedaling, muscular fatigue as well, supporting the need to carefully limit trial count [31]. Therefore, a total of 60 trials was conducted in two sessions in which a resting period between sessions was added to prevent mental or physical fatigue. Furthermore, at the end of the experiment, subjective questionnaires were distributed to the participants to assess their mental, physical, and cognitive effort that can influence the execution of mental tasks such as MI [32].

2.4. Data Analysis

To assess the similarity between cortical activity during PP and MI at different speeds, we computed relative power changes ( Δ R P ) in key frequency bands. EEG signals were first re-referenced using a Common Average Reference (CAR) filter to reduce global noise across electrodes. Then, PSD was estimated using the Fast Fourier Transform (FFT) with 1 s windows and 87.5% overlap, focusing on the μ (8–12 Hz) and β (15–20 Hz) bands. Normalized power was computed using
Δ R ( % ) = P A P b ¯ P b ¯ ,
P A , b = P μ + P β P 8 30 × 100 ,
where P A is the normalized power during PP or MI, P b ¯ corresponds to the mean power of the baseline period, and P μ , P β and P 8 30 are the power bands in μ (8–12 Hz), β (15–20 Hz), and full range (8–30 Hz).
Based on previous literature highlighting the role of the Cz location in lower-limb motor activity [13], we conducted additional focused analyses on this electrode to evaluate its discriminative power between tasks.

2.5. Machine Learning Classifiers

To overcome the limitations of power-based features for distinguishing EEG states, we implemented a machine learning pipeline using two spatial filtering methods: CSP and RG. Although both were originally developed for binary classification, we extended them to handle multiclass scenarios using a One-vs-One (OvO) strategy. In this approach, separate binary classifiers are trained for each pairwise combination of classes, and their outputs are combined via majority voting to yield final predictions [33]. Three classification scenarios were defined:
1.
PP Velocity Classification: EEG segments corresponding to three PP speeds (e.g., slow, medium, fast) were used as separate classes.
2.
MI: EEGs from MI tasks performed after each PP condition were classified into three corresponding speed-related classes.
3.
Cross-Condition: Classifiers were trained on PP EEG data and tested on MI data to evaluate generalization across conditions.
As a baseline comparison, we also used the PSD features from each 1 s EEG window using the FFT method. These features consisted of the mean power in the μ (8–12 Hz) and β (13–30 Hz) bands across all selected EEG channels, which were used as classifier input features.

2.5.1. Pre-Processing

EEG data were bandpass-filtered between 8 and 30 Hz using a zero-phase 4th-order Butterworth filter to isolate activity in the μ (8–12 Hz) and β (13–30 Hz) bands, which are commonly associated with lower-limb activity [23]. To expand the dataset and improve generalization, each trial was segmented into 1 s windows each with 125 ms overlap, as performed in [13]. Each window served as a sample for feature extraction and classification. Four classes were defined for the classification task: Class 1: baseline (resting state before MI), Class 2: pedaling MI and PP at 30 rpm, Class 3: MI and PP at 45 rpm, Class 4: MI and PP at 60 rpm.

2.5.2. Common Spatial Patterns

CSP was used to extract spatial features, considering the binary classification nature of this method. For each OvO class pair, spatial filters were computed to maximize variance differences between classes [28,34,35]. The EEG signals were projected through these filters, and the log-variance of the four most discriminative components (two out of each class) was used as features. This resulted in a feature matrix F CSP R 2400 × 8 , with 2400 samples and 8 features per trial.

2.5.3. Riemannian Geometry

For RG-based feature extraction, each EEG window was first converted into a covariance matrix. These matrices were then projected into tangent space using the Riemannian mean matrix [34,35]. The resulting feature matrix F RG R 2400 × 8 contains 8 tangent space features per window.

2.5.4. Classification

Two widely used classifiers were evaluated: Linear Discriminant Analysis (LDA) and Support Vector Machine (SVM) with a linear kernel. Both classifiers were trained on the extracted feature sets (CSP, RG, or PSD, as appropriate). Model performance was assessed using 5-fold stratified cross-validation. In each fold, the classifier was trained on 80% of the data and tested on the remaining 20%, except in the cross-condition scenario previously mentioned.

2.6. Deep Learning Classifier

We implemented a Convolutional Neural Network (CNN) for EEG signal classification, inspired by prior work on motor imagery and motion estimation [36,37]. The input to the network was a pre-processed EEG window of size 125 × 8. The architecture consisted of three convolutional blocks, each comprising a 2D convolutional layer with kernel size 3 × 3, batch normalization, and ReLU activation. The first, second, and third convolutional layers used 16, 32, and 64 filters, respectively. After the first and second blocks, a max-pooling layer with stride 2 was applied for dimensionality reduction. The feature maps were flattened and passed to a fully connected layer with four output neurons, corresponding to the target classes. The network output was computed using a softmax function followed by a classification layer.
CNN was trained using the Adam optimizer with a minibatch size of 64 and a maximum of 10 epochs [37]. The training dataset was shuffled at every epoch. ReLU activations were employed in all hidden layers to mitigate the vanishing gradient problem and accelerate convergence.

2.7. Performance Metrics

Three evaluation metrics were computed for each fold: accuracy (ACC), area under curve (AUC), and the kappa ( κ ) index, which were defined as
A C C = i = 1 C M i i i = 1 C j = 1 C M i j ,
A U C i = 1 C ( C 1 ) i = 1 C j i C M i i + M j j M i i + M j j + M i j + M j i ,
κ = ACC P e 1 P e ,
where C is the total number of classes. The confusion matrix M has entries M i j , where i is the true class, j is the predicted class, and P e is the probability of random classification. The elements of the confusion matrix M are denoted as M i i , M i j , etc., where M i i represents the count of correctly classified instances for class i, and M i j represents the count of instances from class i that are misclassified as class j. The AUC metric was computed using the trapezoidal rule from the ROC curve, based on classifier confidence scores. Classification performance was summarized using the median and interquartile range (IQR) across the 5 cross-validation folds, reported in the format median (IQR).

2.8. Subjective Questionnaires

At the end of the experiment, participants completed subjective questionnaires to assess cognitive load and mental state. Cognitive load was measured using NASA-TLX, which evaluates six dimensions—temporal demand (TD), mental demand (MD), physical demand (PD), perceived performance (PE), effort (EF), and frustration (FR)—on a 1–20 scale [32]. A custom questionnaire, inspired by [29], assessed participants’ comfort, motivation, concentration, visual fatigue, somnolence, and overall physical and mental condition (awareness, without distractions, etc) on a 5-score scale (1 = minimum, 5 = maximum) [29].

2.9. Statistical Analysis

To assess whether performance metrics differed significantly across methods, classifiers, and task conditions, a series of statistical tests were conducted. First, the Kolmogorov–Smirnov test was applied to assess the normality of each metric’s distribution, and Levene’s test was used to evaluate the homogeneity of variances. Based on these assumptions, either a one-way ANOVA (for normally distributed data with equal variances) or the Friedman test (for non-parametric comparisons) was used to compare classification metrics (accuracy, AUC, kappa) and feature differences (e.g., relative power) across classes (baseline, MI at 30, 45, and 60 rpm). When significant differences were observed (p < 0.05), post hoc pairwise comparisons were performed using either the Tukey–Kramer test for ANOVA, or the Wilcoxon signed-rank test with Bonferroni correction for Friedman results. For pairwise comparisons of classification accuracies, the statistical tests were performed on the group-level medians, i.e., the median accuracy across all participants among different conditions. The null hypothesis for each test was that there were no differences among the task conditions; the alternative hypothesis stated that at least one pair of conditions showed a statistically significant difference. Pearson correlation (r) was used to assess linear relationships between participants’ classification accuracy (ACC) and their responses to the subjective questionnaires. For each participant, only the highest ACC across conditions was considered, along with the corresponding questionnaire responses. This analysis was intended to determine whether participants’ subjective perceptions—such as concentration, effort, or mental engagement—were associated with the quality of the EEG features, as reflected in classifier performance.

3. Results

3.1. Spatial Analysis of Relative Power

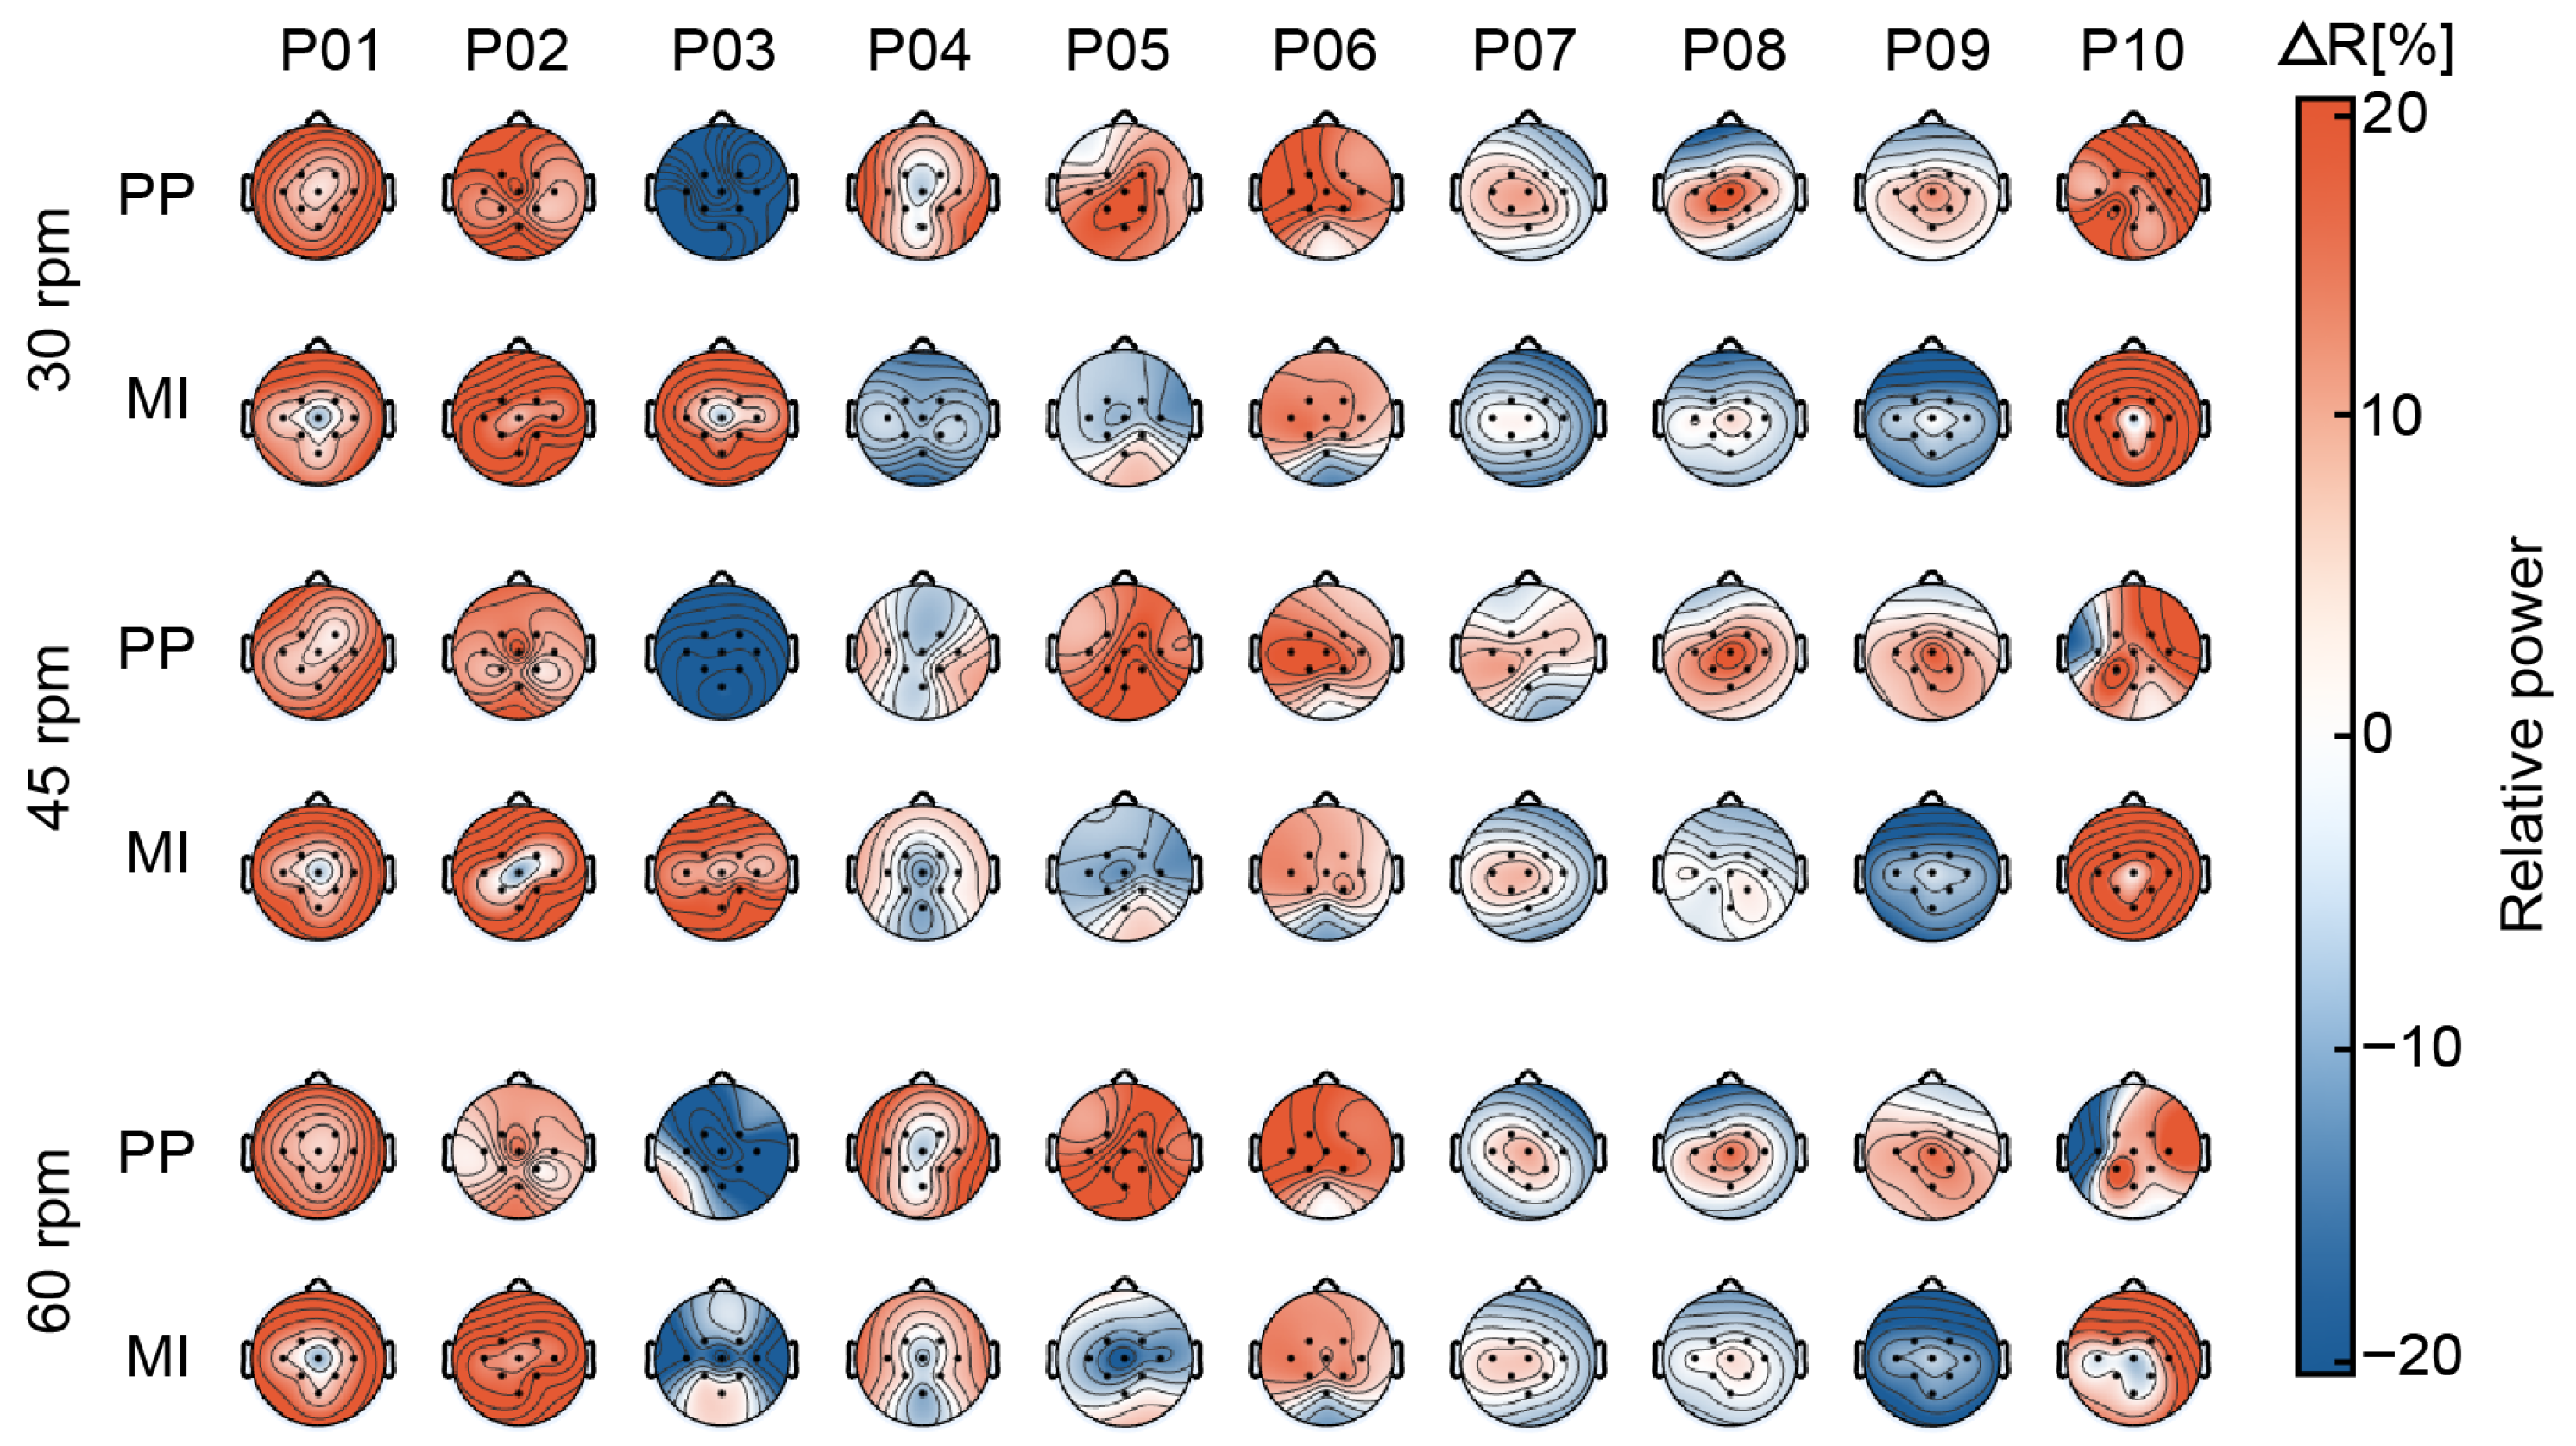
Figure 2 shows the spatial distribution of Δ R % during PP and MI tasks across low, medium and high pedaling speeds. A consistent decrease in relative power was observed across participants, particularly in the central and parietal regions (notably around Cz and Pz locations), which can be associated with lower-limb motor control.
At 30 rpm, participants such as P01, P02, P06, and P10 showed the strongest power suppression during both PP and MI tasks. At higher speeds (45–60 rpm), this suppression diminished for some participants, while others (e.g., P05, P07, P08 and P9) exhibited increased desynchronization during MI following PP at these velocities. Across all velocities, several participants exhibited distinct patterns of relative power over the parietocentral cortex. Notably, participants P01 and P04 showed pronounced decreased power in Cz and Pz locations, whereas participants P07, P08, and P09 demonstrated increased power in the same regions, indicative of reduced desynchronization or synchronization rhythms.
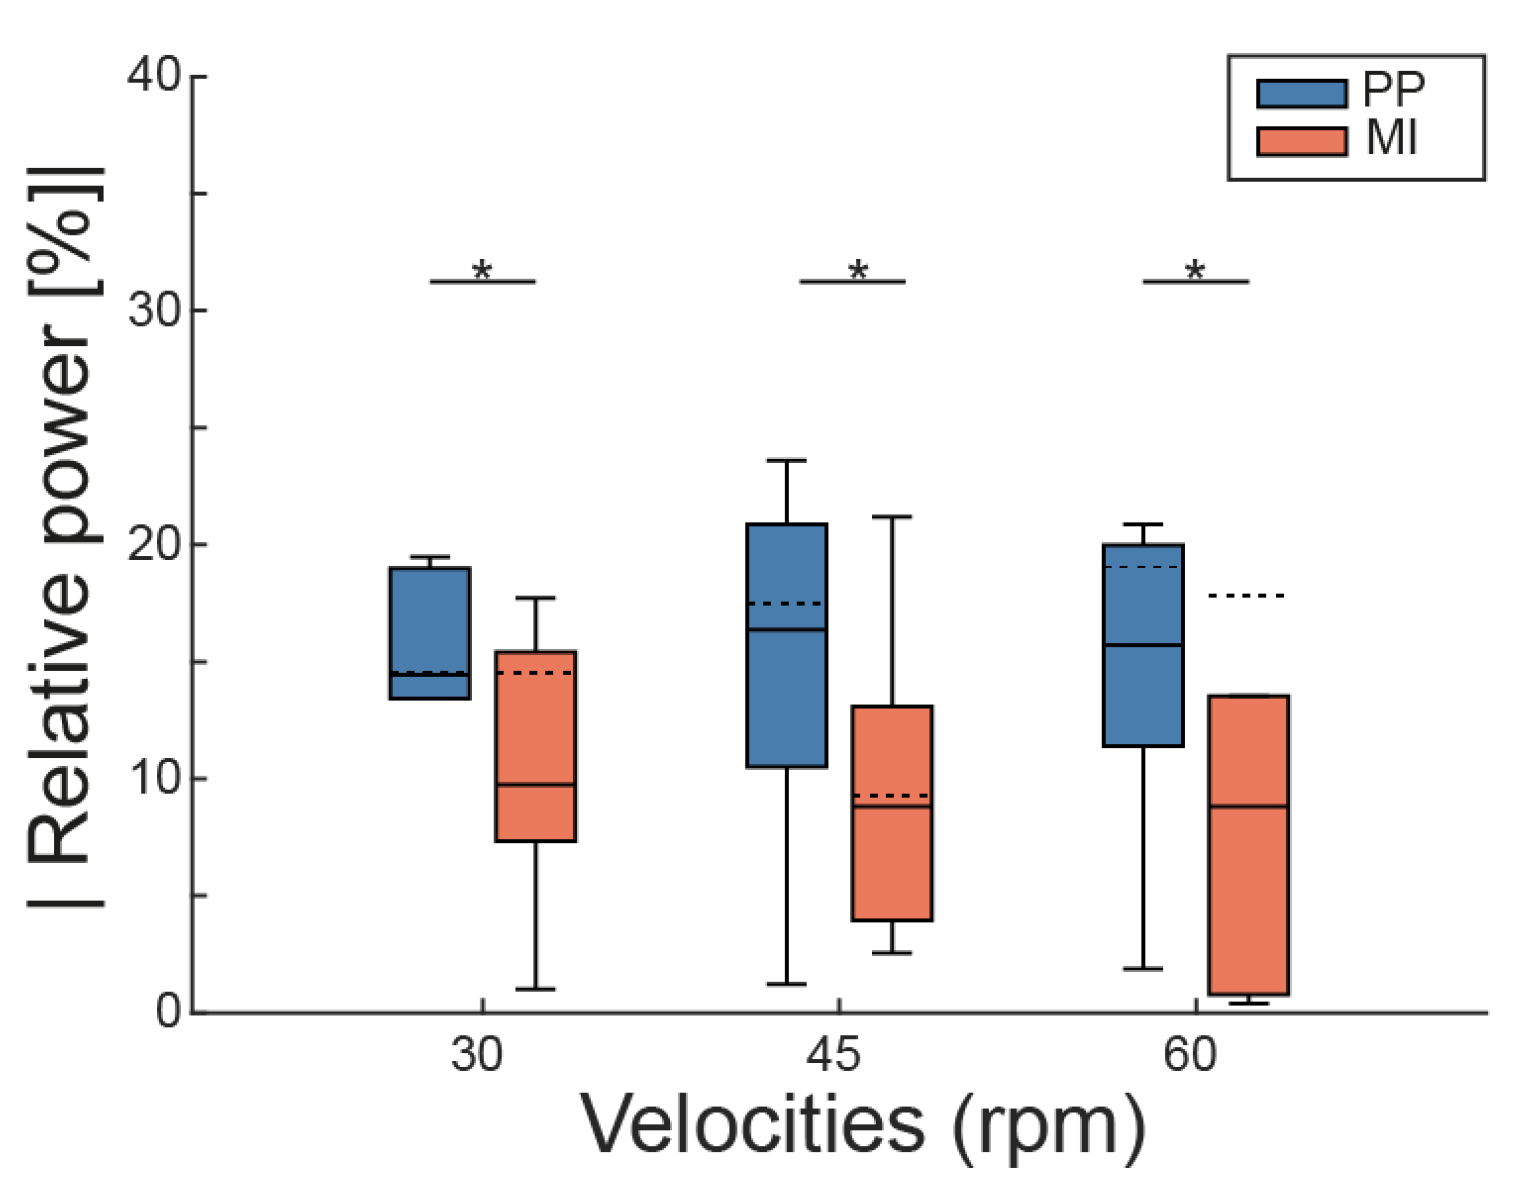
Given the functional relevance of the Cz location in lower-limb motor control, EEG modulation at this electrode across conditions was specifically analyzed for the absolute relative power changes during PP and MI at different speeds. This approach was taken because some participants exhibited an increase (positive changes) while others showed a decrease (negative changes) in relative power (see Section 3.1). By taking the absolute value, we aimed to capture the magnitude of modulation regardless of direction. Across all conditions, absolute relative power was higher during PP compared to MI (see Figure 3). Specifically, for PP, the relative power was 14.44% (5.57%) at 30 rpm, 16.37% (10.36%) at 45 rpm, and 15.72% (8.59%) at 60 rpm. In contrast, MI produced lower relative power: 9.74% (8.08%), 8.80% (9.14%), and 8.80% (12.75%) at 30, 45, and 60rpm, respectively. A decreasing trend across speeds was observed for MI, though this change was not statistically significant (p > 0.05). In contrast, the difference between PP and MI was statistically significant at all speeds (p < 0.05), indicating stronger activation during physical execution.

3.2. Classification Performance

For the PP condition, CNN achieved the highest classification accuracy of 0.89 (0.04), followed by RG+ LDA with 0.75 (0.13), and RG+SVM with 0.75 (0.14), CSP + LDA with 0.74 (0.16), and CSP+SVM with 0.71 (0.17) (see Figure 4A). Then, RP features yielded substantially lower performance values of 0.42 (0.05) and 0.44 (0.07) for LDA and SVM, respectively. During the MI condition, CNN showed the best accuracy of 0.88 (0.05), followed by CSP + LDA with 0.76 (0.15), and CSP+SVM with 0.73 (0.16) (see Figure 4B). RG reached similar accuracies to CSP, achieving 0.75 (0.14) and 0.74 (0.15) for LDA and SVM, respectively. Relative power again showed the lowest performance with 0.40 (0.06) and 0.42 (0.06). In the cross-condition scenario (PP used for training, MI for testing), CNN retained the highest classification accuracy with 0.87 (0.08), followed by CSP + LDA with 0.70 (0.16), and CSP+SVM with 0.68 (0.15) (see Figure 4C). RG followed closely at 0.68 (0.15) and 0.67 (0.15), while relative power remained less effective at 0.38 (0.05) and 0.38 (0.02). Overall, CNN, CSP and RG significantly outperformed relative power across all conditions (p < 0.05).
Building on the previous analysis, the performance of CNN, CSP + LDA and RG+ LDA strategies was further assessed using AUC and kappa, as illustrated in Figure 5. Classification of the PP state achieved the highest performance using CNN, with an ACC of 0.89 (0.04), AUC of 0.98 (0.01), and kappa of 0.86 (0.05), followed by CSP, with an ACC of 0.74 (0.16), AUC of 0.76 (0.10) and kappa of 0.68 (0.17), followed by RG with an ACC of 0.75 (0.13), AUC of 0.73 (0.15), and kappa of 0.68 (0.16). The MI state showed similar classification results, with an ACC of 0.88 (0.05), AUC of 0.98 (0.01), and kappa of 0.84 (0.06) for CNN, an ACC of 0.76 (0.15), AUC of 0.75 (0.11), and kappa of 0.68 (0.17) for CSP, and ACC of 0.74 (0.15), AUC of 0.73 (0.15), and kappa of 0.68 (0.16) for RG. However, when the classifier was trained on features extracted from the PP state and tested on the MI state, performance decreased, with an ACC of 0.87 (0.08), AUC of 0.97 (0.02), and kappa of 0.84 (0.08) for CNN. The performance for RG and CSP followed this trend with ACCs of 0.67 (0.22) and 0.66 (0.20), AUCs of 0.68 (0.14) and 0.64 (0.19), and kappas of 0.58 (0.23) and 0.58 (0.21), respectively. However, for all feature extraction techniques, this decrease was not significant between conditions (p > 0.05).
To address the multiclass classification challenge inherent in CSP and RG binary classification, an OvO strategy was implemented. Confusion matrices for these models in the cross-condition scenario are shown in Figure 6A,B. The confusion matrix for CNN is shown in Figure 6C. The matrix reveals that the high-speed class (60 rpm) was classified with the highest rate (CSP: 74.8%; RG: 69.9%; CNN: 96%), while the low-speed class (30 rpm) had the lowest (CSP: 59.6%; RG: 56%; CNN: 82%), with frequent misclassifications into the medium-speed class (45 rpm), which had an accuracy of 63.0% for CSP, 56.1% for RG, and 84% for CNN. The rest/baseline condition achieved 67.0% accuracy for CSP, 60.1% for RG, and 84% for CNN.

3.3. Subjective Responses

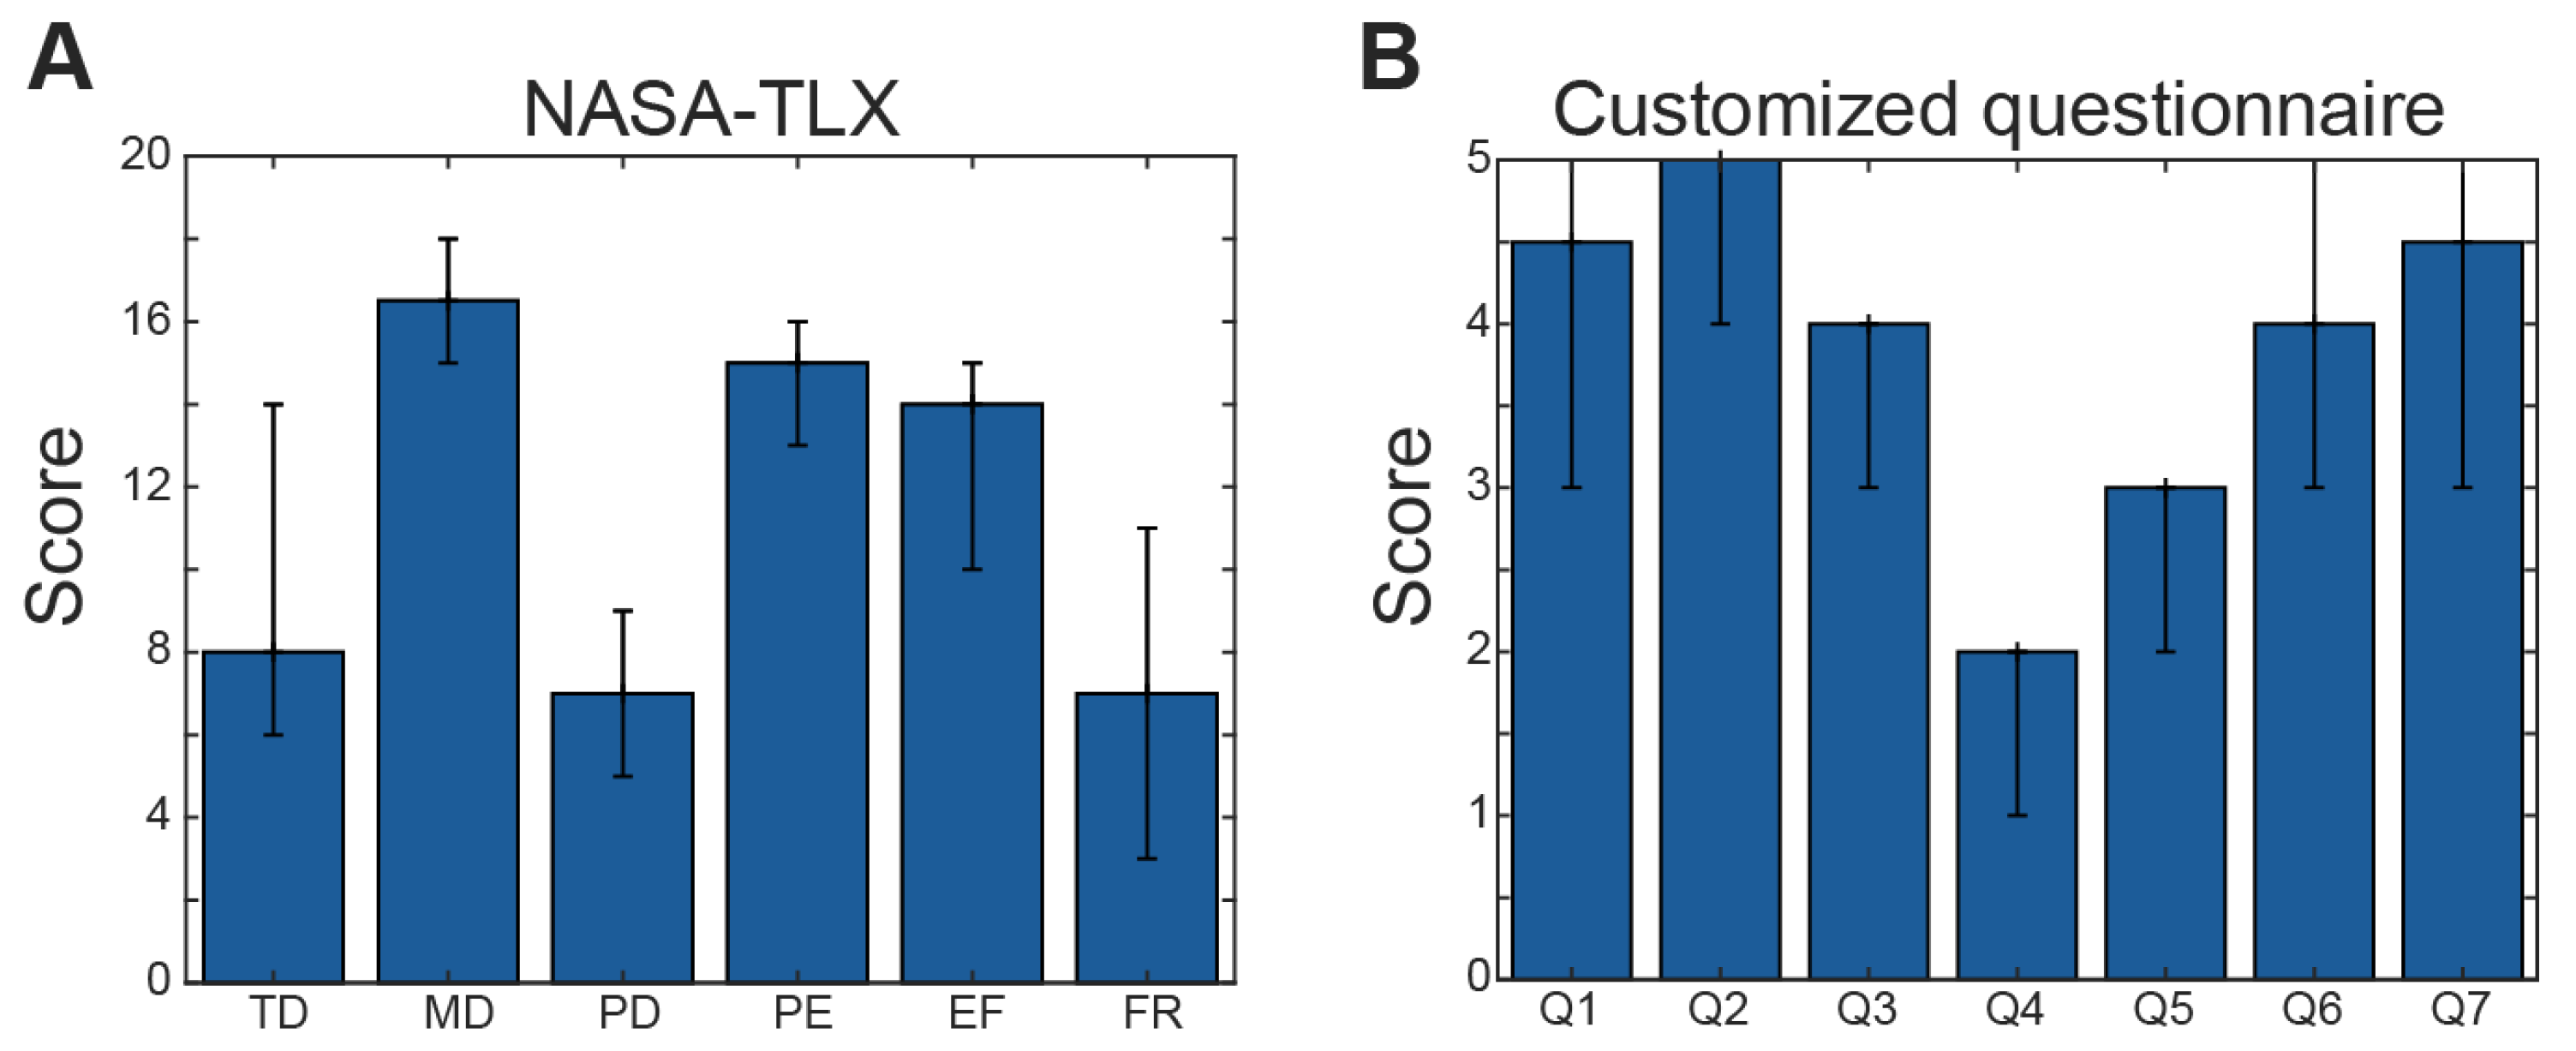
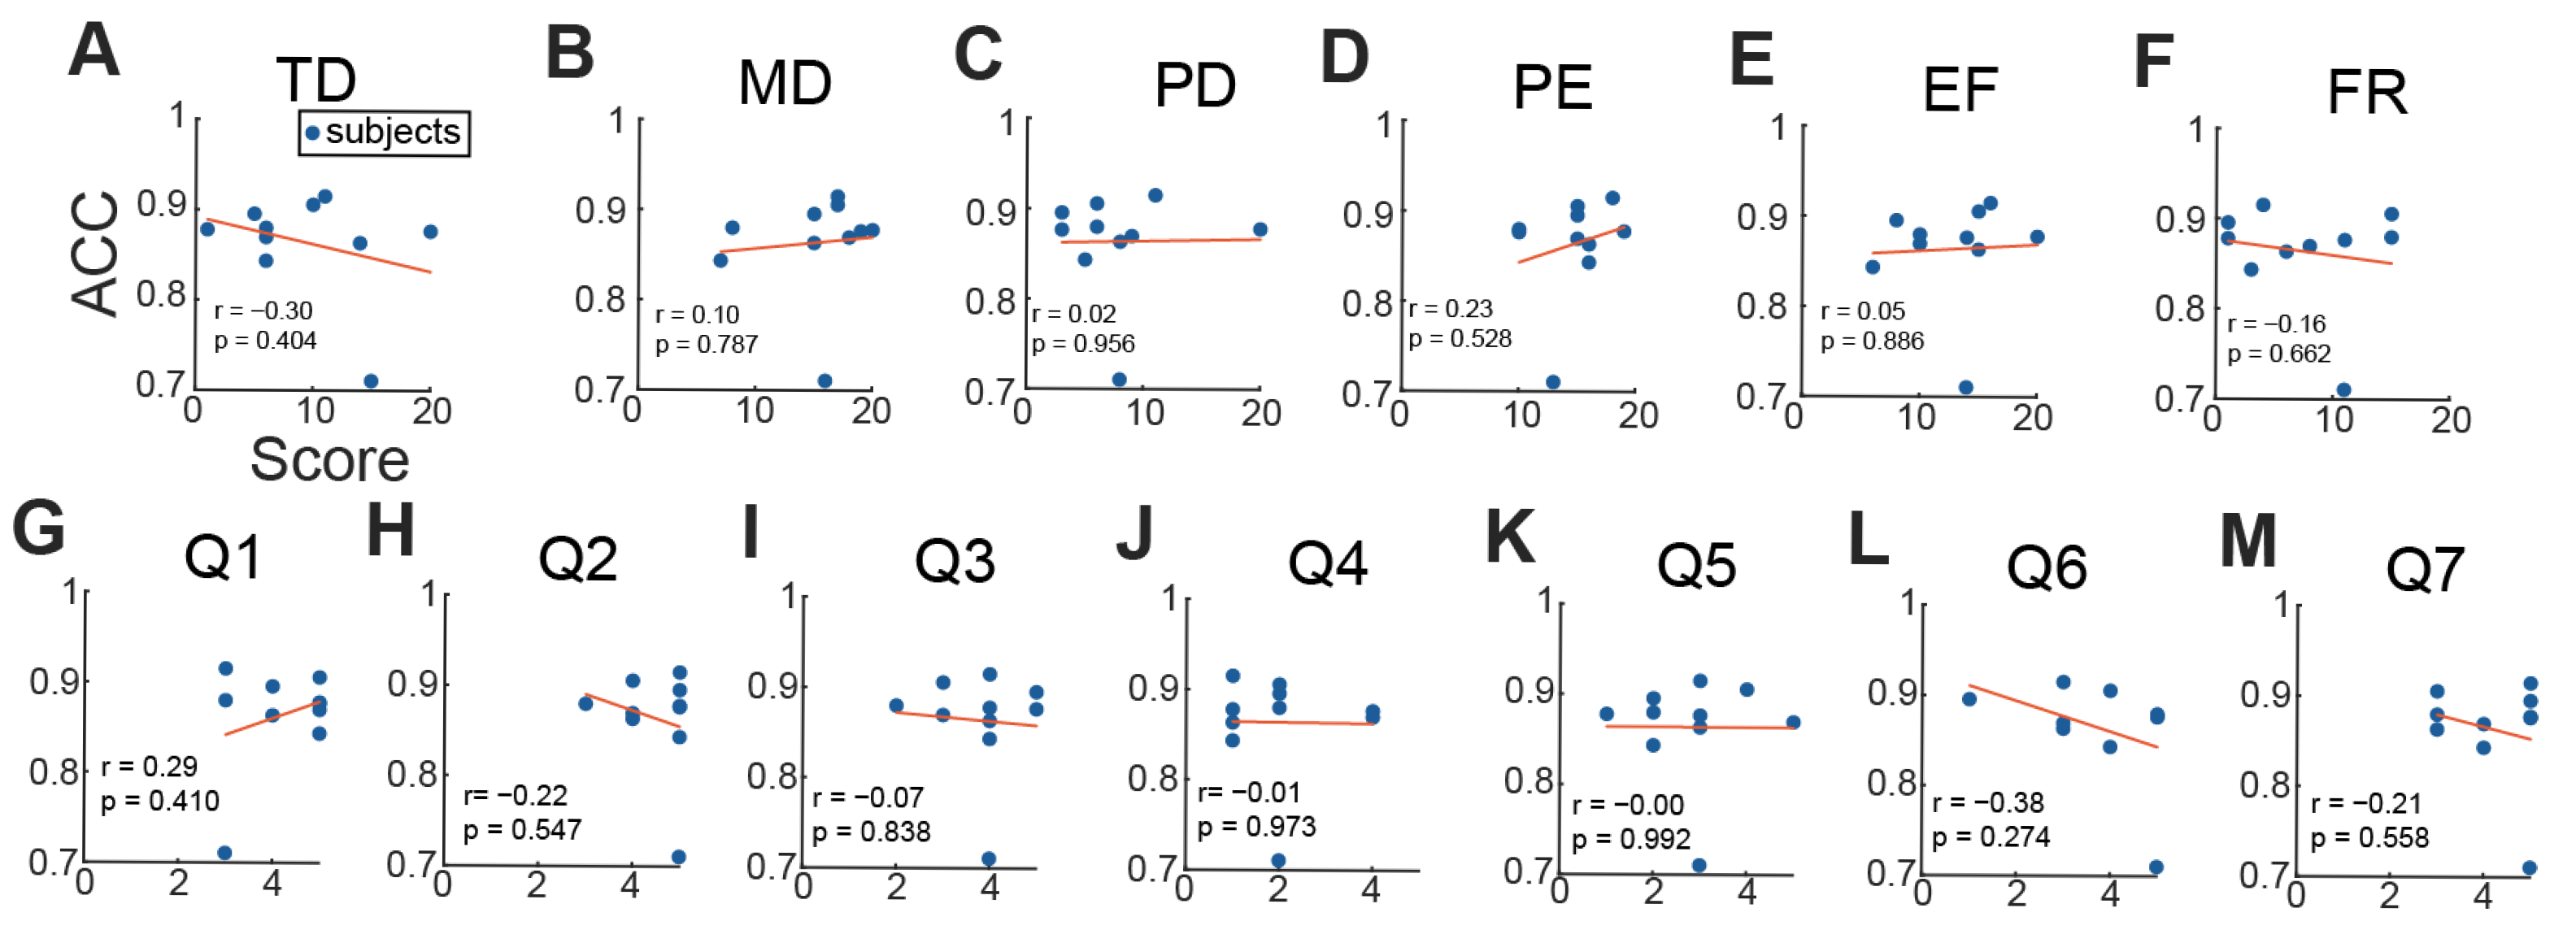
Median NASA-TLX scores indicated moderate to high MD, PE and EF—16.5 (3), 15 (3), and 14 (5), respectively—but moderate TD, PD, and FR—8 (8), 7 (4) and 7 (8)—across all participants (Figure 7A). Responses to the custom questionnaire generally suggested great comfort in Q1 (4.5 (2)), motivation in Q2 (5 (1)), concentration in Q3 (4 (1)), physical state in Q6 (4 (2)), mental state in Q7 (4 (2)) with lower visual fatigue in Q4 (2 (1)) and moderate somnolence in Q5 (3 (1)), across all participants (see Figure 7B). Pearson correlations between questionnaire responses and CNN classification accuracy revealed weak linear relationships (TD: r = −0.30; MD: r = 0.10; PE: r = 0.23; Q1: r = 0.29; Q2: r = −0.22; Q6: r = −0.38; Q7: r = −0.21; Figure 8), with non-statistical significance (p > 0.05). Correlations for the remaining items were negligible, i.e., r ≈ 0.

4. Discussion

This study explored cortical activation and decoding performance of EEG during MI and PP tasks at three pedaling speeds. Strong activation in central and parietal areas—especially around Cz—suggests prominent engagement of sensorimotor regions during both physical and imagined movement. Notably, distinct power variations were observed at lower (30 rpm) and higher speeds (45–60 rpm), indicating speed-dependent modulation of neural activity. Participants showed greater average Δ R values during physical pedaling (PP, 15%) compared to MI ( 10%). The deep learning method yielded the highest classification performance across conditions, while CSP + LDA classification obtained the highest performance among the machine learning strategies. These results demonstrate their effectiveness in EEG-based movement decoding.

4.1. Strong Cortical Activation Around Cz

The analysis of cortical activation showed consistent engagement of parietocentral regions, across both PP and MI conditions. These patterns, observed through Δ R , showed an increase in power variation for P01, P02, P06, and P10 at 30 rpm speed, whereas P05, P07, P08, and P09 showed this at 45-60 rpm speed. Furthermore, a more centered Δ R activation around Cz was found for P01, P04, P05, P07, P08, and P09. This aligns with findings from previous studies [38], which demonstrated overlapping sensorimotor activation and connectivity in these regions during PP and MI tasks at constant pedaling speeds.
Importantly, frequency-specific analyses indicated stronger modulations in the μ and β bands at 60 rpm compared to 30 rpm, across both conditions. This suggests that the neural representation of PP can also influence MI-related activity, particularly when participants have a clear reference for the speed. Such results suggest that velocity encoding in MI may be enhanced by prior motor experience, reinforcing the relevance of passive movements that leverage this sensorimotor coupling [9,13].

4.2. Topographic Patterns May Not Align with Cz

Although topographic maps revealed consistent activation in the centroparietal region, individual analysis of the Cz location showed that most participants exhibited higher energy values for PP compared to MI. This aligns with the known association between overt motor activity and sensorimotor rhythm modulation, particularly in the central cortex [13,39]. In contrast, MI, being a covert cognitive process, often elicits weaker and more variable responses—likely influenced by individual differences in concentration, imagery ability, and experience [39]. Moreover, group-averaged results may obscure individual differences in activation patterns [39]. Some participants showed maximal activity not at Cz, but in adjacent regions such as Pz or neighboring central sites, suggesting variability in spatial localization of MI-related activation [9]. This inter-subject variability emphasizes the importance of multivariate approaches, such as machine learning techniques, which consider the full spatial distribution of EEG features rather than relying on single-channel analysis [5]. These approaches will be explored below.

4.3. Effectiveness of CNN Multiclass Classification of Pedaling Tasks at Varying Velocities

We have evaluated multiple feature extraction and classification strategies for distinguishing pedaling tasks performed at different velocities. Among the approaches tested, the CNN yielded the highest classification performance across all tasks, followed by CSP and RG with LDA. In contrast, PSD features resulted in lower accuracy. Despite this, PSD-based classification still exceeded chance level (25%) in the four-class scenario, indicating the presence of informative spectral patterns.
The high performance of CNN suggests that advanced methods based on deep learning enhance discriminability between pedaling conditions, likely due to its ability to isolate task-relevant neural sources. The classification accuracies (ACC) and Cohen’s kappa values for the CNN method across the three task configurations were as follows: PP—ACC: 0.89; kappa: 0.86; MI—ACC: 0.88; kappa: 0.84; cross-condition PP+MI scenario—ACC: 0.87; kappa: 0.84 (see Figure 5). These results demonstrate that the proposed method significantly outperformed random classification and effective captured neural differences across task conditions. Furthermore, CSP obtained performance metrics between 0.67 and 0.76, which are higher than the chance probability and did not show a statistically significant difference regarding the CNN. This demonstrates that CSP could be feasible for approaches where the training time is crucial, like real-time BCIs, and at the same time, it can classify states with adequate accuracy.
The classification performance in our study (ACC range: 0.76–0.89) is comparable to prior multiclass EEG studies (see Table 1). For instance, Gu et al. [40] achieved approximately 0.75 accuracy for binary classification of left- vs. right-foot MI using time- and frequency-domain features with an SVM classifier. Similarly, Gao et al. [41] decoded leg MI during functional tasks (e.g., stair ascent, descent, and walking) and translated classification outputs into control signals for a prosthetic device, achieving a success rate of 0.81. Tariq et al. [42] reported accuracies up to 0.81 for classifying leg dorsiflexion MI using multiple classifiers, whereas Choi et al. [15] developed a BCI system for controlling a robotic exoskeleton across three states—walking, sitting, and resting—achieving classification accuracies near 0.80. Although these studies demonstrate the feasibility of classifying lower-limb MI, they primarily focus on binary or 3-class problems, and often target discrete or gait-related movements. In contrast, our work addresses a more complex 4-class problem involving cyclic pedaling tasks at different velocities, which introduces finer-grained motor distinctions and increased classification difficulty. This highlights a key gap in the literature related to multiclass classification velocity-dependent lower-limb tasks, such as pedaling.
Further, some prior studies employed features based on Event-Related Desynchronization (ERD) without conventional classifiers. For example, Severens et al. [43] used relative ERD features to distinguish walking from non-walking states, achieving 0.80 accuracy. Our own analysis of relative EEG power showed similar patterns, with notable differences in MI at 30 rpm and 60 rpm for certain participants (Figure 2). This suggests that power-based features, while limited in multiclass scenarios, may still contribute to distinguishing MI conditions across different movement speeds—especially when combined with spatial filtering techniques such as CSP or RG.
In the specific context of pedaling-related BCI systems, previous studies have primarily focused on binary classification. For example, Romero-Laiseca et al. developed a system based on MI of pedaling using an MMBE, achieving binary ACC of 0.69 [2]. Rodriguez-Ugarte et al. implemented a pseudo-online protocol to detect pedaling intention with an ACC of 0.85 [12], whereas Juan et al. employed Convolutional Neural Networks (CNNs) for MI classification, reporting an ACC of 0.80 [10]. Although promising, these studies relied on binary tasks, which limit the system degrees of freedom for more complex or continuous BCI applications [45].
In our study, the cross-condition, i.e., PP+MI, was more challenging to classify than either PP or MI alone. Furthermore, the confusion matrix showed that the lowest pedaling velocity (30 rpm) was the least distinguishable from the resting state, likely due to minimal sensorimotor activation at lower speeds. Notably, we found higher accuracy when distinguishing 60 rpm MI tasks, despite cortical rhythm analyses not clearly differentiating these speeds. This may be attributed to enhanced sensory feedback at intermediate pedaling velocities, which could improve imagery clarity—an effect also observed in studies on gait dynamics and speed-dependent neural processing [46,47]. This similarity may reflect a shared neural representation, whereby participants use the physical experience of PP as a reference during MI. In our protocol, this effect was observed across all pedaling speeds, suggesting that prior sensorimotor experience may enhance the consistency of MI, particularly when specific movement speeds are involved [2,4,48]. Future work should investigate how cortical rhythms and sensory representations interact across passive and imagined pedaling tasks, especially in clinical applications such as neurorehabilitation [9,16,49].
Subjective questionnaire responses were not significantly correlated with CNN classification accuracy. However, weak trends suggest that higher perceived mental demand and performance were associated with slightly higher ACC, which may reflect greater engagement in performing the MI tasks. Other factors, including motivation, physical state, and overall mental state, showed weak negative correlations, suggesting they were less related to EEG feature quality in this sample. Nonetheless, future studies with larger and more diverse populations, including participants with neuromotor deficits, may clarify these relationships. Additionally, incorporating targeted assessments of motor imagery ability, such as the Kinesthetic and Visual Imagery Questionnaire, may help reduce variability due to differences in MI performance [50].

4.4. Clinical Implications for Pedal-Based Rehabilitation BCIs

Pedal-based robotic systems, such as MMEBs, have gained attention in neurorehabilitation due to their ability to provide repetitive, cyclic lower-limb movements that enhance muscle activity, coordination, and gait performance [3]. Compared to other robotic platforms, MMEBs offer advantages such as portability, mechanical simplicity, and continuous motion support [3,6]. Recent studies have also shown that combining lower-limb cyclic exercises with visual neurofeedback can enhance both motor outcomes and patient engagement during therapy [5,9]. These findings underscore the potential of integrating BCI systems into MMEB platforms, particularly when such systems can interpret motor intentions, such as different imagined movement speeds, as demonstrated in our study.
A key limitation in many existing BCI systems is the reliance on binary control schemes (e.g., movement vs. no movement), which do not reflect the continuous and multi-dimensional nature of human motor control [51]. To address this, our work explores the possibility of using MI not just to imagine a movement, but to encode specific parameters such as movement speed in a multiclass classification approach. This could allow BCI systems to provide more robust control signals for rehabilitation devices.
Previous preliminary studies have demonstrated that passive pedaling movements at varying speeds can be classified using EEG-based machine learning algorithms [52]. While promising, passive movement alone may offer limited clinical benefit for certain patient populations, particularly those with severe motor impairments, since it does not engage volitional motor pathways. To address this, our work focuses on MI-driven EEG classification, which has the potential to activate devices such as MMEBs or deliver neurofeedback in a way that reinforces motor intention and supports sensorimotor recovery [2,9,13]. By demonstrating that MI of pedaling at distinct velocities can be decoded using EEG features, our findings provide a step toward developing more adaptive, intention-driven BCI systems.
Although our current results are preliminary, they demonstrate the potential of combining passive motion priors with MI and robust classification algorithms to distinguish imagined movement speeds. We believe this approach could support the development of more adaptive and personalized BCI systems, better aligned with the complexity of natural movement and tailored to individual patient and therapist needs.

4.5. Limitations and Future Directions

This study has limitations that should be acknowledged. First, the experimental protocol was limited to three passive pedaling speeds (30, 45, and 60 rpm), selected based on their relevance to common neurorehabilitation protocols and previous studies performed for pedaling or cycling movements [2,13,26,27,38]. This restricted range may limit the generalizability of our findings, particularly in applications requiring finer speed differentiation. Thus, expanding the range of velocities in future work may offer a more comprehensive understanding of the neural representation of lower-limb movement speeds.
Second, the number of trials per velocity condition was relatively low. This may have influenced classifier performance and reduced the robustness of the feature extraction techniques. Future studies should incorporate larger datasets with more trials per condition to improve model training and validation reliability.
Third, the CNN for this study employed a relatively simple architecture based on [36,37]. Its hyperparameters and structure were not extensively optimized, which may have limited classification performance. Future studies should explore alternative architectures, e.g., Long Short-Term Memory or graph neural networks, and perform systematic hyperparameter tuning to improve reliability [19].
Looking forward, this line of research aims to support the development of adaptive, MI-driven BCI systems integrated into MMEB platforms. The ability to classify imagined pedaling speeds may enable continuous, intention-based modulation of rehabilitation devices, offering a more personalized approach—particularly for individuals with motor impairments such as stroke survivors. Real-world validation, online implementations, and patient-specific adaptations are currently critical for translating these findings into clinically viable interventions, such as those explored in previous studies [2,13].

5. Conclusions

This study demonstrated the feasibility of decoding MI of pedaling at different speeds using EEG within a protocol that included PP as a preparatory condition. Results suggest that PP may enhance cortical engagement during MI, particularly around the Cz area, potentially supporting stronger mental representations of movement. While power-based features alone were limited, robust spatial filtering with CNN enabled classification across four classes (30, 45, 60 rpm, and rest) with accuracies close to 0.89.
These findings indicate that imagined pedaling at multiple velocities elicits distinguishable neural patterns, marking a novel step in lower-limb EEG research. Future studies will focus on clinical validation and integration into BCI-controlled devices for motor recovery in populations with neuromotor impairments.

Author Contributions

Conceptualization, C.F.B.-D. and D.D.-R.; methodology, C.F.B.-D. and A.X.G.-C.; software, C.F.B.-D., A.X.G.-C. and D.D.-R.; formal analysis, C.F.B.-D. and A.X.G.-C.; resources, D.D.-R. and T.F.B.-F.; data curation, C.F.B.-D.; writing—original draft preparation, C.F.B.-D. and A.X.G.-C.; writing—review and editing, D.D.-R. and T.F.B.-F.; visualization, C.F.B.-D. and A.X.G.-C.; supervision, D.D.-R. and T.F.B.-F.; project administration, T.F.B.-F.; funding acquisition, T.F.B.-F. All authors have read and agreed to the published version of the manuscript.

Funding

This research was supported by the Espirito Santo Research Support Foundation (FAPES)/Institute of Applied Computational Intelligence (I2CA) (Resolution N° 285/2021), Brazil, the Coordination for the Improvement of Higher Education Personnel (CAPES) (001), Brazil, and the CNPq under Grant 301233/2018-7, Brazil.

Institutional Review Board Statement

The study was conducted in accordance with the Declaration of Helsinki, and the protocol was approved by the Ethics Committee of the Federal University of Espírito Santo under the approval CAAE: 46099421.9.0000.5542, on 14 July 2021.

Informed Consent Statement

Informed consent was obtained from all subjects involved in the study.

Data Availability Statement

The data supporting the findings of this study are available from the corresponding author upon reasonable request.

Acknowledgments

The authors would like to thank those who participated in this study.

Conflicts of Interest

The authors declare no conflicts of interest.

References

  1. Mendelow, A.D. Stroke: Pathophysiology, Diagnosis, and Management; Elsevier Health Sciences: Amsterdam, The Netherlands, 2015. [Google Scholar] [CrossRef]
  2. Romero-Laiseca, M.A.; Delisle-Rodriguez, D.; Cardoso, V.; Gurve, D.; Loterio, F.; Nascimento, J.H.P.; Krishnan, S.; Frizera-Neto, A.; Bastos-Filho, T. A low-cost lower-limb brain-machine interface triggered by pedaling motor imagery for post-stroke patients rehabilitation. IEEE Trans. Neural Syst. Rehabil. Eng. 2020, 28, 988–996. [Google Scholar] [CrossRef]
  3. Fujita, K.; Kobayashi, Y.; Miaki, H.; Hori, H.; Tsushima, Y.; Sakai, R.; Nomura, T.; Ogawa, T.; Kinoshita, H.; Nishida, T.; et al. Pedaling improves gait ability of hemiparetic patients with stiff-knee gait: Fall prevention during gait. J. Stroke Cerebrovasc. Dis. 2020, 29, 105035. [Google Scholar] [CrossRef]
  4. Lima, J.P.; Silva, L.A.; Delisle-Rodriguez, D.; Cardoso, V.F.; Nakamura-Palacios, E.M.; Bastos-Filho, T.F. Unraveling Transformative Effects after tDCS and BCI Intervention in Chronic Post-Stroke Patient Rehabilitation—An Alternative Treatment Design Study. Sensors 2023, 23, 9302. [Google Scholar] [CrossRef]
  5. Yuan, Z.; Peng, Y.; Wang, L.; Song, S.; Chen, S.; Yang, L.; Liu, H.; Wang, H.; Shi, G.; Han, C.; et al. Effect of BCI-Controlled Pedaling Training System With Multiple Modalities of Feedback on Motor and Cognitive Function Rehabilitation of Early Subacute Stroke Patients. IEEE Trans. Neural Syst. Rehabil. Eng. 2021, 29, 2569–2577. [Google Scholar] [CrossRef]
  6. Dawson-Elli, A.R.; Adamczyk, P.G. Design and Validation of a Lower-Limb Haptic Rehabilitation Robot. IEEE Trans. Neural Syst. Rehabil. Eng. 2020, 28, 1584–1594. [Google Scholar] [CrossRef]
  7. Guggenberger, R.; Heringhaus, M.; Gharabaghi, A. Brain-machine neurofeedback: Robotics or electrical stimulation? Front. Bioeng. Biotechnol. 2020, 8, 639. [Google Scholar] [CrossRef]
  8. Lebedev, M.A.; Nicolelis, M.A. Brain-machine interfaces: From basic science to neuroprostheses and neurorehabilitation. Physiol. Rev. 2017, 97, 767–837. [Google Scholar] [CrossRef]
  9. Blanco-Diaz, C.F.; Serafini, E.R.d.S.; Bastos-Filho, T.; Dantas, A.F.O.d.A.; Santo, C.C.d.E.; Delisle-Rodriguez, D. A Gait Imagery-Based Brain–Computer Interface with Visual Feedback for Spinal Cord Injury Rehabilitation on Lokomat. IEEE Trans. Biomed. Eng. 2025, 72, 102–111. [Google Scholar] [CrossRef]
  10. Juan, J.V.; Martínez, R.; Iáñez, E.; Ortiz, M.; Tornero, J.; Azorín, J.M. Exploring EEG-based motor imagery decoding: A dual approach using spatial features and spectro-spatial Deep Learning model IFNet. Front. Neuroinformatics 2024, 18, 1345425. [Google Scholar] [CrossRef]
  11. Tanuma, A.; Fujiwara, T.; Yamaguchi, T.; Ro, T.; Arano, H.; Uehara, S.; Honaga, K.; Mukaino, M.; Kimura, A.; Liu, M. After-effects of pedaling exercise on spinal excitability and spinal reciprocal inhibition in patients with chronic stroke. Int. J. Neurosci. 2017, 127, 73–79. [Google Scholar] [CrossRef]
  12. Rodríguez-Ugarte, M.; Iáñez, E.; Ortíz, M.; Azorín, J.M. Personalized Offline and Pseudo-Online BCI Models to Detect Pedaling Intent. Front. Neuroinformatics 2017, 11, 45. [Google Scholar] [CrossRef]
  13. Delisle-Rodriguez, D.; Silva, L.; Bastos-Filho, T. EEG changes during passive movements improve the motor imagery feature extraction in BCIs-based sensory feedback calibration. J. Neural Eng. 2023, 20, 016047. [Google Scholar] [CrossRef]
  14. Gottesman, R.F.; Hillis, A.E. Predictors and assessment of cognitive dysfunction resulting from ischaemic stroke. Lancet Neurol. 2010, 9, 895–905. [Google Scholar] [CrossRef]
  15. Choi, J.; Kim, K.T.; Jeong, J.H.; Kim, L.; Lee, S.J.; Kim, H. Developing a motor imagery-based real-time asynchronous hybrid BCI controller for a lower-limb exoskeleton. Sensors 2020, 20, 7309. [Google Scholar] [CrossRef]
  16. Donati, A.R.; Shokur, S.; Morya, E.; Campos, D.S.; Moioli, R.C.; Gitti, C.M.; Augusto, P.B.; Tripodi, S.; Pires, C.G.; Pereira, G.A.; et al. Long-term training with a brain-machine interface-based gait protocol induces partial neurological recovery in paraplegic patients. Sci. Rep. 2016, 6, 30383. [Google Scholar] [CrossRef]
  17. Zhou, Y.; Huang, S.; Xu, Z.; Wang, P.; Wu, X.; Zhang, D. Cognitive Workload Recognition Using EEG Signals and Machine Learning: A Review. IEEE Trans. Cogn. Dev. Syst. 2022, 14, 799–818. [Google Scholar] [CrossRef]
  18. Ferrero, L.; Quiles, V.; Ortiz, M.; Iáñez, E.; Gil-Agudo, Á.; Azorín, J.M. Brain-computer interface enhanced by virtual reality training for controlling a lower limb exoskeleton. Iscience 2023, 26, 106675. [Google Scholar] [CrossRef]
  19. Klepl, D.; Wu, M.; He, F. Graph neural network-based eeg classification: A survey. IEEE Trans. Neural Syst. Rehabil. Eng. 2024, 32, 493–503. [Google Scholar] [CrossRef]
  20. Faul, F.; Erdfelder, E.; Lang, A.G.; Buchner, A. G* Power 3: A flexible statistical power analysis program for the social, behavioral, and biomedical sciences. Behav. Res. Methods 2007, 39, 175–191. [Google Scholar] [CrossRef]
  21. Quiles, V.; Ferrero, L.; Iáñez, E.; Ortiz, M.; Gil-Agudo, Á.; Azorín, J.M. Brain-machine interface based on transfer-learning for detecting the appearance of obstacles during exoskeleton-assisted walking. Front. Neurosci. 2023, 17, 1154480. [Google Scholar] [CrossRef]
  22. Soriano-Segura, P.; Ortiz, M.; Iáñez, E.; Azorín, J.M. Design of a brain-machine interface for reducing false activations of a lower-limb exoskeleton based on error related potential. Comput. Methods Programs Biomed. 2024, 255, 108332. [Google Scholar] [CrossRef]
  23. Storzer, L.; Butz, M.; Hirschmann, J.; Abbasi, O.; Gratkowski, M.; Saupe, D.; Schnitzler, A.; Dalal, S.S. Bicycling and walking are associated with different cortical oscillatory dynamics. Front. Hum. Neurosci. 2016, 10, 61. [Google Scholar] [CrossRef]
  24. Arvaneh, M.; Guan, C.; Ang, K.K.; Quek, C. Optimizing the channel selection and classification accuracy in EEG-based BCI. IEEE Trans. Biomed. Eng. 2011, 58, 1865–1873. [Google Scholar] [CrossRef] [PubMed]
  25. Tortora, S.; Ghidoni, S.; Chisari, C.; Micera, S.; Artoni, F. Deep learning-based BCI for gait decoding from EEG with LSTM recurrent neural network. J. Neural Eng. 2020, 17, 046011. [Google Scholar] [CrossRef] [PubMed]
  26. Cleland, B.T.; Schindler-Ivens, S. Brain activation during passive and volitional pedaling after stroke. Mot. Control 2019, 23, 52–80. [Google Scholar] [CrossRef] [PubMed]
  27. Mullens, C.H.; Brown, D.A. Visual feedback during pedaling allows individuals poststroke to alter inappropriately prolonged paretic vastus medialis activity. J. Neurophysiol. 2018, 119, 2334–2346. [Google Scholar] [CrossRef]
  28. Ang, K.K.; Chin, Z.Y.; Wang, C.; Guan, C.; Zhang, H. Filter bank common spatial pattern algorithm on BCI competition IV datasets 2a and 2b. Front. Neurosci. 2012, 6, 39. [Google Scholar] [CrossRef]
  29. Lee, M.H.; Kwon, O.Y.; Kim, Y.J.; Kim, H.K.; Lee, Y.E.; Williamson, J.; Fazli, S.; Lee, S.W. EEG dataset and OpenBMI toolbox for three BCI paradigms: An investigation into BCI illiteracy. GigaScience 2019, 8, giz002. [Google Scholar] [CrossRef]
  30. Kusano, K.; Hayashi, M.; Iwama, S.; Ushiba, J. Improved motor imagery skills after repetitive passive somatosensory stimulation: A parallel-group, pre-registered study. Front. Neural Circuits 2025, 18, 1510324. [Google Scholar] [CrossRef]
  31. Nakashima, A.; Moriuchi, T.; Matsuda, D.; Nakamura, J.; Fujiwara, K.; Ikio, Y.; Hasegawa, T.; Mitunaga, W.; Higashi, T. Continuous repetition motor imagery training and physical practice training exert the growth of fatigue and its effect on performance. Brain Sci. 2022, 12, 1087. [Google Scholar] [CrossRef]
  32. Zenia, N.Z.; Tarng, S.; Dizaji, L.G.; Hu, Y. EEG Features to Quantify the NASA-TLX Factors of Cognitive Workload. IEEE Trans. Hum.-Mach. Syst. 2025, 55, 372–382. [Google Scholar] [CrossRef]
  33. Dong, E.; Li, C.; Li, L.; Du, S.; Belkacem, A.N.; Chen, C. Classification of multi-class motor imagery with a novel hierarchical SVM algorithm for brain–computer interfaces. Med. Biol. Eng. Comput. 2017, 55, 1809–1818. [Google Scholar] [CrossRef]
  34. Barachant, A.; Bonnet, S.; Congedo, M.; Jutten, C. Multiclass brain–computer interface classification by Riemannian geometry. IEEE Trans. Biomed. Eng. 2011, 59, 920–928. [Google Scholar] [CrossRef] [PubMed]
  35. Yger, F.; Berar, M.; Lotte, F. Riemannian approaches in brain-computer interfaces: A review. IEEE Trans. Neural Syst. Rehabil. Eng. 2016, 25, 1753–1762. [Google Scholar] [CrossRef] [PubMed]
  36. Jain, A.; Kumar, L. Subject-independent trajectory prediction using pre-movement EEG during grasp and lift task. Biomed. Signal Process. Control 2023, 86, 105160. [Google Scholar] [CrossRef]
  37. Blanco-Diaz, C.F.; Guerrero-Mendez, C.D.; de Andrade, R.M.; Badue, C.; De Souza, A.F.; Delisle-Rodriguez, D.; Bastos-Filho, T. Decoding lower-limb kinematic parameters during pedaling tasks using deep learning approaches and EEG. Med. Biol. Eng. Comput. 2024, 62, 3763–3779. [Google Scholar] [CrossRef]
  38. Cardoso, V.F.; Delisle-Rodriguez, D.; Romero-Laiseca, M.A.; Loterio, F.A.; Gurve, D.; Floriano, A.; Valadão, C.; Silva, L.; Krishnan, S.; Frizera-Neto, A.; et al. Effect of a Brain–Computer Interface Based on Pedaling Motor Imagery on Cortical Excitability and Connectivity. Sensors 2021, 21, 2020. [Google Scholar] [CrossRef]
  39. Höller, Y.; Bergmann, J.; Kronbichler, M.; Crone, J.S.; Schmid, E.V.; Thomschewski, A.; Butz, K.; Schütze, V.; Höller, P.; Trinka, E. Real movement vs. motor imagery in healthy subjects. Int. J. Psychophysiol. 2013, 87, 35–41. [Google Scholar] [CrossRef]
  40. Gu, L.; Yu, Z.; Ma, T.; Wang, H.; Li, Z.; Fan, H. EEG-based classification of lower limb motor imagery with brain network analysis. Neuroscience 2020, 436, 93–109. [Google Scholar] [CrossRef] [PubMed]
  41. Gao, H.; Luo, L.; Pi, M.; Li, Z.; Li, Q.; Zhao, K.; Huang, J. EEG-Based Volitional Control of Prosthetic Legs for Walking in Different Terrains. IEEE Trans. Autom. Sci. Eng. 2021, 18, 530–540. [Google Scholar] [CrossRef]
  42. Tariq, M.; Trivailo, P.M.; Simic, M. Mu-Beta event-related (de) synchronization and EEG classification of left-right foot dorsiflexion kinaesthetic motor imagery for BCI. PLoS ONE 2020, 15, e0230184. [Google Scholar] [CrossRef]
  43. Severens, M.; Perusquia-Hernandez, M.; Nienhuis, B.; Farquhar, J.; Duysens, J. Using Actual and Imagined Walking Related Desynchronization Features in a BCI. IEEE Trans. Neural Syst. Rehabil. Eng. 2015, 23, 877–886. [Google Scholar] [CrossRef]
  44. Luu, T.P.; Nakagome, S.; He, Y.; Contreras-Vidal, J.L. Real-time EEG-based brain-computer interface to a virtual avatar enhances cortical involvement in human treadmill walking. Sci. Rep. 2017, 7, 8895. [Google Scholar] [CrossRef] [PubMed]
  45. Nakagome, S.; Luu, T.P.; He, Y.; Ravindran, A.S.; Contreras-Vidal, J.L. An empirical comparison of neural networks and machine learning algorithms for EEG gait decoding. Sci. Rep. 2020, 10, 4372. [Google Scholar] [CrossRef] [PubMed]
  46. Quiles, V.; Ferrero, L.; Iáñez, E.; Ortiz, M.; Cano, J.M.; Azorín, J.M. Detecting the speed change intention from EEG signals: From the offline and pseudo-online analysis to an online closed-loop validation. Appl. Sci. 2022, 12, 415. [Google Scholar] [CrossRef]
  47. Wu, C.; Qiu, S.; Xing, J.; He, H. A CNN-based compare network for classification of SSVEPs in human walking. In Proceedings of the 2020 42nd Annual International Conference of the IEEE Engineering in Medicine & Biology Society (EMBC), Montreal, QC, Canada, 20–24 July 2020; pp. 2986–2990. [Google Scholar] [CrossRef]
  48. Sauvage, C.; Jissendi Tchofo, P.; Manto, M.; Habas, C. Brain areas involved in the control of speed during amotor sequence of the foot: Real movement versus mental imagery. J. Neuroradiol. 2013, 42, 115–125. [Google Scholar] [CrossRef]
  49. Sebastián-Romagosa, M.; Cho, W.; Ortner, R.; Sieghartsleitner, S.; Von Oertzen, T.J.; Kamada, K.; Laureys, S.; Allison, B.Z.; Guger, C. Brain–computer interface treatment for gait rehabilitation in stroke patients. Front. Neurosci. 2023, 17, 1256077. [Google Scholar] [CrossRef]
  50. Malouin, F.; Richards, C.L.; Jackson, P.L.; Lafleur, M.F.; Durand, A.; Doyon, J. The Kinesthetic and Visual Imagery Questionnaire (KVIQ) for assessing motor imagery in persons with physical disabilities: A reliability and construct validity study. J. Neurol. Phys. Ther. 2007, 31, 20–29. [Google Scholar] [CrossRef]
  51. Padfield, N.; Zabalza, J.; Zhao, H.; Masero, V.; Ren, J. EEG-Based Brain-Computer Interfaces Using Motor-Imagery: Techniques and Challenges. Sensors 2019, 19, 1423. [Google Scholar] [CrossRef]
  52. Gonzalez-Cely, A.; Blanco-Diaz, C.; Delisle-Rodriguez, D.; Bastos-Filho, T. EEG-Based Multi-Class Classification for Recognizing Pedaling Velocities: A Promising Approach for Brain-Computer Interface-Enhanced Lower-Limb Robotic Rehabilitation. In Proceedings of the 2024 10th IEEE RAS/EMBS International Conference for Biomedical Robotics and Biomechatronics (BioRob), Heidelberg, Germany, 1–4 September 2024; pp. 223–228. [Google Scholar] [CrossRef]
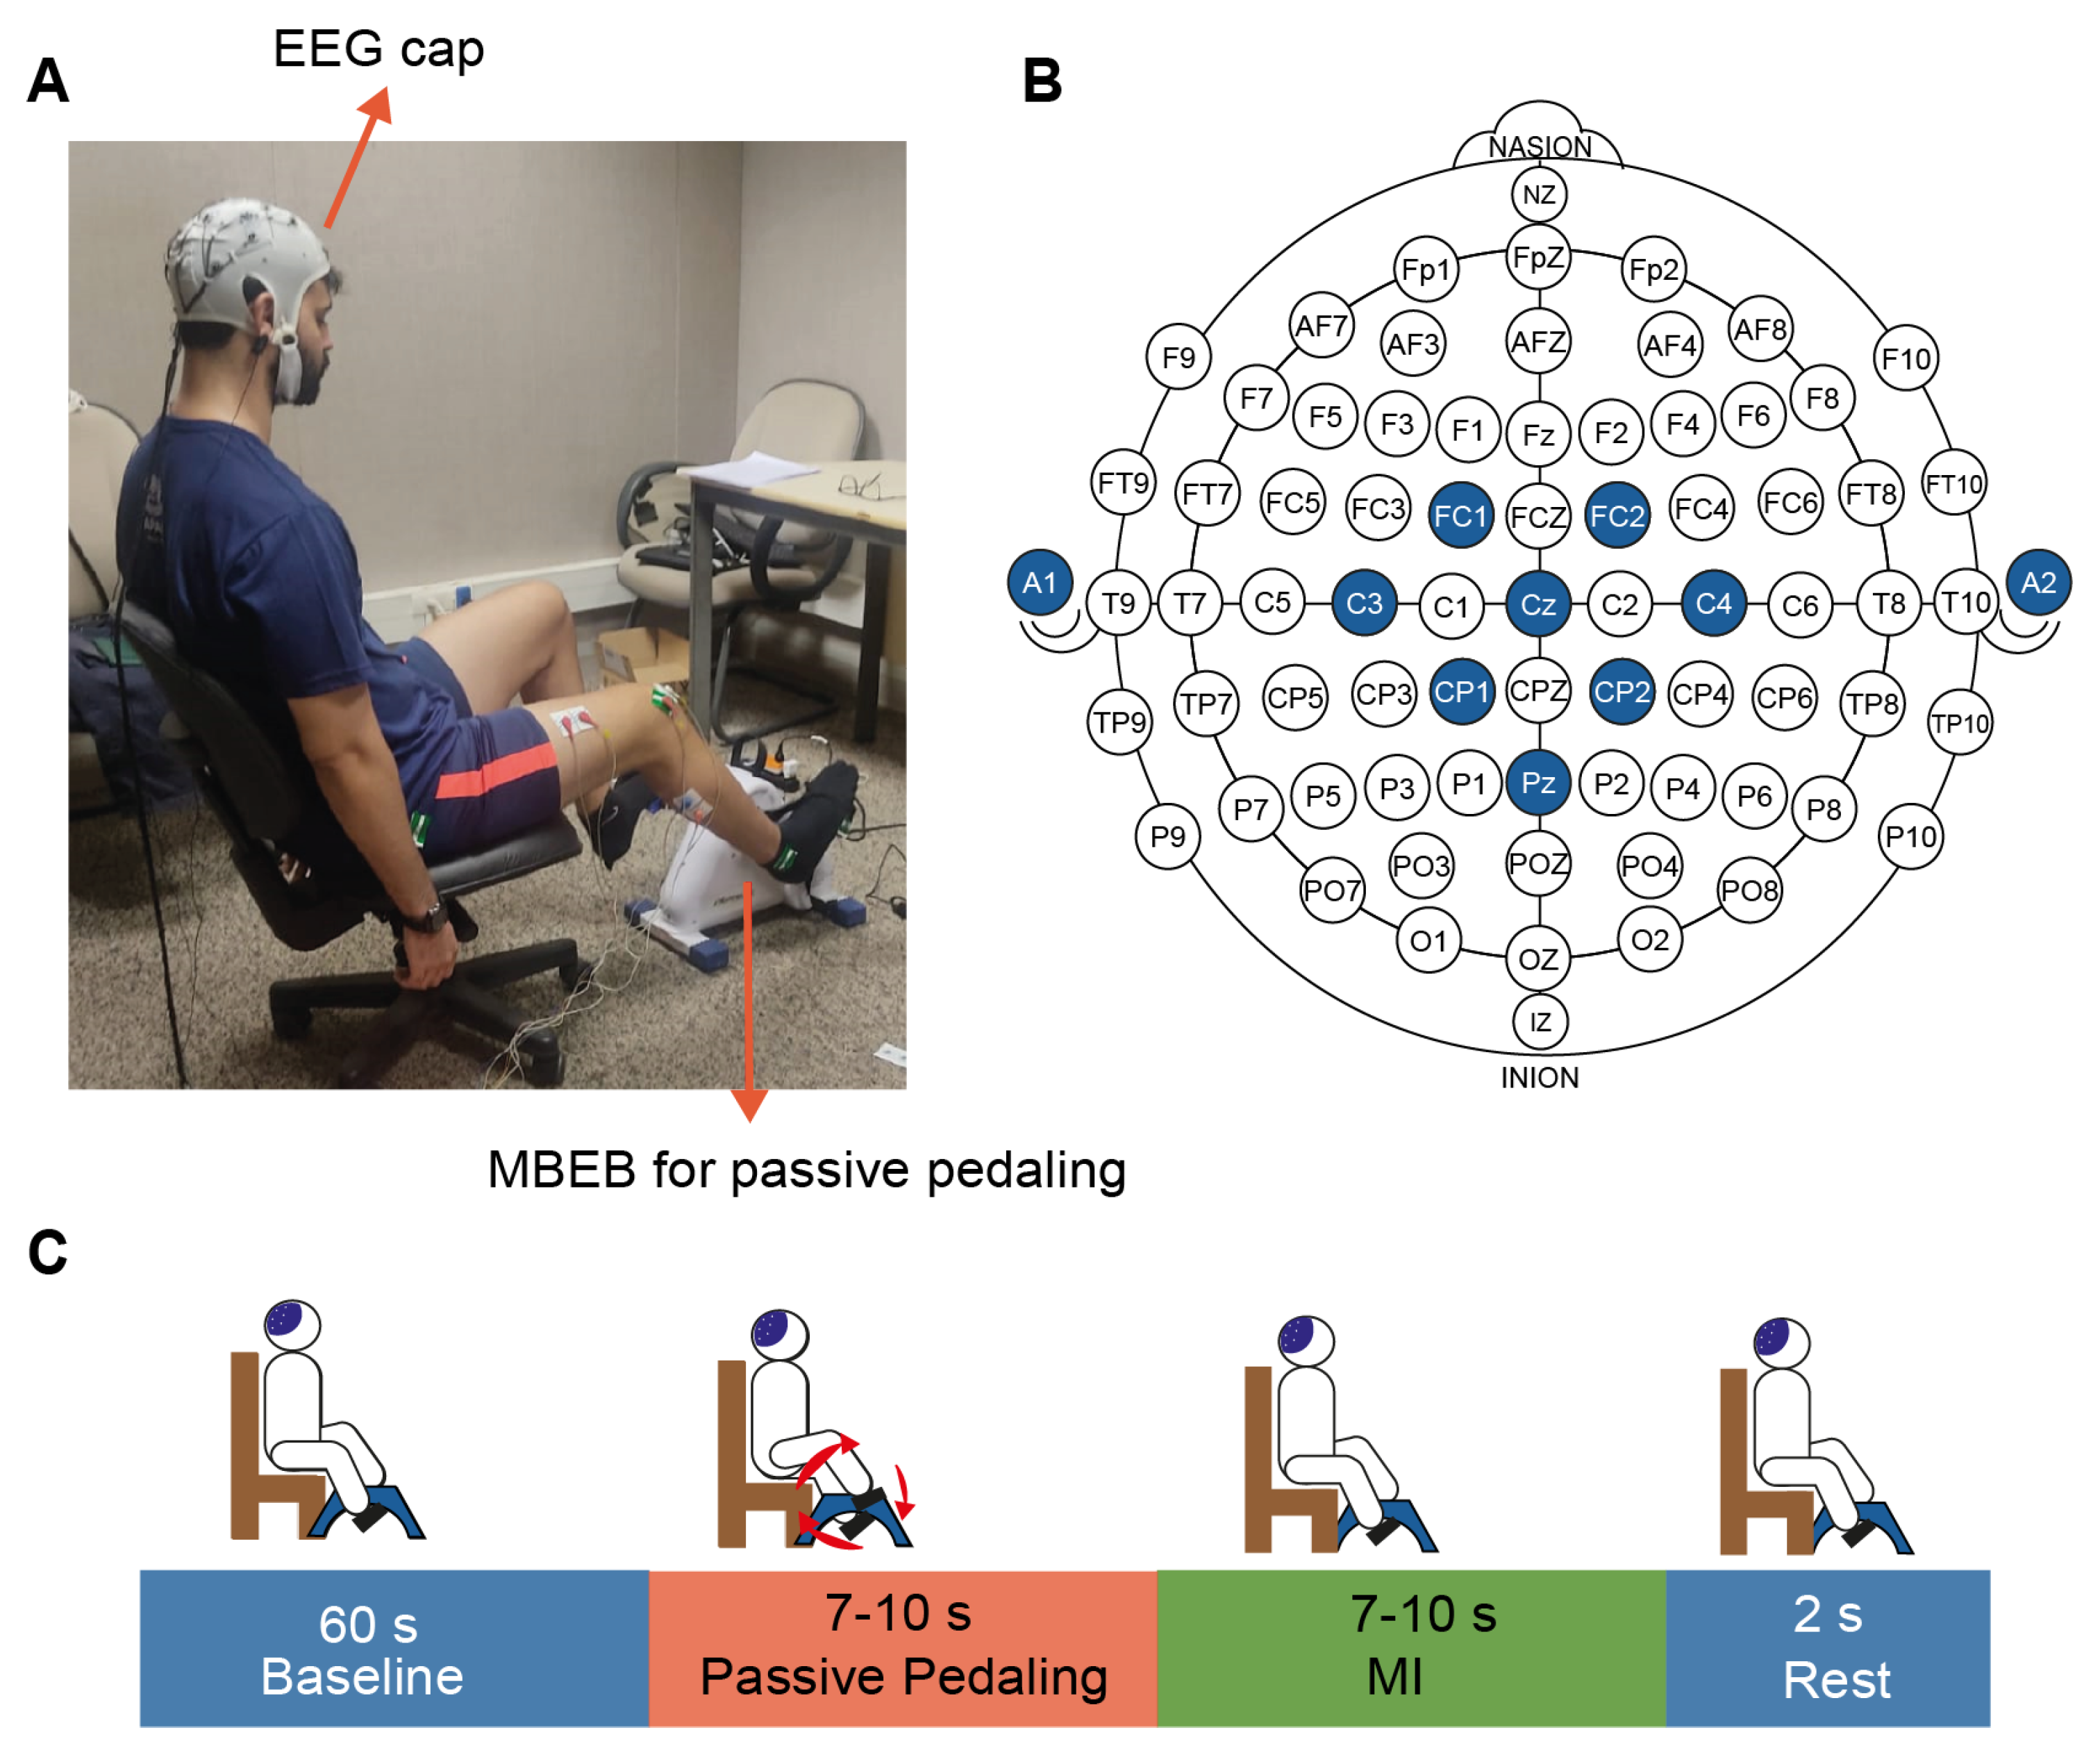
Figure 1. Materials and methods used for EEG acquisition during execution of pedaling MI tasks at different speeds. (A) Experimental setup for EEG acquisition during the pedaling tasks using the MMEB. (B) EEG channels’ locations according to the international system 10–20. (C) Timing for MI execution after PP at different speeds.
Signals 06 00052 g001
Figure 2. Relative power (%) spatial distribution per location for each individual during the performance of PP and MI at different speeds.
Signals 06 00052 g002
Figure 3. Boxplots showing the distribution (median and IQR) of the absolute relative power changes (%) at Cz during PP and MI at three speeds (30, 45, and 60 rpm). Absolute values were used to account for inter-subject variability in the direction (positive or negative) of power changes. Asterisks (*) indicate statistically significant differences between PP and MI at each speed (p < 0.05).
Signals 06 00052 g003
Figure 4. Classification performance of EEG using feature-based methods (PSD, CSP, RG with LDA or SVM) and CNN. Boxplots show ACC (median and IQR) across participants for three scenarios: (A) PP, (B) MI, and (C) cross-condition (trained on PP, tested on MI). Asterisks (*) indicate statistically significant differences (p < 0.05).
Signals 06 00052 g004
Figure 5. Performance metrics (median and IQR): ACC, AUC, and kappa during classification of PP, MI, and cross-condition states at various speeds, using (A) CSP-LDA, (B) RG+ LDA, and (C) CNN, across all participants.
Signals 06 00052 g005
Figure 6. Confusion matrix for overall classification of resting and pedaling MI at different speeds by using (A) CSP + LDA, (B) RG+ LDA, and (C) CNN. Note: Blue intensity denotes higher percentages (close to 100%), while white denotes values near 0%.
Signals 06 00052 g006
Figure 7. Median response of the subjective questionnaires across subjects: (A) NASA-TLX and (B) custom questionnaire. Bar indicates median whereas error lines indicate IQR.
Signals 06 00052 g007
Figure 8. Correlations between subjective questionnaire responses and performance in ACC of CNN: (AF) NASA-TLX, (GM) custom questionnaire. r means Pearson correlation coefficient.
Signals 06 00052 g008
Table 1. Comparison of related works based on lower-limb recognition using EEG signals.
ApproachFeaturesClassifierACCRef.
Rest and pedaling MIRG, CSPLDA, ANN0.69, 0.80[2,10]
Attention level on virtual pedalingFrequency--[5]
Rest and pedaling intentionFrequencySVM0.77[12]
Rest and sitting and walking MIFilter bank CSPSVM0.80[15]
Left- and right-foot MITime–frequencySVM0.75[40]
Leg MI during ascending stairs, descending stairs, and floor walkingCSPSVM0.81[41]
Right and left dorsiflexionTime–frequencyKNN0.81[42]
Walking and non-walking, both executed and imaginedERD-0.80[43]
Decoding continuous lower-limbANN and KF--[44,45]
Rest and pedaling MI at 30 rpm, 45 rpm and 60 rpmCSP,-LDA, CNN0.76, 0.87Ours
Disclaimer/Publisher’s Note: The statements, opinions and data contained in all publications are solely those of the individual author(s) and contributor(s) and not of MDPI and/or the editor(s). MDPI and/or the editor(s) disclaim responsibility for any injury to people or property resulting from any ideas, methods, instructions or products referred to in the content.