1. Introduction
Mapping geological formations is essential for understanding geodynamic processes, identifying natural resources, and assessing geological risks. The precise identification of geological formations is a key issue for understanding tectonic structures, planning mining activities, and sustainably managing natural resources. This field goes beyond scientific boundaries to play a strategic role in economic development, environmental preservation, and population security [
1]. Due to the difficult access conditions and the superposition of soil and plant covers, this task remains challenging in mountainous and densely vegetated regions, such as the Western Highlands of Cameroon [
2]. These constraints limit the effectiveness of conventional mapping methods based on field surveys and geophysical observations. However, the emergence of remote sensing technologies and machine learning algorithms provides new opportunities to overcome these obstacles and provide robust and scalable solutions. Multisource satellite data, combining optical images, radar, and digital terrain models (DTMs), enable detailed analysis of geological features, even in complex environments [
3]. LANDSAT and ALOS PALSAR images provide complementary perspectives: optical data capture spectral information about mineral composition, while radar data reveal underlying structures through their sensitivity to surface roughness [
4]. Additionally, DTMs, such as those provided by the SRTM (Shuttle Radar Topography Mission), facilitate the extraction of morphometric parameters essential for identifying tectonic structures and drainage patterns. Integrating these multisource data with advanced machine learning techniques represents a significant breakthrough in this context [
5]. Supervised learning models, such as decision trees and neural networks, allow for capturing complex relationships between environmental, spectral, and morphometric variables, leading to more accurate and automated geological classification. This approach provides a better understanding of local geological systems and a strategic tool for water resource management, sustainable mining, and natural hazard assessment applications. This article proposes an innovative methodology combining multi-source satellite data and machine learning algorithms to detect and map the geological formations of the Western Highlands of Cameroon. The objective is to establish a reproducible and extensible methodological framework capable of responding to the challenges linked to this region’s geological complexity and environmental variability.
Our study made the following contributions:
We have created a complete and representative dataset of different types of geological formations. This dataset is based on the integration of multiple satellite imagery sources. The data were carefully preprocessed to match spatial resolutions and correct for atmospheric biases. This process guarantees consistency and optimal quality for the analysis and classification phase. This multi-source approach maximizes the information available, allowing a more precise and complete exploration of the types of geological formations.
We analyzed three advanced classification algorithms: Random Forest, XGBoost, and Gradient Boosting. These methods were selected for their ability to handle complex and multidimensional data and their robustness to noise. Each algorithm was evaluated using the different parameters extracted from satellite data, allowing us to identify each approach’s performances and specificities for classifying the types of geological formations.
A key aspect of our methodology involves merging the highest precision parameters. This data fusion, which incorporated spectral, morphometric, and topographical features, leveraged the information’s complementarity. Subsequently, we performed a new classification using the fused data to assess the impact of multi-source integration on the accuracy and efficiency of the algorithms. This approach underscored the critical role of combining diverse data types in enhancing the overall performance of geological classification.
The manuscript is structured as follows:
Section 2 reviews the state-of-the art on pod maturity and methods based on color spaces.
Section 3 describes the materials used and the methodologies adopted as part of our approach.
Section 4 presents the experiments conducted, and the results obtained.
Section 5 performs an in-depth analysis (ablation) of our study. Finally,
Section 6 discusses these results and concludes the study.
2. Related Work
Satellite imagery offers a synthetic and detailed perspective of geological formations, making it possible to analyze deep structures, map the different rocks, and understand the tectonic processes at work. Much research has been conducted in this area, highlighting the importance of this issue for society.
Among them, Wang et al. proposed a method for geological mapping by merging multi-source data (geochemical, geophysical, and remote sensing) within a fully convolutional neural network (FCN) model [
6]. This approach captures complex relationships between geological features and obtains precise predictions. The results obtained on the Cuonadong dome, with an overall classification accuracy of 0.96 and an average intersection over union (IoU) index of 0.9, demonstrate the exceptional performance of the proposed model. Wei et al. combine multispectral images (Sentinel-2) and synthetic aperture radar data (Sentinel-1) to take advantage of the complementarities of these two sources [
7]. By exploiting the complementarities of Sentinel-1 and Sentinel-2 data, their model learns to extract the most discriminating features for river detection. Using this benchmark dataset, they demonstrated their method’s superiority over traditional approaches. The results of their experiment achieved an F1 score of 91.53% on the created dataset. Wan et al. developed SAGTR, an integrated satellite-air-ground system, for faster and more accurate detection of anomalies in mountainous areas, where mine tailings reservoirs require rigorous monitoring, thereby improving environmental risk management [
8]. Liu et al. exploited the potential of MODIS satellite data and deep learning (LSTM and attention mechanism) to develop an accurate and reliable grain yield forecasting model [
9]. Their results, evaluated on a large set of data, demonstrate the relevance of this approach for agriculture. Although the results are encouraging for China, generalization to other geographic regions may be limited due to differences in climate, soil types, agricultural practices, and grain varieties. Lahssini et al. developed a deep learning model (CHNET) to map canopy height in French Guiana using multi-source satellite data [
10]. The model, integrating environmental data, showed promising results but has limits for very high canopies. The study highlights the importance of improving the quality and analysis of GEDI data to characterize tropical forests better. Tan et al. surveyed soil erosion in gardens in Xishuangbanna, a tropical region of China [
11]. Faced with the growing threat to food security and biodiversity, they combined satellite imagery, field surveys, and visual interpretation to map the gardens and their conservation measures finely. Using the Chinese Soil Erosion Model (CSLE), they quantified erosion rates and identified the most vulnerable areas. Their results show that gardens with less than 30% plant cover experience irreversible erosion, responsible for 68.19% of total soil loss. Ji et al. developed an innovative model to map forest fire risk in the Anning Valley of China [
12]. By combining environmental data and machine learning techniques, they obtained a robust predictive model with greater than 86% accuracy compared to historical data. This study constitutes a significant advance in the management of forest fires by allowing precise identification of risk areas and, thus, better prevention. However, the transferability of results to other geographic regions may be limited. Risk factors and their relative importance vary considerably depending on climatic, ecological, and socio-economic conditions. W. Han et al. developed an innovative method of geological interpretation using remote sensing images [
13]. By intelligently merging multi-source data using a deep neural network, they can precisely identify many geological elements, from lithology to glaciers. Extracting features at different scales strengthens the robustness of their model. Experimental results confirm the effectiveness of this approach for geological interpretation. Sousa et al.’s study used satellite remote sensing to monitor geological hazard areas [
14]. In particular, they developed a new method combining a deep learning model (ECA U-Net) and InSAR to detect mining subsidence. Furthermore, they applied the SBAS InSAR technique to monitor the Xiaolangdi dam, highlighting significant deformations. The study also explores the potential of InSAR to protect architectural heritage and proposes a new method for temporal detection of landslides based on optical imaging. The results highlight the effectiveness of AI coupled with InSAR for improving the monitoring of geological risks.
3. Study Area
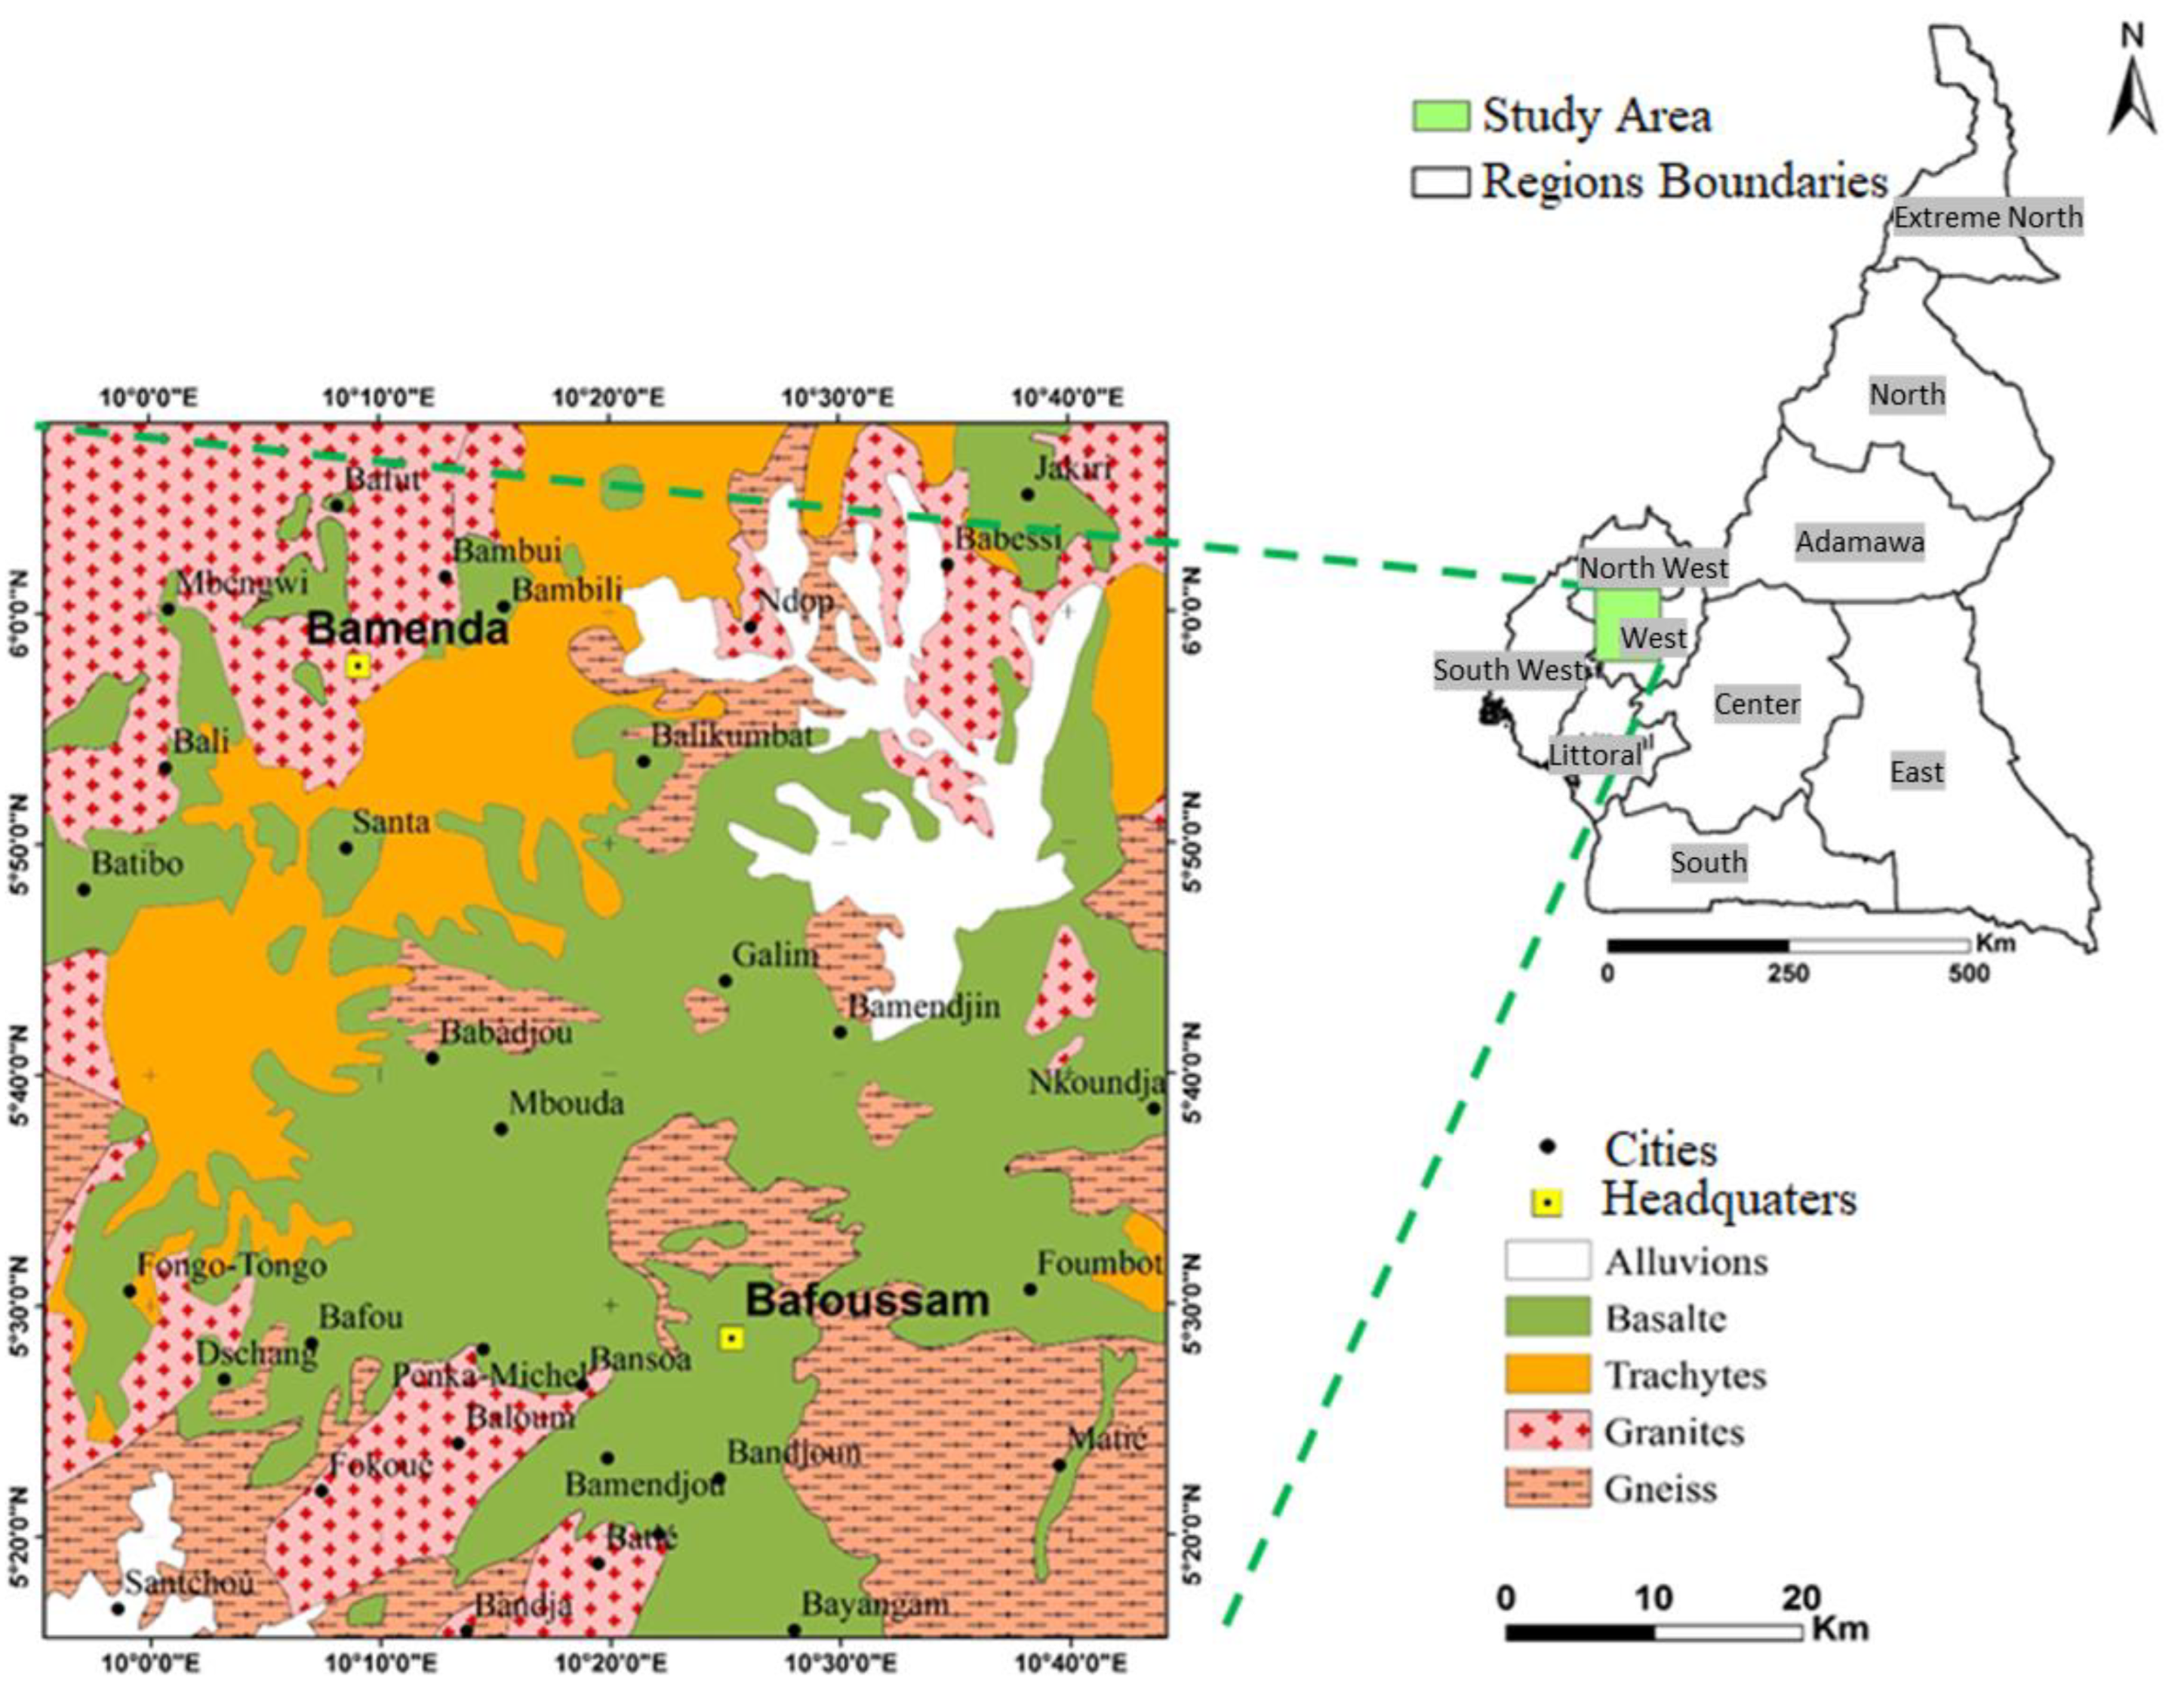
The selected study area is located in the Western Highlands of Cameroon (WHPC), covering approximately 9000 km² (
Figure 1). It lies between longitudes 09°50′ E to 10°45′ E and latitudes 5°15′ N to 6°10′ N, overlapping parts of the West and North-West regions of Cameroon. The cities of Bafoussam and Bamenda serve as administrative headquarters and major urban centers.
The terrain is predominantly mountainous, with elevations exceeding 2000 m, but it also includes plains below 500 m and plateaus ranging between 500 and 2000 m. Prominent geological features include plutonic massifs such as Mbam (2335 m), Nkogam (2263 m), and Mbapit (1989 m). To the west, Santa Peak (Mount Lefo, 2550 m) forms part of the Bamenda Mountains. The Bamboutos Mountains, characterized by several peaks above 2700 m, represent the highest elevation within the West Cameroon region. They form Cameroon's second-largest water reservoir after the Adamaoua region and significantly contribute to regional drainage and groundwater recharge.
The hydrographic network in the WHPC area is dense and closely related to its rugged topography and fracture patterns. Rivers flow primarily along SE–NW and SW–NE directions and include major rivers such as the Mbam, Noun, Nkam, Metchum, and Menoua. The region is drained by four main watersheds: two coastal (Cross River and Wouri) and two continental (Benue–Niger and Sanaga). The most significant river systems are the Noun and the Nkam rivers, oriented NW–SE and N–S respectively, with perpendicular tributaries such as the Mifi South, Mifi North, and Menoua rivers. These rivers frequently feature waterfalls (e.g., Marnmywata and Metche), especially near abrupt elevation changes, and supply reservoirs including the significant Lake Bamendjing dam.
The Western Highlands of Cameroon exhibit a rich and complex geology characterized by diverse lithological formations resulting from a prolonged geodynamic history [
15]. The crystalline basement, a product of the Pan-African orogeny, predominantly comprises crystalline schists and magmatic rocks [
16]. Orthogneisses, migmatitic gneisses, and amphibolites dominate the landscape, intersected by aplite and pegmatite dykes. Syn-tectonic and post-tectonic granitic massifs, such as those of Bandja, Fomopéa, and Batié, are distinguished by their feldspar-, quartz-, and biotite-rich compositions, reflecting intense magmatic activity during the Neoproterozoic. These formations reveal complex structural features, including isoclinal folds, intricate foliations, and shear zones, indicative of multi-phase tectonic deformation [
17]. The Cenozoic and Quaternary cover further enriches this basement through significant volcanic episodes. Three major volcanic phases are identified: the Eocene andesitic–basaltic phase, the Pliocene trachytic–rhyolitic phase, and the Quaternary basaltic phase. The lower black series basalts, characterized by thick and prismatic flows, extensively cover the plateaus, while the trachytes and rhyolites of the middle white series shape the reliefs of the Bamboutos and Bamenda mountains. The more recent basaltic flows, along with pyroclastic deposits and ignimbrites, mark the Quaternary volcanic phase, indicative of active Strombolian-type volcanism. These volcanic formations significantly influence the current topography and contribute to the fertility of the region’s soils.
Major tectonic structures profoundly affect this geological framework. Episodes of folding and later strike-slip faulting have generated a network of faults and shear zones that continue to guide regional drainage and influence volcanic alignments. The resulting geological architecture endows the Western Highlands with a diverse geomorphology and substantial geological potential, fostering scientific research and local economic activities.
4. Materials and Methods
The experiments were in Python on a DELL computer from the UREN laboratory. This computer has an Intel(R) Core i7-10700 processor clocked at 2.90 GHz, 32 GB of RAM, and an NVIDIA Quadro P400 GPU. The models were configured in Python version 3.8.8, using the Keras API version 2.4.3 with TensorFlow version 2.3 as a backend.
4.1. Dataset
As part of this study, a multi-source approach was adopted to integrate various geospatial data to identify and characterize the geological formations of the Western Highlands of Cameroon. Data sources include analog maps (geological, soil, and topographic) and optical and radar satellite images.
LANDSAT OLI images (30 m resolution) allowed spectral analysis of geological formations. With a spatial resolution of 30 m and 11 spectral bands, these LANDSAT OLI images (OLI2 to OLI 12) capture mineralogical and pedological variations. Visible, near, and mid-infrared bands are particularly useful for analyzing lithological compositions.
SRTM digital terrain models extracted key topographic attributes, such as slope, aspect, and drainage density.
Finally, ALOS PALSAR radar images (12.5 m resolution) in the L band were used to detect geological structures, thanks to their sensitivity to surface roughness.
The processing was carried out using specialized software: ENVI version 5.0 and ERDAS IMAGINE version 11 for image correction and analysis, ArcGIS version 10.0 for GIS integration, and Python version 3.8.8 for implementing machine learning algorithms.
The raw data were pre-processed to ensure their geometric and radiometric consistency. The analog maps were digitized and georeferenced in the UTM WGS 84 system. The LANDSAT OLI images underwent atmospheric corrections using ENVI’s FLAASH module, while the speckle in the ALOS PALSAR radar images was attenuated via adaptive filters (Lee, Frost). Mosaicking multi-source images created a homogeneous database. The harmonization of contrasts and blurring junctions between scenes made it possible to optimize the visual and analytical quality of the data.
4.1.1. Extraction of Geological Parameters
The optical and radar images were fused using a discrete wavelet transform (TOD). This method provides an Optical Radar (OR) image, preserving the radiometric richness of LANDSAT images while integrating the textural properties of radar images, producing hybrid OR images with an improved resolution of 12.5 m.
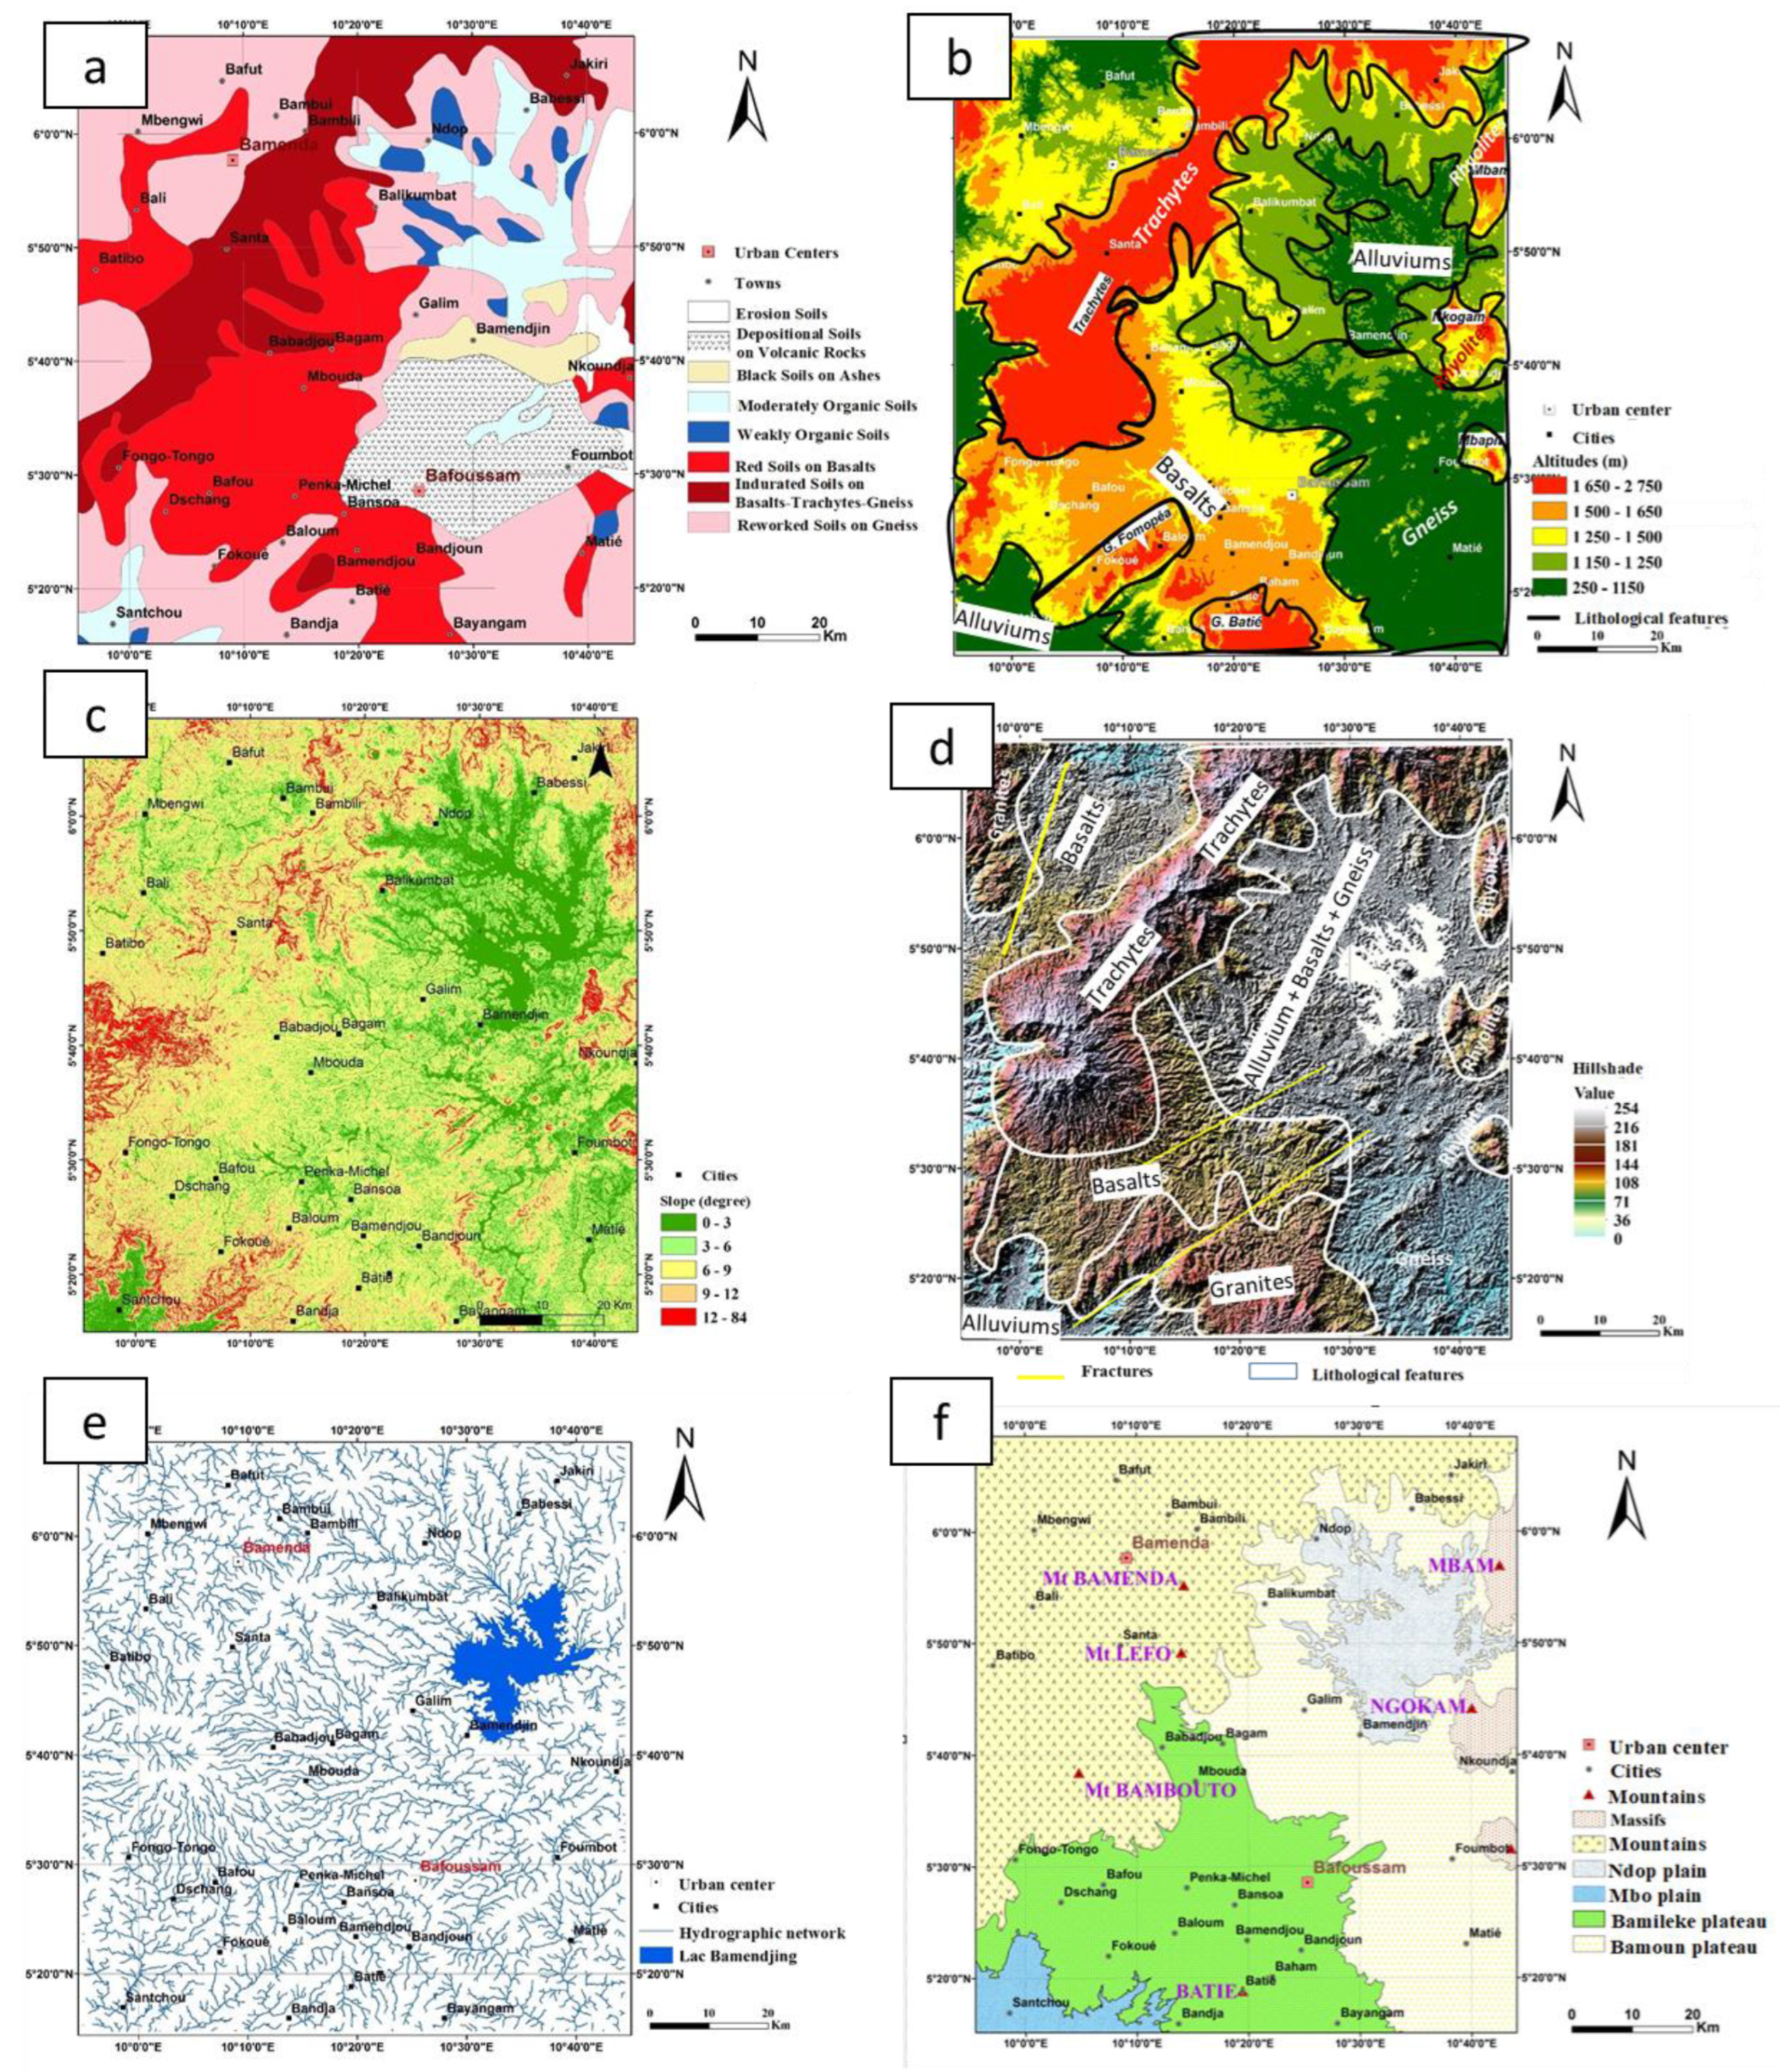
The SRTM DEM provides foundational data for extracting morphometric parameters (Data 1) critical for geological analysis. These parameters help distinguish between various lithological units and structural features.
Altitude: The altitude map highlights the spatial distribution of elevations, distinguishing between plains, plateaus, and mountainous regions. This parameter helps identify lithological boundaries, such as rhyolitic massifs, trachytic formations, and granitoid outcrops. In this study, altitude is a key variable influencing the spatial distribution of geological units, as elevation often correlates with rock type and soil properties.
Slope: Slope data, derived from the DEM, captures the terrain’s steepness and helps reveal geomorphological structures, such as fault lines and lithological contacts. The model uses slope variations to classify areas prone to erosion, infiltration, or surface runoff, which are often linked to specific geological formations.
Aspect (Slope Orientation): Aspect data provide information on slopes’ directional exposure, which can influence weathering processes and vegetation patterns and indirectly reflect underlying geological structures. In Random Forest classification, the aspect contributes to identifying structural trends and the orientation of geological units.
Hillshade: The hillshade layer enhances the visualization of topographic features by simulating shadow effects, highlighting linear structures, such as faults and fractures. This is particularly valuable for the model, as it improves the differentiation of geological units based on structural discontinuities.
Hydrographic network and drainage density: The hydrographic network, extracted from the DEM, offers insight into the relationship between surface water flow and geological formations. Drainage density is a critical variable in the model, as it reflects substrate permeability and structural controls on surface water movement. Highly drained areas often correspond to impermeable rocks or fault zones, while poorly drained areas indicate permeable substrates conducive to groundwater infiltration.
Soil map as environmental predictors: Soil characteristics are closely linked to underlying geology and are essential for refining geological mapping. The study integrates soil maps that classify regions into ferrallitic, hydromorphic, and poorly developed soils, each corresponding to specific lithological settings. In the model, soil types serve as categorical predictors, improving the accuracy of lithological classification.
Geomorphological map: Understanding the geomorphological framework is critical for geological mapping. The Western Highlands of Cameroon present a highly diverse relief, ranging from lowland plains to mountainous regions exceeding 2700 m. These geomorphological contrasts are integrated into the model as contextual variables, helping to delineate geological formations influenced by elevation, slope, and drainage activity.
SRTM data generated parameters, combined with soil and geological indices, enabled the correlation of geological formations with their morphological contexts (
Figure 2).
Principal component analysis (PCA) was applied to reduce spectral redundancy and extract meaningful information from satellite and hybrid images. This statistical technique made it possible to transform LANDSAT image bands and neo-channels resulting from the fusion of radar and optical images into a set of orthogonal principal components, capturing the majority of the variance of the initial data. The first five principal components (PCs) explained more than 90% of the variance, providing valuable information for lithological and structural discrimination. Specific components were correlated explicitly with distinct geological characteristics: CP4 enhanced the signatures of trachytes, while CP5 highlighted gneisses. This approach also made it possible to create synthetic images with high spectral and spatial resolution, which is ideal for analyzing textures and geological structures.
Spectral ratios constitute a powerful tool for improving the discrimination of geological formations from satellite images. This study used several combinations of bands to accentuate spectral contrasts and minimize topographical and shading effects specific to the mountainous region of the Western Highlands of Cameroon. Among the ratios applied, the ratios OR7/OR4, OR5/OR4, and OR5/OR7 made it possible to reduce interference linked to incident light while enhancing the spectral differences between geological materials, such as basalts, gneisses, and granites. These ratios were chosen because of their sensitivity to the mineralogical characteristics of lithological formations, particularly in the visible and near-infrared. Additional ratios, such as OLI5/OLI7 (highlighting clay and iron variations), OLI/OLI2 (used for differentiating bare soils and vegetation), and gloss index (BI), have been calculated to analyze the physical properties of exposed surfaces. In parallel, standardized indices were used to link the vegetation cover to the underlying mineral alteration, thus revealing zones of mineralization and fractures associated with underground flows. These ratios and indices have been integrated into a robust analytical framework, providing crucial variables for training classification models and lithological mapping.
4.1.2. Data Preparation
Creating a consistent and structured database is essential for training and validating machine learning models. In this study, data were compiled from multiple sources: satellite and water images (OLI, OR), existing geological maps, field observations, and derived parameters, such as spectral ratios, PCA, normalized indices (NDVI, IB), and morphometric attributes (slope, drainage density, altitude). These data were integrated into a tabular framework, where each observation represents a geographical point (field site), and each column corresponds to an explanatory or target variable.
The input variables were classified into two categories:
Continuous variables: Spectral reflectance values, ratios (e.g., B5/B7, OR5/OR4), altitude, slope, morphometric indices, etc.
Categorical variables: Soil types, lithological classes, and geological formations identified in the field or from existing maps.
Particular attention was paid to data preprocessing to ensure their compatibility with machine learning algorithms. Missing data were imputed using appropriate statistical methods (e.g., spatial interpolation or local average). Quantitative variables were normalized to reduce the effect of scaling differences, while qualitative variables were encoded numerically using techniques such as one-hot coding.
The database was divided into two subsets for the training and validation phases: 80% of the data (935 samples) were allocated to training the models. In contrast, 20% (234 samples) were being reserved for their validation. This distribution aims to guarantee analytical robustness, minimize sampling bias, and ensure the reproducibility of geological classifications. Since the data is unbalanced, some classes are significantly over-represented compared to others. A proportional distribution was maintained during the creation of the subsets, thus making it possible to keep the same distribution of classes in the validation set. This ensures that the validation set accurately reflects the actual distribution of classes in the database, thus avoiding evaluation biases.
Figure 3 illustrates the compilation and integration of geospatial data from various sources (geological and soil maps, satellite imagery, radar, and topographic data) to analyze a dependent variable on a set of independent variables.
Table 1 and
Figure 4 present the data distribution according to the different types of geological formations.
4.2. Classification Algorithms
Classification algorithms are essential artificial intelligence tools that allow data to be categorized by assigning specific labels, thus facilitating automated decision-making. The choice of algorithm is necessary and depends on the particular characteristics of the data to be analyzed. We selected three particularly efficient algorithms for our experiments: Gradient Boosting, XGBoost, and Random Forest [
18].
4.2.1. Gradient Boosting
Gradient Boosting is an ensemble method in machine learning that builds a robust predictive model by iteratively adding weak estimators, typically decision trees. Each new estimator is trained to correct errors from previous predictions by optimizing the loss function using the gradient. This iterative approach gradually improves the model’s accuracy by capturing complex relationships between variables [
19].
This model is particularly suitable for detecting and analyzing geological formations because it manages heterogeneous and complex data sets. It can efficiently process data from multiple sources, such as satellite images, seismic measurements, and drilling data, while capturing non-linear interactions between these variables. Its exceptional flexibility makes exploring complex links between geological parameters possible, making this method efficient in classification and regression tasks [
20].
4.2.2. XGBoost
XGBoost (Extreme Gradient Boosting) is a robust machine learning algorithm based on the concept of Gradient Boosting. It improves this algorithm by optimizing calculations and introducing advanced features, making it faster and more efficient. XGBoost uses a set of decision trees (weak learners) to predict the residuals of previous models and correct errors. Its uniqueness lies in how decision trees are constructed and optimized, making the algorithm powerful and resource-efficient [
21].
This algorithm follows a structured process:
Initial model: A simple basic model is built to make an initial prediction.
Calculation of residuals: The difference between predictions and actual values is calculated to identify errors.
New trees: A new decision tree is trained to predict these residuals and reduce errors.
Model update: The predictions from the new tree are integrated into the existing model with a weighting factor.
Repetition: This process is repeated until performance reaches a satisfactory level or a stopping criterion is reached.
XGBoost is particularly effective for applications requiring heterogeneous data processing, including numeric, categorical, and textual variables. In geology, where the relationships between geological formations are often complex and non-linear, XGBoost is particularly effective. It excels at capturing these relationships thanks to its ability to process data from various sources, such as satellite images or seismic measurements [
22].
4.2.3. Random Forest
The Random Forest is a machine-learning algorithm based on combining numerous decision trees. Each tree is constructed from a random subset of the training data and a random subset of the features. Introduced by Leo Breiman, this method quickly became a benchmark in machine learning thanks to its simplicity, robustness, and performance.
The operation of the Random Forest is based on the following principles:
Training trees: Many decision trees are built independently, each trained on a random sample of the data (bootstrap) and a random subset of the features.
Model diversity: Random selection of data and features ensures tree diversity, which improves generalization ability and reduces the risk of overfitting.
Prediction by vote: Each tree casts a vote when a prediction is required. The final decision is made by a majority vote for classification tasks or by averaging predictions for regression tasks [
23].
In geology, Random Forests are widely used to analyze complex data from various sources, such as satellite images or geophysical measurements. Their ability to capture complex relationships between variables makes them a valuable tool for classifying geological formations and predicting geophysical properties [
24].
4.3. The General Architecture of Our Methodology
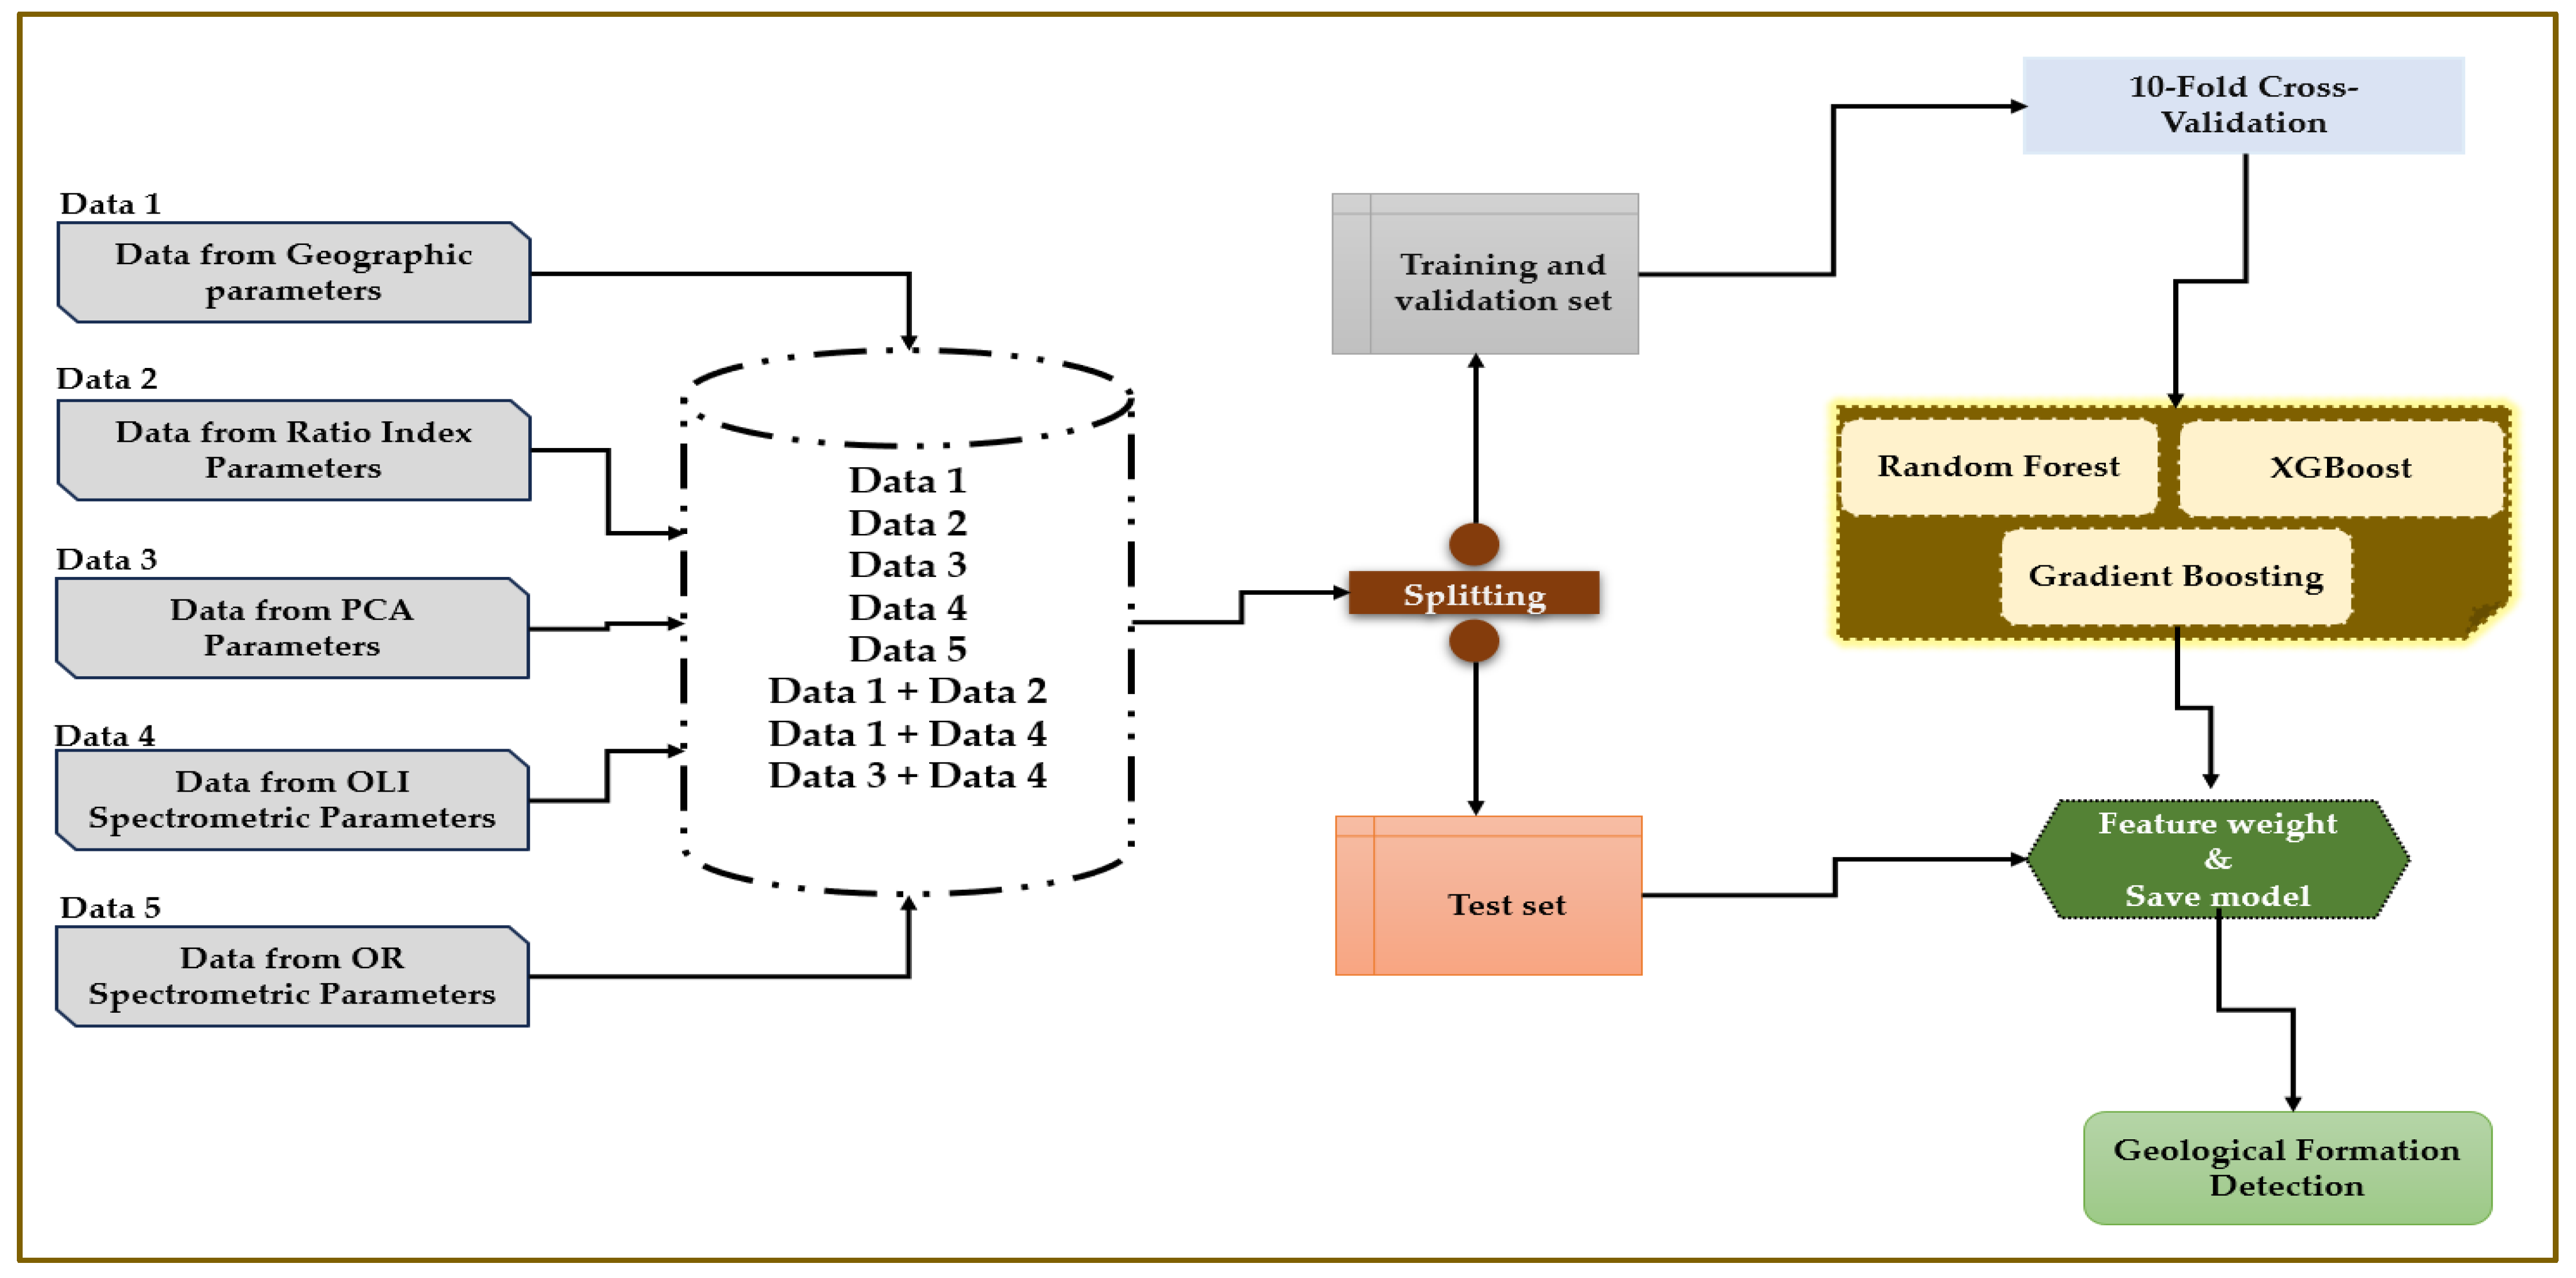
We conducted our geological formation detection study as follows:
We collect data from different sources, including geographic parameters (Data 1), ratio index parameters (Data 2), PCA parameters (Data 3), OLI spectrometric parameters (Data 4), and OR spectrometric parameters (Data 5).
We store individual datasets in a central repository and create combinations of datasets, such as Data 1 + Data 2, Data 1 + Data 4, and Data 3 + Data 4, to explore the interactions between different parameters for optimal results.
We split the aggregated datasets into training and validation sets. The training sets are used to train machine learning models, while the validation sets are reserved for model evaluation.
We apply 10-fold cross-validation on the training and validation sets and train models using three machine learning algorithms: Random Forest, XGBoost, and Gradient Boosting.
In the Feature Selection and Ensemble Learning step, we evaluate each algorithm’s performance, extract feature weights to identify significant predictors, and save the best-performing models for future use.
We use the optimized model to predict geological formations, leveraging the integration of diverse datasets and advanced machine-learning techniques for reliable and accurate detection. This workflow ensures thorough testing, robust model training, and a systematic approach to geological formation detection, making it dependable and practical for real-world applications.
Figure 5 presents the overall structure of our approach.
4.4. Methods and Parameters Description
Our experiment measured various parameters for the different geological formations, including PCA (principal component analysis), geological and environmental parameters, ratio indices, and OLI and OR spectrometric parameters. These parameters were selected to influence the detection of geological features. Our experiments focused on the in-depth analysis of each parameter, evaluating their relevance and contribution to detection accuracy. After conducting these experiments, we conducted a rigorous calibration to identify and maintain the best parameters. This optimization process allowed us to refine our approach and guarantee better efficiency in detecting geological formations.
We then merged the different selected parameters to evaluate their combined impact on the detection performance. This step was motivated by the idea that combining multiple data sources can capture complementary information, thereby increasing the model’s accuracy. By merging parameters, we sought to maximize the representation of relevant geological features and improve the model’s robustness to data variations. This approach was validated through experimental testing to observe whether fusion significantly improved detection results.
The algorithms employed in this study include Gradient Boosting, Random Forest, and XGBoost, each selected for its ability to handle complex data and provide robust prediction models. Gradient Boosting improves accuracy by combining several weak models into a higher-performing model. The Random Forest, for its part, is a set of decision trees that reduces overlearning and improves the generalization of results. XGBoost, an optimized version of Gradient Boosting, was chosen for its speed of execution and its ability to process large data sets efficiently.
The cross-validation technique was applied to ensure better learning quality and validate the results. This method divides the data into subsets, where each subgroup trains and validates the model. This guarantees a better evaluation of the model’s performance on all the data and reduces the risks of overfitting, thus contributing to the reliability of the results obtained within the study’s framework.
The parameters used are data from geographic parameters (DGPs), data from the ratio index parameters (DRIPs), data from PCA parameters (DPCAPs), data from OLI spectrometric parameters (DOLIPs), and data from OR spectrometric parameters (DORSPs).
4.5. Performance Metric
To evaluate the performance of the models in our study, we will use several metrics, including accuracy, precision, mean square error, recall, F1 score, Matthew’s correlation coefficient (MCC), and the ROC curve. These metrics are calculated using specific formulas. For example, accuracy evaluates the system’s ability to classify data into the appropriate classes correctly.
Accuracy corresponds to the ratio between the number of images correctly classified as positive and the total number of genuinely positive images.
Recall measures the ability of a classifier to identify accurate positive results.
The F1 score is the weighted harmonic average of precision and recall.
The Matthews correlation coefficient (MCC) makes assessing the quality of classifications possible.
The Mean Square Error (MSE) of an estimator represents the mean of the squares of the deviations, that is, the average of the squared differences between the estimated and actual values.
The variables mentioned previously are:
True Positives (TPs): Items correctly classified as positive with a true label.
False Positives (FPs): Items incorrectly classified as positive with a false label.
True Negatives (TNs): Items correctly classified as negative with a false label.
False Negatives (FNs): Items incorrectly classified as negative with a true label.
: The actual data in the dataset.
: The predicted data of the dataset.
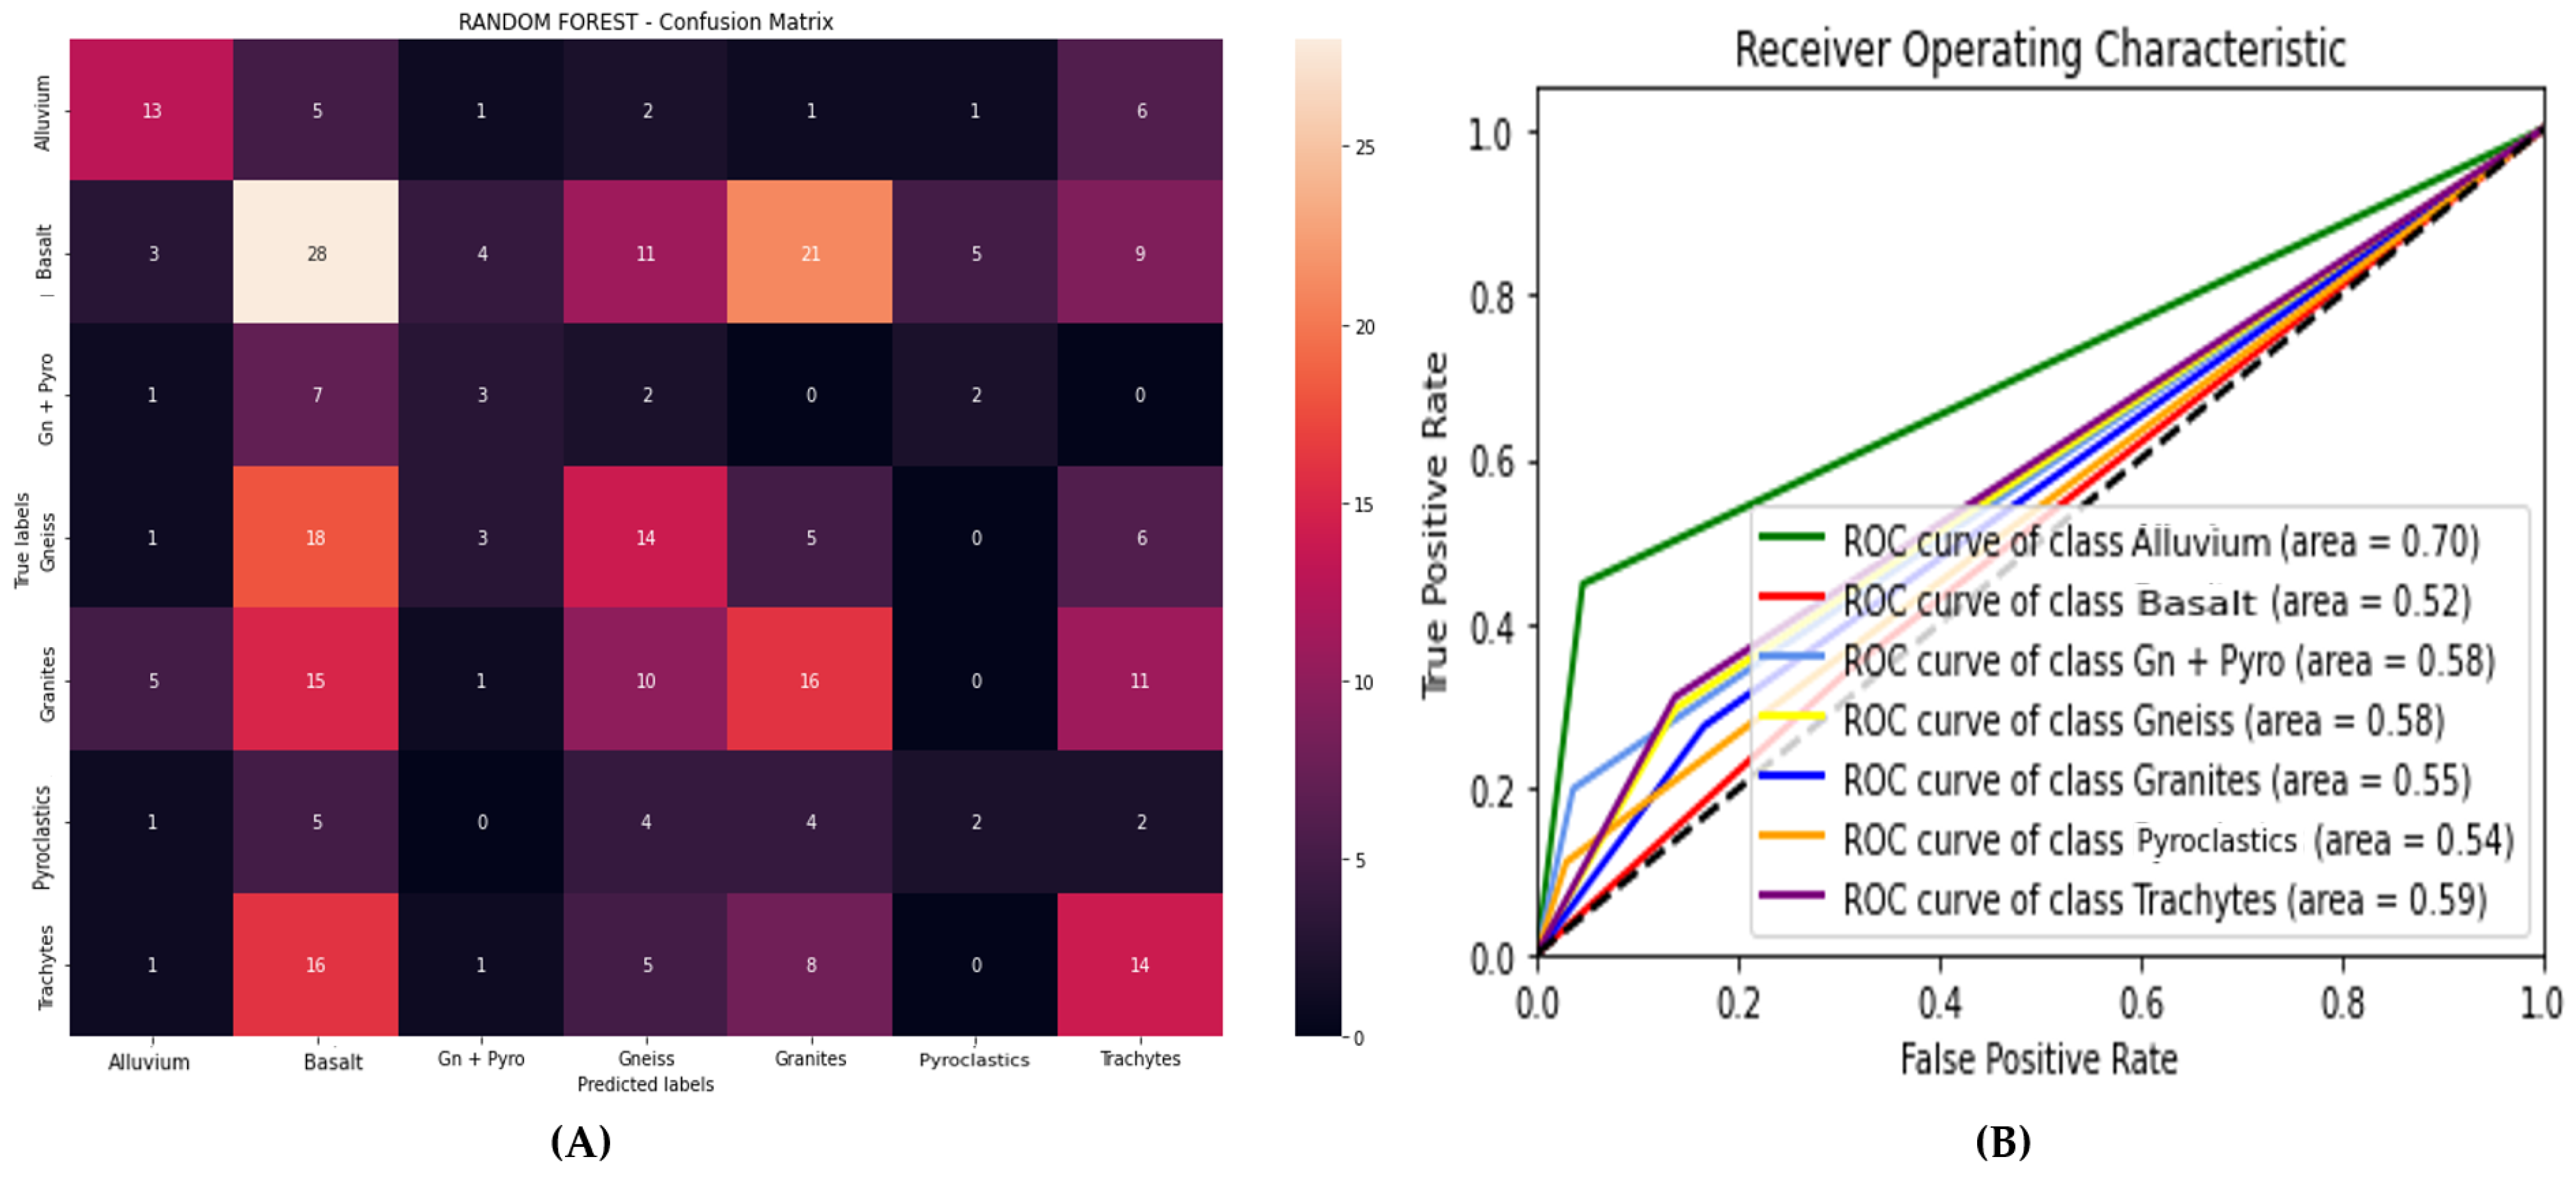
We used the ROC curve, which allows us to evaluate a model’s performance using two indicators: sensitivity and specificity. It also offers a visual performance assessment, making it one of the most crucial evaluation metrics for testing a model’s effectiveness. The confusion matrix was also employed to provide a detailed representation of the model predictions regarding true positives, false positives, true negatives, and false negatives.
5. Experiments and Results
We will present the algorithm that obtained the best precision for each parameter, accompanied by its ROC curve and confusion matrix.
The black dashed line in the ROC curve represents the random classifier or the line of no discrimination. This line has an area under the curve (AUC) of 0.5, meaning it performs no better than random chance.
5.1. Data from Geographic Parameters (DGPs)
Table 2 presents the performance evaluation of three machine learning algorithms (Gradient Boosting, XGBoost, and Random Forest) applied to data from geographic parameters. The results show that:
Gradient Boosting achieves the best accuracy (51.53%) and the best F1 score (50.75%), while Random Forest has the shortest execution time (2.58 ms). On the other hand, XGBoost presents the lowest performance in terms of accuracy (47.78%) and MCC (35.72%). These results allow us to compare the algorithms’ effectiveness in speed and prediction quality for this specific application.
Figure 6 illustrates the ROC curve and the confusion matrix of the model that achieved the highest accuracy.
5.2. Data from Ratio Index Parameters (DRIPs)
Table 3 presents the performance evaluation of three machine learning algorithms (Gradient Boosting, XGBoost, and Random Forest) based on data from the ratio index parameters. The results show that:
Random Forest shows the best overall performance with an accuracy of 30.72%, an F1 score of 30.54%, and an MCC of 14.48% while maintaining the shortest execution time (2.34 ms).
Figure 7 illustrates the ROC curve and the confusion matrix of the model that achieved the highest accuracy.
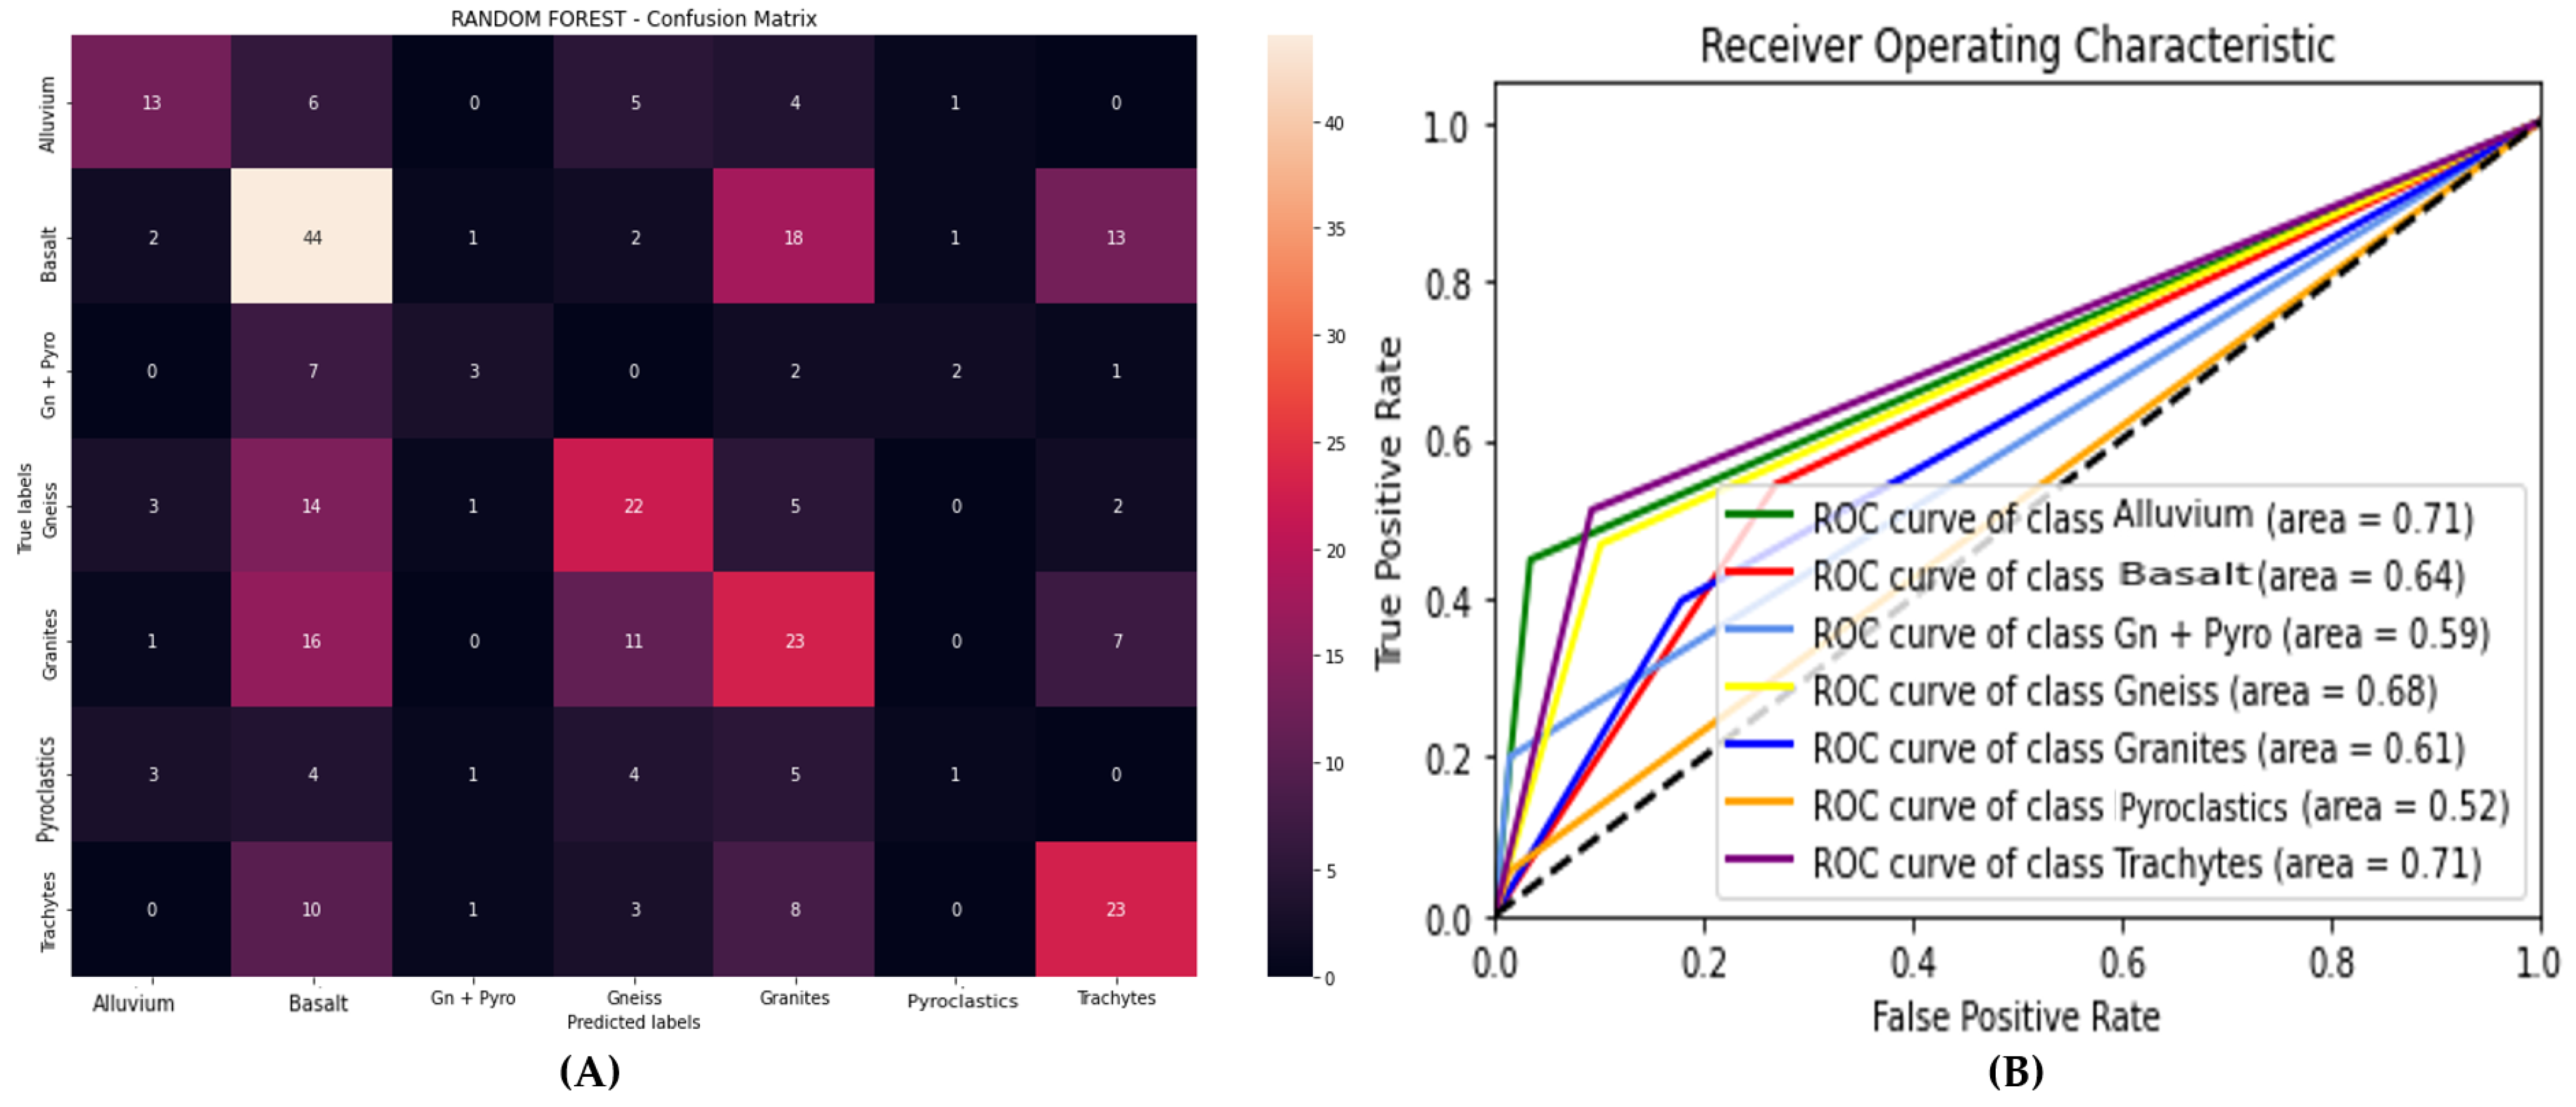
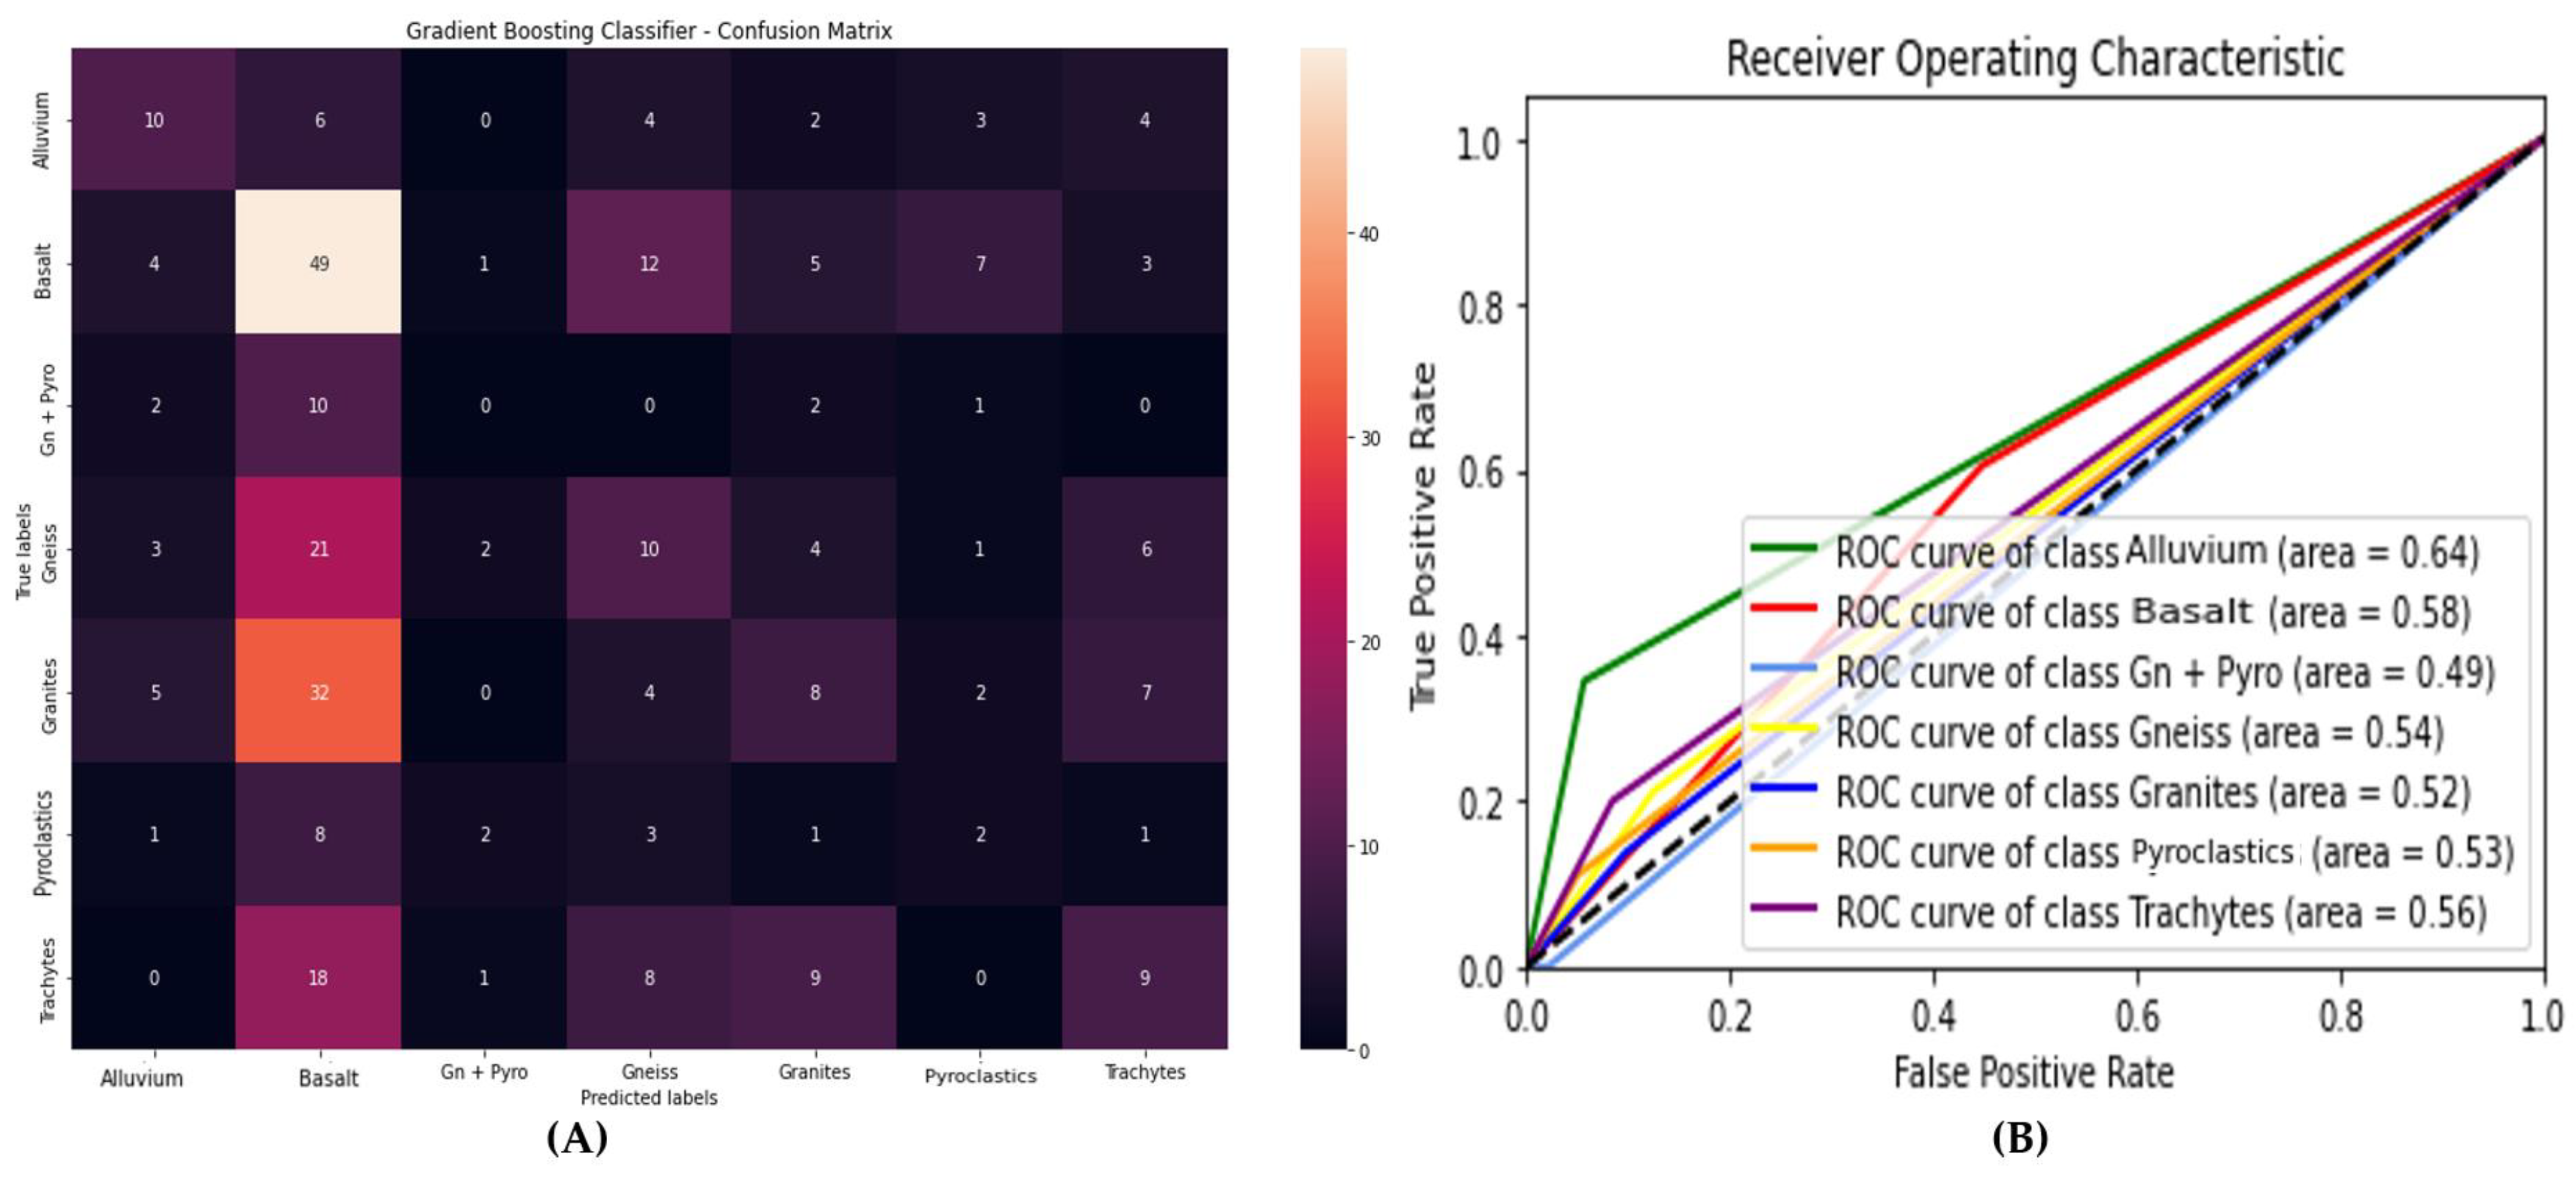
5.3. Data from PCA Parameters (DPCAPs)
Table 4 presents the performance evaluation of three machine learning algorithms (Gradient Boosting, XGBoost, and Random Forest) on data from PCA (principal component analysis) parameters. The results show that:
Random Forest obtains the best performance with an accuracy of 41.98%, an F1 score of 41.45%, and an MCC of 28.23% while displaying a relatively short execution time (3.14 ms).
Figure 8 illustrates the ROC curve and the confusion matrix of the model that achieved the highest accuracy.
5.4. Data from OLI Spectrometric Parameters (DOLIPs)
Table 5 presents the performance evaluation of three machine learning algorithms (Gradient Boosting, XGBoost, and Random Forest) applied to data from OLI (Operational Land Imager) spectrometric parameters. The results show that:
The Random Forest shows the best performance with an accuracy of 52.59%, an F-score of 43.02%, and an MCC of 30.32% while being the fastest (2.60 ms).
Figure 9 illustrates the ROC curve and the confusion matrix of the model that achieved the highest accuracy.
5.5. Data from OR Spectrometric Parameters (DORSPs)
Table 6 presents the performance evaluation of three machine learning algorithms (Gradient Boosting, XGBoost, and Random Forest) applied to data from OR spectrometric parameters. The results indicate that:
Gradient Boosting shows the best performance with an accuracy of 30.03%, an F-score of 27.32%, and an MCC of 12.16%, despite a higher execution time (11.12 ms).
Figure 10 illustrates the ROC curve and the confusion matrix of the model that achieved the highest accuracy.
5.6. Algorithm Performance Based on Geological Data Types and Optimal Parameters
We present a detailed summary of the accuracy rates obtained for each type of geological data. These results are based on the best parameters identified and optimized to maximize the performance of the three classifiers tested. The analysis highlights variations in accuracy based on characteristics of geological data and the ability of algorithms to exploit this information, providing a clear comparison of their relative effectiveness.
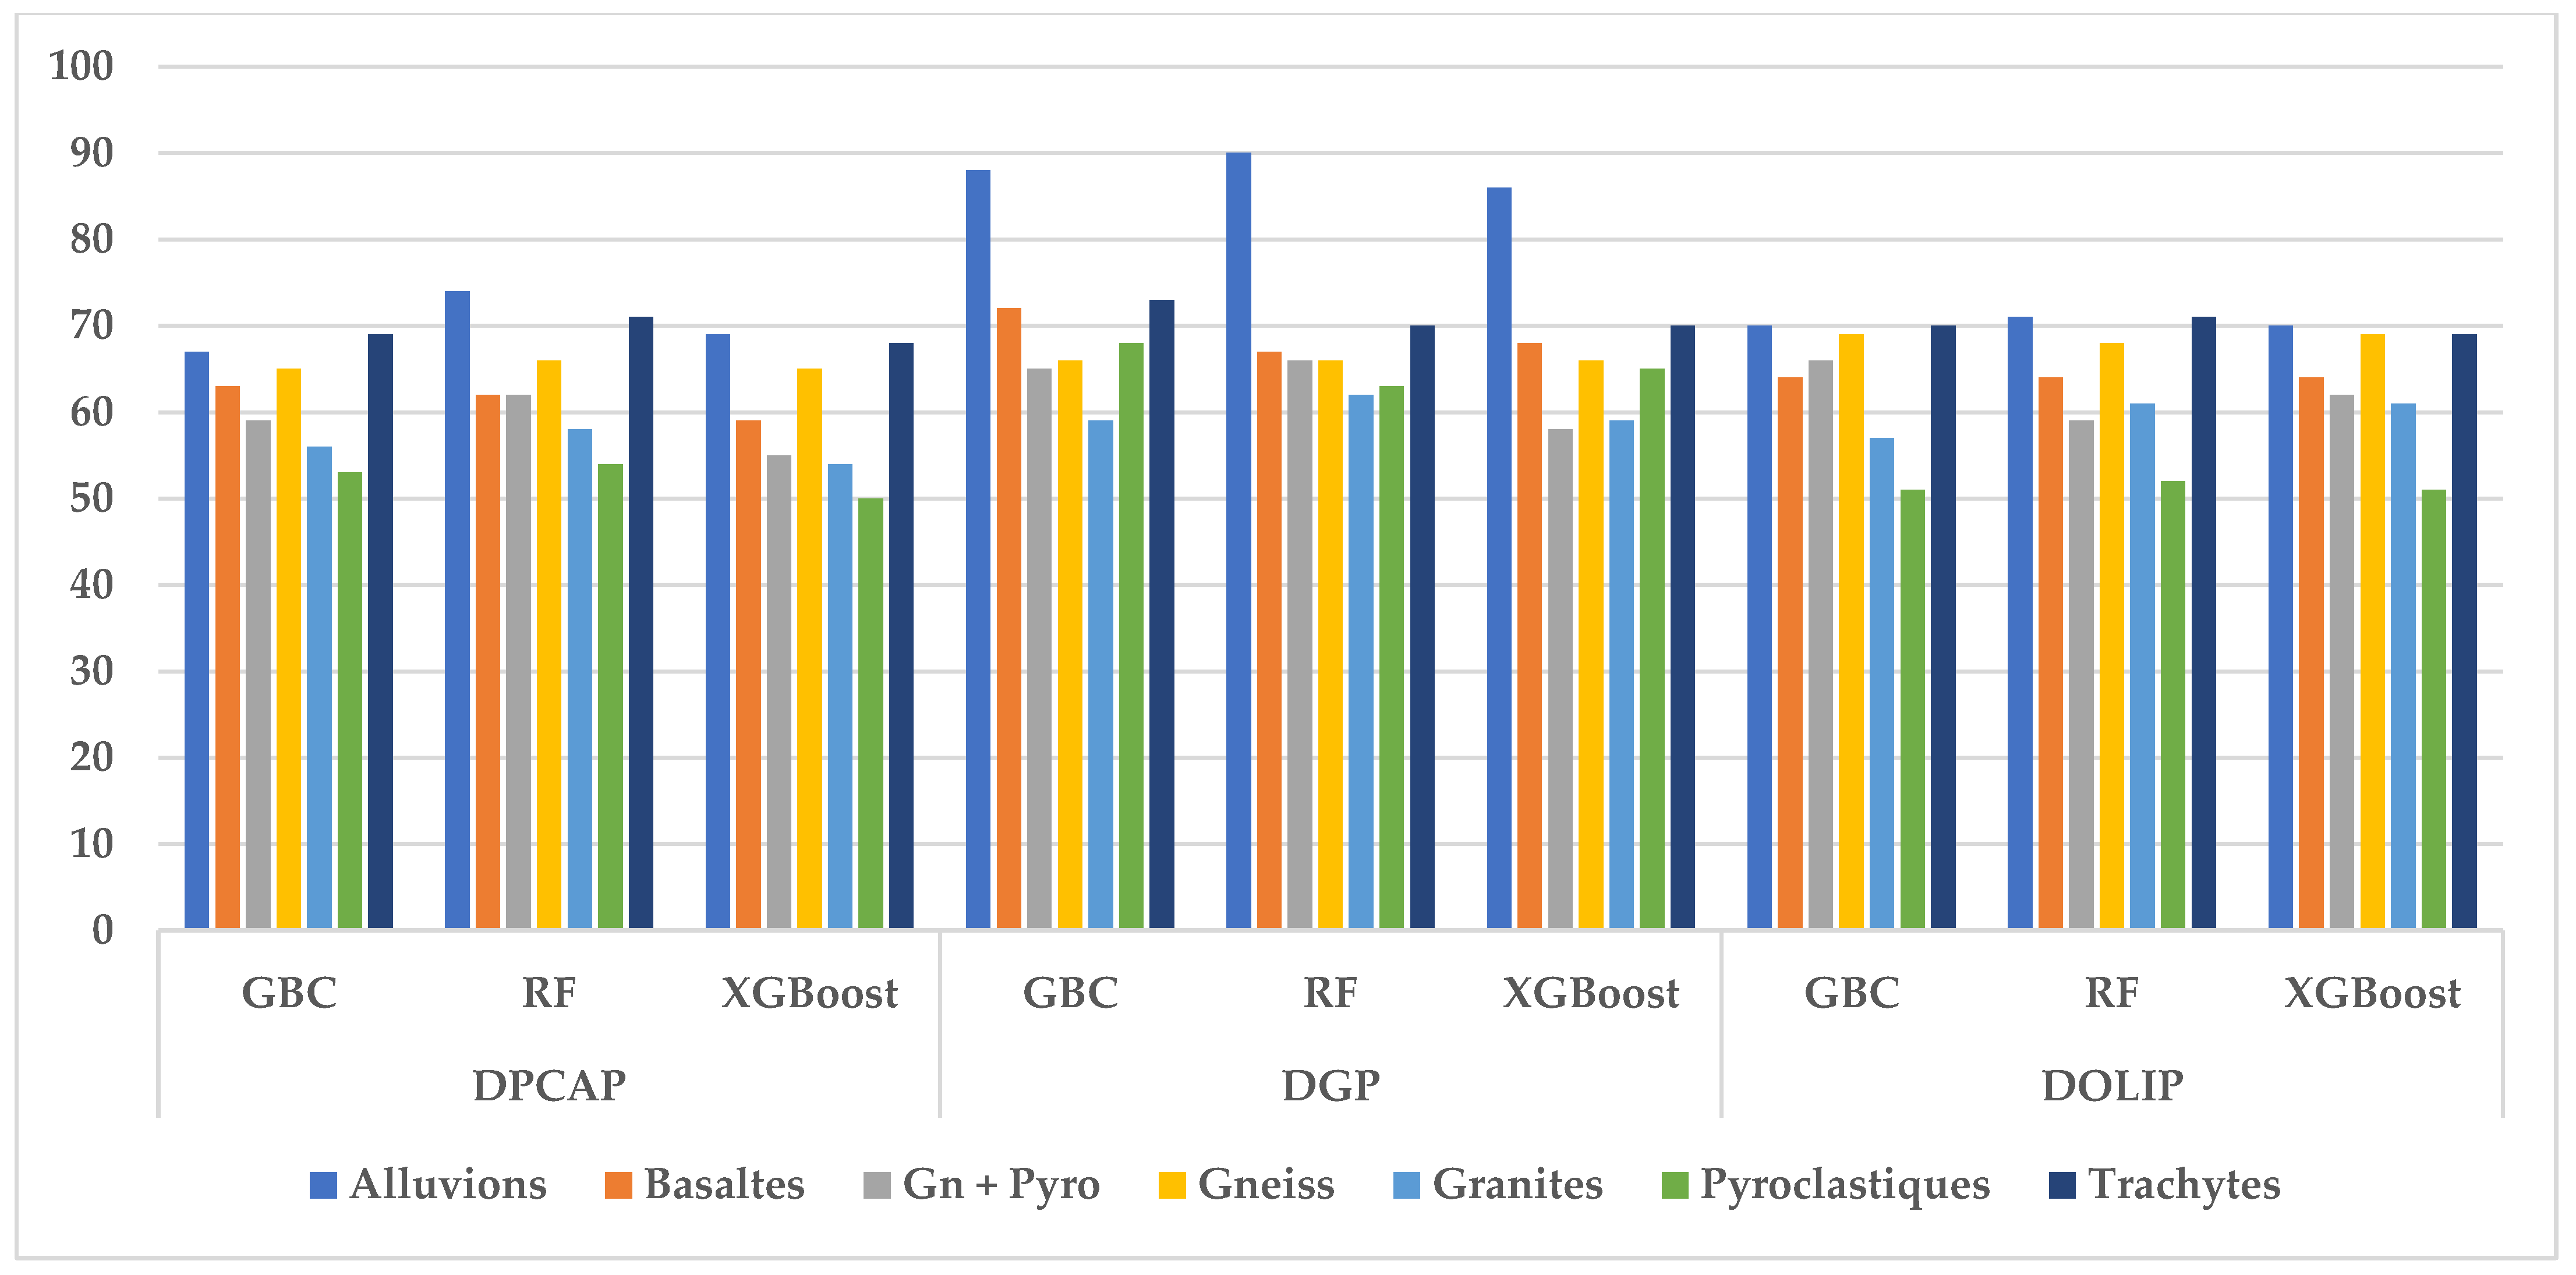
Table A1, presented in
Appendix A, provides the performances of the Gradient Boosting Classifier (GBC) and Random Forest (RF) using three sets of parameters: PCAP, DGP, and DOLIP. Geographic parameters (PGs) produce the best scores overall, as evidenced by the 90% obtained for alluvium with RF and the 65% for pyroclastics with XGBoost. Random Forest stands out as the best-performing algorithm in the majority of cases.
We will then combine the best parameters, which include:
Data from OLI spectrometric parameters: These data allowed the Random Forest algorithm to achieve the best accuracy (52.59%) and higher MCC (30.32%) while having a low execution time (2.60 ms).
Data from PCA parameters: They allowed Random Forest to achieve an accuracy of 41.98% and an MCC of 28.23%, with an execution time of 3.14 ms, thus showing good performance on data transformed by dimensional reduction.
Data from geographic parameters: Although slightly inferior in performance compared to the OLI spectrometric parameters, they allowed Random Forest to achieve a competitive precision of 49.14% and an MCC of 37.39%, with a time execution time of 2.58 ms, confirming their relevance for classification tasks.
5.7. Combination of Geographic Parameter Data with PCA-Derived Data (DGP-DPCAP)
Several algorithms were evaluated for combining geographic parameter data with PCA-derived data.
Table 7 presents the performances of these algorithms in terms of different criteria. The results show that Random Forest has the best performance, with an accuracy of 55.29%, MCC of 45.12%, and execution time of 3.59 ms. The other algorithms, Gradient Boosting, and the effectiveness of combining geographic parameters and PCA data for classification tasks, particularly with the Random Forest algorithm, are thus demonstrated.
5.8. Combination of Geographic Parameter Data and OLI Spectrometric Parameter Data (DGP-DOLIP)
Several algorithms were used to evaluate the combination of geographic parameter data with OLI spectrometric parameters.
Table 8 presents the performances of these algorithms according to different criteria.
The results show that XGBoost and Random Forest achieve the best performance, with an accuracy of 51.53%. XGBoost stands out slightly with an MCC of 40.35%, while Random Forest achieves an MCC of 40.28% while offering the lowest execution time (3.16 ms). While performing well, Gradient Boosting shows slightly lower accuracy (50.51%) and an MCC of 39.14%, with a higher execution time (14.08 ms).
These results demonstrate the effectiveness of combining OLI geographic and spectrometric parameters for classification tasks. The XGBoost algorithm achieves optimal performance, and Random Forest offers remarkable speed.
5.9. Combination of OLI Spectrometric Parameter Data with PCA-Derived Data (DPCAP-DOLIP)
Several algorithms were used to evaluate the combination of OLI spectrometric parameter data with PCA-derived data.
Table 9 presents the performances of these algorithms according to different criteria.
The results show that Random Forest provides the best performance, with an accuracy of 45.05%, an MCC of 31.81%, and the lowest execution time (3.38 ms). Gradient Boosting follows with 41.29% accuracy and 27.12% MCC but significantly higher execution time (15.99 ms). XGBoost, while fast (5.61 ms), has a slightly lower accuracy (40.27%) and an MCC of 26.34%.
These results demonstrate the Random Forest algorithm’s superior performance and speed, highlighting the effectiveness of combining OLI spectrometric parameters and PCA data for classification tasks.
5.10. Performance of Geological Types According to Combinations of Parameters
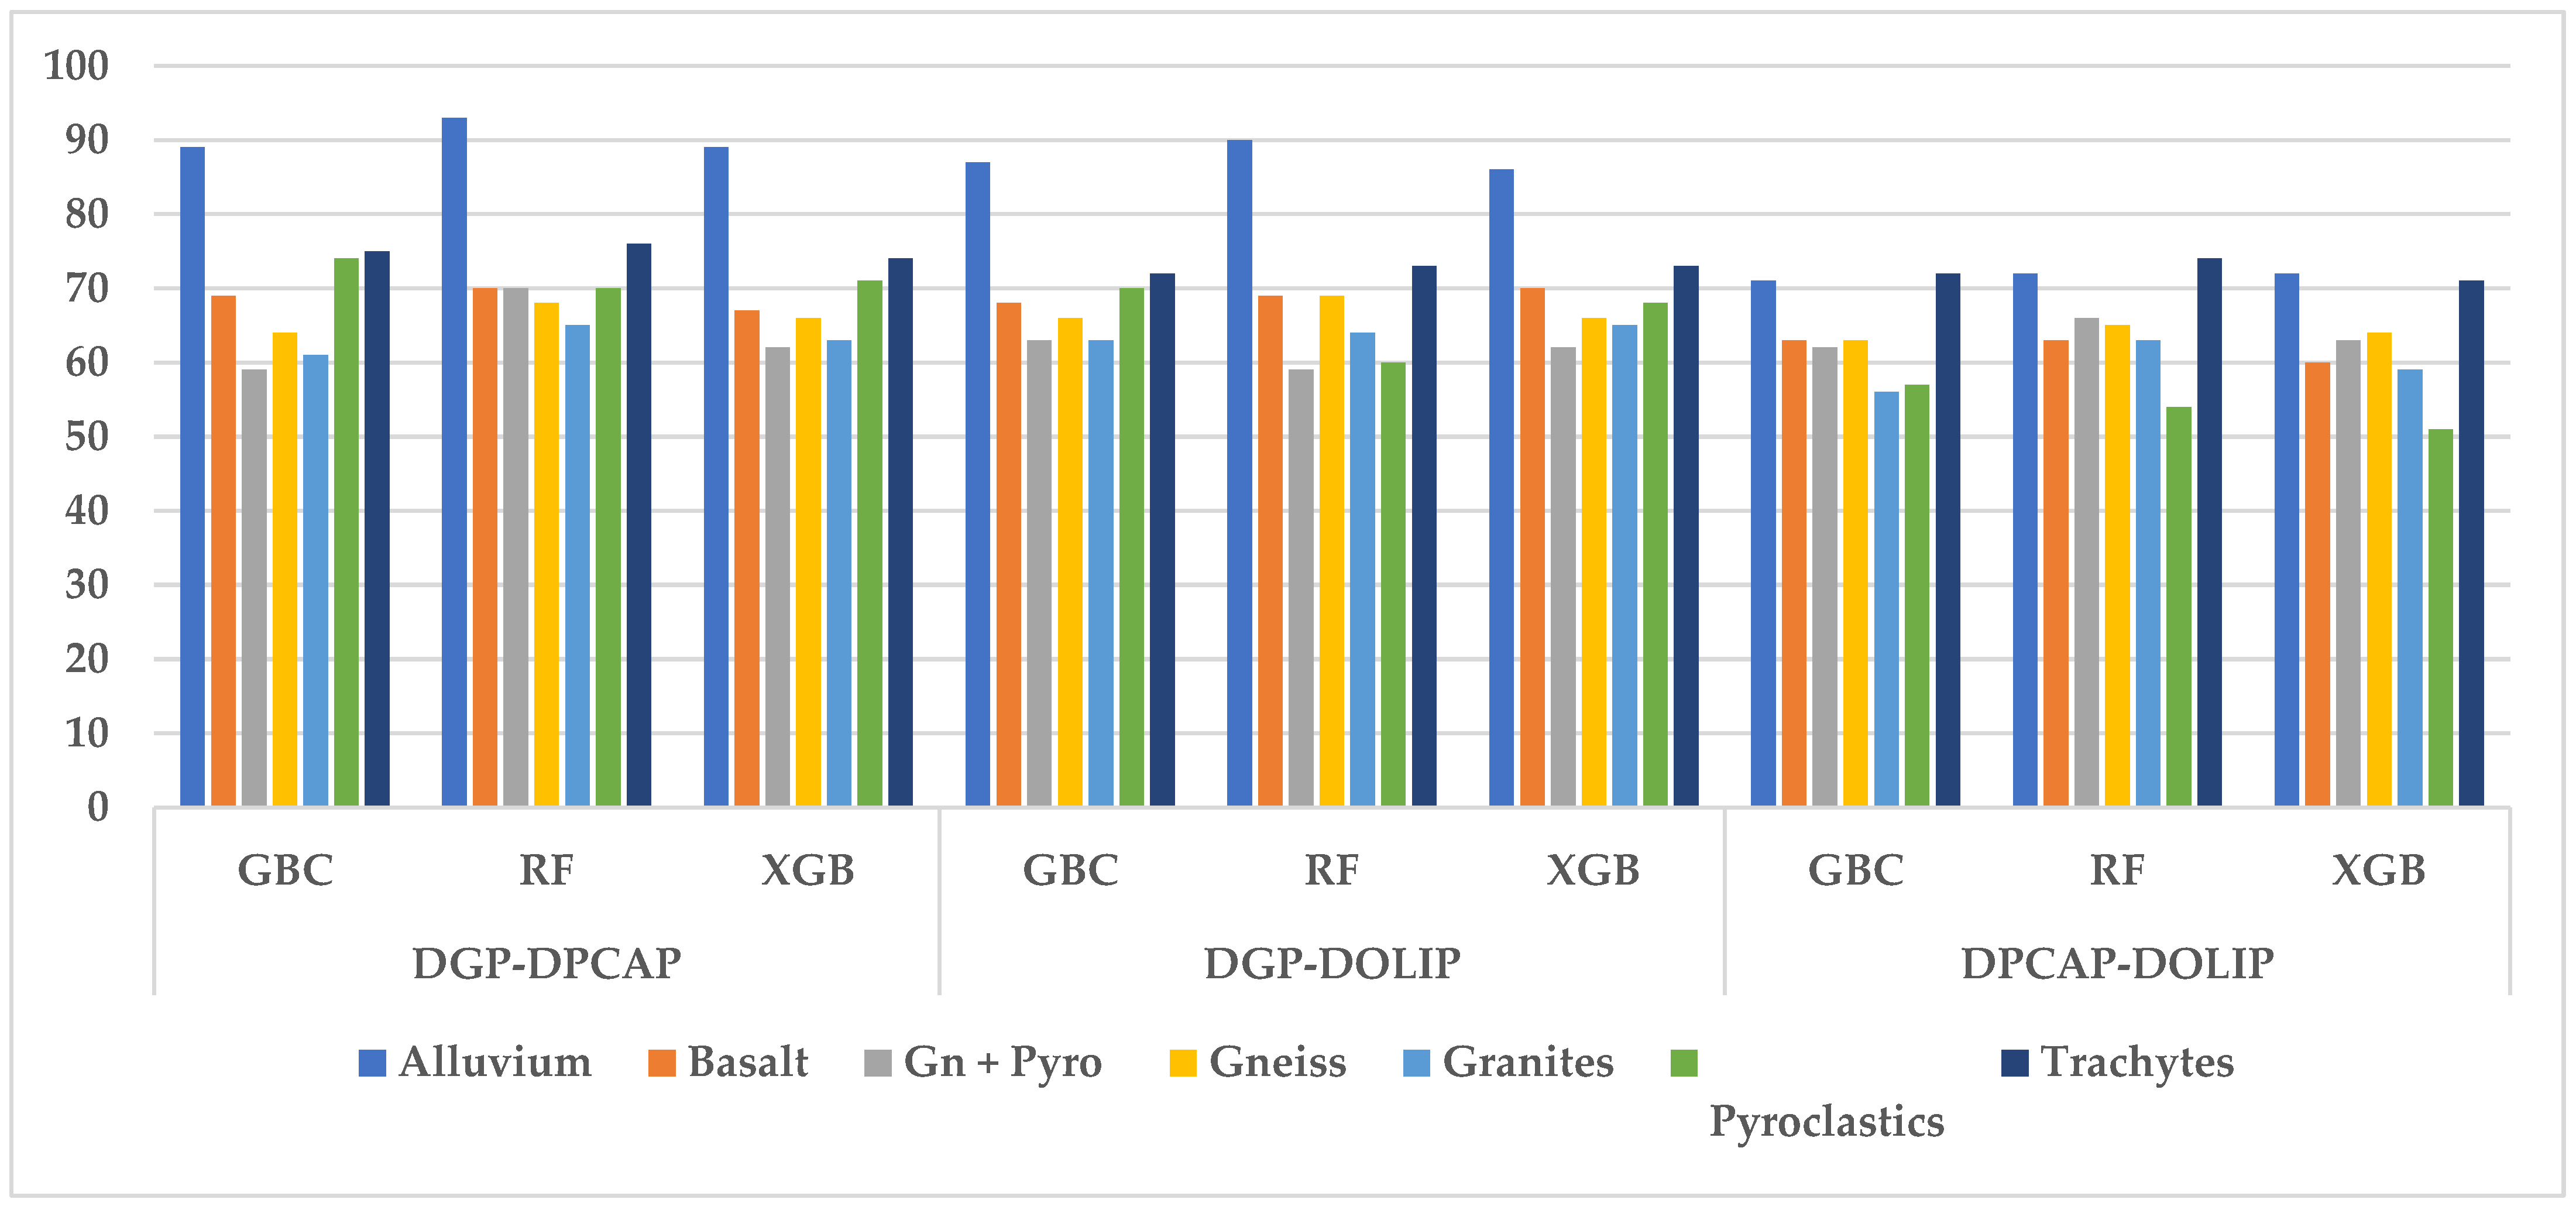
Table A2, presented in
Appendix A, provides the performances of the Gradient Boosting Classifier (GBC), Random Forest (RF), and XGBoost (XGB) algorithms in percentage, applied to different types of geological data (alluvium, basalt, etc.), using three combinations of parameters: DGP-DPCAP, DGP-DOLIP, and DPCAP-DOLIP. The DGP-DPCAP parameters stand out for their overall superior performance, with results such as 93% for alluvium and 70% for pyroclastics obtained by Random Forest.
The DGP-DOLIP combination also offers good results, notably 90% for alluvium and 73% for trachytes, confirming its effectiveness for exploiting geographic and spectrometric data. In contrast, due to dimensionality reduction, the DGP-DPCAP combination produces slightly lower scores in several categories, such as 56% for granites and 51% for pyroclastics, which could result in a loss of information.
Random Forest is the best-performing algorithm in most cases, particularly with the DGP-DPCAP and DGP-DOLIP combinations, which effectively exploit geological data’s spatial and spectrometric relationships.
6. Ablation Analysis
The ablation of our study consists of an analysis to evaluate the individual impact of different sets of parameters or characteristics on the performance of classification models. In this case, the study compares the performance of the algorithms when different datasets are used, including:
Data from geographic parameters (DGPs).
Data from OLI spectrometric parameters (DOLIPs).
Data from PCA parameters (DPCAPs).
Combinations of these data sets.
For each configuration, performance metrics, such as accuracy, MCC, and execution time, are used to determine which data or combinations contribute the most to overall performance.
6.1. Individual Parameter Sets and Classifiers
Geographic parameters (DPGs) provide the best overall performance with 51.53% accuracy and 40.35% MCC achieved with XGBoost.
The spectrometric parameters (PSOLIs) are also efficient, although less affluent than PG.
PCA parameters (PPCAs) perform the worst in accuracy and MCC, but they can still improve performance when combined with other sets.
By comparing the datasets of geographic parameters (DGPs), OLI spectrometric parameters (DOLIPs), and PCA parameters (DPCAPs), the goal is to identify the data or combinations of data that most influence classification performance. Algorithm performance is evaluated using criteria such as accuracy, MCC (Matthews Correlation Coefficient), and execution time.
Geographic Settings (DGPs) achieve the best accuracy results, with Gradient Boosting reaching 51.53%, followed by Random Forest (49.14%) and XGBoost (47.78%).
OLI spectrometric parameters (DOLIPs) achieve the best accuracy with Random Forest (52.59%), outperforming Gradient Boosting and XGBoost in accuracy and MCC.
PCA parameters (DPCAPs) show lower accuracy in all algorithms, with Random Forest remaining the best performer in this category, with an accuracy of 41.98%.
Regarding execution time, Random Forest is the fastest on all datasets, followed by XGBoost and Gradient Boosting.
Table 10 provides valuable insight into the relative impact of different datasets on classification performance. It shows that DGP and DOLIP ensembles are more effective at improving classification results than DPCAP, with Random Forest consistently performing across all datasets.
6.2. Combinations of Parameter Sets and Classifiers
The goal is to identify which data combinations most influence classification performance by comparing dataset combinations of geographic parameters (DGPs), OLI spectrometric parameters (DOLIPs), and PCA parameters (DPCAPs). Algorithm performance is measured using criteria such as accuracy, MCC (Matthews Correlation Coefficient), and execution time.
The DGP-DOLIP combinations achieve similar results in terms of accuracy, with XGBoost and Random Forest reaching 51.53% and Gradient Boosting slightly lower (50.51%). Performance in MCC follows a similar pattern, with XGBoost and Random Forest delivering close results at 40.35% and 40.28%, respectively.
DGP-DPCAP combinations perform better, especially with Random Forest, which achieves the best accuracy (55.29%) and high MCC (45.12%), outperforming other algorithms in this combination.
The DPCAP-DOLIP combinations show relatively lower performance, with Random Forest still performing best (45.05%) but with a significantly lower MCC (31.81%) than in the other combinations.
Regarding execution time, Random Forest remains the fastest across all combinations, followed by XGBoost and Gradient Boosting.
Table 11 provides essential insight into the impact of different dataset combinations on classification performance. It suggests that DGP-DPCAP and DGP-DOLIP combinations improve classification results, with Random Forest showing consistent, high-level performance across all data combinations.
6.3. Comparison of Algorithms
Random Forest demonstrates the best overall performance, achieving the highest accuracy and MCC while maintaining the fastest execution time across all configurations. It excels in the DGP-DPCAP and DGP-DOLIP combinations, significantly outperforming other models.
XGBoost performs well but remains slightly behind Random Forest in accuracy and MCC. Additionally, it is somewhat slower, making it a strong contender but not the most optimal choice.
Gradient Boosting exhibits weaker performance, especially in precision and MCC. It is also slower, making it less competitive than Random Forest and XGBoost. However, it can still be viable in specific configurations where its strengths may be beneficial.
In conclusion, Random Forest is the most robust and efficient algorithm, with consistent and strong performance across all dataset combinations, particularly for accuracy, MCC, and running time.
7. Discussion
The results of this study highlight the crucial importance of geographic and spectrometric parameters in enhancing the performance of geological classification models. The model performances vary significantly depending on the datasets and algorithms used, revealing interesting trends and potential areas for improvement.
The superior performance of the Random Forest model in most data combinations can be attributed to its ability to handle heterogeneous and noisy datasets while limiting overfitting through its tree aggregation mechanism. For instance, the combination of geographic parameters and principal component analysis data (DGP-DPCAP) achieved an accuracy of 55.29% and an MCC of 45.12%, surpassing other tested combinations.
A particularly notable result is the high accuracy achieved in the classification of alluvium, reaching up to 93% with the Random Forest algorithm. This effectiveness can be explained by several geological factors. Alluvium typically exhibits distinct spectral and morphological characteristics due to its sandy, silty, or clayey composition, which differs markedly from denser and more coherent rock formations. Additionally, its topographic location in valleys and plains, often accompanied by a dense hydrographic network, facilitates detection using geographic parameters, such as low slope and proximity to watercourses. These features make alluvium easier to identify using classification algorithms compared to more complex lithologies or those obscured by dense vegetation.
However, this high performance for alluvium raises fundamental questions about the complexity of the methods used. The detection of alluvium could potentially be achieved using simpler models, such as a high-resolution Digital Terrain Model (DTM). Geomorphological analysis techniques in a Geographic Information System (GIS), could delineate valley bottoms and alluvial extents with comparable or even superior accuracy.
It is therefore essential to refocus the use of such algorithms on more complex classification challenges. While alluvium serves as an excellent case study for model validation, it does not represent a significant challenge for machine learning techniques compared to difficult lithologies, such as metamorphic formations or volcanic units, where the advantages of advanced algorithms are more justified.
Another key finding concerns the high accuracy achieved in classifying trachytes and basalts, despite the challenges inherent in detecting them, especially under dense vegetation cover. In field surveys, trachytes and basalts are often difficult to identify due to surface weathering and vegetation that obscures outcrops. However, the results suggest that the geographic and spectrometric parameters integrated into the model help overcome these challenges. Trachytes have specific spectral signatures, particularly in the near-infrared and mid-infrared bands, which machine learning algorithms can exploit to differentiate them from adjacent formations. Additionally, their rugged topography, characterized by steep slopes, provides a geomorphological cue that aids in their detection.
The model’s ability to effectively identify complex geological formations fully justifies the use of advanced machine learning methods, such as Random Forest, in contexts where simpler techniques fail to capture geological complexity. The results for trachytes and basalts illustrate the potential of these approaches for more demanding geological applications and highlight their value beyond the simplest cases.
The study also emphasizes the varying impact of different parameter sets on model performance. Geographic parameters (DGPs) consistently yield solid results, particularly for classes like alluvium, trachytes, basalts, and pyroclastics, where spatial context plays a critical role. Random Forest and XGBoost exhibit competitive performance, with Random Forest achieving 51.53% accuracy and an MCC of 37.39%, while Gradient Boosting and XGBoost also perform well.
OLI spectrometric parameters (DOLIPs) significantly influence model performance due to their spectral richness. Random Forest again leads with 52.59% accuracy and an MCC of 30.32%, followed by XGBoost with 43.34% accuracy and 30.09% MCC. These findings highlight the strength of OLI data in capturing key geological characteristics, making them a strategic choice for geospatial and spectral classification tasks.
Principal component analysis (PCA) parameters (DPCAPs) reduce data dimensionality while retaining essential information, improving execution times—Random Forest processes this data in just 2.60 ms. However, PCA data yield lower accuracy (41.98%) and MCC (28.23%) compared to other datasets. PCA proves useful in specific cases, such as granite and trachyte detection, where its dimensionality reduction aids in handling complex data, albeit sometimes at the expense of accuracy.
Combining different datasets generally enhances model performance, though the impact depends on the combination. The DGP-DPCAP combination yielded the highest accuracy (55.29%) and MCC (45.12%) with Random Forest. In contrast, combining DOLIP and DPCAP resulted in less optimal outcomes, suggesting that excessive data complexity can hinder model effectiveness. For example, the DPCAP-DOLIP combination with Random Forest produced lower accuracy (45.05%) and MCC (31.81%) than other combinations.
This study demonstrates that geographic (DGP) and OLI spectrometric parameters (DOLIPs) are most effective in boosting classification performance, particularly when using Random Forest. While PCA parameters (DPCAPs) reduce dimensionality and execution time, they offer lower accuracy and MCC than other datasets.
Finally, it is important to contextualize the significance of reduced computation time in geological studies. While algorithmic efficiency is often viewed as a benefit, the time saved—typically measured in seconds or minutes—is negligible compared to the extensive time required for ground surveys and laboratory analyses, which can span weeks or months. Therefore, while computational efficiency is valuable, its impact is secondary to the time-intensive processes involved in geological validation. The true value of advanced algorithms lies in their ability to process large, heterogeneous datasets and extract complex patterns, rather than simply minimizing execution time.
The results align with Wang et al. [
25], who demonstrated the effectiveness of multi-source approaches in geological mapping. Although Random Forest performed well in this study, its accuracy remains below the 96% reported by Wang et al. using convolutional neural networks (CNNs), underscoring the potential benefits of exploring deep learning architectures for enhanced classification.
Similarly, the performance of XGBoost in certain configurations corroborates the findings of Han et al. [
13], who highlighted the algorithm’s robustness in handling multisource data within complex geological contexts.
A major challenge identified in this study is the imbalance of geological classes within the dataset, with certain formations being overrepresented. This imbalance may bias the models toward dominant classes at the expense of underrepresented ones.
Additionally, while the data sources (optical, radar, morphometric) provide valuable insights, they remain static snapshots and may not fully capture the spatiotemporal variability of geological formations. The complex geological structures of the Western Highlands of Cameroon further complicate classification, with intertwined tectonic and volcanic features adding layers of complexity.
Several avenues could improve model performance and refine results. Integrating hyperspectral or LiDAR data could enhance mineralogical and topographical insights, improving model accuracy. Also, exploring convolutional neural networks (CNNs) or graph neural networks (GNNs) could better capture spatial relationships and complex data structures. Applying oversampling techniques for minority classes or cost-sensitive learning approaches could also mitigate class imbalance effects.
The study’s findings have significant implications for natural resource management and geological risk prevention. The methods developed here can be adapted to other regions with similar geological contexts, contributing to more effective land management and a deeper understanding of geological systems.
8. Conclusions
This study explored the impact of different combinations of geospatial and spectrometric data on the performance of classification algorithms in a geological context. By combining geographic parameters, OLI spectrometric parameters, and data from dimension reduction by PCA, the objective was to evaluate the influence of each type of data and their combination on algorithms, such as Random Forest, XGBoost, and Gradient Boosting. The results showed that OLI geographic and spectrometric data are most effective in improving overall model accuracy and performance, especially with Random Forest. These data provide nuanced and specific information that is crucial for geological classification. In contrast, PCA data, while helpful in reducing dimensionality and speeding up execution, did not show exceptional performance in accuracy compared to other datasets.
Combining different data sources generally improves results, although information overload in some combinations, such as OLI and PCA, has shown less optimal performance. Thus, judiciously adding these parameters can result in significant gains in accuracy and MCC, but it is crucial to select the right combinations to avoid excessive complexity. We plan to extend this study to other regions or types of geological formations to verify the robustness and generalization of the models. In addition, we will collect more data to balance the representation of different types of geological formations. Adding additional data will help reduce bias related to underrepresented classes, thereby improving the performance and fairness of the models. In addition to current parameters, integrating data from hyperspectral, thermal, or radar sensors will be considered. These new sources of information will bring additional richness to the characteristics used by the algorithms, providing a better ability to distinguish complex geological formations and refine predictions.


 ,
, 

