Comparison of Impulse Response Generation Methods for a Simple Shoebox-Shaped Room
Abstract
1. Introduction
- Wave-based methods (hybrid FEM and modal analysis);
- Geometrical acoustics methods (the image method and ray tracing);
- Delay-network reverberators (SDNs);
- Statistical methods (Sabine-NED).
2. Ground-Truth IR Recordings
3. IR Synthesis Techniques
3.1. Image Method
3.2. Ray-Tracing Hybrid
3.2.1. Three-Dimensional Model and Simulation Parameters
3.2.2. Material Absorption Coefficients
3.3. Modal Analysis Method
3.4. Finite Element Analysis Hybrid Method
3.5. Scattering Delay Networks
3.6. Sabine-NED Method
4. Evaluation and Results
4.1. Objective Evaluation
Objective Measures
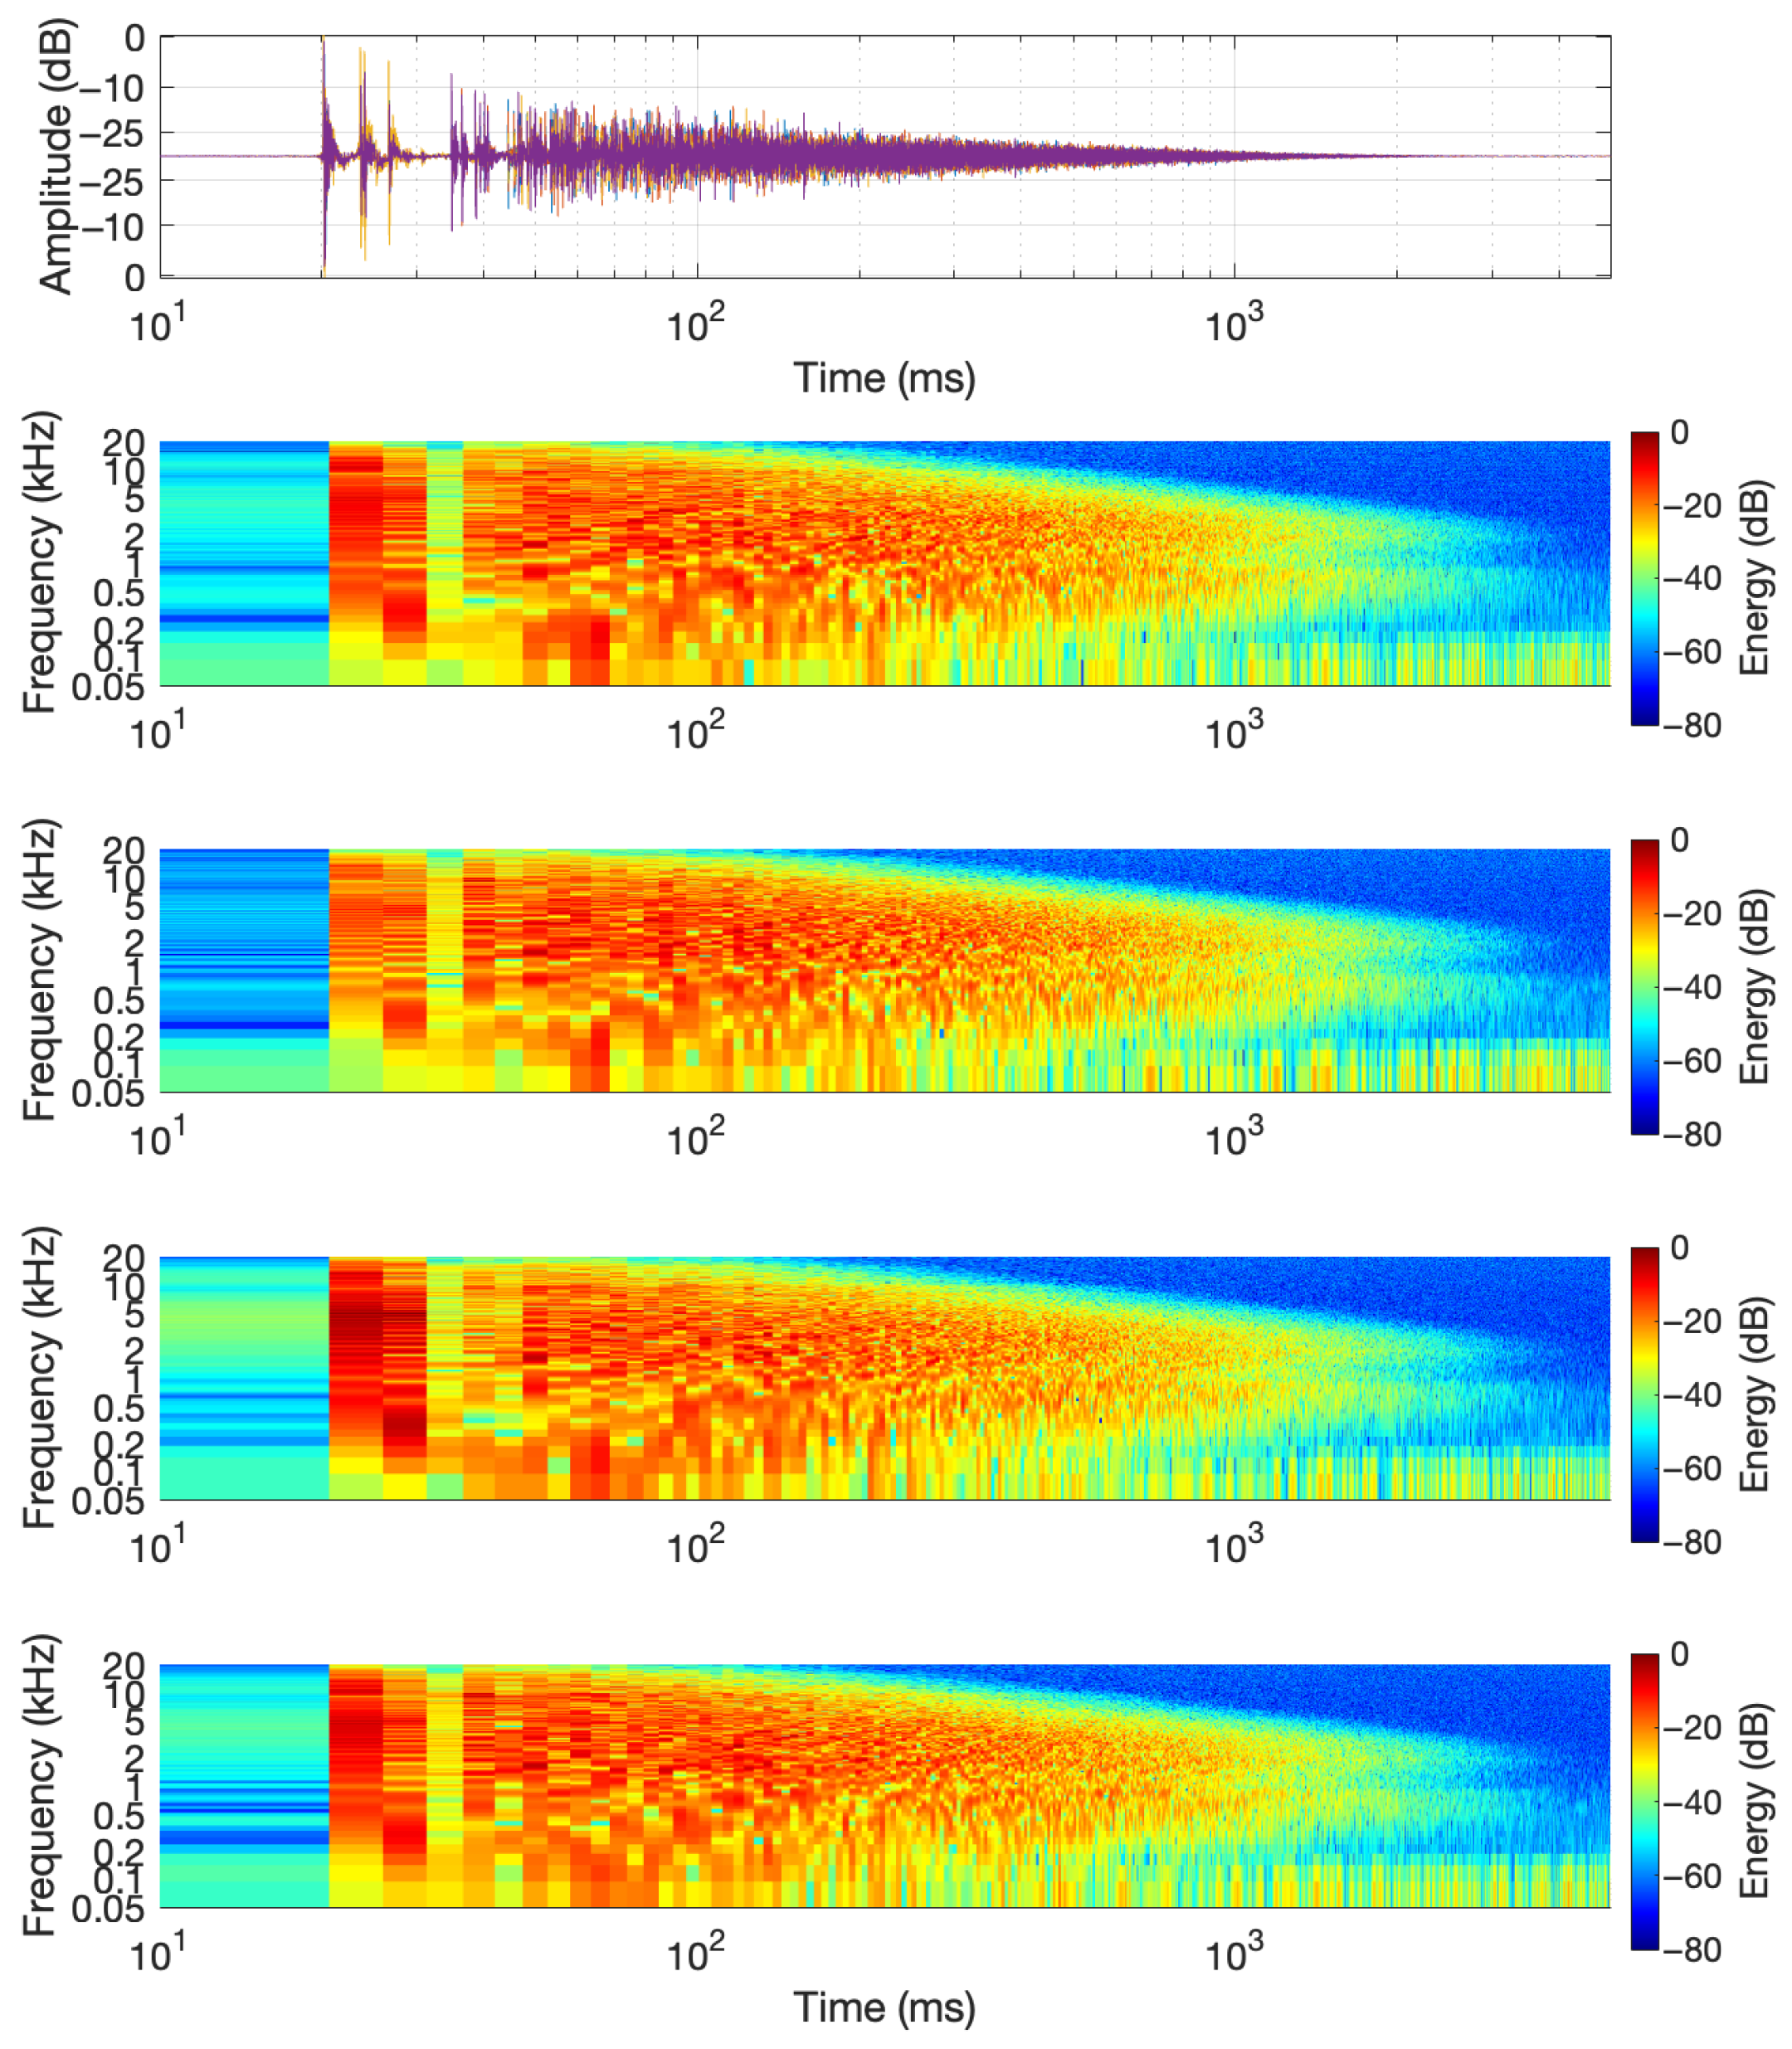
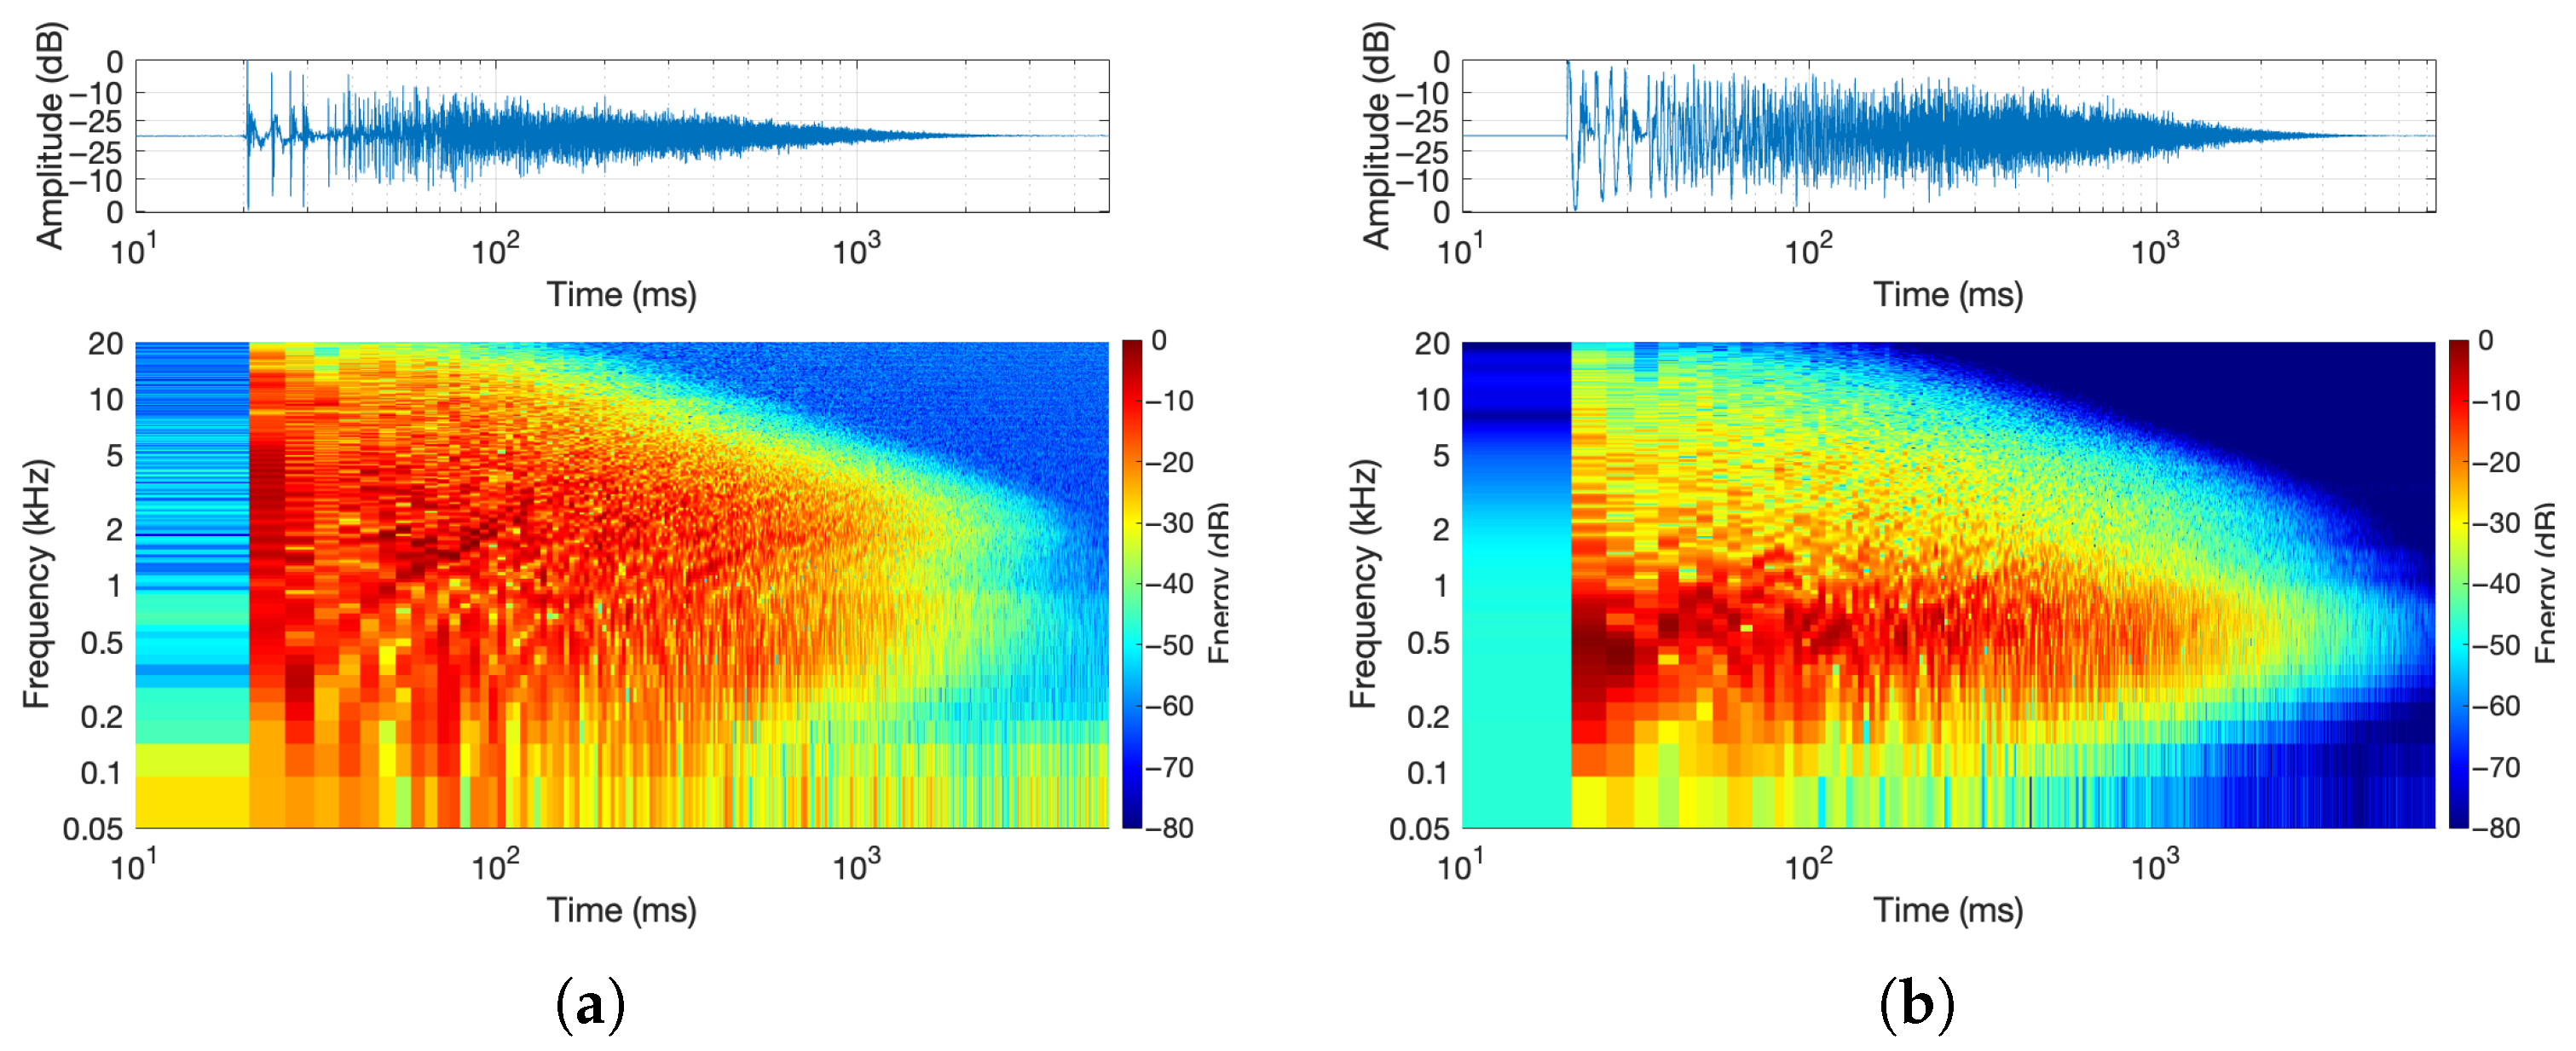
- Spectrogram: To illustrate the frequency characteristics of the IRs, the spectrograms were calculated as follows: First, the responses were re-centered by aligning to the onset of the IR and then normalized. The short-time Fourier Transform (STFT) of each time signal was then calculated with 50 percent overlap, and the magnitude was converted to dB using . Both axes of time and frequency are logarithmically scaled. On a logarithmic scale, early reflections can be more easily seen, and it is close to the exponential shape of the reverb decay. Measured spectrograms are shown in Figure 3.
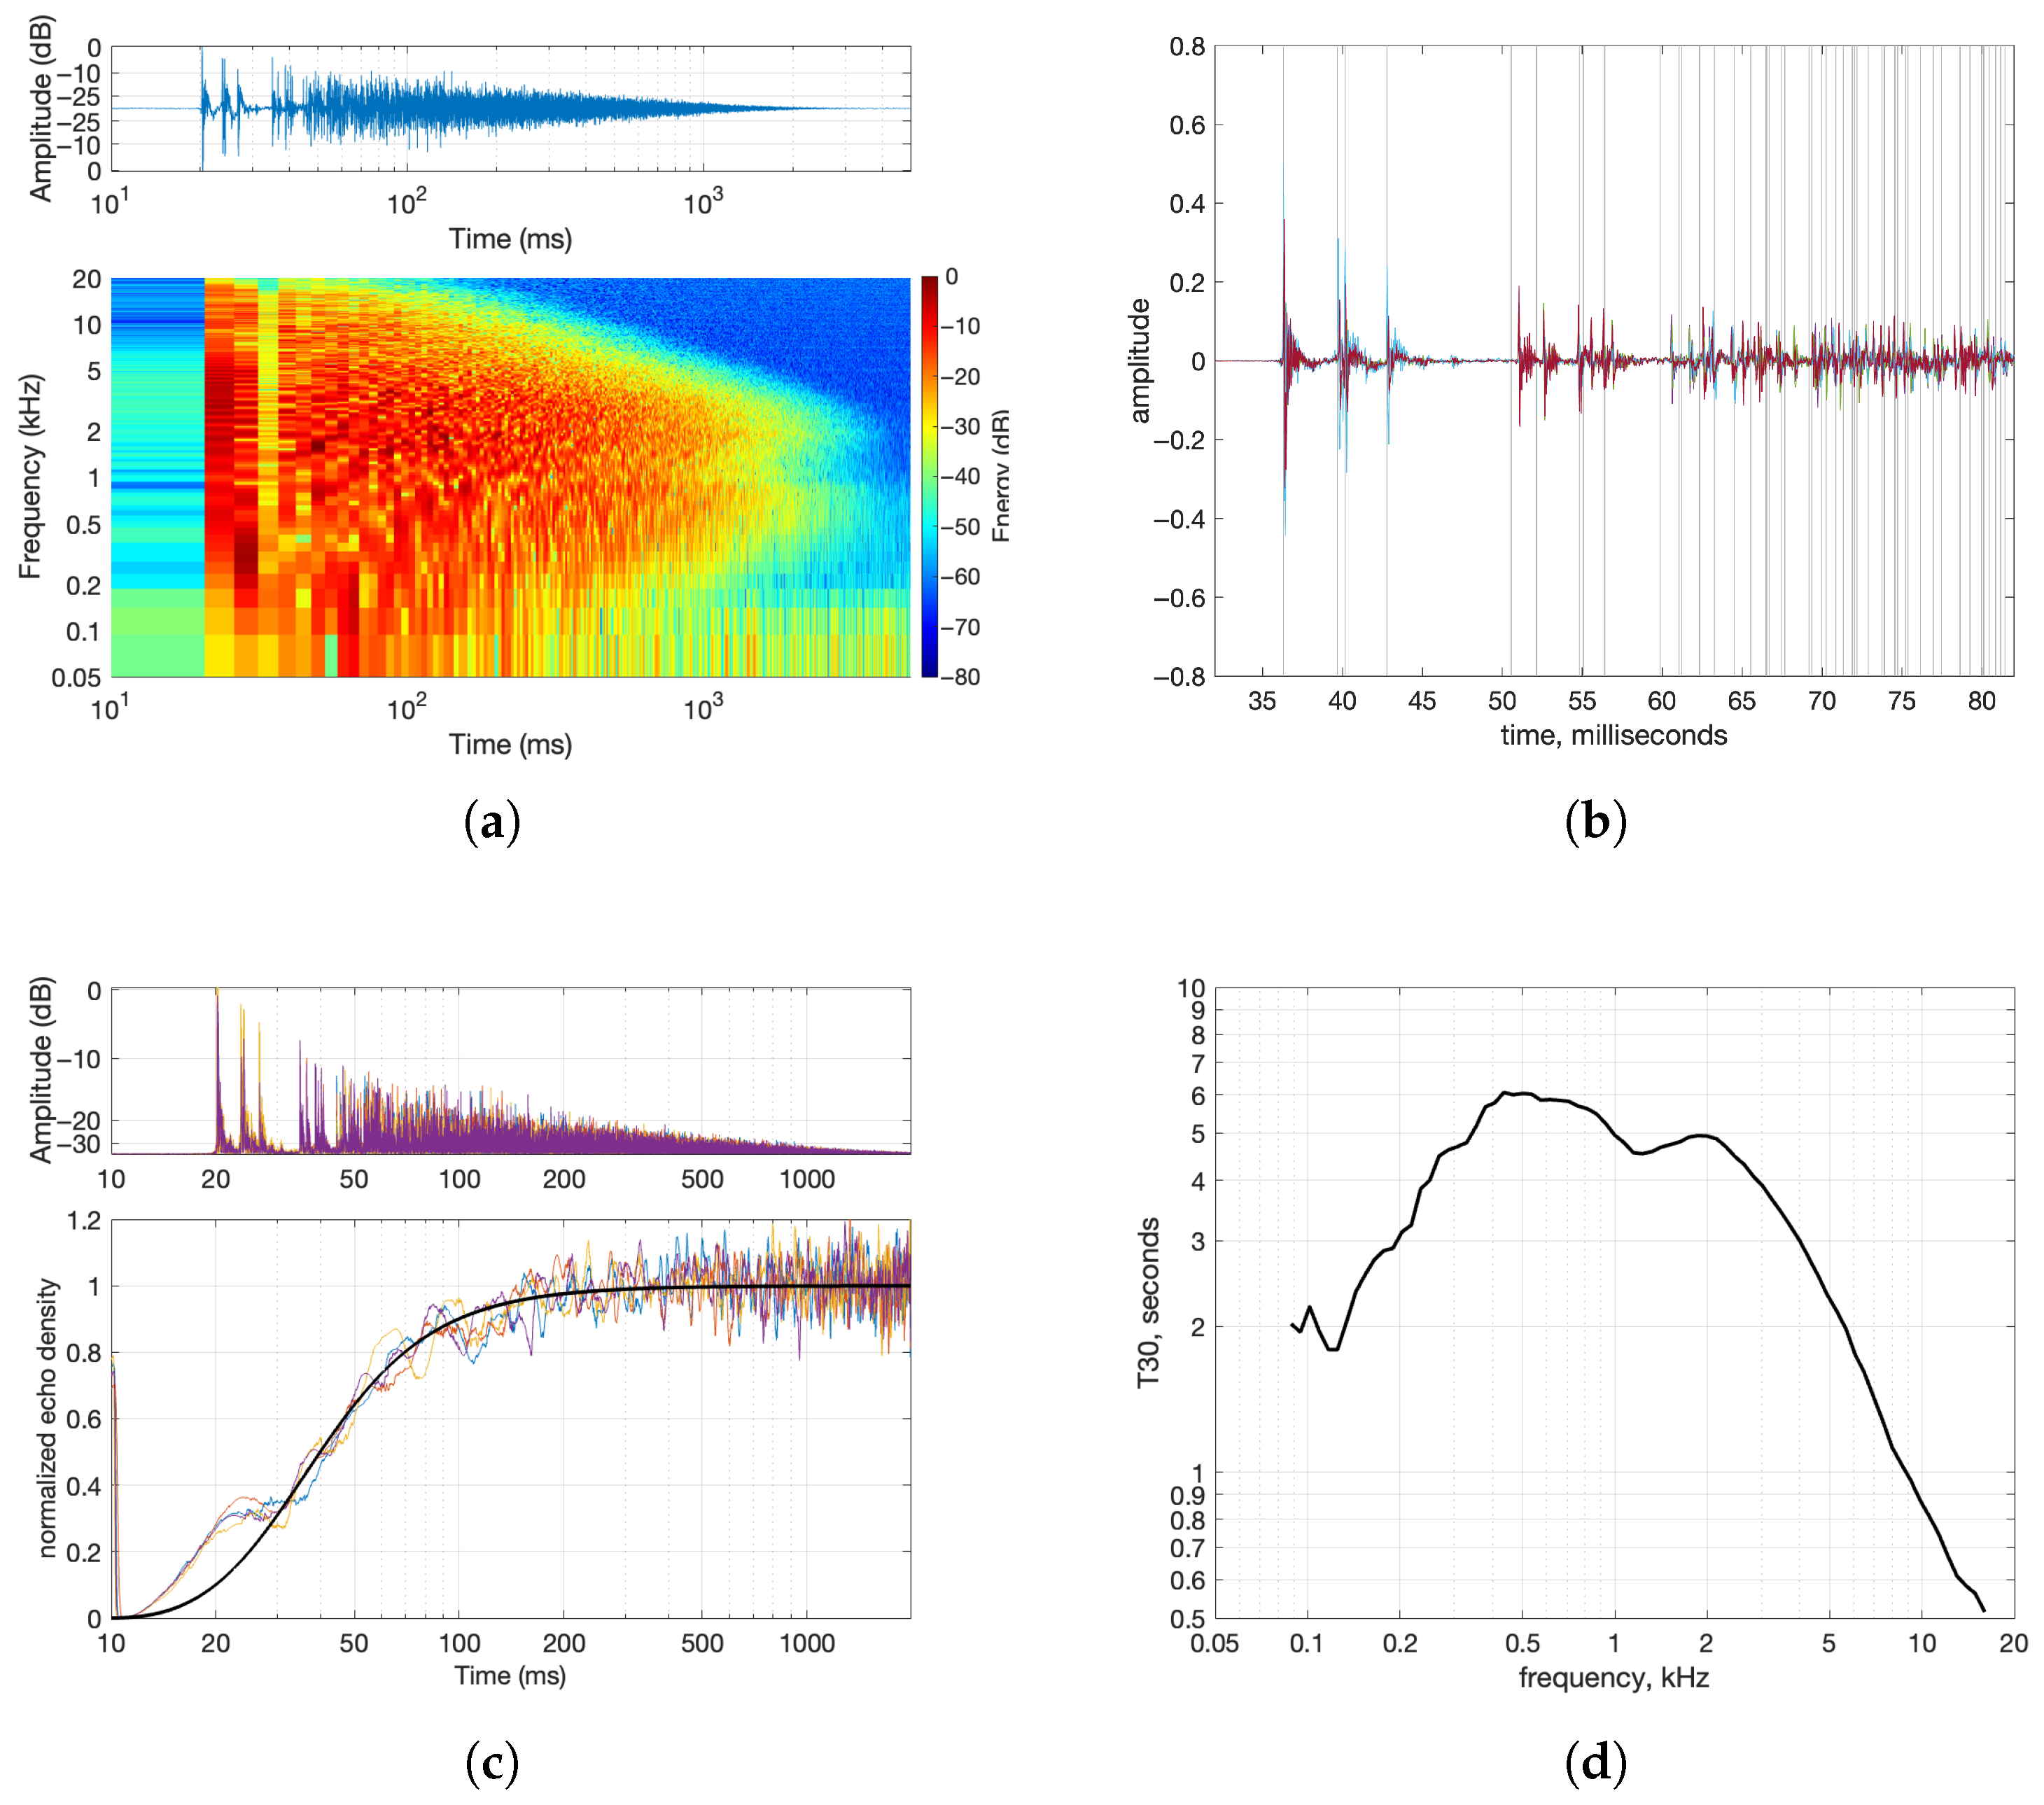
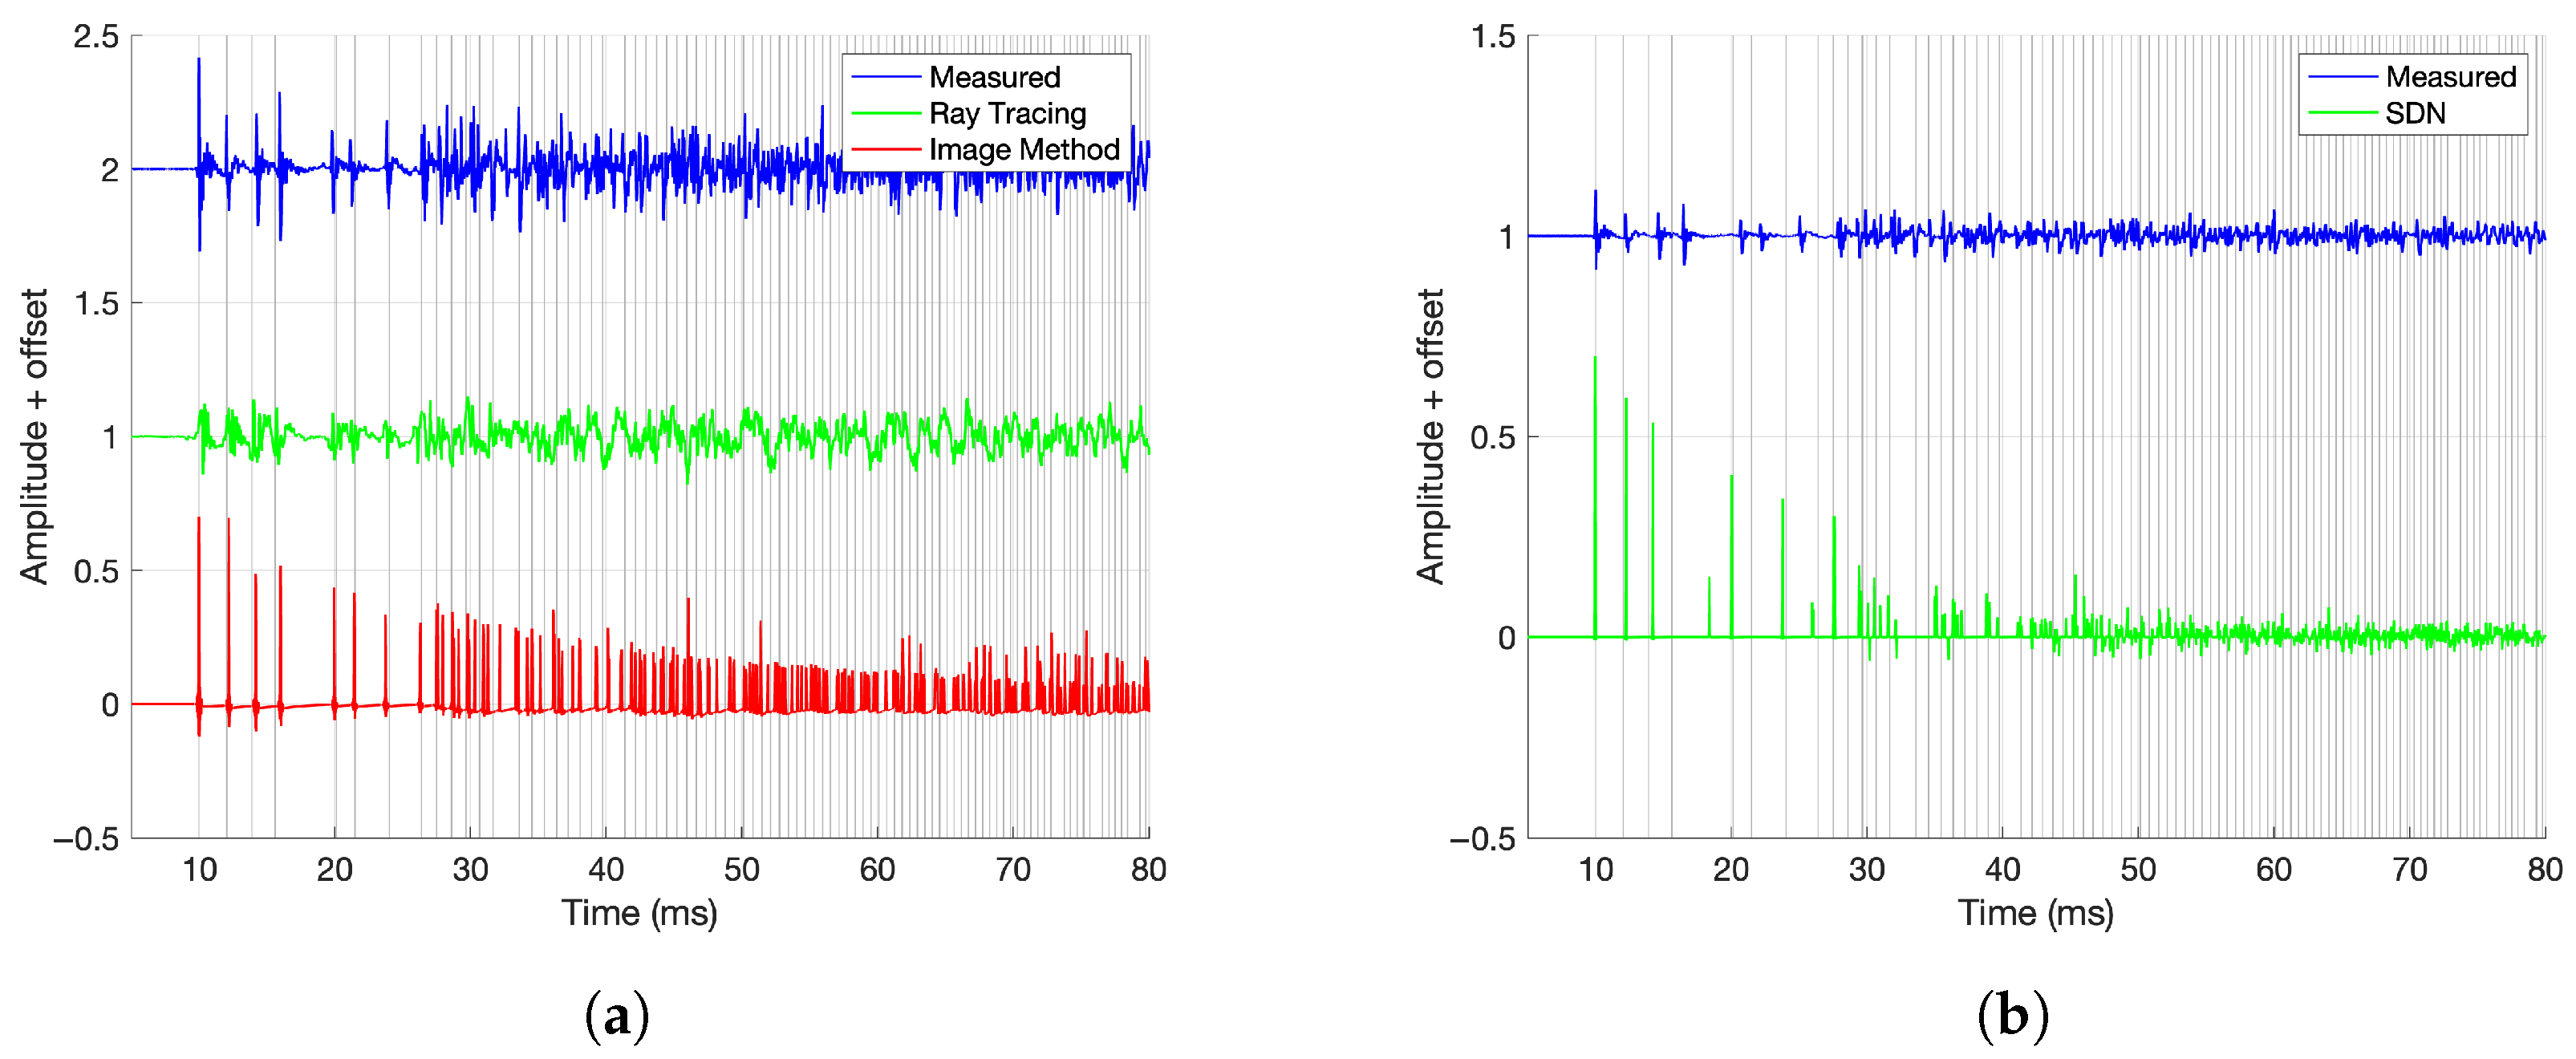
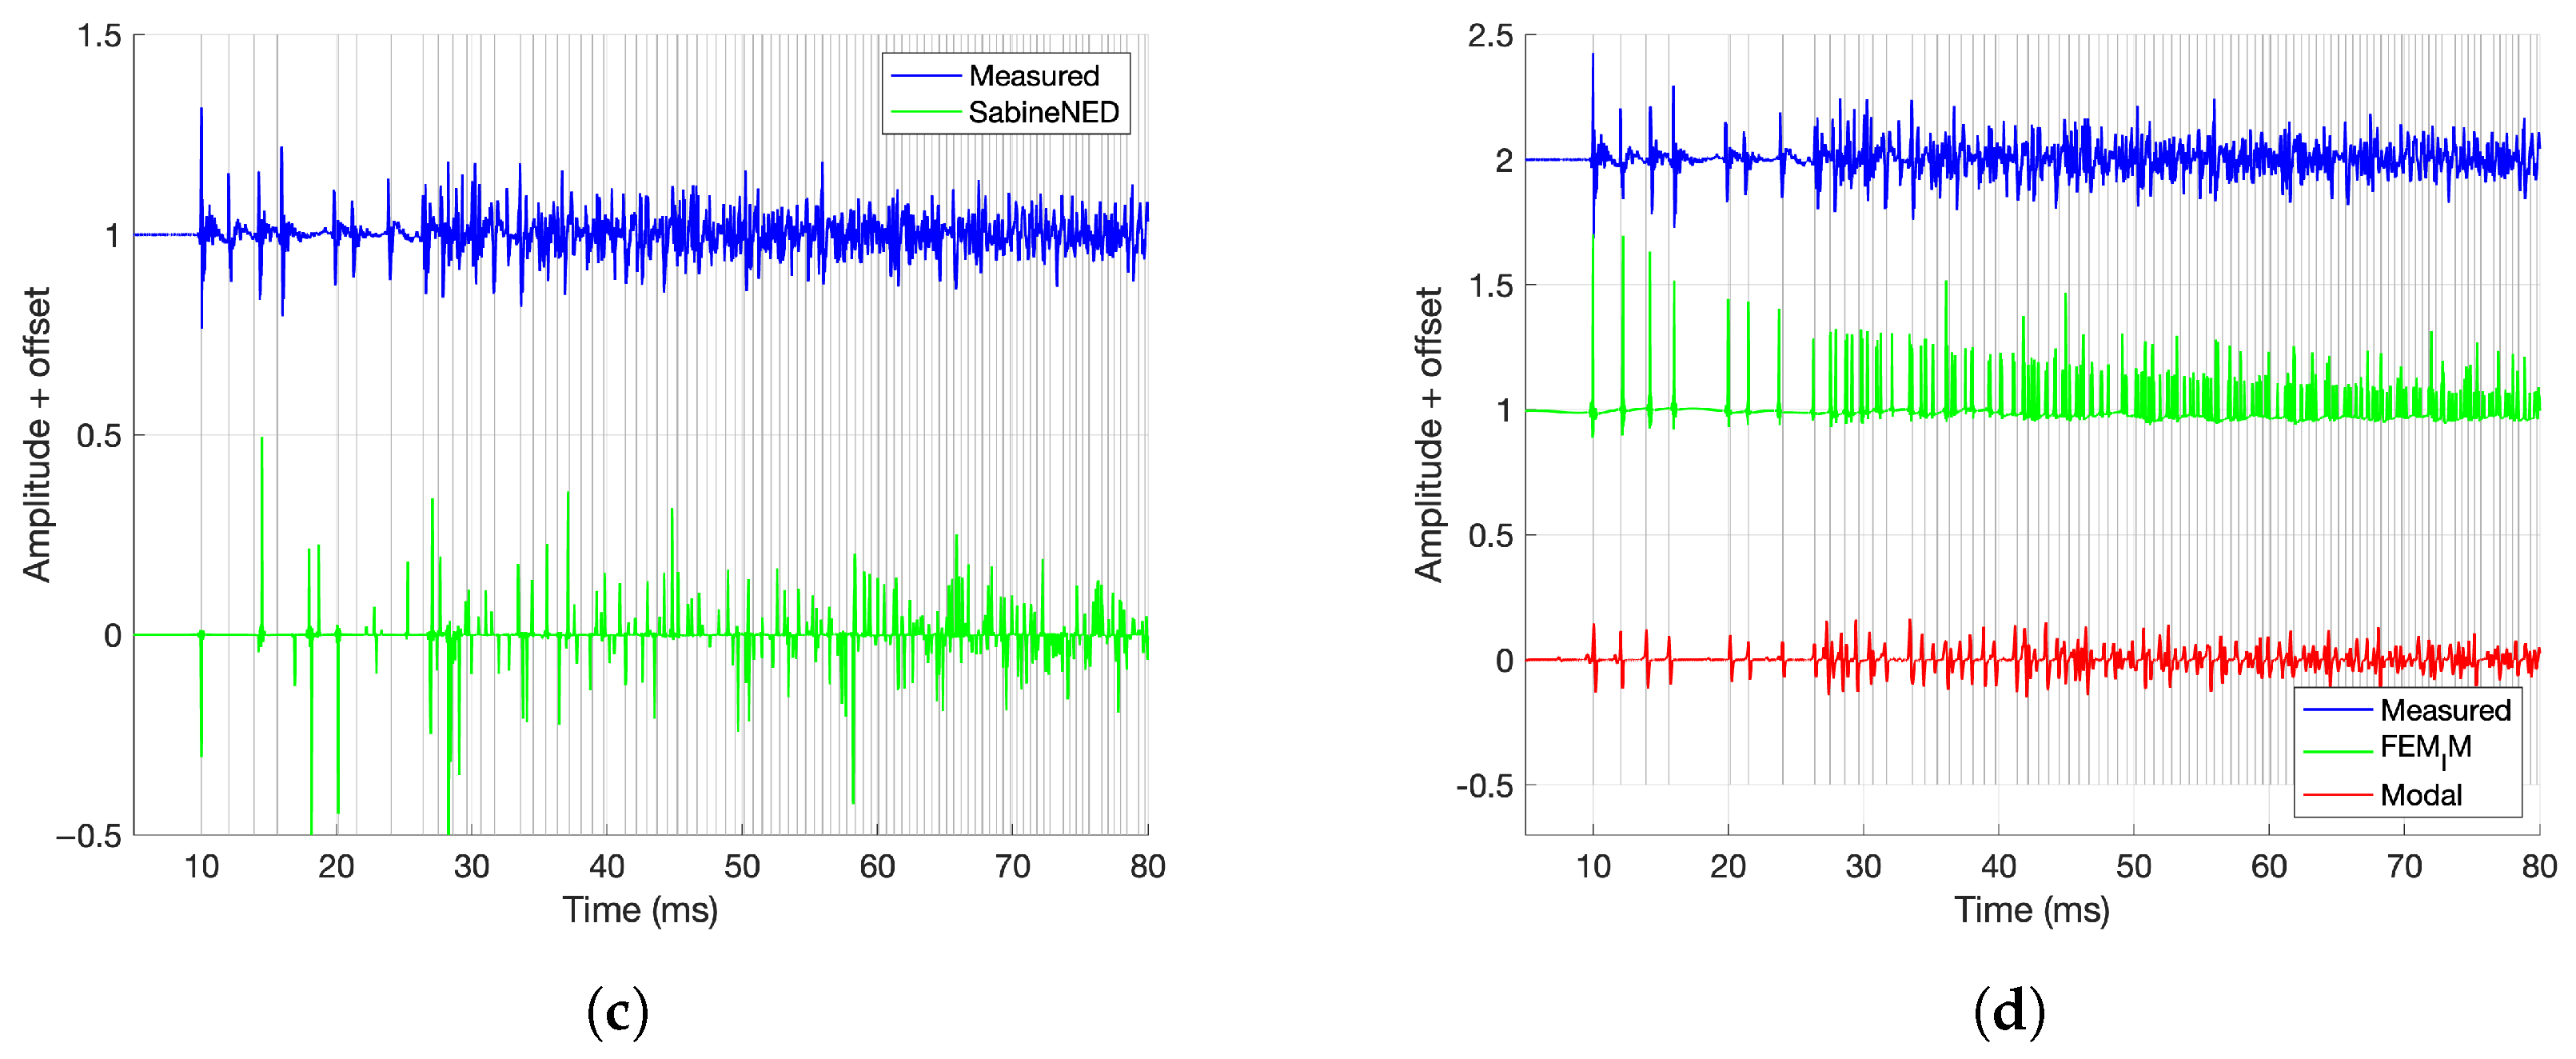
- Arrival Times: The timing of early reflections was validated using an image source model of a rectangular room. The model generates virtual sources by mirroring the speaker position across room boundaries and calculates their distances and directions relative to the microphone. Comparing the modeled arrival times to the measured IRs helped assess how well the synthesis methods preserved early reflection patterns. For a given reflection index , where N is the maximum reflection order along axis i, the position of the image source in dimension i is computed as follows:where
- is the original speaker coordinate along axis i;
- is the length of the room along axis i;
- is the integer reflection count along that axis (positive or negative).
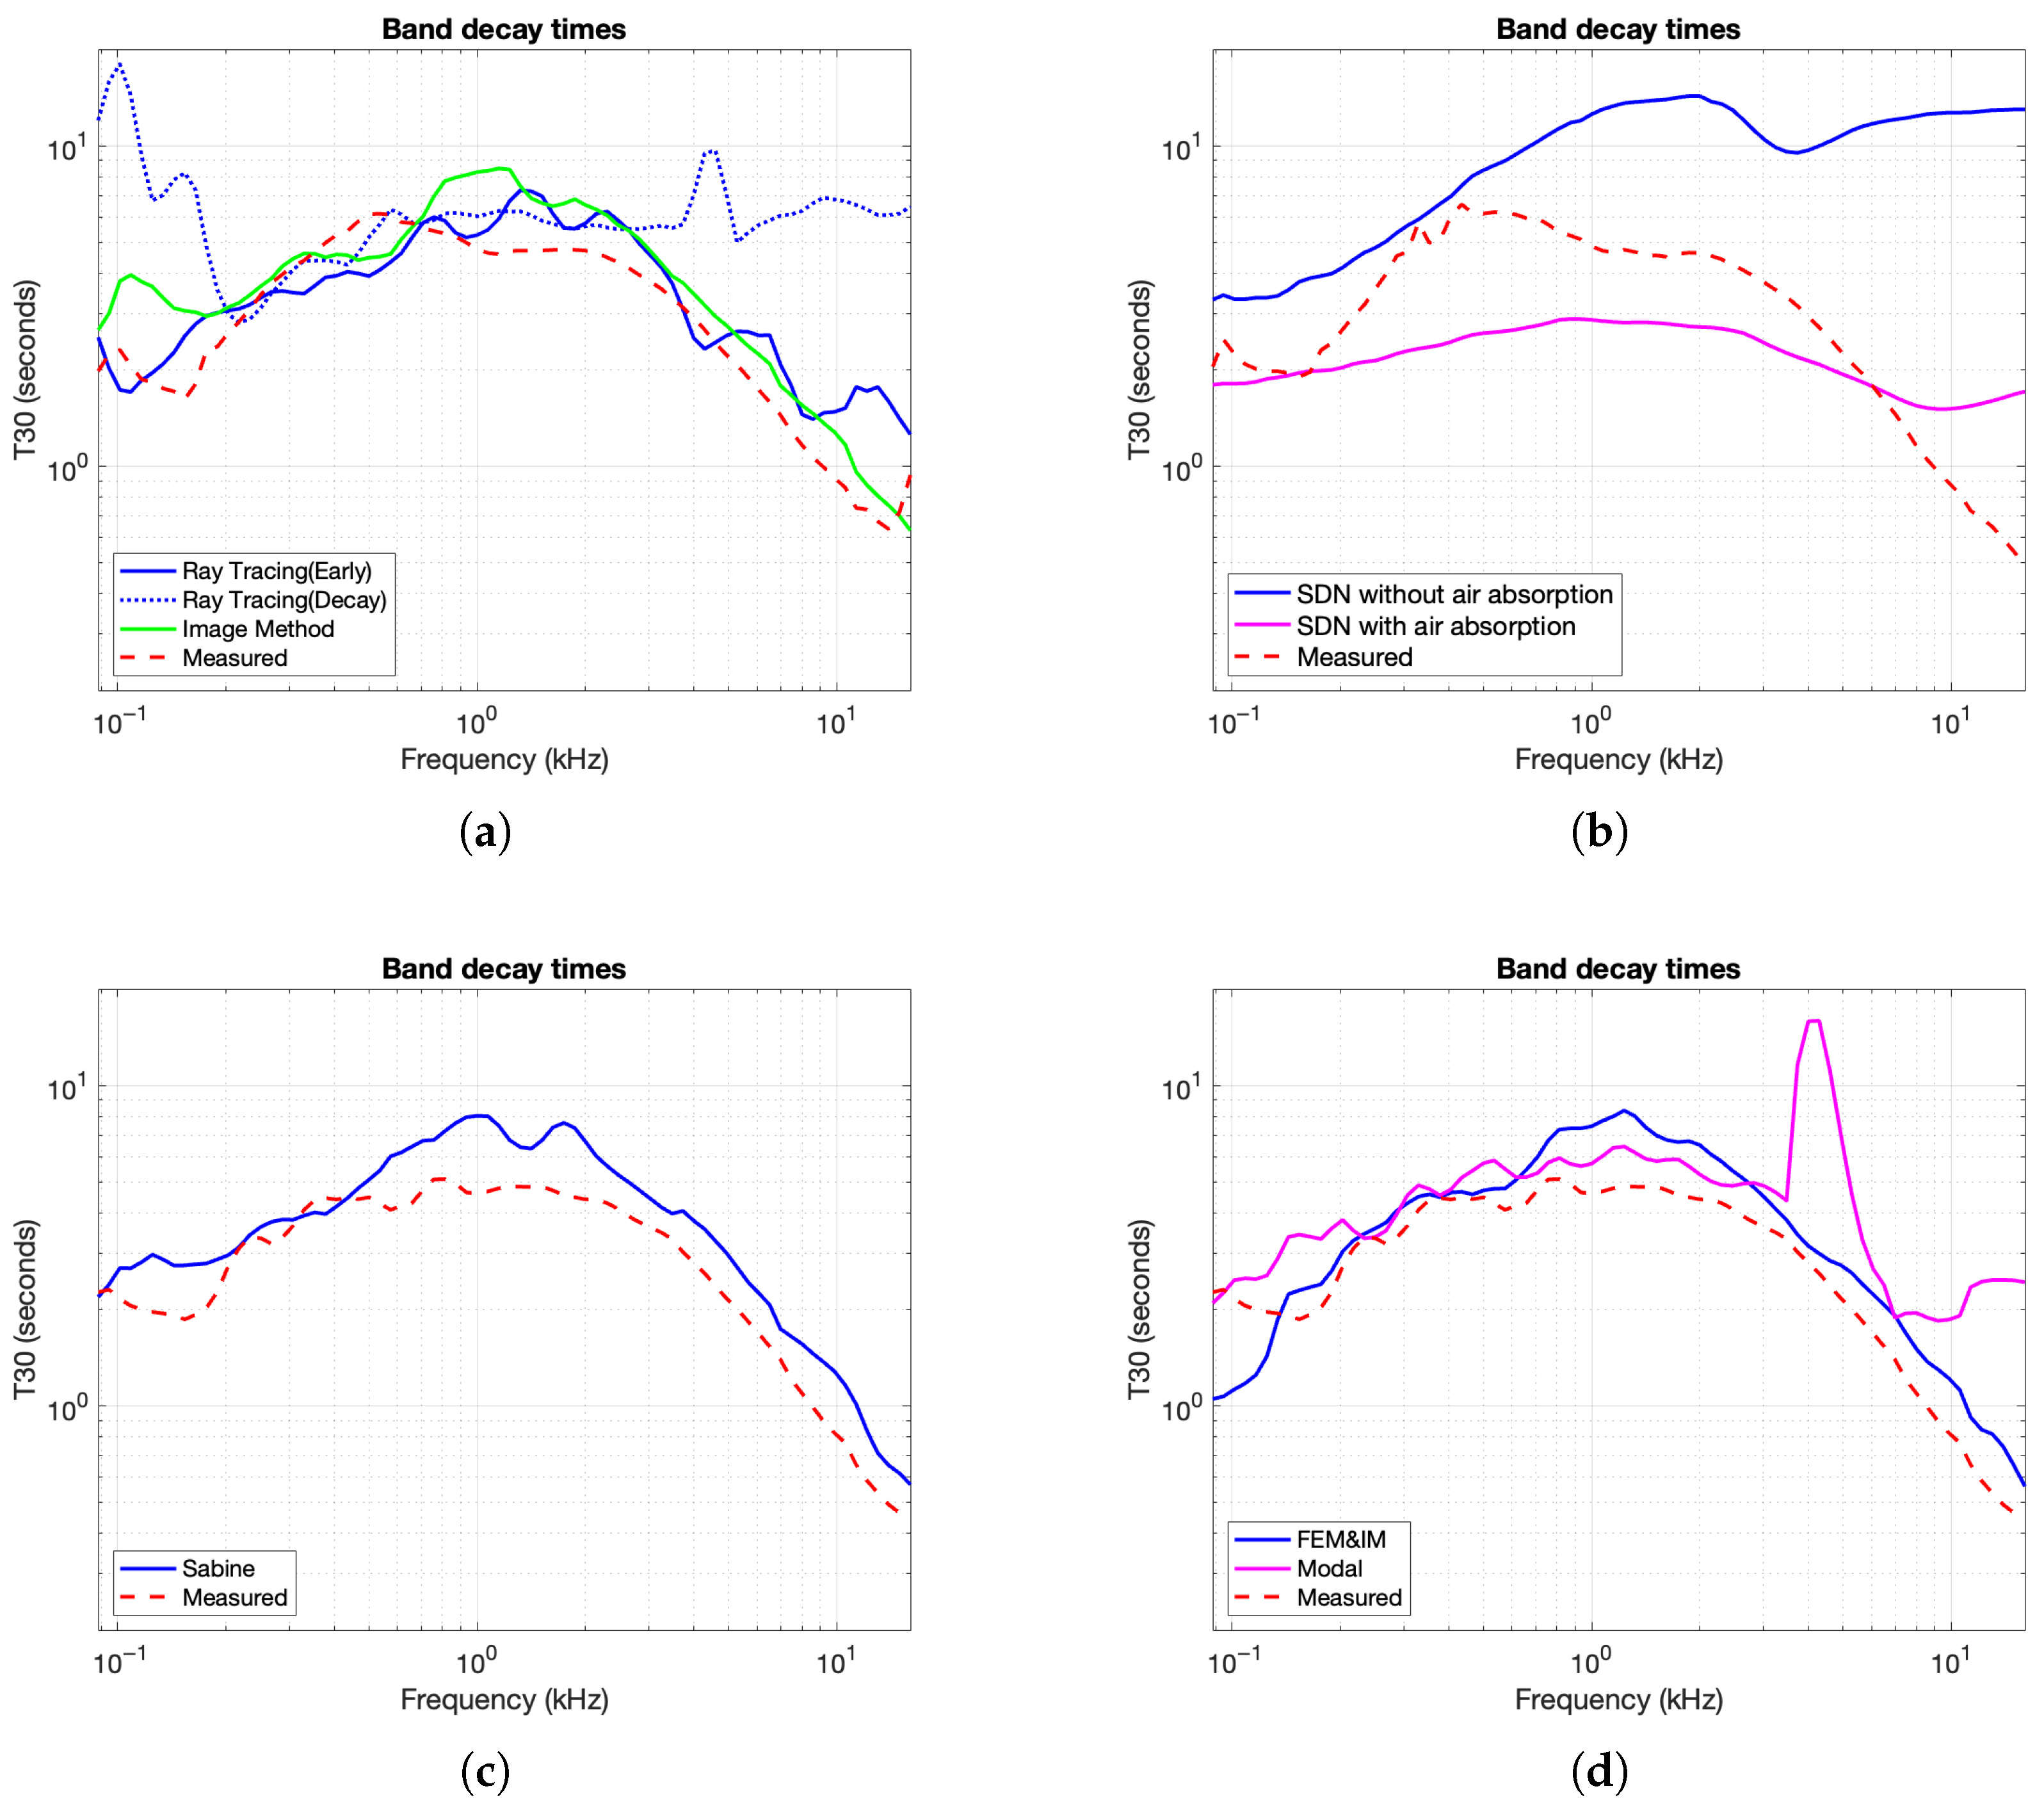
For each image source and the microphone position m, the vector from the source to the mic isThis formula accounts for the alternating nature of image positions based on the parity of the reflection index. The complete set of image source positions is then generated by evaluating all combinations of across each spatial dimension (2D or 3D), forming a grid of mirrored sources.For each image source, the distance (range) is the Euclidean norm of the vector v, whereThe direction vector from the image source to the microphone is computed as a unit vector, whereThis lays the groundwork for computing arrival times that are shown with light gray colors in figures such as Figure 4b. - Band Decay Times: Decay times in multiple frequency bands were measured to evaluate how energy dissipates across the spectrum. This involved filtering the IR into frequency bands, smoothing the energy envelope, estimating the noise floor, and fitting a decay slope. The center frequencies are defined as . This yields fractional octave bands spanning approximately 88 Hz to 16 kHz. The result was a decay curve showing how long it takes for energy to drop by 60 dB in each band.The impulse response is first filtered with a fourth-order Butterworth bandpass filter,where is the bandpass filter for center frequency and ∗ denotes the convolution operation. Then the smoothed energy envelope, , is computed for each band-filtered signal by a Hann window of durationwhere is a normalized Hann window and ∗ denotes convolution. This is known as the response energy profile (REP), and it is the root-mean-square energy of the impulse response over a sliding window.The last of the response was used to estimate the noise floor using a linear fit to the REPThe estimated noise floor level is then given byThe algorithm selects a fitting interval where the signal decays from to , with and . Within this range, a linear fit is computed as follows:The reverberation time for band b is then calculated from the slope asThe output curve demonstrates the required time for the energy to decay 60 dB in each frequency band. An example of a decay time curve is shown in Figure 4d.
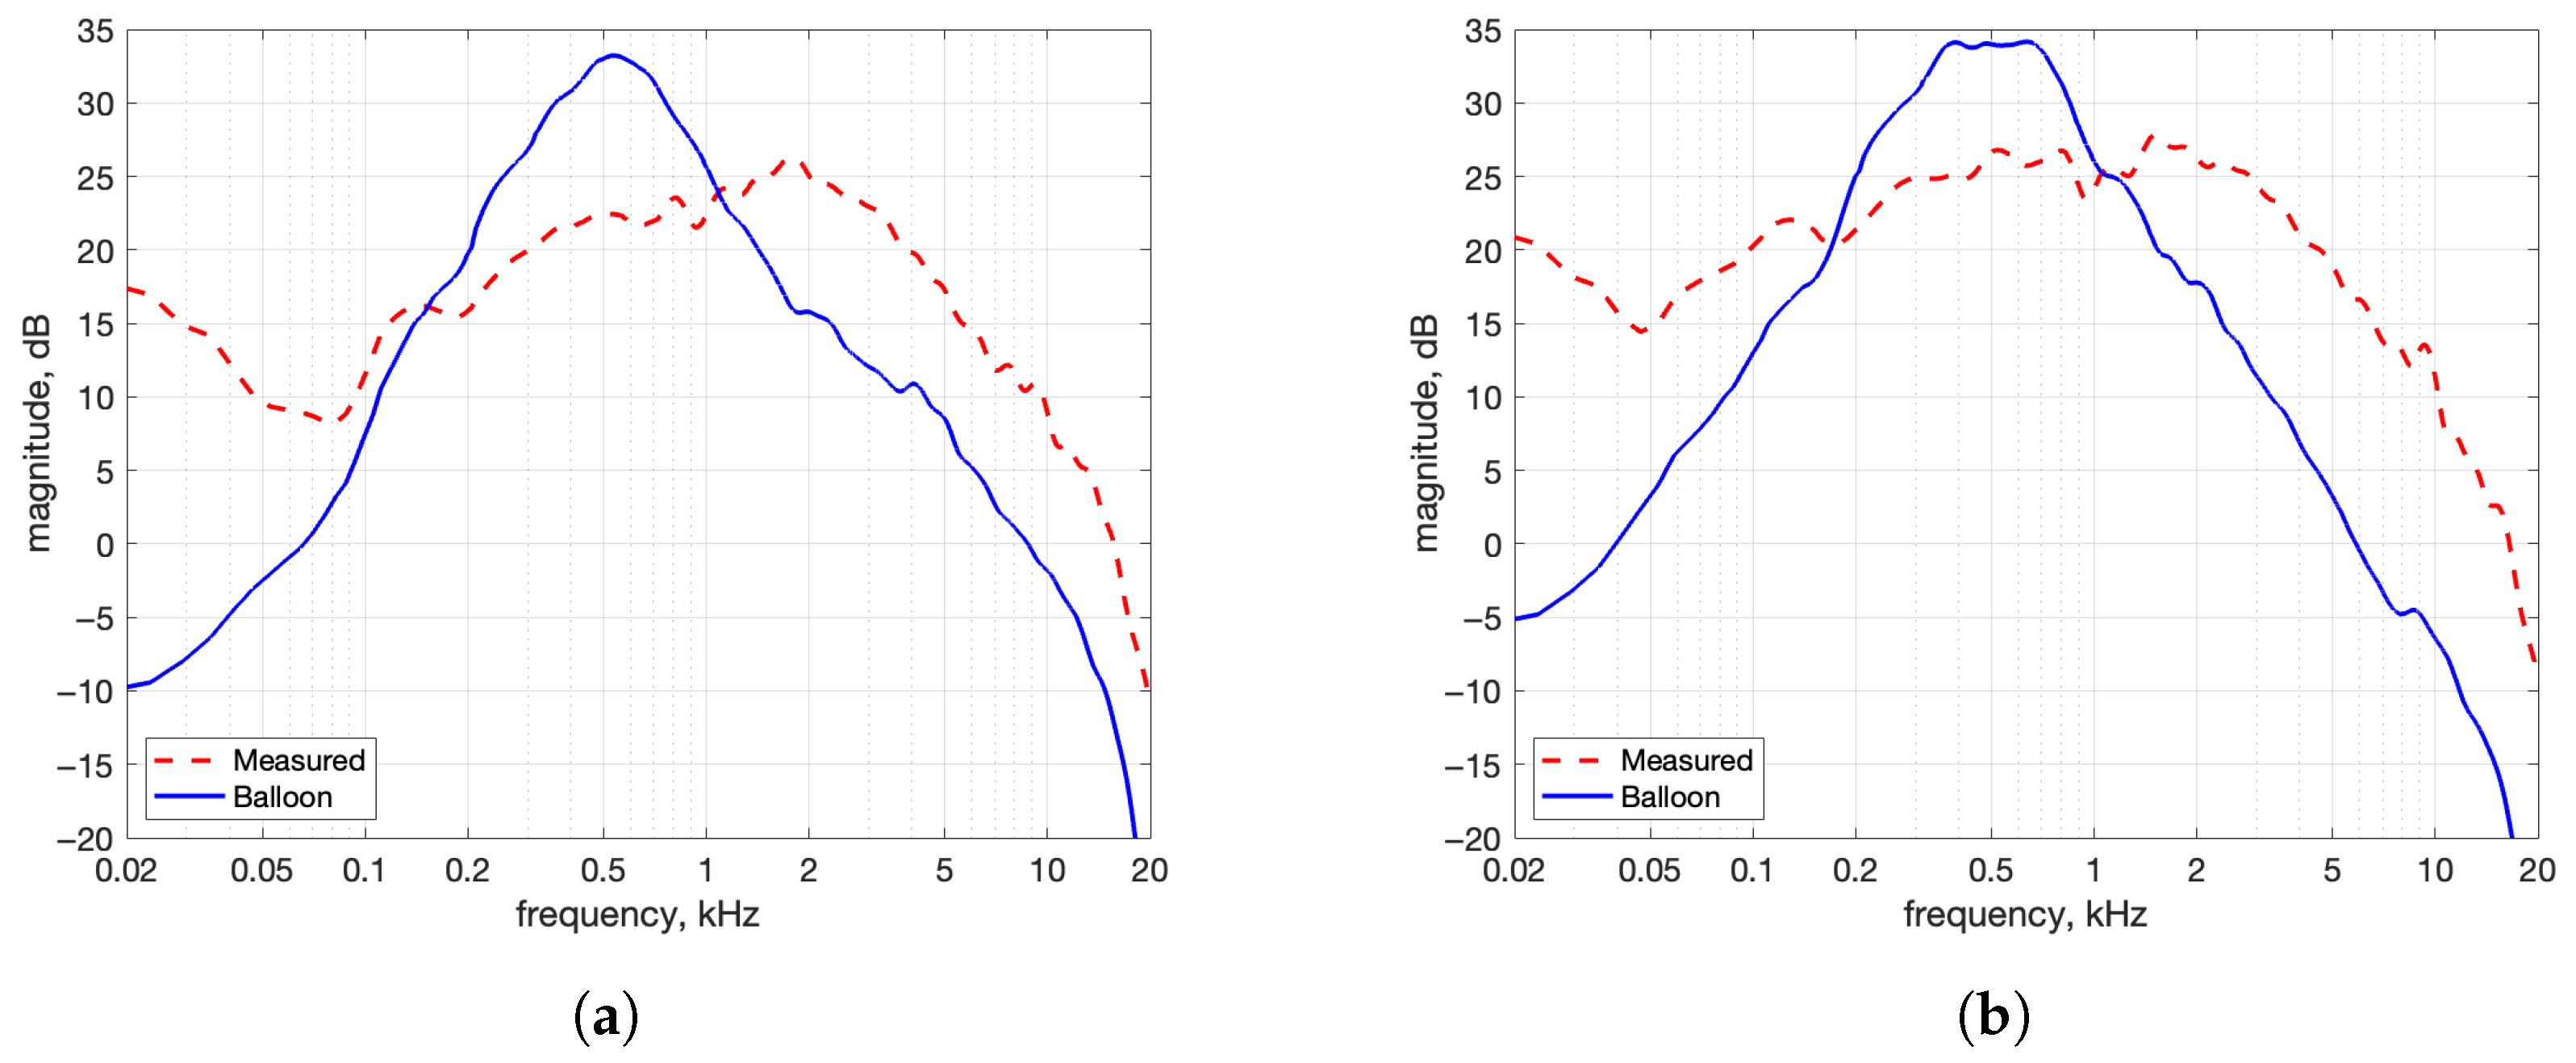
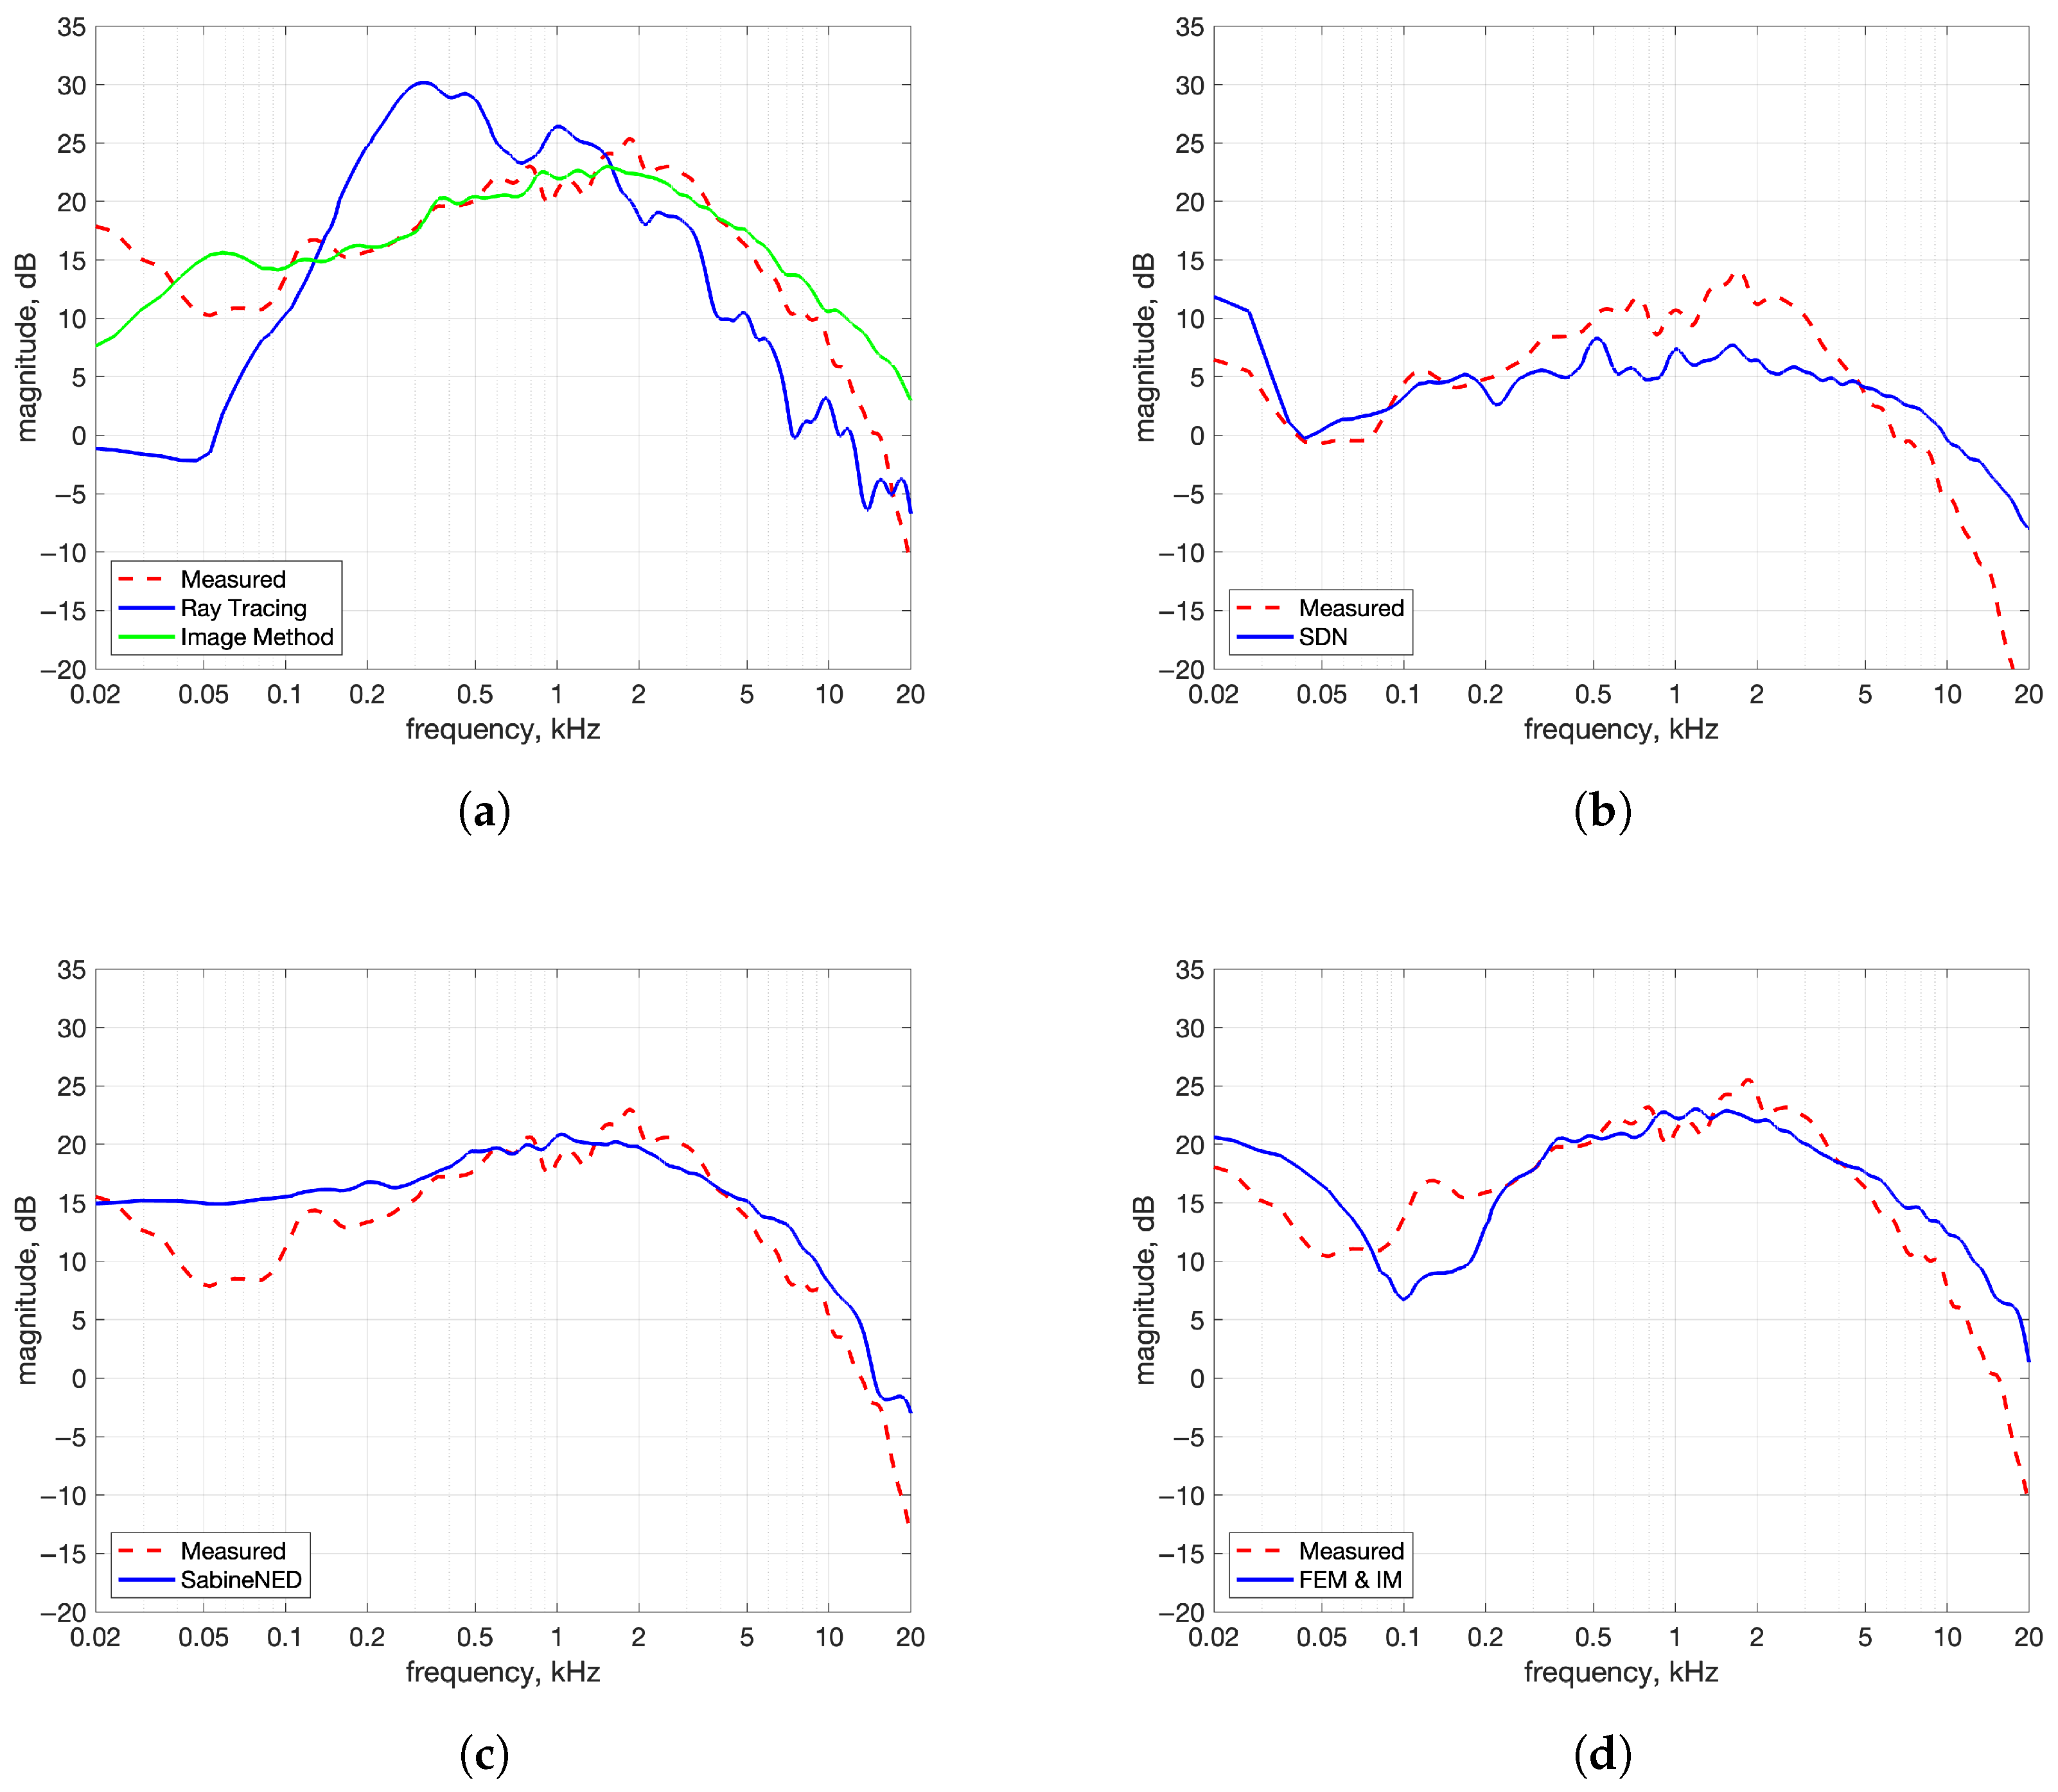
- Power Spectra: To examine whether the synthesized IRs reproduced the spectral shape of the measured IRs, their power spectra were compared. The spectra were smoothed using a method based on Equivalent Rectangular Bandwidth (ERB) bands to reduce narrowband fluctuations and emphasize overall spectral balance. Smoothing makes it easier to compare wideband energy content and spectral characteristics. The smoothing method performs critical band smoothing on the magnitude response. Linearly spaced frequency bins are first grouped into Equivalent Rectangular Bandwidth (ERB) bands, and the magnitude spectrum is averaged over each all the bins in each band to obtain a smoothed magnitude spectrum.
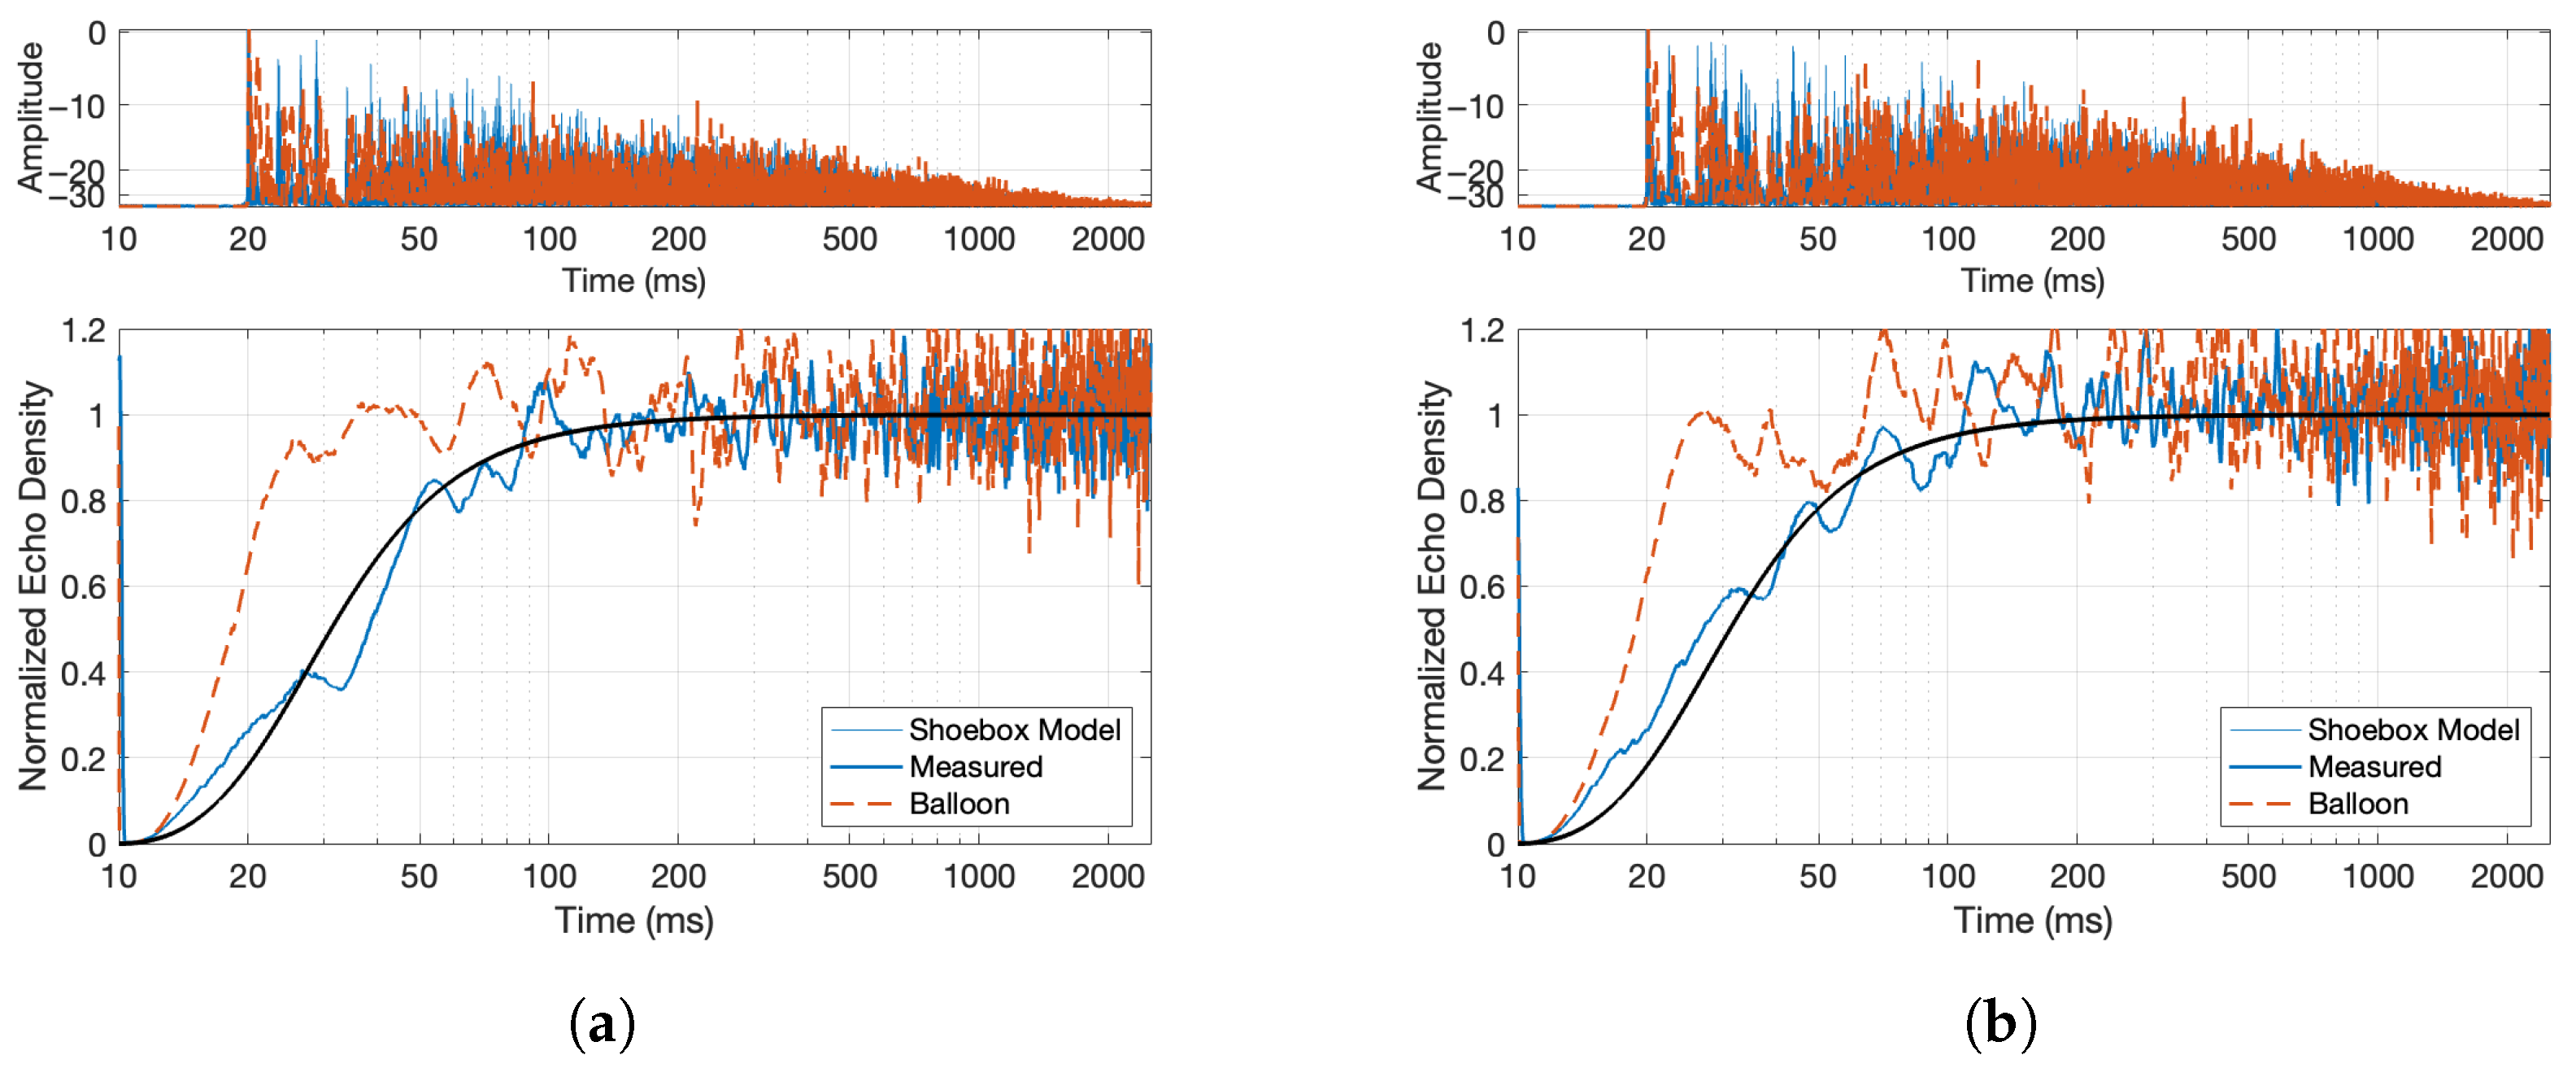
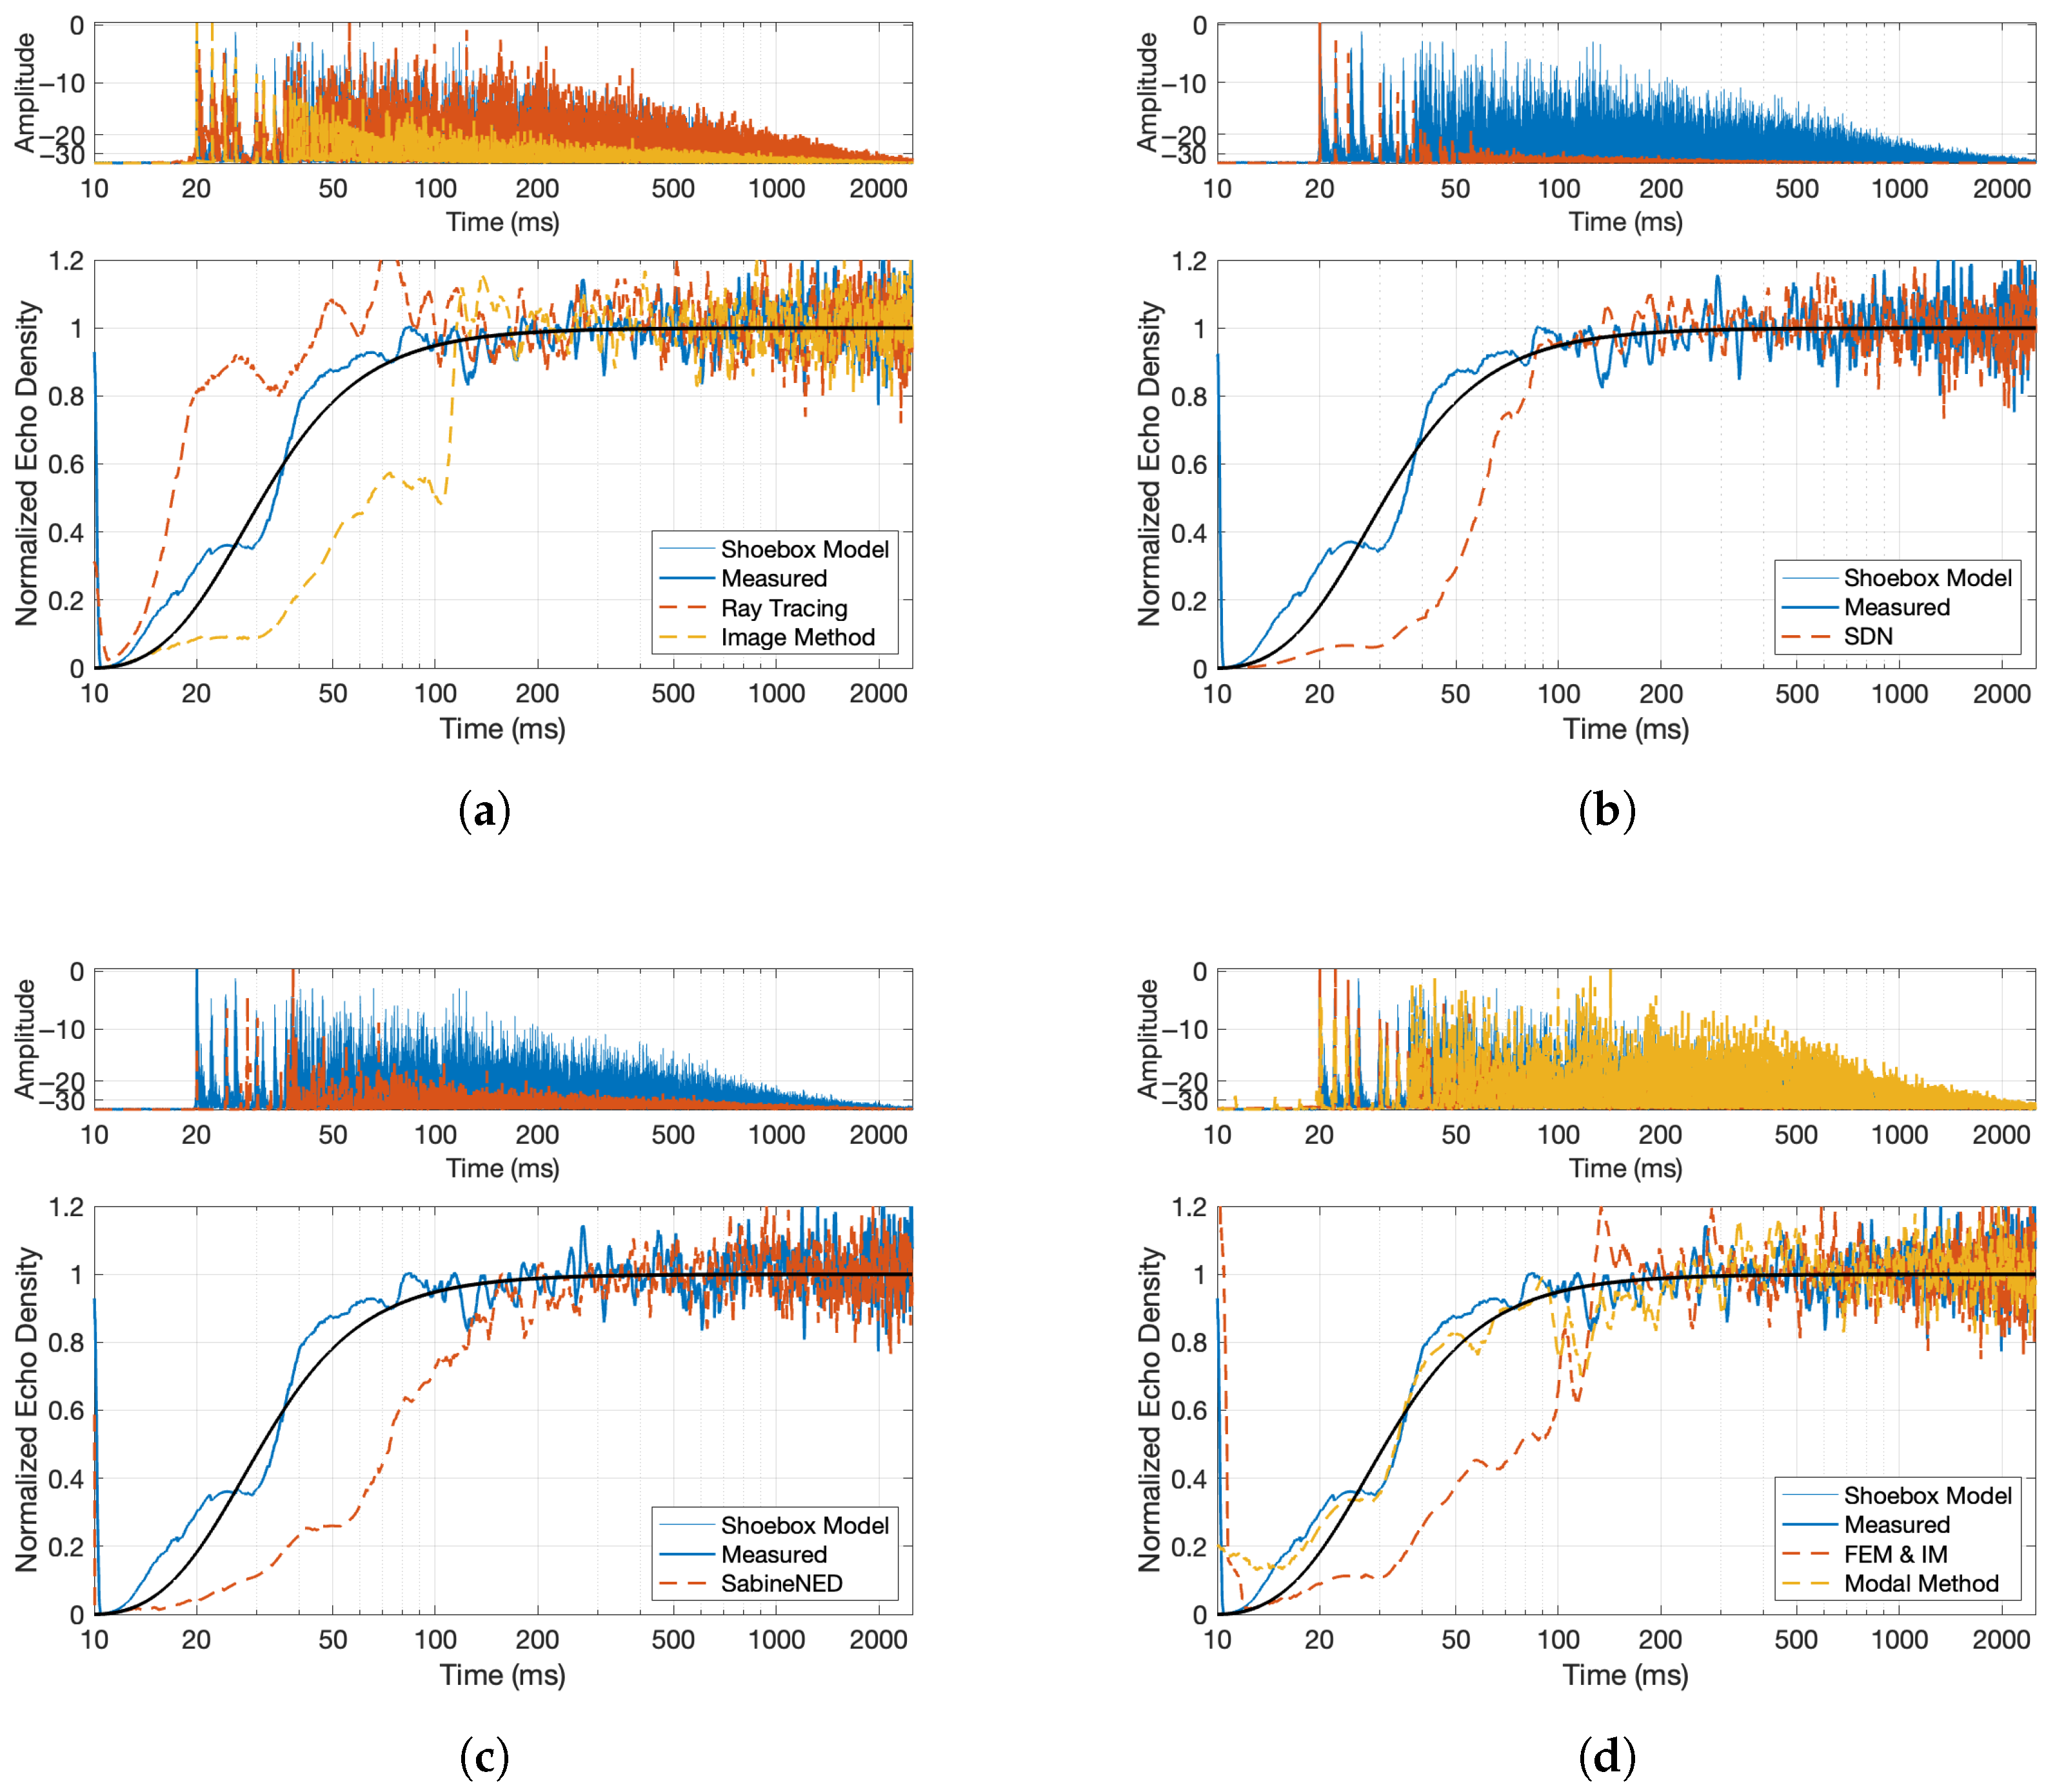
- Echogram and Normalized Echo Density: The normalized echo density (NED) was analyzed to evaluate how reflections accumulate over time. A theoretical model predicts how echo density evolves in a room, starting from a sparse distribution and growing toward a fully dense reverberant field. This model was compared to the measured sweep response using a moving window analysis, revealing how closely the measurement matched theoretical expectations. The theoretical model of a shoebox-shaped room produces a smooth curve that begins at zero (indicating no reflections) and asymptotically approaches one (a fully diffuse echo field). This behavior is governed by the room’s volume and the temporal resolution of the analysis.Here, t represents time in seconds; is a scaling constant that controls how quickly the echo density increases; c is the speed of sound in air (343 m/s); V is the volume of the room (computed from its dimensions); and is the temporal smoothing or resolution parameter in seconds.The function captures the progression from early sparse reflections to a statistically dense reverberant field. As shown in Figure 4c, the echo density derived from the measured sweep response aligns closely with the modeled curve, supporting the accuracy and reliability of the sweep-based measurement. The normalized echo density profile of the initial four-channel sine sweep IR shows the number and distribution of reflection arrivals at the receiver using a 20 ms sliding time window. The following equation is used to compute the NED of an RIR over a moving window of time, whereHere, represents the discrete-time impulse response, and W is the analysis window length in samples. The term denotes the energy computed over a running window starting at sample index k. The threshold is used in the count-based method to identify significant reflections, and is the maximum number of samples exceeding the threshold in any window; it is used to normalize the count of echoes. The computed decay times shown in Figure 4d will be used in the comparative study as a baseline.
4.2. Psychoacoustic Evaluation
4.2.1. Listening Test Methods
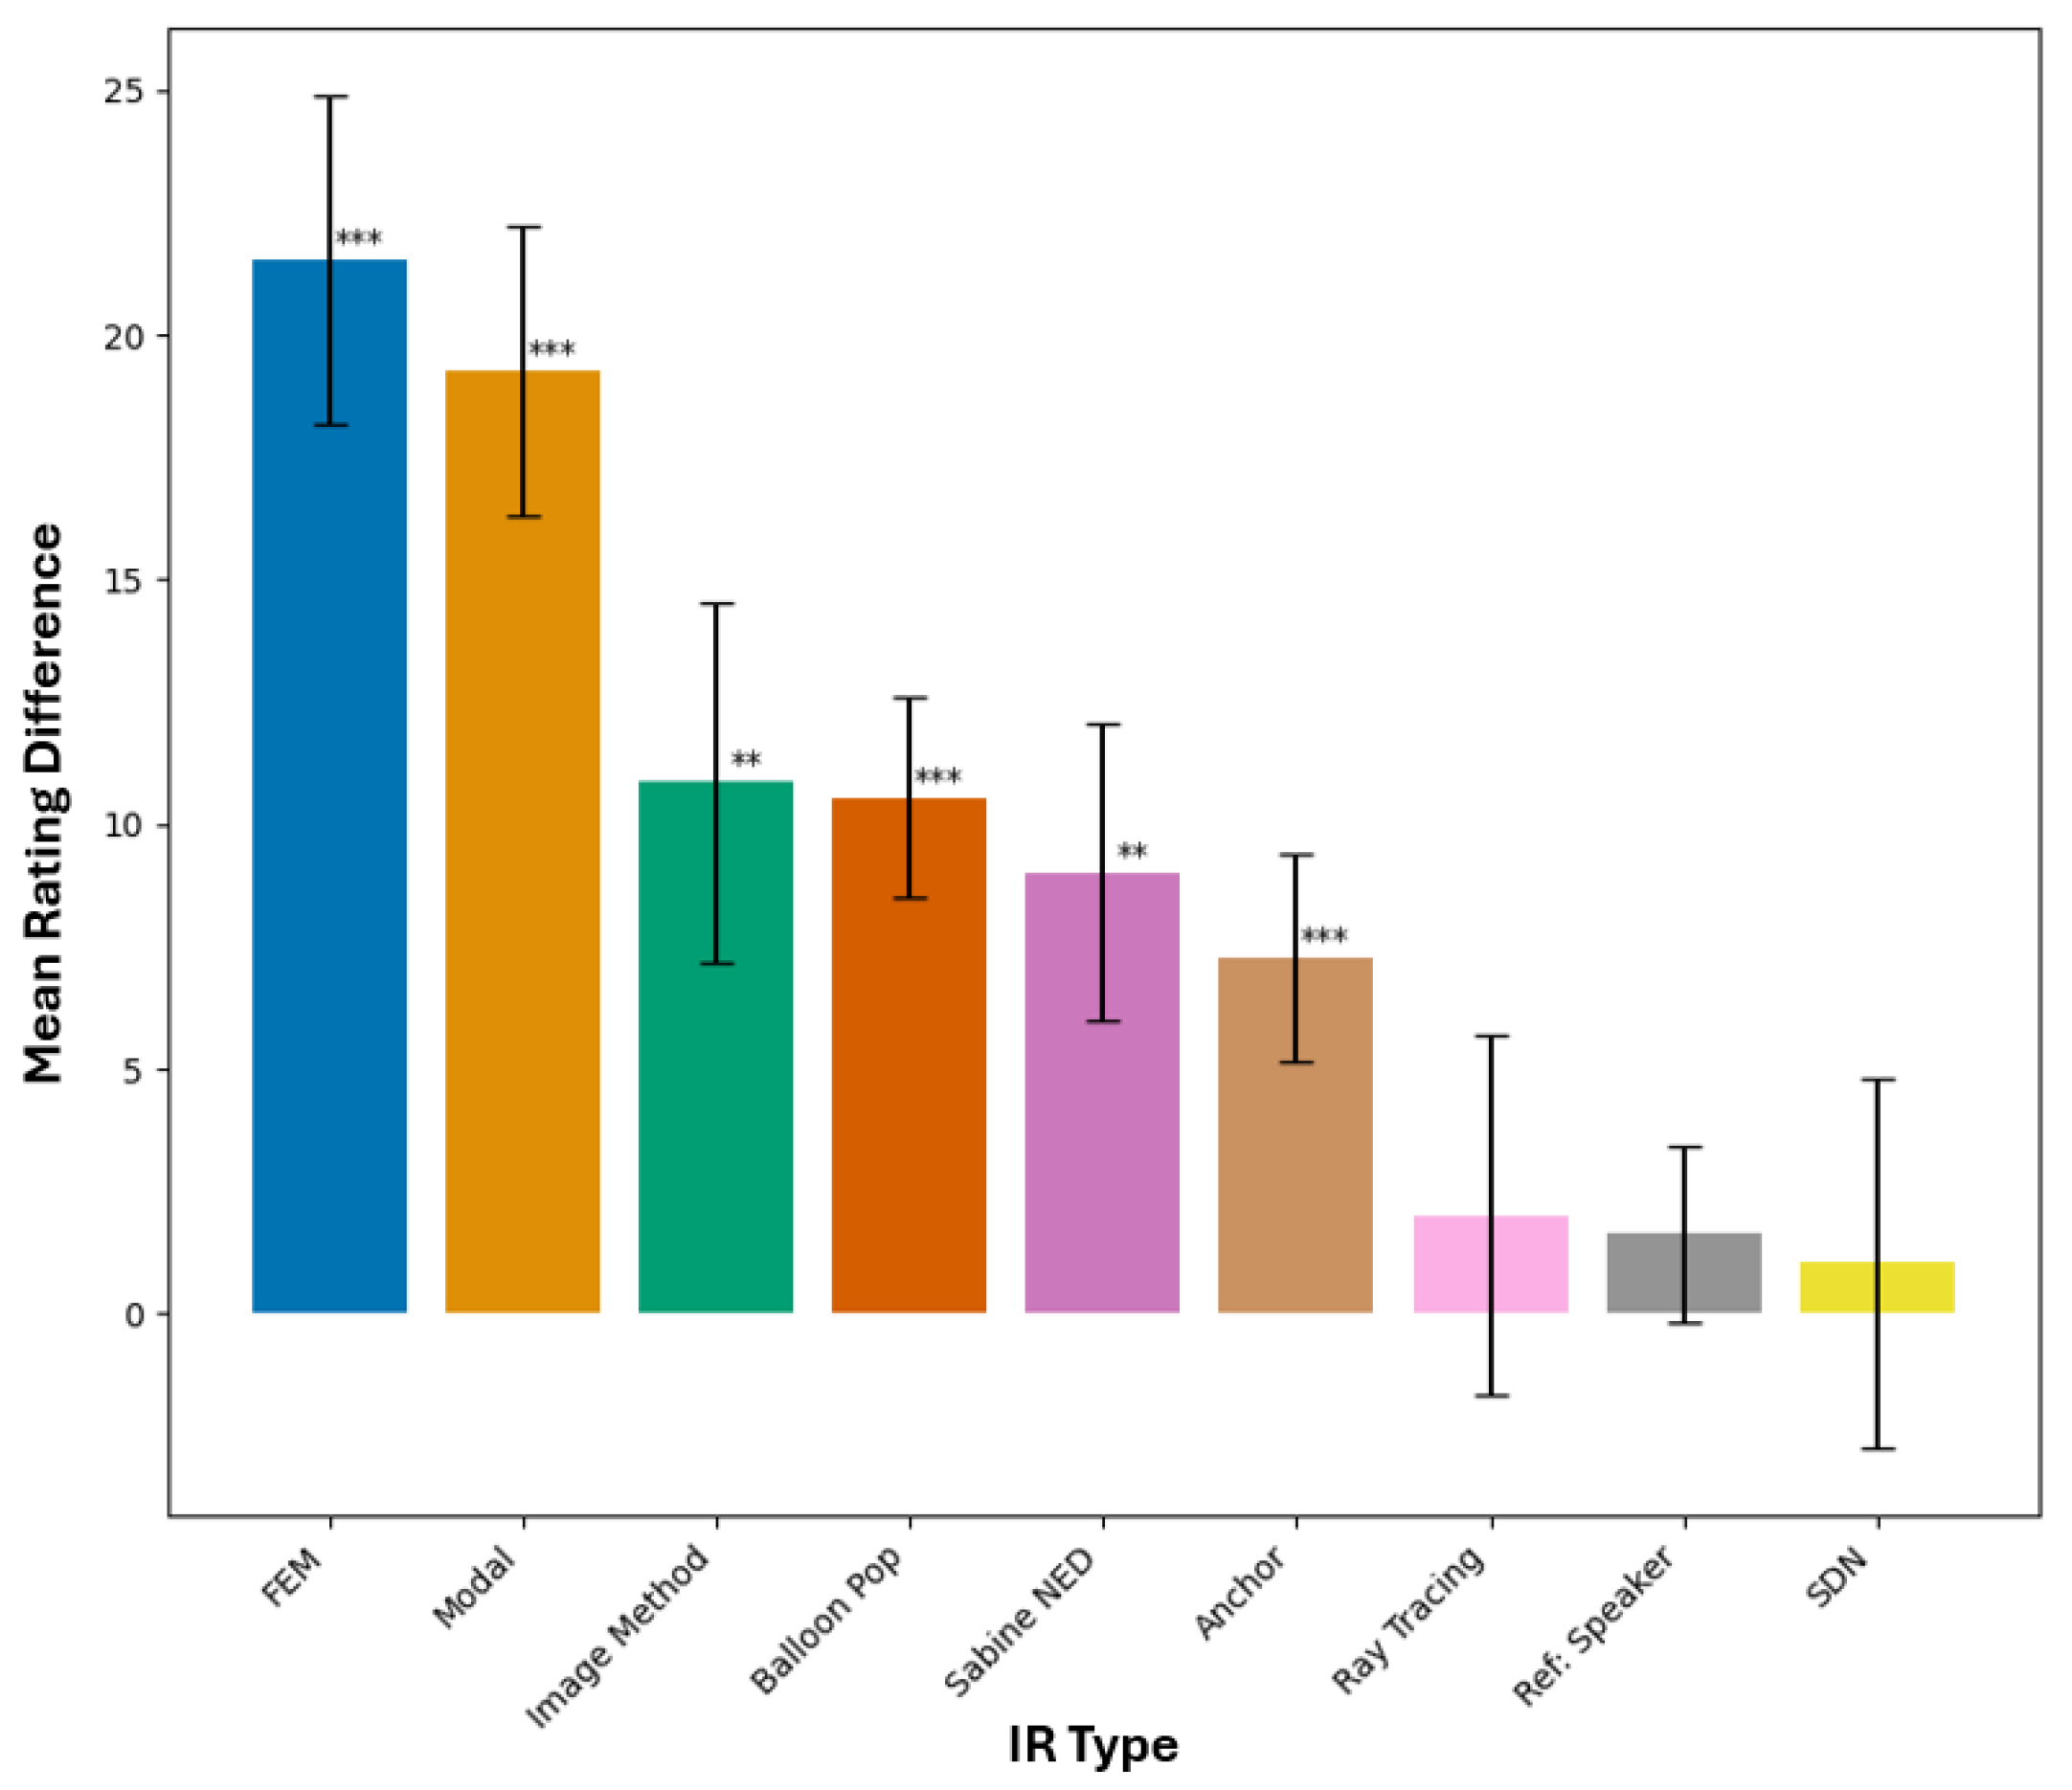
4.2.2. Listening Test Results
5. Discussion
5.1. Sine Sweep vs. Balloon Pop
5.2. Comparison Between Methods
5.2.1. Best Performing—Image Method and Sabine-NED Method
- Mismatch in the low-frequency power spectrum of IM up to 100 Hz compared to reference, as seen in Figure 10a.
- Misalignment of early reflections in the Sabine-NED method compared to the reference, as seen in Figure 11c, as it is agnostic to the source–receiver location. It is likely that a spatialized stimulus would have exposed the mismatch in time of arrivals in the Sabine-NED method.
- Slower rise in NED of both methods compared to the reference, as seen in Figure 12a,c.
5.2.2. Worst Performing—Modal Method and Ray Tracing
5.2.3. Other Methods—SDN and FEM-Hybrid
5.3. Stimulus Type: Speech vs. Drums
6. Conclusions
Author Contributions
Funding
Institutional Review Board Statement
Informed Consent Statement
Data Availability Statement
Acknowledgments
Conflicts of Interest
References
- Savioja, L.; Huopaniemi, J.; Lokki, T.; Väänänen, R. Creating interactive virtual acoustic environments. J. Audio Eng. Soc. 1999, 47, 675–705. [Google Scholar]
- Vorländer, M. Virtual acoustics. Arch. Acoust. 2014, 39, 307–318. [Google Scholar] [CrossRef]
- Neidhardt, A.; Schneiderwind, C.; Klein, F. Perceptual matching of room acoustics for auditory augmented reality in small rooms-literature review and theoretical framework. Trends Hear. 2022, 26, 23312165221092919. [Google Scholar] [CrossRef]
- Potter, T.; Cvetković, Z.; De Sena, E. On the Relative Importance of Visual and Spatial Audio Rendering on VR Immersion. Front. Signal Process. 2022, 2, 904866. [Google Scholar] [CrossRef]
- Katz, B.F.G.; Murphy, D.; Farina, A. Exploring cultural heritage through acoustic digital reconstructions. Phys. Today 2020, 73, 32–37. [Google Scholar] [CrossRef]
- Murphy, D.; Shelley, S.; Foteinou, A.; Brereton, J.; Daffern, H. Acoustic Heritage and Audio Creativity: The Creative Application of Sound in the Representation, Understanding and Experience of Past Environments. Internet Archaeol. 2017, 44. [Google Scholar] [CrossRef]
- Kuttruff, H. Room Acoustics; CRC Press: Boca Raton, FL, USA, 2016. [Google Scholar]
- Abel, J.S.; Huang, P. A simple, robust measure of reverberation echo density. In Proceedings of the Audio Engineering Society Convention 121, San Francisco, CA, USA, 5–8 October 2006. [Google Scholar]
- Sabine, W.C. Collected Papers on Acoustics; Harvard University Press: Cambridge, MA, USA, 1922. [Google Scholar]
- Siltanen, S.; Lokki, T.; Kiminki, S.; Savioja, L. The room acoustic rendering equation. J. Acoust. Soc. Am. 2007, 122, 1624–1635. [Google Scholar] [CrossRef] [PubMed]
- Valimaki, V.; Parker, J.D.; Savioja, L.; Smith, J.O.; Abel, J.S. Fifty years of artificial reverberation. IEEE Trans. Audio Speech Lang. Process. 2012, 20, 1421–1448. [Google Scholar] [CrossRef]
- Savioja, L.; Svensson, U.P. Overview of geometrical room acoustic modeling techniques. J. Acoust. Soc. Am. 2015, 138, 708–730. [Google Scholar] [CrossRef] [PubMed]
- Välimäki, V.; Parker, J.; Savioja, L.; Smith, J.O.; Abel, J. More than 50 years of artificial reverberation. In Proceedings of the Audio Engineering Society Conference: 60th International Conference: Dreams (Dereverberation and Reverberation of Audio, Music, and Speech), Leuven, Belgium, 3–5 February 2016; Audio Engineering Society: New York, NY, USA, 2016. [Google Scholar]
- Hamilton, B.; Bilbao, S. FDTD methods for 3-D room acoustics simulation with high-order accuracy in space and time. IEEE/ACM Trans. Audio Speech Lang. Process. 2017, 25, 2112–2124. [Google Scholar] [CrossRef]
- Gumerov, N.A.; Duraiswami, R. Fast multipole accelerated boundary element methods for room acoustics. J. Acoust. Soc. Am. 2021, 150, 1707–1720. [Google Scholar] [CrossRef]
- Prinn, A.G. A review of finite element methods for room acoustics. Acoustics 2023, 5, 367–395. [Google Scholar] [CrossRef]
- Saarelma, J.; Botts, J.; Hamilton, B.; Savioja, L. Audibility of dispersion error in room acoustic finite-difference time-domain simulation as a function of simulation distance. J. Acoust. Soc. Am. 2016, 139, 1822–1832. [Google Scholar] [CrossRef] [PubMed]
- Meissner, M. Prediction of reverberant properties of enclosures via a method employing a modal representation of the room impulse response. Arch. Acoust. 2016, 41, 27–41. [Google Scholar] [CrossRef][Green Version]
- Das, O.; Abel, J.S. Modal Estimation on a Warped Frequency Axis for Linear System Modeling. arXiv 2022, arXiv:2202.11192. [Google Scholar] [CrossRef]
- Abel, J.S.; Coffin, S.; Spratt, K. A modal architecture for artificial reverberation with application to room acoustics modeling. In Proceedings of the Audio Engineering Society Convention, Los Angeles, CA, USA, 9–12 October 2014; Volume 137. [Google Scholar]
- Allen, J.B.; Berkley, D.A. Image method for efficiently simulating small-room acoustics. J. Acoust. Soc. Am. 1979, 65, 943–950. [Google Scholar] [CrossRef]
- Borish, J. Extension of the image model to arbitrary polyhedra. J. Acoust. Soc. Am. 1984, 75, 1827–1836. [Google Scholar] [CrossRef]
- McGovern, S.G. Fast image method for impulse response calculations of box-shaped rooms. Appl. Acoust. 2009, 70, 182–189. [Google Scholar] [CrossRef]
- Krokstad, A.; Strom, S.; Sørsdal, S. Calculating the acoustical room response by the use of a ray tracing technique. J. Sound Vib. 1968, 8, 118–125. [Google Scholar] [CrossRef]
- Pompei, A.; Sumbatyan, M.; Todorov, N. Computer models in room acoustics: The ray tracing method and the auralization algorithms. Acoust. Phys. 2009, 55, 821–831. [Google Scholar] [CrossRef]
- Christensen, C.L.; Rindel, J.H. A New Scattering Method That Combines Roughness and Diffraction Effects. Acta Acust. United Acust. 2005, 91, 35–48. [Google Scholar] [CrossRef]
- ODEON A/S. ODEON Room Acoustics Software, User Manual; ODEON A/S: Lyngby, Denmark, 2023. [Google Scholar]
- Brinkmann, F.; Aspöck, L.; Ackermann, D.; Lepa, S.; Vorländer, M.; Weinzierl, S. A Round Robin on Room Acoustical Simulation and Auralization. J. Acoust. Soc. Am. 2019, 145, 2746–2760. [Google Scholar] [CrossRef] [PubMed]
- Southern, A.; Siltanen, S.; Murphy, D.T.; Savioja, L. Room Impulse Response Synthesis and Validation Using a Hybrid Acoustic Model. IEEE Trans. Audio Speech Lang. Process. 2013, 21, 1940–1952. [Google Scholar] [CrossRef]
- Rindel, J.H. The use of computer modeling in room acoustics. J. Vibroengineering 2000, 3, 219–224. [Google Scholar]
- Pjeturson, O.H.; Pind, F.; Jeong, C.H. New Opportunities in Room Acoustics Simulations Using Wave Based Technology. In Proceedings of the Baltic-Nordic Acoustic Meeting, Hanasaari, Finland, 22–24 May 2024. [Google Scholar]
- Jot, J.M.; Chaigne, A. Digital delay networks for designing artificial reverberators. Proc. Audio Eng. Soc. 1991, 1–12. [Google Scholar]
- Välimäki, V.; Holm-Rasmussen, B.; Alary, B.; Lehtonen, H.M. Late reverberation synthesis using filtered velvet noise. Appl. Sci. 2017, 7, 483. [Google Scholar] [CrossRef]
- Smith, J.O. A new approach to digital reverberation using closed waveguide networks. In Proceedings of the International Computer Music Conference, Vancouver, BC, Canada, 19–22 August 1985; pp. 47–53. [Google Scholar]
- De Sena, E.; Hacıhabiboğlu, H.; Cvetković, Z.; Smith, J.O. Efficient synthesis of room acoustics via scattering delay networks. IEEE/ACM Trans. Audio Speech Lang. Process. 2015, 23, 1478–1492. [Google Scholar] [CrossRef]
- Scerbo, M.; Das, O.; Friend, P.; De Sena, E. Higher-order Scattering Delay Networks for Artificial Reverberation. In Proceedings of the International Conference on Digital Audio Effects (DAFx), Vienna, Austria, 6–10 September 2022. [Google Scholar]
- Vinceslas, L.; Scerbo, M.; Hacıhabiboğlu, H.; Cvetković, Z.; De Sena, E. Low-Complexity Higher Order Scattering Delay Networks. In Proceedings of the 2023 IEEE Workshop on Applications of Signal Processing to Audio and Acoustics (WASPAA), New Paltz, NY, USA, 22–25 October 2023; pp. 1–5. [Google Scholar]
- Djordjevic, S.; Hacihabiboglu, H.; Cvetkovic, Z.; De Sena, E. Evaluation of the perceived naturalness of artificial reverberation algorithms. In Proceedings of the Audio Engineering Society Convention 148. Audio Engineering Society, Online, 2–5 June 2020. [Google Scholar]
- Mi, H.; Kearney, G.; Daffern, H. Perceptual Similarities between Artificial Reverberation Algorithms and Real Reverberation. Appl. Sci. 2023, 13, 840. [Google Scholar] [CrossRef]
- Kj, C.; Volk, C.P.; Jeong, C.H. Perceptual Evaluation of Room Acoustic Simulations and Measurements. In Proceedings of the Baltic-Nordic Acoustic Meeting, Hanasaari, Finland, 22–24 May 2024. [Google Scholar]
- Schoeffler, M.; Bartoschek, S.; Stöter, F.R.; Roess, M.; Westphal, S.; Edler, B.; Herre, J. webMUSHRA—A Comprehensive Framework for Web-based Listening Tests. J. Open Res. Softw. 2018, 6, 8. [Google Scholar] [CrossRef]
- International Organization for Standardization. ISO 9613-1:1993—Acoustics—Attenuation of Sound During Propagation Outdoors—Part 1: Calculation of the Absorption of Sound by the Atmosphere. 1993. Available online: https://www.iso.org/standard/20649.html (accessed on 13 May 2025).
- Härmä, A.; Karjalainen, M.; Savioja, L.; Välimäki, V.; Laine, U.K.; Huopaniemi, J. Frequency-warped signal processing for audio applications. J. Audio Eng. Soc. 2000, 48, 1011–1031. [Google Scholar]
- De Sena, E.; Antonello, N.; Moonen, M.; Van Waterschoot, T. On the modeling of rectangular geometries in room acoustic simulations. IEEE/ACM Trans. Audio Speech Lang. Process. 2015, 23, 774–786. [Google Scholar] [CrossRef]
- Lam, Y.W. Issues for computer modelling of room acoustics in non-concert hall settings. Acoust. Sci. Technol. 2005, 26, 145–155. [Google Scholar] [CrossRef]
- Das, O.; De Sena, E. The Complex Image Method for Simulating Wave Scattering in Room Acoustics. In Proceedings of the 2023 Immersive and 3D Audio: From Architecture to Automotive (I3DA), Bologna, Italy, 5–7 September 2023; pp. 1–7. [Google Scholar]
- Kristensen, S.D.; Rasmussen, B. Repeatability and Reproducibility of Sound Insulation Measurements. Danmarks Tekniske Universitet. Report No. 118. 1984. Available online: https://vbn.aau.dk/ws/portalfiles/portal/75719936/RoundRobin_SoundInsulationWindows_Repeatability_Reproducibility_LI_TR_118_1984SDK_BiR_.pdf (accessed on 18 August 2025).
- Harris, D.A. Noise control manual. Van Nostrand Reinhold 1991, 3, 45–53. [Google Scholar]
- Smits, J.; Kosten, C. Sound absorption by slit resonators. Acta Acust. United Acust. 1951, 1, 114–122. [Google Scholar]
- Das, O.; Calamia, P.; Gari, S.V.A. Room impulse response interpolation from a sparse set of measurements using a modal architecture. In Proceedings of the ICASSP 2021-2021 IEEE International Conference on Acoustics, Speech and Signal Processing (ICASSP), Toronto, ON, Canada, 6–11 June 2021; pp. 960–964. [Google Scholar]
- Mitchell, A. An introduction to the mathematics of the finite element method. In Proceedings of the The Mathematics of Finite Elements and Applications: Proceedings of the Brunel University Conference of the Institute of Mathematics and Its Applications Held in April 1972; Academic Press: Oxford, UK, 1972; p. 37. [Google Scholar]
- Hecht, F. New development in FreeFem++. J. Numer. Math. 2012, 20, 251–266. [Google Scholar] [CrossRef]
- Tronchin, L. Variability of room acoustic parameters with thermo-hygrometric conditions. Appl. Acoust. 2021, 177, 107933. [Google Scholar] [CrossRef]
- Bradley, J. The sound absorption of occupied auditorium seating. J. Acoust. Soc. Am. 1996, 99, 990–995. [Google Scholar] [CrossRef]
- Angelo, F. Simultaneous Measurement of Impulse Response and Distortion with a Swept-Sine Technique. Paper No. 5093. 2000. Available online: https://aes2.org/publications/elibrary-page/?id=10211 (accessed on 18 August 2025).
- Series, B. Method for the Subjective Assessment of Intermediate Quality Level of Audio Systems. 2014. Available online: https://www.itu.int/rec/R-REC-BS.1534-3-201510-I/en (accessed on 18 August 2025).
- Steinmetz, C.J.; Reiss, J.D. pyloudnorm: A simple yet flexible loudness meter in Python. In Proceedings of the 150th AES Convention, Online, 25–28 May 2021. [Google Scholar]

| Material Type | 63 Hz | 125 Hz | 250 Hz | 500 Hz | 1000 Hz | 2000 Hz | 4000 Hz |
|---|---|---|---|---|---|---|---|
| Wooden Floor on Joist | 0.15 | 0.15 | 0.11 | 0.10 | 0.07 | 0.06 | 0.07 |
| Wall Material (Hard Wooden Board) | 0.06 | 0.06 | 010 | 0.08 | 0.09 | 0.07 | 0.04 |
| Large Panels of Heavy Glass | 0.18 | 0.18 | 0.06 | 0.04 | 0.03 | 0.02 | 0.02 |
| Ventilation Grille | 0.60 | 0.60 | 0.60 | 0.60 | 0.60 | 0.60 | 0.60 |
| Glass Window | 0.35 | 0.35 | 0.25 | 0.18 | 0.12 | 0.07 | 0.04 |
| Parameter | Value/Description |
|---|---|
| ODEON Version | 17 |
| Source Position (x, y, z) | Similar to the ground truth |
| Source Type | Omnidirectional |
| Receiver Position(s) | Similar to the ground truth |
| Receiver Type | Binaural |
| Speaker Directivity Pattern | Omni |
| Impulse Response Length | 7600 ms |
| Number of Late Rays | 16,000 |
| Calculation Mode | Precision Mode (Odeon-suggested values) |
| Early Reflection Transition Order | 2 |
| Maximum Reflection Order | 10,000 |
| Impulse Resolution | 1 ms |
| Number of Early Scatter Rays per Image Source | 100 |
| Calculation Method | Angular absorption only for soft materials |
| Screen Diffraction | Enabled |
| Scattering Method | Explicit scattering coefficients assigned to each material or surface |
| Reflection-Based Scatter | Enabled |
| Key Diffraction Frequency | 707 Hz |
| Methods | C80 (dB) | D50 (%) | Center of Mass (ms) |
|---|---|---|---|
| FEM Hybrid | −3.05 | 23.74 | 298.55 |
| Sabine-NED | −3.84 | 20.07 | 322.94 |
| Modal | −9.27 | 5.71 | 446.43 |
| Ray Tracing Hybrid | −5.88 | 11.90 | 364.54 |
| Image Method | −3.36 | 22.35 | 312.95 |
| SDN | 2.59 | 56.09 | 82.06 |
| Balloon Pop Measurement | −6.47 | 11.24 | 371.35 |
| Sine Sweep Measurement | −4.03 | 18.60 | 283.23 |
| Variable | F-Statistic | p-Value |
|---|---|---|
| Stimuli | 30.1388 | |
| Position | 1.1860 | 0.3057 |
| IR Method | 367.4879 |
| Method Type | Method Name | Computational Requirements | Accuracy |
|---|---|---|---|
| Geometrical acoustics | Ray tracing | Medium | High |
| Image source model | Low | High | |
| Wave-based | FEM | Highest | Highest |
| Modal | High | High | |
| Statistical | Sabine-NED | Low | Medium |
| Delay network | Scattering delay network | Lowest | Medium |
| Method Type | Method Name | Scalability with Geometric Complexity | Availability |
|---|---|---|---|
| Geometrical acoustics | Ray tracing | Highly scalable | Paid—ODEON |
| Geometrical acoustics | Image source model | Moderately scalable (needs computation of visibility tree) | Free—Pyroomacoustics (https://pyroomacoustics.readthedocs.io/en/pypi-release/pyroomacoustics.room.html, accessed on 17 November 2024) (shoebox), Free—https://github.com/audiolabs/DEISM, accessed on 18 August 2025 DEISM (arbitrary geometry) |
| Wave-based | FEM | Highly scalable | Free—FreeFEM++ (https://freefem.org/, accessed on 17 November 2024) requires GPU for fastest computation. |
| Wave-based | Modal | Not scalable | Easy to implement. |
| Statistical | Sabine-NED | Not scalable | Easy to implement. |
| Delay network | Scattering delay network | Currently not scalable | Free—RealTime-SDN plugin (https://github.com/LIMUNIMI/Real-time-SDN, accessed on 23 August 2024) |
Disclaimer/Publisher’s Note: The statements, opinions and data contained in all publications are solely those of the individual author(s) and contributor(s) and not of MDPI and/or the editor(s). MDPI and/or the editor(s) disclaim responsibility for any injury to people or property resulting from any ideas, methods, instructions or products referred to in the content. |
© 2025 by the authors. Licensee MDPI, Basel, Switzerland. This article is an open access article distributed under the terms and conditions of the Creative Commons Attribution (CC BY) license (https://creativecommons.org/licenses/by/4.0/).
Share and Cite
May, L.; Farzaneh, N.; Das, O.; Abel, J.S. Comparison of Impulse Response Generation Methods for a Simple Shoebox-Shaped Room. Acoustics 2025, 7, 56. https://doi.org/10.3390/acoustics7030056
May L, Farzaneh N, Das O, Abel JS. Comparison of Impulse Response Generation Methods for a Simple Shoebox-Shaped Room. Acoustics. 2025; 7(3):56. https://doi.org/10.3390/acoustics7030056
Chicago/Turabian StyleMay, Lloyd, Nima Farzaneh, Orchisama Das, and Jonathan S. Abel. 2025. "Comparison of Impulse Response Generation Methods for a Simple Shoebox-Shaped Room" Acoustics 7, no. 3: 56. https://doi.org/10.3390/acoustics7030056
APA StyleMay, L., Farzaneh, N., Das, O., & Abel, J. S. (2025). Comparison of Impulse Response Generation Methods for a Simple Shoebox-Shaped Room. Acoustics, 7(3), 56. https://doi.org/10.3390/acoustics7030056


