Article

Influence of Infotainment-System Audio Cues on the Sound Quality Perception Onboard Electric Vehicles in the Presence of Air-Conditioning Noise

1
Department of Architecture and Industrial Design, Università degli Studi della Campania “Luigi Vanvitelli”, 81031 Aversa, Italy
2
Faculty of Design, Kyushu University, Fukuoka 815-8540, Japan
3
Graduate School of Design, Kyushu University, Fukuoka 815-8540, Japan
*
Author to whom correspondence should be addressed.
Acoustics 2025, 7(1), 1; https://doi.org/10.3390/acoustics7010001
Submission received: 17 October 2024 / Revised: 15 December 2024 / Accepted: 20 December 2024 / Published: 25 December 2024

Abstract

:
Car cabin noise generated by heating, ventilation, and air-conditioning (HVAC) systems significantly impacts passengers’ acoustic comfort. In fact, with the reduction in engine noise due to the passage from internal combustion to electric or hybrid-electric engines, interior background noise has dramatically reduced, especially at 25% and 50% HVAC airflow rates. While previous research has focused on the effect of HVAC noise in car cabins, this paper investigates the possibility of using car infotainment-system audio cues to moderate onboard sound quality perception. A laboratory experiment combining the factors of infotainment-system audio (ISA) cues, signal-to-noise ratios (SNRs), and airflow rates (AFRs) at different levels was performed in two university laboratories in Italy and Japan involving groups of local individuals. The results indicate that introducing ISA cues in car cabins fosters improvements in the perceived aesthetic dimension of sound quality, making it more functioning, natural, and pleasant. For the Italian group, adding ISA cues also moderated the loudness dimension by reducing noise perception. The moderating effects of ISA cues differed between the Italian and Japanese groups, depending on the AFR. All these effects were more evident at the SNR level of −4 dB when the ISA cues competed with existing background noise.

1. Introduction

The noise inside car cabins is an important factor affecting the perception and comfort of drivers and passengers [1]. Its role in the global appreciation of cars is expected to become even more important due to the increasing popularity of electric vehicles (EVs) and hybrid-electric vehicles (HEVs). According to a recent International Energy Agency report [2], in 2022, the total number of electric cars on the world’s roads reached 26 million, up 60% relative to 2021. The change in power systems, from internal combustion engines to electric motors, has made car interiors quieter, and functioning noises other than powertrain noise have become more noticeable. Among them, heating, ventilation, and air-conditioning (HVAC) systems operate constantly and are thought to have a significant impact on passenger comfort, as the noise level when the HVAC system is off is significantly lower than in internal combustion engine vehicles (ICEVs). Masullo et al. [3] showed that, with electric-driven engines, the interior noise was reduced dramatically, by up to 9 dB. The most significant differences occurred at the lowest (25% and 50%) airflow rates (AFR), where the noise of the internal combustion engine in idle mode masked the air-conditioning noise, and the annoyance (i.e., psychoacoustic annoyance [4] or; subjective annoyance [1]) between the HVAC in the on and off conditions increased considerably in HEVs compared to ICEVs.
The literature is rich in studies that investigated how to reduce HVAC noise levels using more or less conventional methods. Some of them focused their efforts on the re-design of blowers and blades [5,6] or on the zones of flow separations with high turbulent kinetic energy [7]. Bennouna et al. [8] conducted an experimental investigation using two strategies: passive absorbers on the HVAC body and ducts, or HVAC integration into the vehicle. Their findings showed that passive absorbers induce low aeraulic noise reduction, whereas HVAC relocation induces significant noise reduction along both structure radiation and aeraulic paths. Allam and Åbom [9] investigated using splitters made of microperforated plates in cooling-fan inlet/outlet applications, suggesting a locally reacting design. Arenas and Crocker [10] compared old and new sound-absorbing materials in terms of acoustics and other characteristics (i.e., safety, weight, and technological optimization), predicting a rapid expansion in the latter over the next few years. Singh and Mohanty [11] proposed using jute felt and waste cotton as low-cost, lightweight, biodegradable, and recyclable natural materials with high potential for HVAC noise control. Other authors proposed solutions integrating active noise-control systems [12,13].
On the other hand, a limited number of scientific papers investigated the sound quality of vehicles’ HVAC systems. Yoon et al. [14] used a neural network to predict positive sound evaluations. Nakasaki et al. [15] evaluated the subjective impressions of air-conditioning sounds onboard vehicles in terms of loudness and sharpness, deriving two main factors: volume and thermal factors. Wagner et al. [16] associated the participants’ impression of hearing the sound of an air conditioner that cools or heats with sharpness. The less distinct the sharpness parameter is, the more it sounds like an air-conditioning unit heats. In line with the review work of Ma et al. [17] on the perceptual dimensions of sound, where the authors carried out a meta-analysis of semantic differential method applications to indoor and outdoor sounds, recent research investigating the perception of sound in car cabins [18,19,
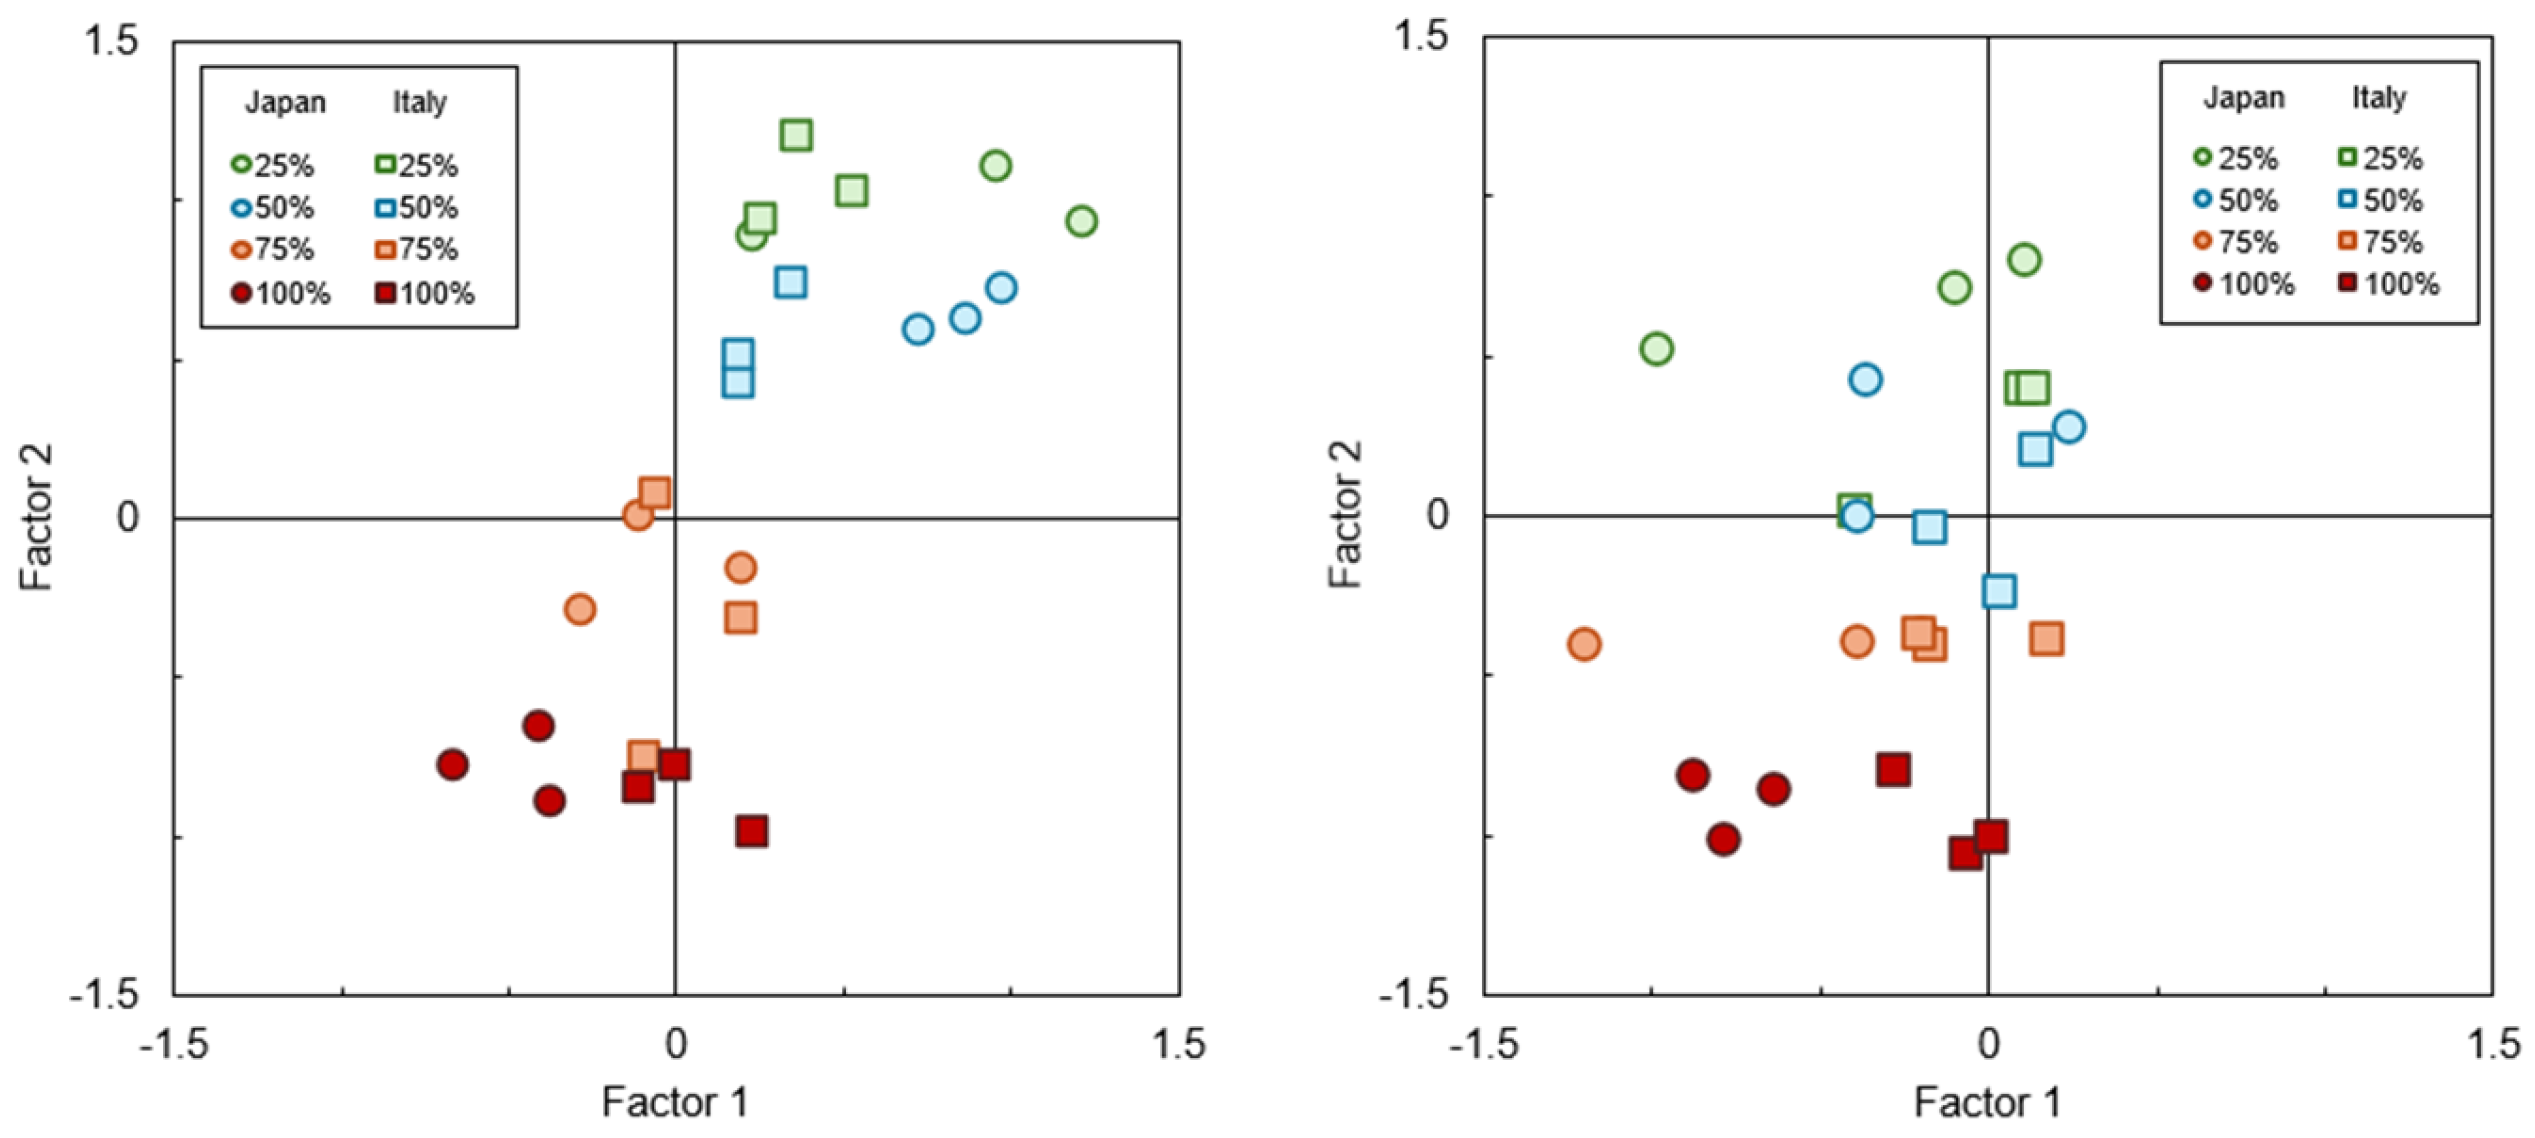
20] has highlighted two perceptual dimensions, the aesthetics (or quality) (Factor 1) and the loudness (or powerfulness) of sound (Factor 2), that well describe the subjective impressions of individuals inside car cabins in the presence of HVAC noise. The results of these studies showed that the distribution of factor scores changed as the airflow rate changed, particularly for HEVs compared to ICEVs. The findings suggested that as the airflow rate decreases, the impression of the quality and quietness of sound increases.
In contrast, as shown in Figure 1 [21], the factor scores for the same airflow rate tend to be distributed close to each other, giving similar subjective impressions. The differences between the two types of engines were mainly observed for low airflow rates (e.g., 25%), where HEVs were rated as being of higher quality, more comfortable, and quieter than ICEVs. Moreover, as the airflow rate increases, the difference becomes smaller, resulting in a negative impression, such as being noisy or unpleasant. The conclusions of all these works [18,19,20,21] suggested that the evaluation of HVAC noise inside vehicles was affected by its balance with the powertrain noise. Masullo, Yamauchi et al. [22] also analyzed the differences in perception of car cabin noise between participants from different cultures, revealing that while Japanese participants varied their quality ratings depending on changes in airflow rate, the Italian group was less sensitive to this variation. For both groups, the results were evident mainly in the case of HEVs.
Whereas previous experiments and analyses were only focused on the combination of HVACs and engine noise, more realistic and complex operative conditions should be considered to understand how the overall sound quality perception in the presence of HVAC noise can be improved.
From a sound-design perspective, Haverkamp [23] states that the car interior should be a calm auditory environment with soft sounds that do not attract much attention but contribute to a lively and comfortable ambience. To this end, vehicle infotainment systems that already perform several audio processing tasks [24] (i.e., voice recognition, equalization, and spatial rendering) could be used for a secondary goal, i.e., making the most of the mechanism of informational masking provided by played-back audio cues. In this view, music and broadcast cues can potentially affect the attention and well-being of individuals [25], fostering top-down rather than bottom-up attentional mechanisms [26].
Different from the energetic masking caused by competition between a masker and masked sound due to overlapping excitation patterns in the peripheral parts of the auditory system [27], informational masking can reduce the capability to segregate a target sound from competing sounds [28,29]. The use of informational masking has been recently extended from speech to other sectors to modulate individuals’ attentional processes. As described by Posner [30], two different attentional orienting mechanisms exist: an endogenous mechanism able to elicit top-down control and an exogenous bottom-up mechanism, which is a primitive response to an external cue. In the working sector, informational masking was proposed to improve performance and satisfaction in open-plan offices [31]. In environmental acoustics, cognitive efforts are minimized by activating voluntary attention (bringing distractions under control through inhibition) and fostering automatic, involuntary attention.
To this end, several authors proposed the use of augmented positive sounds, such as water or bird [32,33,34] sounds, demonstrating both in the laboratory [35] and in situ [36] their effectiveness in terms of the human brain’s responses.
In this paper, we intend to understand whether the perceived sound quality of a car containing HVAC noise is affected by infotainment-system audio (ISA) cues.
To this end, we conducted laboratory experiments in which music and radio broadcasts of musical and verbal audio were used as competitive attentional targets of air-conditioning noise and listened to simultaneously. The research questions (Qs) and related hypotheses (Hs) are listed below:
  • Q1: Can different ISA cues moderate the perceived sound quality in an electric-vehicle car cabin containing HVAC noise?
  • H1: Informational masking provided by ISA cues affects the sound quality in electric-vehicle car cabins when the HVAC system is activated.
  • Q2: How does sound quality perception change using ISA cues at different AFR levels of an HVAC system?
  • H2: When HVAC systems are activated in electric-vehicle car cabins, ISA cues moderate the perceived sound quality differently at different AFR levels.
  • Q3: How does sound quality perception change between Japanese (JPN) and Italian (ITA) groups using ISA cues?
  • H3: When HVAC systems are activated in electric-vehicle car cabins, ISA cues moderate the perceived sound quality differently in the Japanese (JPN) and Italian (ITA) groups.
  • Q4: What is the optimal SNR between ISA cues and HVAC noise to improve the perceived sound quality in an electric-vehicle car cabin?
  • H4: When an HVAC system is activated in an electric-vehicle car cabin, the SNR between ISA cues and HVAC noise moderates sound quality perception.

2. Methodology

A within–between experimental design was prepared to investigate the study hypotheses. The experiments took place in parallel in the laboratories of the Department of Architecture and Industrial Design of the Università degli Studi della Campania “Luigi Vanvitelli” (Sens i-Lab) and of the Department of Acoustic Design of Kyushu University (Yamauchi Lab), involving Italian and Japanese samples of participants. The experiments combined audio stimuli of HVAC noise at several AFR levels and broadcast radio recordings, as well as a famous song sung in Japanese and in the Italian language and a musical version of the song. All the stimuli were presented at different SNRs. Two preliminary experiments were conducted to choose the duration time of the audio stimuli (stimulation length) and the signal-to-noise ratio levels. All auditory stimuli were played back by headphones HD 650 (Sennheiser, Wedemark, Germany). In Sens i-Lab, the playback sound levels of the headphones were calibrated by an HSU III.2 artificial head coupled with a SQobold 4-channel system (Head Acoustics, Herzogenrath, Germany), while in the Yamauchi Lab, the levels were calibrated by an artificial ear Type 4153 (Brüel & Kjær, Darmstadt, Germany) and a sound-level meter Type 2250 (Brüel & Kjær).

2.1. Preliminary Setup n. 1: Determination of Stimulation Length

In a previous experiment on stationary noises combining internal combustion and hybrid-electric-vehicle noise with HVAC noise, the stimulus length was 5 s [3]. However, when conducting experiments on information masking using infotainment-system audio cues, it is necessary to ensure that the listening duration is sufficient to understand the conveyed information [37,38,39] entirely. On the other hand, it is also necessary to ensure that the length of the entire experiment does not place an excessive burden on the participants. We conducted a preliminary test involving two students at a soundproof laboratory in Ohashi Campus, Kyushu University, to determine an appropriate stimuli length in the main experiments.
Stimuli: Air-conditioning noise was recorded inside an electric car in a steady condition while broadcast audio was synthesized and superimposed on the air-conditioning noise as an auditory stimulus for the infotainment system. There were six different stimulus lengths: 5, 10, 15, 20, 25 and 30 s. Considering the intention to perform a main cross-cultural experiment, the audio broadcast (a weather forecast) was prepared in English and then translated into Japanese. Google Text-to-Speech [40] was used to convert the text into speech. The AFR of the HVAC system was set at 25, 75 and 100%, as in previous experiments [3,22]. The SNR of the audio broadcast and HVAC noise was calculated as indicated in Equation (1) and adjusted to between 0 and −9 dB. There were 6 types (length) × 3 types of AFR × 2 types of SNR. In total, 36 different conditions were simulated.
S N R = L e q , b r o a d c a s t L e q , H V A C
Method: All the stimuli were calibrated and presented using the abovementioned headphones. Participants rated the stimuli using 14 different 7-point scales. Of the 36 types of stimuli mentioned in the previous section, 6 stimuli of the same length were played randomly, and this was considered one block. Each block was evaluated twice, and 12 blocks were conducted for each experimental participant.
Results: The time required to evaluate all stimuli within one block was recorded. The time needed per block for one of the two experimental participants showed a tendency that the longer the stimulation, the shorter the time required for the experiment. The other participant also showed a similar tendency, with minimal changes. According to the introspection report, there was an opinion that “If the length is short, the stimulus will have to be played repeatedly, making it more difficult to evaluate”. It is conceivable that the shorter the stimulus, the greater the workload on the experimental participants. Therefore, we decided that the length of the stimuli to be used in the main experiment would be 30 s, allowing participants to understand the linguistic information better and reduce their burden.

2.2. Preliminary Setup n. 2: Determination of Signal-to-Noise Ratio Steps

A further preliminary test was also conducted to determine the signal-to-noise ratios for the main experiment.
Stimuli: Similar to the preliminary experiment n. 1, a synthesized sound of Japanese speech from an audio broadcast was combined with the HVAC noise at four different levels (25%, 50%, 75% and 100%), so that, over cues of 30 s, there were sound equivalent levels differences between the broadcast and HVAC noise (Equation (1)) of 0.0, −3.0, −4.5, −6.0, −9.0 and −12.0 dB. In total, 4 AFR × 6 SNR = 24 combinations of stimuli were prepared.
Method: The experiment was conducted in a soundproof laboratory in Ohashi Campus, Kyushu University, with the participation of 3 students. All the stimuli were calibrated and presented using the abovementioned headphones. While listening to these stimuli, participants were asked to evaluate the loudness of the broadcast using a 7-point Likert scale ranging from “very loud” to “very small” compared to the noise. Each of the three participants was given two ratings for each stimulus.
Results: For each participant and stimulus combination, the average loudness rating of the broadcast audio was obtained. The number of times the rating difference was zero between SNR conditions under the same airflow conditions was counted. The number of times that the loudness of the broadcast sound was judged to be the same as the HVAC noise was highest when the SNR values were between −3.0 and −4.5 dB (n. 6), followed by the conditions in which the SNR values were between −4.5 and −6.0 dB (n. 2) and between −6.0 and −9.0 dB (n. 1). These results suggested that when the SNR was 3.0 dB or less, it became difficult to perceive any difference in the broadcast audio.
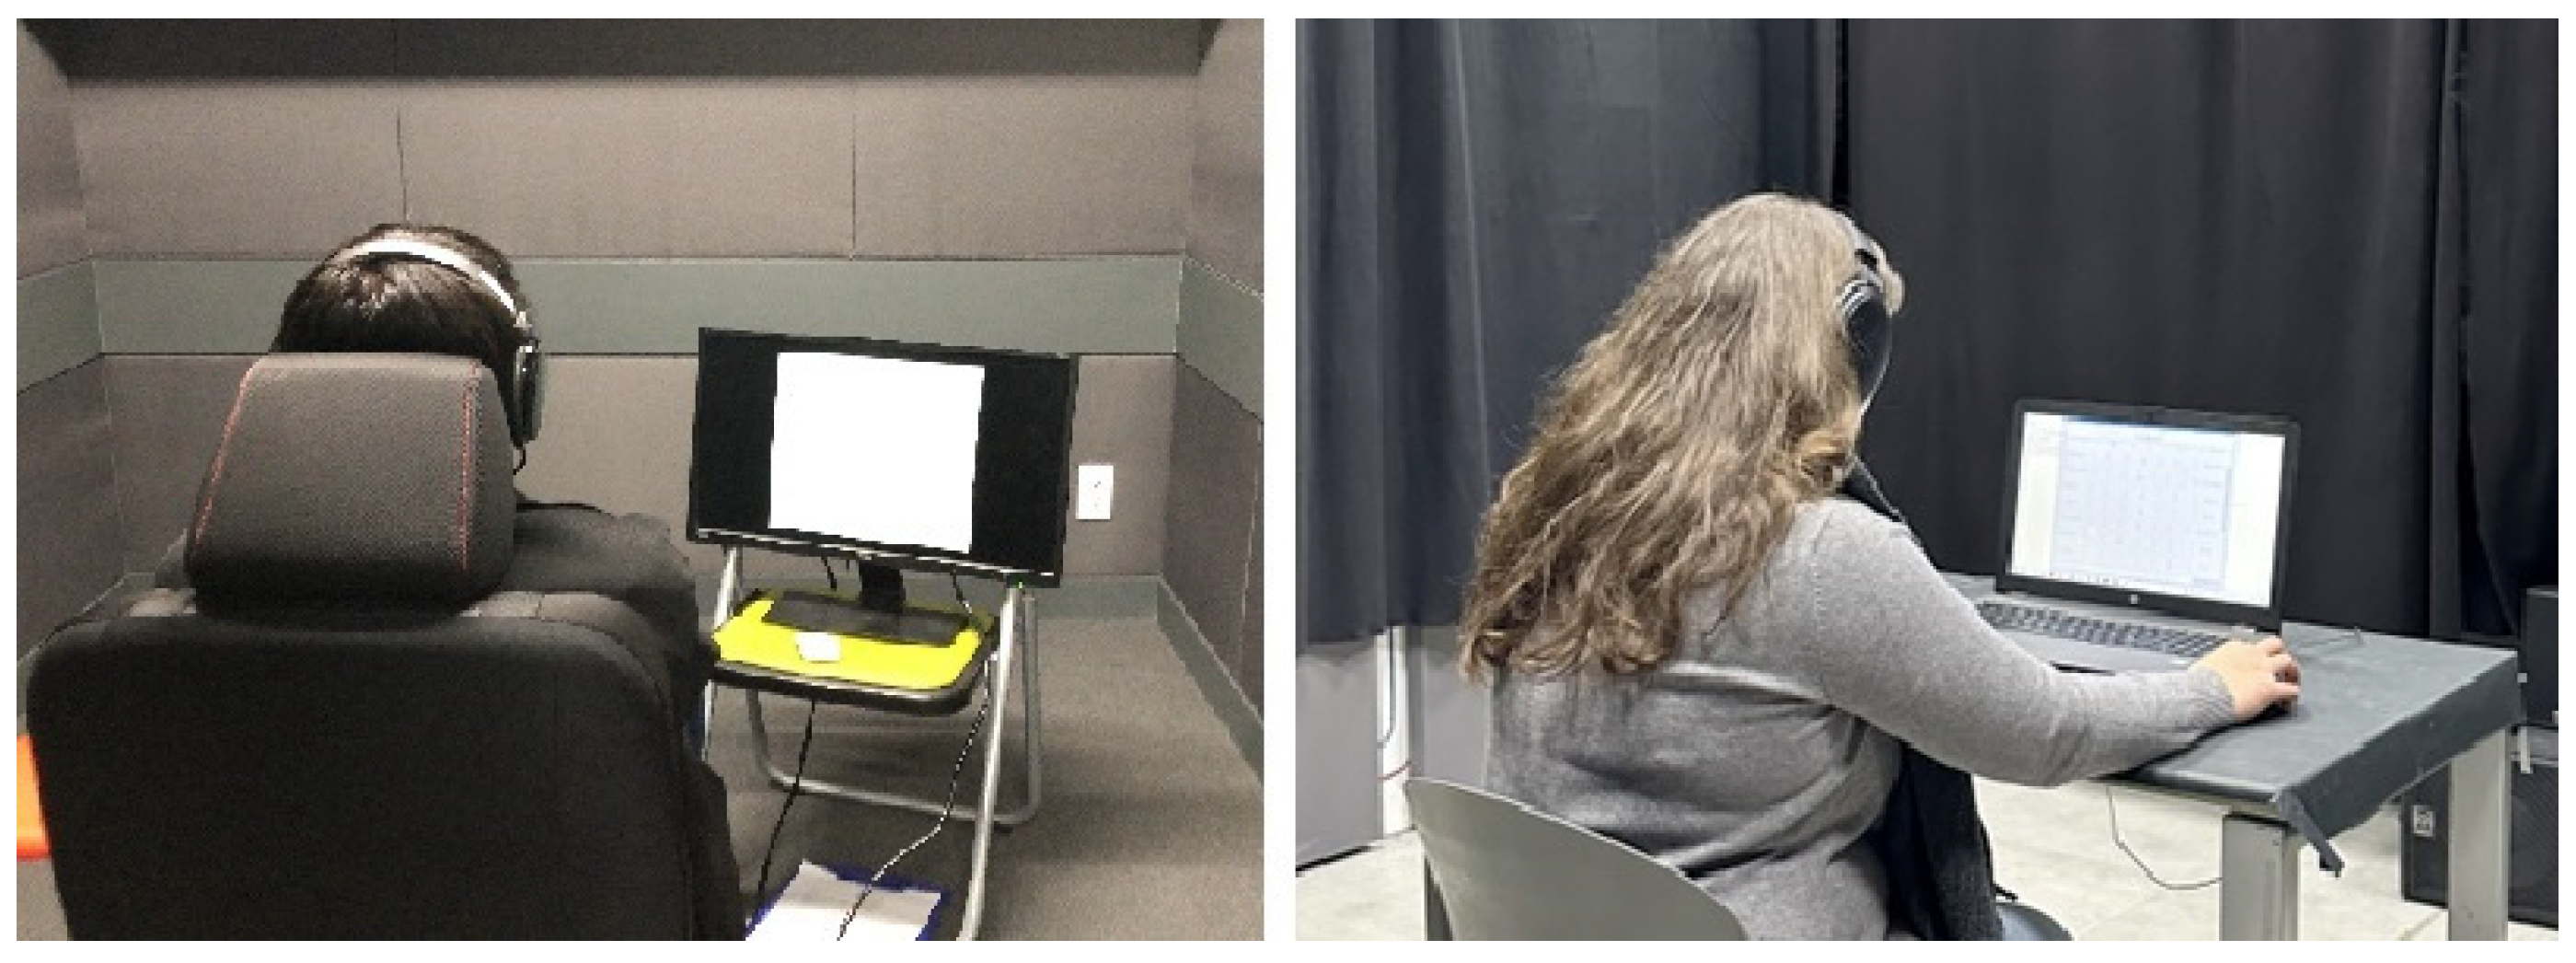
3. Main Experiment

Based on the two preliminary experiments, a main experiment was conducted to examine the effects of infotainment audio on perceived sound quality when an air-conditioning system is functioning. The experiment was conducted both in Japan, in the Yamauchi Lab in the Department of Acoustic Design at Kyushu University, and in Italy, in the Sens i-Lab in the Department of Architecture and Industrial Design of the Università degli Studi della Campania “Luigi Vanvitelli” (Figure 2).

3.1. Materials and Methods

Besides the air-conditioning noises and the infotainment audio used in the preliminary experiments, combinations of both with different signal-to-noise ratios were prepared. Details of the audio stimulus conditions are described below.
HVAC noise: Audio recordings of the air-conditioning system of an electric-vehicle model were extracted from a previous study [3]. The audio recordings were of an electric-vehicle model with the air-conditioning system functioning at three of the most frequently used airflow rates: 25%, 50% and 75% (hereafter referred to as AFR1, AFR2 and AFR3, respectively).
ISA cues: These consisted of a Japanese (JPN_BR) and an Italian (ITA_BR) version of an audio broadcast created using Google Text-to-Speech and 3 audio tracks which were extracted from the song “Let it Go”, used during the end credits of the movie Frozen: Japanese (JPN_SO)- and Italian (ITA_SO)-lyric versions and a karaoke (INST) version. These were played back using the car audio system of an internal combustion engine vehicle, a C-segment passenger car, while its engine was stopped, and recorded using a head-and-torso simulator Type 4100 (Brüel & Kjær) positioned in the passenger seat.
SNR: Considering the results of the preliminary experiments, the SNR was set in 4 dB steps, and three types were used: −4.0, −8.0 and −12.0 dB.
The previous 3 HVAC conditions × 5 types of ISA cues × 3 types of SNR generated 45 sound stimuli. Three more conditions with only air-conditioning noise and no masking audio (CTRL) were added. In total, 48 stimuli were used. Representative chunks of 30 s were extracted from each recording and analyzed using the software Artemis Suite 14.3 (Head Acoustics) (see Table 1).
After the calibration, the stimuli were played back by HD 650 (Sennheiser) headphones. Figure 3 shows the octave-band A-weighted sound-equivalent levels of the stimuli at different AFRs and of the background noise in the two labs. The spectra represent the experimental listening conditions, that is, when wearing headphones.
The subjective impressions of different sound aspects (quality, pleasantness, power, and spatio-temporal and spectral structure) were evaluated utilizing a 7-point semantic differential scale of 14 adjective pairs translated from English into Japanese and Italian [21] (see Table 2).

3.2. Participants

Twenty-three Japanese (twelve males and eleven females; M = 23.0; SD = 2.7) and twenty Italian participants (eleven males and nine females; M = 28.8; SD = 7.6) participated in the study. All of them participated voluntarily, without receiving any compensation for doing so.

3.3. Procedure

Participants were seated in front of a laptop and wore headphones in the center of the room. First, each participant was administered the Weinstein noise sensitivity scale [41,42] to test their noise sensitivity. After that, the test procedure was explained in detail to each participant: they were asked to rate their impression of each of the 48 presented stimuli on a 7-point semantic differential scale of adjective pairs (see Table 3).
A laptop was used to play the audio and collect the ratings on the semantic differential. Participants listened and rated each stimulus using the 14 adjective pairs before moving on to the next stimulus. They could listen to each stimulus as many times as they wanted. Participants were informed of the possibility of taking a break whenever they needed to during the experiment. Halfway through the experiment, a prompted message from the interface would suggest that participants take a break in any case. The average session duration was 45 min.

3.4. Statistical Analyses

To confirm what emerged from previous research about the main dimensions characterizing onboard sound quality perception when a HVAC system is activated, a Principal Component Analysis (PCA) was initially conducted.
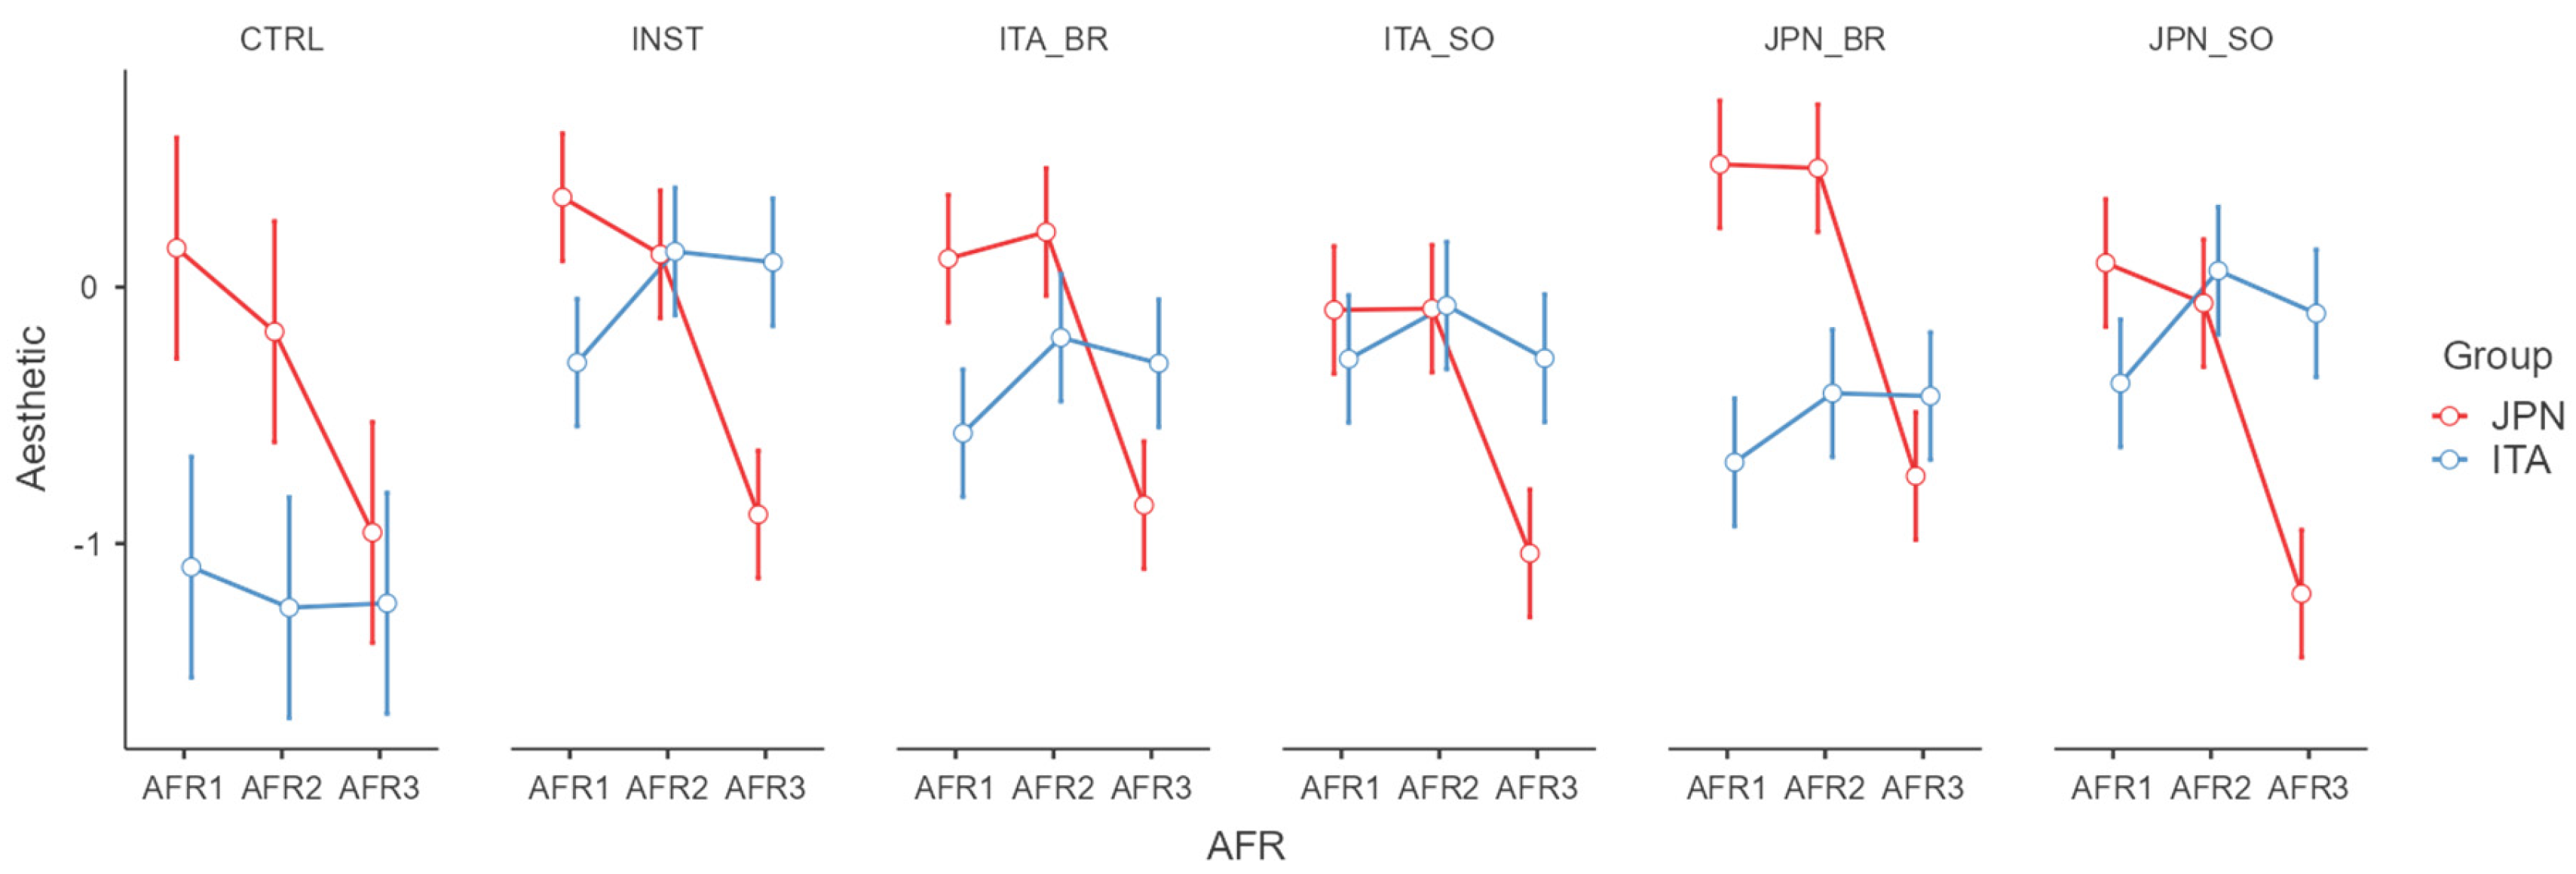
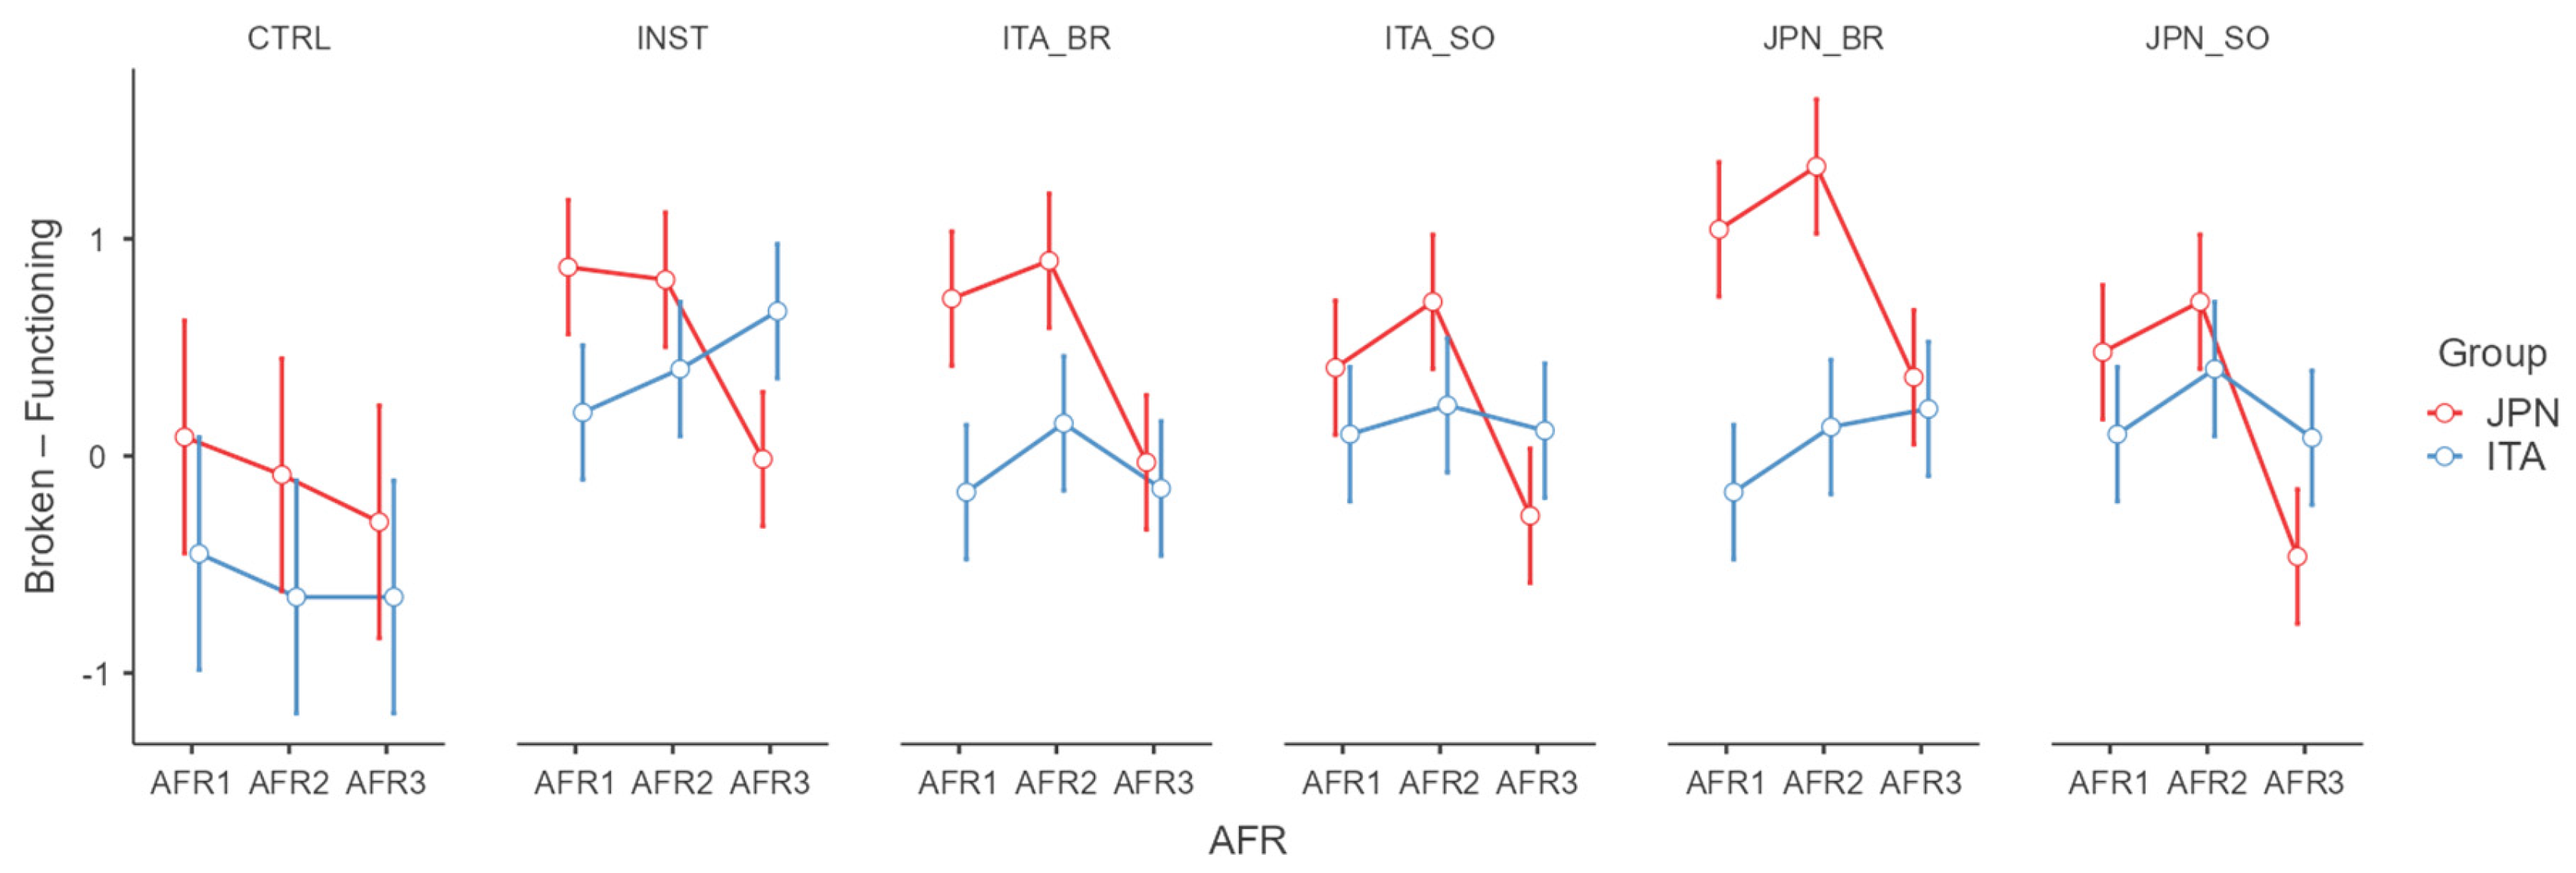
The main and interactive effects of the type of ISA, AFR, and SNR and of group were analyzed with respect to the two main perceptual dimensions (aesthetics and loudness) and each single sound quality attribute by means of the following:
-
Mixed-factorial 6 × 3 × 2 ANOVAs that treated the type of ISA as a 6-level within-subject factor (CTRL, INST, ITA_BR, ITA_SO, JPN_BR, and JPN_SO), the AFR as a 3-level within-subject factor (AFR1, AFR2, and AFR3), and the cultural group as a 2-level between-subject factor (ITA and JPN);
-
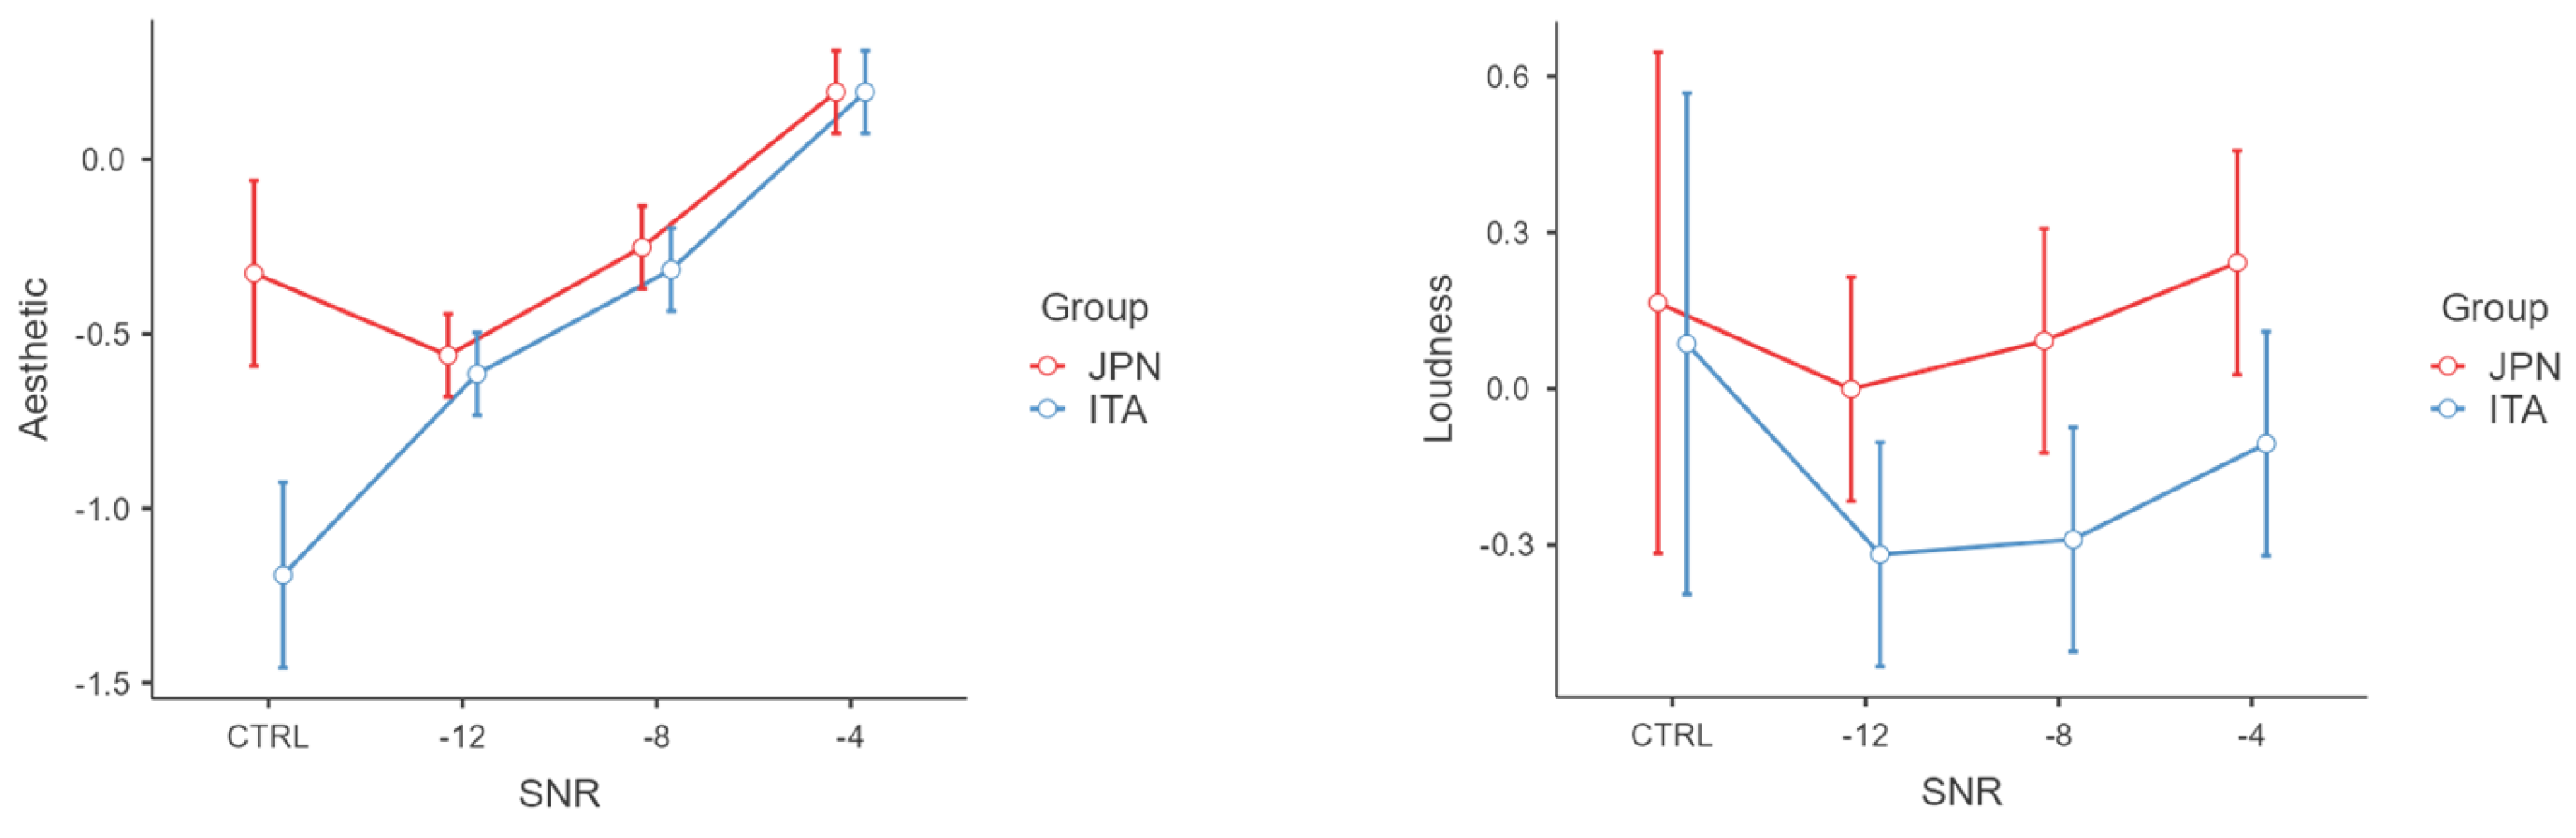
Mixed-factorial 4 × 2 ANOVAs that treated the SNR as a 4-level within-subject factor (CTRL, −12, −8 and −4) and the cultural group as a 2-level between-subject factor.
These latter analyses were conducted to understand whether the informational masking provided by ISA cues could moderate the perception of sound quality in car cabins and to answer the four research questions.

4. Results

4.1. Main Sound Quality Dimensions

The Principal Component Analysis (PCA) based on the average score ratings of each item was carried out by considering the Keiser criterion, assuming an eigenvalue equal to one, and the Promax rotation method was then used. Table 3 shows the scales with loading factors greater than 0.6 and highlights three main perceptual dimensions. The first two, aesthetics and loudness, were already recognized in previous research [21], while a third component, referred to as the spatial or temporal identification of ISA cues, was neglected in the following analyses. The Kaiser–Meyer–Olkin (KMO) test was used to verify the sample adequacy (KMO index = 0.731) and the Bartlett test the sphericity assumption (χ2 = 1657.14, df = 91, p < 0.0001).

4.2. Mixed-Factorial ANOVAs on the Type of ISA, AFR, and Cultural Group

The results of the mixed-factorial 6 × 3 × 2 ANOVAs on the aesthetic dimension (see Table 4) showed that a significant main effect emerged for the AFR (F(2,60) = 13.09, p < 0.001, ηp2 = 0.30) and a strong tendency for the type of ISA cues (F(5,60) = 2.33, p = 0.053, ηp2 = 0.16). Moreover, significant interactions of Group × AFR (F(2,60) = 16.44, p < 0.001, ηp2 = 0.35) and Type x Group (F(5,60) = 3.31, p < 0.01, ηp2 = 0.22) also emerged. Bonferroni post hoc testing revealed that the aesthetic value in the AFR3 condition was significantly different from that of AFR1 (MAFR1-MAFR3 = 0.48, t(60) = 4.05, p < 0.001) and AFR2 (MAFR2-MAFR3 = 0.55, t(60) = 4.73, p < 0.001). However, this effect was mainly due to the dramatic drop in the rating of the Japanese group in the AFR3 condition (MAFR1,JPN–MAFR3,JPN = 1.13, t(60) = 6.79, p < 0.001; MAFR2,JPN-MAFR3,JPN = 1.03, t(60) = 6.18, p < 0.001). The aesthetic rating was significantly higher with the introduction of instrumental ISA cues than in the CTRL condition (MCTRL-MINST = −0.68, t(60) = −3.35, p = 0.021). This effect was due to the Italian group (MCTRL,ITA-MINST,ITA = −1.06, t(60) = −3.67, p = 0.034) (see Figure 4).
For the loudness dimension (see Table 5), the results of the mixed-factorial 6 × 3 × 2 ANOVAs revealed a main effect of the AFR (F(2,60) = 675, p < 0.001, ηp2 = 0.96) and of the Group (F(1,60) = 56.3, p < 0.001, ηp2 = 0.48), as well as the interaction of Group × AFR (F(2,60) = 63.8, p < 0.001, ηp2 = 0.68). Bonferroni post hoc testing revealed that the loudness value increased significantly as the AFR increased (MAFR1-MAFR2 = −0.72, t(60) = −14.59, p < 0.001; MAFR2-MAFR3 = −1.09, t(60) = −21.91, p < 0.001; MAFR1-MAFR3 = −1.81, t(60) = −36.50, p < 0.001) and significantly differed between the groups (MJPN-MITA = 0.30, t(60) = 7.50, p < 0.001).
The results also showed that while the Italian group benefited from the introduction of ISA cues mainly at AFR3, the Japanese group mainly benefited at the lowest AFR level (see Figure 5).
Applying the mixed-factorial ANOVA to each of the attributes of the two sound quality dimensions (see Table 6 and Table 7), it can be observed that the Broken–Functioning (F(5,60) = 2.82, p < 0.024, ηp2 = 0.19), Mechanical–Natural (F(5,60) = 6.19, p < 0.001, ηp2 = 0.34), and Unpleasant–Pleasant (F(5,60) = 2.39, p = 0.048, ηp2 = 0.17) attributes were those that were significantly influenced by the introduction of the ISA cues (see Figure 6, Figure 7 and Figure 8).
Regarding the loudness dimension, the attributes significantly influenced by the introduction of the ISA cues were Quiet–Noisy (F(5,60) = 9.02, p < 0.001, ηp2 = 0.43) and Deep–Sharp (F(5,60) = 2.55, p < 0.037, ηp2 = 0.18) (see Figure 9 and Figure 10).

4.3. Mixed-Factorial ANOVAs on the SNR and Cultural Group

The results of the mixed-factorial 4 × 2 ANOVA on the aesthetic dimension (see Table 8) show that a significant main effect of SNR (F(3,88) = 17.18, p < 0.001, ηp2 = 0.37) and of Group (F(1,88) = 4.28, p = 0.042, ηp2 = 0.05) emerged. On the other hand, the same mixed-factorial 4 × 2 ANOVA on the loudness dimension (see Table 9) did not show any significant effects. Bonferroni post hoc testing revealed that aesthetic perception increases with the introduction of the ISA cues with the SNR of −4 dB (MCTRL-M-SNR-4 = −0.72, t(88) = −4.63, p < 0.001) (see Figure 11).
In more detail, the mixed-factorial ANOVAs on each of the attributes (see Table 10 and Table 11) showed that the SNRs of the ISA cues affect the perception of all the aesthetic attributes and only the Deep–Sharp attribute of the loudness dimension.

5. Discussion

The PCA results confirmed what was already found in previous research [21], i.e., inside electric-vehicle car cabins, the most important perceived sound quality dimensions are related to the aesthetic and loudness characteristics. These results are also in line with previous findings of other authors; see Kuwano et al. [43]. However, unlike earlier research, a new and exogenous sound source in the car cabin introduced a further dimension associated with the playback of the ISA cues. Although this aspect deserves interest with respect to better comprehending how the car audio system configuration influences the perception inside car cabins, this aspect was not addressed in this study.
Considering the four research questions, it can be observed that the informational masking provided by the introduction of ISA cues can moderate the perceived sound quality in electric-vehicle cabins containing HVAC noise. Concerning the first research question, Q
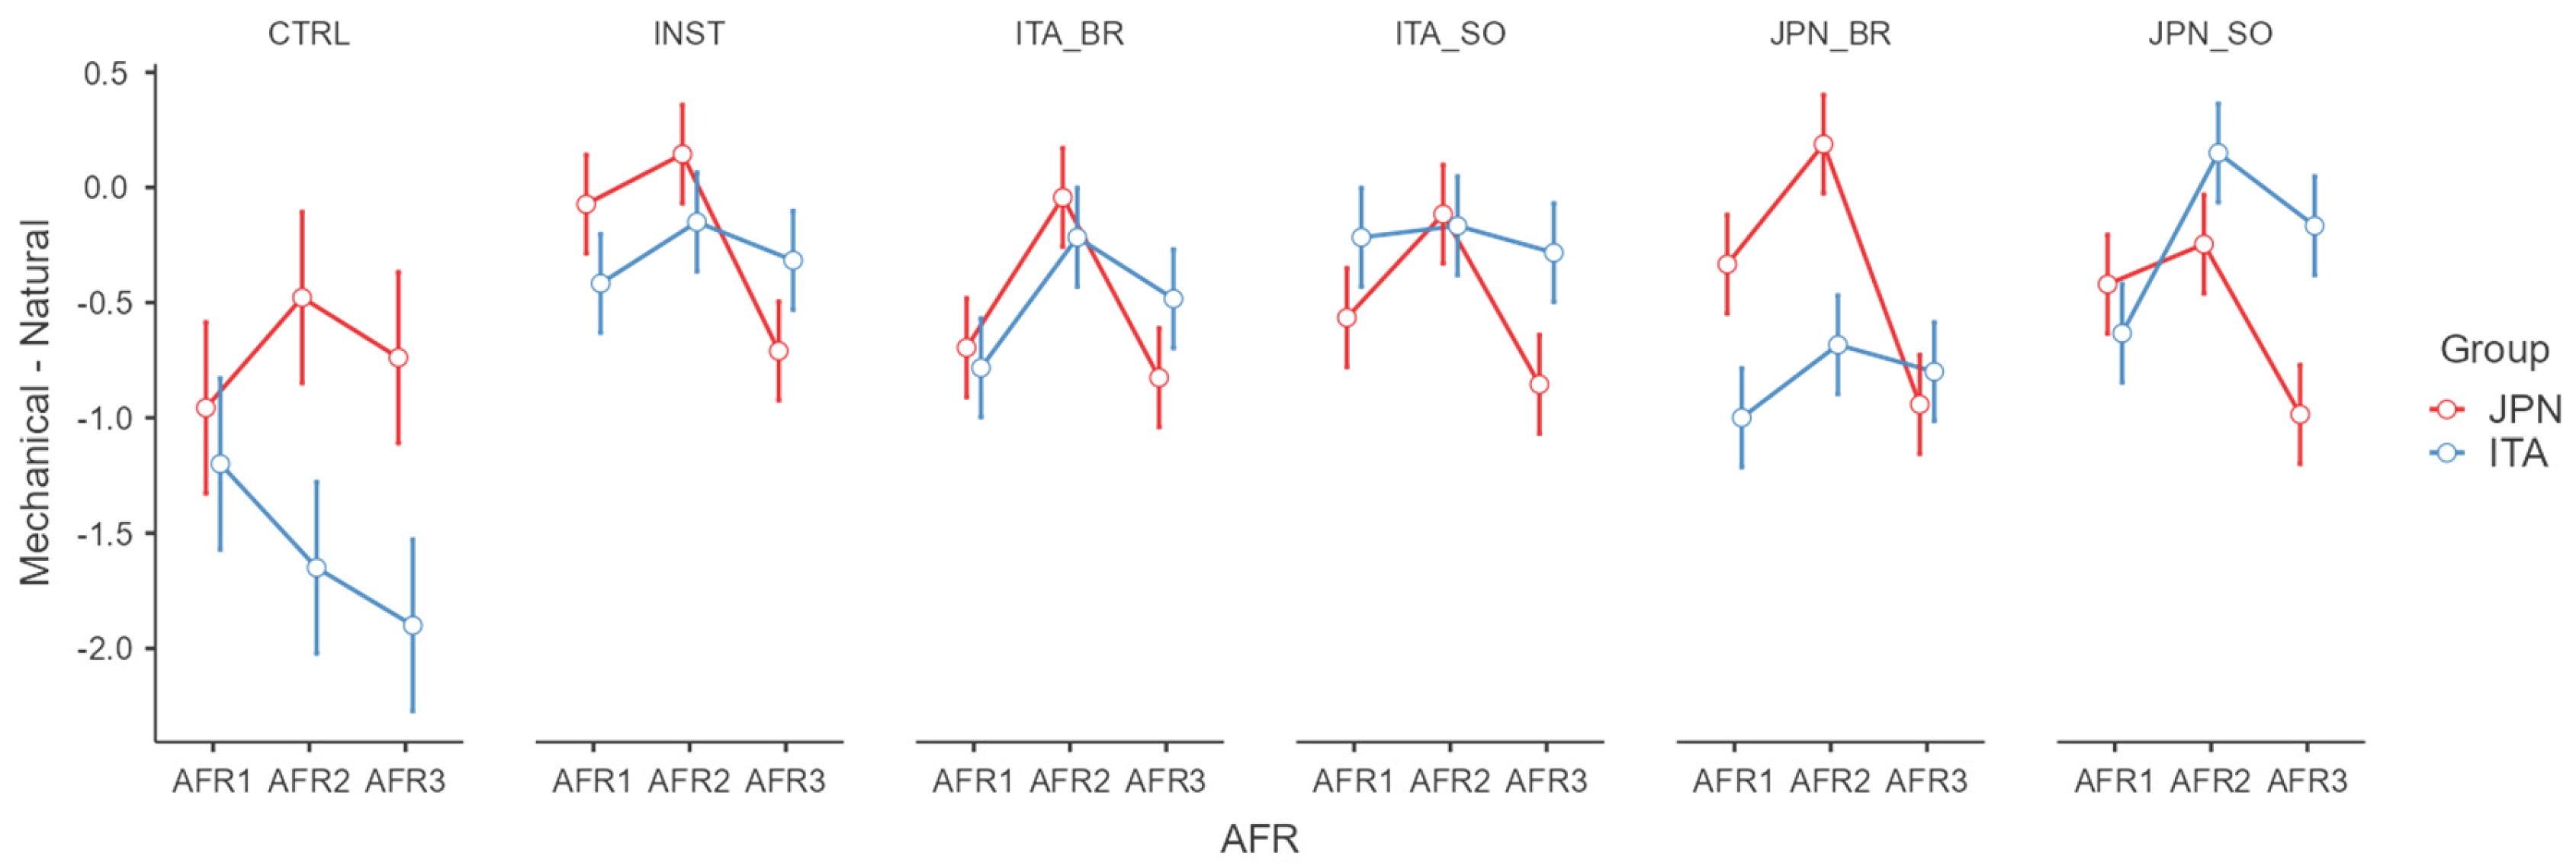
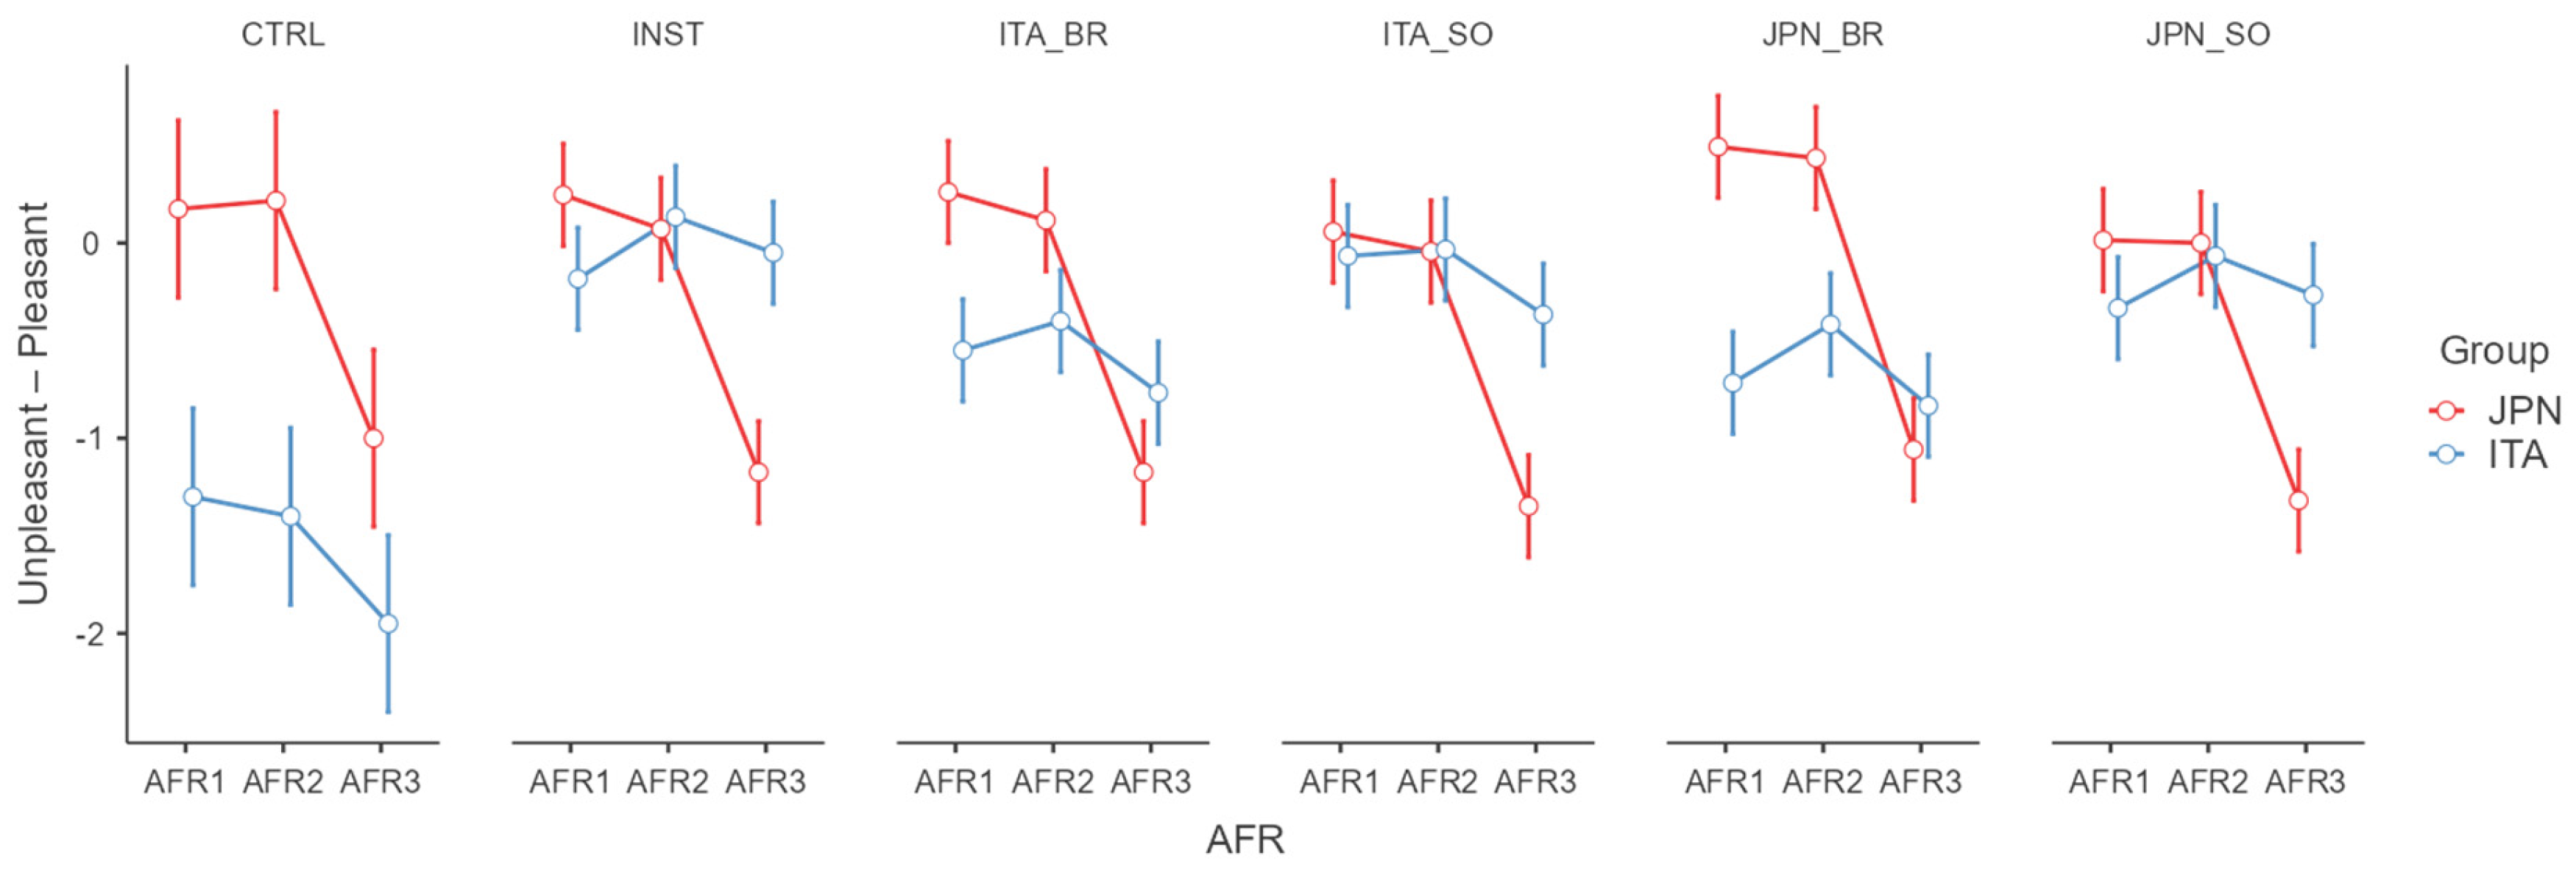
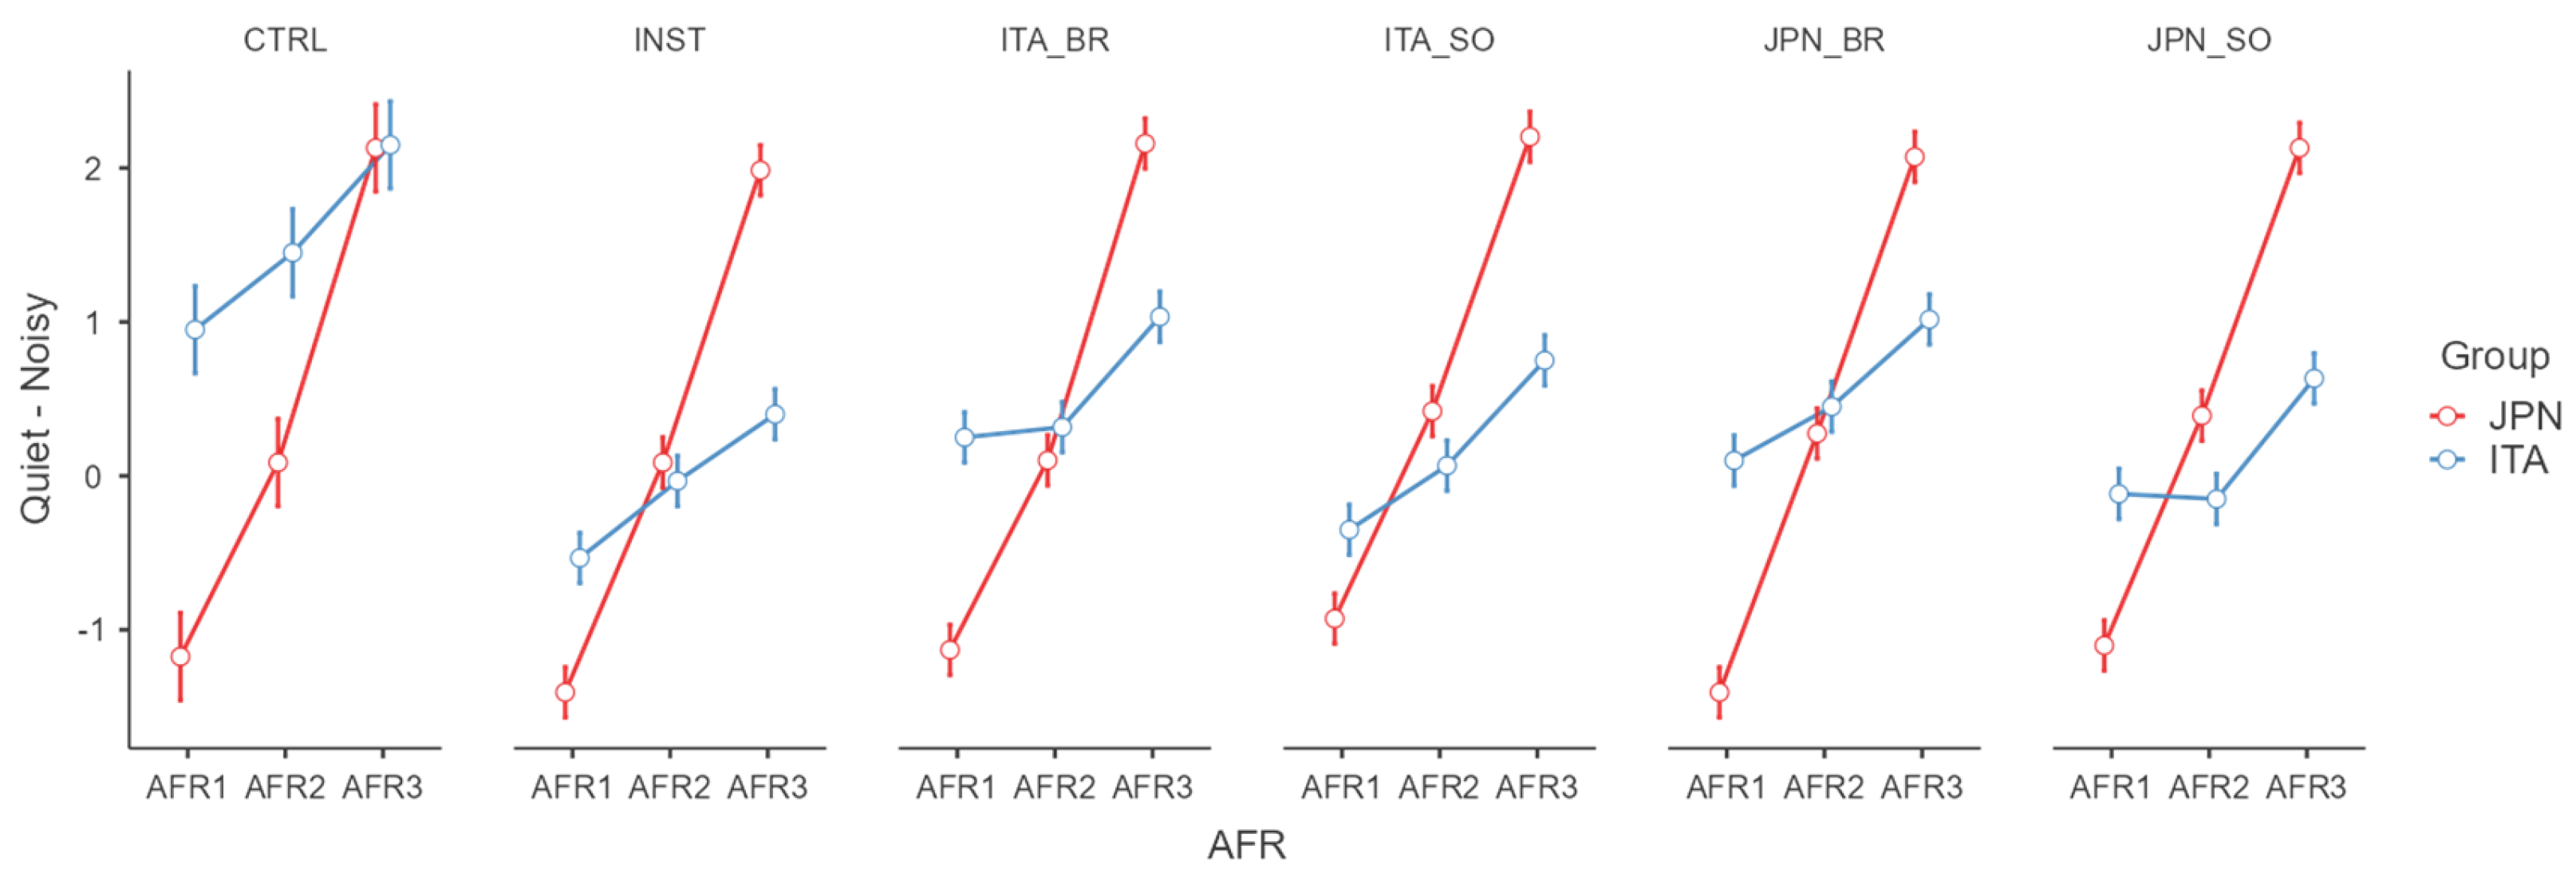
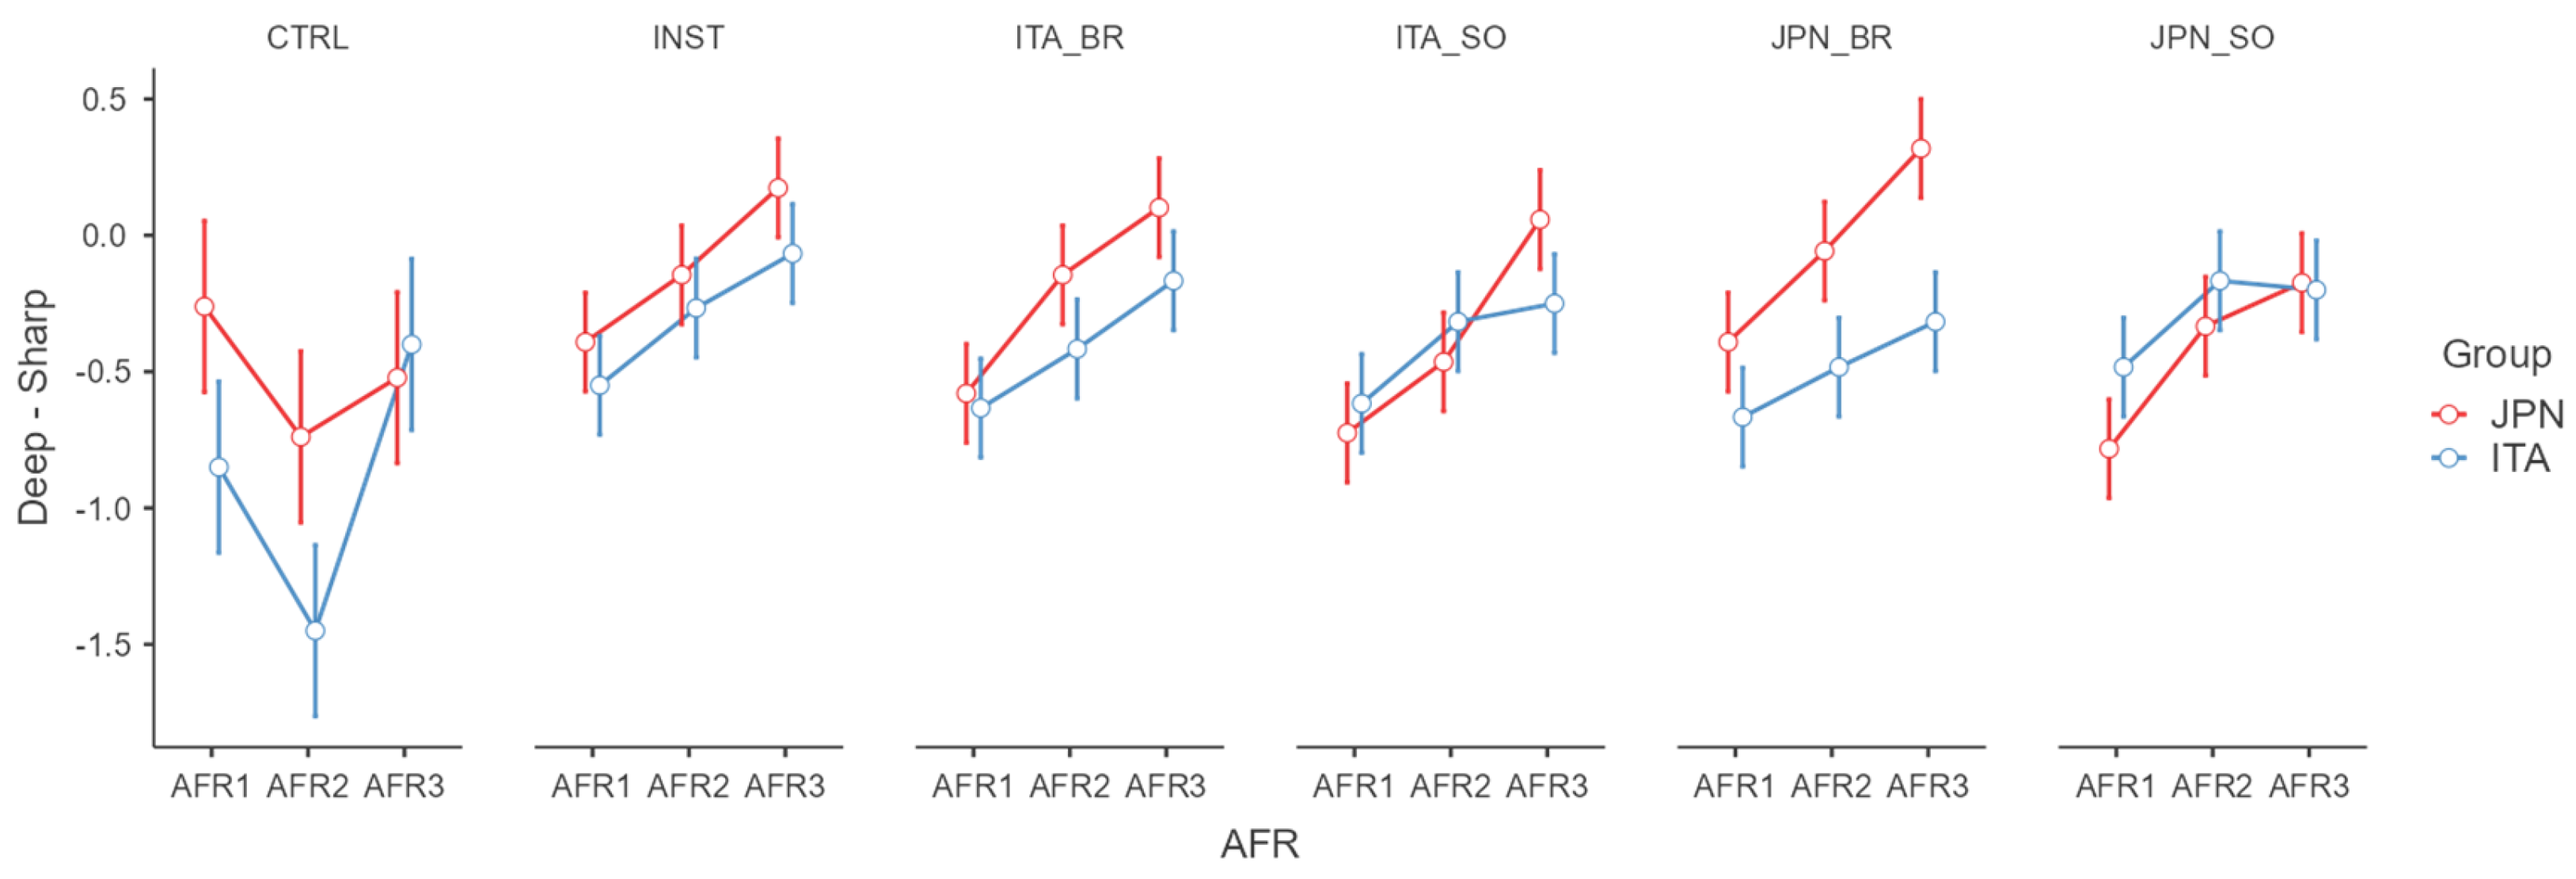
1, it can be observed that the introduction of ISA cues can be useful in improving the aesthetic dimension of the sound quality onboard and making it more functional, natural, and pleasant. On the other hand, it also changes the perception onboard from deep to sharp, providing a better sense of quietness, though this was only found for the Italian group. Among the different types of cues, the instrumental one improved the aesthetic ratings. Although applied in a different context, car cabins, the findings are in line with previous research which demonstrated how the use of additional natural or augmented natural [36,44,45,46] sounds or music [45] can be considered an effective and soft mitigating strategy to compensate for negative perception of the sound environment of everyday-life environments.
The results for the second research question, Q2, showed that the effect of ISA cues did not interact with the AFR. However, the main effect of AFR on the Japanese group highlighted a dramatic drop in the aesthetic rating caused by a deeper unpleasant impression. This outcome was accompanied by a more rapid increase in the loudness perception in the AFR3. This result showed once more that, due to negative perceptions, the Japanese group is sensitive to high AFR levels of HVAC systems.
Considering the third research question, Q3, although the effect of ISA cues did not interact with the Group factor for the two main sound quality dimensions, it can be observed that some differences emerged for specific attributes of the aesthetic and loudness dimensions.
The results for the last research question, Q4, show that the SNR between ISA cues and HVAC noise is important in improving sound quality perception in an electric-vehicle car cabin. Such improvement becomes effective only at an SNR of −4 dB. This condition fosters an aesthetic improvement of the existing sound quality onboard independently of the AFR level, the type of ISA cue, and the cultural group.

6. Conclusions

This study highlighted the possibility of using ISA cues to improve the perceived sound quality in electric-vehicle cabins when the air-conditioning system is activated. The results showed that adding music to air-conditioning noise can be a reliable soft strategy to improve the aesthetic dimension of perceived sound quality.
The effectiveness of ISA cue use was most evident when the SNR reached at least the value of −4 dB. Moreover, the differences between the cultural groups confirmed a special sensitivity of the Japanese group to high AFR levels of HVAC systems, as well as the greater effectiveness of ISA cue introduction for the Italian group compared to the Japanese group.
The results suggest linking the sound level of the ISA cues with the air-conditioning flow rate to best mitigate the sound quality character onboard electric vehicles. Due to the limited types of ISA cues, the findings also suggest exploring the development of different, existing, or customized sounds to optimize the mitigating effect.

Author Contributions

Conceptualization, M.M. and K.Y.; methodology, M.M. and K.Y.; software, M.M., K.Y. and M.D.; validation, M.M., K.Y. and M.D.; investigation, F.C. and M.D.; resources, M.M. and K.Y.; data curation, F.C., K.Y., M.M. and M.D.; writing—original draft preparation, M.M., F.C., K.Y. and M.D.; writing—review and editing, M.M., L.M. and K.Y.; supervision, L.M.; project administration, M.M. and K.Y. All authors have read and agreed to the published version of the manuscript.

Funding

This research received no external funding.

Informed Consent Statement

Verbal informed consent was obtained from the participants. Verbal consent was obtained rather than written because of the specific experimental conditions. In accordance with the Declaration of Helsinki and considering the non-interventional and minimal-risk nature of this anonymous listening test, verbal informed consent was obtained from all participants, as permitted under specific circumstances outlined in relevant ethical guidelines (e.g., APA Ethical Principles 8.05—Dispensing with Informed Consent for Research). This decision was justified by the lack of potential for distress or harm, the guaranteed anonymity of responses, and the explicit instruction provided to participants that their involvement was entirely voluntary and could be terminated at any point without consequence.

Data Availability Statement

The dataset generated and analyzed during the current study is available from the corresponding author on reasonable request.

Acknowledgments

The authors would like to thank all colleagues and friends who helped them to carry out the activities of the Collaborative Research Project on “Informational masking of HVAC noise in electric vehicles” between the Department of Architecture and Industrial Design of the Università degli Studi della Campania “Luigi Vanvitelli” and the Department of Acoustic Design, Faculty of Design, Kyushu University, and the volunteers who offered their time.

Conflicts of Interest

The authors declare no conflicts of interest.

References

  1. Leite, R.P.; Paul, S.; Gerges, S.N.Y. A sound quality-based investigation of the HVAC system noise of an automobile model. Appl. Acoust. 2009, 70, 636–645. [Google Scholar] [CrossRef]
  2. IEA. Global EV Outlook 2023; IEA: Paris, France, 2023; Available online: https://www.iea.org/reports/global-ev-outlook-2023 (accessed on 1 June 2024).
  3. Masullo, M.; Yamauchi, K.; Nakatani, Y.; Maffei, L. HVAC noise perception in car cabin: A preliminary comparison between ICEVs and HEVs. In Proceedings of the 23rd International Congress on Acoustics ICA 2019, Aachen, Germany, 9–13 September 2019. [Google Scholar]
  4. Zwicker, E.; Fastl, H. Psychoacoustics, Facts and Models, 2nd ed.; Springer: Berlin, Germany, 1999. [Google Scholar]
  5. Neise, W. Noise reduction in centrifugal fans: A literature survey. J. Sound Vib. 1976, 45, 375–403. [Google Scholar] [CrossRef]
  6. Neise, W. Review of noise reduction methods for centrifugal fans. J. Eng. Ind. 1982, 104, 151–161. [Google Scholar] [CrossRef]
  7. Sen, S.; Singh, K.; Raj, A.; Goel, A. A Practical Approach Towards Reducing the HVAC Flow Noise; SAE Technical Paper 2021-01-0216; SAE: Warrendale, PA, USA, 2021. [Google Scholar]
  8. Bennouna, S.; Matharan, T.; Cheriaux, O. Automotive HVAC Noise Reduction; SAE Technical Paper 2018-01-1519; SAE: Warrendale, PA, USA, 2018. [Google Scholar]
  9. Allam, S.; Åbom, M. Fan noise control using microperforated splitter silencers. J. Vib. Acoust. 2014, 136, 31017. [Google Scholar] [CrossRef]
  10. Arenas, J.P.; Crocker, M.J. Recent trends in porous sound-absorbing materials. Sound Vib. 2010, 44, 12–17. [Google Scholar]
  11. Singh, S.; Mohanty, A.R. HVAC noise control using natural materials to improve vehicle interior sound quality. Appl. Acoust. 2018, 140, 100–109. [Google Scholar] [CrossRef]
  12. Wu, J.D.; Bai, M.R. Application of feed forward adaptive active-noise control for reducing blade passing noise in centrifugal fans. J. Sound. Vib. 2001, 239, 1051–1062. [Google Scholar] [CrossRef]
  13. Back, J.; Lee, S.K.; Min Lee, S.; An, K.; Kwon, D.H.; Park, D.C. Design and implementation of comfort-quality HVAC sound inside a vehicle cabin. Appl. Acoust. 2021, 177, 107940. [Google Scholar] [CrossRef]
  14. Yoon, J.H.; Yang, I.H.; Jeong, J.E.; Park, S.G.; Oh, J.E. Reliability Improvement of a Sound Quality Index for a Vehicle HVAC System Using a Regression and Neural Network Model. Appl. Acoust. 2012, 73, 1099–1103. [Google Scholar] [CrossRef]
  15. Nakasaki, R.; Hasegawa, H.; Kasuga, M.; Kobayashi, R.; Hasegawa, H.; Kasuga, M. Evaluation of Air-Conditioning Sounds in a Vehicle to Determine Thermal Feelings Using Psychoacoustic Parameters. Acoust. Sci. Technol. 2013, 34, 159–165. [Google Scholar] [CrossRef]
  16. Wagner, V.; Enigk, H.; Beitz, T.; Kallus, K.W. Subjective and Objective Evaluation of the Air Conditioning Sound. J. Ergon. 2014, 4, 131. [Google Scholar] [CrossRef]
  17. Ma, K.W.; Wong, H.M.; Mak, C.M. A Systematic Review of Human Perceptual Dimensions of Sound: Meta-analysis of Semantic Differential Method Applications to Indoor and Outdoor Sounds. Build. Environ. 2018, 133, 123–150. [Google Scholar] [CrossRef]
  18. Yamauchi, K.; Dan, M.; Cioffi, F.; Maffei, L.; Masullo, M. Perceptual Difference on HVAC Sound Quality between Electric and Conventional Vehicles. In Proceedings of the Internoise 2021, Washington, DC, USA, 1–5 August 2021. [Google Scholar]
  19. Dan, M.; Yamauchi, K.; Cioffi, F.; Maffei, L.; Masullo, M. Study on Sound Quality Evaluation of Air Conditioning Sound in Electric Vehicles by Comparison with Internal Combustion Engine Vehicles; Noise and Vibration Research Group of the Acoustical Society of Japan Materials: Osaka, Japan, July 2021; N-2021-29. [Google Scholar]
  20. Dan, M.; Yamauchi, K.; Cioffi, F.; Maffei, L.; Masullo, M. Subjective evaluation of air conditioning in electric vehicles in comparison with internal combustion engine vehicles-Comparison between Japanese and European subjects. In Proceedings of the Japan Society of Control Engineers Autumn Research Conference, Tokyo, Japan, 8–10 November 2021. [Google Scholar]
  21. Dan, M.; Yamauchi, M.; Masullo, M.; Maffei, L. Influence of Hearing Music or Speech Information on HVAC Sounds Evaluation in the Vehicle. Tech. Rep. Noise Vib. Acoust. Soc. Jpn. 2022, N-2022-52. [Google Scholar]
  22. Masullo, M.; Yamauchi, K.; Dan, M.; Cioffi, F.; Maffei, L. Intercultural Differences in the Perception of HVAC Sound Quality in Car Cabins: From Conventional to Electric Vehicles. Appl. Sci. 2021, 11, 11431. [Google Scholar] [CrossRef]
  23. Haverkamp, M. Soft sounds within quiet cars? Design with respect to subjective intensity of sounds. In Proceedings of the Forum Acusticum, Lyon, France, 7–11 December 2020. [Google Scholar]
  24. Every, M.; MacDonald, K. A Software Library for Active Control of Automotive Engine Noise; SAE Technical Paper 2013-01-1950; SAE: Warrendale, PA, USA, 2013. [Google Scholar]
  25. Mendes, C.G.; Diniz, L.A.; Marques Miranda, D. Does Music Listening Affect Attention? A Literature Review. Dev. Neuropsychol. 2021, 46, 192–212. [Google Scholar] [CrossRef]
  26. Treisman, A.M.; Gelade, G. A feature-integration theory of attention. Cogn. Psychol. 1980, 12, 97–136. [Google Scholar] [CrossRef]
  27. Durlach, N.I.; Mason, C.R.; Kidd, G.; Arbogast, T.L.; Colburn, H.S.; Shinn-Cunningham, B.G. Note on informational masking. J. Acou. Soc. Am. 2003, 113, 2984–2987. [Google Scholar] [CrossRef]
  28. Pollack, I. Auditory informational masking. J. Acoust. Soc. Am. 1975, 57, S5. [Google Scholar] [CrossRef]
  29. Kidd, G.; Mason, C.R.; Richards, V.M.; Gallun, F.J.; Durlach, N.I. Informational Masking. In Auditory Perception of Sound Sources; Yost, W.A., Popper, A.N., Fay, R.R., Eds.; Springer Handbook of Auditory Research; Springer: Boston, MA, USA, 2008; Volume 29. [Google Scholar]
  30. Posner, M.I. Orienting of attention. Q. J. Exp. Psychol. 1980, 32, 3–25. [Google Scholar] [CrossRef]
  31. Haapakangas, A.; Kankkunen, E.; Hongisto, V.; Virjonen, P.; Oliva, D.; Keskinen, E. Effects of Five Speech Masking Sounds on Performance and Acoustic Satisfaction. Implications for Open-Plan Offices. Acta Acust. United Acust. 2011, 97, 641–655. [Google Scholar] [CrossRef]
  32. Oldoni, D.; De Coensel, B.; Boes, M.; Rademaker, M.; De Baets, B.; Van Renterghem, T.; Botteldooren, D. A computational model of auditory attention for use in soundscape research. J. Acous. Soc. Am. 2013, 134, 852–861. [Google Scholar] [CrossRef] [PubMed]
  33. Hong, J.Y.; Lam, B.; Ong, Z.T.; Ooi, K.; Gan, W.S.; Kang, J.; Yeong, S.; Lee, I.; Tan, S.T. A mixed-reality approach to soundscape assessment of outdoor urban environments augmented with natural sounds. Build Environ. 2021, 194, 107688. [Google Scholar] [CrossRef]
  34. Jeon, J.Y.; Lee, P.J.; You, J.; Kang, J. Perceptual assessment of quality of urban soundscapes with combined noise sources and water sounds. J. Acoust. Soc. Am. 2010, 127, 1357–1366. [Google Scholar] [CrossRef] [PubMed]
  35. Li, J.; Maffei, L.; Pascale, A.; Masullo, M. Neural Effects of the Spatialisation of Water-Sounds Sequences on Masking Traffic Noise: A Psychophysical Study. J. Acoust. Soc. Am. 2022, 152, 172–183. [Google Scholar] [CrossRef]
  36. Li, J.; Masullo, M.; Maffei, L.; Pascale, A.; Chau, C.K.; Lin, M. Improving informational-attentional masking of water sound on traffic noise by spatial variation settings: An in-situ study with brain activity measurements. Appl. Acoust. 2024, 218, 109904. [Google Scholar] [CrossRef]
  37. Kondo, A.; Ueno, K.; Yokoyama, S.; Yano, H.; Tachibana, H. Sound environment evaluation of automobile/vehicle interiors-Subjective evaluation experiment on radio listening. In Proceedings of the Acoustical Society of Japan, Kanazawa, Japan, 28 November–2 December 2006; pp. 677–678. [Google Scholar]
  38. Monma, M.; Honda, K. Examination of the impact of verbal information contained in music on reading task—Comparison of Japanese lyrics and Korean lyrics. Jpn. J. Ergon. 2010, 46, 342–345. [Google Scholar]
  39. Sato, I. Information and evacuation announcements in public spaces with consideration for language barrier-free. J. Acoust. Soc. Jpn. 2021, 77, 308–313. [Google Scholar]
  40. Google Text-to-Speech. Available online: https://cloud.google.com/text-to-speech (accessed on 20 October 2020).
  41. Senese, V.P.; Ruotolo, F.; Ruggiero, G.; Iachini, T. The Italian Version of the Weinstein Noise Sensitivity Scale European. J. Psychol. Assess. 2012, 28, 118–124. [Google Scholar] [CrossRef]
  42. Weinstein, N.D. Individual differences in reactions to noise: A longitudinal study in a college dormitory. J. Appl. Psychol. 1978, 63, 458–466. [Google Scholar] [CrossRef]
  43. Kuwano, S.; Namba, S.; Florentine, M.; Rui, Z.D.; Fastl, H.; Schick, A. A cross-cultural study of the factors of sound quality of environmental noise. J. Acoust. Soc. Am. 1999, 105, 1081. [Google Scholar] [CrossRef]
  44. Van Renterghem, T.; Vanhecke, K.; Filipan, K.; Sun, K.; De Pessemier, T.; De Coensel, B.; Joseph, W.; Botteldooren, D. Interactive soundscape augmentation by natural sounds in a noise polluted urban park. Landsc. Urban Plan. 2020, 194, 103705. [Google Scholar] [CrossRef]
  45. Steele, D.; Bild, E.; Tarlao, C.; Guastavino, C. Soundtracking the Public Space: Outcomes of the Musikiosk Soundscape Intervention. Int. J. Environ. Res. Public Health 2019, 16, 1865. [Google Scholar] [CrossRef] [PubMed]
  46. Hao, Y.; Kang, J.; Wörtche, H. Assessment of the masking effects of birdsong on the road traffic noise environment Acoustical and perceptual assessment of water sounds and their use over road traffic noise. J. Acoust. Soc. Am. 2013, 133, 227. [Google Scholar]
Figure 1. Factor scores for each stimulus by group (left: HEVs, air conditioner; right: ICEVs, air conditioner; percentages indicate the AFR). Factor 1 is aesthetics (or quality). Factor 2 is loudness (or powerfulness). Figure re-arranged from [21].
Acoustics 07 00001 g001
Figure 2. Experimental sessions in the Yamauchi Lab, Japan (left), and the Sens i-Lab, Italy (right).
Acoustics 07 00001 g002
Figure 3. Comparison of octave bands among the spectra of the stimuli at the different AFRs and the background noise in the Yamauchi Lab and the Sens i-Lab with headphones.
Acoustics 07 00001 g003
Figure 4. Mean values and standard errors of the aesthetic dimension as a function of the AFR, type of ISA cues, and cultural group.
Acoustics 07 00001 g004
Figure 5. Mean values and standard errors of the loudness dimension as a function of the AFR, type of ISA cues, and group.
Acoustics 07 00001 g005
Figure 6. Mean values and standard errors of the Broken–Functioning attribute as a function of the AFR, type of ISA cues, and group.
Acoustics 07 00001 g006
Figure 7. Mean values and standard errors of the Mechanical–Natural attribute as a function of the AFR, type of ISA cues, and group.
Acoustics 07 00001 g007
Figure 8. Mean values and standard errors of the Unpleasant–Pleasant attribute as a function of the AFR, type of ISA cues, and group.
Acoustics 07 00001 g008
Figure 9. Mean values and standard errors of the Quiet–Noisy attribute as a function of the AFR, type of ISA cues, and group.
Acoustics 07 00001 g009
Figure 10. Mean values and standard errors of the Deep–Sharp attribute as a function of the AFR, type of ISA cues, and group.
Acoustics 07 00001 g010
Figure 11. Mean values and standard errors of aesthetics and loudness as a function of the SNR and Group.
Acoustics 07 00001 g011
Table 1. Acoustic and psychoacoustic metrics of the sound stimuli.
L [dB]LA [dB]N [sone]S [acum]R [asper]F [vacil]
AFR1CTRL53.339.83.21.050.01900.0031
AFR2CTRL59.848.15.91.030.02790.0066
AFR3CTRL68.257.511.91.410.03460.0087
INSTRAFR1SNR-455.241.43.91.430.01750.0161
SNR-854.340.63.61.310.01800.0120
SNR-1254.040.23.51.210.01840.0077
AFR2SNR-462.449.87.51.540.02470.0216
SNR-861.148.96.91.410.02590.0153
SNR-1260.348.46.41.290.02640.0111
AFR3SNR-471.359.314.61.860.03060.0272
SNR-869.758.213.41.730.03160.0194
SNR-1268.857.712.71.620.03240.0142
ITA_broadcastAFR1SNR-453.741.53.71.330.01820.0124
SNR-853.640.63.51.240.01880.0078
SNR-1253.440.13.31.180.01870.0059
AFR2SNR-460.049.66.71.420.02580.0176
SNR-860.048.96.51.310.02660.0112
SNR-1259.948.46.31.220.02730.0083
AFR3SNR-468.559.213.51.760.03260.0214
SNR-868.358.212.81.650.03350.0135
SNR-1268.257.812.41.570.03400.0100
ITA_songAFR1SNR-454.541.23.91.470.01660.0093
SNR-853.940.53.61.320.01760.0071
SNR-1253.740.23.41.210.01850.0060
AFR2SNR-460.749.67.41.610.02340.0127
SNR-860.248.86.91.440.02490.0092
SNR-1259.848.26.21.300.02550.0080
AFR3SNR-469.458.914.21.900.02940.0163
SNR-868.758.113.31.740.03110.0117
SNR-1268.457.812.81.620.03260.0093
JPN_broadcastAFR1SNR-453.741.23.71.250.01790.0131
SNR-853.740.33.41.180.01820.0079
SNR-1253.640.13.31.120.01890.0058
AFR2SNR-460.049.46.61.340.02620.0185
SNR-860.048.76.41.240.02750.0115
SNR-1259.748.36.41.170.02750.0082
AFR3SNR-468.558.913.41.660.03280.0227
SNR-868.358.112.71.570.03340.0137
SNR-1268.057.511.71.510.03290.0117
JPN_songAFR1SNR-454.241.23.91.450.01700.0103
SNR-853.940.53.61.310.01800.0073
SNR-1253.540.03.31.220.01840.0061
AFR2SNR-461.049.67.41.590.02390.0137
SNR-860.348.86.91.420.02530.0105
SNR-1259.848.26.21.290.02590.0087
AFR3SNR-469.559.014.41.900.02960.0175
SNR-868.858.213.41.730.03140.0122
SNR-1268.357.712.51.610.03220.0098
Table 2. Pairs of the adjectives used to evaluate the subjective impressions [21].
JapaneseEnglishItalian
機能している–壊れたFunctioning–BrokenFunzionante–Rotto
高品質な–低品質なHigh Quality–Low QualityAlta Qualità–Bassa Qualità
煩わしくない–煩わしいNot Annoying–AnnoyingNon Fastidioso–Fastidioso
自然な–機械的なNatural–MechanicalNaturale–Meccanico
不快–心地よいUnpleasant–PleasantSgradevole–Gradevole
騒々しい–静かなNoisy–QuietRumoroso–Quieto
大きい–小さいLoud–SoftAlto Volume–Basso Volume
力強い–弱々しいPowerful–WeakPotente–Debole
拡がりのある–局所的なDiffuse–LocalizedDiffuso–Localizzato
変動した–安定したFluctuating–StableFluttuante–Stabile
粗い–滑らかなRough–FlatRuvido–Piatto
鋭い–鈍いSharp–DullAcuto–Grave
澄んだ–濁ったClear–ThickChiaro–Sordo
広帯域性の–純音性のWideband–TonalA Banda Larga–Tonale
Table 3. Component loadings of Principal Component Analysis.
Items123Uniqueness
Mechanical–Natural0.995 0.197
Broken–Functioning0.907 0.169
Unpleasant–Pleasant0.873 0.079
Low Quality–High Quality0.757 0.123
Dull–Clear0.747 0.235
Annoying–Not Annoying0.731 0.085
Soft–Loud 0.987 0.039
Weak–Powerful 0.966 0.053
Deep–Sharp 0.820 0.244
Flat–Rough 0.741 0.159
Quiet–Noisy 0.695 0.063
Diffuse–Localized 0.8060.317
Fluctuating–Stable 0.6420.405
Wideband–Tonal -0.249
Table 4. Mixed-factorial 6 × 3 × 2 ANOVAs on the aesthetic dimension.
Aesthetic
SSdfMSFpηp2
AFR4.8622.4313.09<0.0010.30
Type2.1650.432.330.0530.16
Group0.6310.633.410.070.05
AFR × Type0.21100.020.111.000.02
Group × AFR6.123.0516.44<0.0010.35
Type × Group3.0850.623.310.010.22
AFR × Type × Group0.33100.030.180.9970.03
Residuals11.14600.19
Table 5. Mixed-factorial 6 × 3 × 2 ANOVAs on the loudness dimension.
Loudness
SSdfMSFpηp2
AFR44.83222.41675.00<0.0010.96
Type0.350.061.800.1270.13
Group1.8711.8756.30<0.0010.48
AFR × Type0.19100.020.570.8280.09
Group × AFR4.2422.1263.80<0.0010.68
Type × Group0.1750.031.000.4240.08
AFR × Type × Group0.44100.041.320.240.18
Residuals1.99600.03
Table 6. Mixed-factorial 6 × 3 × 2 ANOVAs on the aesthetic sound quality attributes.
Aesthetic Items
SSdfMSFpηp2 SSdfMSFpηp2
Broken–FunctioningMechanical–Natural
AFR2.9321.465.090.0090.15AFR3.2621.6311.77<0.0010.28
Type4.0550.812.820.0240.19Type4.2850.866.19<0.0010.34
Group2.812.89.740.0030.14Group0.3210.322.320.1330.04
AFR × Type0.66100.070.230.9920.04AFR × Type0.54100.050.390.9460.06
Group × AFR2.9621.485.150.0090.15Group × AFR1.0620.533.840.0270.11
Type × Group2.2550.451.570.1830.12Type × Group2.9750.594.290.0020.26
AFR × Type × Group0.42100.040.150.9990.02AFR × Type × Group1.18100.120.850.5820.12
Residuals17.25600.29 Residuals8.3600.14
Low Quality–High QualityUnpleasant–Pleasant
AFR1.0620.532.190.1200.07AFR11.6925.8528.41<0.0010.49
Type1.5650.311.290.2800.10Type2.4650.492.390.0480.17
Group4.3714.3718.02<0.0010.23Group1.2911.296.250.0150.09
AFR × Type0.25100.030.111.000.02AFR × Type0.22100.020.1110.02
Group × AFR12.726.3526.18<0.0010.47Group × AFR5.5222.7613.4<0.0010.31
Type × Group2.2650.451.860.1150.13Type × Group5.3851.085.23<0.0010.3
AFR × Type × Group1.01100.10.420.9330.07AFR × Type × Group0.27100.030.130.9990.02
Residuals14.55600.24 Residuals12.35600.21
Annoying–Not AnnoyingDull–Clear
AFR21.99210.9948.44<0.0010.62AFR2.6521.324.920.0110.14
Type1.7250.341.510.1990.11Type1.2550.250.930.4680.07
Group0.1910.190.840.3640.01Group0.0310.030.120.7320.00
AFR × Type0.69100.070.30.9780.05AFR × Type3.15100.321.170.3280.16
Group × AFR9.1624.5820.18<0.0010.40Group × AFR15.5827.7928.95<0.0010.49
Type × Group6.1951.245.45<0.0010.31Type × Group3.9750.792.950.0190.20
AFR × Type × Group0.38100.040.170.9980.03AFR × Type × Group1.55100.150.570.8280.09
Residuals13.62600.23 Residuals16.15600.27
Table 7. Mixed-factorial 6 × 3 × 2 ANOVAs on the loudness sound quality attributes.
Loudness Items
SSdfMSFpηp2 SSdfMSFpηp2
Soft–LoudFlat–Rough
AFR115.57257.79358.11<0.0010.92AFR19.2529.6285.72<0.0010.74
Type1.6550.332.050.0850.15Type0.3250.060.570.7240.05
Group8.7218.7254.03<0.0010.47Group1.5111.5113.44<0.0010.18
AFR × Type0.36100.040.220.9930.04AFR × Type0.57100.060.510.8760.08
Group × AFR6.4323.2219.94<0.0010.40Group × AFR1.8220.918.11<0.0010.21
Type × Group0.6250.120.770.5770.06Type × Group0.6950.141.230.3060.09
AFR × Type × Group1.29100.130.80.6300.12AFR × Type × Group1.7100.171.520.1560.20
Residuals9.68600.16 Residuals6.74600.11
Weak–PowerfulQuiet–Noisy
AFR77.16238.58191.69<0.0010.86AFR61.75230.88383.19<0.0010.93
Type0.950.180.90.4880.07Type3.6450.739.02<0.0010.43
Group4.9114.9124.38<0.0010.29Group0.1410.141.710.1960.03
AFR × Type0.33100.030.170.9980.03AFR × Type0.35100.040.440.9200.07
Group × AFR3.4821.748.64<0.0010.22Group × AFR18.7729.38116.45<0.0010.80
Type × Group0.6150.120.610.6960.05Type × Group3.9450.799.79<0.0010.45
AFR × Type × Group0.78100.080.390.9470.06AFR × Type × Group0.34100.030.420.9320.07
Residuals12.08600.2 Residuals4.83600.08
Deep–Sharp
AFR2.921.4514.7<0.0010.33
Type1.2650.252.550.0370.18
Group0.6610.666.660.0120.10
AFR × Type0.78100.080.790.6400.12
Group × AFR0.0520.020.250.7790.01
Type × Group0.9750.191.960.0970.14
AFR × Type × Group0.44100.040.440.9190.07
Residuals5.92600.1
Table 8. Mixed-factorial 4 × 2 ANOVAs on the aesthetic dimension.
Aesthetic
SSdfMSFpηp2
SNR10.9133.6417.18<0.0010.37
Group0.910.904.280.0420.05
SNR × Group0.9830.331.540.2100.05
Residuals18.62880.21
Table 9. Mixed-factorial 4 × 2 ANOVAs on the loudness dimension.
Loudness
SSdfMSFpηp2
SNR1.0430.350.500.6850.02
Group1.1911.191.710.1950.02
SNR × Group0.1230.040.060.9820
Residuals61.13880.69
Table 10. Mixed-factorial 4 × 2 ANOVAs on the aesthetic sound quality attributes.
Aesthetic Items
SSdfMSFpηp2 SSdfMSFpηp2
Broken–FunctioningMechanical–Natural
SNR14.6934.924.51<0.0010.46SNR7.3332.4414.34<0.0010.33
Group2.212.211.010.0010.11Group0.5910.593.490.0650.04
SNR × Group0.6530.221.080.3620.04SNR × Group1.1730.392.290.0840.07
Residuals17.57880.20 Residuals14.99880.17
Low Quality–High QualityUnpleasant–Pleasant
SNR10.6433.5512.64<0.0010.3SNR11.0133.6711.54<0.0010.28
Group3.8713.8713.77<0.0010.14Group1.9611.966.170.0150.07
SNR × Group0.4630.150.540.6540.02SNR × Group2.5430.852.660.0530.08
Residuals24.7880.28 Residuals27.98880.32
Annoying–Not AnnoyingDull–Clear
SNR10.4433.486.78<0.0010.19SNR12.6534.2212.98<0.0010.31
Group0.0110.010.020.8890Group0.310.300.930.3380.01
SNR × Group3.1131.042.020.1170.06SNR × Group2.2830.762.340.0790.07
Residuals45.17880.51 Residuals28.58880.32
Table 11. Mixed-factorial 4 × 2 ANOVAs on the loudness sound quality attributes.
Loudness Items
SSdfMSFpηp2 SSdfMSFpηp2
Soft–LoudFlat–Rough
SNR7.4232.471.430.2380.05SNR1.8630.621.670.1800.05
Group5.8215.823.380.0700.04Group1.211.23.220.0760.04
SNR × Group0.5230.170.10.9600SNR × Group0.7430.250.660.5780.02
Residuals151.59881.72 Residuals32.73880.37
Weak–PowerfulQuiet–Noisy
SNR7.4732.492.120.1030.07SNR3.2331.080.930.4310.03
Group3.6213.623.080.0830.03Group0.5510.550.470.4940.01
SNR × Group0.6630.220.190.9050.01SNR × Group2.530.830.720.5440.02
Residuals103.42881.18 Residuals102.28881.16
Deep–Sharp
SNR3.931.312.17<0.0010.29
Group0.6110.615.70.0190.06
SNR × Group0.330.10.950.4220.03
Residuals9.4880.11
Disclaimer/Publisher’s Note: The statements, opinions and data contained in all publications are solely those of the individual author(s) and contributor(s) and not of MDPI and/or the editor(s). MDPI and/or the editor(s) disclaim responsibility for any injury to people or property resulting from any ideas, methods, instructions or products referred to in the content.

