Abstract
Vacuum cleaners are one of the most widely used household appliances associated with unpleasant noises. Previous studies have indicated the severity of loud vacuum cleaner noise and its impact on the users nearby. The standalone quantified measurements of the generated noise are not sufficient for properly characterizing vacuum cleaners. Human perception should also be included for a better assessment of the quality of sound. A hybrid approach such as psychoacoustics analysis, which comprises subjective and objective evaluations of sounds, has recently been widely used. This paper focuses on the experimental assessment of vacuum cleaner noise and evaluates their psychoacoustical matrices. Three vacuum cleaners with different specifications have been selected as test candidates, and their sound qualities have been analyzed. Statistical analysis, ANOVA, has been performed in order to investigate the effectiveness of individual psychoacoustic metrics.
1. Introduction
Electromechanical home appliances are being used in almost every house, such as fans, hair driers, grinders, juicers, microwave ovens, and vacuum cleaners. The vacuum cleaner is one of the most frequently used home appliances, generating unpleasant noise during operations. Many people ignore one crucial aspect, namely the noise level rating, when buying a vacuum cleaner. The noise is mainly emitted from the built-in suction units of the vacuum cleaners, exhaust fan, airflow, and the surface vibrations during the operation [1]. The suction unit generally consists of a driving electric motor and a centrifugal blower. A vanned diffuser is installed in the hose in some equipment to achieve a high-pressure rise during the operation. A detailed description of typical vacuum cleaner noise generation source(s) can be found in various publications [2,3,4,5]. The sound pressure level of working vacuum cleaners varies from 65 dB (A) to 90 dB (A). Long-term exposure to excessive levels of noise ≥80 dB (A) can result in adverse human health issues, such as mental stress, fatigue, psychological disorders, hearing loss, high blood pressure, coronary heart disease, sleeping disorder, hypertension, obesity, cognitive impairment in children, and diabetic type I and II [6,7,8]. The risk is typically low for regular usage, but extended professional cleaners will be exposed to higher risks.
The European Union (EU) recently released eco-design regulation guidelines related to energy consumption and noise levels for vacuum cleaners. The maximum motor and peak noise levels for any vacuum cleaners in operation are limited to 900 W and 80 dB (A), respectively [9,10]. However, manufacturers have reported their concerns for the full implementation of those directives because the noise levels are sometimes psychologically misinterpreted by the users to be indicative of the cleaning capacity of the vacuum cleaners. Symanczyk [11] pointed out the paradox with vacuum cleaner sounds: “you can make them very silent, but then they will not be perceived as very powerful”. Some vacuum cleaners that failed to meet EU guidelines are still available in the market for sale [12]. In recent times, the European Union has released strict directives for vacuum cleaner manufacturers to reduce operating noise. Moreover, the International Labor Organization (ILO) (Geneva, Switzerland) has regularly suggested that employers should regularly monitor vacuum cleaner noise. If noise is intrusive, employers will probably need to find a solution to the noise [13].
Owing to these international regulations, a comprehensive assessment of sound quality for commercial vacuum cleaners is necessary. In this regard, several research studies have been reported [14]. Researchers started from the measurement of sound pressure levels of the generated noise and assessed the performance of the equipment as per international regulations ( of the 8 h daily occupational noise exposure). However, the standalone sound pressure level data are not sufficient for the conclusion made for the noise severity levels because human perception of the surrounding noise differs from the quantified sound levels. The human perception of sound considers subjective and objective elements and may vary from person to person. Apart from the sound intensity of the noise, other subjective parameters, such as environmental conditions and psychoacoustical parameters (loudness, sharpness, roughness, fluctuation strength, and tonality), need to be incorporated in the sound quality assessments [15,16].
Psychoacoustic parameters are used to describe different noises caused by the different subjective feelings about objective physical quantities [17]. In recent years, psychoacoustical studies have become more common for household appliances, including vacuum cleaners [18,19], hairdryers [20], fan noise [21], washing machine noise [22], air conditioning, and refrigeration equipment noise [23]. In addition, psychoacoustic metrics have been used for other noise sources such as dental equipment noise [24] and centrifugal pumps [25]. Ih et al. [19] experimentally investigated the product sound quality of the vacuum cleaner. First, the Taguchi orthogonal array method, an experimental design technique, was utilized to assess the frequency range that described the sound quality of the vacuum cleaners. Then, a psychoacoustic model ‘annoyance index’ was developed by using linear regression analysis. The developed model was further validated by the artificial neural network (ANN), which is an artificial intelligence-based technique. Takada et al. [20] conducted a psychoacoustic assessment for the economic evaluation of the sound quality index for vacuum cleaners and hair dryers. Conjoint analysis was used to evaluate the buying willingness of these items based on generated noise. It was reported that an individual’s purchasing willingness increased for the equipment with lower values of sound pressure level and sharpness. Rukat et al. [5] investigated the effect of operating conditions on vacuum cleaner noise. They reported that the vacuum cleaner emitted a higher noise level while working on a flat surface such as terracotta than working on the carpet. Their conclusion was based on the measurement of A-weighted sound pressure levels of the tested vacuum cleaners. Novakovic et al. [26] investigated the sound quality of the vacuum cleaner’s suction unit, which is the main element of noise generation. Jeong et al. [27] investigated the sound quality index of six commercial vacuum cleaners available in Korea. More recently, Hatta et al. [28,29] performed a subjective evaluation test to assess the robot vacuum cleaner sound. The experiment was conducted under two different hearing settings called ‘active’ and ‘passive’. In an active setting, the participant was aware of the vacuum cleaning operation while the passive participant was unaware of the vacuum cleaner operation, and the noise was perceived in passive mode. The result revealed that the participants felt more uncomfortable in the passive condition than the active condition. These reported works confirm the broad applications of the psychoacoustic assessment of noise.
In this work, we have performed an experimental assessment of the psychoacoustic characteristics of commercially available household vacuum cleaners. Three dry-type vacuum cleaners from different manufacturers are selected, and their acoustic performances have been investigated. In the study, we first measured the noise levels generated from the chosen vacuum cleaners. Then, the recorded data were used to evaluate psychoacoustic matrices, namely loudness, sharpness, roughness, and fluctuation strength.
2. Psychoacoustic Factors: Definitions
2.1. Loudness
Loudness is one of the essential subjective parameters of psychoacoustic analysis. Loudness is slightly different from the sound amplitude. The sound amplitude is a measured sound intensity in decibel value, whereas loudness is the psychological aspect of the measured sound pressure level. The microphone-perceived sound quantifies the former, and the latter involves the human perception of the sound. Interestingly, the human ear can perceive different frequencies at different sound pressure levels as equally loud. This is due to the differing sensitivity of the human ear within the hearing domain. In 1933, Fletcher–Munson developed equal loudness curves to accurately define perceived loudness across all frequency spectrums within the human hearing domain. The loudness level of a sound is the sound pressure level of a 1 kHz tone in a plane wave and frontal incident that is as loud as the sound [30]. It is expressed in phon or sone. The is a unit of loudness representing equal loudness to a 1000 Hz pure tone, whereas sones are defined as the loudness perceived by typical listeners when confronted with a 1000 Hz tone at a sound pressure level of 40 phon. The loudness level in sones can be calculated from the relation . The loudness calculation is made by various international standards, such as ISO 532-1:2017 and DIN 45631, which are also available in multiple inbuilt sound processing software.
2.2. Sharpness
Sharpness delineates the human sensation caused by high-frequency components of the noise. The unit of sharpness (S) is . A narrow band noise at 1 kHz with a bandwidth of <150 Hz and a sound level of 60 dB is defined as one . The variability of sharpness depends upon the specific loudness distribution of the sound. It is calculated as a weighted area of loudness from the following relation [30]:
where is the specific loudness that exhibits the loudness distribution across the critical-bands, is the weighting function, and is the critical-band rate defined by Eberhardt Zwicker.
2.3. Fluctuation Strength and Roughness
When multiple tones are modulated or combined to form a single sound, the sound level rises and falls over time. These sound level fluctuations arise from the constructive and destructive interferences of the tones for a different frequency. Examples of such sounds could be the siren from an ambulance or the rumbling of a car engine. The amount of sound modulation determines the sensation that is perceived by the human ear. This sensation can be modeled by two analytical parameters: fluctuation strength and roughness [14]. These psychoacoustic matrices quantify the amount of sound modulation based on the following aspects: modulation frequency—the number of rises and falls in the sound per sound; and modulation level—the perceived magnitude level change over time.
The fluctuation strength describes 20 modulations per second or less (between 0.5 and 20 Hz). The roughness is perceived as the sensation of rapidly modulated sound or vibration in the modulation range between 20 and 300 times per second (20–300 Hz). In terms of the human hearing domain, the ear can pick up modulations below 20 Hz and anything beyond it perceived as a stationary and rough tone. These two metrics can invoke individual sensory perceptions. For instance, a tone with high fluctuation strength is regarded as an alert (fire alarms and sirens).
By contrast, high roughness has been used in automotive industries to accentuate the sportiness of the vehicle. The units used to describe fluctuation strength (F) and roughness (R) are and , respectively. One is defined as a tone with a sound pressure level of 60 dB at 1 kHz modulated by 100% at a modulation frequency of 4 Hz. On the other hand, one represents the roughness produced by a pure tone at 1000 Hz and with a SPL of 60 dB, which is modulated by 100% modulation depth and modulation frequency () of 70 Hz.
The roughness of sound can be estimated from the following equation [30]:
and the fluctuation strength is determined from the following equation:
where is the perceived masking depth and is the calibration factor.
3. Experimental Layout and Methods
3.1. Test Environment
The experiment was carried out in a Vibration/Dynamics Laboratory room located at the National University of Singapore. The room was 5.9 m × 8.3 m in size with two doors and several cabinets surrounding three sides of the walls. There were four tables in the room, and various equipment was placed onto the tables. Figure 1a shows the floor plan and the photo of the test room. The room was selected for noise assessment since it possessed similar size and obstructions to a living room, representing a typical operating environment for a vacuum cleaner. However, in order to avoid any interference, the room condition was kept constant throughout the measurement. Moreover, the external noise was minimum and confirmed by the sound level meter.
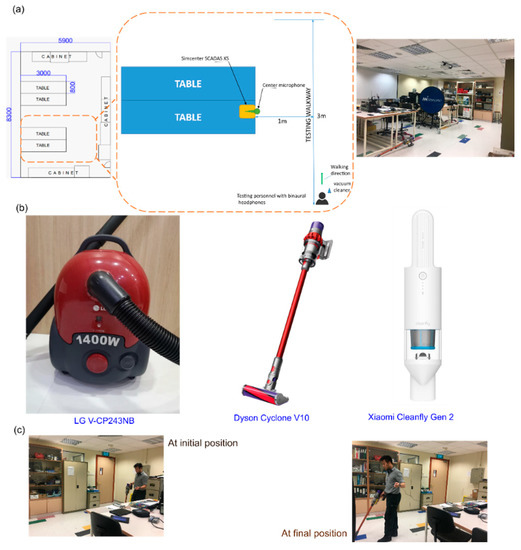
Figure 1.
(a) Schematics of experimental setup plan. (b) Photographs of the three different vacuum cleaners. LG V-CP243NB (model type 1), Dyson Cyclone V10 (model type 2), and Xiaomi Cleanfly Gen2 (model type 3). (c) Photographs of the testing room displaying the vacuum cleaner positions.
3.2. Test Appliances
Three different manufacturers of dry-type vacuum cleaners were selected for the psychoacoustic studies. The manufacturers launched the selected vacuum cleaners in three different periods. The LG V-CP243NB is the oldest model, while the Dyson Cyclone V10 and Xiaomi models are recently launched. Figure 1b shows photographs of the selected models. LG V-CP243NB is a traditional vacuum cleaner that includes a suction unit on the sled and a flexible hose for transporting the dust. The power consumption is 1400 W with a single power setting. Dyson Cyclone V10 is an upright vacuum cleaner known for its fourteen patented concentric cyclone feature that allows efficient and accelerated airflows for capturing microscopic particles as small as 0.3 microns. Their digital motor consumes 525 W to generate 125,000 rpm motor speed for 151 air watts suction power. It comes with three power settings to suit different tasks, and the running time is up to 60 min. The overall weight of the device is 2.5 kg. The Xiaomi Cleanfly Gen 2 is a portable wireless handheld vacuum cleaner. It consists of a brushless DC motor with a maximum rotation speed of 100,000 rpm with a total power consumption of 120 W. The Xiaomi Cleanfly comes with two-speed settings for different applications. It can develop a maximum suction pressure of 16.8 kPa and a compact design with an overall weight of 560 g. The product specifications of these three vacuum cleaners are listed in Table 1.

Table 1.
Product specifications of the used vacuum cleaners.
3.3. Test Equipment and Signal Processing
A handheld data acquisition system recorded ambient and vacuum cleaner noise (The Simcenter SCADAS XS-Siemens®). It can acquire dynamic data simultaneously at 50,000 samples per second on up to 12 active channels. The portable hardware was connected with a binaural headset and a central microphone. The central microphone was kept over the SCADAS instrument. The headset was equipped with two microphones positioned at both ears to conduct binaural recordings. A ¼” pressure field central microphone (PCB) was also connected with the data acquisition system. The data recorded from the binaural headset reflected the noise influence on the vacuum cleaner user. At the same time, the regular microphone was used to capture the noise effect from the vacuum cleaner to the surrounding occupants. The SCADAS system was remotely controlled by the Simcenter Testlab Scope App software installed on an Android-based Samsung tablet. The recorded data were post-processed in the LMS test lab software (Siemens®), and psychoacoustic factors were evaluated.
For the noise measurements of the vacuum cleaners, the walking test was preferred over the static test. This is because suction noise and the noise generated from the interaction between the vacuum cleaner and the floor are both considered in the walking test methods. On the other hand, only suction noise is measured in the static test. A SCADAS XS and a central microphone were placed on the table (Figure 1a). The central microphone was used to investigate the noise annoyance towards the surrounding occupants. Moreover, a set of binaural headphones was placed on the test personnel’s shoulder to recreate the sound disturbance perceived by the user. The central microphone was kept at a distance of 1 m away from the walkway. The operator’s walking distance was limited to 3 m. The microphones were calibrated by using a standard sound calibrator. The test personnel operated the vacuum cleaners while walking at a linear distance of 3 m, and the noise was recorded. Prior to this, background noise was first recorded in the same experimental condition, and the results were used for comparison with the acoustic characteristics for a vacuum cleaner noise. Table 2 enlists the annotations used to represent the microphones and motor speed settings.
Table 2.
Annotations used in the study.
For equivalent sound pressure level calculations, a total of 20 sound pressure level readings (SPL) were recorded at an interval of 30 s in 10 min, and their minimum and maximum SPL were calculated. From these data, the equivalent continuous noise levels were calculated by using the following expressions , where is the number of observations in the reference time interval and is the sampled values of the pressure level in decibels [32].
4. Results and Discussion
4.1. Acoustical Performances
Figure 2a–e depicts the measured A-weighted sound levels spectra (one-third octave) for the three different vacuum cleaners: model type 1, model type 2, and model type 3, respectively. All measurements were performed at the same venue, under similar environmental conditions, and by the same person. Each experiment was repeated ten times, and their average values have been considered in the study. As shown in Figure 2a, the noise level of the model type 1 vacuum cleaner is at the maximum in the mid-range frequencies (500–2000 Hz). The Equivalent pressure levels for C1, C2, and C3 are 77.4 dB, 90.4 dB, and 80.6 dB, respectively. In model type 2, the maximum noise level is observed in the mid-frequency range at both speed settings. Moreover, as shown in Figure 2b, the equivalent pressure levels are measured to be 69.8 dB, 86.2 dB, and 70.7 dB for C1, C2, and C3 in the minimum setting, respectively. As shown in Figure 2c, the equivalent sound levels are 75.4 dB, 94.8 dB, and 76.3 dB for C1, C2, and C3 in the maximum setting, resepctively. Figure 2d,e shows the sound pressure level spectrum obtained from the model type 3 vacuum cleaner. It is observed that the maximum sound level values lie within mid-range frequencies in both speed settings S1 and S2. The is 64.1 dB, 79.6 dB, and 70.4 dB for C1, C2, and C3 in the minimum setting, while the is 71.2 dB, 90.0 dB, and 79.2 dB for C1, C2 and C3 in the maximum setting.
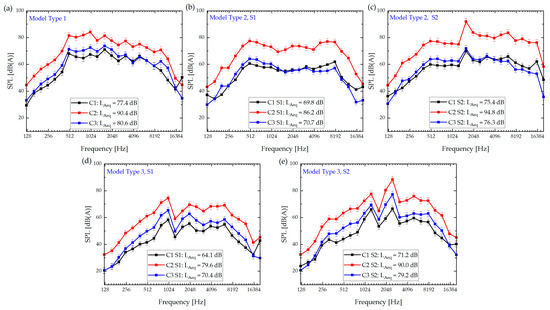
Figure 2.
Sound pressure level spectra of three different vacuum cleaners: (a) Model type 1, (b) Model type 2 at minimum speed setting S1, (c) Model type 2 at maximum speed setting S2, (d) Model type 3 at minimum speed setting S1, (e) Model type 3 at maximum speed setting S2. All data are plotted on a log2 scale.
4.2. Psychoacoustic Performance
Figure 3, Figure 4 and Figure 5 shows the results of psychoacoustic metrics (loudness, sharpness, fluctuation strength, and roughness) obtained from the recorded sound levels of vacuum cleaner units. Figure 3a shows that the maximum perceived sound intensity is at the user’s right ear and is about 109 sone, as it was located near to the vacuum cleaner (model type 1). Moreover, the user’s left ear C3 experienced slightly higher loudness than the surrounding occupants C1. Furthermoer, C1 has larger sharpness values than C2 and C3, implying that the sharpness was the highest for the surrounding occupants (Figure 3b). In Figure 3c, the user’s right ear (C2) encounters the highest roughness value in the 30–300 Hz modulation frequency. Furthermore, the fluctuation strengths captured are nearly identical in all microphones.
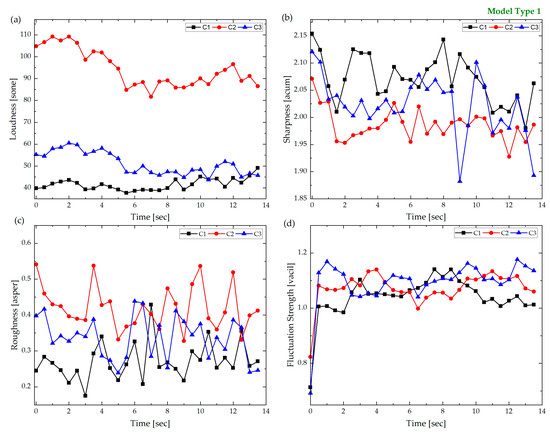
Figure 3.
Psychoacoustic parametric values for the vacuum cleaner (model type 1). (a) Loudness, (b) sharpness, (c) roughness, and (d) fluctuation strength.
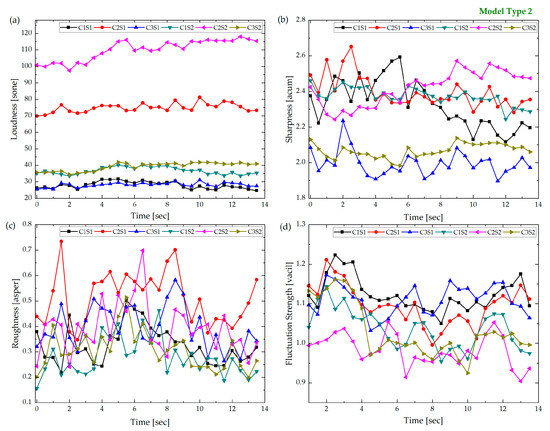
Figure 4.
Psychoacoustic parametric values for the vacuum cleaner (model type 2). (a) Loudness, (b) sharpness, (c) roughness, and (d) fluctuation strength.
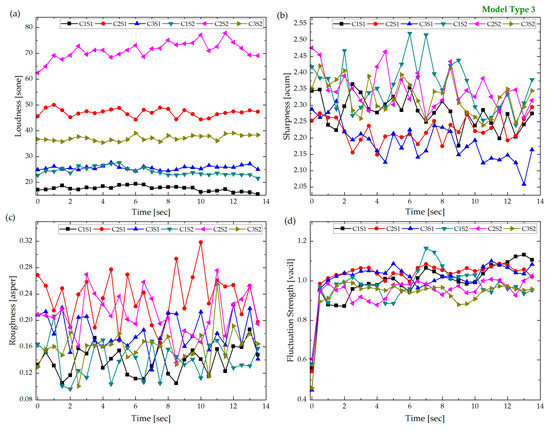
Figure 5.
Psychoacoustic parametric values for the vacuum cleaner (model type 3). (a) Loudness, (b) sharpness, (c) roughness, and (d) fluctuation strength.
The model type 2 surprisingly revealed a maximum loudness value of 118 sones to the user’s right ear at the maximum speed setting S2. A second highest perceived sound intensity was observed at the user’s right ear but in the minimum rotation speed setting S1 (Figure 4a). The other two microphones, C1 and C3, have a slight variation in their loudness values in both speed settings. Furthermore, as shown in (Figure 4b), the sharpness value for the C3 microphone was the lowest over the period at lower speed setting S1, while for the right ear microphone C2, the sharpness value was higher than that of C1 except for few periods. A similar trend was observed at a higher speed setting S2. Since the user had kept the vacuum cleaners on the right hand during the operation, the lower sharpness value for the left ear’s C3 microphone may be attributed to the lower sharpness value. Moreover, there was no statistically significant difference in roughness values between each configuration (Figure 4c). The user’s right ear microphone attained the slightly higher roughness value of recorded sound at both speed settings. Since the roughness varies with time, it may be possible that the variation with time had a more significant effect than the difference in motor speed and recording position (listening position) compared to other psychoacoustic parameters.
Similarly, as shown in Figure 4d, the fluctuation strength values were not significantly dependent on the microphone positions. However, some variations in measured values were observed with time. Their difference in fluctuation strength was within 0.25 vacil.
For the third vacuum cleaner system (model type 3), the highest loudness value of 78 sones is recorded in C2 for both speed settings (Figure 5a). It can be observed that the sound intensity perceived by the user’s right ear C2 is higher than by the left ear C3 and surrounding occupants C1 regardless of the equipment types and speed settings. For sharpness values, the occupant’s microphone C1 was perceived to be the highest among all microphones at each set (Figure 5b). While for the right and left ear microphones, the sharpness values were not significantly different. However, some significant peaks could be observed at several periods.
Similarly to the model type 2 vacuum cleaners, the roughness (Figure 5c) and fluctuation strength (Figure 5d) depended on the operation time for the model type 3 system. These parameters did not deviate much between different locations and speeds, indicating that they have close amplitude variations.
4.3. Comparative Analysis
Figure 6 presents the comparative results of psychoacoustics parameters for three vacuum cleaners. As shown from Figure 6a, model type 1 produced the highest loudness for the surrounding occupants C1 (41.5 sone), followed by model type 2 (36.7 sone) and model type 3 (17.6 sone) at the maximum and the minimum settings. In addition, the loudness captured at the right-side ear mic C2 was higher than the left ear mic C3. Since the vacuum cleaner was operating on the user’s right hand (Figure 1a), the person’s body might obstruct the path of the sound wave in reaching the left ear. The most substantial loudness impact towards the user’s right ear resulted from model type 2 at the maximum setting (C2S2) with a value of 110 sone.
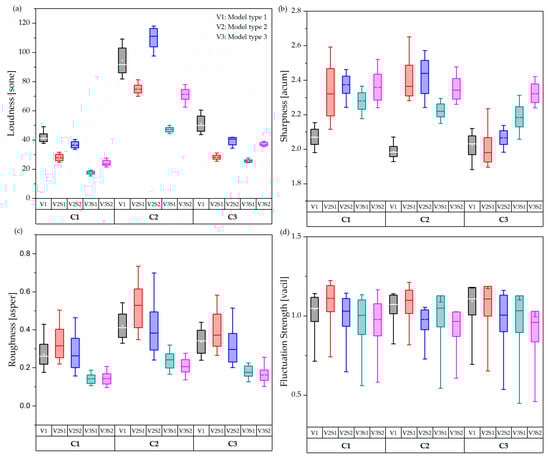
Figure 6.
Comparative psychoacoustic parametric values for different vacuum cleaners with corresponding standard deviations. (a) Loudness, (b) sharpness, (c) roughness, and (d) fluctuation strength. ◊ Mean;− Median.
Loudness is the psychological counterpart to sound pressure level. The sound pressure level is a physical quantity perceived by the microphones, whereas loudness is a psychological quantity perceived by humans. As shown from the loudness spectra, the average loudness values sensed by the right ear for model type 1 and model type 2 vacuum cleaners were higher irrespective of multiple speed ratings. Hence, these vacuum cleaners could be considered as the loudest among them.
Figure 6b shows the average sharpness values perceived by surrounding occupants and the user’s ears. As shown, the average sharpness values perceived by surrounding occupants C1 in the model type 1 system were the lowest (2.07 acum), and model type 2 and model type 3 produced higher sharpness with the respective values of 2.37 acum and 2.35 acum. Moreover, contrary to loudness, the sharpness measurements did not significantly differ between the left and right ears. The average sharpness values measured by C2 and C3 for model type 1 and model type 3 vacuum cleaners at both settings were approximately the same. For example, for model type 3, the sharpness values perceived by the right and left ears were 2.34 acum and 2.33 acum, respectively. However, the average sharpness value in C2 for the model type 2 vacuum cleaner (C2S2) was more significant than that of C3. Right ears received the highest sharpness values for model type 2 vacuum cleaner at both settings. The sharpness measures the annoyance level of high-frequency components in a sound signal. As revealed from the sharpness spectra, the average sharpness value of model type 2 and type-3 vacuum cleaners increased with increased motor speed. By definition [33], it could be comprehended that the high-frequency content of the vacuum cleaner sound increased with the motor speed, resulting in a sharper sound.
Figure 6c shows the average roughness values obtained from the different vacuum cleaners. As shown, the roughness values for model type 3 were almost constant despite different settings across different microphones. Model type 2, however, has shown larger roughness values when operating at the lowest speed rating across all microphones. The sharpness values for model type 2 at S1 were measured to be 0.32 asper (C1), 0.51 asper (C2), and 0.4 asper (C3). The observations across the left and right ears remained similar across all three devices, where the right ear registered the larger roughness values.
The fluctuation strength of the vacuum cleaners exhibited minor variations across each microphone (Figure 6d). The values range from 0.9 to 1.1 vacil for all microphones. Roughness and fluctuation are physical quantities that describe the speed of sound signal change. A low variation in average roughness and fluctuation strength values revealed that the signal changes across the ears and surroundings were at the minimum. Moreover, roughness and fluctuation were not as significant compared to loudness and sharpness. Nevertheless, these factors could show the subjective feeling of vacuum cleaner noise to a certain extent [17].
4.4. Statistical Analysis
A statistical test, namely the analysis of variance (ANOVA) [34,35], was performed to investigate the characteristics of the vacuum cleaners. The effects of microphone positions and vacuum cleaner types on equivalent sound pressure levels were analyzed using two-way ANOVA. The two-way ANOVA result (Table 3) shows that the microphone positions (C1, C2, and C3) have the main effects on the equivalent sound pressure levels. The main effect plot of for microphone positions and the vacuum cleaner types are shown in Figure 7a,b. As shown, the higher was acquired from the microphone C2 (right ear) than compared to C1 and C2. The microphone C1 recorded the equivalent lowest mean sound pressure level value. The lowest for C1 could be a result of its remote distance from the vacuum cleaner. Furthermore, model type 1 (V1) produced a maximum equivalent sound pressure level (mean values) among the three vacuum cleaners (Figure 7b).
Table 3.
Two-way ANOVA at a confidence interval of 95%.
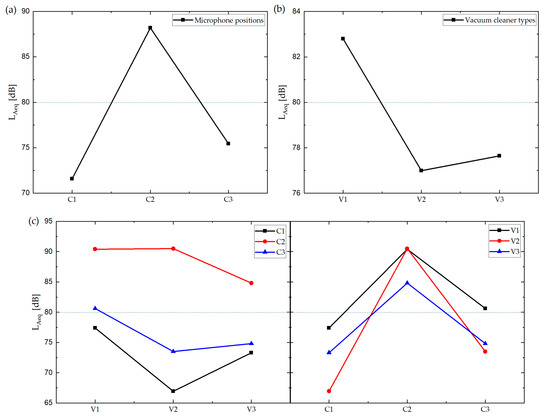
Figure 7.
Main effect plots for (a) microphone positions versus and (b) vacuum cleaner types versus . (c) Interaction plots for equivalent continuous sound levels.
Moreover, as shown in Table 3, the population means of vacuum cleaner types and their interactions were not significant at a confidence level of 95%. Figure 7c shows the interaction effects of the vacuum cleaner types and microphone positions on the mean equivalent sound levels. The interaction plot between the vacuum cleaner types (V’s) and the microphone positions (C’s) suggested that (Figure 7c) the values obtained from C1 (surrounding) and C3 (left ear) microphones were at the maximum for the vacuum cleaner type 1 (V1). Furthermore, the maximum was obtained from the C2 (right ear) microphone for the vacuum cleaner type 2 (V2).
Furthermore, as shown in Table 3, the interaction between both factors was non-significant at a 95% confidence level. In this case, we performed a one-way ANOVA analysis for investigating the variations of microphone positions, vacuum cleaner types, and motor speeds on the psychoacoustic matrices. Table 4 shows the ANOVA results for psychoacoustic matrices. The ANOVA table revealed that, at a significance level of 0.05, the population means of loudness, sharpness, roughness, and fluctuation strengths were significantly different within their subgroups. The high R-square values indicated that all factors were statistically well fitted, except for fluctuation strength (low R2 = 0.27). However, the low p-values confirmed that the main effect of each element was significant. In other words, the difference between some of the factor level means was statistically significant for all aspects.
Table 4.
One-way ANOVA at a confidence interval of 95%.
5. Conclusions
The presented experimental investigations provide exciting information related to the sound quality index of the following vacuum cleaners: LG V-CP243NB (model type 1), Dyson Cyclone V10 (model type 2), and Xiaomi Cleanfly Gen 2 (model type 3). A series of experiments was carried out to measure the noise produced by each vacuum cleaner. Binaural headphones and a condenser microphone emulated the psychoacoustic effect towards the user and the surrounding occupants. Based on the experimental investigations, the following observations were made:
- The average loudness values sensed by the right ear for model type 1 and model type 2 vacuum cleaners were higher irrespective of multiple speed ratings.
- The average sharpness value of model type 2 and type 3 vacuum cleaners increased with increased motor speed.
- A low variation in average roughness and fluctuation strength values revealed that the signal changes across the ears and surroundings were at the minimum.
- Moreover, the psychoacoustic metrics perceived by the user could be different from those that are within the proximity of the appliance.
- The ANOVA analysis revealed that microphone positions have a significant contribution to the equivalent sound pressure levels.
The presented investigations may provide a valuable contribution to the assessment of vacuum cleaner noise and may help develop a better appliance with permissible noise levels. Moreover, by considering the human perception of vacuum cleaner noise, a relationship could be created between subjective and objective studies. The integrated model can then be used to predict the sound quality index of vacuum cleaners. The studies could be extended to different models of vacuum cleaners and also wet-type vacuum cleaners.
Author Contributions
Conceptualization, S.K. and H.P.L.; methodology, W.S.W.; software, S.K. and W.S.W.; validation, S.K., W.S.W. and H.P.L.; formal analysis, S.K. and W.S.W.; investigation, S.K. and W.S.W.; resources, H.P.L.; data curation, W.S.W.; writing—original draft preparation, S.K. and W.S.W.; writing—review and editing, S.K.; supervision, H.P.L.; project administration, H.P.L.; funding acquisition, H.P.L. All authors have read and agreed to the published version of the manuscript.
Funding
This research received no external funding.
Institutional Review Board Statement
Not applicable.
Informed Consent Statement
Informed consent was obtained from all subjects involved in the study.
Data Availability Statement
The data presented in this study are available on request from the corresponding authors.
Acknowledgments
The authors would like to mention the contribution of Teng Mingbang (FYP student, NUS Singapore) for assisting us in the experiments and data extraction work.
Conflicts of Interest
The authors declare no conflict of interest.
References
- Altmsoy, E.; Erol, H. An experimental study on vibro-acoustic characteristics of a wet and dry type vacuum cleaner. In Proceedings of the 7th International Congress on Sound and Vibration, Garmisch-Partenkirchen, Germany, 4–7 July 2000. [Google Scholar]
- Čudina, M.; Prezelj, J. Noise generation by vacuum cleaner suction units. Part I. Noise generating mechanisms-An overview. Appl. Acoust. 2007, 68, 491–502. [Google Scholar] [CrossRef]
- Čudina, M.; Prezelj, J. Noise generation by vacuum cleaner suction units. Part II. Effect of vaned diffuser on noise characteristics. Appl. Acoust. 2007, 68, 503–520. [Google Scholar] [CrossRef]
- Čudina, M.; Prezelj, J. Noise generation by vacuum cleaner suction units. Part III. Contribution of structure-borne noise to total sound pressure level. Appl. Acoust. 2007, 68, 521–537. [Google Scholar] [CrossRef]
- Rukat, W.; Jakubek, B.; Madej, A. The noise emitted by a vacuum cleaner treated as a device with extensive sound sources. Vib. Phys. Syst. 2018, 29, 1–8. [Google Scholar]
- Jensen, K.; Hahn, N.E.; Palme, R.; Saxton, K.; Francis, D.D. Vacuum-Cleaner Noise and Acute Stress Responses in Female C57BL/6 Mice (Mus musculus). J. Am. Assoc. Lab. Anim. Sci. 2010, 49, 300–306. [Google Scholar] [PubMed]
- Seidler, A.; Hegewald, J.; Seidler, A.L.; Schubert, M.; Wagner, M.; Dröge, P.; Haufe, E.; Schmitt, J.; Swart, E.; Zeeb, H. Association between aircraft, road and railway traffic noise and depression in a large case-control study based on secondary data. Environ. Res. 2017, 152, 263–271. [Google Scholar] [CrossRef] [PubMed]
- Kumar, S.; Lee, H.P. The Present and Future Role of Acoustic Metamaterials for Architectural and Urban Noise Mitigations. Acoustics 2019, 1, 590–607. [Google Scholar] [CrossRef]
- Commission Regulation (EU). No 666/2013 of 8 July 2013 Implementing Directive 2009/125/EC with Regard to Ecodesign Requirements for Vacuum Cleaners. Off. J. Eur. Union 2013, 285, 1–13. [Google Scholar]
- Knight, M. Noisy Vacuum Cleaners Flout EU Rules–Which? News. Available online: www.which.co.uk/news/2018/03/noisy-vacuum-cleaners-flout-eu-rules/ (accessed on 23 June 2021).
- Symanczyk, A. The Sound of Stuff–Archetypical Sound in Product Sound Design. J. Sonic Stud. 2015, 10. [Google Scholar]
- Sayid, R. Vacuum Cleaner Makers “Flout EU Laws by Still Making Machines That Are as Loud as a Noisy PUB”–Mirror Online. Available online: www.mirror.co.uk/news/uk-news/vacuum-cleaner-makers-flout-eu-12226971 (accessed on 23 June 2021).
- Noise. Labour Administration and Inspection. Available online: www.ilo.org/global/topics/labour-administration-inspection/resources-library/publications/guide-for-labour-inspectors/noise/lang--en/index.htm (accessed on 9 July 2021).
- Fastl, H. The Psychoacoustics of Sound-Quality Evaluation. Acta Acust. United Acust. 1997, 83, 754–764. [Google Scholar]
- Jurc, R.; Jiříĉek, O.; Brothánek, M. Methods for the assessment of pleasantness in sound quality. Noise Control Eng. J. 2010, 58, 62–66. [Google Scholar] [CrossRef]
- Lipar, P.; Prezelj, J.; Šteblaj, P.; Rejec, J.; Čudina, M. Psychoacoustic approach used for developing the model of sound pleasantness of vacuum cleaners and suction units based on objective and subjective analysis. In Proceedings of the 5th Congress of the Alps Adria Acoustics Association, Petrčane, Croatia, 12–14 September 2012. [Google Scholar]
- Chen, X.; Lin, J.; Jin, H.; Huang, Y.; Liu, Z. The psychoacoustics annoyance research based on EEG rhythms for passengers in high-speed railway. Appl. Acoust. 2021, 171, 107575. [Google Scholar] [CrossRef]
- Altmsoy, E.; Kanca, G.; Belek, H.T. A comparative study on the sound quality of wet and dry type vacuum cleaners. In Proceedings of the Sixth International Congress on Sound and Vibration, Lyngby, Denmark, 5–8 July 1999. [Google Scholar]
- Ih, J.G.; Lim, D.H.; Shin, S.H.; Park, Y. Experimental design and assessment of product sound quality: Application to a vacuum cleaner. Noise Control Eng. J. 2003, 51, 244–252. [Google Scholar] [CrossRef]
- Takada, M.; Arase, S.; Tanaka, K.; Iwamiya, S.I. Economic valuation of the sound quality of noise emitted from vacuum cleaners and hairdryers by conjoint analysis. Noise Control Eng. J. 2009, 57, 263–278. [Google Scholar] [CrossRef]
- Schneider, M.; Feldmann, C. Psychoacoustic evaluation of fan noise. In Proceedings of the FAN 2015, Lyon, France, 15–17 April 2015. [Google Scholar]
- Moravec, M.; Ižaríková, G.; Liptai, P.; Badida, M.; Badidová, A. Development of psychoacoustic model based on the correlation of the subjective and objective sound quality assessment of automatic washing machines. Appl. Acoust. 2018, 140, 178–182. [Google Scholar] [CrossRef]
- Sung, W.; Davies, P.; Bolton, J.S. A methodology to modify steady state heating, ventilating, air conditioning and refrigeration equipment noise. In Proceedings of the INTER-NOISE and NOISE-CON Congress Conference, NoiseCon16, Hamburg, Germany, 21–24 August 2016; Institute of Noise Control Engineering: Providence, RI, USA, 2016; pp. 299–306. [Google Scholar]
- Ma, K.W.; Mak, C.M.; Wong, H.M. The perceptual and behavioral influence on dental professionals from the noise in their workplace. Appl. Acoust. 2020, 161, 107164. [Google Scholar] [CrossRef]
- Murovec, J.; Čurović, L.; Novaković, T.; Prezelj, J. Psychoacoustic approach for cavitation detection in centrifugal pumps. Appl. Acoust. 2020, 165, 4–8. [Google Scholar] [CrossRef]
- Novaković, T.; Ogris, M.; Prezelj, J. Validating impeller geometry optimization for sound quality based on psychoacoustics metrics. Appl. Acoust. 2020, 157, 107013. [Google Scholar] [CrossRef]
- Jeong, J.-E.; Yang, I.-H.; Park, G.-D.; Oh, J.-E. Case study for Sound Quality Index of Vacuum Cleaner’ Operating Noise. Trans. Korean Soc. Noise Vib. Eng. 2010, 20, 1223–1228. [Google Scholar] [CrossRef][Green Version]
- Hatta, I.; Okuno, S.; Yoshida, J.; Poveda Martinez, P.; Ramis Soriano, J. Uncomfortableness to vacuum cleaner noise according to the mental state between active and passive situation. In Proceedings of the INTER-NOISE and NOISE-CON Congress Conference, Madrid, Spain, 16–19 June 2019; Institute of Noise Control Engineering: Providence, RI, USA, 2019; pp. 3206–3215. [Google Scholar]
- Yoshida, J.; Hatta, I. Influence of hearing attitude difference on sound quality evaluation of vacuum cleaner sound. Acoust. Sci. Technol. 2021, 42, 46–49. [Google Scholar] [CrossRef]
- Zwicker, E.; Fastl, H. Psychoacoustics: Facts and Models; Springer Science & Business Media: New York, NY, USA, 2013; Volume 22, ISBN 3662095629. [Google Scholar]
- ASTM Standards. Standard Test Method for Measuring Air Performance Characteristics of Vacuum Cleaners; F558-21ASTM; ASTM Standards: West Conshohocken, PA, USA, 2021. [Google Scholar]
- British Standards. Description and Measurement of Environmental Noise, Guide to Quantities and Procedures; BS 7445-1:1991; British Standards Institution: London, UK, 1991. [Google Scholar]
- Sato, S.; You, J.; Jeon, J.Y. Sound quality characteristics of refrigerator noise in real living environments with relation to psychoacoustical and autocorrelation function parameters. J. Acoust. Soc. Am. 2007, 122, 314–325. [Google Scholar] [CrossRef]
- Kumar, S.; Dubey, A.K.; Pandey, A.K. Computer-aided genetic algorithm based multi-objective optimization of laser trepan drilling. Int. J. Precis. Eng. Manuf. 2013, 14, 1119–1125. [Google Scholar] [CrossRef]
- Montgomery, D.C. Design and Analysis of Experiments, 10th ed.; John Wiley & Sons Inc.: New York, NY, USA, 2019; ISBN 978-1-119-49244-3. [Google Scholar]
Publisher’s Note: MDPI stays neutral with regard to jurisdictional claims in published maps and institutional affiliations. |
© 2021 by the authors. Licensee MDPI, Basel, Switzerland. This article is an open access article distributed under the terms and conditions of the Creative Commons Attribution (CC BY) license (https://creativecommons.org/licenses/by/4.0/).