Systematic Review

Assessing the Relationship between Gastrointestinal and Pancreatic Neuroendocrine Tumor Grade and Overall Survival: A Systematic Review and Meta-Analysis

by
Preeti Malik
1,*,†,
Neel Patel
2,
Azadeh Khayyat
3,
Muhammad Asad
4,
Sameer Dawoodi
5,
Sangeetha Chandramohan
6,
Nkechi Unachukwu
7,
Bibimariyam Nasyrlaeva
8,
Laseena Vaisyambath
9,
Sriram B. Chowdary
10,
Vikramaditya Samala Venkata
11 and
Urvish Patel
6,*,†
1
Department of Pathology, Montefiore Medical Center, New York, NY 10467, USA
2
Department of Public Health, Icahn School of Medicine at Mount Sinai, New York, NY 10029, USA
3
Department of Internal Medicine, Brown University, Providence, RI 02903, USA
4
Department of Pathology and Laboratory Medicine, Weill Cornell Medical Center, New York Presbyterian Hospital, New York, NY 10065, USA
5
Department of Internal Medicine, Yale New Haven Health, Bridgeport Hospital, Bridgeport, CT 06610, USA
6
Department of Internal Medicine, MPH, Icahn School of Medicine at Mount Sinai, New York, NY 10029, USA
7
Department of Internal Medicine, Interfaith Medical Center, Brooklyn, NY 11213, USA
8
Department of Pathology, Siparadigm Diagnostic Informatics, Pine Brook, NJ 07058, USA
9
Department of Medicine, Markham Stouffville Hospital, Markham, ON L3P7P3, Canada
10
Department of Internal Medicine, Geisinger Community Medical Center, Scranton, PA 18510, USA
11
Department of Internal Medicine, Cheshire Medical Center, Dartmouth Hitchcock Medical Center, Keene, NH 03431, USA
*
Authors to whom correspondence should be addressed.
These authors contributed equally to this work.
Gastrointest. Disord. 2023, 5(3), 408-418; https://doi.org/10.3390/gidisord5030033
Submission received: 6 March 2023 / Revised: 6 August 2023 / Accepted: 30 August 2023 / Published: 18 September 2023

Abstract

:
Background: Neuroendocrine tumors (NET) are a rare group of epithelial neoplasms present in the gastrointestinal tract (GI) (67.5%) and bronchopulmonary tree (25.3–30%), and in 15% of cases, their primary sites cannot be identified. Although endoscopic screening, improvements in pathological techniques, and early detection have shown improvements in NET survival rates, the prognosis of advanced, metastatic, and poorly differentiated NET is very poor. In this study, we aimed to evaluate the effect of gastrointestinal and pancreatic (GEPs) NETs’ grade on overall survival. Method: We searched observational studies describing the overall survival or prognostic factors of primary GEP NETs from May 2011–May 2021 following the PRISMA guidelines. Studies describing the effect of primary grade 3 GEP NETs on overall survival were included. A meta-analysis was performed, and a pooled hazard ratio and their 95% confidence interval (95% CI) were obtained. Forest plots were created using random effects models and a sensitivity analysis was performed to account for the heterogeneity. Results: Seven studies with 7692 confirmed patients were included. In our meta-analysis, grade 3 GEP NETs were associated with higher odds of poor survival (pooled HR: 2.73; 95% CI: 1.36–5.47; p = 0.005), with a 92% heterogeneity between studies (p < 0.0001). To account for this heterogeneity, a sensitivity analysis was performed by removing two outlying studies (Fathi et al. and Foubert et al.) on funnel plots. The results after the sensitivity analysis did not change and still showed a significant association of grade 3 with a poor survival (pooled HR: 4.53; 95% CI: 3.54–5.78; p < 0.00001), with no heterogeneity between studies (p = 0.72; I2 = 0%). Conclusions: Our meta-analysis found that grade 3 GEP NETs are associated with poor survival and additional future studies are needed to identify other risk factors associated with poor survival in GEP NETs to improve their mortality.

1. Introduction

Neuroendocrine tumors (NETs) are a rare group of epithelial neoplasms with a presence of single or nests of neuroendocrine cells (NECs) (neuroendocrine differentiation) [1]. According to the American Society of Clinical Oncology (ASCO), NETs are found in the gastrointestinal tract in (67.5%) and bronchopulmonary tree in (25.3–30%) of cases, but in 15% of cases, the primary site cannot be identified [2]. The small intestine (19%), large intestine (20%), stomach (8.7%), and pancreas (7%) are common sites in the gastrointestinal tract [2]. In the United States, the annual incidence of newly diagnosed NET is approximately 2 per 100,000 [3,4]. The increased rates of NETs over the last few decades are mostly attributed to advancements in diagnostic abilities [3]. Dasari et al., a retrospective study using nationally representative data from the Surveillance, Epidemiology, and End Results (SEER) program identified a 6.4-fold increase (1.09 to 6.98 per 100,000) in age-adjusted incidence rates between 1973 and 2012 for early-stage tumors [5]. Through methods such as endoscopic screening and improvements in pathological techniques, in addition to an expansion of data pertaining to the safety and efficacy of treatment modalities, early detection has been shown to be clinically beneficial, as survival rates of patients with a NET have increased over time [1,5,6].
Although diagnostic approaches and survival rates are improving, NETs still present medical challenges which lead to worse overall outcomes compared to those of other types of tumors. NETs first exhibit vague, non-specific symptoms that can make an initial diagnosis difficult. These tumors are typically found incidentally during other surgeries, such as those for bowel wall obstructions or pancreatitis [4]. Because of their nondescript presentation, and the fact that more specific symptoms, including those of carcinoid syndrome (flushing, wheezing, diarrhea, and heart valve issues), appear only at the time of metastasis, the average length of time from tumor onset to diagnosis is nine years [7]. Because metastasis is generally associated with poorer outcomes, the challenge of diagnosing NETs is hypothesized to be the primary reason for their low survival rates (with a 5-year survival rate of 67 percent) [4].
There are a number of published studies that have looked at the survival outcomes and prognostic factors for patients diagnosed with an NET. For example, multiple studies have found negative correlations between worsened clinical outcomes (an increased rate of recurrence and shorter disease-free survival times) and tumor size, staging, and grading [8,9,10]. Other prognostic factors, such as age and gender, are less well-defined and present conflicting data. For example, a study conducted by Folkstead et al. found age, but not gender, to be associated with diminished outcomes, while a study by Rosenblum et al. obtained opposite findings [9,11].
In this study, we aim to evaluate the predictive roles of various prognostic factors in overall survival in gastrointestinal neuroendocrine tumors. In addition to established factors, such as tumor size, staging, and grading, we recognize the significance of other markers, including the Ki-67 marker, which reflects the proliferative potential of a tumor [2]. High Ki-67 indices have been associated with more aggressive behavior and worse prognoses for neuroendocrine tumors, including gastrointestinal and pancreatic NETs [2,3]. Furthermore, we will explore the correlation between lymph node involvement and gastroenteropancreatic neuroendocrine tumors (GEP-NETs), as lymph node metastasis is indicative of tumor aggressiveness and can significantly impact overall survival [4,5]. Overall, we aim to evaluate the predictive roles of various prognostic factors from a wide array of studies on GI neuroendocrine tumors in overall survival.

2. Methods

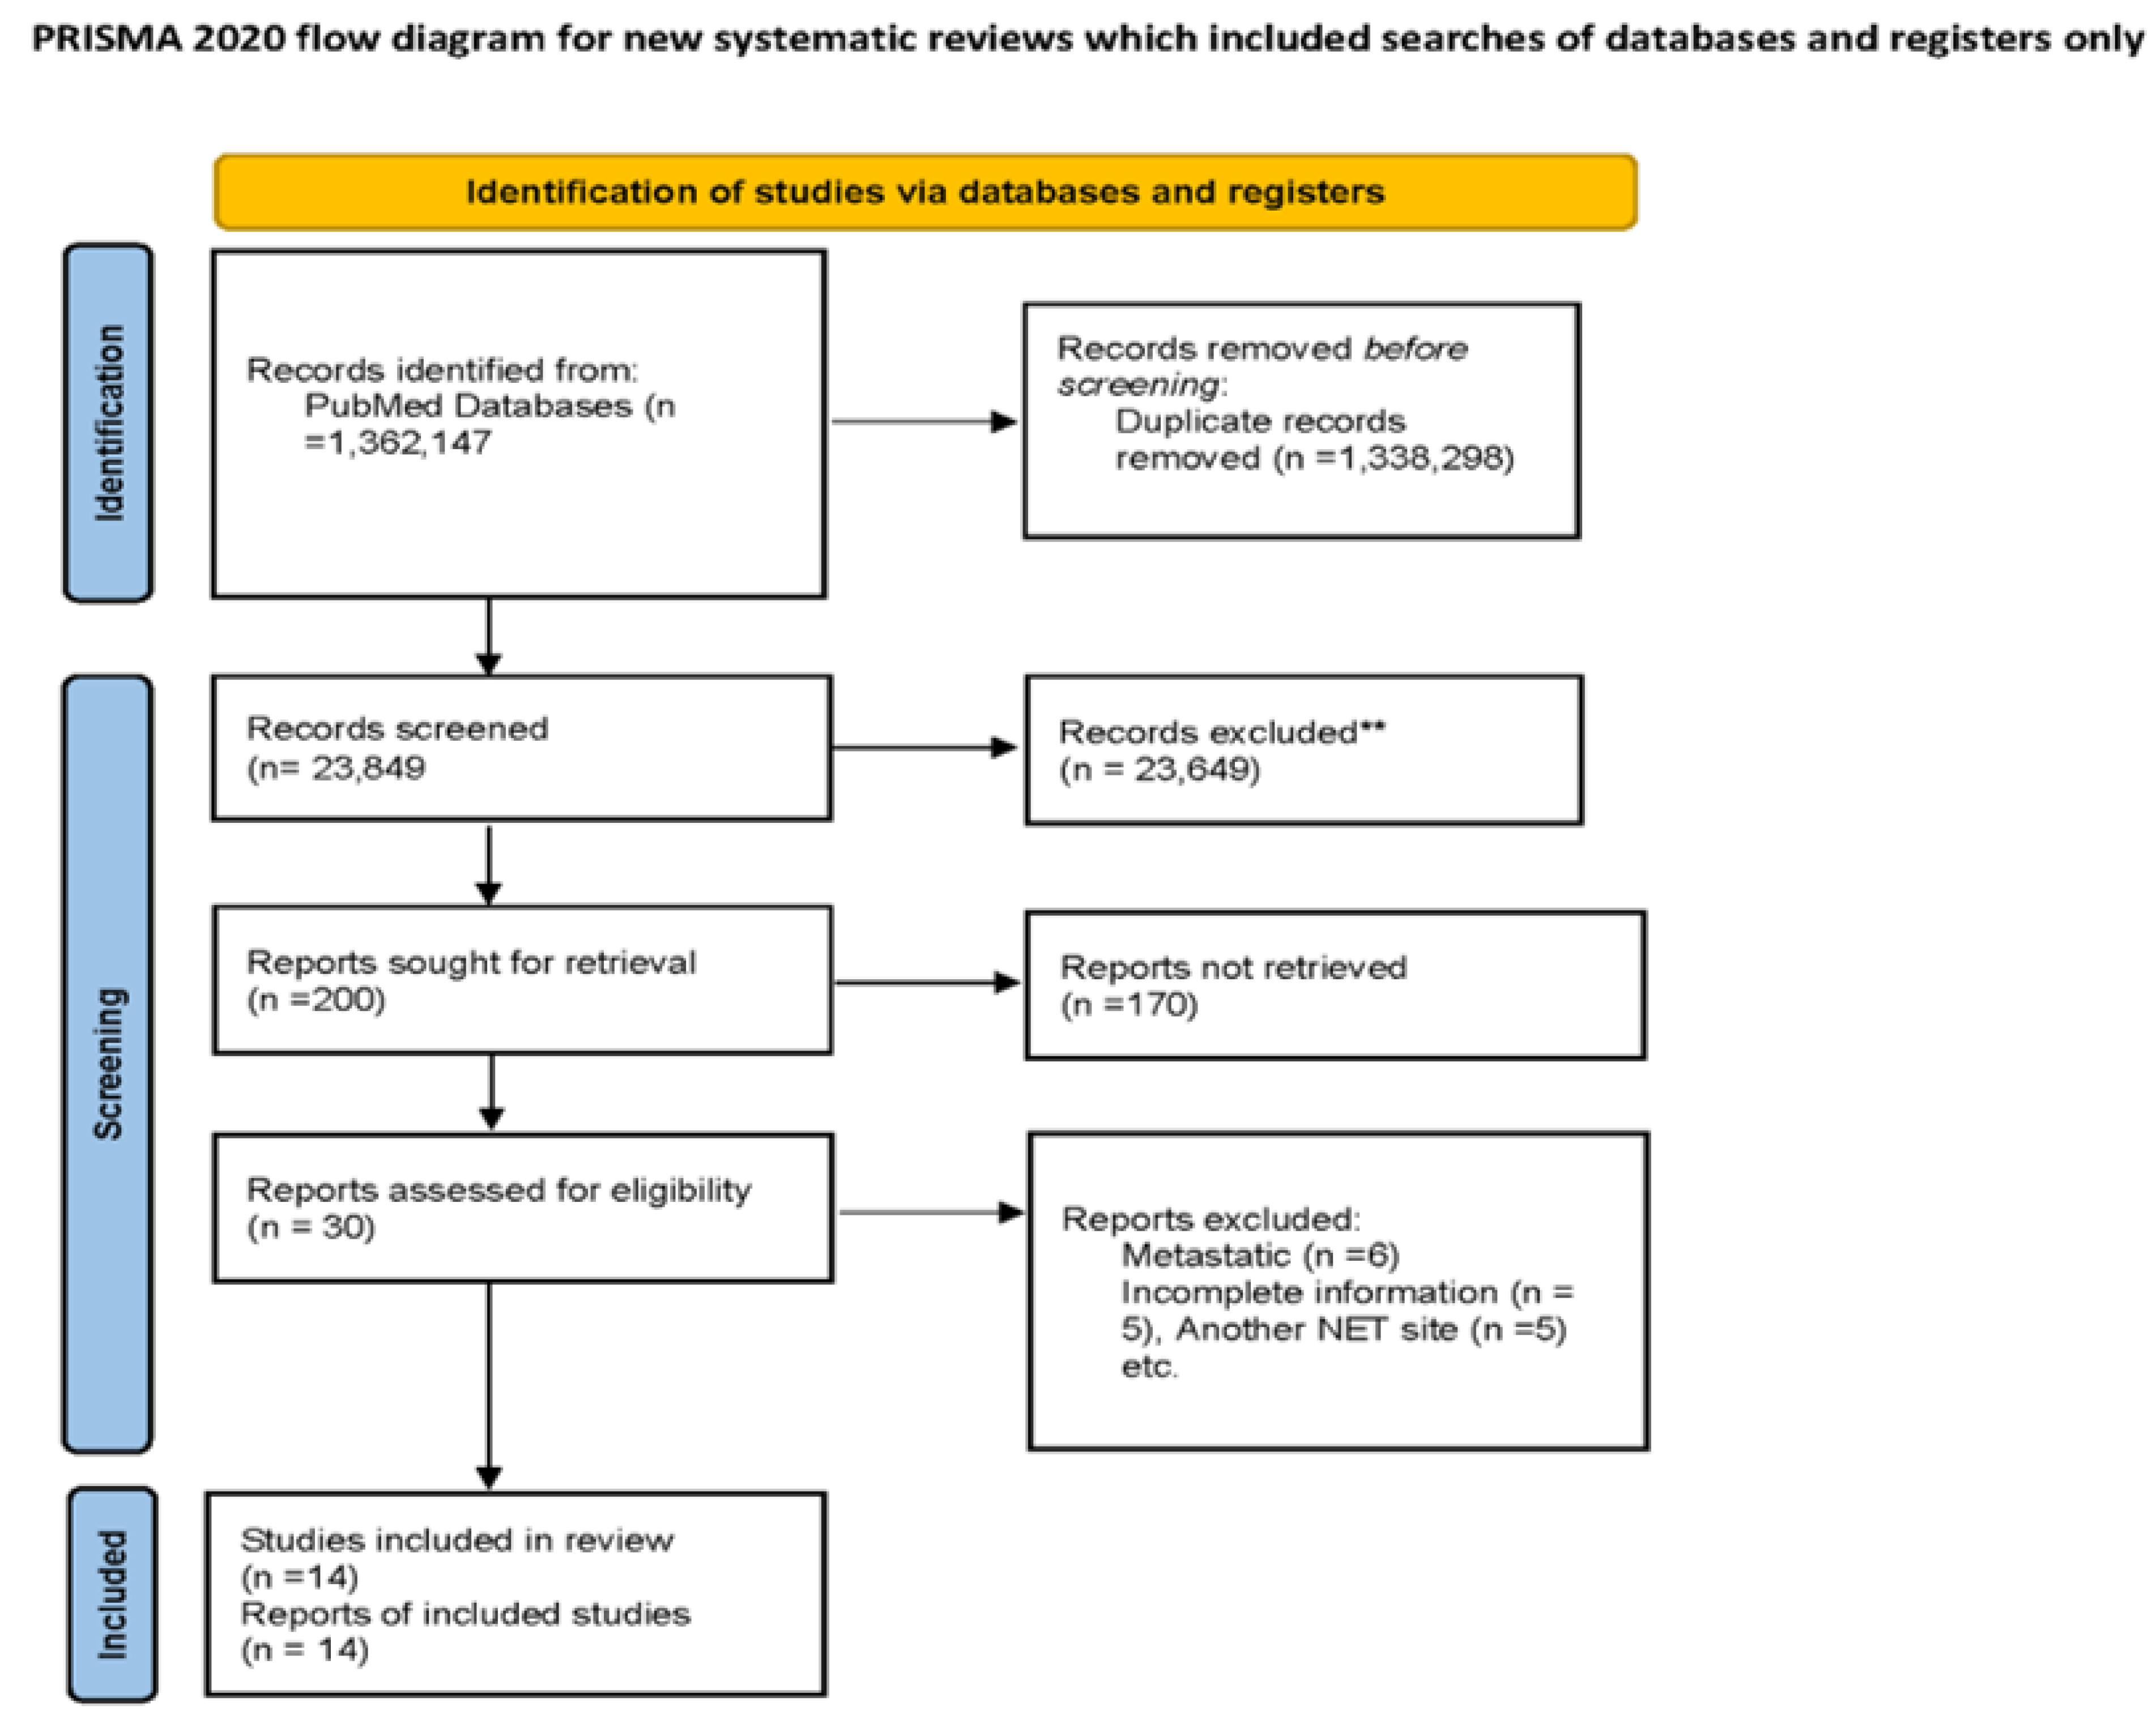
2.1. Aim and Literature Search Strategy

The primary aim of the study was to evaluate the association of prognostic factors with overall survival in gastroenteric pancreatic neuroendocrine tumors (GEP NETs). We followed the PRISMA guidelines [12] and MOOSE checklist [13] when conducting the systematic review and meta-analysis of observational studies evaluating the association of prognostic factors in the overall survival of GEP NETs. Observational studies were searched using PubMed with the keywords (((((Neuroendocrine Tumors[Title/Abstract]) OR (NET[Title/Abstract])) OR (Gastropancreatic NET[Title/Abstract])) OR (Midgut NET[Title/Abstract])) OR (pNET[Title/Abstract])) OR (pancreatic NET[Title/Abstract]) AND “magnetic”[All Fields] AND (((Survival[Title/Abstract]) OR (Overall Survival[Title/Abstract])) OR (Prognosis[Title/Abstract])) OR (Outcomes[Title/Abstract])) OR (Recurrence[Title/Abstract(((Survival[Title/Abstract]) OR (Overall Survival[Title/Abstract])) OR (Prognosis[Title/Abstract])) OR (Outcomes[Title/Abstract])) OR (Recurrence[Title/Abstract]) from May 2011–May 2021. A flow diagram of the search and study selection process is described in Figure 1.

2.2. Study Selection

We reviewed the abstracts and full-length articles of the observational studies which had an availability of data on overall survival in GEP NETs and collected them for a quantitative analysis. AA, MA, AK, and RJ independently screened all of the identified studies and assessed their full texts to determine their eligibility. Any disagreement was resolved through consensus with the PM and AA.
Observational studies which described the overall survival or prognostic factors of primary GEP NETs were included. We excluded the studies which had metastatic NETs and tumor location other than gastrointestinal pancreatic and also studies not in the English language. The prognostic factors included in our meta-analysis were age, gender, tumor grading, KI67 index, and positive lymph nodes.

2.3. Data Extraction

The data were extracted by MA, AK, and RJ. The descriptive variables extracted were the author’s name, study year, country, sample size, study period, NET site, Overall Survival, and prognostic factors.

2.4. Statistical Analysis

The meta-analysis was conducted using review manager software (v5.4). We used random effects models to calculate the pooled hazard ratio and their respective 95% confidence intervals (95%CI). An I2 of 25%, 50%, and 75% was considered as low, medium, and high heterogeneity, respectively. We assessed the publication bias using funnel plots. In addition, the risk of bias was assessed using the Newcastle–Ottawa Scale (NOS) scale. A p value of <0.05 was considered to be statistically significant.

3. Results

Out of the 200 articles screened, there were 30 articles that were eligible for the study after considering our inclusion and exclusion criteria. During the second round of eligibility, 16 more studies were excluded due to incomplete information, metastatic NETs, and the location of the NET not being GEP NETs. Hence, the final 14 observation studies were selected for a systematic review and meta-analysis (Figure 1). Table 1 describes the study characteristics and collected data on the prognostic factors, and the Supplementary Materials describes the full study details and reference citations for the 14 observational studies used for the meta-analysis.

3.1. Prognostic Factors

AGE: 11 studies out of the 14 reported an association of age with overall survival in GEP NETs. In our meta-analysis, we found that an increasing age is associated with poor survival (pooled HR: 1.20; 95%CI: 1.06–1.36; p = 0.005), with an 80% heterogeneity (p < 0.00001) (Figure 2A). In order to account for this heterogeneity, we conducted a sensitivity analysis by removing the outlying studies of Foubert et al., Tan et al., and Yang et al. The results after the sensitivity analysis were still significant (pooled HR: 1.11; 95%CI: 1.05–1.18; p = 0.0004), with a 32% heterogeneity (p = 0.17). (Figure 2B).
Grade 3: 7 studies out of the 14 reported an association of grade 3 tumors with overall survival in GEP NETs. We found grade 3 tumors to be associated with poor survival (pooled HR: 2.73; 95%CI: 1.36–5.47; p = 0.005), with a 92% heterogeneity (p < 0.00001) (Figure 3A). In the sensitivity analysis, after removing the outlying studies of Fathi et al. and Foubert et al., the analysis was significant with a pooled HR: 4.53; 95%CI: 3.54–5.58; p < 0.00001) and a 0% heterogeneity (p = 0.72) (Figure 3B).

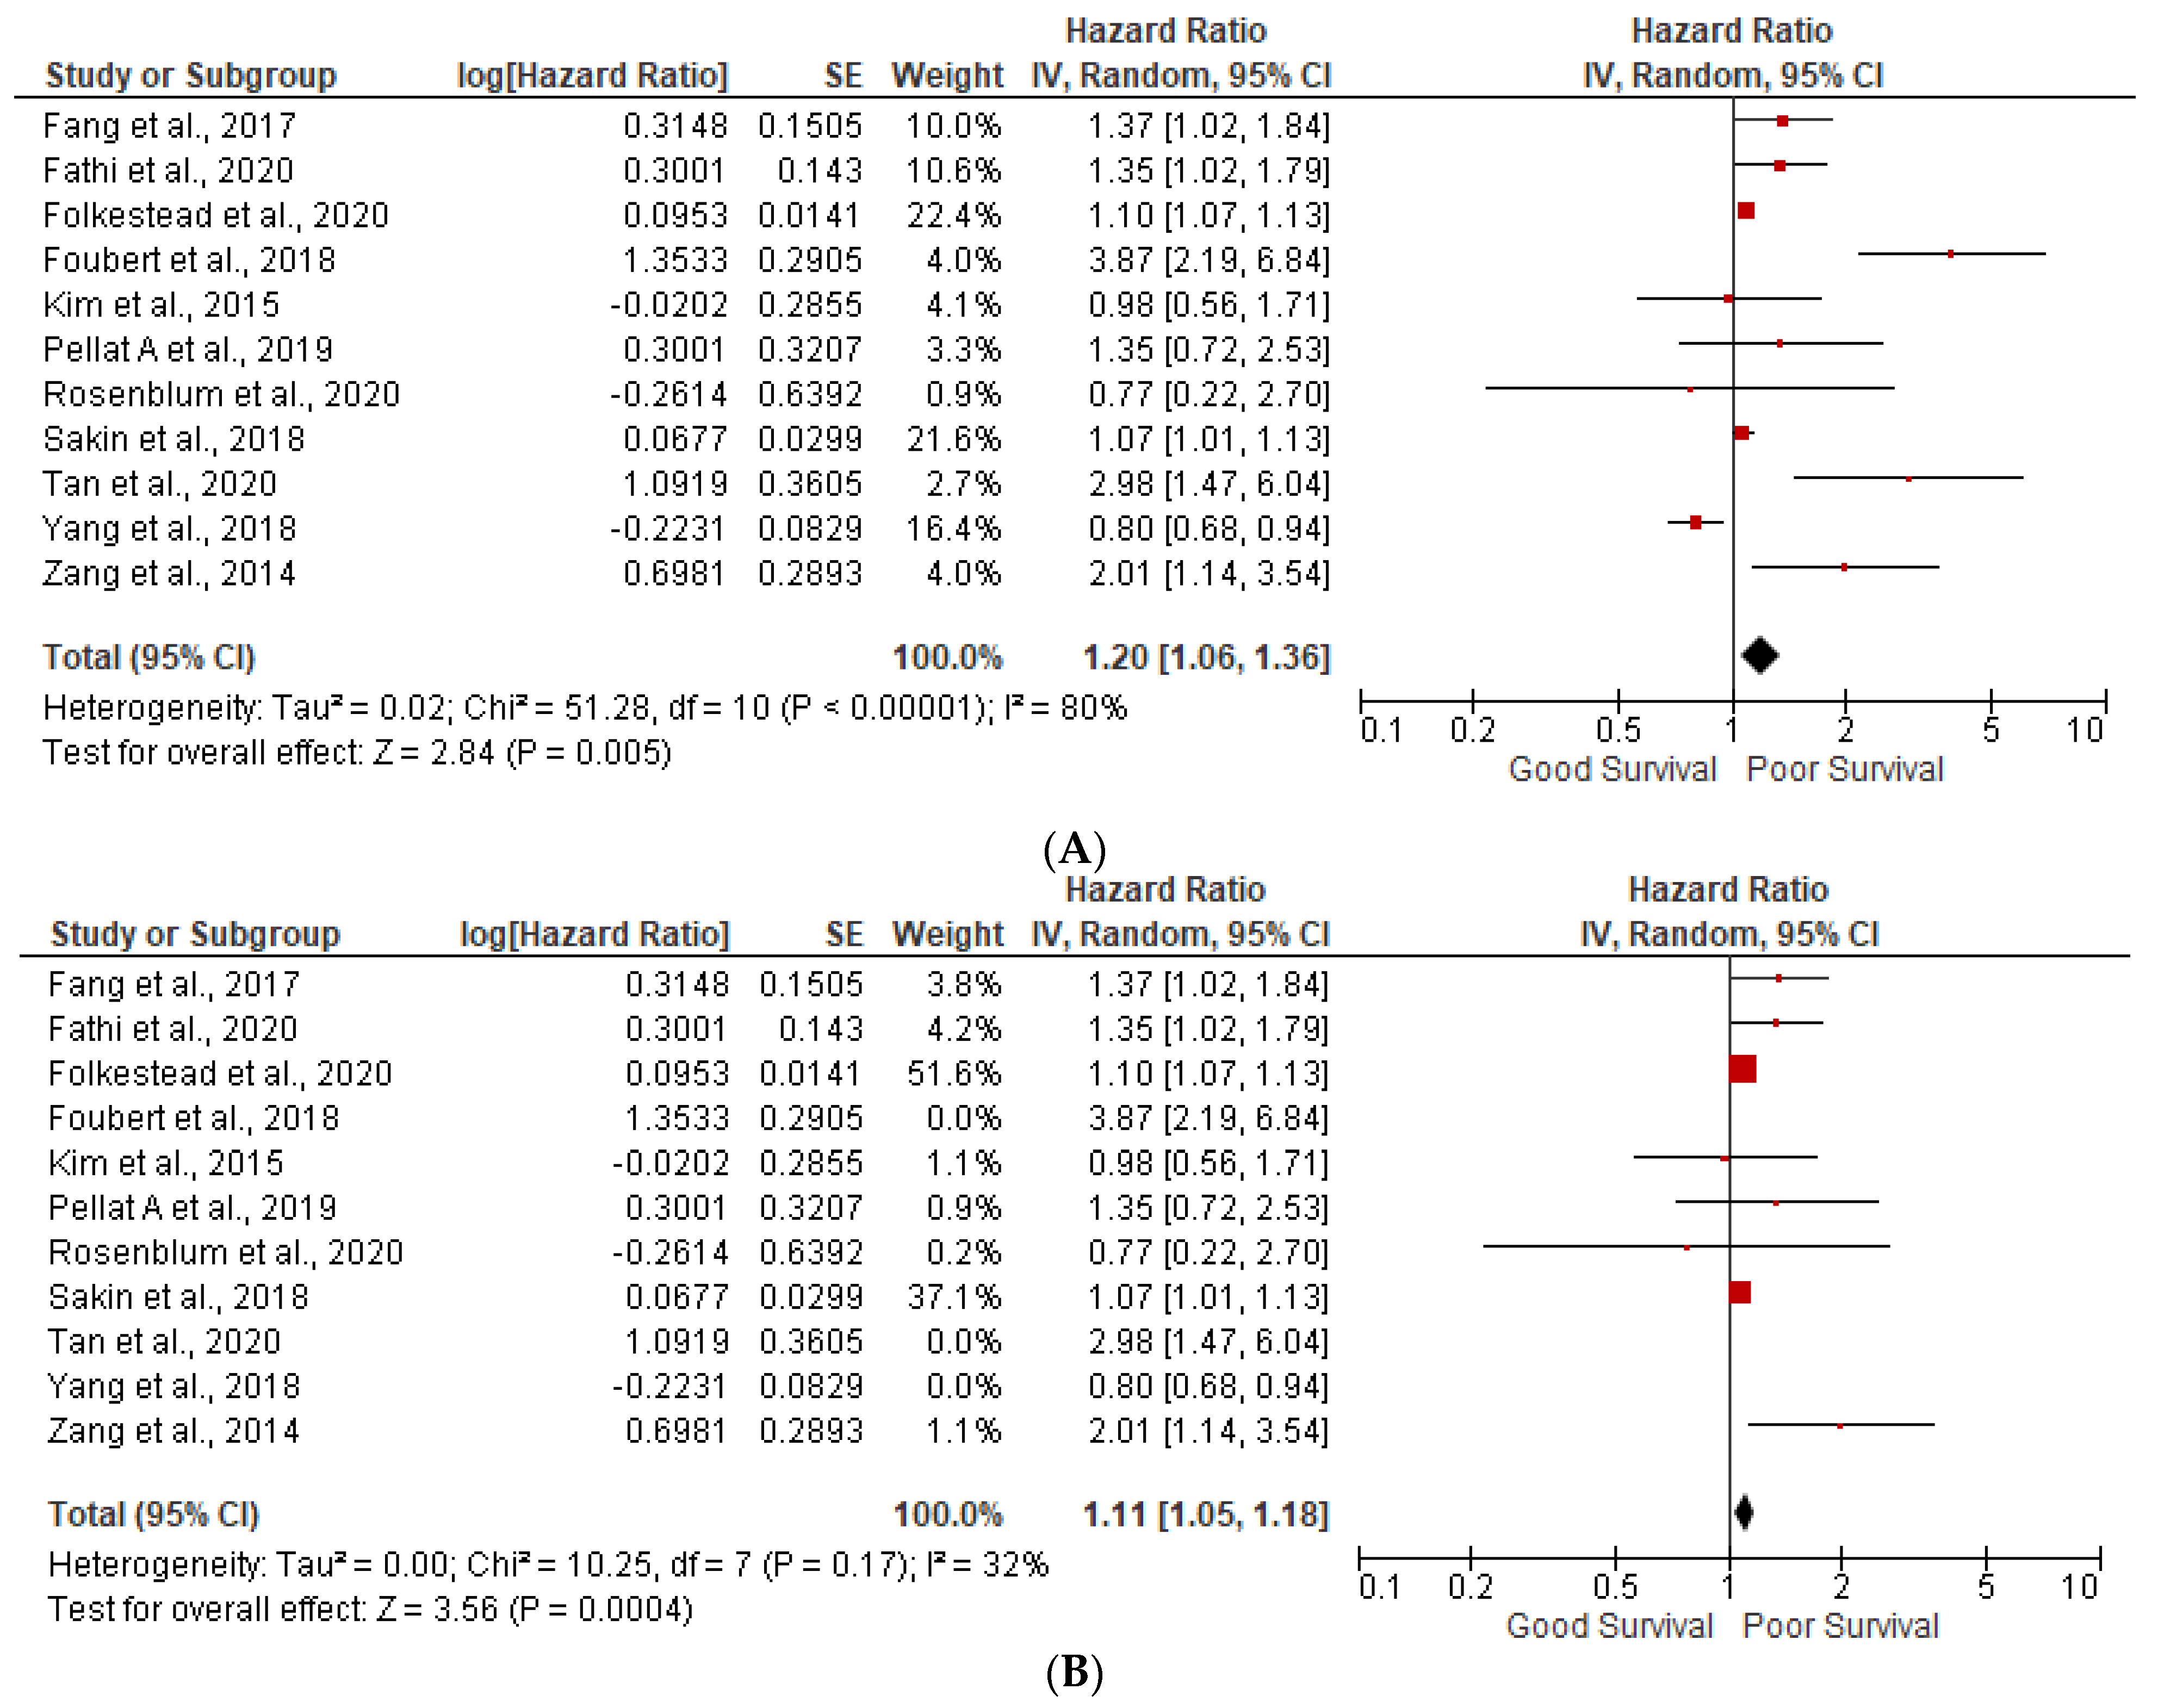
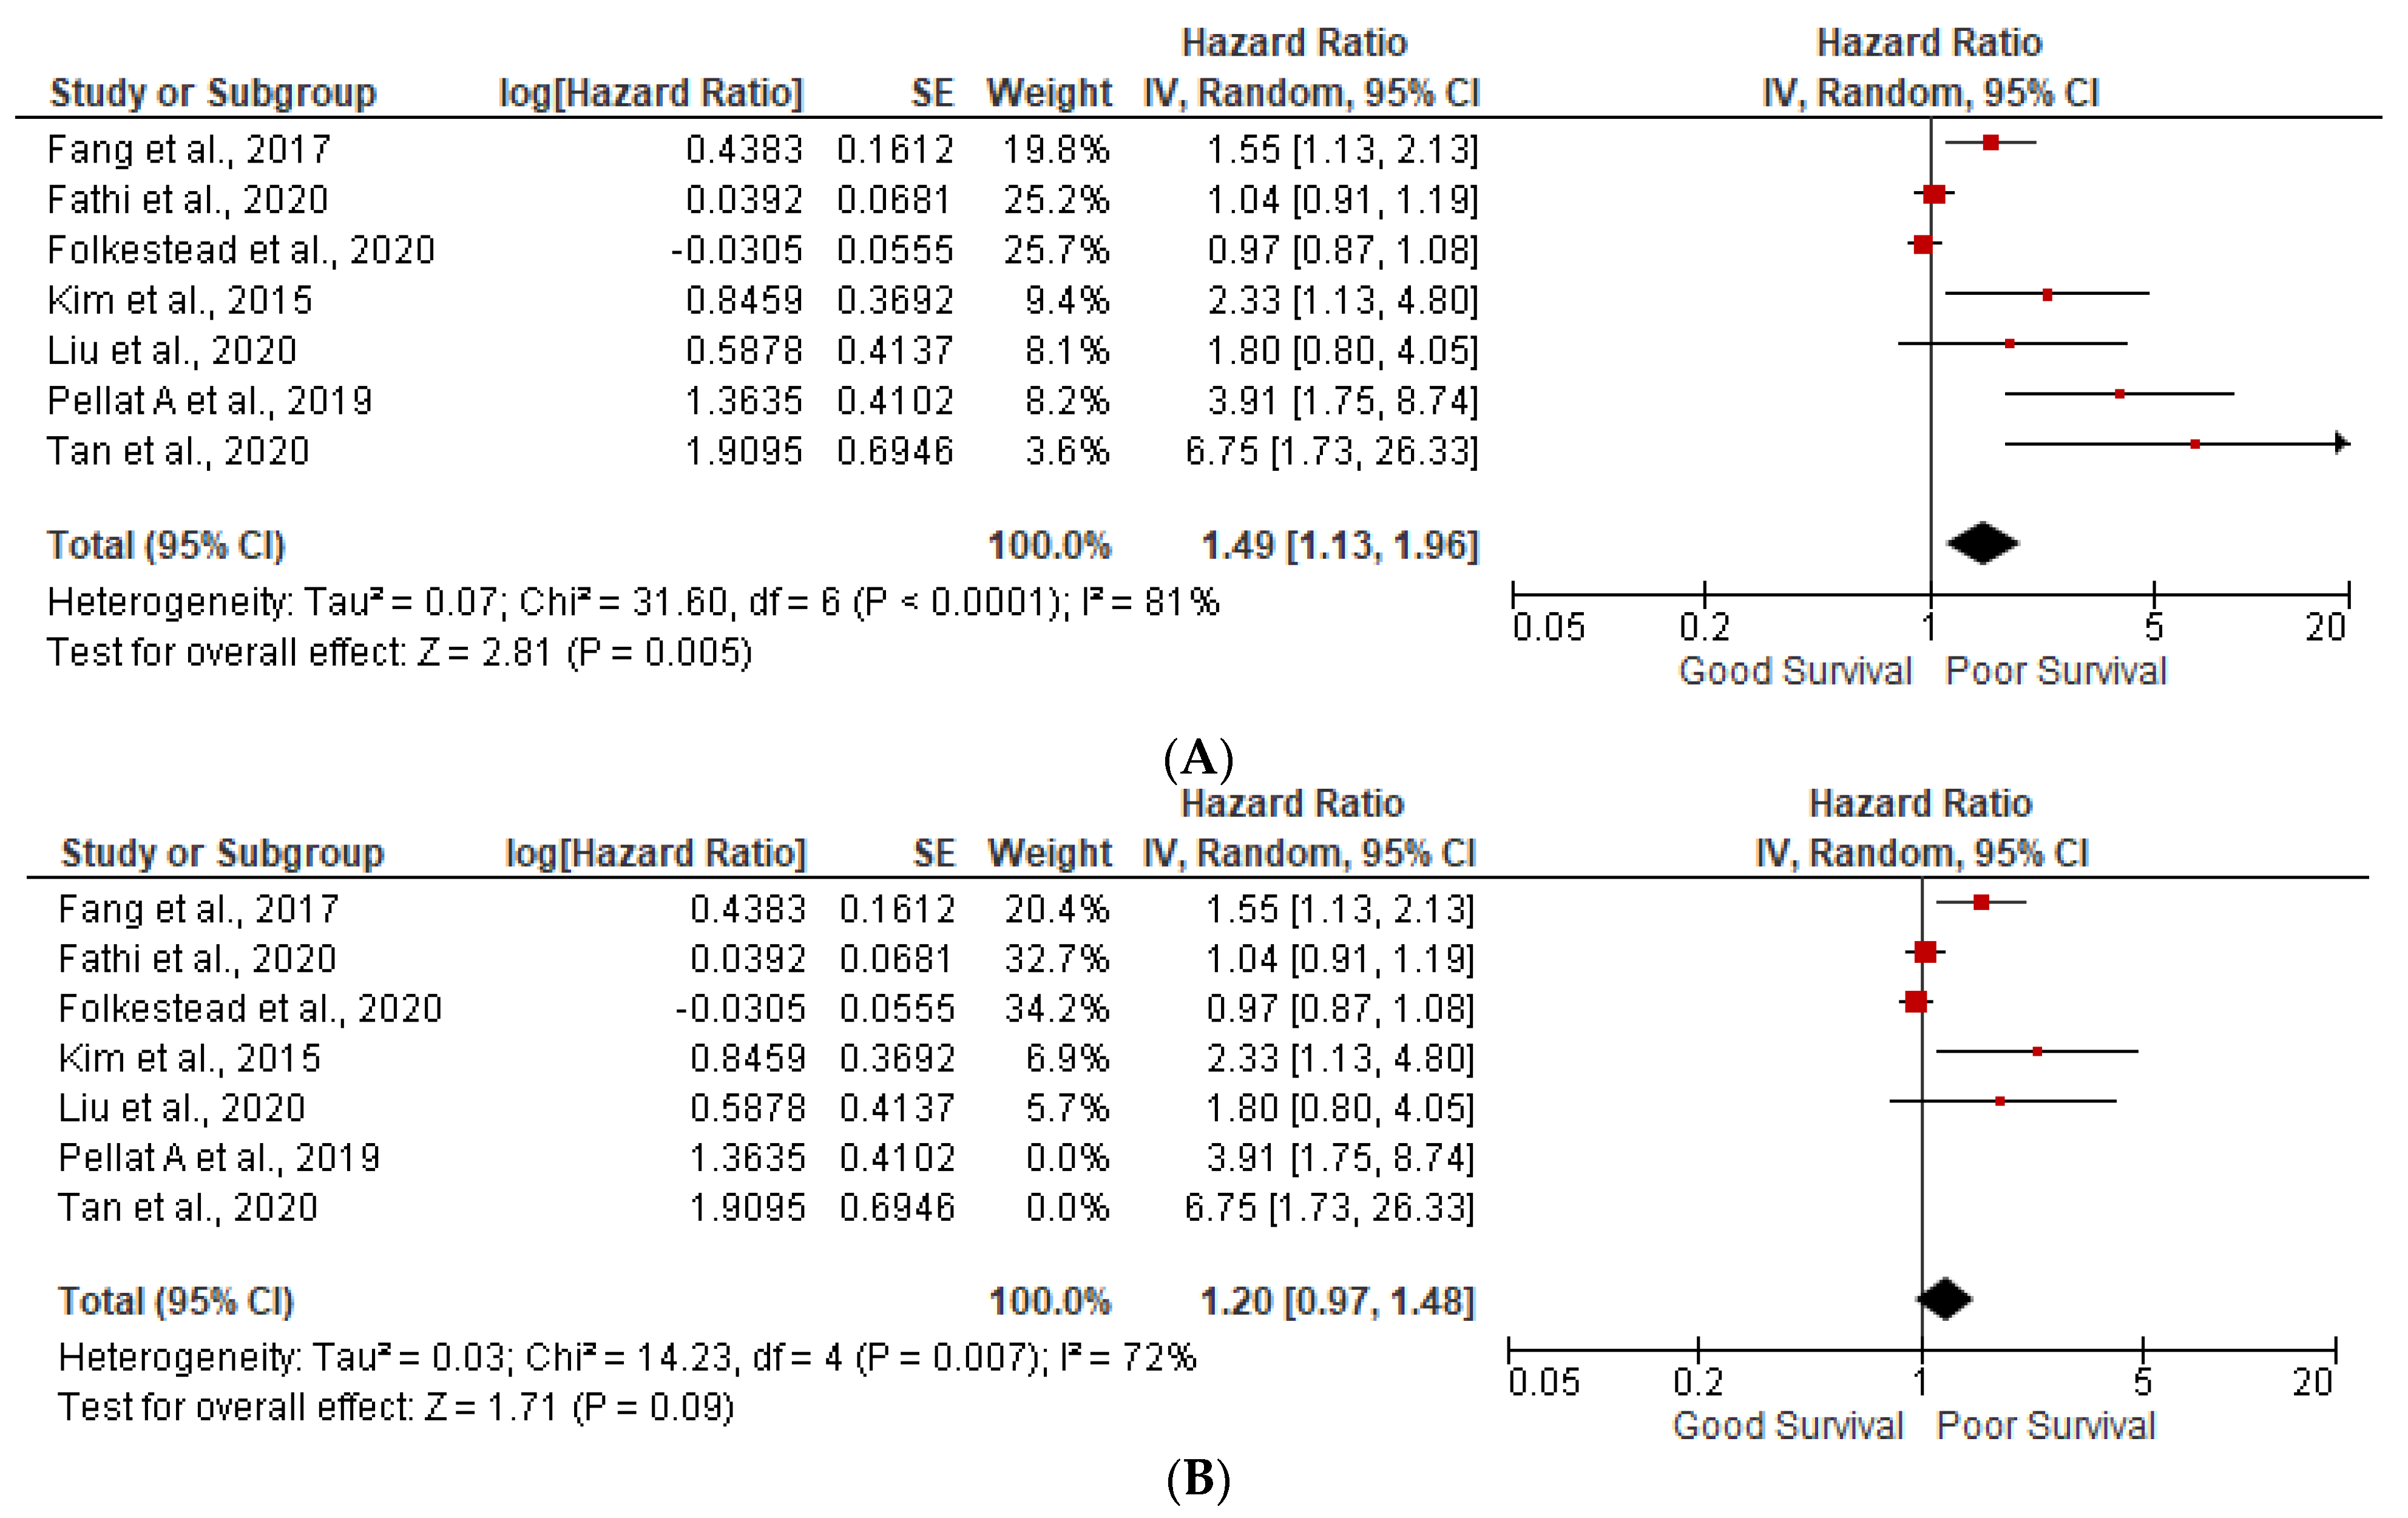
3.2. Lymph Node Positivity

In total, 7 studies out of the 14 reported an association of lymph node positivity with poor survival (pooled HR: 1.49; 95%CI: 1.13–1.96; p = 0.005), with an 81% heterogeneity (p < 0.00001) (Figure 4A). In the sensitivity analysis, after removing the outlying studies of Pellat et al. and Tan et al., we found a pooled HR: 1.20; 95%CI: 0.97–1.48; p = 0.09) and a 72% heterogeneity (p = 0.007) (Figure 4B).

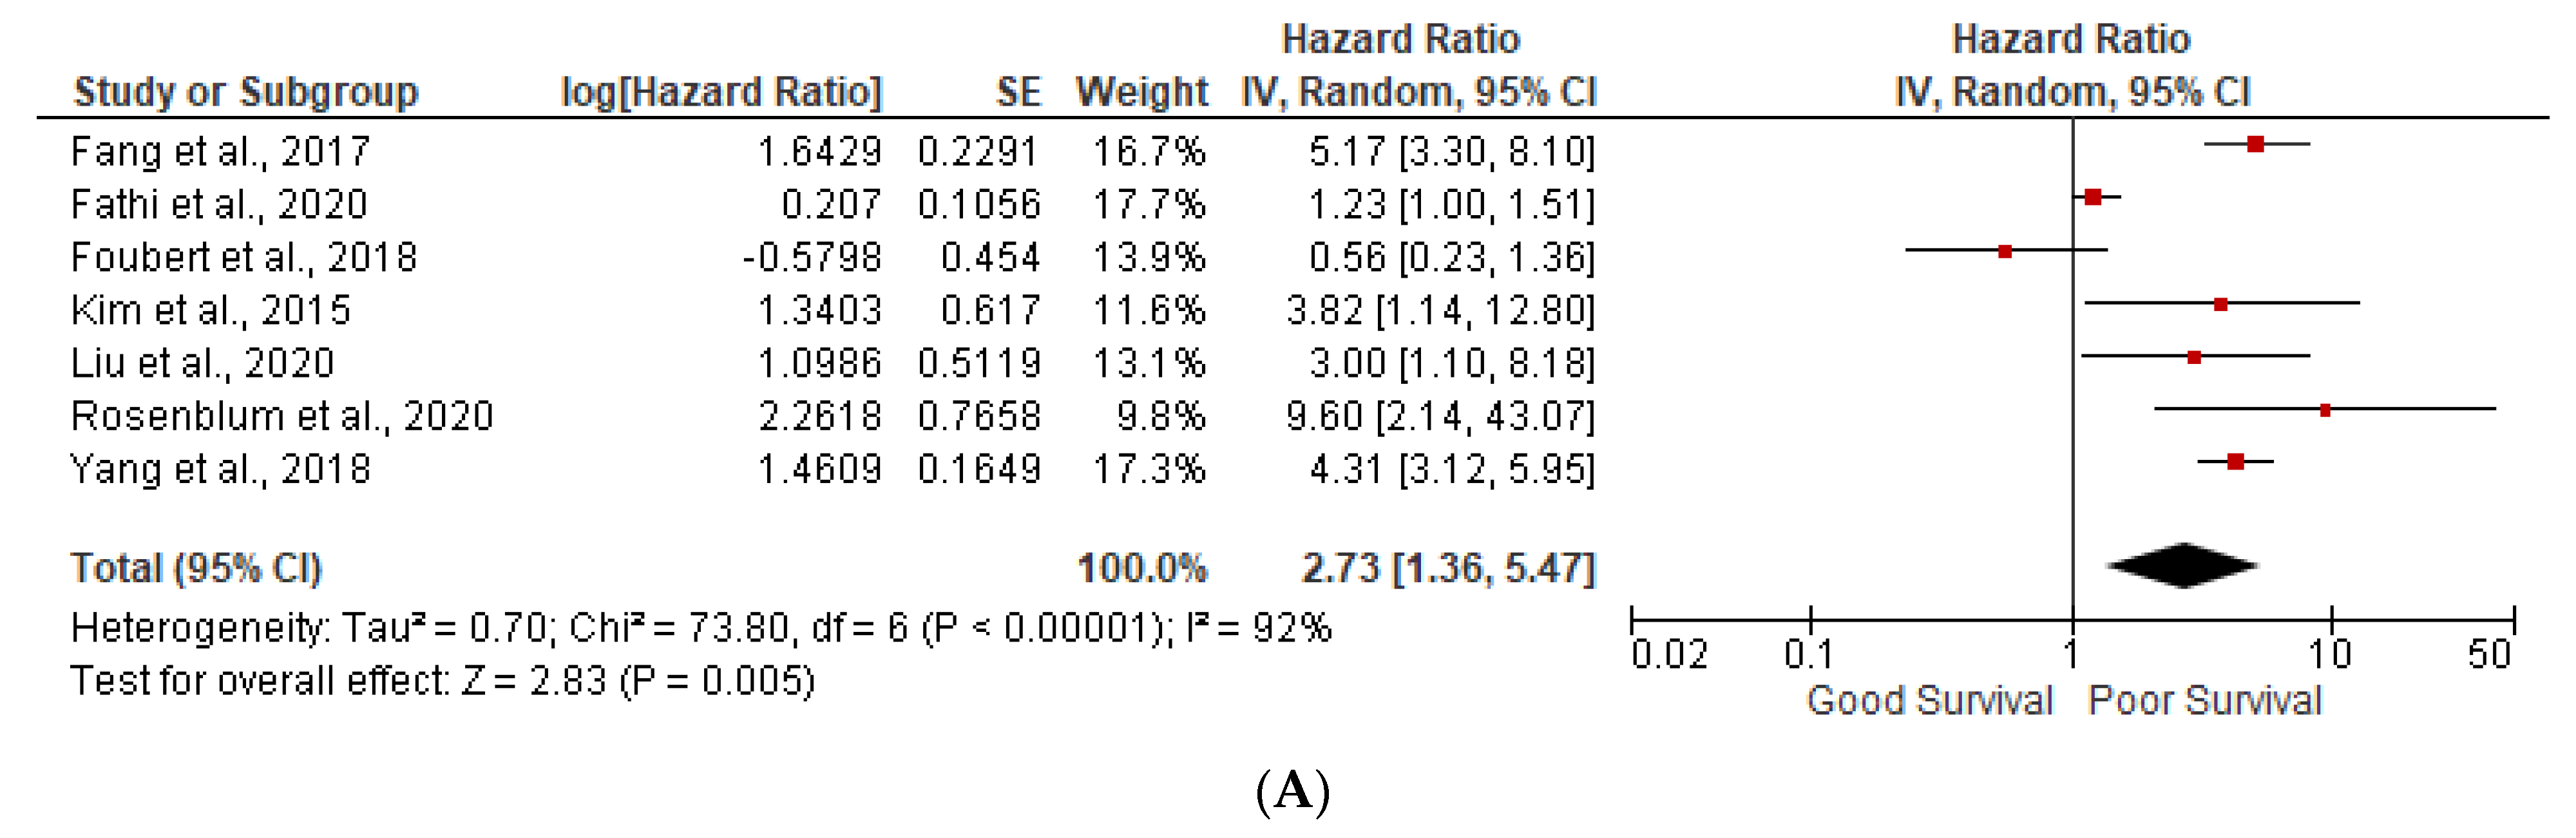
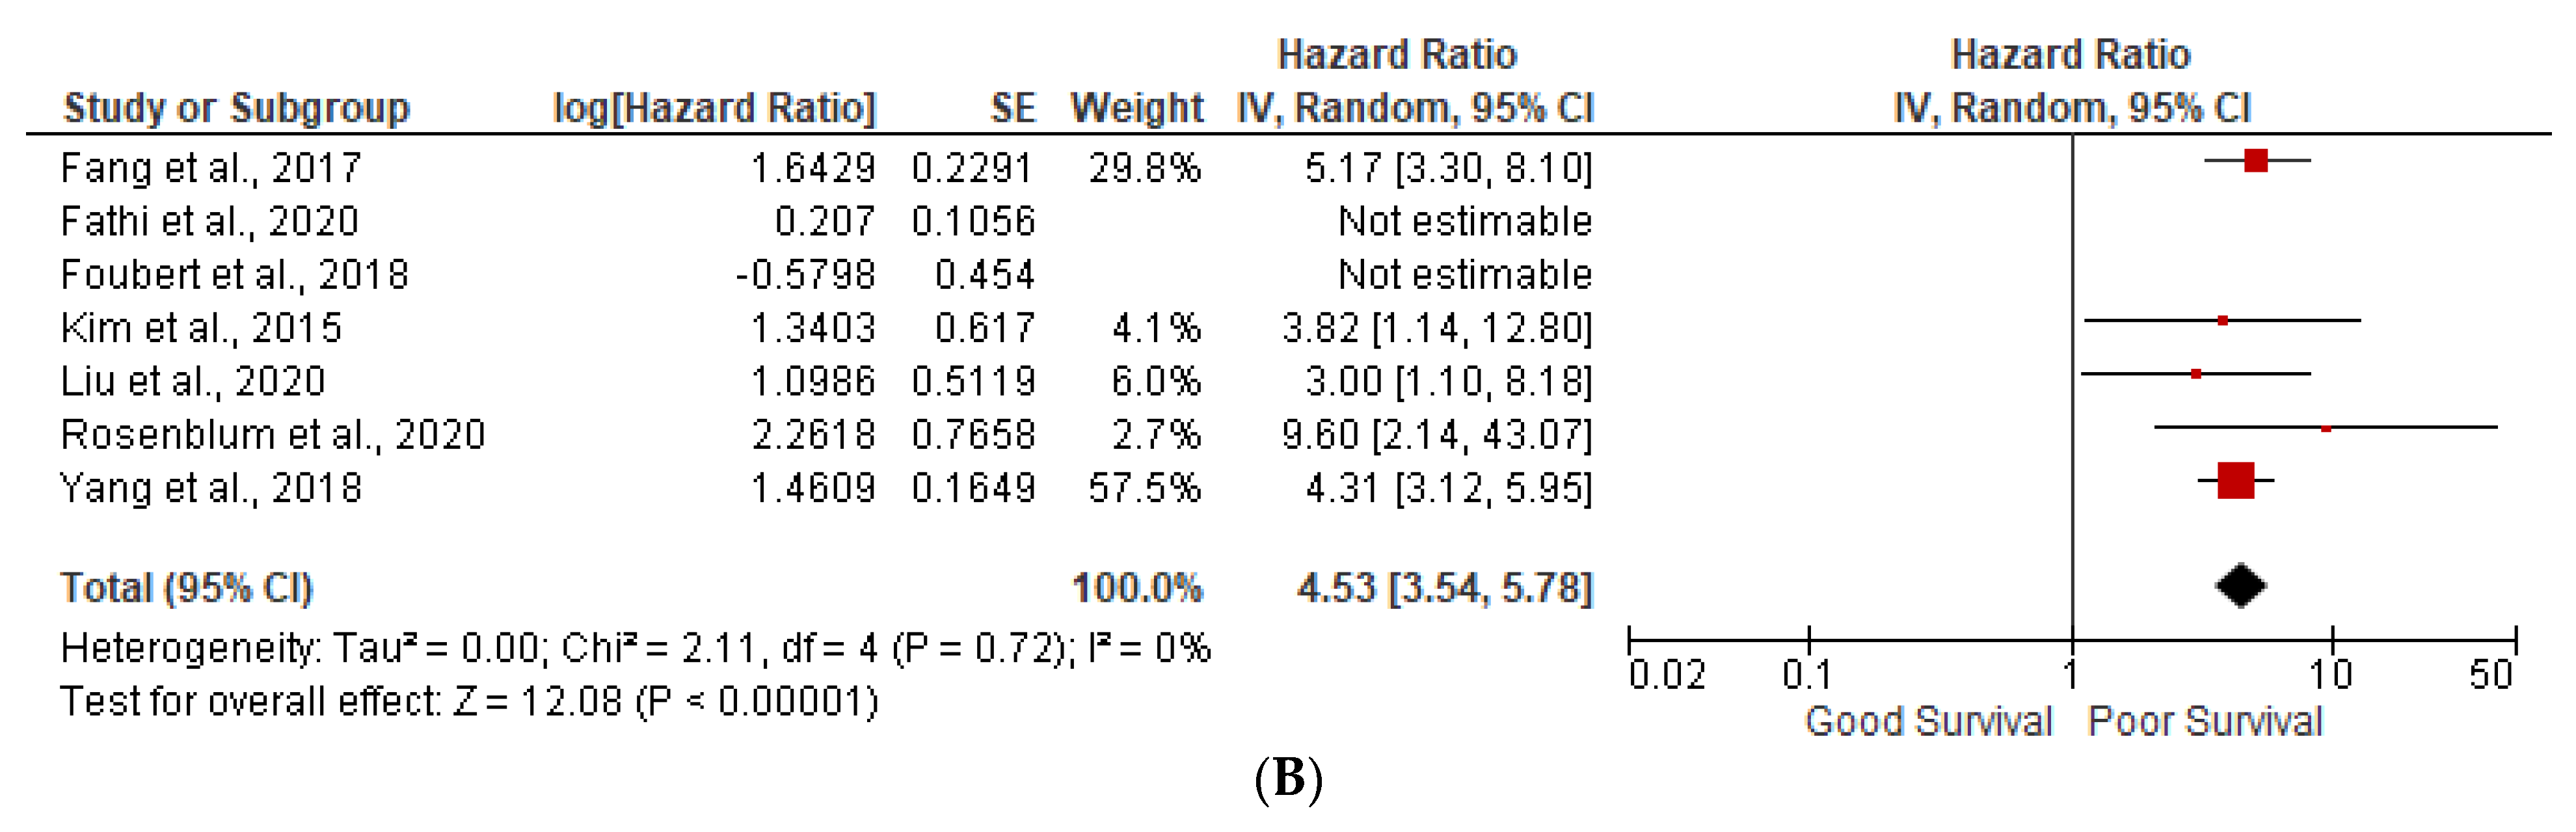
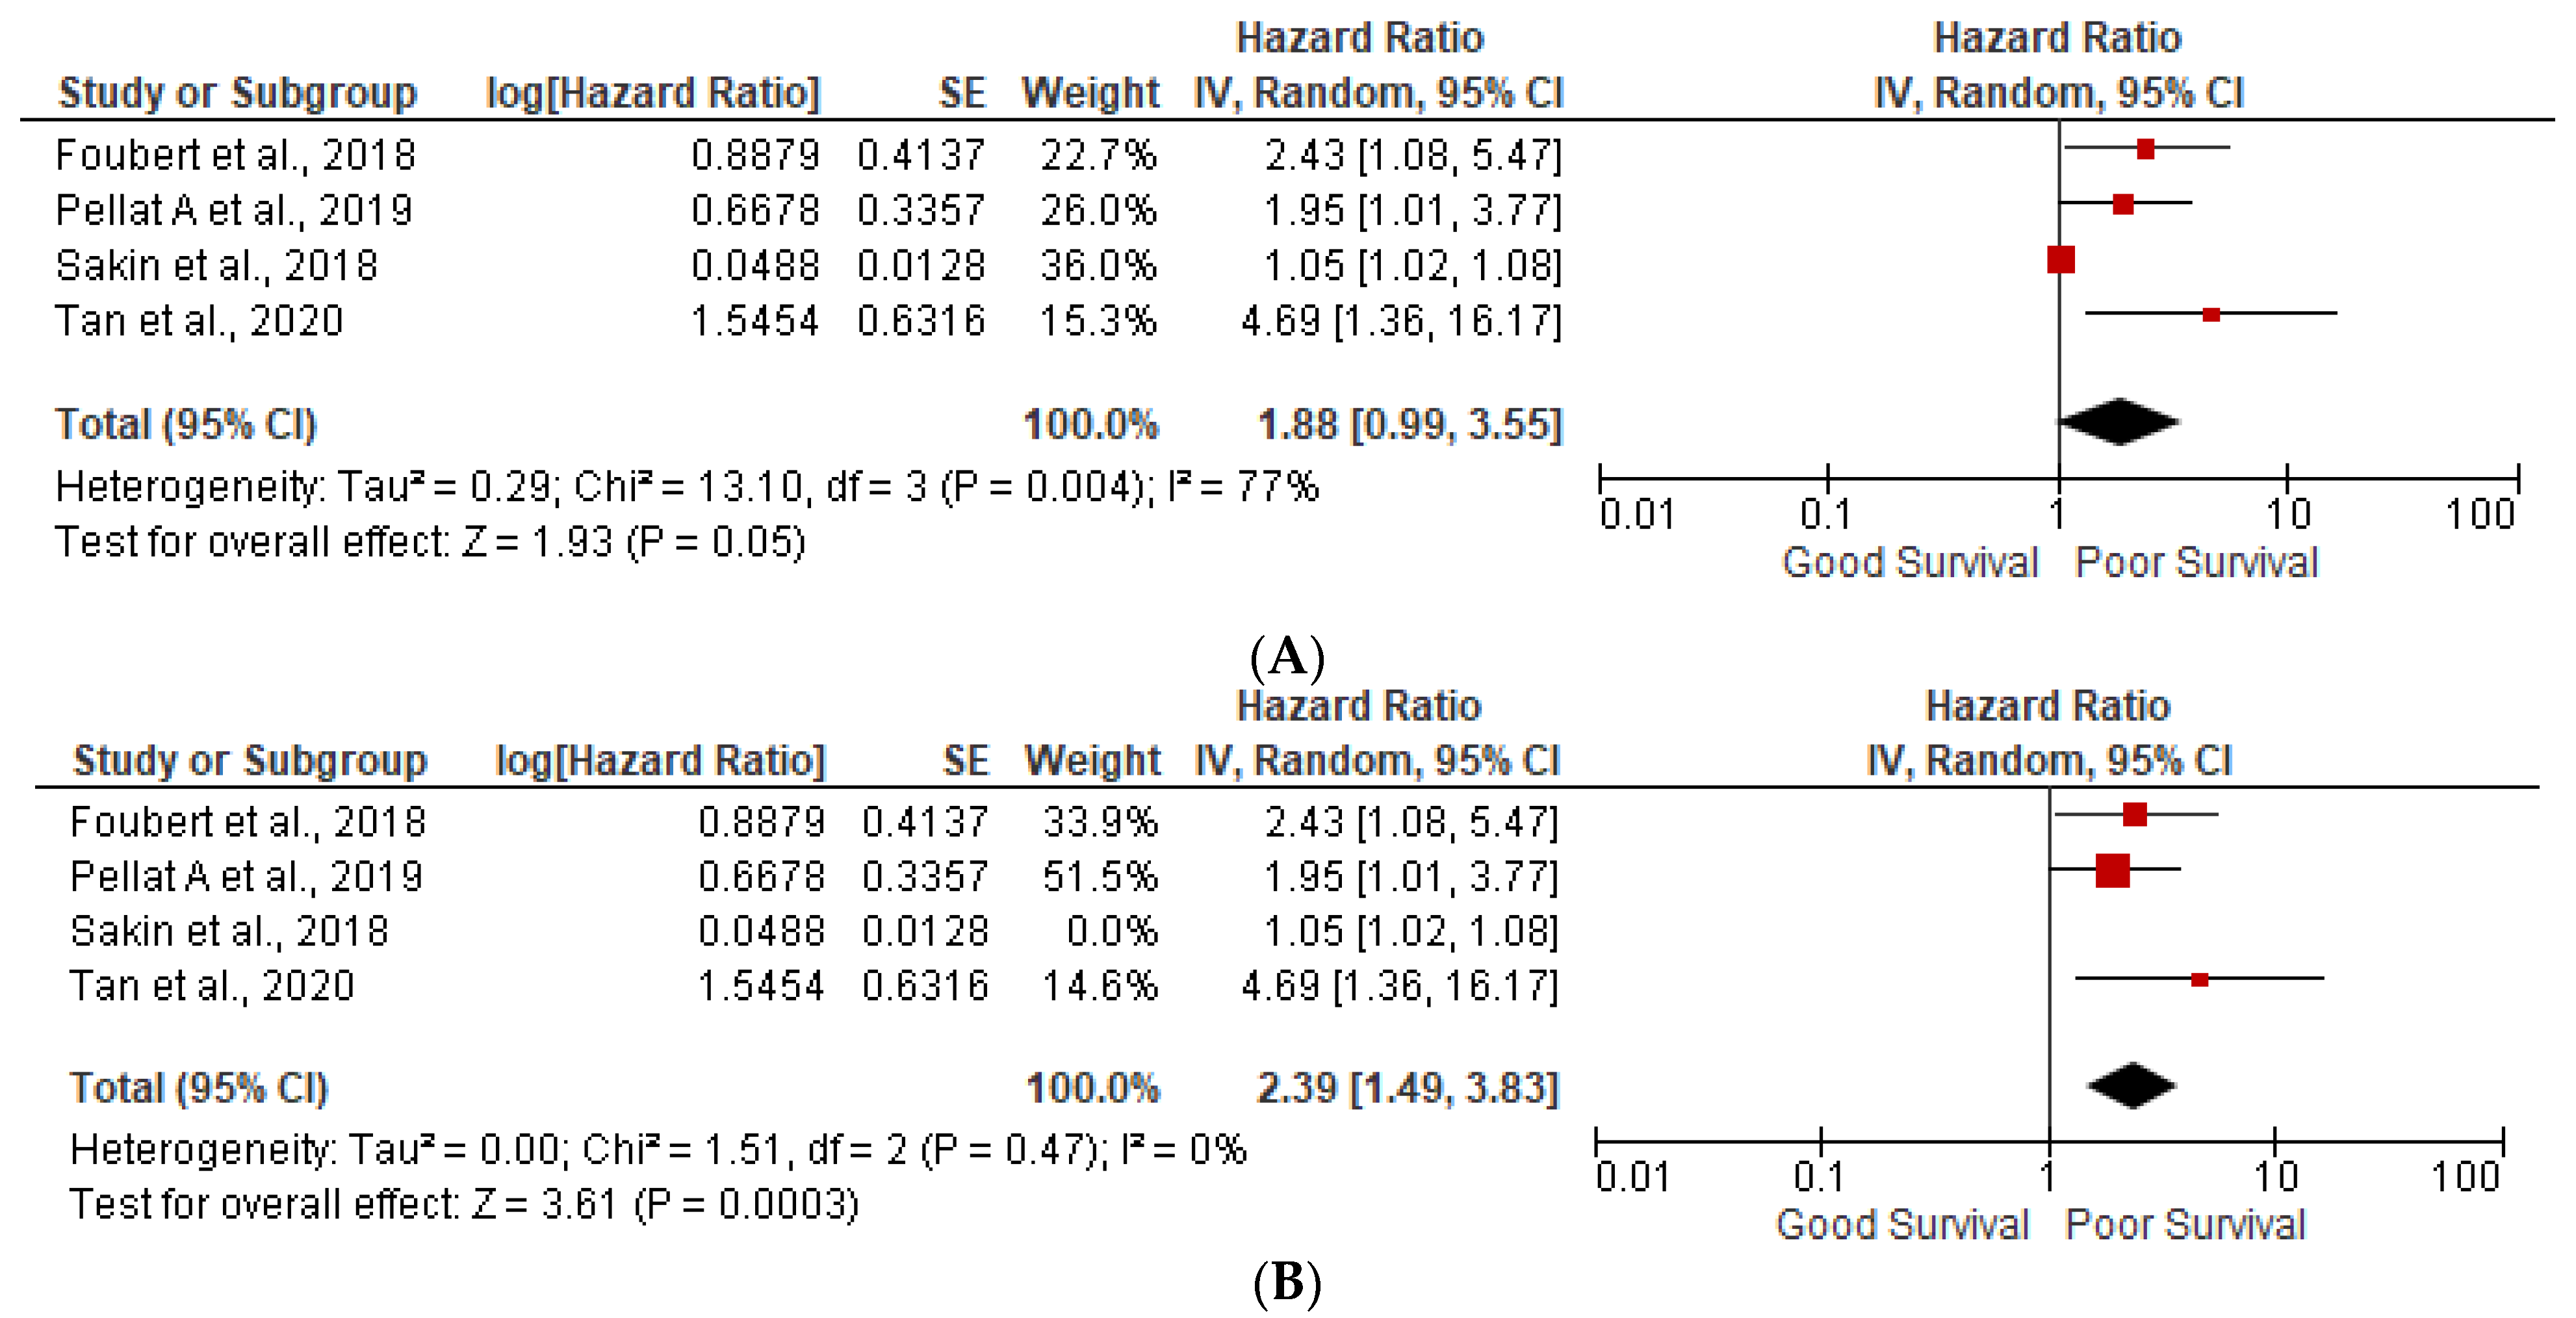
3.3. Ki-67 More than 5%

A total of 5 studies out of the 14 found that a Ki67 index more than 5% was weakly associated with poor survival (pooled HR: 1.88; 95%CI: 0.99–3.55; p = 0.05), with a 77% heterogeneity (p = 0.004) (Figure 5A). In the sensitivity analysis, after removing the outlying study of Sakin et al., we found a strong association between a Ki67 index of more than 5% and poor survival, with a pooled HR: 2.39; 95%CI: 1.49–3.83; p = 0.0003) and 0% heterogeneity (p = 0.47) (Figure 5B).

3.4. Table 2 Describes the Overall Findings of This Study

Table 2 described pooled HR and 95%CI with sensitivity analysis showing poor outcomes associated with age, grade 3, and lymph node positivity.

3.5. Heterogeneity (I2) Statistics and NOS Scale

The heterogeneity analysis showed a 77–92% dispersion observed between the studies. For each outcome, we performed a sensitivity analysis after removing outliers from the individual meta-analysis. Additionally, the overall studies had a low to moderate risk of bias. Table 3 describes the risk of bias, which was assessed using the Newcastle–Ottawa Scale (NOS) scale, showing a low to moderate risk of bias. The Supplementary Materials shows the funnel plots used for the sensitivity analyses.

4. Discussion

In this meta-analysis, we covered 14 observation studies to evaluate the association of prognostic factors with overall survival in gastroenteric pancreatic neuroendocrine tumors (GEP NETs). We found increasing age, grade 3 tumors, lymph node positivity, and a Ki67 index more than 5% to be associated with poor survival.
As we age, the immune system weakens and responds more slowly. This allows for tumors to better escape a host’s immune defenses with a decreased ability of immune cells to suppress tumor growth [14]. A study conducted by Niederele et al. found that benign GI tumors were far more common in younger patients, while malignant ones were more prevalent in older populations [15]. In addition, one study found that those above 80 years of age with a GI tumor (pancreatic) have a three times higher mortality rate than those less than 40, and those between the ages of 40 and 80 years have a two times higher mortality rate than those below 40 years of age. Since the decline of the immune system with age is a well-established fact, it was surprising to see the heterogeneity in the studies included in our analysis. This could partially be accounted for by geographical distribution, in addition to limitations in sample size. For example, a study conducted by Zhu et al. noted that there are significant differences between the populations in the United States and China with respect to NETs. Patients in China were found to be older and have larger tumors [16]. While a study has not been conducted to observe regional differences of gastric NETs in the United States, it is plausible that there is also significant regional diversity, which may be able to account for some of the discrepancies in outcomes across studies.
The grading system for NETs and neuroendocrine neoplasms (NEN) was updated in 2010 by the World Health Organization (WHO) [17]. Essentially, grade 1 tumors have the lowest mitotic rates with a Ki-67 Index (<3%), grade 3 tumors have the highest mitotic rate with a Ki-67 Index (>20%), and grade 2 tumors are found to be intermediate with a Ki-67 (from 3% to 20%). Moreover, there is an extra component to this classification based on the degree of differentiation of the tumor, which ranges from well-differentiated to poorly differentiated [18]. The majority of GI NET tumors fall between grade 1 and grade 2 (accounting for 84 percent of all GI NETs), while grade 3 tumors are much rarer (6–8% of GI NETs) [17]. This is perhaps due to more frequent imaging maybe contributing to the earlier identification of tumors to be diagnosed and treated at an earlier stage. Our results again fall in line with the expectations based on the grading of tumors. Tumors with higher proliferative rates, and hence higher grades, tend to be more aggressive and spread faster. This leads to more rapid-onset symptoms and a narrower window for curative therapeutic intervention before only palliative care can be given. Furthermore, in most cases, grade 1 tumors can be excised, while grade 2 and 3 tumors are far more challenging to treat [19]. It is of interest to note that, because grade 2 tumors span a wide range, our results indicate that a threshold of a five percent Ki-67 index for a tumor is associated with a poor survival prognosis. Hence, while it is not surprising that our meta-analysis revealed a negative correlation between grading and survival outcomes, the five percent marker may serve as a threshold with relevant clinical significance.
Furthermore, we found that metastasis to lymph nodes leads to poor survival outcomes. In most cases, the lymph nodes are among the first places a metastatic cancer travels to reach subsequent tissues. As a result, our data fall in line with the expected outcomes, since metastasis is associated with the later stages of cancer. For example, stage 0 cancer is carcinoma in situ and is defined as a cancer that has not spread to any tissues, while stages 1–4, which are subsequently associated with worse clinical outcomes, refer to a cancer that has metastasized [20]. In addition, it is important to note the relationship between the number of lymph nodes affected and survival outcomes. A study conducted by Zaidi et al. found that a metastasis to four or more lymph nodes increases the risk of cancer recurrence post-treatment [21]. The number of lymph nodes affected also affects overall survival rates, with data showing a negative correlation between 10-year survival rates and the number of lymph nodes affected [22].
In our study, we found that female sex is associated with a worse survival outcome, however, the mechanisms behind this remain unclear. It is interesting to note that NETs are slightly more common in females than males [23]. It has been hypothesized that differences in hormonal regulation may play a role in this relationship, but more studies are needed before being able to make any definitive conclusions. Moreover, another possibility that may explain our findings is that survival rate differences between genders may be attributed to differences in tumor locations. For example, appendiceal tumors are more common in females, while small intestine tumors are more common in males [24]. Certain GI tumor locations may lead to worse clinical outcomes, however, more studies are needed investigating these location–survival relationships.
Our findings not only serve to corroborate relationships that already exist, but also have important clinical significance. For instance, our analysis revealed a five percent Ki-67 index threshold for poor clinical outcomes. This benchmark may have an influence on future clinical decision making and treatment options. Because grade 2 tumors are so variable, this percentage marker may be able to draw a distinction between administering more and less aggressive forms of treatment. Moreover, although we established a relationship between female sex and worse survival outcomes, we understand that more research needs to be conducted in this domain to develop an understanding of the underlying mechanisms. While the relationships of age and lymph node positivity were already well established, they serve as important findings that help to corroborate the overall quality of our study. Although we restricted our search and analysis to gastric neuroendocrine tumors, we found that there is a high degree of heterogeneity even within this limited group.

5. Conclusions

Overall, the results of our study fell in line with the normal expectation of all tumors, not just those limited to the GI system. Essentially, we found that an older age, higher-grade tumors, lymph node positivity, and female sex are associated with worse clinical outcomes and lower survival rates. Although the basic scientific mechanisms for most types of cancers and associated prognostic factors are well established, our study revealed more nuanced relationships in GI NETs than are present in the current literature. Our subcategory analysis, such as the specific Ki67 index percentage and number of lymph nodes affected for poor survival, produced new findings with important clinical relevance. While we acknowledge that there is still a need for further research to evaluate prognostic factors to help corroborate our findings, we hope that our study serves as an initial guide that may help with future clinical decision making.

Supplementary Materials

The following supporting information can be downloaded at: https://www.mdpi.com/article/10.3390/gidisord5030033/s1, Figure S1: Funnel Plots; Table S1: Citations for the studies used in this meta-analysis.

Author Contributions

Conceptualization, P.M. and U.P.; formal analysis, P.M. and U.P.; investigation, V.S.V.; methodology, P.M.; project administration, N.P., V.S.V. and U.P.; resources, V.S.V.; software, P.M. and U.P.; supervision, V.S.V. and U.P.; validation, N.P., S.B.C. and U.P.; visualization, N.P.; writing—original draft, A.K., M.A., S.D., S.C., N.U., B.N., L.V. and S.B.C.; writing—review and editing, N.P., S.B.C., V.S.V. and U.P. All authors have read and agreed to the published version of the manuscript.

Funding

This research received no external funding.

Institutional Review Board Statement

The study was conducted according to the guidelines of the Declaration of Helsinki, and Ethical review and approval were waived for this study, due to meta-analysis of already published studies.

Informed Consent Statement

Not applicable.

Data Availability Statement

Data included in this study are available from previously published studies.

Conflicts of Interest

The authors declare no conflict of interest.

References

  1. Yang, Z.; Wang, W.; Lu, J.; Pan, G.; Pan, Z.; Chen, Q.; Liu, W.; Zhao, Y. Gastric Neuroendocrine Tumors (G-Nets): Incidence, Prognosis and Recent Trend Toward Improved Survival. Cell Physiol. Biochem. 2018, 45, 389–396. [Google Scholar] [CrossRef] [PubMed]
  2. Cancer.net: Neuroendocrine Tumors/Introduction [Internet]. Available online: https://www.cancer.net/cancer-types/neuroendocrine-tumors/introduction (accessed on 1 August 2023).
  3. Neuroendocrine Tumors: Statistics [Internet]. It Is Estimated That, Has Been Increasing for Years. Available online: https://www.cancer.net/cancer-types/neuroendocrine-tumors/statistics#:~:text=Overall%2C (accessed on 1 August 2023).
  4. Robertson, R.G.; Geiger, W.J.; Davis, N.B. Carcinoid tumors. Am. Fam. Physician 2006, 74, 429–434. [Google Scholar] [PubMed]
  5. Dasari, A.; Shen, C.; Halperin, D.; Zhao, B.; Zhou, S.; Xu, Y.; Shih, T.; Yao, J.C. Trends in the incidence, prevalence, and survival outcomes in patients with neuroendocrine tumors in the United States. JAMA Oncol. 2017, 3, 1335–1342. [Google Scholar] [CrossRef] [PubMed]
  6. Kaderli, R.M.; Spanjol, M.; Kollár, A.; Bütikofer, L.; Gloy, V.; Dumont, R.A.; Seiler, C.A.; Christ, E.R.; Radojewski, P.; Briel, M.; et al. Therapeutic Options for Neuroendocrine Tumors: A Systematic Review and Network Meta-analysis. JAMA Oncol. 2019, 5, 480–489. [Google Scholar] [CrossRef] [PubMed]
  7. Horton, K.M.; Kamel, I.; Hofmann, L.; Fishman, E.K. Carcinoid Tumors of the Small Bowel: A Multitechnique Imaging Approach. Am. J. Roentgenol. 2004, 182, 559–567. [Google Scholar] [CrossRef] [PubMed]
  8. Chung, C.S.; Tsai, C.L.; Chu, Y.Y.; Chen, K.C.; Lin, J.C.; Chen, B.C.; Sun, W.C.; Yen, H.H.; Chen, C.Y.; Wu, I.C.; et al. Clinical features and outcomes of gastric neuroendocrine tumors after endoscopic diagnosis and treatment a digestive endoscopy society of tawian (dest). Medicine 2018, 97, e12101. [Google Scholar] [CrossRef] [PubMed]
  9. Folkestad, O.; Wasmuth, H.H.; Mjønes, P.; Fougner, R.; Hauso, Ø.; Fossmark, R. Survival and disease recurrence in patients operated for small intestinal neuroendocrine tumors at a referral hospital. Surg. Oncol. 2020, 35, 336–343. [Google Scholar] [CrossRef] [PubMed]
  10. Kim, B.S.; Park, Y.S.; Yook, J.H.; Oh, S.T.; Kim, B.S. Differing Clinical Courses and Prognoses in Patients with Gastric Neuroendocrine Tumors Based on the 2010-WHO Classification Scheme. Medicine 2015, 94, e1748. [Google Scholar] [CrossRef] [PubMed]
  11. Rosenblum, R.E.; Harris, C.K.; Baeg, K.J.; Starr, J.A.; Brais, L.K.; Stashek, K.M.; Ward, S.C.; Katona, B.W.; Clancy, T.E.; Wisnivesky, J.P.; et al. Predictors of Recurrence and Survival in Patients with Surgically Resected Pancreatic Neuroendocrine Tumors. Pancreas 2020, 49, 249–254. [Google Scholar] [CrossRef] [PubMed]
  12. Prisma Guidelines [Internet]. Available online: http://www.prisma-statement.org/Extensions/NetworkMetaAnalysis (accessed on 1 August 2023).
  13. IJNS. MOOSE (Meta-Analyses of Observational Studies in Epidemiology) Checklist. 2019. Available online: https://www.elsevier.com/__data/promis_misc/ISSM_MOOSE_Checklist.pdf (accessed on 1 August 2023).
  14. Aging Changes in Immunity [Internet]. Available online: https://medlineplus.gov/ency/article/004008.htm#:~:text=As you grow older%2C (accessed on 1 August 2023).
  15. Niederle, M.B.; Hackl, M.; Kaserer, K.; Niederle, B. Gastroenteropancreatic neuroendocrine tumours: The current incidence and staging based on the WHO and European Neuroendocrine Tumour Society classification: An analysis based on prospectively collected parameters. Endocr. Relat. Cancer 2010, 17, 909–918. [Google Scholar] [CrossRef] [PubMed]
  16. Zhu, L.M.; Tang, L.; Qiao, X.W.; Wolin, E.; Nissen, N.N.; Dhall, D.; Chen, J.; Shen, L.; Chi, Y.; Yuan, Y.Z.; et al. Differences and similarities in the clinicopathological features of pancreatic neuroendocrine tumors in China and the United States: A multicenter study. Medicine 2016, 95, e2836. [Google Scholar] [CrossRef] [PubMed]
  17. Coriat, R.; Walter, T.; Terris, B.; Couvelard, A.; Ruszniewski, P. Gastroenteropancreatic Well-Differentiated Grade 3 Neuroendocrine Tumors: Review and Position Statement. Oncologist 2016, 21, 1191–1199. [Google Scholar] [CrossRef] [PubMed]
  18. Oronsky, B.; Ma, P.C.; Morgensztern, D.; Carter, C.A. Nothing But NET: A Review of Neuroendocrine Tumors and Carcinomas. Neoplasia 2017, 19, 991–1002. [Google Scholar] [CrossRef] [PubMed]
  19. McGrath, P.C.; Neifeld, J.P.; Lawrence, W., Jr.; Kay, S.A.U.L.; Horsley, J.S., 3rd; Parker, G.A. Gastrointestinal sarcomas: Analysis of prognostic factors. Ann. Surg. 1987, 206, 706–710. [Google Scholar] [CrossRef] [PubMed]
  20. NIH: Cancer Staging [Internet]. Available online: https://www.cancer.gov/about-cancer/diagnosis-staging/staging (accessed on 1 August 2023).
  21. Zaidi, M.Y.; Lopez-Aguiar, A.G.; Dillhoff, M.; Beal, E.; Poultsides, G.; Makris, E.; Rocha, F.; Crown, A.; Idrees, K.; Smith, P.M.; et al. Prognostic Role of Lymph Node Positivity and Number of Lymph Nodes Needed for Accurately Staging Small-Bowel Neuroendocrine Tumors. JAMA Surg. 2019, 154, 186–187. [Google Scholar] [CrossRef] [PubMed]
  22. Blair, R. HHS Public Access. Physiol. Behav. 2017, 176, 139–148. [Google Scholar]
  23. Ahmed, M. Gastrointestinal neuroendocrine tumors in 2020. World J. Gastrointest. Oncol. 2020, 12, 791–807. [Google Scholar] [PubMed]
  24. Ellis, L.; Shale, M.J.; Coleman, M.P. Carcinoid tumors of the gastrointestinal tract: Trends in incidence in England since 1971. Am. J. Gastroenterol. 2010, 105, 2563–2569. [Google Scholar] [CrossRef] [PubMed]
Figure 1. A flow diagram of the search and study selection process, should include the ref part according to the authors.
Gastrointestdisord 05 00033 g001
Figure 2. (A) Forest plot of age and survival. (B) Forest plot of age and survival after sensitivity analysis. Red described individual study and black diamond described pooled effect.
Gastrointestdisord 05 00033 g002
Figure 3. (A) Forest plot of grade and survival. (B) Forest plot of grade and survival after sensitivity analysis.
Gastrointestdisord 05 00033 g003aGastrointestdisord 05 00033 g003b
Figure 4. Forest plot of lymph node positivity and survival.
Gastrointestdisord 05 00033 g004
Figure 5. (A) Forest plot of ki-67 more than 5% and survival. (B) Forest plot of ki-67 more than 5% and survival after sensitivity analysis.
Gastrointestdisord 05 00033 g005
Table 1. Study characteristics and collected data on prognostic factors.
Study Name, YearCountryStudy PeriodSample SizeNET SiteOverall SurvivalPrognostic Factors
Folkestead et al., 2020NorwayJanuary 1998–May 2018186Intestinal5-year survival: 75.8%
9.7 years (95%CI 7.7–11.6)
Age, gender, and Positive Lymph node
Tan et al., 2020ChinaJanuary 2009 to December 201788PancreaticNAAge, Ki-67, and positive lymph nodes
Liu et al., 2020ChinaFebruary 2003–February 2014155Gastroenteropancreatic
(GEP) NENs
1-year = 82%, 3-year = 72%, 5-year = 51%Grade and positive lymph nodes
Kim et al., 2015Korea1996–2014175GastricNAAge, gender, grade, and positive lymph node
Ptasnuka et al., 2019Latvia2006–2018205Gastropancreatic1-year: 88.0% (95%CI 83.3–92.7)
3 year: 77.1% (95%CI 70.4–83.8)
NA
Pellat A et al., 2019France2000–201673GI pancreatic5-year OS 50% (25–50%)Age, gender, Ki-67, and positive lymph nodes
Yang et al., 2018China1973–20143740GastricNAAge, gender, and grade
Fathi et al., 2020USA1988–20121787Pancreatic5-year OS: 24.4%.Age, gender, grade, and positive lymph nodes
Cetinkaya et al., 2014Norway1982–2010114Pancreatic5-year OS: 53.9% (95% CI: 43.4–63.3)NA
Zang et al., 2014China2003–2012168Gastroenteropancreatic
(GEP-NENs)
8.94 years (95% confidence interval (CI): 8.40–9.48)Age and gender
Fang et al., 2017South China2005–20151183GEP- NENs28 months (range, 4–135 months)Age, gender, grade,
and positive lymph nodes
Foubert et al., 2018FranceOctober 1994–October 2013151Intestinal and Pancreatic NETNAAge, grade, and Ki-67
Sakin et al., 2018Turkey2000–201685GEP NETNAAge and Ki-67
Rosenblum et al., 2020USA1990–2017501PancreaticNAAge, gender, and grade
Table 2. Prognostic factors of poor outcomes.
Prognostic Factors of Poor Outcomes
  • Pooled HR
  • 95%CI
  • p-Value
  • I2 Value
  • p-Value
  • z Value
Sensitivity Analysis
  • Pooled HR
  • 95% CI
  • p-Value
Sensitivity Analysis
  • I2 Value
  • p-Value
Age
  • 1.20
  • 1.06–1.36
  • 0.005
  • 80%
  • p < 0.00001
  • 2.84
  • 1.11
  • 1.05–1.18
  • 0.0004
  • 32%
  • p = 0.17
Grade 3
  • 2.73
  • 1.36–5.47
  • 0.005
  • 92%
  • p < 0.00001
  • 2.83
  • 4.53
  • 3.54–5.58
  • p < 0.00001
  • 0%
  • p = 0.72
Lymph node positivity
  • 1.49
  • 1.13–1.96
  • 0.005
  • 81%
  • p < 0.0001
  • 2.81
  • 1.20
  • 0.97–1.48
  • p = 0.09
  • 72%
  • p = 0.007
Ki-67 more than 5%
  • 1.88
  • 0.99–3.55
  • p = 0.004
  • 77%
  • p = 0.05
  • 1.93
  • 2.39
  • 1.49–3.83
  • p = 0.0003
  • 0%
  • p = 0.47
Table 3. NOS Scale.
Table 3. NOS Scale.
StudiesSelectionComparabilityOutcomeOverall Quality/Overall Risk of Bias
Folkestead et al., 2020+++++High
Tan et al., 2020+++++Moderate
Liu et al., 2020++++++++Low
Kim et al., 2015++++++++Low
Ptasnuka et al., 2019+++++++Low
Pellat A et al., 2019++++++Moderate
Yang et al., 2018++++++++Low
Fathi et al., 2020++++++High
Cetinkaya et al., 2014++++++Moderate
Zang et al., 2014++++++++Low
Fang et al., 2017++++++++Low
Foubert, 2018+++++High
Sakin, 2018++++++Moderate
Rosenblum et al., 2020++++++++Low
Disclaimer/Publisher’s Note: The statements, opinions and data contained in all publications are solely those of the individual author(s) and contributor(s) and not of MDPI and/or the editor(s). MDPI and/or the editor(s) disclaim responsibility for any injury to people or property resulting from any ideas, methods, instructions or products referred to in the content.

