Article

Effect of Heating Rate on Microstructure and Corrosion Resistance of Quenched and Tempered 8620 Low Carbon Alloy Steel

School of Engineering and Technology, Central Michigan University, Mt. Pleasant, MI 48859, USA
*
Author to whom correspondence should be addressed.
Corros. Mater. Degrad. 2024, 5(3), 370-386; https://doi.org/10.3390/cmd5030016
Submission received: 15 July 2024 / Revised: 17 August 2024 / Accepted: 27 August 2024 / Published: 29 August 2024

Abstract

:
In the process of heat treatment of 8620 low alloy steel, the heating rate is a critical parameter that must be carefully controlled to achieve the desired combination of microstructural features, mechanical properties, and corrosion resistance while simultaneously ensuring process efficiency and cost-effectiveness. This study investigates, for the first time, the microstructural evolution and electrochemical properties of 8620 steel under identical quenching and tempering heat treatment routes with slow-rate (SR) and fast-rate (FR) heating rates. Microstructural analysis revealed martensitic phases for SR, while FR exhibited a dual-phase microstructure containing ferrite. Upon tempering, for both samples, the martensite transformed into tempered martensite, with tempered (Temp) FR exhibiting around 50% smaller ferrite grains. Mechanical testing indicated that SR had 17% higher hardness than FR, although hardness decreased after tempering by 22% (SR) and 17% (FR). All electrochemical tests indicated that the as-quenched SR exhibited significantly superior corrosion resistance than FR. For instance, the polarization resistance of SR was 440 Ω higher than that of the FR samples. Tempering resulted in a considerable decrease in corrosion resistance for Temp SR, whereas Temp FR improved. Electrochemical characterization revealed Temp FR displayed close-to-ideal capacitive behavior and low double-layer capacitance, indicating enhanced overall corrosion resistance.

1. Introduction

Attempts to improve the performance and durability of industrial materials have led to extensive studies into the intricate relationship between microstructural development and corrosion resistance [1,2]. As a result of heat treatment, steels have significantly altered microstructures, affecting their morphology and mechanical properties, such as hardness, strength, toughness, and ductility [3]. Aside from its versatility and cost-effectiveness, 8620 steel is a top choice for many industries, including automotive, aerospace, machinery, and manufacturing. A number of applications require gears, shafts, axles, and crankshafts to be made out of this steel, making it an essential component [4]. Through heat treatments, its mechanical qualities can be adjusted to suit application needs [5].
In terms of strength, toughness, and corrosion resistance, 8620 steel has a well-rounded set of properties. A low-carbon and nickel-chromium alloy provides strength and toughness, as well as resistance to corrosion. Machining 8620 steel is also highly efficient, enabling the production of intricate parts with tight tolerances [6]. Compared to high-alloyed steel, 8620 steel is a more cost-effective alternative, providing a cost-effective solution for applications requiring a balance between cost and performance [7]. Its unique properties enable manufacturers to customize its mechanical properties through processes such as quenching and tempering [8]. A heat treatment process includes three main steps, namely heating, soaking, and cooling. The material is first heated to a desired temperature, held at this temperature to ensure uniform heat distribution, and then cooled to room temperature or a specified temperature. By controlling the heating rate, manufacturers can tailor the microstructure to achieve the desired combination of mechanical properties, ensuring that the steel meets the specific requirements of the intended application [9]. The heating rate affects the microstructure of the steel, which influences its mechanical properties as well as the resistance to corrosion [10,11]. Optimizing the heating rate allows manufacturers to create a microstructure that enhances the corrosion resistance of steel, thereby extending its durability and lifespan [11,12,13], and can reduce costs [14], i.e., reduction in material, processing, and maintenance costs. Further, improvements in corrosion resistance are in line with sustainability initiatives in a variety of industries.
Among the many ways in which the mechanical properties of 8620 steel can be improved are through quenching and tempering [15]. In this process, high temperatures are rapidly cooled to create a hardened microstructure that is highly wear-resistant and hard. Tempering is then applied to enhance toughness and ductility while maintaining adequate hardness [16]. When low-alloyed steels are tempered after quenching, they exhibit significant improvements in both their microstructure and corrosion resistance [17]. Tempering transforms martensite (a hard, brittle phase formed during quenching) into a mixture of ferrite, tempered martensite, and possibly other microstructural constituents based on the tempering temperature [18]. By undergoing this transformation, its hardness and strength are reduced while its toughness and ductility are enhanced, making it more suitable for certain applications. The tempering process can also improve corrosion resistance by relieving residual stresses and promoting the formation of a more stable passive oxide layer on the surface, which acts as a barrier to corrosion [16]. It is important to remember, however, that the specific effect of tempering on microstructure and corrosion resistance depends on a few factors, such as tempering temperature, tempering time, and alloy composition, which requires careful monitoring and optimization of the tempering process in order to achieve desired material properties [19,20]. Accordingly, it was found in another study that when tempering is done within the temperature range of 200 °C to 700 °C, 8620 steel results in reduced hardness and the best corrosion resistance at around 500 °C [17].
NaCl is a highly corrosive agent commonly found in marine and chemical processing facilities, as well as oil and gas production facilities [21]. It is essential to understand how 8620 steel performs under these conditions because metal components exposed to saltwater may experience rapid corrosion. In NaCl solutions, chloride ions promote the formation of aggressive corrosion products, such as iron chloride compounds, which accelerate corrosion [22]. It is possible for this to cause localized corrosion phenomena, such as pitting and crevice corrosion, which can severely compromise the structural integrity of metallic components.
As a result of optimizing the heating rate during heat treatment, energy can be saved, and production costs can also be reduced. In order to improve the overall efficiency of the production process, manufacturers can carefully control the heating parameters in order to minimize the time and energy required to heat the steel to the desired temperature [19]. The result is not only a reduction in energy consumption but also savings in operating costs and increased competitiveness in the manufacturing process [23]. Controlling this process not only reduces the release of significant amounts of heat during fossil fuel burning but also has positive environmental implications, such as diminishing emissions and minimizing the overall environmental impact of steel production. Energy-efficient processes are also responsible for reducing greenhouse gas emissions and contributing to sustainable manufacturing practices, which are in line with global efforts to mitigate climate change and preserve natural resources [24].
This study introduces a novel investigation into the microstructural evolution and corrosion resistance of 8620 low-carbon alloy steel subjected to two distinct heating rates during the heat treatment process. While previous research has extensively examined the effects of heat treatment on steel microstructures, the specific influence of varying heating rates on the microstructure and corrosion resistance of 8620 steel has not been properly explored. This study uniquely addresses this gap by comparing the microstructures and electrochemical behaviors of cold-rolled wrought 8620 steel under slow and fast heating rates. The findings provide valuable insights into how the heating rate can be optimized to enhance the material’s performance, making this research a noteworthy contribution to the field of metallurgical engineering and materials science.

2. Materials and Methods

2.1. Sample Preparation

This study examined a cold-rolled, wrought 8620 low-carbon alloy steel acquired from Alro Steel company in Clare, Michigan, MI, USA; whose composition is described in detail in Table 1. To prepare specimens, a rod of 8620 steel was turned into a coin-shaped sample clone with a thickness of about 5 mm and a diameter of 25 mm using a lathe machine.

2.2. Heat Treatment

The samples were heated up to an annealing temperature of 850 °C ± 8 °C under two different heating rates in THERMOLYNE 2000 furnace model FC2025P (Thermo Fisher Scientific Inc., Pittsburgh, PA, USA). The first heating rate was carried out according to the standard warming-up rate of the furnace; that is, the specimens were placed in the furnace, and then the furnace was turned on. Approximately 35 min were required to reach 850 °C; the heating rate was approximately 0.4 °C/s (0.3928 °C/s), which is called the slow rate (SR) heating rate. Subsequently, after achieving 850 °C, a second sample was added to the furnace, resulting in a faster heating of the sample, also known as fast rate (FR). As a result of opening and closing the furnace’s closure in order to add another sample, the temperature in the chamber temporarily decreased, and it took 14 s for the temperature to stabilize at 850 °C. Consequently, the FR was approximately 59 °C/s (58.92 °C/s). A 40 min soaking time was established for both SR and FR samples in the furnace at an isotherm temperature of 850 °C. After the soaking step, both samples were immediately quenched in DI water (Deionized water) at 25 °C. For tempering heat treatment, both samples were placed in the furnace and slowly heated to 500° C with the heating rate of 0.5 °C/s (this stage takes roughly 15 min to reach 500 °C) and soaked for 20 min, followed by a moderate cooling process in the air outside of the furnace. Figure 1 demonstrates a diagram of heat treatment for heat-treated samples based on time and temperature.

2.3. Material Characterization

The samples were mechanically sanded from 120 to 1200 grit, cleaned with ethanol, and then air dried at room temperature. The specimen surfaces were further mirror polished using a polishing cloth with 3 μm to 1 μm diamond suspension and etched with a 2% Nital solution (ES Laboratory, Glendora, CA, USA) for the purpose of revealing their grain boundaries. Through trial and error, the best etching time was determined to be between 4 and 7 s per sample, with specimens with lower ferrites requiring a longer etching time than those containing martensitic phases. Microstructural analyses were performed using the Hitachi S-3400-II (Hitachi High-Tech Corporation, Tokyo, Japan) Scanning Electron Microscope (SEM). The Cascade Microtech M150 (FormFactor, Livermore, CA, USA) Optical Microscope (OM) was used to examine the quality of the etching process. Quantification of phases, grain sizes, and phase distribution was achieved using point calculation and image binarization techniques with the Windows version of ImageJ/Fiji v2.15, an open-source image processing application.

2.4. Hardness Test

The hardness measurements were conducted using a LECO RT-120A (LECO Corporation, St. Joseph, MI, USA) testing system with a Rockwell C (ASTM E18) indenter using a 150 kgf load and a 10 s dwell time. The microhardness of the sample was measured at six points, each separated by at least 25 μm, starting at 25 μm from the sample edge. Prior to evaluating each 8620 specimen, the hardness tester machine had been calibrated with a standard sample block to ensure accuracy.

2.5. Electrochemical Test

The electrochemical measurements were conducted in a solution of 3.5% NaCl serving as the electrolyte medium, utilizing analytical grade chemicals and high-purity Milli-Q water. During electrochemical testing, a Gamry Reference 1000E (Gamry Instruments, Warminster, PA, USA) potentiostat was utilized with three electrodes, with 8620 steel samples as the working electrode, platinum coils as the counter electrode, and saturated calomel electrodes as the reference electrode. After polishing, the samples were cleaned in an ultrasonic bath with distilled water, then rinsed with acetone and ethanol, and rinsed again with distilled water before drying in the air. Prior to each test, the Open-circuit Potential (OCP) was measured for at least 30 min in advance so that the system could stabilize. As part of the Potentiodynamic Polarization test (PDP), the potential was swept between −0.5 V vs. OCP and +1.5 V vs. OCP at a scan rate of 1 mV/s versus the reference electrode. During the electrochemical impedance spectroscopy (EIS) measurements, a 5 mV sinusoidal potential modulation was applied to OCP at 10 data points per decade, with a frequency range of 50 kHz to 10 mHz.
It should be noted that in all the electrochemical tests, the exposed surface area of the working electrode was 1 cm2. The repeatability of the results was ensured by performing every test at least three times (n = 3).

3. Results and Discussion

3.1. Microstructure and Phase Morphology

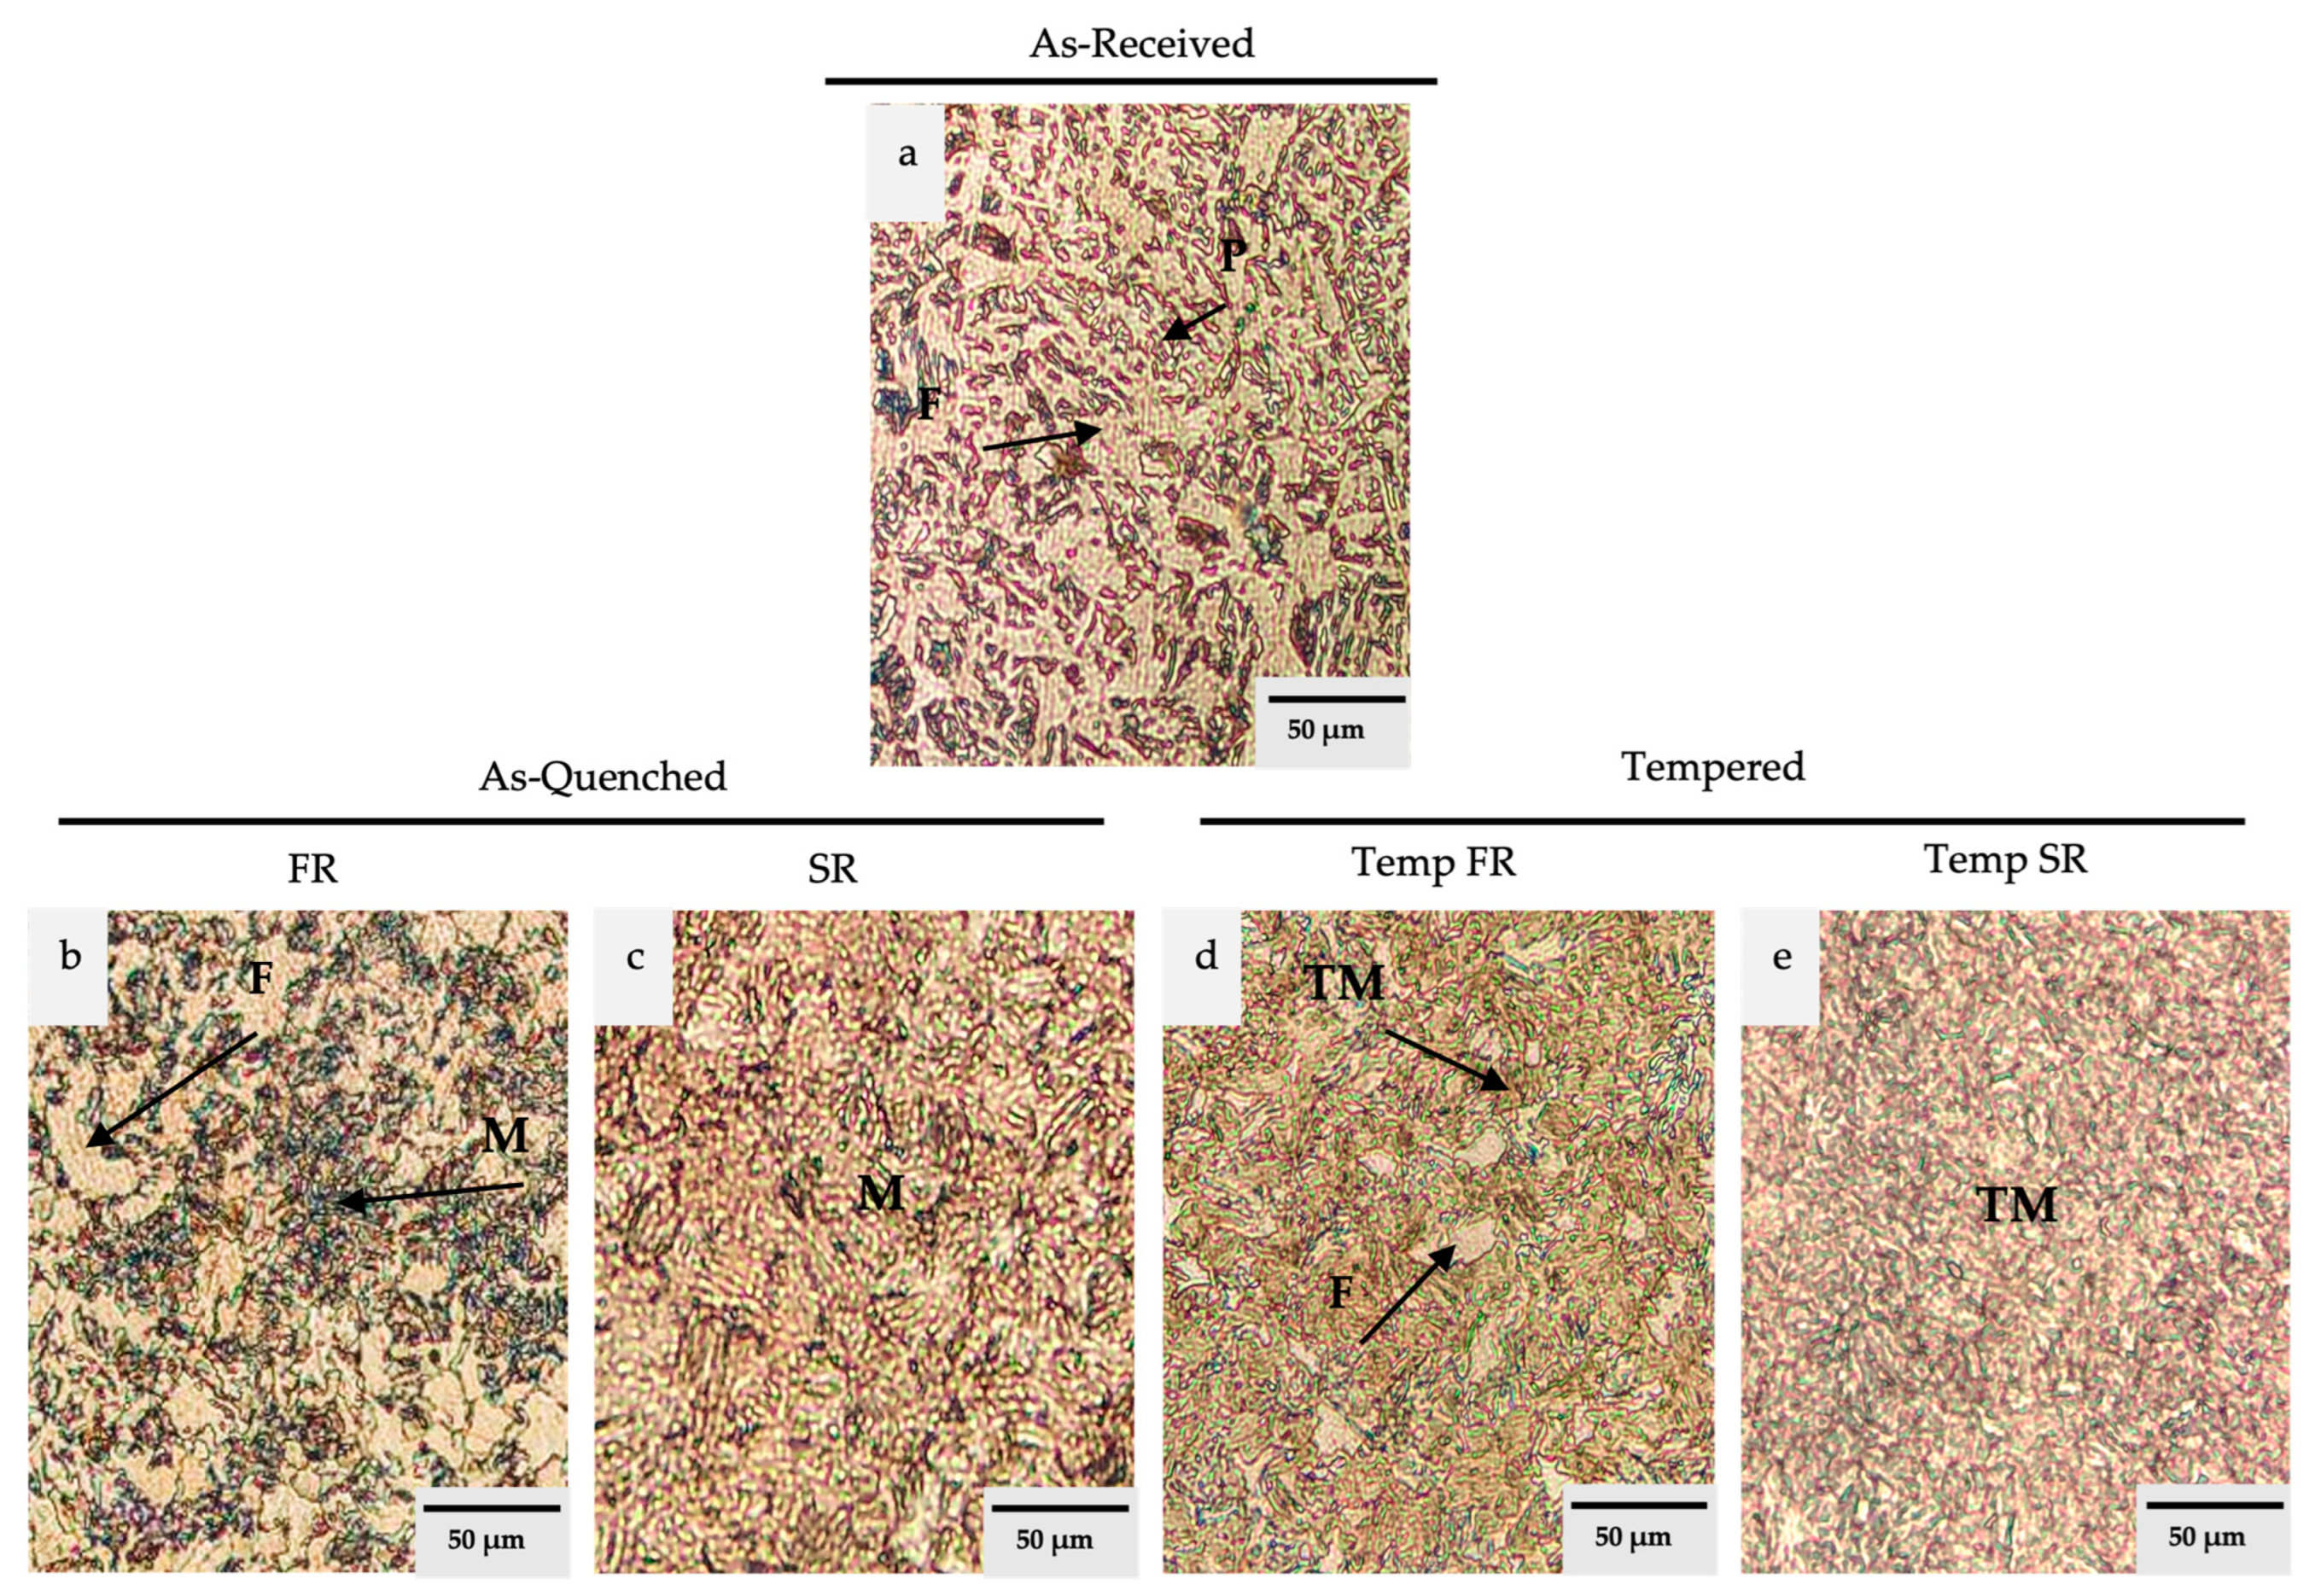
In Figure 2, various magnifications of SEM micrography are selected. To consider a more detailed look, more magnification depictions were employed for the heat-treated samples. Figure 2a illustrates the microstructure of the as-received low alloy steel 8620 that has not been heat-treated. Figure 3 presents optical microscopy images that illustrate the phase morphologies and grain size variations, aiding in the distinction between the different phases. Figure 2a and Figure 3a show the microstructure comprising ferrite (darker gray in SEM) and pearlite (lighter gray in SEM). The ferrite phase in the optical microscope (OM) results are depicted as the light pale area. These findings are consistent with previous studies, confirming the presence of these phases in cold-rolled 8620 steel [25,26,27]. In Figure 2 and Figure 3, the differentiation between martensite and pearlite is made based on their distinct morphologies, as observed in the SEM images. Martensite is recognized by its needle-like structure, whereas pearlite is characterized by its layered appearance. Nonetheless, it is acknowledged that these features can be difficult to distinguish using only SEM. Subsequent studies will seek to include EBSD analysis for a clear crystallographic determination of the phases identified.
Figure 2b,d are the SEM results of FR, whereas Figure 2c,e represent the SR samples of the as-quenched step of heat treatment. The figures of the as-quenched step are in 50 and 10 μm magnification, respectively. While the SR sample consists almost entirely of martensite (approximately 100%), the FR sample has a dual-phase microstructure with 44.6% martensite and 55.4% ferrite. The average grain size of the ferrite phase in the FR sample is 22 μm. During full recrystallization in SR, the existing ferrite and pearlite phases are expected to completely transform into austenite at approximately 850 °C during the soaking process. Subsequent quenching in deionized water leads to the transformation of 100% austenite into 100% martensite, which is precisely what was observed in the SR sample. The presence of the martensite phase following the quenching process of 8620 wrought steel has been consistently reported in previous studies [5,27]. In FR, ferrite and martensite morphology may well be caused by the effect of a faster heating rate on the start of recrystallization because an increase in heating rate retards recrystallization and increases the temperature of complete recrystallization [13,28]. During the transition from ferrite to austenite in the intercritical range, a faster heating rate may push the Ac1 (the temperature at which austenite begins to form during the heating cycle) to higher temperatures than a more gradual heating rate [28]. The heating rate can strongly affect the kinetics of the transformation from ferrite to austenite during the intercritical range [29]. Therefore, if the first stage of the heat treatment is conducted at a faster rate, a considerable amount of ferrite will remain after even 40 min of soaking time, followed by quenching to room temperature. Figure 2d,e, and Figure 3c also offer detailed insights into the formation of martensite structures. These figures illustrate a lath morphology with sharp, needle-like shapes arranged in a random acicular pattern (Figure 2e marked as Aq1). This structure, observed in Figure 2e and Figure 3c, is uniformly formed from prior–austenite and corresponds to the SR sample [16]. This formation, characterized by sharp, needle-like lath morphology (Figure 2e marked as Aq1) and a random acicular pattern, aligns with the high hardness observed in the samples and the quenching process applied. These structural features are consistent with the formation of fresh martensite, a phase known for its high hardness due to its unique crystal structure. The rapid cooling during quenching prevents the formation of other softer phases like pearlite or ferrite from austenite, leading to the formation of martensite’s distinctive microstructure. The observed morphology, combined with the increased hardness, supports the conclusion that the material underwent a complete transformation of austenite to martensite, as expected under the conditions of quenching and high thermal gradients. In contrast, in Figure 2d, along with Figure 3b, the ferritic matrix appears to be not completely dissolved during soaking and persists after quenching among the prior–austenite grain boundaries, which transforms into the martensite phase, resulting in a dual-phase morphology. The dual-phase microstructure of 8620 steel, typically comprising ferrite and martensite, strikes an optimal balance between strength and ductility. The ferrite phase provides a soft, ductile matrix, while the martensite phase enhances hardness and tensile strength [5]. This is reflected in the observed hardness differences, where the FR sample, containing both ferrite and martensite, exhibits lower hardness compared to the SR sample, which consists entirely of martensite.
The SEM images in Figure 2f–i depict the results of the tempering process at a magnification of 20 and 5 μm. Figure 2f,g and Figure 3d,e clearly exhibit tempered martensitic features that are uniform for Temp SR (Figure 2g and Figure 3e) and along with some ferrite for Temp FR (Figure 2f and Figure 3d). However, the Temp SR in Figure 2g,i and also Figure 3e, contained a fully tempered martensite, and the Temp FR in Figure 2f,h and Figure 3d are observed to be a dual-phase of some fine ferrite within a tempered martensite matrix. The researchers also observed that higher heating rates resulted in a more uniform distribution of BCC blocks than lower heating rates, resulting in an approximately 8 μm reduction in the maximum length of BCC blocks [9,19]. Furthermore, after tempering, the proportion of ferrite grains decreased from 55.4%, with an average grain size of 22 μm, to 27.7%, accompanied by a reduction in average grain size to 10.5 μm. The tempered martensite in the Temp FR sample exhibited less needle-like lath and a rougher morphology in more semi-spheroids round edge structures (in Figure 2i marked as Aq2). These changes are consistent with the observed decrease in hardness from the FR samples to the Temp FR samples after tempering.
Comparatively, Figure 2g,i and Figure 3e present a fine-tempered martensitic structure resulting from the previous quenched sample, which was fully martensite (Figure 2c,e). As a result of the higher heating rate, the average grain size of ferrite decreased by almost half. This indicates that the nucleation was more efficient at the beginning of recrystallization and subsequently culminated with smaller nucleation, especially for the ferrite phase formed after tempering (Temp FR) [19].
After quenching, the ferrite–pearlite structure became fully martensite under the implication of slow-rate heat treatment (SR), and after tempering, it became tempered martensite with lower hardness. For the fast rate, the dual-phase (martensitic and ferritic) structure was left with smaller ferritic grains distributed among tempered martensitic morphology at the end of the quenching process.

3.2. Mechanical Characterization

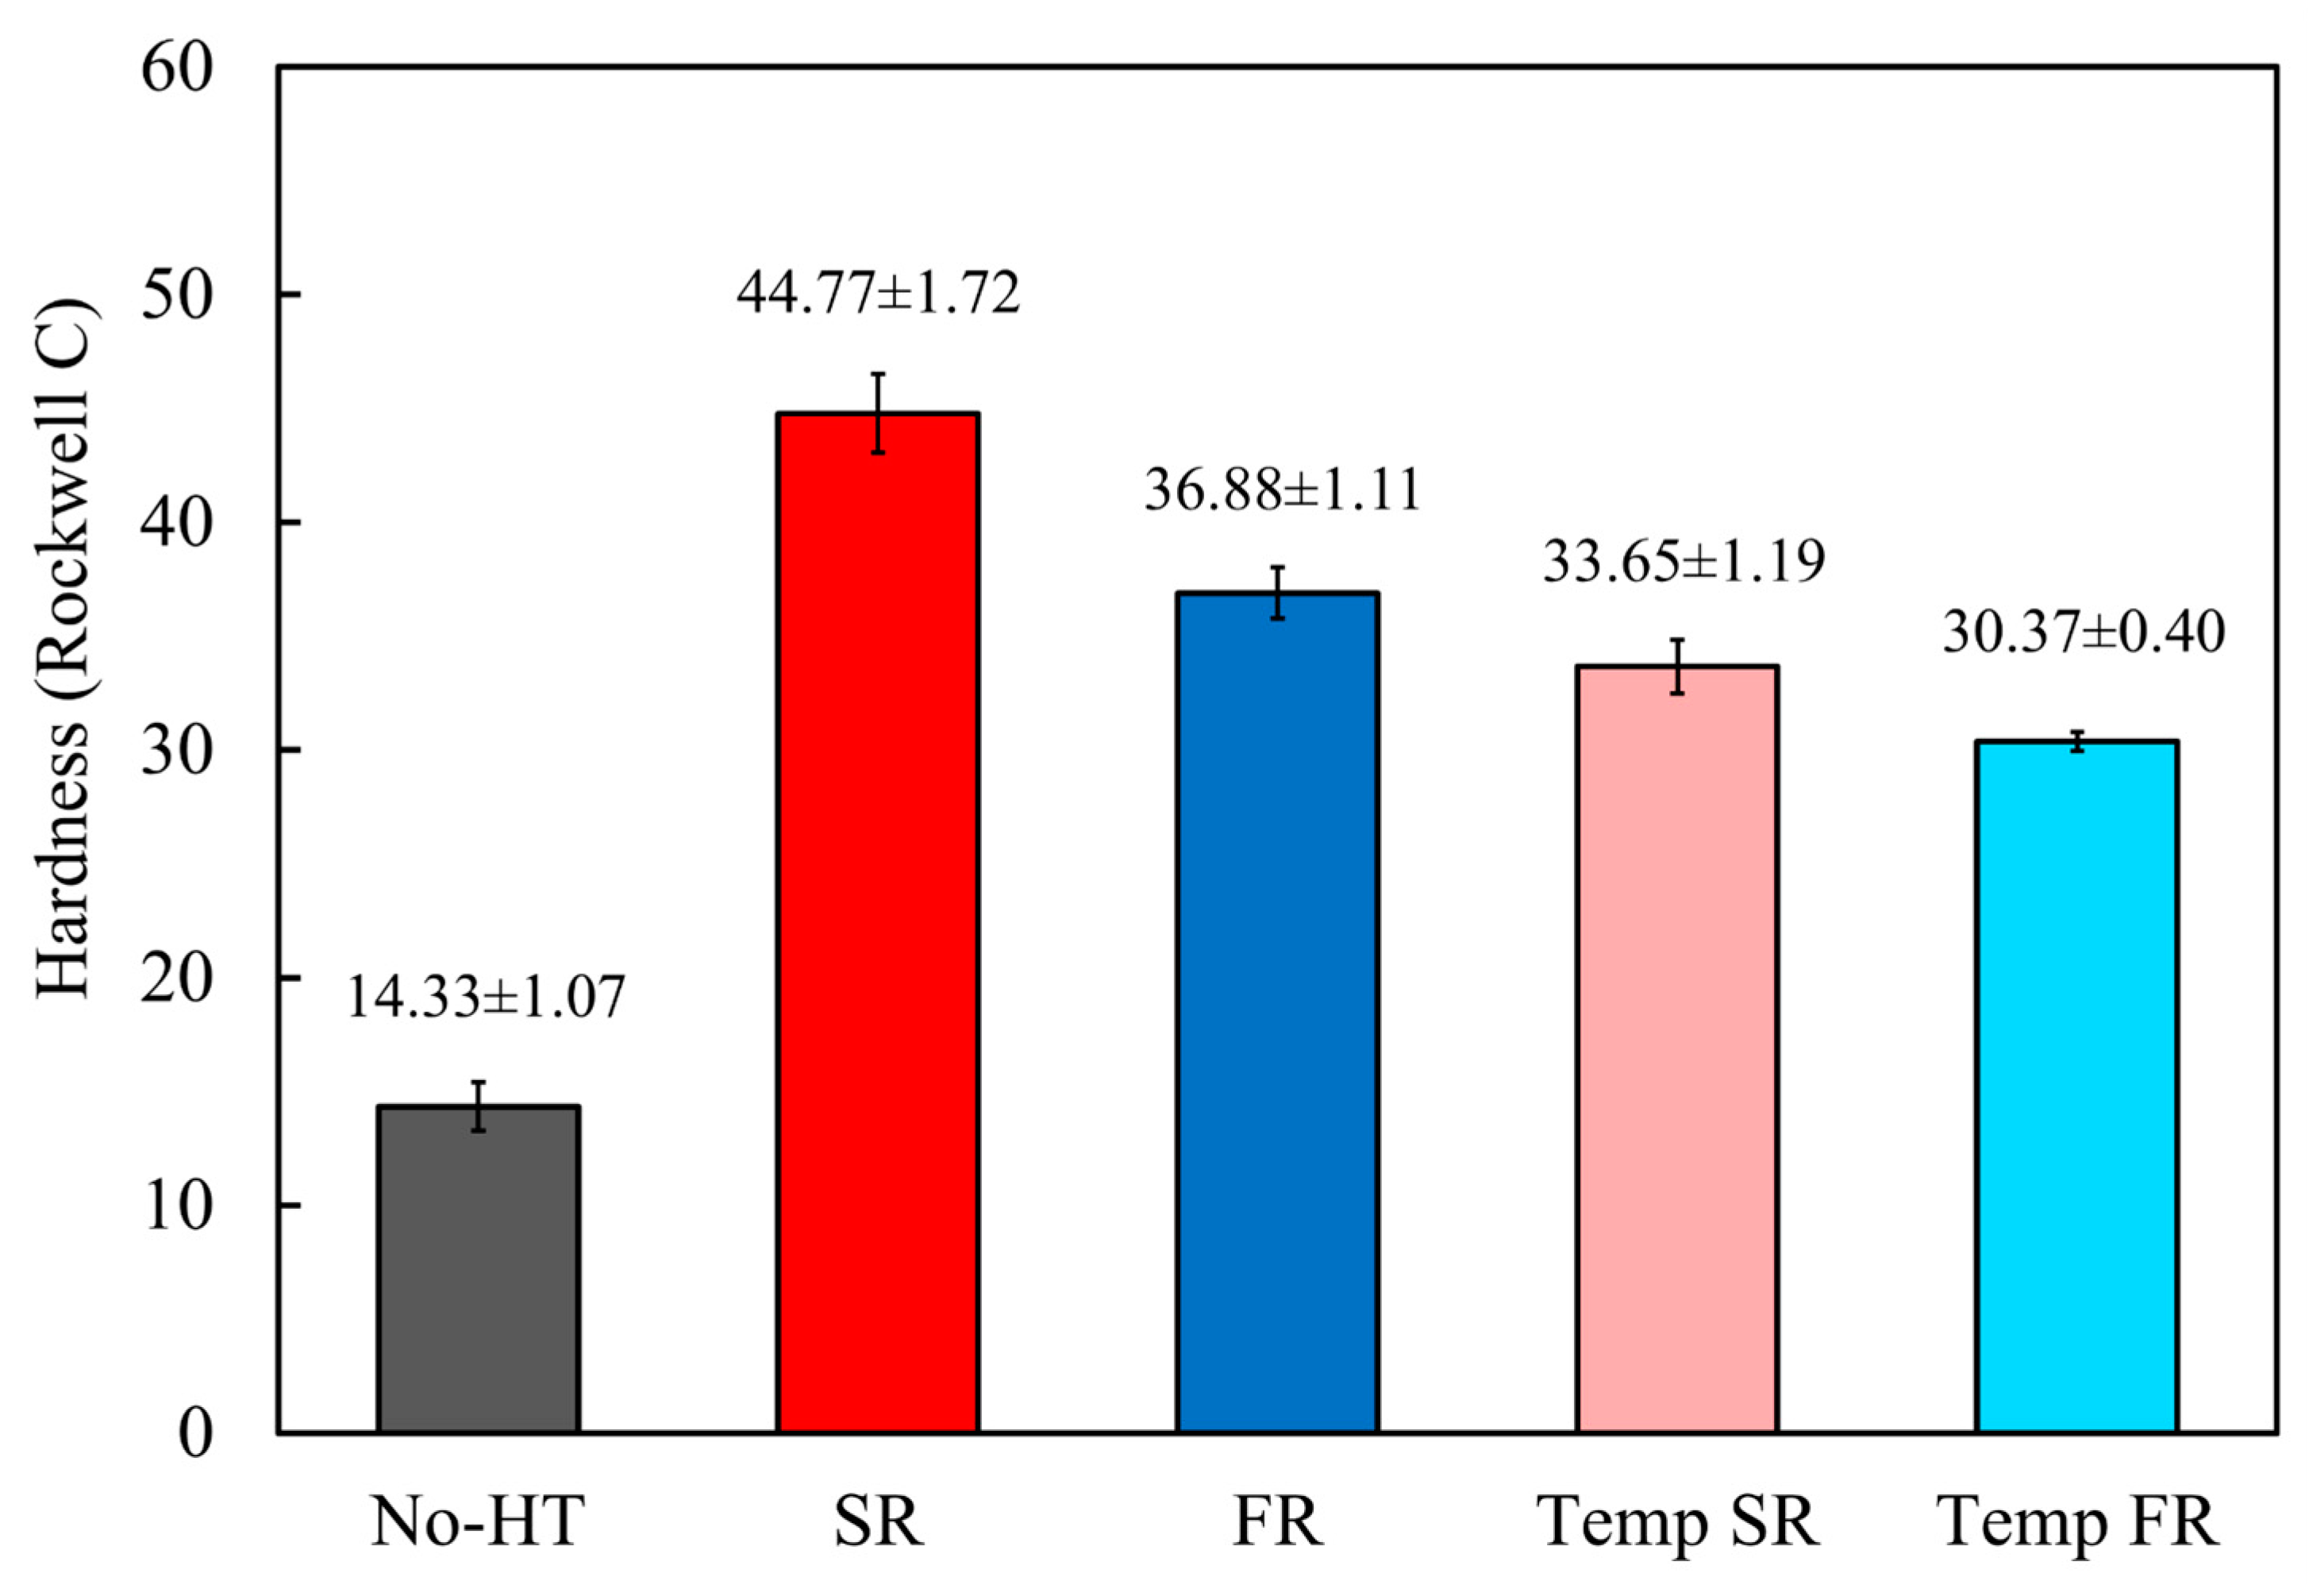
As an illustration of the hardness alteration, Figure 4 shows the average hardness of samples without heat treatment of 14.33 ± 1.07 (No-HT) and as-quenched fast and slow heating rates (FR, SR) of 36.88 ± 1.11 and 44.77 ± 1.72, respectively. Lastly, fast and slow heating rates after tempering (Temp FR, Temp SR) of 30.37 ± 0.40 and 33.65 ± 1.19. Both SR and FR samples had significant increases in hardness after heat treatment at various heating rates, whereas the SR sample showed a notably greater increase than the FR sample. A decrease in hardness is evident in Figure 4 following the application of tempering heat treatment.
It is noteworthy that despite the overall variation in hardness before and after tempering, this phenomenon shows a relatively larger change in hardness for SR to Temp SR with 11.12 HRC than for the other heating rate of 3.23 HRC due to the transformation of the martensite phase into a soft phase. As compared to the as-quenched, the difference between the hardness of Temp FR and Temp SR was lower. It is possible that the decrease in hardness and brittleness may be due to the transmutation of the fresh martensite phase, which has a higher hardness, into the tempered martensite, which has a lower hardness and a higher toughness during tempering [8]. Although the SR (Figure 2c,e) contains primarily martensite and a higher hardness average, the FR (Figure 2c,d) has a less hardness with a lower average due to the presence of ferrite. The increased hardness observed in SR samples post-quenching, coupled with the high martensite content, highlights the effectiveness of the heat treatment in enhancing mechanical properties. However, the observed drop in hardness after tempering underscores the trade-off between hardness and ductility, which is crucial for optimizing material performance.

3.3. Corrosion Behavior of 8620 Steel Specimens

3.3.1. Open-Circuit Potential

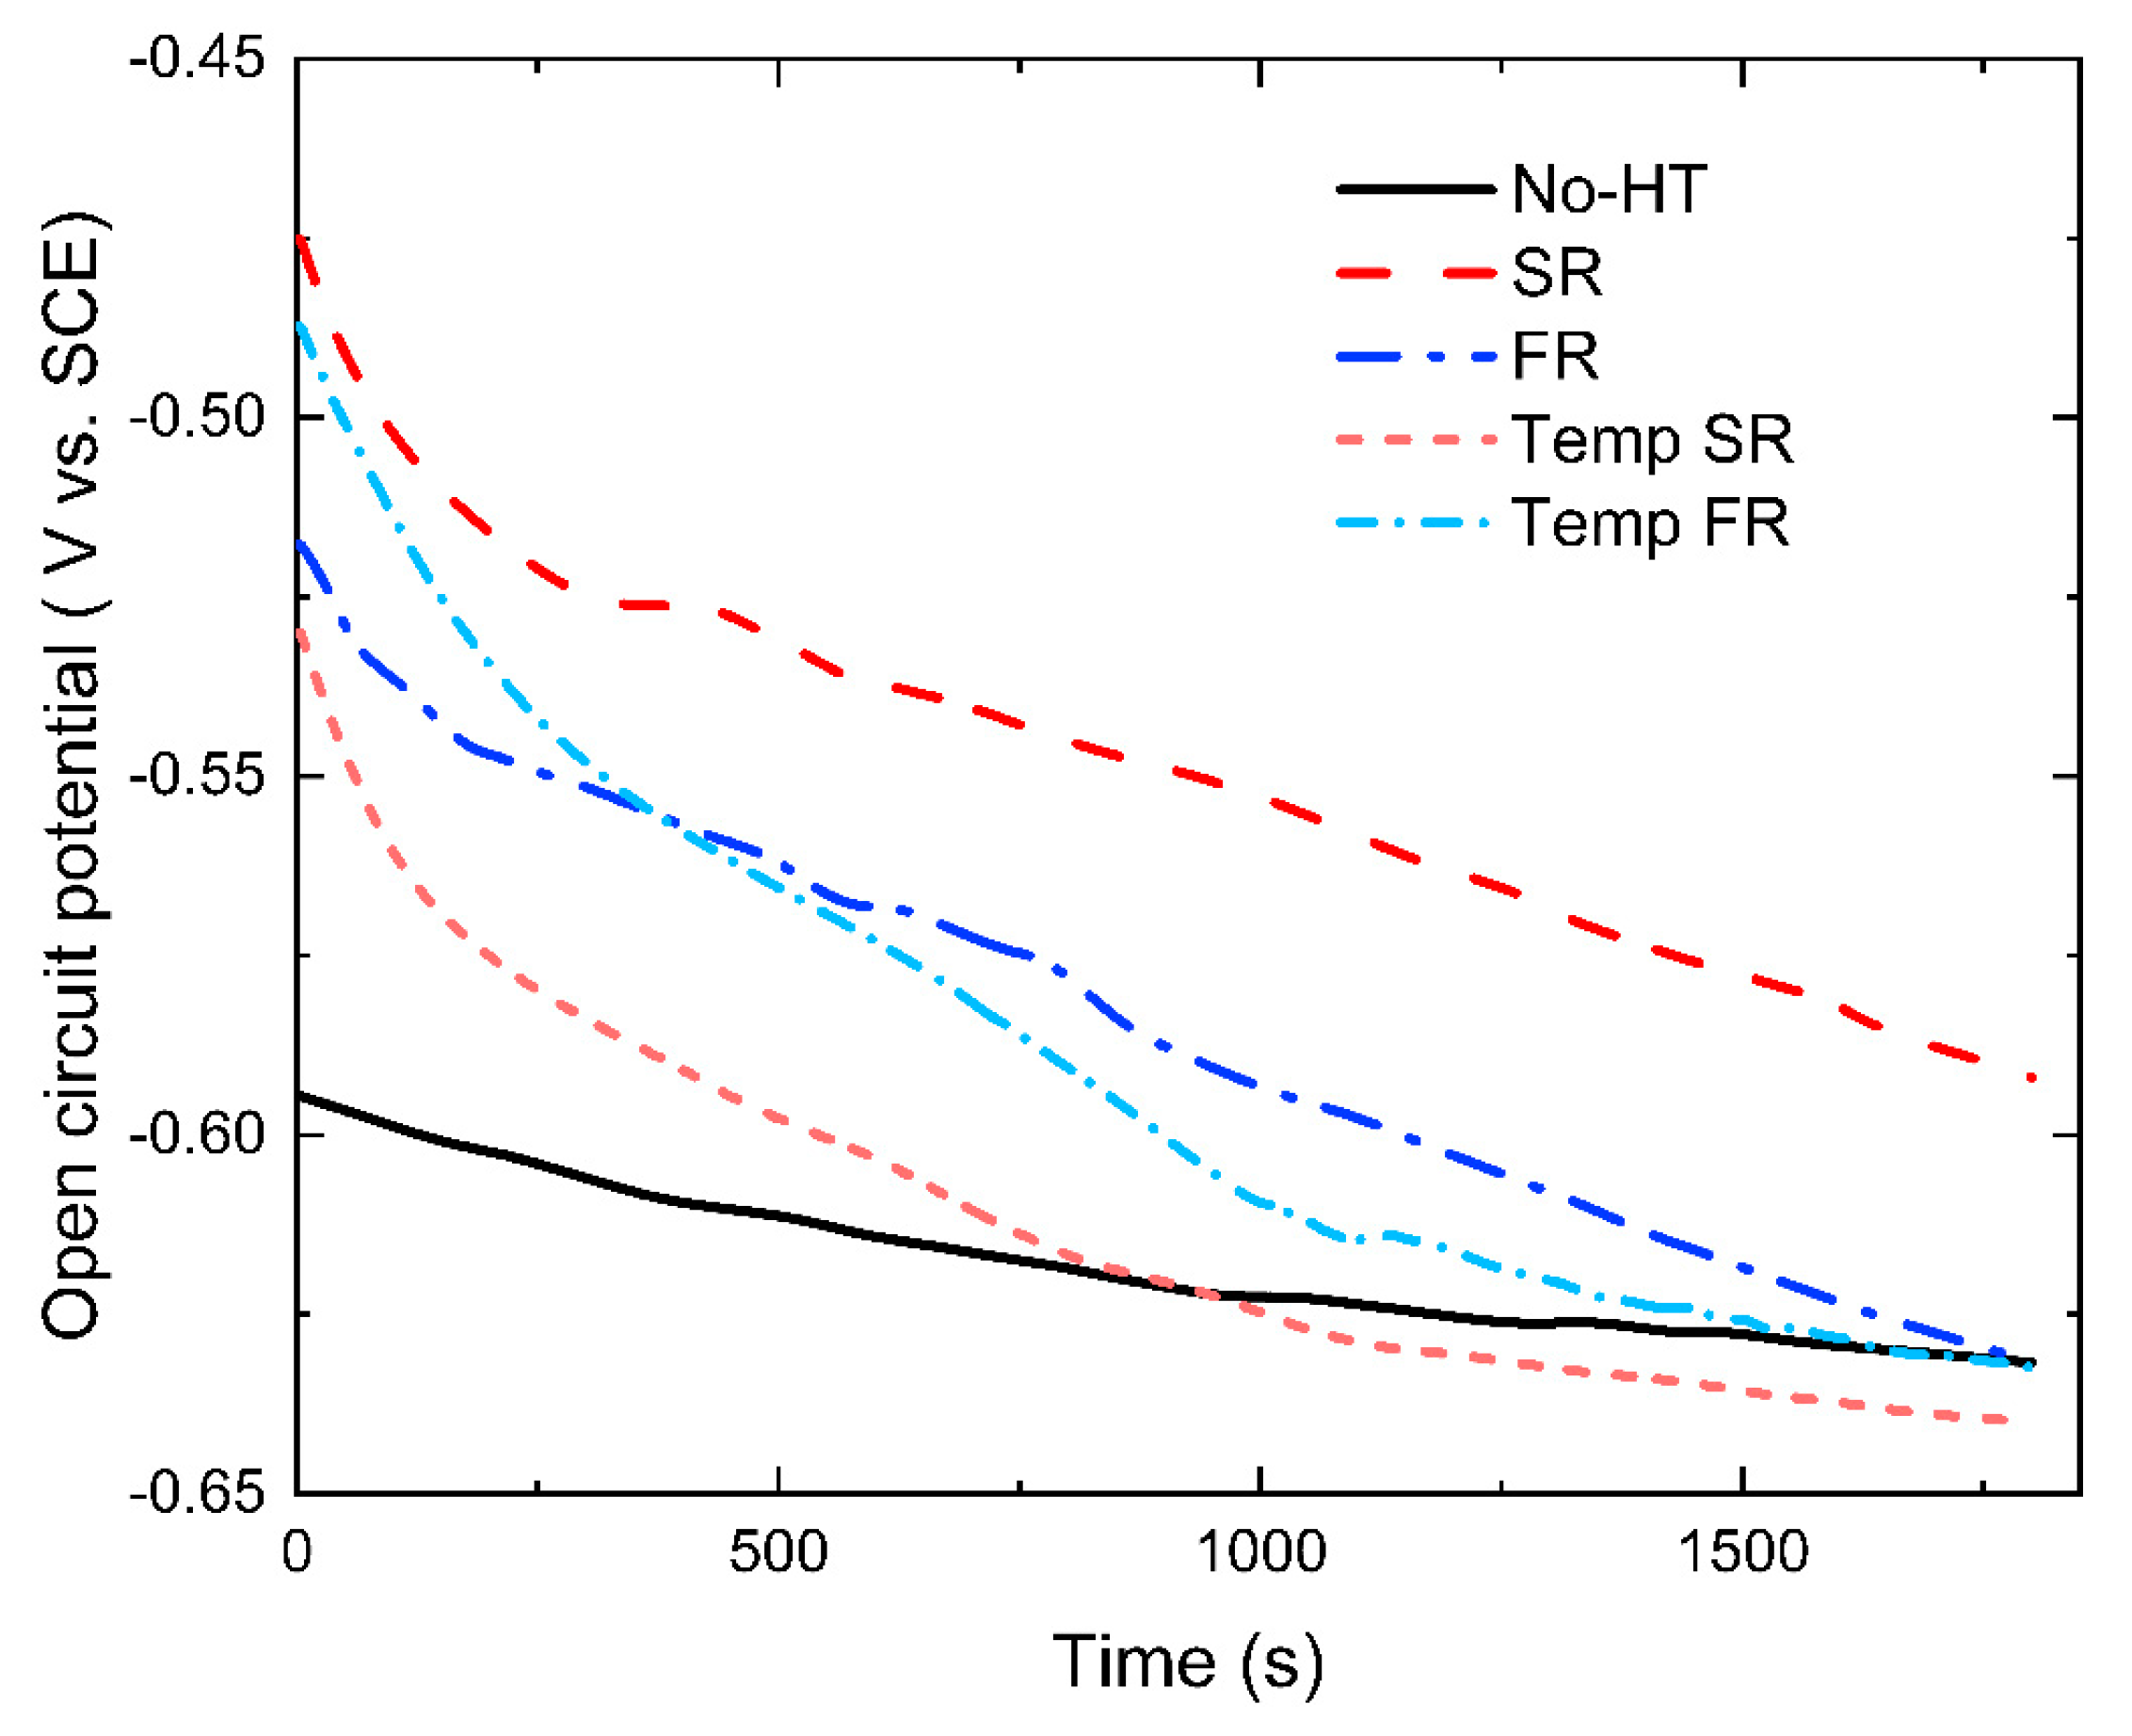
Figure 5 presents the OCP results of the No-HT and heat-treated specimens of 8620 low alloy steel in 3.5% NaCl electrolyte at room temperature. The curves of all the tested specimens moved gradually toward more negative values, as shown in Figure 5, with increasing exposure time to the electrochemical solution. This indicates that passive films that are formed in the open air are destroyed by electrochemical solutions applied to electrode surfaces.
The voltages of the OCP process for the SR and Temp FR were the same at the start, and both Temp SR and Temp FR had the same starting voltage. In response to an increase in immersion time, the negative tendency of corrosion potential (Ecorr) gradually increases, finally reaching a quasi-steady state after 1500 s. The variation of Ecorr was negligible after becoming steady, with the exception of SR, which had a less negative voltage of −0.595 VSCE. The Ecorr values of No-HT, FR, and Temp FR were about −0.632 VSCE, whereas that of the Temp SR specimen was about −0.644 VSCE. As a result, the as-quenched SR specimen has the superior voltage due to the most positive value (−0.595 VSCE). In contrast, after applying the tempering heat treatment, this value experienced a large change of −0.049 VSCE compared to FR and Temp FR, which largely maintained the same voltage after and before tempering.

3.3.2. Potentiodynamic Polarization

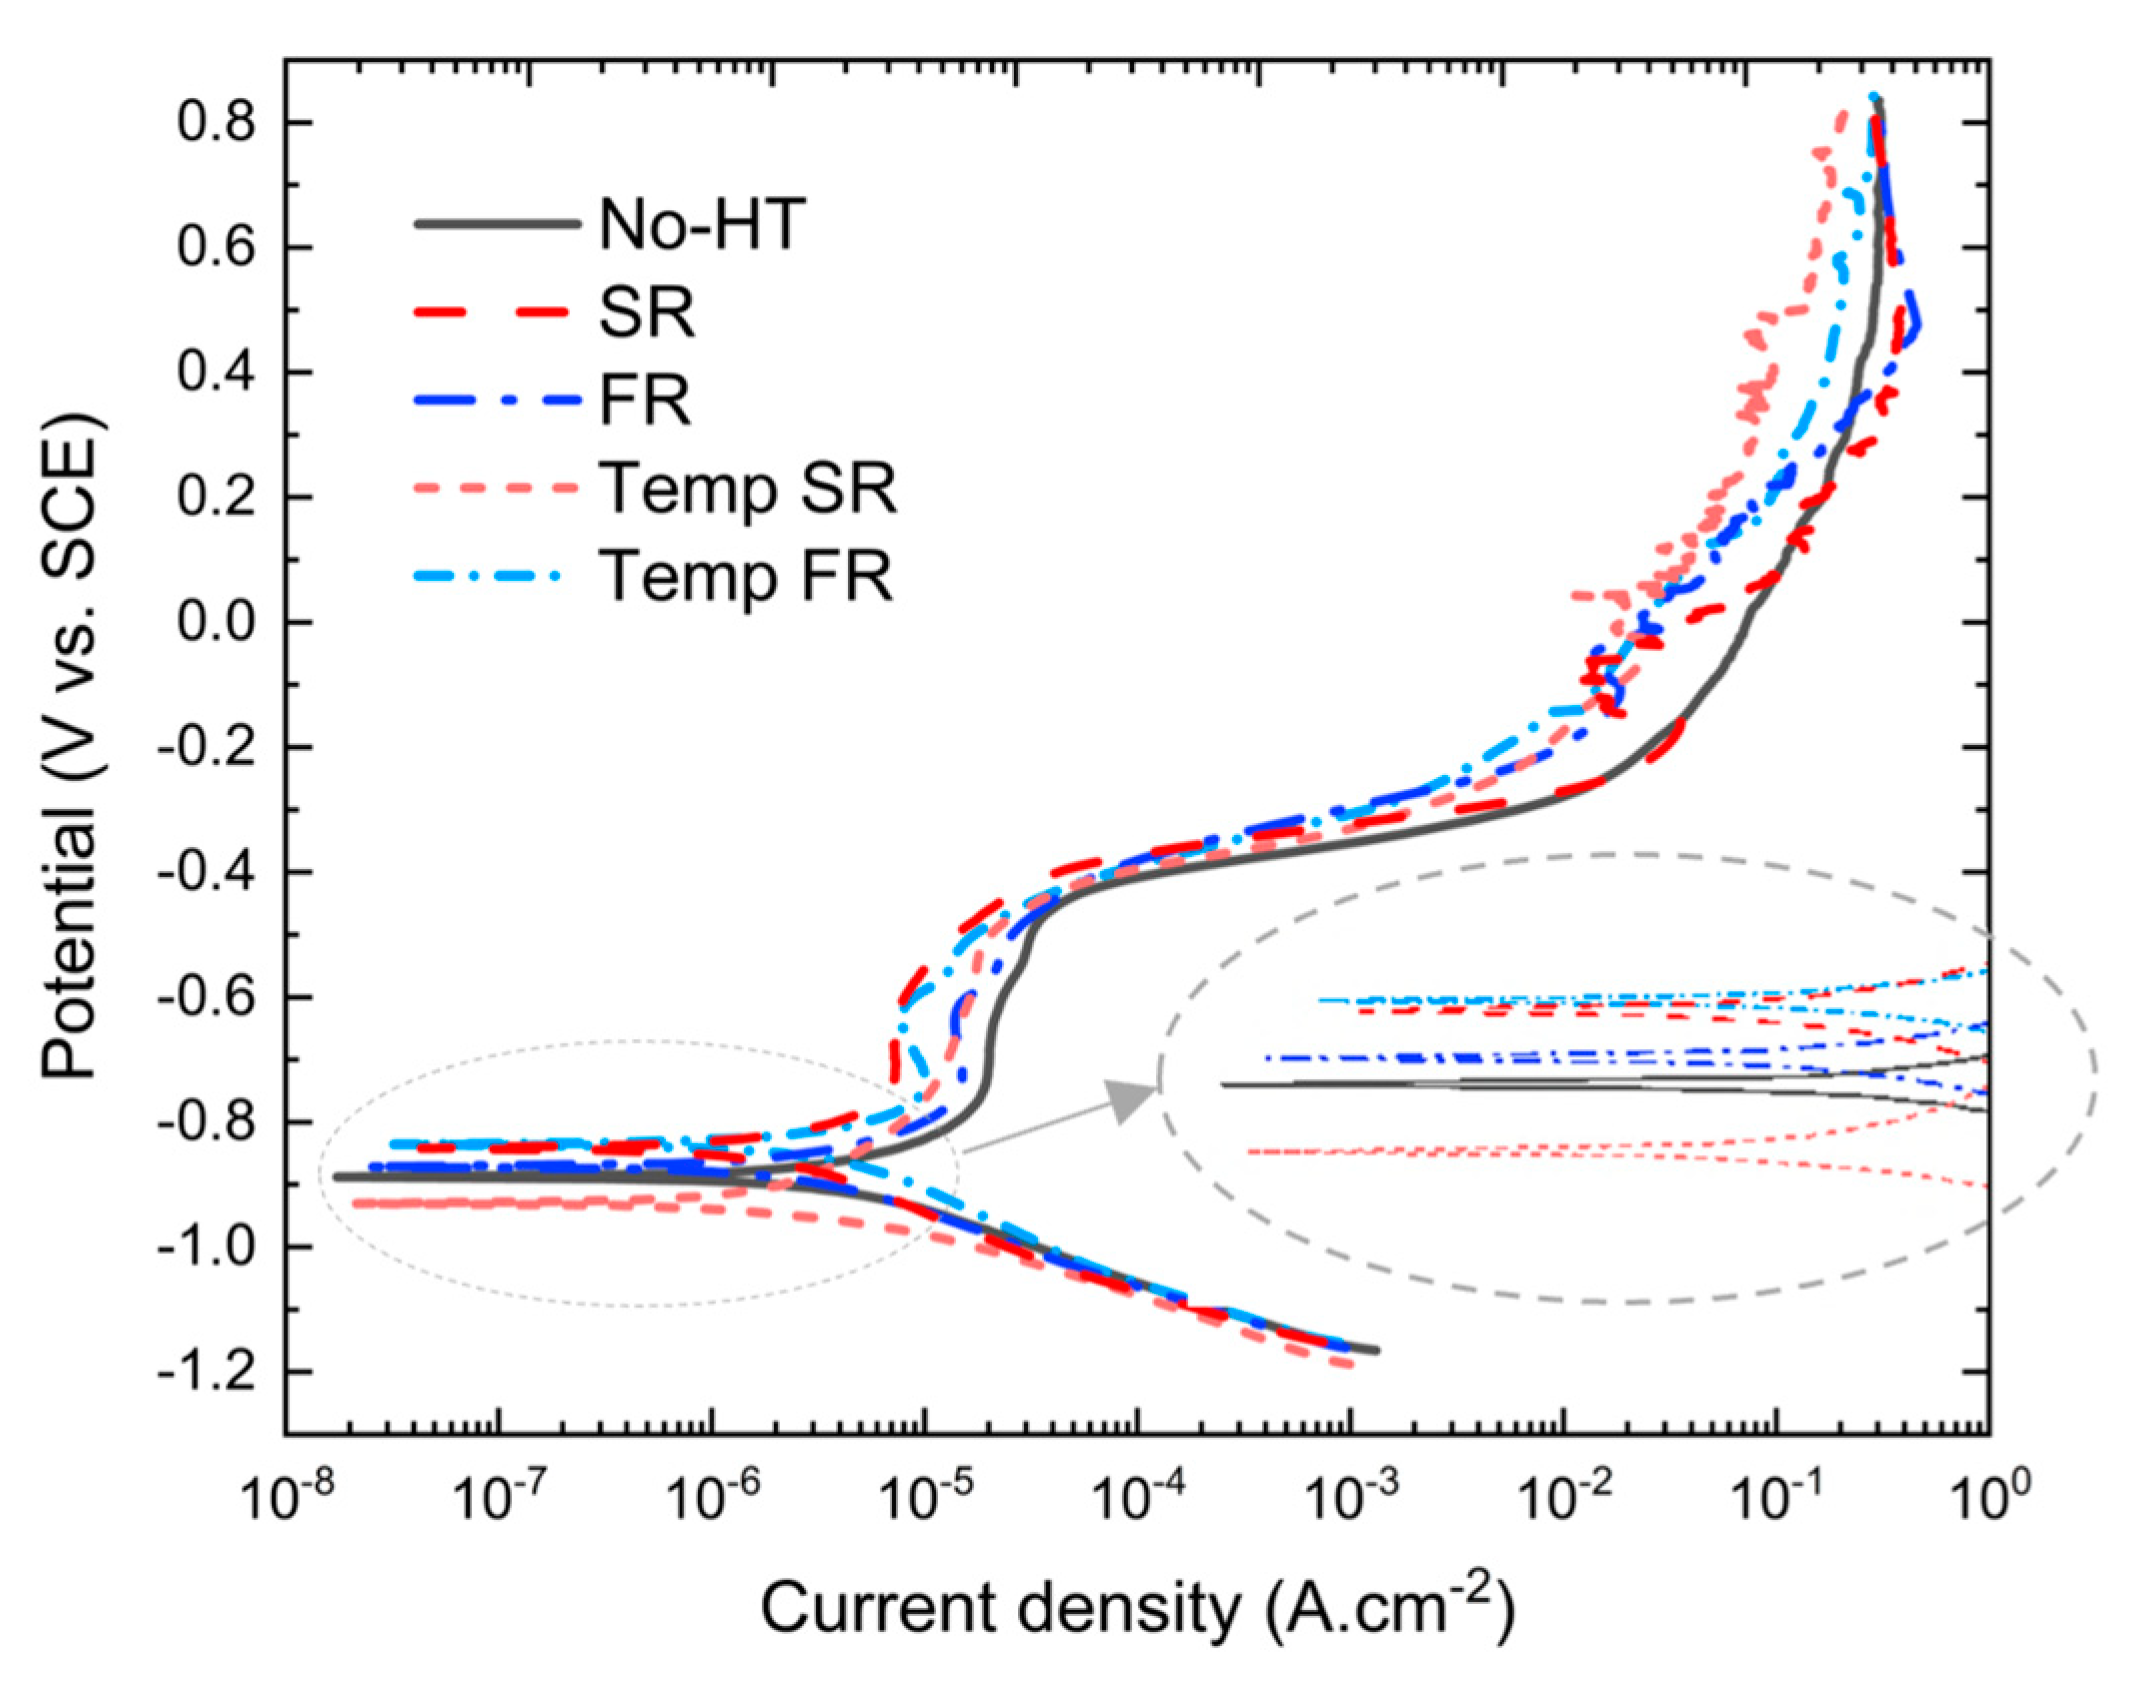
As shown in Figure 6, PDP scans, including cathodic branches, anodic branches, and corrosion current density, icorr, were used to examine the process of cathodic hydrogen evolution and anodic dissolution of tested specimens. The anodic and cathodic branches of the polarization curves were not symmetrical. Regardless of whether the specimens had been heat-treated or not, all specimens showed similar passivation behaviors in the anodic branches. The difference was made by a slight shift to the left side (toward lower current density) after applying heat treatment. The heat-treated specimens were tested under electrochemical examination at two step points (right after quenching and after tempering).
The electrochemical parameters that were extracted from PDP curves are presented in Table 2 using the Gamry Echem Analyst 2 software (version 7.10). Moreover, polarization resistance (RP), corrosion potential (Ecorr), corrosion current density (icorr), and Tafel anodic and cathodic slopes (βA and βC) are also listed for all samples. Table 2 presents RP values derived from the Stern–Geary equation [25,30] with a constant coefficient of 2.303 provided in Equation (1).
R P = β A β C 2.303 β A + β C i c o r r
The electrochemical values of the corrosion current density (icorr) and corrosion potential (Ecorr) were evaluated with polarization curves using Tafel extrapolation. The No-HT with the lowest RP of 6.726 ± 0.75 Ω·m2 and the highest corrosion rate of 5.55 ± 0.43 mpy (milli per year) illustrates the weakest corrosion resistance behavior. At the as-quenched step, SR showed a significant improvement than FR in corrosion resistance factors. Compared to the as-quenched FR, the tempered fast heating rate sample (Temp FR) indicated a decrease in corrosion tendency. This trend was the exact opposite of the SR and Temp SR, meaning that the Temp SR was more prone to corrosion than the SR. Among the heat-treated samples, the most effective corrosion resistance with a corrosion rate of 1.81 ± 0.21 mpy and the highest RP of 13.51 ± 1.05 Ω·cm2 belonged to Temp FR.
The results in Table 2 displayed that corrosion tendency and corrosion rate declined with performing tempering for samples treated under a rapid rate of heating up, while it had a negative effect on corrosion resistance (RP) of the samples treated under a glacially slow rate of heating.
These corrosion results are consistent with the SEM micrography, as discussed in Section 3.1. The ferrite–pearlite phase in No-HT of the cold-rolled sample shown in Figure 2a exhibits a higher corrosion rate and a lower RP, which indicates weaker corrosion resistance than the fresh martensite structure of SR (see Figure 2c,e). This phenomenon could be derived from the observation that martensite morphology may be resistant to aqueous corrosion due to its uniform corrosion behavior [31,32]. No-HT, which had a lower cooling rate during the production process, had a higher corrosion tendency in general [16]. On the other hand, it is possible that the greater resistance to corrosion of the uniformly fresh martensite phase of SR, compared to the ferrite–pearlite phase of No-HT, might be attributed to the higher cooling rate of the as-quenched samples. The high cooling rate (in the case of SR) can lead to a lower depth of corrosion attack than the microstructure of the ferrite–pearlite (No-HT) produced with a lower cooling rate [33]. With the fact that the 8620 low alloy steel contains chromium (see Table 1), in the situation that obtained a complete austenitizing of SR the chromium segregation may incorporate a passive layer, which is called chromium release. At the as-quenched step, it is possible that the improved passive behavior is due to the chromium that is available to form a chrome-rich passive layer over single-phase fresh martensite [34].
In FR, the galvanic effect between the ferrite (anode) and the fresh martensite (cathode), which contains a high density of lattice defects, is likely to result in accelerated corrosion of the ferrite [35], resulting in a higher corrosion rate of FR than SR. While comparing the responses of FR and Temp FR, studies have found that the fresh martensite, which was the dominant phase in FR, had up to approximately two folds less mV than tempered martensite, and the higher Volta potential value generally indicates a higher electrochemical nobility [36,37,38]. In consideration of the heterogeneity of electrochemical nature, these two types of martensite may reveal different responses during the Temp FR and FR corrosion process. In contrast to martensitic morphology, tempered martensite itself shows galvanic corrosion [33,39].
It is reported that tempering around 500 °C (considered a moderate tempering) provides a reduction in misorientation, grain coarsening, less acicularity, and higher spheroidization [33] (see Figure 2f,h). It should also be noted that tempered martensitic structures have a different micro-galvanic property when they are in the single phase (Temp SR) as opposed to the dual phase (Temp FR). An investigation of the effect of martensite content in dual-phase steels [40] found that a higher martensite content accelerates corrosion processes in NaCl solutions [34]. Thus, the martensite in the dual-phase samples (FR) shifted to tempered martensite (Temp FR) after tempering, resulting in a decrease in martensite through the tempering process. These mechanisms may eventually result in an improved corrosion rate at Temp FR (see Table 2). This would come from the changed tempered martensite morphology arrangement. The explanation is supposedly based on the presence of different phases and the dual-phase structure of Temp FR with tempered martensite and ferrite (see Figure 2f,h), which have different electrochemical potentials than martensite (SR) and ferrite-martensite (FR) [41,42,43,44].
Electrochemical results suggested that the tempered martensite had a behavior distinctive from martensite, specifically when morphology was transmuted to ferrite and tempered martensite (Temp FR). This combination of tempered martensite and ferrite in Temp FR provides an enhanced balance between βA and βC, which corresponds to higher impedance as measured by RP factor (see Table 2).

3.3.3. Electrochemical Impedance Spectroscopy

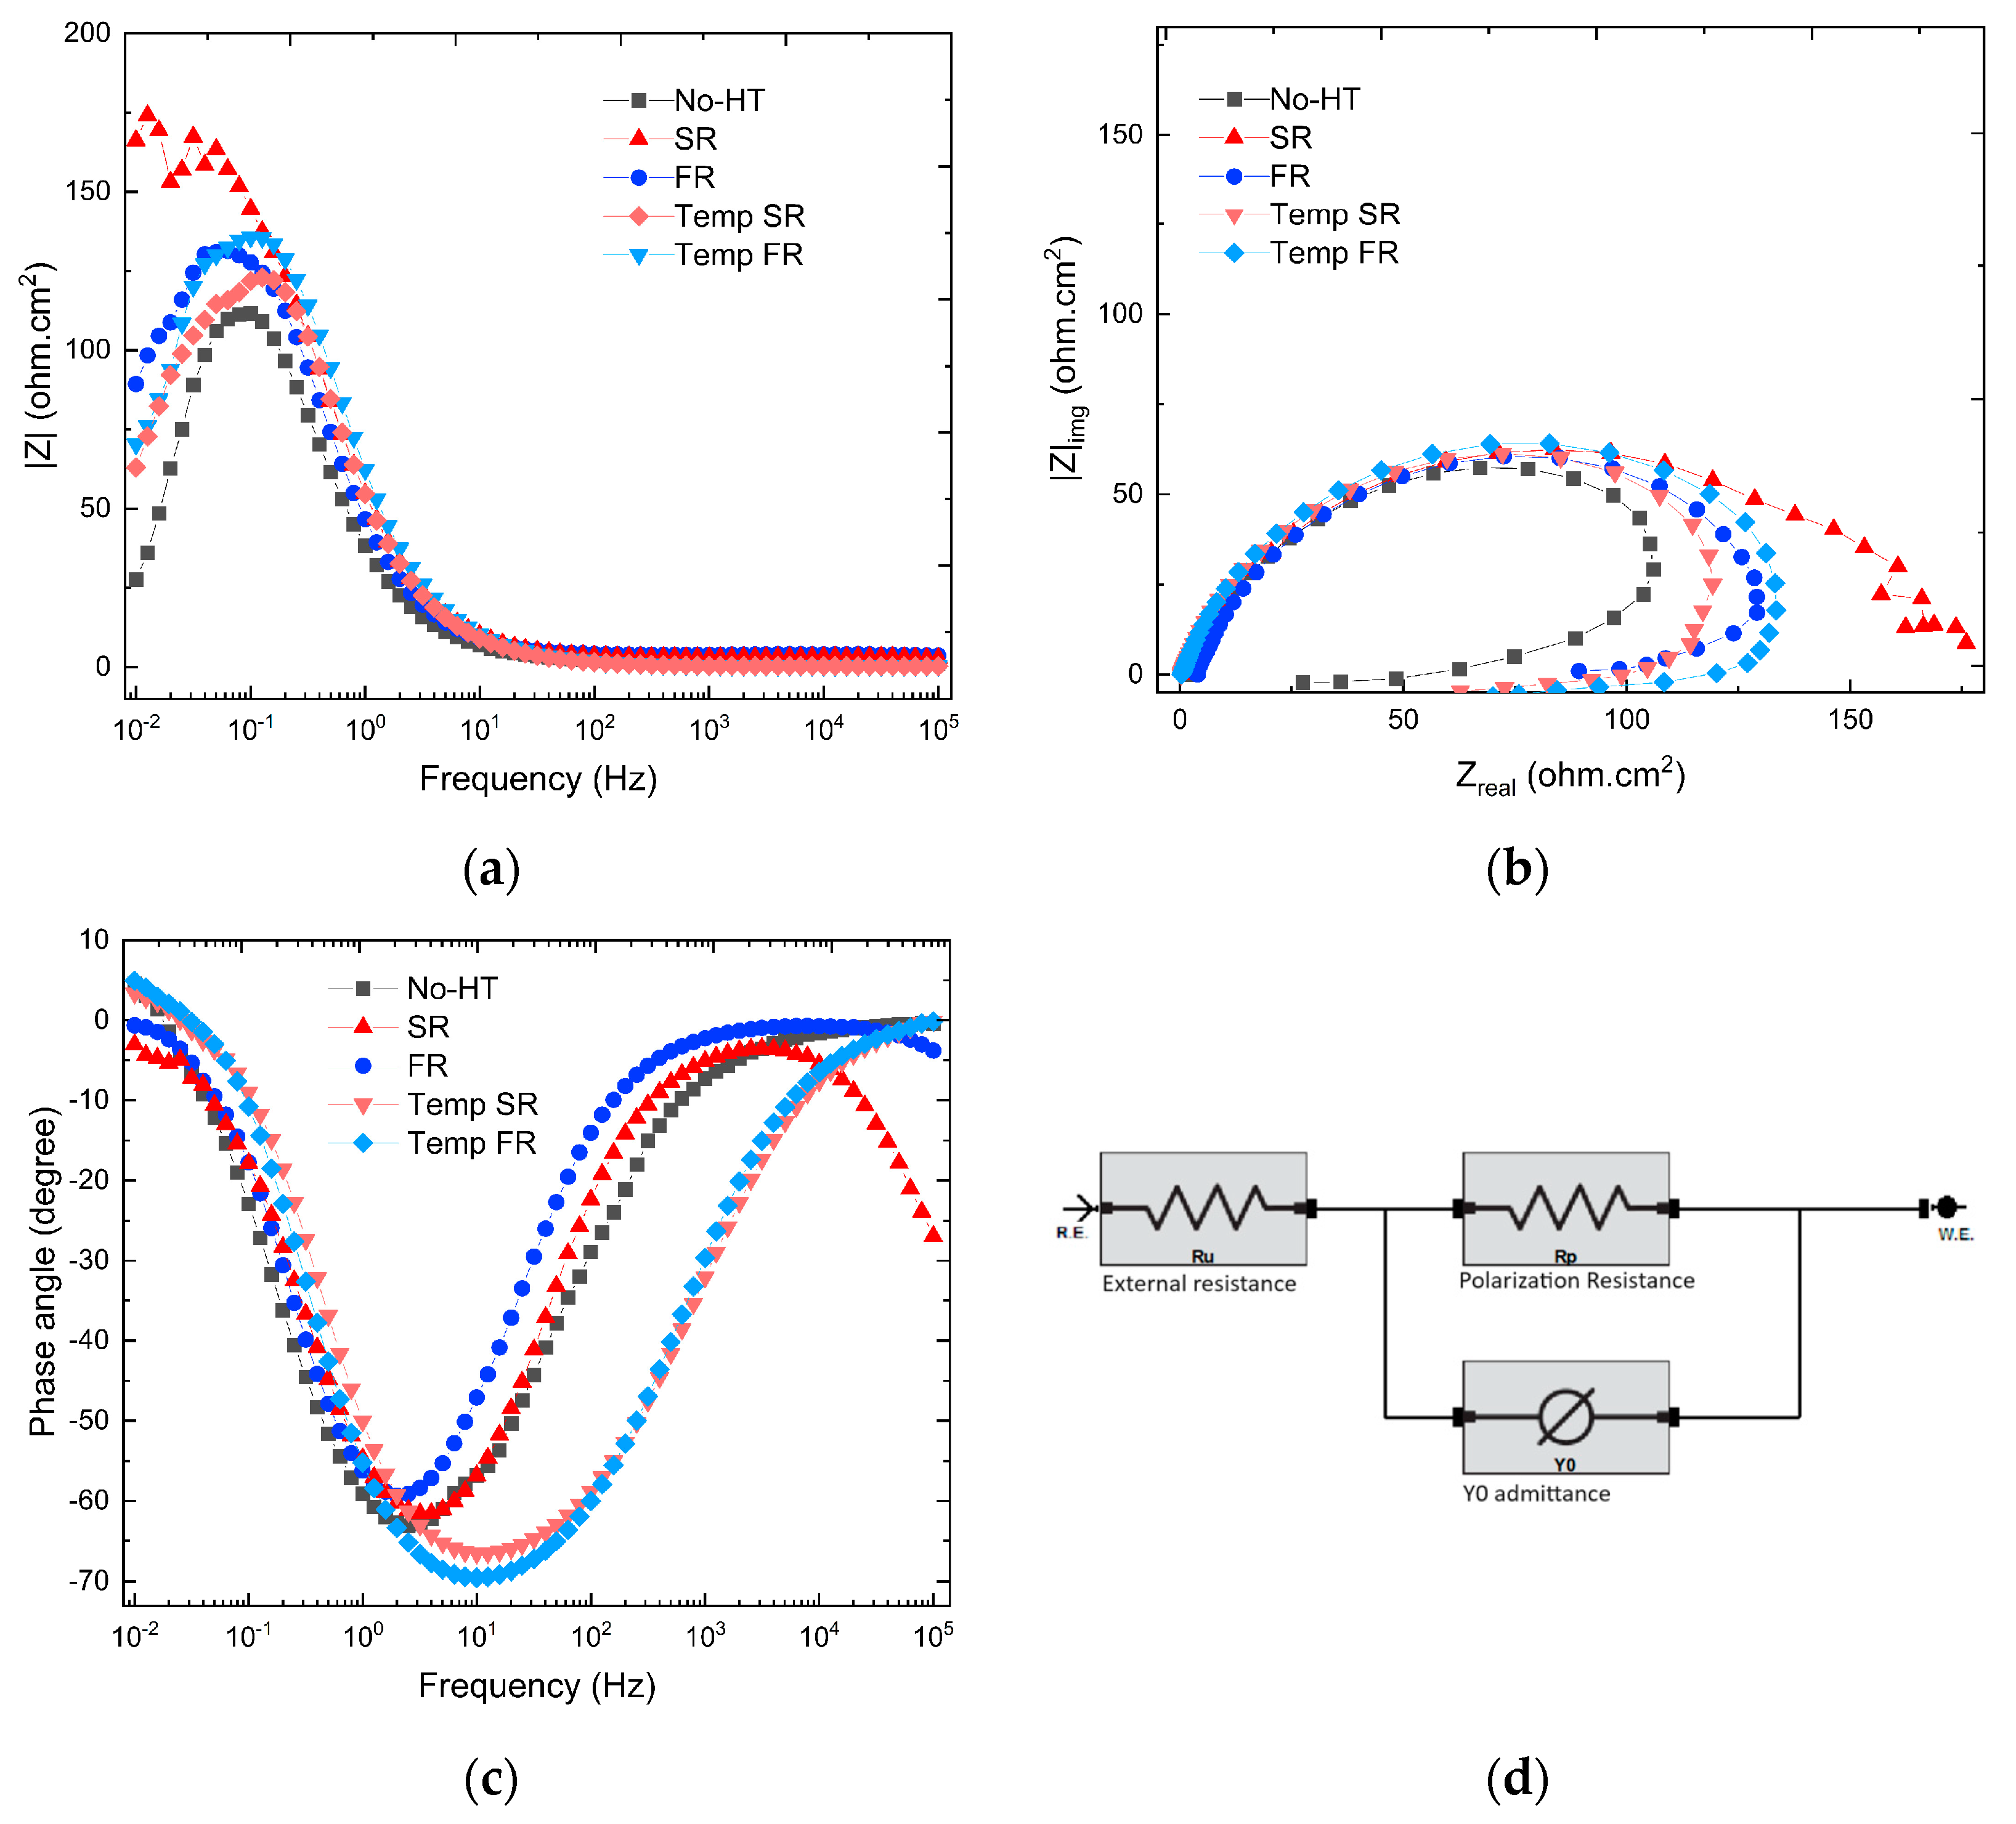
Figure 7a–c depicts Nyquist plots, Bode impedance plots, and Bode phase plots obtained from electrochemical impedance spectroscopy (EIS) conducted at room temperature using an aqueous solution of 3.5% NaCl over a frequency range of 10 mHz to 100 kHz. Figure 7a shows that Nyquist plots exhibit depressed semicircles in their impedance spectra. Through extrapolation of these semicircles toward the low-frequency region, i.e., the intersection of the fitted curves with the Zreal axis, the overall system resistance was determined. As the radius of a semicircle increases, corrosion resistance generally increases [45]. Observing the Nyquist plots, the semicircle radius for SR samples is the largest. However, after tempering, it became even smaller than that of Temp FR and FR samples. In comparison to the FR sample, the Temp FR sample, which is characterized as dual-phase steel with tempered martensite and fine-grain ferrite, demonstrates a significant improvement in corrosion rate and Rp.
In Figure 7b, the Bode impedance magnitude plot represents the logarithm of impedance magnitude (|Z|) as a function of frequency. There is a correlation between high impedances and resistance to mass transport or charge transfer. Depending on the nature of the peak, it might represent a relaxation process or frequency resonance, while plateaus and slopes might indicate diffusional or capacitive behavior. It is evident that SR has the highest magnitude at the low frequency (10 mHz), which is consistent with all other EIS results graphs. Despite its low magnitude at 10 mHz, the Temp FR exhibits a higher peak than FR at around 0.1 Hz, which, after fitting with the CPE model (which will be discussed in more detail in the following paragraphs), indicates a higher polarization resistance and lower Y0 (see Table 3).
The phase angles (see Figure 7c) of all 8620 steel samples started in the range of −5 to +5 degrees, while the tempered samples had a positive phase angle at 1 mHz. Further, the Temp FR and Temp SR samples at moderate frequencies (1 Hz to 100 Hz) exhibited a significant shift to a more negative phase angle. In other words, the double passive layer between the electrolyte and the surface of the system exhibited a resistive behavior at the higher frequencies. Almost the same capacitive behavior was observed at moderate frequencies. In spite of this, the capacitive behavior differed from that of an ideal capacitor (ZPhase = −90), which can be attributed to differences in surface heterogeneities [46]. As a side argument, it may well be another evidence of the positive effect of tempering on materials in the 8620 steel group.
However, the other as-quenched samples approached about −60 degrees and maintained this peak over a smaller window of frequencies. The Temp FR sample (highest RP) showed the most negative phase angle (−70) and kept more negative values over a larger range of intermediate frequencies (1 Hz to 1 kHz). It is probable that the variation in phase angle between tempered and as-quenched 8620 exists because of the change from martensitic form to tempered form, which has unique electrochemical properties. Moreover, because of the uneven distribution of charge across the electric double layer, the non-homogeneity of phases, and the roughness of the surface, a phase angle shifts greater than −90 was observed instead of pure capacitance with ZPhase of −90 [46]. This problem can be resolved by fitting the graphs with a Constant Phase Element (CPE) model to obtain a more sensitive judgment of the double-layer capacitive behavior. Figure 7d shows the corresponding circuit to the CPE model.
In Figure 7c, the phase angles of all samples, except for SR, which inclined to negative again, were near zero degrees at a high frequency (10 kHz and more). This implies that the impedance at a high frequency can be represented by resistance. As frequency decreases, phase angles also decrease, indicating that the electric double layer undergoes a capacitive response.
Table 3 presents data obtained from Gamry Echem Analyst2 software version 7.10. The process of fitting electrochemical impedance spectroscopy (EIS) data with the CPE model involves determining the parameters of the CPE element within an equivalent circuit representation of the electrochemical system (see Figure 7d). It is common to use a CPE model to account for non-ideal behavior at electrode-electrolyte interfaces, such as surface roughness, heterogeneity, or distributions of capacitance in double layers. Unlike ideal capacitors, which exhibit a constant capacitance over all frequencies, CPE elements introduce a frequency-dependent phase angle (α) parameter, representing a deviation from the ideal capacitance. It is the objective of the fitting process to determine the values of Y0 and α that are most appropriate for describing the experimental impedance data. Y0 with the unit Siemens raised to the power of α. Siemens (S) is the SI unit of conductance, which is equivalent to inverse ohms (Ω−1), and to the power of α reflects the non-ideal capacitive behavior at the electrode-electrolyte interface. Y0 is the admittance at a frequency of 0 Hz (ω = 0). This is typically done using nonlinear regression techniques to minimize the difference between the experimental impedance and the impedance predicted by the CPE model across a range of frequencies. Where α is the deviation from the ideal capacitive behavior of value 0 < α < 1. Generally, a pure capacitor has a value between 0.93 and 1, while an impure capacitor has a value of less than 0.93, and j = 1 refers to the imaginary component of the impedance, which is representative of the angular frequency [47]. Equation (2) describes the impedance (ZCPE is the equivalent impedance of a simple capacitor) in the CPE model.
ZCPE = Y0/(jω)α
Based on the CPE model and the EIS spectra, Table 3 provides quantitative values for each element. These parameters collectively capture the electrochemical response and interfacial characteristics that influence corrosion behavior. Through fitting procedures, it is possible to determine the polarization resistance (RP) from experimental data at low frequencies (where capacitive behavior dominates). By considering polarization resistance (RP), Y0, and α in the analysis, a more comprehensive understanding of the corrosion resistance can be addressed. In the case of a circuit containing a CPE (see Figure 7d), the double-layer capacitance (Cdl) can be calculated using the following expression in Equation (3), composed of CPE parameters Y0, α and corporation of the average polarization resistance of samples [48,49].
Cdl = Y0−1/α RP(1−α)/α
Nevertheless, it is important to note that the highest polarization resistance was observed for SR, measuring 1377.2 ± 59.8 Ω, approximately 440 Ω greater than that of the FR samples and 147 Ω higher than Temp FR. Interestingly, Temp FR exhibited a greater α, which means it has closer to the ideal capacitive behavior compared to SR. In electrochemical systems, a higher Cdl may suggest that the passive film or oxide layer on the metal surface is less protective or stable [22]. As a result, increased ionic transport in chloride-containing environments and enhanced corrosion activity can occur at the electrode-electrolyte interface, promoting localized corrosion phenomena. On the other hand, the lowest Cdl value was recorded for the No-HT sample, and Temp FR (See Table 3) recorded the lowest Cdl value among the other heat-treated samples. The results of PDP (see Table 2) and EIS may indicate an increased corrosion resistance at Temp FR compared to that of SR.

4. Conclusions

The study investigated the impact of heating rate on the microstructural changes, mechanical characteristics, and electrochemical responses of cold-rolled wrought 8620 low-carbon alloy steel, with a particular emphasis on the results of electrochemical tests. The investigation revealed important differences in microstructure and mechanical properties between samples subjected to slow and fast heating rates after quenching and tempering heat treatment.
  • The formation of martensite significantly increased the hardness, with SR samples showing a hardness 8 HRC higher compared to FR. This was consistent with the higher martensite phase fraction observed, confirming the impact of phase transformation on mechanical properties.
  • Following the tempering process, the hardness decreased from 44.77 to 33.65 HRC for SR and from 36.88 to 30.37 HRC for FR. It may be inferred that moderate tempering yields nearly identical effects on both martensite and the dual-phase of ferrite and martensite.
  • Due to the presence of almost 100% martensitic phases, the corrosion rate for SR was reported to be nearly half that of No-HT. However, following tempering, the EIS results indicated that polarization resistance decreased by almost 380 Ω for the Temp SR, while Temp FR improved. Compared with the FR samples, the Temp FR samples had a 300 Ω gain in polarization resistance and a twofold reduction in Cdl. This phenomenon is likely demonstrated by the increase in martensite to tempered martensite, from 44.6% in SR to 72.3% in Temp SR, which figuratively enhances the overall corrosion response.
  • The tempering heat treatment on Temp FR suggested a noble effect on corrosion characteristics. The Temp FR also had a superior corrosion rate, RP, and Cdl to the as-quenched SR.
Intriguingly, utilizing a fast heating rate to produce dual-phase 8620 steel presents significant advantages over traditional methods. This approach, which bypasses complex and extended thermal cycles, enables a more efficient transformation process. It results in the creation of a dual-phase structure composed of martensite and ferrite in a reduced time frame. Therefore, a fast heating rate is a more effective and streamlined method for achieving dual-phase characteristics in 8620 steel than conventional techniques.
Future research could explore optimum heating rate parameters with respect to their effects on microstructure and corrosion characteristics. In addition, it could investigate advanced surface modification techniques under the ideal heating rate to further enhance low alloy steel corrosion resistance. Furthermore, in studies with a high focus on microstructures, a detailed dilatometric measurement can be prepared to determine the effect of heating rates on the kinetics of phase transformation.

Author Contributions

Conceptualization, S.T., W.H., and I.S.; Methodology, S.T., W.H., and I.S.; Formal analysis and Data curation S.T.; Writing—original draft, S.T.; Writing—review and editing, S.T., W.H., and I.S.; Supervision, I.S. All authors have read and agreed to the published version of the manuscript.

Funding

This research received no external funding.

Data Availability Statement

The data that support the findings of this study are available from the corresponding author upon reasonable request.

Acknowledgments

The authors would like to acknowledge the support from the College of Science and Engineering at Central Michigan University. The authors are grateful to Kashif Mairaj Deen from The University of British Columbia for his guidance in this project.

Conflicts of Interest

The authors declare no conflict of interest.

References

  1. Osório, W.R.; Peixoto, L.C.; Garcia, L.R.; Garcia, A. Electrochemical Corrosion Response of a Low Carbon Heat Treated Steel in a NaCl Solution. Mater. Corros. 2009, 60, 804–812. [Google Scholar] [CrossRef]
  2. Huang, W.H.; Yen, H.W.; Lee, Y.L. Corrosion Behavior and Surface Analysis of 690 MPa-Grade Offshore Steels in Chloride Media. J. Mater. Res. Technol. 2019, 8, 1476–1485. [Google Scholar] [CrossRef]
  3. Yuan, F.; Wei, G.; Gao, S.; Lu, S.; Liu, H.; Li, S.; Fang, X.; Chen, Y. Tuning the Pitting Performance of a Cr-13 Type Martensitic Stainless Steel by Tempering Time. Corros. Sci. 2022, 203, 110346. [Google Scholar] [CrossRef]
  4. Alshareef, A.J.; Marinescu, I.D.; Basudan, I.M.; Alqahtani, B.M.; Tharwan, M.Y. Ball-Burnishing Factors Affecting Residual Stress of AISI 8620 Steel. Int. J. Adv. Manuf. Technol. 2020, 107, 1387–1397. [Google Scholar] [CrossRef]
  5. Phatiwach, V.; Angkurarach, L.; Juijerm, P. Effect of Intercritical Annealing on Deformation Behavior and Flow Stress Predictive Models of AISI 8620 Steel. J. Mater. Sci. 2023, 58, 13488–13501. [Google Scholar] [CrossRef]
  6. An, J.; Su, Z.G.; Gao, X.X.; Yang, Y.L.; Sun, S.J. Corrosion Characteristics of Boronized AISI 8620 Steel in Oil Field Water Containing H 2S 1. Prot. Met. Phys. Chem. Surf. 2012, 48, 487–494. [Google Scholar] [CrossRef]
  7. Erdogan, M.; Tekeli, S. The Effect of Martensite Volume Fraction and Particle Size on the Tensile Properties of a Surface-Carburized AISI 8620 Steel with a Dual-Phase Core Microstructure. Mater. Charact. 2002, 49, 445–454. [Google Scholar] [CrossRef]
  8. Verdeja, L.F.; Verdeja, J.I.; González, R. Machinability improvement through heat treatment in 8620 low-carbon alloyed steel. Mach. Sci. Technol. 2009, 13, 529–542. [Google Scholar] [CrossRef]
  9. Hernandez-Duran, E.I.; Ros-Yanez, T.; Castro-Cerda, F.M.; Petrov, R.H. The Influence of the Heating Rate on the Microstructure and Mechanical Properties of a Peak Annealed Quenched and Partitioned Steel. Mater. Sci. Eng. A 2020, 797, 140061. [Google Scholar] [CrossRef]
  10. Tan, X.; Lu, W.; Rao, X. Effect of Ultra-Fast Heating on Microstructure and Mechanical Properties of Cold-Rolled Low-Carbon Low-Alloy Q&P Steels with Different Austenitizing Temperature. Mater. Charact. 2022, 191, 112086. [Google Scholar] [CrossRef]
  11. Hernandez-Duran, E.I.; Bliznuk, V.; Ros-Yanez, T.; Iquilio-Abarzua, R.; Castro-Cerda, F.M.; Petrov, R.H. Improvement of the Strength-Ductility Balance in Ultrafast Heated Steels by Combining High-Temperature Annealing and Quenching and Partitioning Process. Mater. Sci. Eng. A 2021, 827, 142045. [Google Scholar] [CrossRef]
  12. Xu, D.; Li, J.; Meng, Q.; Liu, Y.; Li, P. Effect of Heating Rate on Microstructure and Mechanical Properties of TRIP-Aided Multiphase Steel. J. Alloys Compd. 2014, 614, 94–101. [Google Scholar] [CrossRef]
  13. Bellavoine, M.; Dumont, M.; Drillet, J.; Hébert, V.; Maugis, P. Combined Effect of Heating Rate and Microalloying Elements on Recrystallization during Annealing of Dual-Phase Steels. Met. Mater. Trans. A Phys. Met. Mater. Sci. 2018, 49, 2865–2875. [Google Scholar] [CrossRef]
  14. Gaggiotti, M.; Albini, L.; Stornelli, G.; Tiracorrendo, G.; Landi, L.; Di Schino, A. Ultra-Fast Heating Treatment Effect on Microstructure, Mechanical Properties and Magnetic Characteristics of Non-Oriented Grain Electrical Steels. Appl. Sci. 2023, 13, 9833. [Google Scholar] [CrossRef]
  15. Ghosh, P.; Dhokey, N.B. Refinement of Tempered Martensite Structure and Its Effect on Wear Mechanism in SAE 8620. Tribol. Mater. Surf. Interfaces 2016, 10, 178–184. [Google Scholar] [CrossRef]
  16. Hong, S.; Lin, H.C.; Lee, Y.; Lian, T.S.; Tseng, L.Y.; Lin, K.M. The Corrosion Behaviors of Heat-Treated SAE 8620 Steels. Mater. Sci. Forum 2008, 575–578, 1190–1198. [Google Scholar] [CrossRef]
  17. Atapek, Ş.H.; Polat, Ş.; Zor, S. Effect of Tempering Temperature and Microstructure on the Corrosion Behavior of a Tempered Steel. Prot. Met. Phys. Chem. Surf. 2013, 49, 240–246. [Google Scholar] [CrossRef]
  18. Da Sun, S.; Fabijanic, D.; Barr, C.; Liu, Q.; Walker, K.; Matthews, N.; Orchowski, N.; Easton, M.; Brandt, M. In-Situ Quench and Tempering for Microstructure Control and Enhanced Mechanical Properties of Laser Cladded AISI 420 Stainless Steel Powder on 300M Steel Substrates. Surf. Coat. Technol. 2018, 333, 210–219. [Google Scholar] [CrossRef]
  19. Jaskari, M.; Järvenpää, A.; Karjalainen, P. The Effect of Heating Rate and Temperature on Microstructure and R-Value of Type 430 Ferritic Stainless Steel. Mater. Sci. Forum 2018, 941, 364–369. [Google Scholar] [CrossRef]
  20. Zhang, Y.; Yang, J.; Xiao, D.; Luo, D.; Tuo, C.; Wu, H. Effect of Quenching and Tempering on Mechanical Properties and Impact Fracture Behavior of Low-Carbon Low-Alloy Steel. Metals 2022, 12, 1087. [Google Scholar] [CrossRef]
  21. de Paula, R.G.; Santos, A.P.; Soares, R.B.; dos Santos Silva, K.H.; Nascimento, J.P.; de Freitas Cunha Lins, V. Effect of Gamma Radiation on the Electrochemical Behavior of AISI 8620 Steel Coated with Diamond-Like Carbon. J. Mater. Eng. Perform. 2023, 32, 6226–6235. [Google Scholar] [CrossRef]
  22. Herrera Hernández, H.; Reynoso, M.R.; González, C.T.; Morán, O.G.; Hernández, G.M.; Mandujano Ruiz, A.; Morales Hernández, J.; Orozco Cruz, R. Electrochemical Impedance Spectroscopy (EIS): A Review Study of Basic Aspects of the Corrosion Mechanism Applied to Steels. In Electrochemical Impedance Spectroscopy; InTech Open: London, UK, 2020; pp. 137–144. [Google Scholar] [CrossRef]
  23. Domanski, M.; Webb, J. A Review of Heat Treatment Research. Lithic. Technol. 2007, 32, 153–194. [Google Scholar] [CrossRef]
  24. Mele, M.; Magazzino, C. A Machine Learning Analysis of the Relationship among Iron and Steel Industries, Air Pollution, and Economic Growth in China. J. Clean. Prod. 2020, 277, 123293. [Google Scholar] [CrossRef]
  25. Sabuz, E.H.; Noor-A-Alam, M.; Haider, W.; Shabib, I. Improving the Mechanical and Electrochemical Performance of Additively Manufactured 8620 Low Alloy Steel via Boriding. Corros. Mater. Degrad. 2023, 4, 623–643. [Google Scholar] [CrossRef]
  26. Marulanda, D.M.; Cortés, J.G.; Pérez, M.A.; García, G. Microstructure and Mechanical Properties of AISI 8620 Steel Processed by ECAP. Mater. Res. Soc. Symp. Proc. 2014, 1611, 89–94. [Google Scholar] [CrossRef]
  27. Kumar, R.; Ghosh, P.K.; Kumar, S. Thermal and Metallurgical Characteristics of Surface Modification of AISI 8620 Steel Produced by TIG Arcing Process. J. Mater. Process. Technol. 2017, 240, 420–431. [Google Scholar] [CrossRef]
  28. Mohanty, R.R.; Girina, O.A.; Fonstein, N.M. Effect of Heating Rate on the Austenite Formation in Low-Carbon High-Strength Steels Annealed in the Intercritical Region. Met. Mater. Trans. A Phys. Met. Mater. Sci. 2011, 42, 3680–3690. [Google Scholar] [CrossRef]
  29. Gaggiotti, M.; Albini, L.; Di Nunzio, P.E.; Di Schino, A.; Stornelli, G.; Tiracorrendo, G. Ultrafast Heating Heat Treatment Effect on the Microstructure and Properties of Steels. Metals 2022, 12, 1313. [Google Scholar] [CrossRef]
  30. Stern, M.; Geary, A.L. Electrochemical Polarization: I. A Theoretical Analysis of the Shape of Polarization Curves. J. Electrochem. Soc. 1957, 104, 56. [Google Scholar] [CrossRef]
  31. Kadowaki, M.; Saengdeejing, A.; Muto, I.; Chen, Y.; Masuda, H.; Katayama, H.; Doi, T.; Kawano, K.; Miura, H.; Sugawara, Y.; et al. First-Principles Analysis of the Inhibitive Effect of Interstitial Carbon on an Active Dissolution of Martensitic Steel. Corros. Sci. 2020, 163, 108251. [Google Scholar] [CrossRef]
  32. Maruyama, N.; Tabata, S.; Kawata, H. Excess Solute Carbon and Tetragonality in As-Quenched Fe-1Mn-C (C:0.07 to 0.8 Mass Pct) Martensite. Met. Mater. Trans. A Phys. Met. Mater. Sci. 2020, 51, 1085–1097. [Google Scholar] [CrossRef]
  33. Khan, M.I.; Sarkar, A.; Mehtani, H.K.; Raut, P.; Prakash, A.; Prasad, M.J.N.V.; Samajdar, I.; Parida, S. Microstructure and Aqueous Corrosion in Carbon Steel: An Emerging Correlation. Mater. Chem. Phys. 2022, 290, 126623. [Google Scholar] [CrossRef]
  34. Bösing, I.; Cramer, L.; Steinbacher, M.; Zoch, H.W.; Thöming, J.; Baune, M. Influence of Heat Treatment on the Microstructure and Corrosion Resistance of Martensitic Stainless Steel. AIP Adv. 2019, 9, 65317. [Google Scholar] [CrossRef]
  35. Guo, Y.B.; Li, C.; Liu, Y.C.; Yu, L.M.; Ma, Z.Q.; Liu, C.X.; Li, H.J. Effect of Microstructure Variation on the Corrosion Behavior of High-Strength Low-Alloy Steel in 3.5wt% NaCl Solution. Int. J. Miner. Metall. Mater. 2015, 22, 604–612. [Google Scholar] [CrossRef]
  36. Liu, J.; Yang, L.; Zhang, C.; Zhang, B.; Zhang, T.; Li, Y.; Wu, K.; Wang, F. Significantly Improved Corrosion Resistance of Mg-15Gd-2Zn-0.39Zr Alloys: Effect of Heat-Treatment. J. Mater. Sci. Technol. 2019, 35, 1644–1654. [Google Scholar] [CrossRef]
  37. Rahimi, E.; Rafsanjani-Abbasi, A.; Imani, A.; Hosseinpour, S.; Davoodi, A. Correlation of Surface Volta Potential with Galvanic Corrosion Initiation Sites in Solid-State Welded Ti-Cu Bimetal Using AFM-SKPFM. Corros. Sci. 2018, 140, 30–39. [Google Scholar] [CrossRef]
  38. Chen, H.; Lv, Z.; Lu, L.; Huang, Y.; Li, X. Correlation of Micro-Galvanic Corrosion Behavior with Corrosion Rate in the Initial Corrosion Process of Dual Phase Steel. J. Mater. Res. Technol. 2021, 15, 3310–3320. [Google Scholar] [CrossRef]
  39. Katiyar, P.K.; Misra, S.; Mondal, K. Comparative Corrosion Behavior of Five Microstructures (Pearlite, Bainite, Spheroidized, Martensite, and Tempered Martensite) Made from a High Carbon Steel. Metall. Mater. Trans. A 2019, 50, 1489–1501. [Google Scholar] [CrossRef]
  40. Sarkar, P.P.; Kumar, P.; Manna, M.K.; Chakraborti, P.C. Microstructural Influence on the Electrochemical Corrosion Behaviour of Dual-Phase Steels in 3.5% NaCl Solution. Mater. Lett. 2005, 59, 2488–2491. [Google Scholar] [CrossRef]
  41. Ochoa, N.; Vega, C.; Pébère, N.; Lacaze, J.; Brito, J.L. CO2 Corrosion Resistance of Carbon Steel in Relation with Microstructure Changes. Mater. Chem. Phys. 2015, 156, 198–205. [Google Scholar] [CrossRef]
  42. Fushimi, K.; Yanagisawa, K.; Nakanishi, T.; Hasegawa, Y.; Kawano, T.; Kimura, M. Microelectrochemistry of Dual-Phase Steel Corroding in 0.1 M Sulfuric Acid. Electrochim. Acta 2013, 114, 83–87. [Google Scholar] [CrossRef]
  43. Staicopolus, D.N. The Role of Cementite in the Acidic Corrosion of Steel. J. Electrochem. Soc. 1963, 110, 1121. [Google Scholar] [CrossRef]
  44. Escrivà-Cerdán, C.; Ooi, S.W.; Joshi, G.R.; Morana, R.; Bhadeshia, H.K.D.H.; Akid, R. Effect of Tempering Heat Treatment on the CO2 Corrosion Resistance of Quench-Hardened Cr-Mo Low-Alloy Steels for Oil and Gas Applications. Corros. Sci. 2019, 154, 36–48. [Google Scholar] [CrossRef]
  45. Sabuz, E.H.; Maruf, M.A.; Haider, W.; Shabib, I. Enhanced Corrosion Resistance of TiZrN-Coated Additively Manufactured 8620 Low-Alloy Steel in Nitrate Salt Solution and Salt Bath. Coatings 2023, 13, 1998. [Google Scholar] [CrossRef]
  46. Igual Muñoz, A.; García Antón, J.; Guiñón, J.L.; Pérez Herranz, V. The Effect of Chromate in the Corrosion Behavior of Duplex Stainless Steel in LiBr Solutions. Corros. Sci. 2006, 48, 4127–4151. [Google Scholar] [CrossRef]
  47. Taweesup, K.; Visuttipitukul, P.; Yongvanich, N.; Lothongkum, G. Corrosion Behavior of Ti-Cr-N Coatings on Tool Steel Substrates Prepared Using DC Magnetron Sputtering at Low Growth Temperatures. Surf. Coat. Technol. 2019, 358, 732–740. [Google Scholar] [CrossRef]
  48. Hirschorn, B.; Orazem, M.E.; Tribollet, B.; Vivier, V.; Frateur, I.; Musiani, M. Determination of Effective Capacitance and Film Thickness from Constant-Phase-Element Parameters. Electrochim. Acta 2010, 55, 6218–6227. [Google Scholar] [CrossRef]
  49. Ebrahimi, N.; Momeni, M.; Kosari, A.; Zakeri, M.; Moayed, M.H. A Comparative Study of Critical Pitting Temperature (CPT) of Stainless Steels by Electrochemical Impedance Spectroscopy (EIS), Potentiodynamic and Potentiostatic Techniques. Corros. Sci. 2012, 59, 96–102. [Google Scholar] [CrossRef]
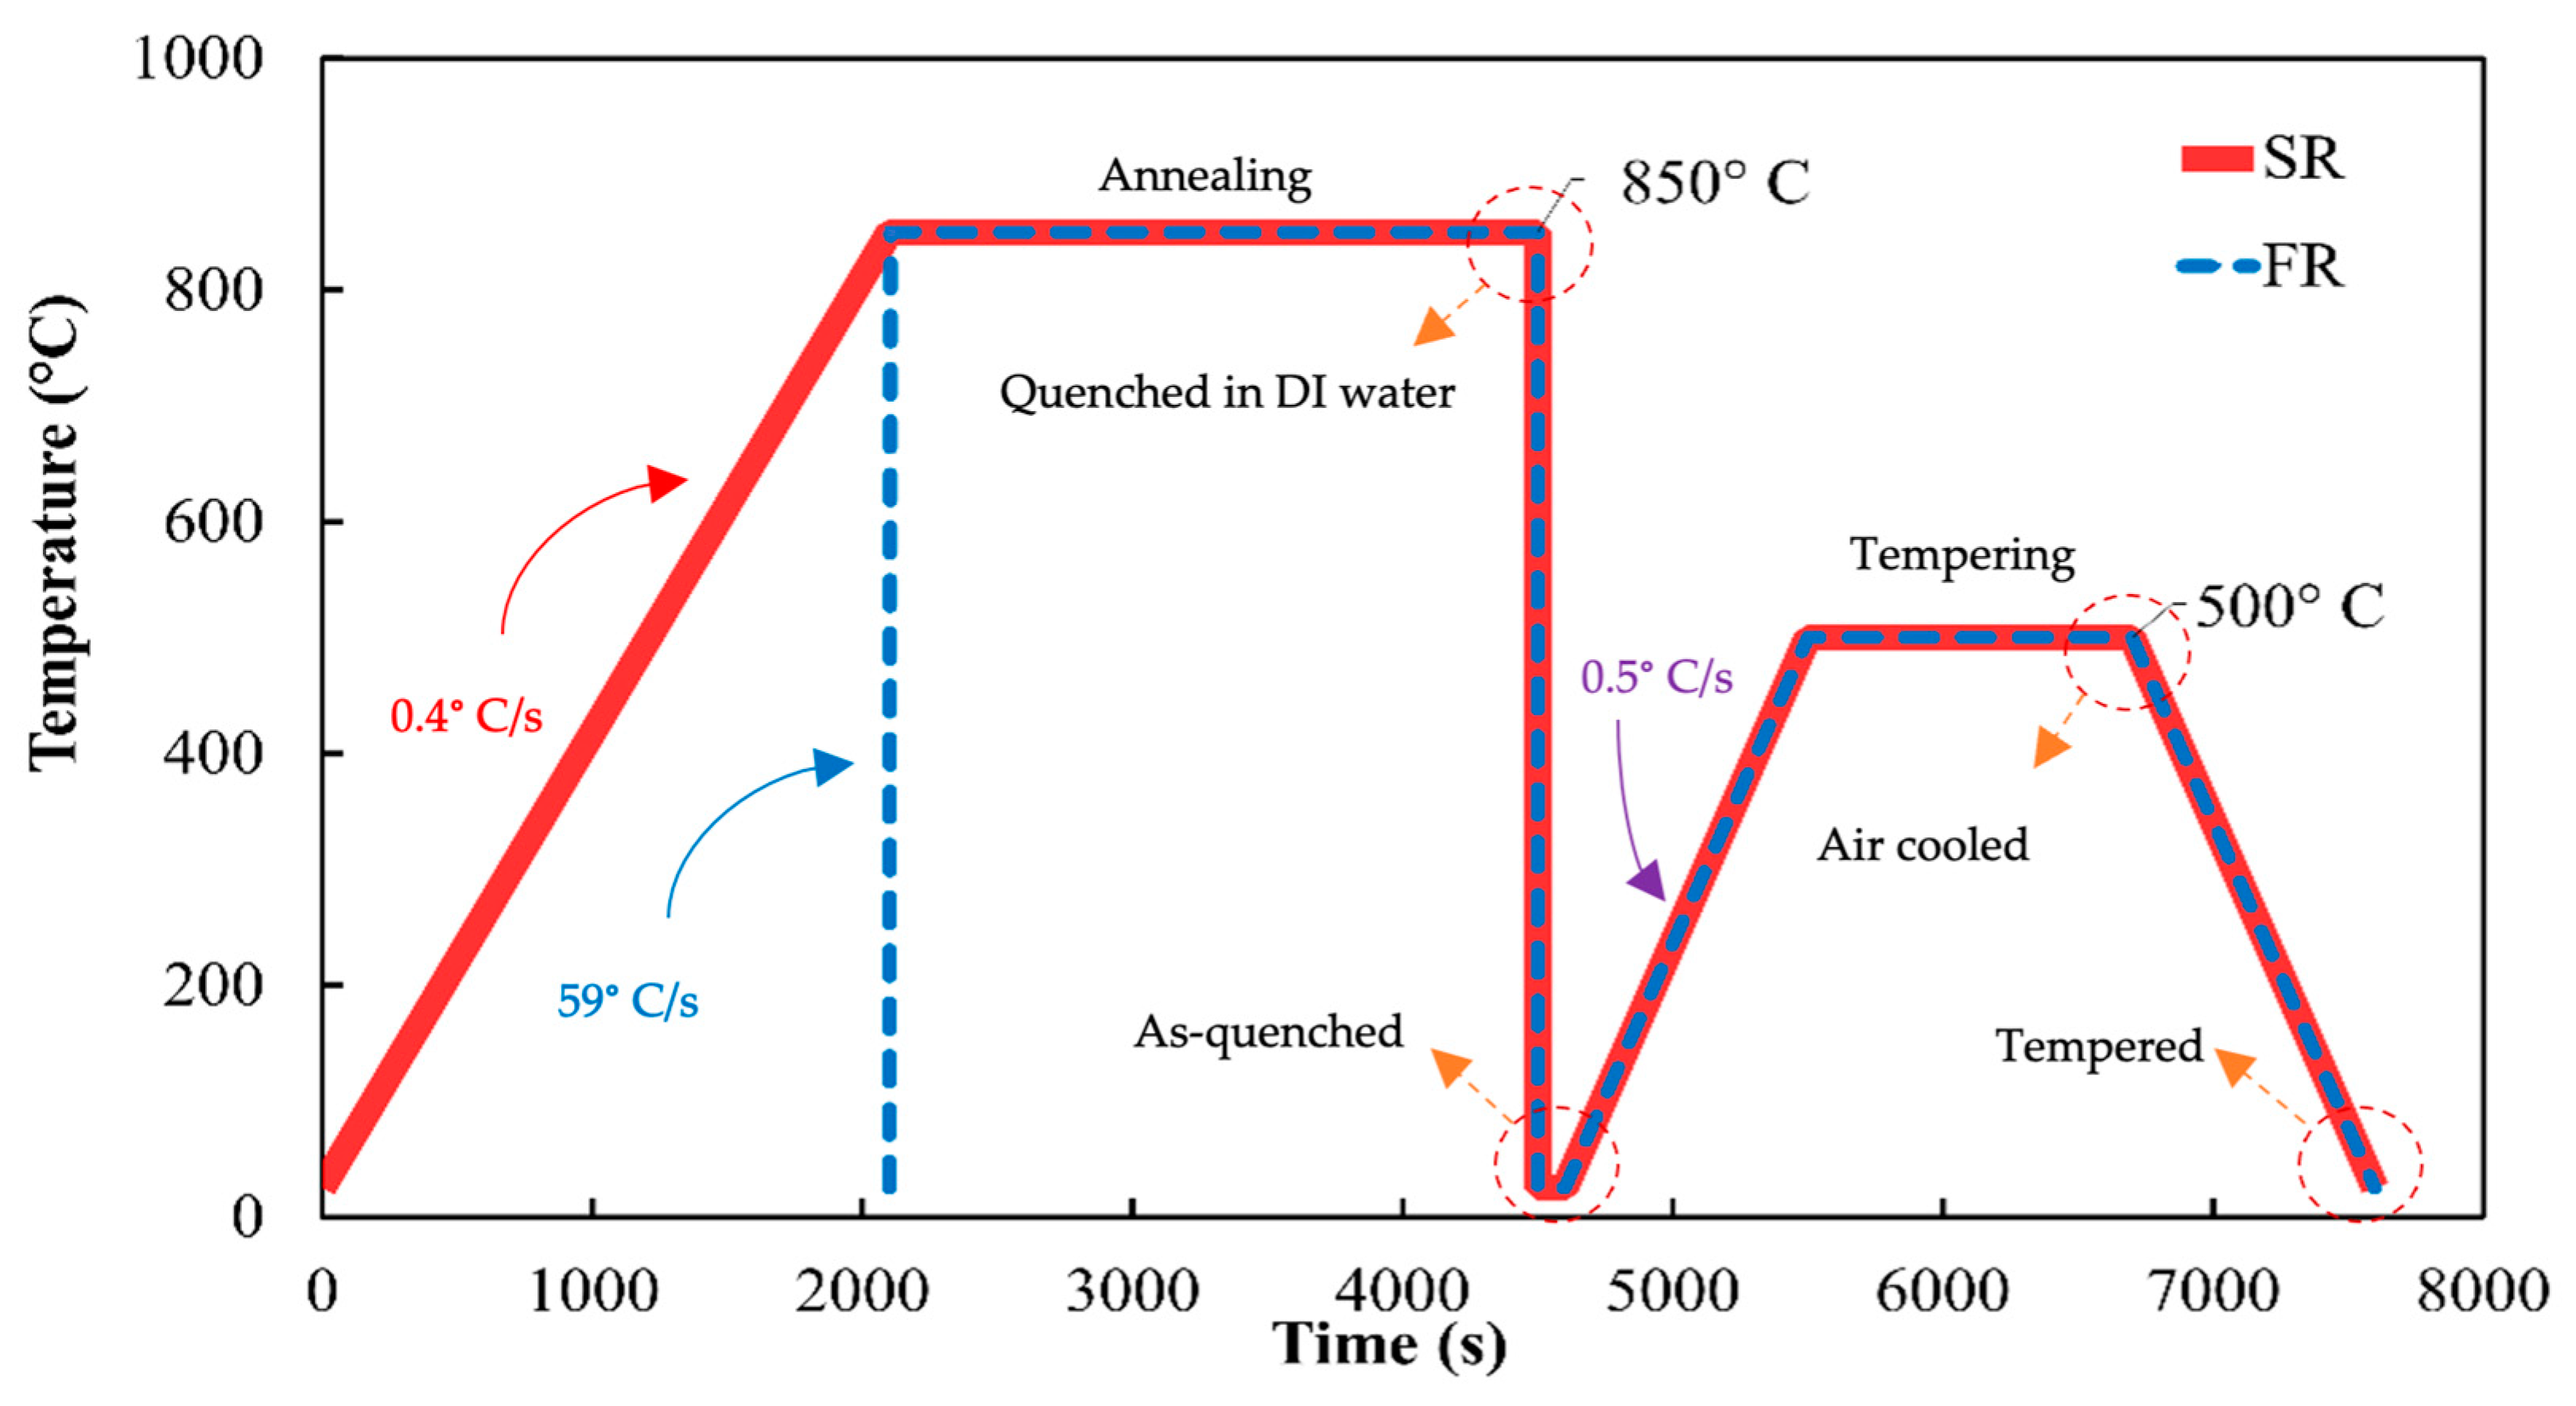
Figure 1. Heat treatment cycles: The process began with varying heating rates (0.4 °C/s for slow and 59 °C/s for fast), followed by identical annealing and quenching in DI water. After electrochemical testing and SEM micrography, both the slow- and fast-rate samples underwent tempering under identical conditions.
Cmd 05 00016 g001
Figure 2. SEM micrograph of 8620 No-HT samples: (a) as-received cold rolled with ferrite (F) and pearlite (P) microstructure; after quenching, the FR sample showed a dual-phase structure with martensite (M) and ferrite (b,d); and SR with full martensite (c,e). Surfaces observed in (f,h) are of the Temp FR after tempering, resulting in a dual-phase fine ferritic morphology surrounded by tempered martensite (TM) in contrast with the uniform tempered martensite structure of Temp SR (g,i).
Cmd 05 00016 g002
Figure 3. Optical microscopy images of 8620 No-HT samples: (a) as-received cold-rolled sample showing a ferrite (F) and pearlite (P) microstructure; (b) after quenching, the fast-rate (FR) sample exhibits a dual-phase structure with martensite (M) as the darker area and ferrite as the brighter area; (c) the slow-rate (SR) sample is fully martensitic. (d) After tempering, the FR sample displays a fine ferritic morphology surrounded by tempered martensite (TM), in contrast to the uniform tempered martensite structure observed in the tempered SR sample (e).
Cmd 05 00016 g003
Figure 4. Hardness test table of different samples for 8620 low alloy steel. The heat treatment resulted in an increase in hardness, and the hardness of the as-quenched samples (FR and SR) was greater than that after tempering (Temp FR and Temp SR).
Cmd 05 00016 g004
Figure 5. Open-circuit potential of No-HT and the samples heat-treated with the slow and fast heating rate after and before tempering at 500° C for 20 min.
Cmd 05 00016 g005
Figure 6. Potentiodynamic polarization plots of all 8620 low alloy specimens.
Cmd 05 00016 g006
Figure 7. (a) Nyquist plots, (b) Bode impedance plots, (c) Bode phase plots, and (d) CPE circuit diagram.
Cmd 05 00016 g007
Table 1. Compositions of 8620 low alloy steel elements used in this study (wt%).
ElementCrNiMnMoSiCSPFe
Wrought 86200.40.40.70.150.150.180.040.035Bal.
Table 2. Data obtained from Tafel extrapolation of PDP scans (n = 3).
SamplesEcorr
(mV)
icorr
(μA/cm2)
βA
(mV/Decade)
βC
(mV/Decade)
RP
(Ω·cm2)
Corrosion Rate
(mpy)
No-HT−872.3 ± 24.912.15 ± 0.95805.1 ± 79.4246.8 ± 36.06.72 ± 0.755.55 ± 0.43
SR−851.3 ± 14.26.36 ± 0.53760.3 ± 58.9196.9 ± 15.99.51 ± 1.122.91 ± 0.23
FR−870.9 ± 7.39.91 ± 0.441035 ± 99.7214.6 ± 38.67.72 ± 0.784.53 ± 0.20
Temp SR−935.5 ± 18.15.39 ± 0.95552.4 ± 33.2127.1 ± 10.68.52 ± 1.872.91 ± 0.69
Temp FR−839.2 ± 2.63.97 ± 0.46511.4 ± 13.1162.1 ± 08.113.51 ± 1.051.81 ± 0.21
Table 3. The parameters were determined by fitting the CPE model to the EIS spectrum (n = 3).
SamplesPolarization Resistance
(Ω)
Y0
(μS-sα cm−2)
α
(0 < α < 1)
Cdl
(F × 104)
Goodness of Fit
(10−2)
No-HT945.2 ± 157.6522 ± 540.839 ± 0.0153.0552.61 ± 1.6
SR1377.2 ± 59.8497 ± 590.822 ± 0.0075.0030.33 ± 0.01
FR931.1 ± 171.6479 ± 810.801 ± 0.0207.5892.46 ± 1.61
Temp SR989.8 ± 165.4285 ± 540.837 ± 0.0126.6011.05 ± 0.96
Temp FR1234.0 ± 158.2273 ± 80.870 ± 0.0283.6001.34 ± 0.98
Disclaimer/Publisher’s Note: The statements, opinions and data contained in all publications are solely those of the individual author(s) and contributor(s) and not of MDPI and/or the editor(s). MDPI and/or the editor(s) disclaim responsibility for any injury to people or property resulting from any ideas, methods, instructions or products referred to in the content.