Review

Hydrogen Absorption and Self-Corrosion of Mg Anode: Influence of Aqueous Electrolyte Species

by
Andrei Nazarov
1,*,†,
Tatiana Yurasova
2 and
Andrey Marshakov
2
1
French Corrosion Institute, 29200 Brest, France
2
Frumkin Institute of Physical Chemistry and Electrochemistry, 119071 Moscow, Russia
*
Author to whom correspondence should be addressed.
Retired.
Corros. Mater. Degrad. 2024, 5(3), 350-369; https://doi.org/10.3390/cmd5030015
Submission received: 26 May 2024 / Revised: 1 August 2024 / Accepted: 2 August 2024 / Published: 7 August 2024

Abstract

:
This review examines the impact of various aqueous electrolytes on hydrogen absorption and self-corrosion in magnesium (Mg) anodes. The discussion integrates both historical and recent studies to explore the mechanisms behind self-corrosion and anomalous hydrogen evolution (HE) under conditions of the Negative Difference Effect (NDE) and Positive Difference Effect (PDE). The focus is on the formation and oxidation of magnesium hydride in regions of active dissolution under NDE conditions. In the case of PDE, anodic dissolution occurs through the passive MgO-Mg(OH)₂ film, which shields the metal from aqueous electrolytes, thereby reducing hydrogen absorption and abnormal HE. The NDE conditions showed delayed reduction activity at the surface, attributed to a hydride phase within the corrosion product layer. Hydride ions were quantified through their anodic oxidation in an alkaline electrolyte, measured by the electric charge passed. The review also considers the role of de-passivating halide ions, electrolyte acidity buffering, and the addition of ligands that form stable complexes with Mg2⁺ ions, on the rates of hydride formation, self-corrosion, and anodic dissolution of Mg. The study evaluates species that either inhibit or promote hydrogen absorption and self-corrosion.

1. Introduction

Magnesium is a lightweight metal and is widely utilized in the industry [1]. During the last decades, various structural applications of magnesium alloys (Mg–Zn, Mg-Al) have been employed in the aerospace and automotive sectors [1,2,3]. Mg–Al–Ca alloys are in high demand as biodegradable implants due to their biocompatibility and good mechanical stability [4,5,6]. Using Mg for hydrogen storage is also a potential application [7,8,9]. It is a promising candidate due to its high hydrogen storage capacity (7.6 wt.%) and relatively low cost. The strongly negative standard reduction potential of −2.36 V (SHE) and a high theoretical energy density make Mg a prospective anode in both primary and secondary batteries [1].
The drawback for the above-mentioned applications is the so-called self-corrosion of the Mg anode, causing the parasitic discharge of Mg-based batteries. It limits the application of Mg alloys as sacrificial anodes for corrosion protection in underwater or underground constructions. Galvanic contact of magnesium and alloys with other materials such as steels, Cu alloys, Al, and Ti alloys is the reason for effective anodic self-corrosion (Equations (1) and (2)). The noble intermetallic inclusions in the alloys are also cathodes and polarize the Mg matrix, boosting alloy degradation. The most dangerous are the Fe, Cu, or Ni cathodic admixtures.
Mg is a strong reductant and interacts with water according to Equations (1) and (2). An increased rate of HE and self-corrosion is observed during the anodic polarization of Mg in aqueous electrolyte [10,11,12,13]. An anomaly relates to the increase in the rate of cathodic water reduction (Equation (2)) with a noble shift in the electrochemical potential that contradicts the electrochemical principle of kinetics for activation-controlled reactions. It is termed the Negative Difference Effect (NDE) or anomalous HE. Positive difference effect (PDE) corresponds to a decrease in water reduction rate and HE with the anodic polarization [14,15,16]. The NDE anomaly was a reason for significant research activity in the study of the electrochemical properties of Mg and Mg alloys, which were reviewed in several fundamental articles [1,10,11,12,13]. Thus, Mg anodic dissolution can follow NDE or PDE and the mechanism is likely determined by conditions of the electrode/electrolyte interface, including the nature of the aqueous electrolyte solution and the condition of the surface films. These properties will be discussed in this review.
Mg + 2H2O → Mg(OH)2 + H2 g
Mg → Mg2+ + 2e Eo= −2.363
2H2O + 2e → 2OH+ H2 g Eo= −0.828

1.1. Correspondence: Mechanisms of Self-Corrosion of Mg Anode

The earliest studies on the mechanism of self-corrosion of magnesium (Mg) anodes were conducted by Tomashov N.D. et al. [14] and James W.J. and Straumanis M. In these studies, it was found that the rate of self-corrosion and hydrogen evolution (HE) in NaCl-containing aqueous electrolytes increased proportionally with the density of the anodic current [14]. The HE rate was also proportional to the surface area of the anode activated by chloride ions [14]. Self-corrosion was explained as the electrochemical or chemical interaction of the active Mg surface with water (Equations (1) and (2)). It was observed that HE rates did not significantly depend on the impurities in the alloy [14]. In [15,16], self-corrosion was attributed to the disintegration of the Mg anode due to the detachment of small metal particles by released hydrogen. These detached Mg particles dissolve without electrical contact with the anode, a phenomenon known as the chunk effect. Petty et al. [17] proposed that Mg dissolves with low apparent valency as Mg+ (Equation (3)). They observed that after anodic polarization, the Mg surface exhibited prolonged reduction activity, capable of reducing sulfate ions to sulfur dioxide. This delayed reactivity of the Mg anode was attributed to Mg+ accumulated on the anode surface (Equation (3)). However, this particle has a short lifetime and has not been experimentally detected.
Mg→Mg+ + e
Mg+ + H2O→Mg2+ + ½ H2 g + OH
The actual mass loss of the anode can be higher than the loss calculated from the amount of electricity passed, indicating that the anodic dissolution of Mg can significantly deviate from predictions based on Faraday’s law. Depending on the conditions, the apparent valency of Mg can range from 0.06 to 2 [10,11]. Currently, two main mechanisms are proposed to explain anomalous HE and self-corrosion [11,17,18,19,20,21,22,23,24,25,26,27,28,29,30,31,32,33]. The first one suggests anodic dissolution as a monovalent cation Mg+, with subsequent cation oxidation in the electrolyte bulk [13,17,18,19,20]. The second mechanism involves changes in the catalytic properties of the anode surface related to cathodic water reduction [21,22,23,24,25,26,27]. Birbilis et al. [21] provided strong evidence of the enhanced catalytic efficiency of anodically treated Mg surfaces. Enhanced catalytic activity is associated with an increased exchange current of hydrogen reduction by several orders of magnitude [21].
Experimental results providing strong evidence for the oxidation of Mg to Mg2+ were published in [25,29,30,31,32]. Notably, a ratio of 2 equivalents per mole of dissolved Mg was necessary to explain the effect of pH and buffering of the aqueous electrolyte solutions [29,30,31,32]. Curioni [26] discovered that dark regions of the formed surface film are primary sites for the cathodic reaction. The increase in charge passed during the anodic step increases the surface area of the electrode covered by the corrosion film. It was suggested that these corroded regions could account for the increased cathodic activity of Mg during anodic dissolution if they propagated across the surface. Williams et al. [22] studied HE on pure Mg using the Scanning Vibrating Electrode Technique (SVET). They found that HE is associated with dark filaments containing corrosion products. These filiform-like tracks, coupled with intense local anodes, left behind regions of sustained cathodic activity [33]. Thus, enhanced catalytic activity was linked to a “dark” deposit formed on the Mg anode surface during dissolution [20,21,22,23,24,25]. Analytical studies described the film as bi-layered, consisting of an inner MgO-rich layer and an outer layer predominantly containing MgO and Mg(OH)2.

1.2. The Effect of Surface Impurities and Electrolyte Nature on Anomalous HE

The increase in self-dissolution of the Mg anode and the low apparent valences can be explained by surface enrichment with noble metals such as Fe [10,11]. As a result of Mg dissolution during open-circuit corrosion or anodic polarization, impurities may accumulate in or under the dark corrosion film formed on the surface [23,24,25,26,27]. Consequently, the concentration of impurities at the surface could become substantially higher than in the bulk metal. Sites enriched with noble elements can exhibit an increased ability for water reduction, leading to enhanced rates of self-corrosion. However, Taheri et al. [23] identified that small Fe-rich particles embedded in the outer layer of the corrosion film on a Mg electrode are not effective cathodes. Lysne et al. [34] concluded that the cathodic efficiency changes little and cannot account for the enhanced HE rates on anodically polarized Mg. These data align with the earlier study [14] that did not find a difference in HE rates for ultra-pure and technical pure Mg.
The anomalous H2 evolution was studied based on the nature of the buffering of the aqueous electrolyte solution. Fajardo et al. [35] showed that on the Mg surface in an acidic citric acid buffer solution, the typical dark corrosion product was not present. However, HE still occurred and was not linked to the presence of this dark corrosion product. Data reported by Lebouil et al. [31], where Mg dissolution was studied in a phosphate buffer solution (pH 6.7), exhibited decreased HE rates with increasing applied anodic potentials. Rossrucker et al. [29,30] investigated the effect of pH on HE and demonstrated the significant influence of pH in the near-surface region of Mg. Flow cell measurements showed that anomalous HE was absent for low anodic currents in a neutral buffered solution but was promoted at high anodic polarization currents and in unbuffered electrolytes.
In conclusion, anomalous HE and the Negative Difference Effect (NDE) are linked to the formation of dark corrosion products that exhibit high water reduction activity. Buffering of aqueous electrolytes at a low pH and low anodic currents can inhibit the formation of these dark grey products and reduce anomalous HE [29,30]. Impurities such as Fe have a minimal influence on HE during anodic polarization. However, in free corrosion conditions and acidic electrolytes, cathodic admixtures can accelerate Mg corrosion [13].

1.3. Hydride Formation and the Anomalous HE on the Mg Anode

Magnesium (Mg) is a well-known hydride-forming metal used in solid-state hydrogen storage applications [1]. In hydrogen storage research, Mg is typically charged to form MgH2 at high temperatures (300–400 °C) and pressures exceeding 1 MPa [12]. Mechanical testing of tensile specimens charged under such conditions exhibits hydrogen embrittlement. At 16–35 ppm concentrations, hydrogen is mainly segregated at the grain boundaries and has minimal impact on tensile properties [12]. Hydrogen can also reside within the magnesium lattice as gaseous hydrogen in blisters or bubbles. Magnesium and magnesium alloys are susceptible to stress corrosion cracking (SCC) in various environments, including distilled water [12,36]. There is evidence that it is assisted by hydrogen embrittlement. To prevent SCC, it is suggested that applied stress should be kept below 50% of the yield strength. Crack growth can follow delayed hydride cracking, hydrogen adsorption–dislocation emission, hydrogen-enhanced de-cohesion, and hydrogen-enhanced localized plasticity mechanisms [12,36,37].
The anomalous HE or Negative Difference Effect (NDE) due to magnesium hydride formation was initially proposed by G. Perrault using a thermodynamic approach [38,39]. Considering the E (SHE)–pH diagram for the Mg–H2O system, MgH2 can be a product of the cathodic reaction (Equation (4)):
Mg(OH)2 + 4H+ + 4e = MgH2 + 2H2O E = −0.842 − 0.059 pH
In previous studies [40,41], the formation of phases containing hydride ions in anodic corrosion products was detected experimentally. Thermal decomposition of the corrosion product collected from the surface showed two endothermic effects accompanied by two steps of gaseous hydrogen evolution (Figure 1). The high-temperature effect near 400 °C and hydrogen release were attributed to the thermal decomposition of MgH2 [40]. The broad low-temperature effect at 50–200 °C, also accompanied by gaseous hydrogen evolution, was explained by hydride hydrolysis at elevated temperatures due to moisture adsorbed to the corrosion product.
Hydride formation was detected in the active locations of corroding Mg at the free corrosion potential or anodic polarization in NaCl-containing aqueous electrolyte solution [40]. Thus, the interaction of the active metal surface with water in the cathodic reaction (Equation (5)) was proposed using thermodynamic data [38].
Mg + 2H+ +2e → MgH2 E = 0.186 − 0.059 pH
From a thermodynamic perspective, cathodic water reduction on the active metal surface, forming MgH2 (Equation (5)), is more favorable than cathodic water reduction (Equation (2)) or Mg species reduction (Equation (4)). X-ray diffractograms (XRD) of anodic corrosion products (dark grey areas) showed reflections from Mg(OH)2 and broad lines from amorphous MgH2 [40]. Moreover, the cathodic polarization of Mg in 1 M NaOH produced a thin film containing MgH2, matching the four strongest diffraction lines detected by XRD. It was suggested that the cathodic reductions (Equations (4) and (5)) could explain the formation of a thin, compact hydride film on the Mg cathode [40]. A similar formation of MgH2 after the cathodic polarization of Mg in a carbonate-buffered aqueous electrolyte solution was shown in the XRD study by Gulbrandsen E. [42]. In [43], hydride hydrogen in corrosion products was identified using microcalorimetry and thermal ion mass spectroscopy of H+ and H2+ ions.
In [41,43], the delayed reducing activity of the Mg surface as a result of anodic pre-polarization or corrosion in NaCl aqueous electrolyte was detected. It was assumed that the activity resulted from a hydride phase in the corrosion products (“dark-grey” areas). The delayed reducing activity of the Mg surface was observed even after prolonged aging in dry air conditions [43]. These results align with earlier studies by Petty [17] showing the delayed reducing activity of the pre-polarized Mg surface relative to the sulfate ions. The open circuit potential for corroded areas containing hydride was found to be near −1.4 V (SHE) and usually differed from the potential of areas maintaining passivity [42,43]. The anodic oxidation of hydride ions was studied in a 1 M NaOH aqueous electrolyte solution, which preserved strong Mg passivity and enabled the oxidation of H ions in corrosion products [43]. The anodic oxidation (Equations (6) and (8)) of H species in alkali at −1.2 V (SHE) was applied for the quantification of hydride in corrosion products [43]. The amount of passed electricity was used to determine the hydride amount using Faraday’s law.
MgH2 +2H2O→Mg(OH)2 + H2 + 2H+ + 2e
E = −1.684 − 0.059 pH + 0.0291 log pH2
2MgH2 + 2H+ → 2Mg2+ + 3H2
[H] = 1.015 10−5 Q
where [H] is the number of hydride ions (moles) and Q (coulombs) is the quantity of electricity applied for the oxidation of hydride ions in the surface corrosion products. In another protocol for hydride ion quantification, the volume of released gaseous hydrogen was measured during the treatment of the Mg electrode with an acidic electrolyte [40]. Mg remains passive in this electrolyte, and hydride was hydrolyzed by acid (Equation (7)), making the volume of gaseous hydrogen proportional to the amount of hydride hydrogen in the surface corrosion products.
Hydride formation on Mg and alloy surfaces was studied using surface analytical techniques in [37,44,45,46,47,48,49,50,51,52]. Hydrogen charging by H-plasma resulted in the MgH2 layer detected by XRD, increasing hardness and decreasing tensile properties of Mg–Al samples [37]. Chen et al. [44], using SIMS, showed the formation of MgH2 on AZ91 alloy after immersion in NaCl solution. Seyeux et al. [45], using TOF-SIMS for depth profiling of the surface film, found MgH2 on pure Mg, Al3Mg2, and Mg17Al12 previously exposed to water. Evidence of MgH2 formation was obtained by Unocic et al. [46] and W.J. Binns et al. [47]. XRD and dynamic SIMS measurements showed the presence of MgH2 in aged sections of corrosion filaments. W.J. Binns et al. proposed the mechanism of Mg self-dissolution involving MgH2 as an intermediate [47]. These results are consistent with a mechanism whereby a metastable MgH2 is formed and subsequently degrades [40]. Hydrogen charging due to corrosion in chloride-chromate mixtures resulted in intermediate hydrogen concentrations of 100–200 ppm, and up to 100 ppm due to Mg exposure to water vapor [12]. These values exceed the solubility of H in Mg at ambient temperature, indicating that hydrogen should precipitate as MgH2 at these concentrations. According to Chen J. et al. [44], hydrogen produced by corrosion in water diffuses into bulk and reacts with the Mg matrix to form hydride. Mechanical testing of tensile specimens charged under such conditions often exhibits hydrogen embrittlement and stress corrosion cracking. Some of the hydrogen accumulates at hydride/Mg matrix (or secondary phase) interfaces as a consequence of slow hydride formation and the incompatibility of the hydride with the Mg matrix (or secondary phase) and combines to form molecular hydrogen [44].
Thus, this introduction shows that hydride formation on the corroding Mg surface is well documented. This article aims to correlate well-known results from comprehensive reviews [10,11,12,13,48] with previous experimental works [40,41,43,49,50,51] focused on the electrochemistry of hydride formation–oxidation, the impact of electrolyte species on the efficiency of hydrogen absorption, and the self-corrosion of Mg anodes. These experimental works were not reviewed previously, and the results are provided in this review in more detail. Reviewing old and recent publications, taking into account the formation of the intermediate hydride phase, will be important for understanding the mechanisms of corrosion and hydrogen absorption by the Mg anode.

2. Self-Corrosion and Hydrogen Absorption in Halide Containing Aqueous Electrolytes

2.1. Electrochemical Detection of Hydride Ions on the Surface of Mg Anode

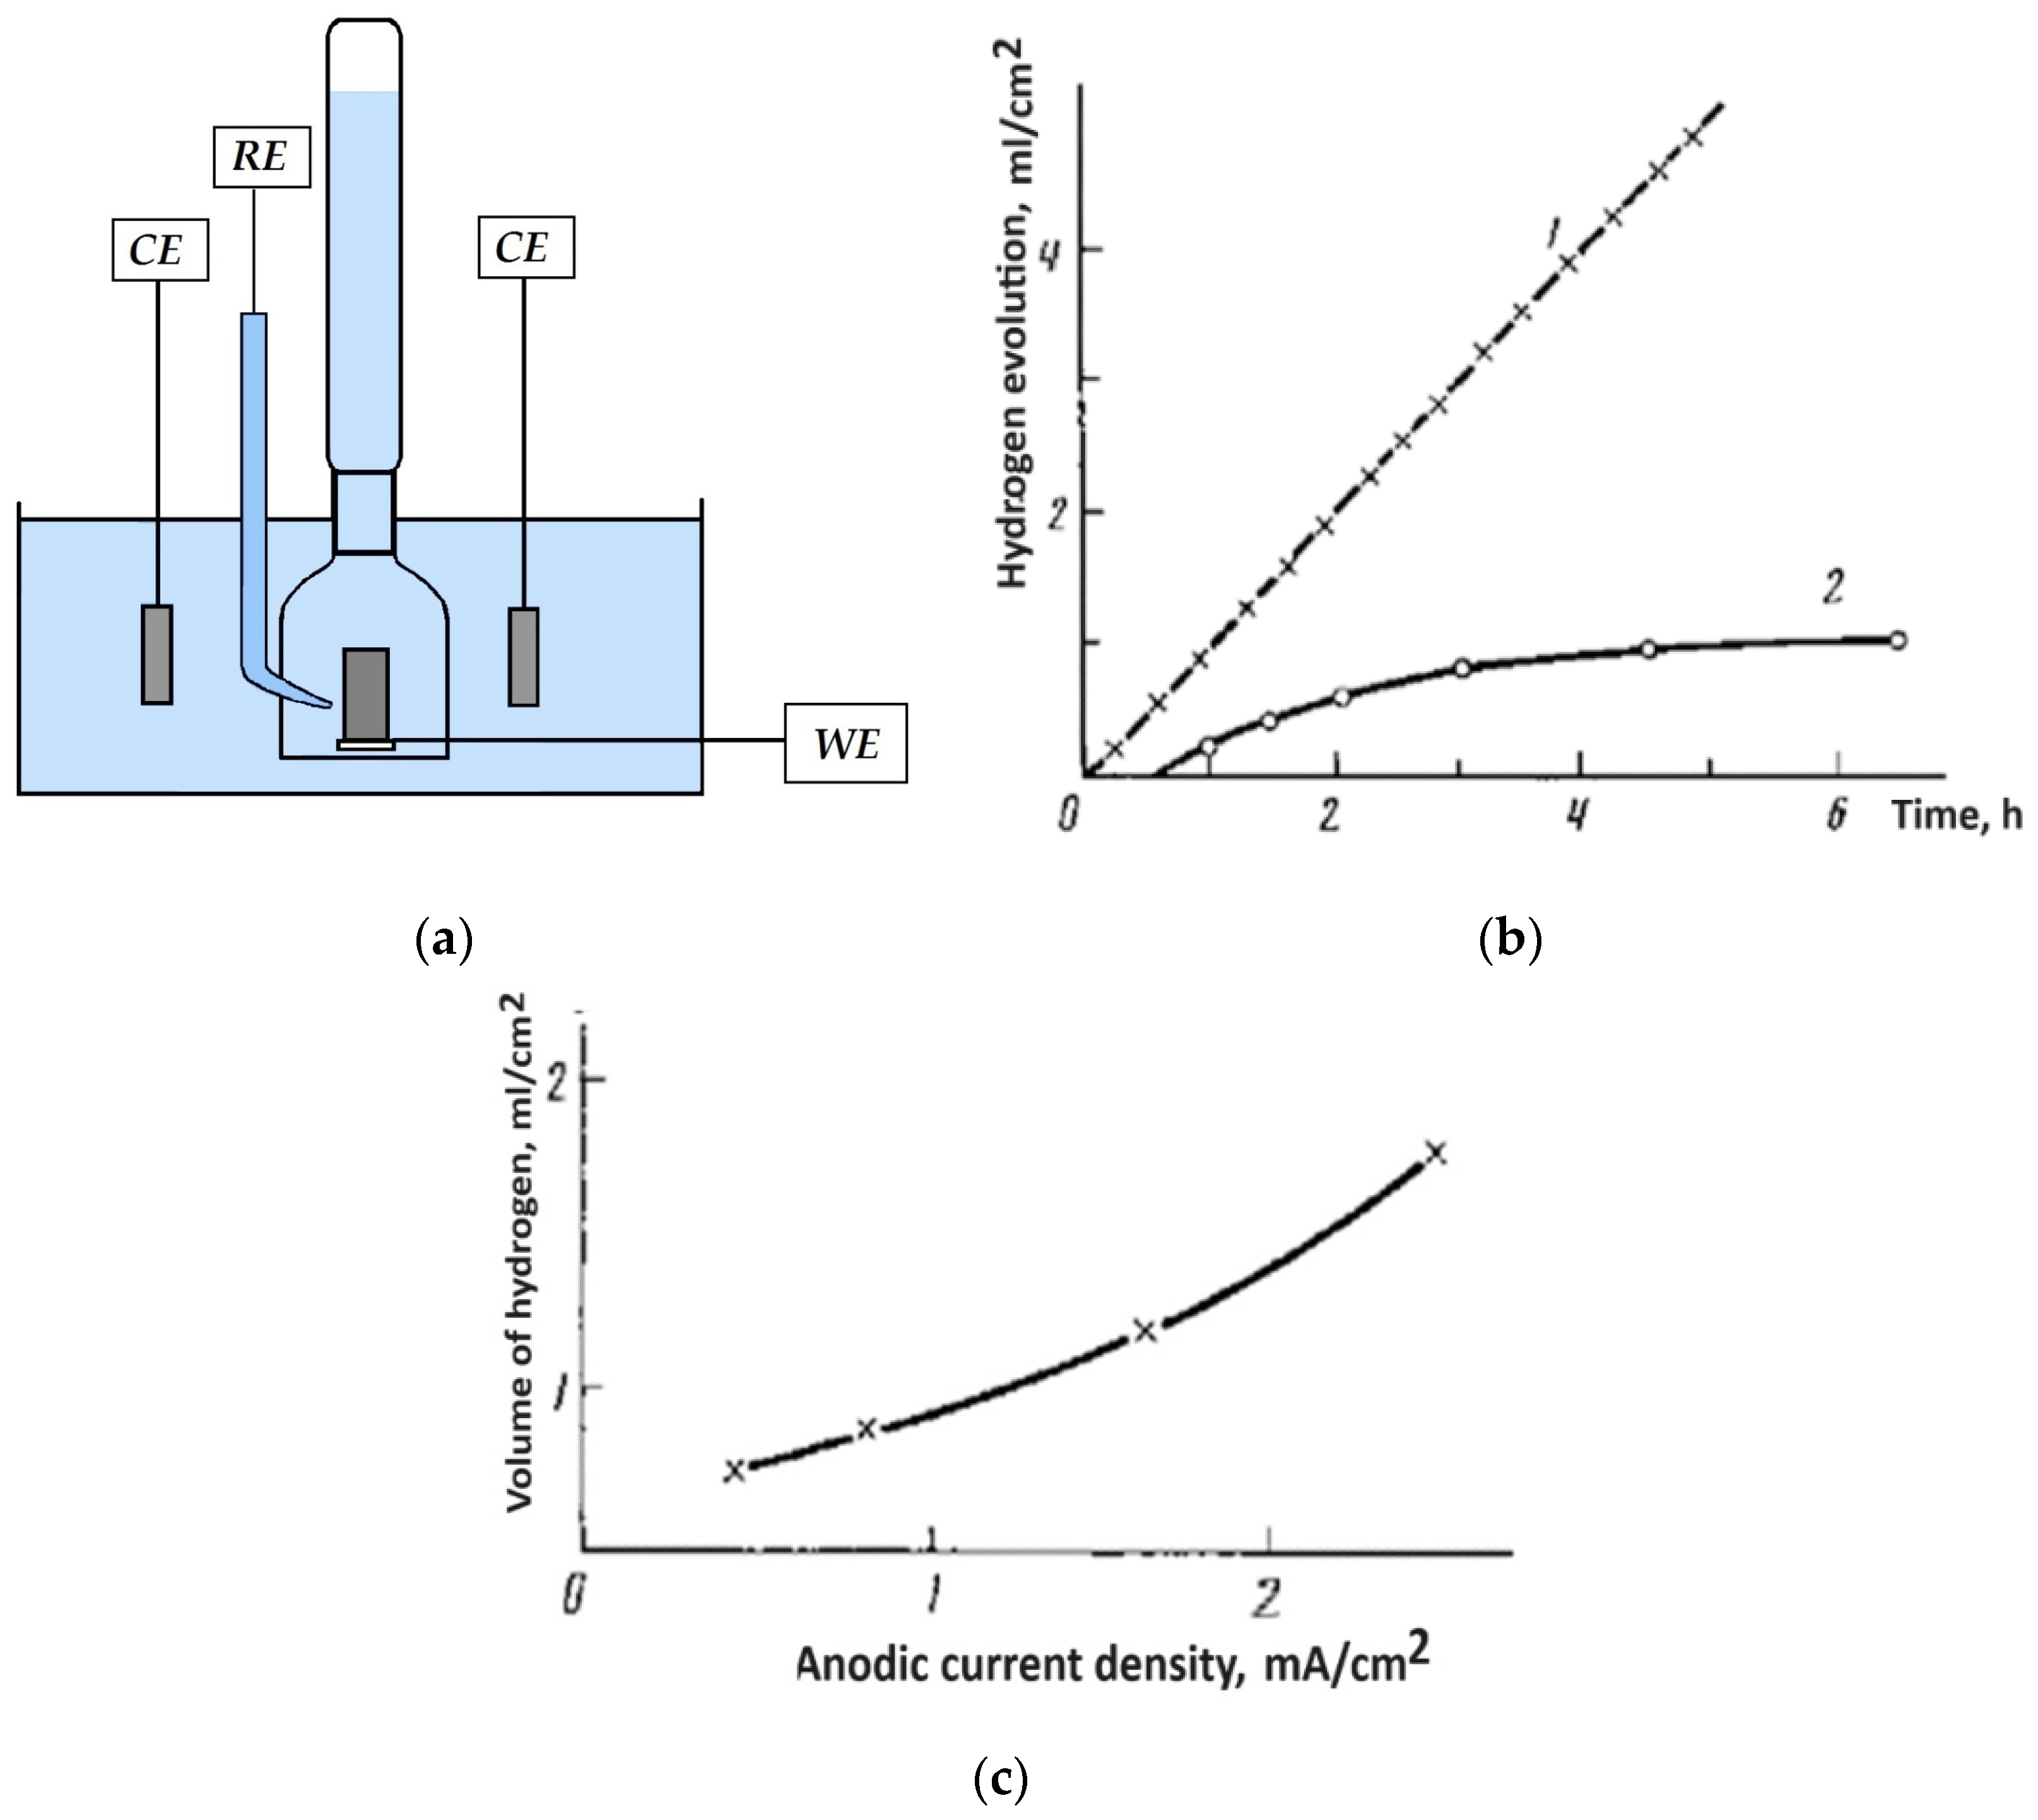
The amount of hydride hydrogen in the corrosion product layer was analyzed after anodic galvanostatic polarization tests. The self-corrosion rate in 0.1 M NaCl aqueous electrolyte was measured using volumetry of hydrogen evolution (HE) (Figure 2). The hydrogen concentration was determined by measuring HE after treating the Mg electrode in 5% chromic acid with 1% AgNO3 (Equation (7)). The results show that the HE rate and surface hydride hydrogen concentration remained steady during galvanostatic anodic dissolution. The surface concentration of hydride hydrogen increased with anodic current density [40,41].
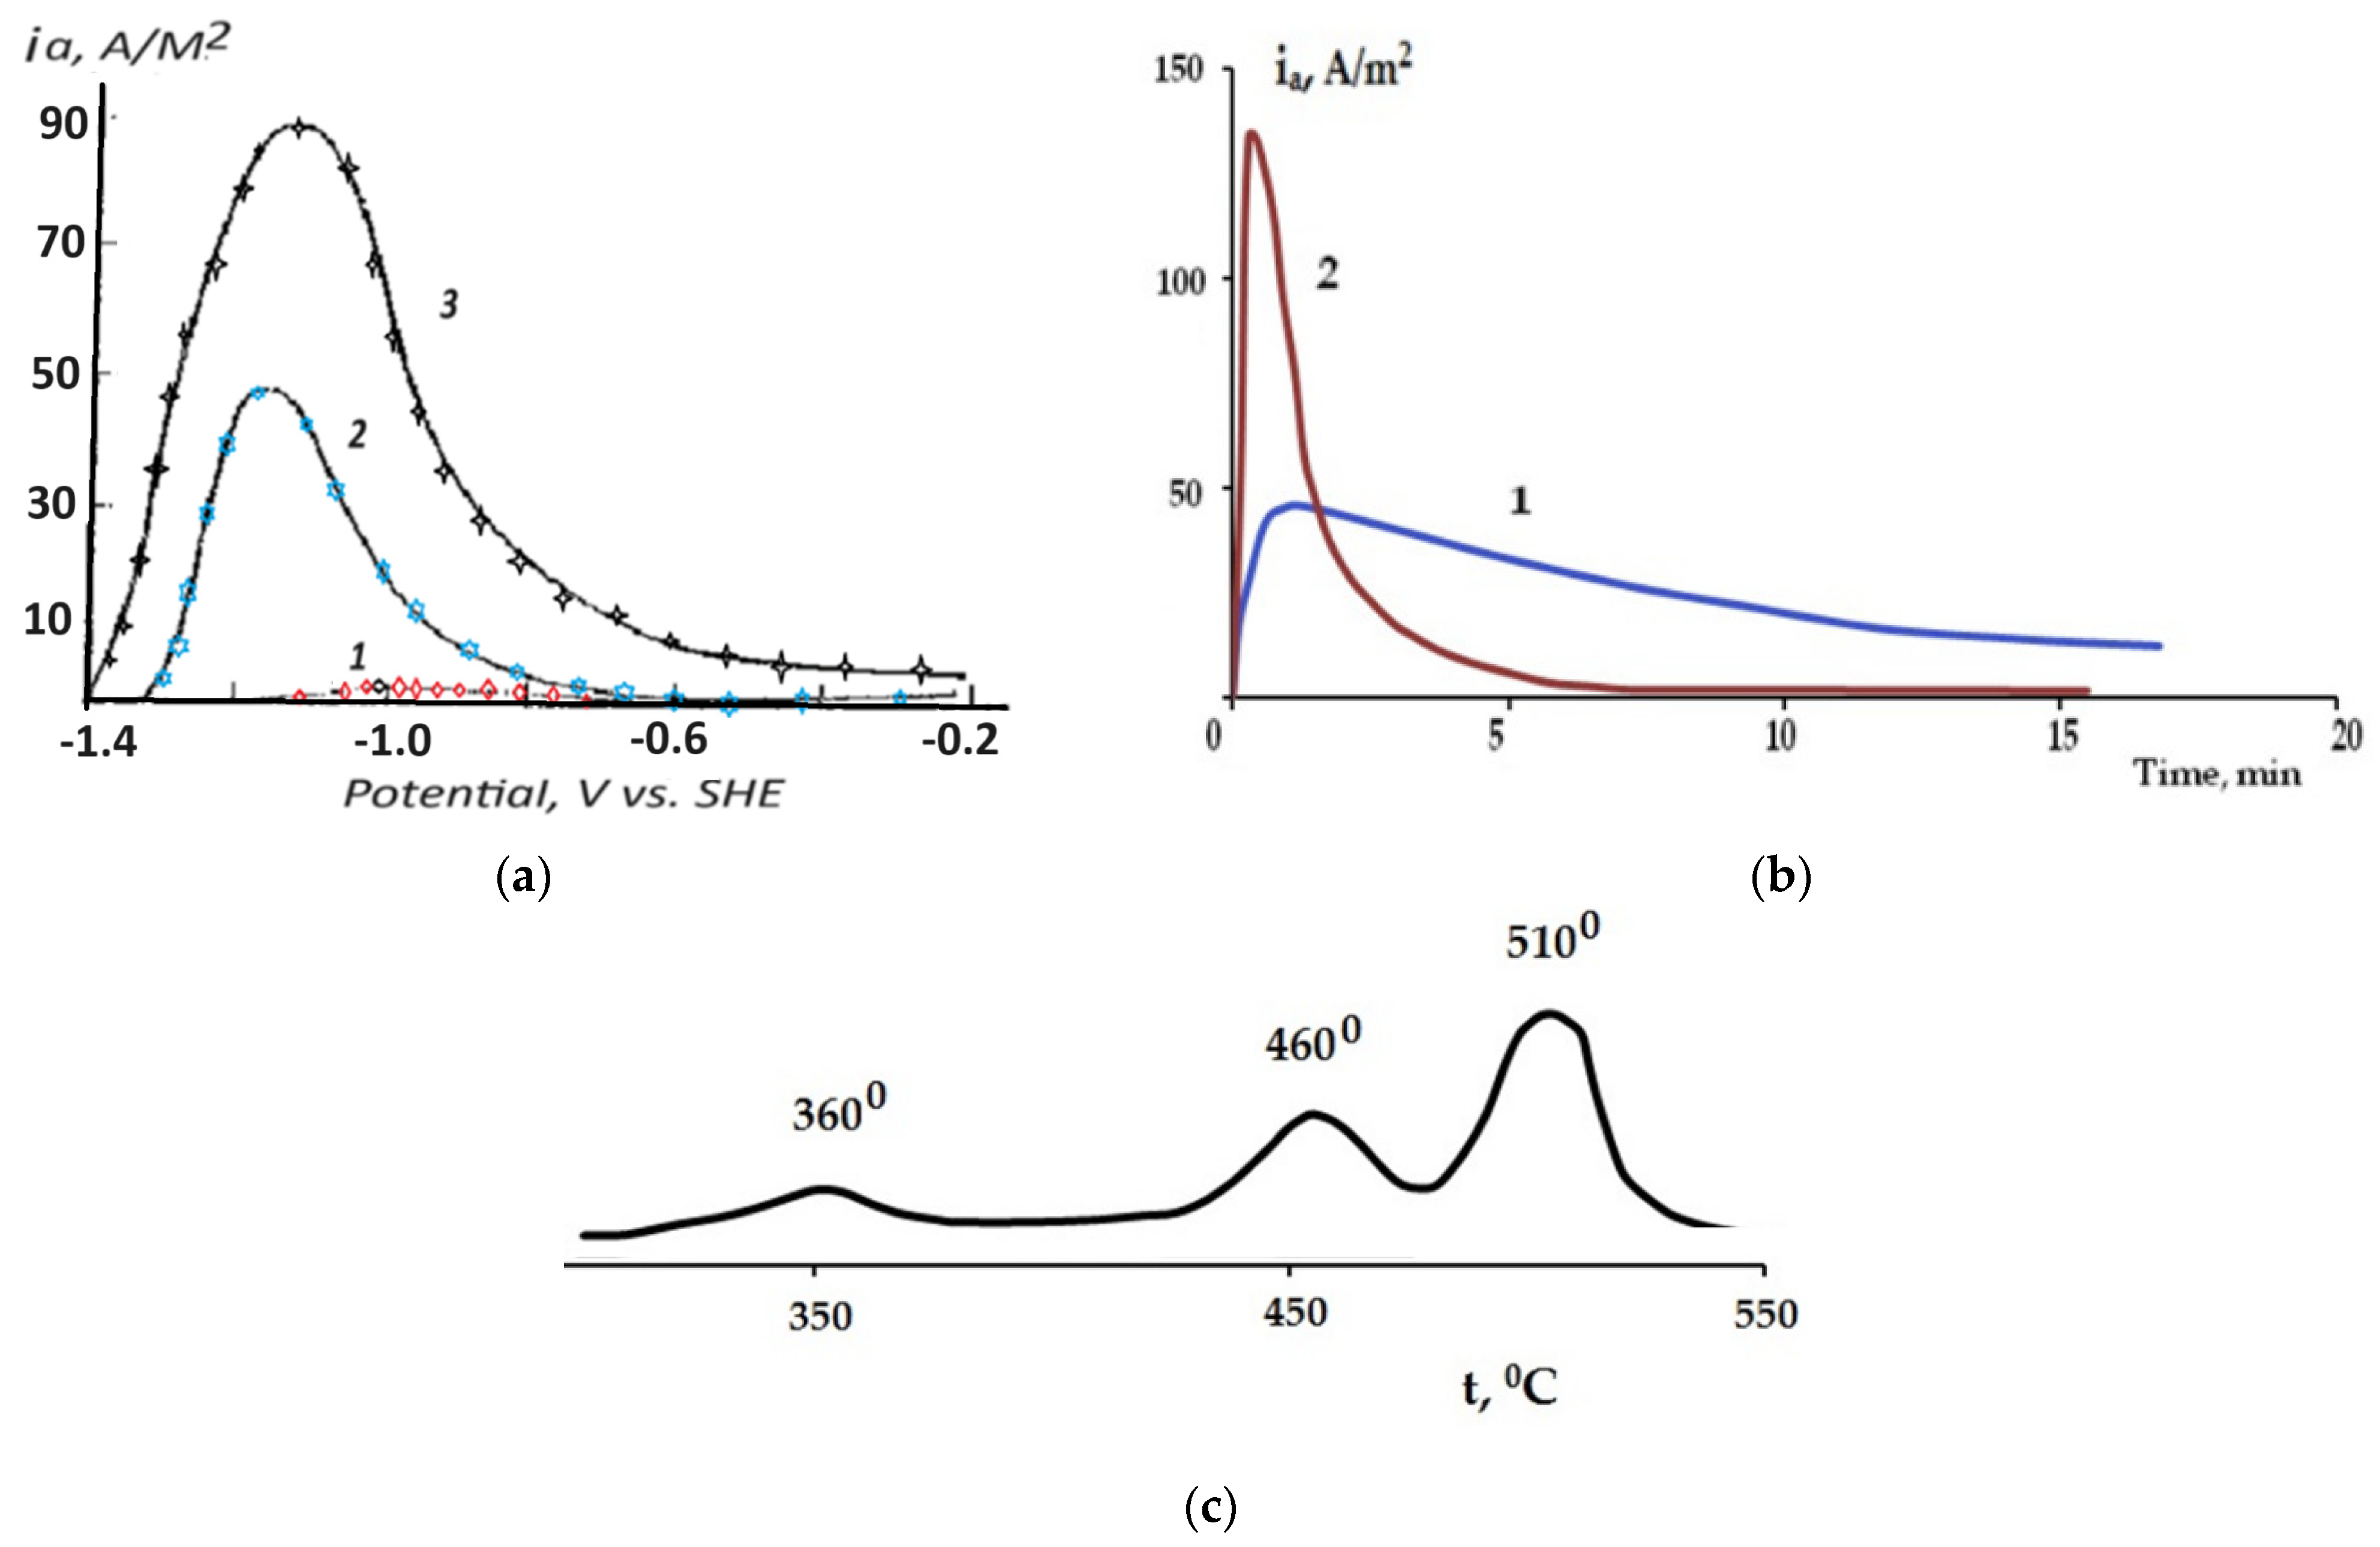
The surface hydride phase in the corrosion product layer can be quantified using anodic oxidation in 1 M NaOH aqueous electrolyte [43]. In this electrolyte, the Mg substrate remains passive over a wide potential range. The open-circuit potential of Mg-MgH2 in 1 M NaOH shifts from −1.1 to −1.4 V (SHE) as the surface hydride hydrogen amount increases. Anodic polarization curves show a sharp increase in currents, indicating active hydride ion oxidation. No significant anodic current was detected for electrodes before anodic pretreatment in the NaCl electrolyte (Figure 3). At −1.2 V (SHE), the amount of anodic electricity and the volume of released gaseous hydrogen corresponds to the stoichiometry of oxidation (Equation (6)), which was used to quantify the amount of hydride hydrogen. During hydride oxidation, hydrogen bubbles are released from areas with dark-grey corrosion products, delaminating MgO/Mg(OH)2 patches from the electrode surface [43]. The decrease in anodic current and HE was due to the depletion of active substances in the surface product (Figure 3). The uniform distribution of the hydride phase quickly reduced the current due to easy oxidation. Conversely, after free corrosion testing in the NaCl-containing electrolytes, the internal hydride ion oxidation took longer due to hydrogen bubbles blocking the pits (Figure 3b, curve 1). Thermal ion mass spectroscopy of H2+ in corrosion products showed lines at high temperatures of 360 °C, 460 °C, and 510 °C (Figure 3c), linked to the decomposition of the hydride phase stored in the surface corrosion product. The flux of H+ ions from the sample was about five times more intense than H2+ and did not show significant temperature effects [43].

2.2. Kinetics of Self-Corrosion and Hydride Collection on Mg Anode in 0.1 M NaCl Aqueous Electrolyte

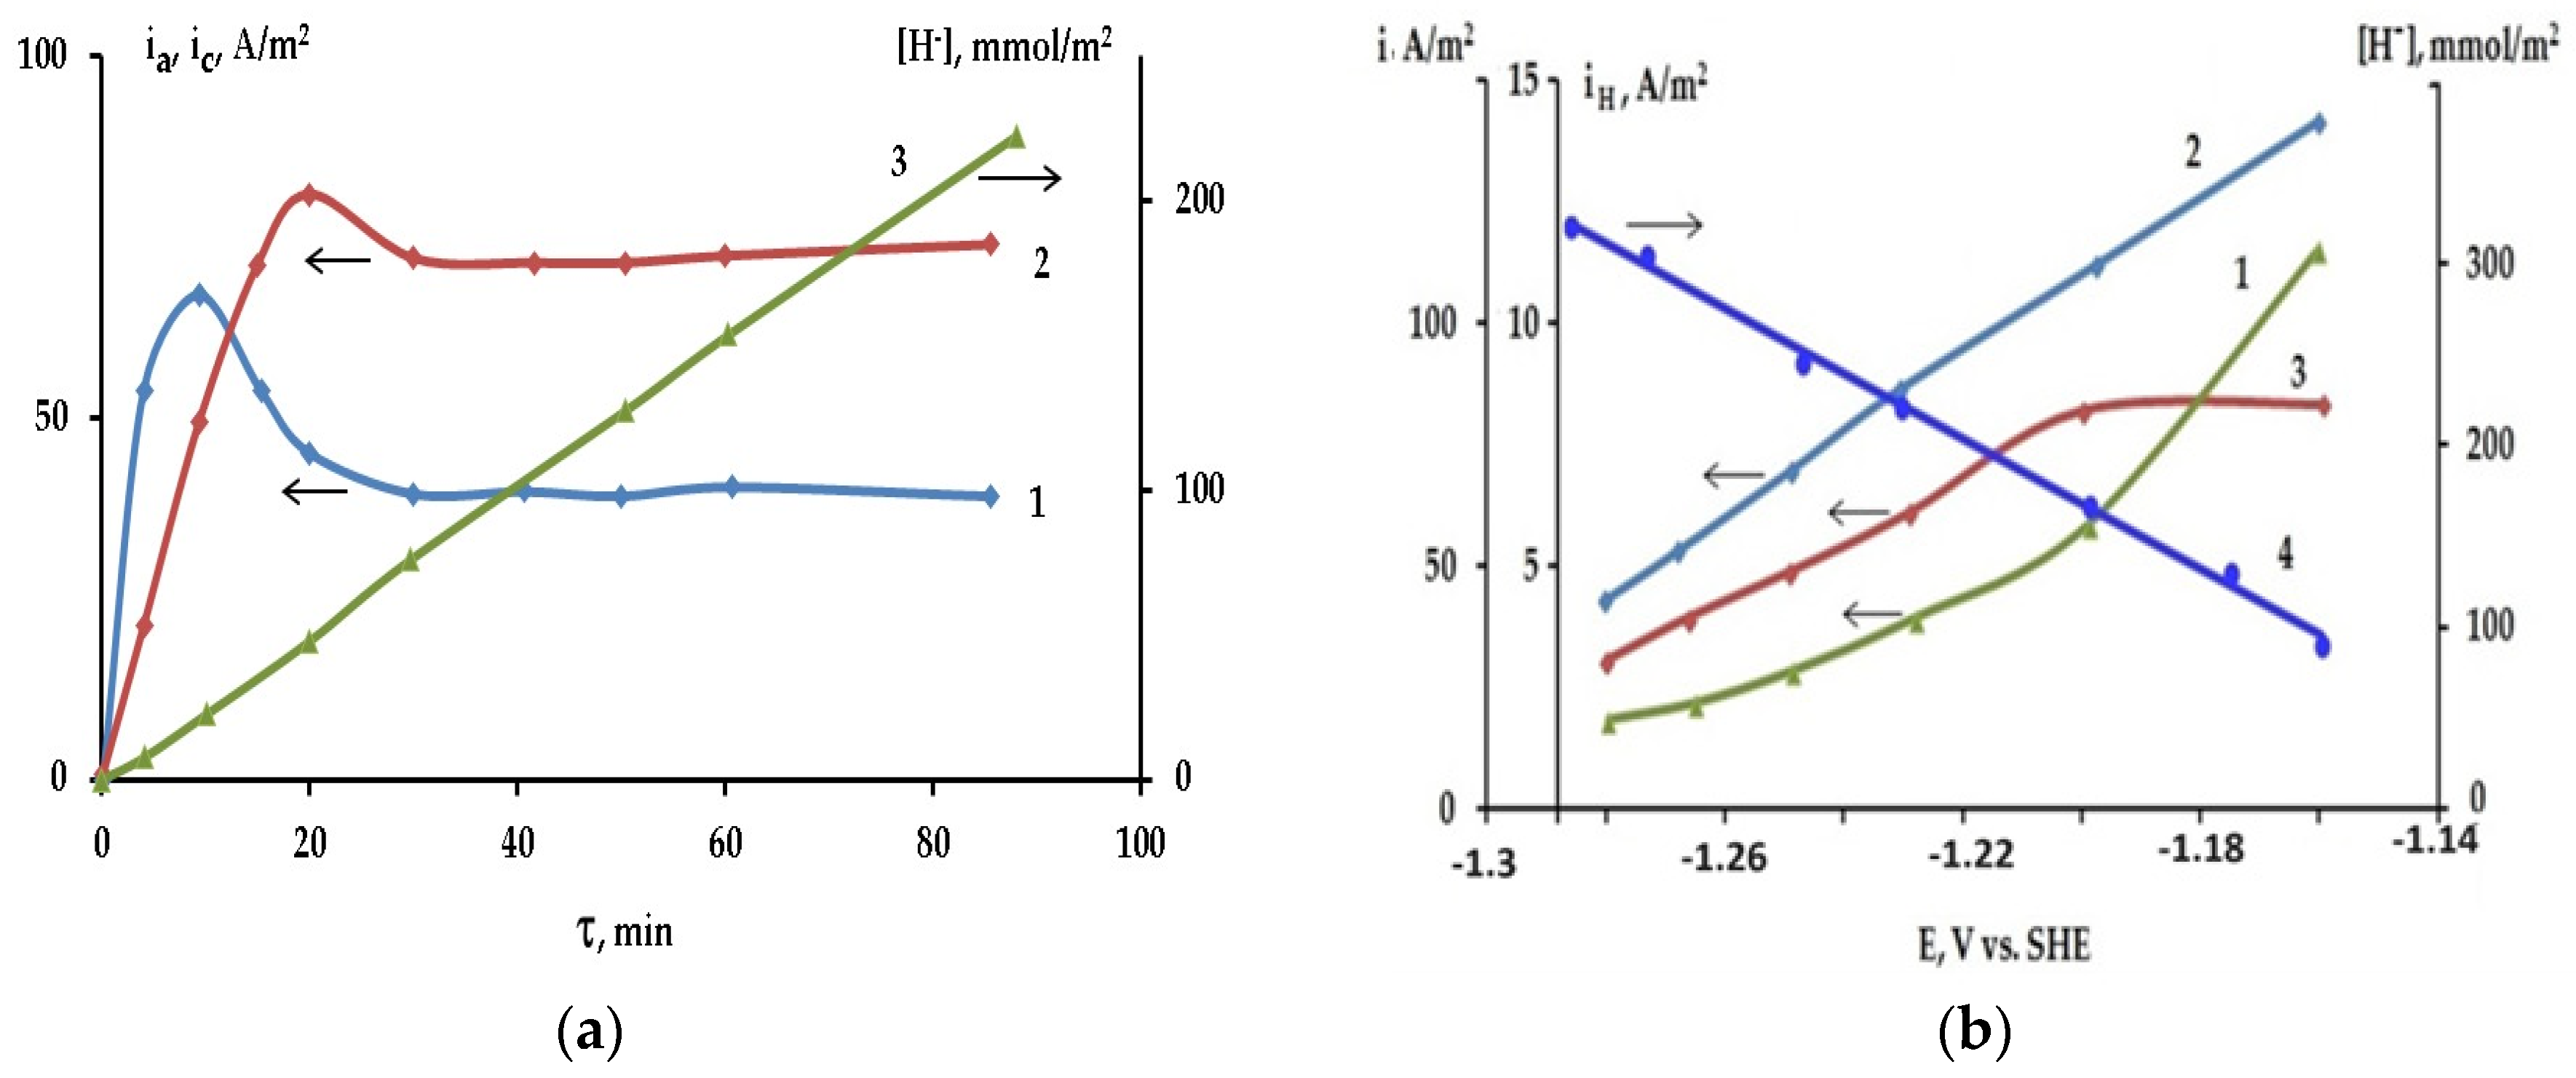
The kinetics of hydride formation and HE were studied under potentiostatic control, measuring the anodic current density, HE current density, and the amount of hydride hydrogen collected in the corrosion product. The experimental data were published in [50]. The concentration of H ions was determined by post-anodic oxidation in 1 M NaOH. Unlike galvanostatic dissolution, under potentiostatic control, the surface hydride hydrogen concentration on the Mg anode increased proportionally with electrolysis time in 0.1 M NaCl electrolyte (Figure 4a). At steady-state conditions, hydride formation currents of 4.5 A/m2, molecular hydrogen evolution currents of 55 A/m2, and anodic currents of 31 A/m2 were detected. The amount of hydrogen in the hydride ranged from 5 to 10% of the total gaseous HE. The noble shift in the anodic polarization potential increased the anodic current and the current of gaseous HE while decreasing the amount of hydride hydrogen (Figure 4b). These results align with the definition of NDE for Mg anode. It was proposed [50] that Mg hydride is an intermediate product of cathodic formation (Equation (5)) at active locations on the metal surface, followed by consecutive anodic oxidation (Equation (6)) with HE. This suggests that the hydride phase is an intermediate product of Mg anode self-corrosion, a point supported in previous studies [47,52].

2.3. The Effect of Halide Ions on the Kinetics of Self-Corrosion and Hydride Formation

The influence of Cl concentration on the self-corrosion and hydride formation rates of the Mg anode under galvanostatic conditions was studied in [50]. The currents were calculated using time dependencies of HE and the amounts of hydride hydrogen stored in the corrosion product, as determined by post-anodic oxidation in 1 M NaOH. It was shown that increasing the concentration of NaCl decreased the self-corrosion current (Figure 5, curves 1–3) but increased the surface concentration of hydride ions. The efficiency of anodic dissolution (ia) relative to the total dissolution (ia + ic) currents R (Equation (9)) was determined as:
R = ia/(ia + ic)
The ratio R increased from 0.29 to 0.35 and 0.48 with increased Cl concentration. Chlorides are the most effective activators of the oxide films that increase the active area of the anode interacting with water (Equations (4)–(7)). However, with an increase in NaCl concentration, the anode potential shifts to more negative values. These two factors likely influence the final surface hydride concentration and self-dissolution rates. At more negative potentials, the rate of hydride phase oxidation (Equation (6)) decreased. Thus, the hydride phase enriches the surface, thereby reducing the HE rate.
On the other hand, anodic dissolution can proceed with the participation of either water or halide ions (Equations (10) and (11)). Reaction with water creates Mg(OH)2 and hydronium ions, which can reduce to hydride ions at the anode surface (Equation (10)). Anodic dissolution with chloride (Equation (11)) forms MgCl2, which can hydrolyze in the electrolyte bulk outside of the double electric layer, decreasing hydrogen ion absorption and reduction.
Mg + 2H2O→Mg(OH)2 + 2H+ + 2e
E = −1.862 − 0.059 pH
Mg + 2Cl→MgCl2 + 2e
E = −1.72 − 0.029 log [Cl]2/[MgCl2]
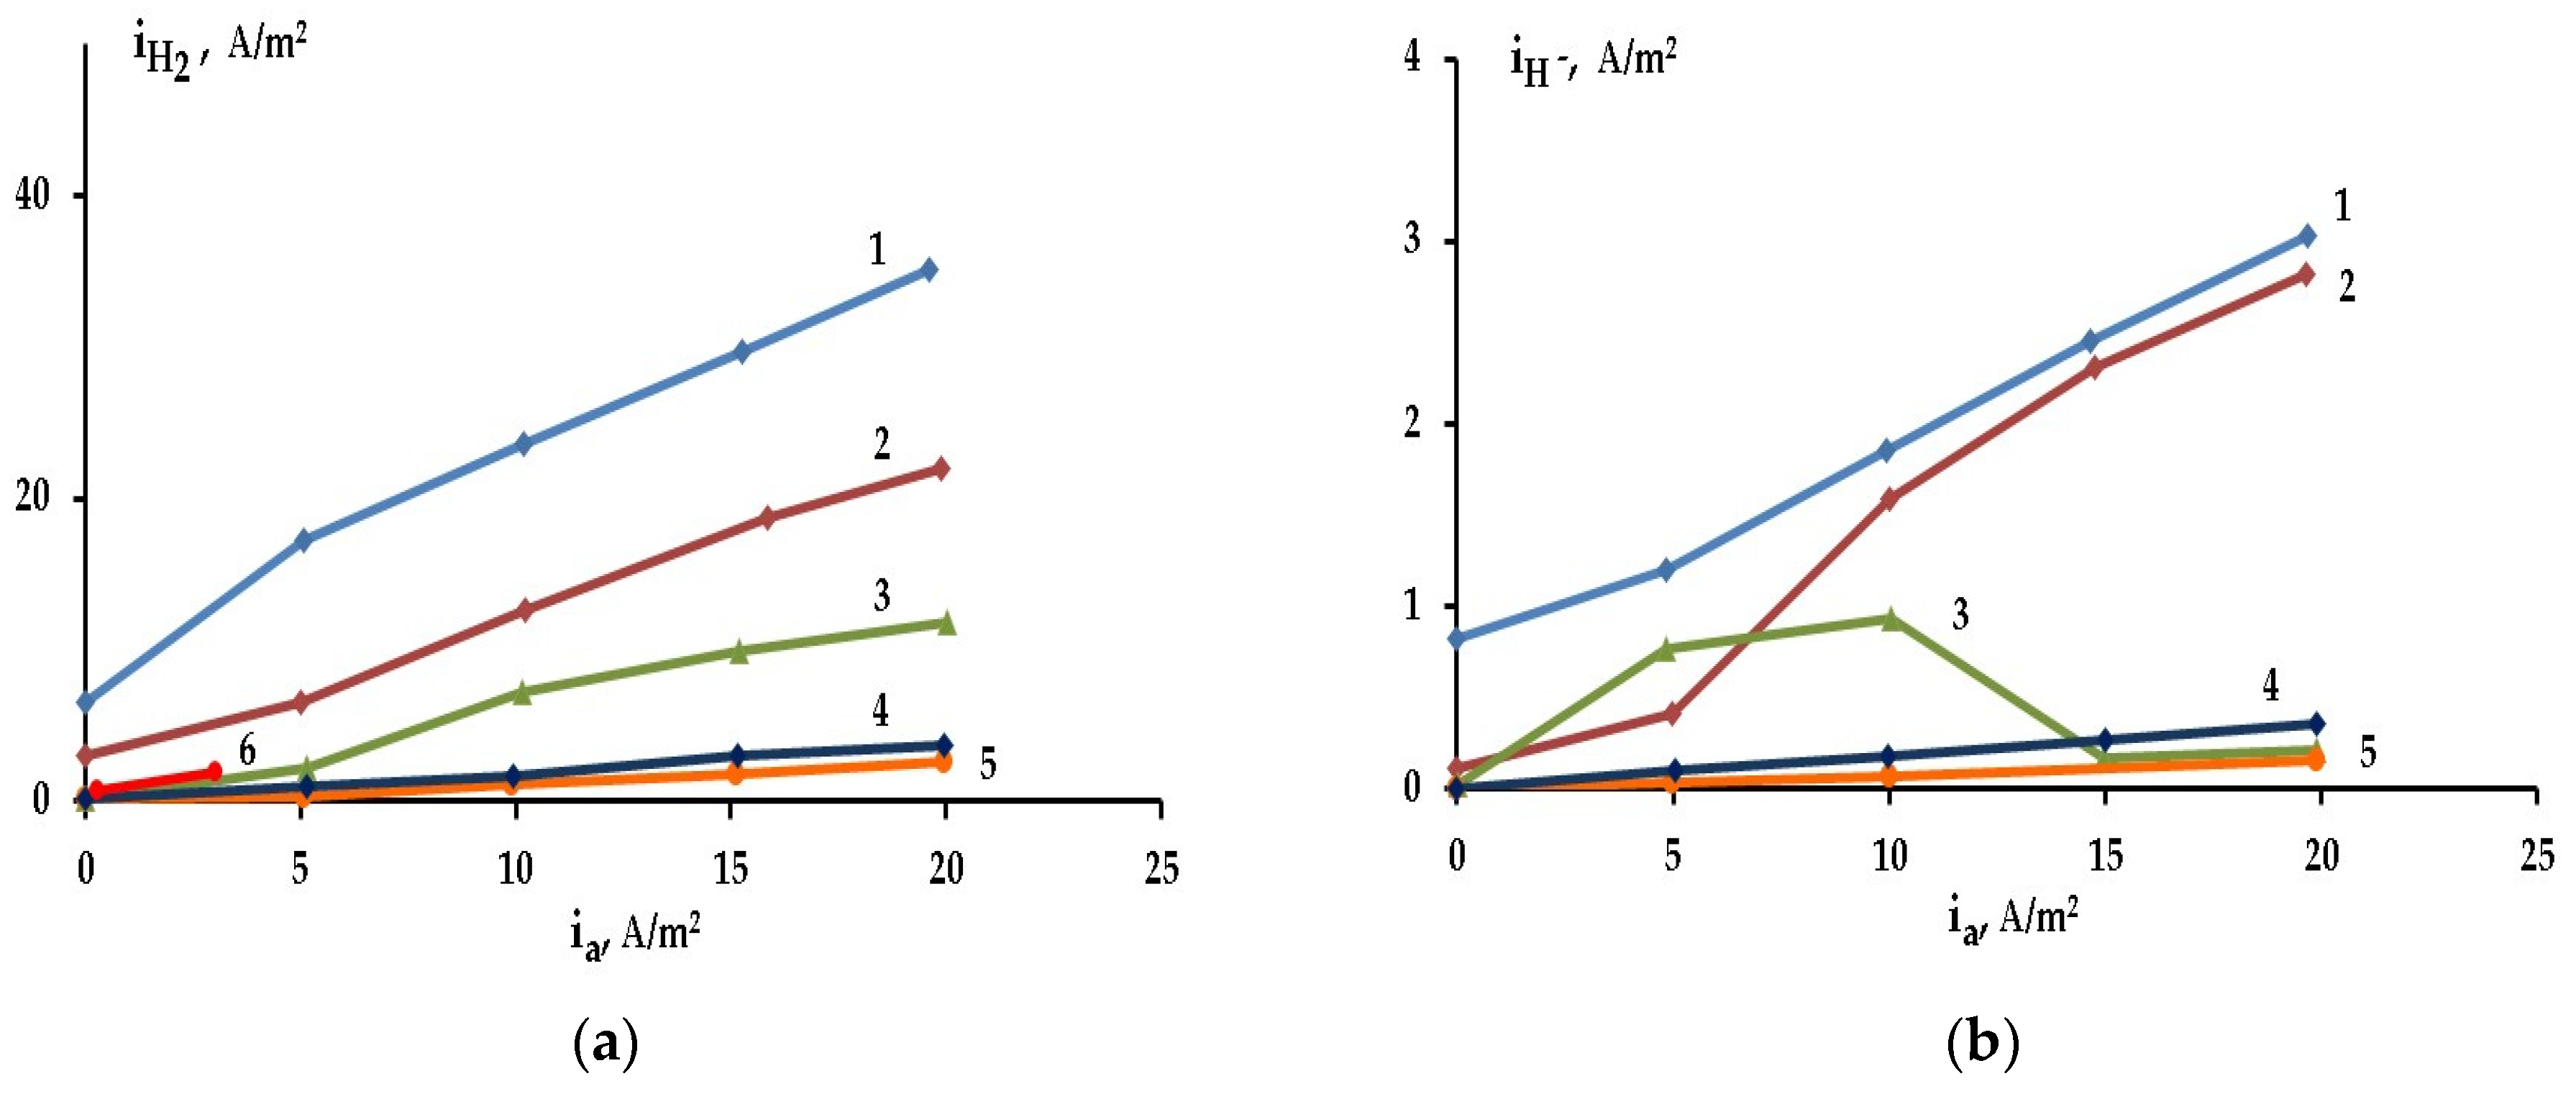
To test these assumptions, the anodic galvanostatic dissolution in electrolytes containing halides, acetate, and sulfate ions was studied (Figure 6). The experimental data were reported in [50]. At the same anodic current density and concentration of 0.1 M, chloride shows the highest self-corrosion and hydride formation currents. The HE decreased in the presence of Br, I, acetate, and sulfate-containing electrolytes. Low HE and hydride formation were detected due to the passivation of the Mg anode in the presence of fluoride ions. The R (Equation (9)) is proportional to apparent valency, increasing in the order of 0.35 (Cl), 0.5 (Br), 0.64 (I), 0.8 (SO42−), and 0.83 (CH3COO). The self-corrosion and hydride formation rates decreased in this order, which can be attributed to the anion’s ability to activate the surface. These data agree with [32] that sulfate ions have a low ability to activate the oxide and uniformly dissolve the anode, resulting in a low self-corrosion rate. The discussion aligns with the study by T.W. Cain et al. [48], which showed that the rate of self-dissolution under NDE conditions depends on the type of anion and its ability to break down the passive oxide film on the Mg anode.
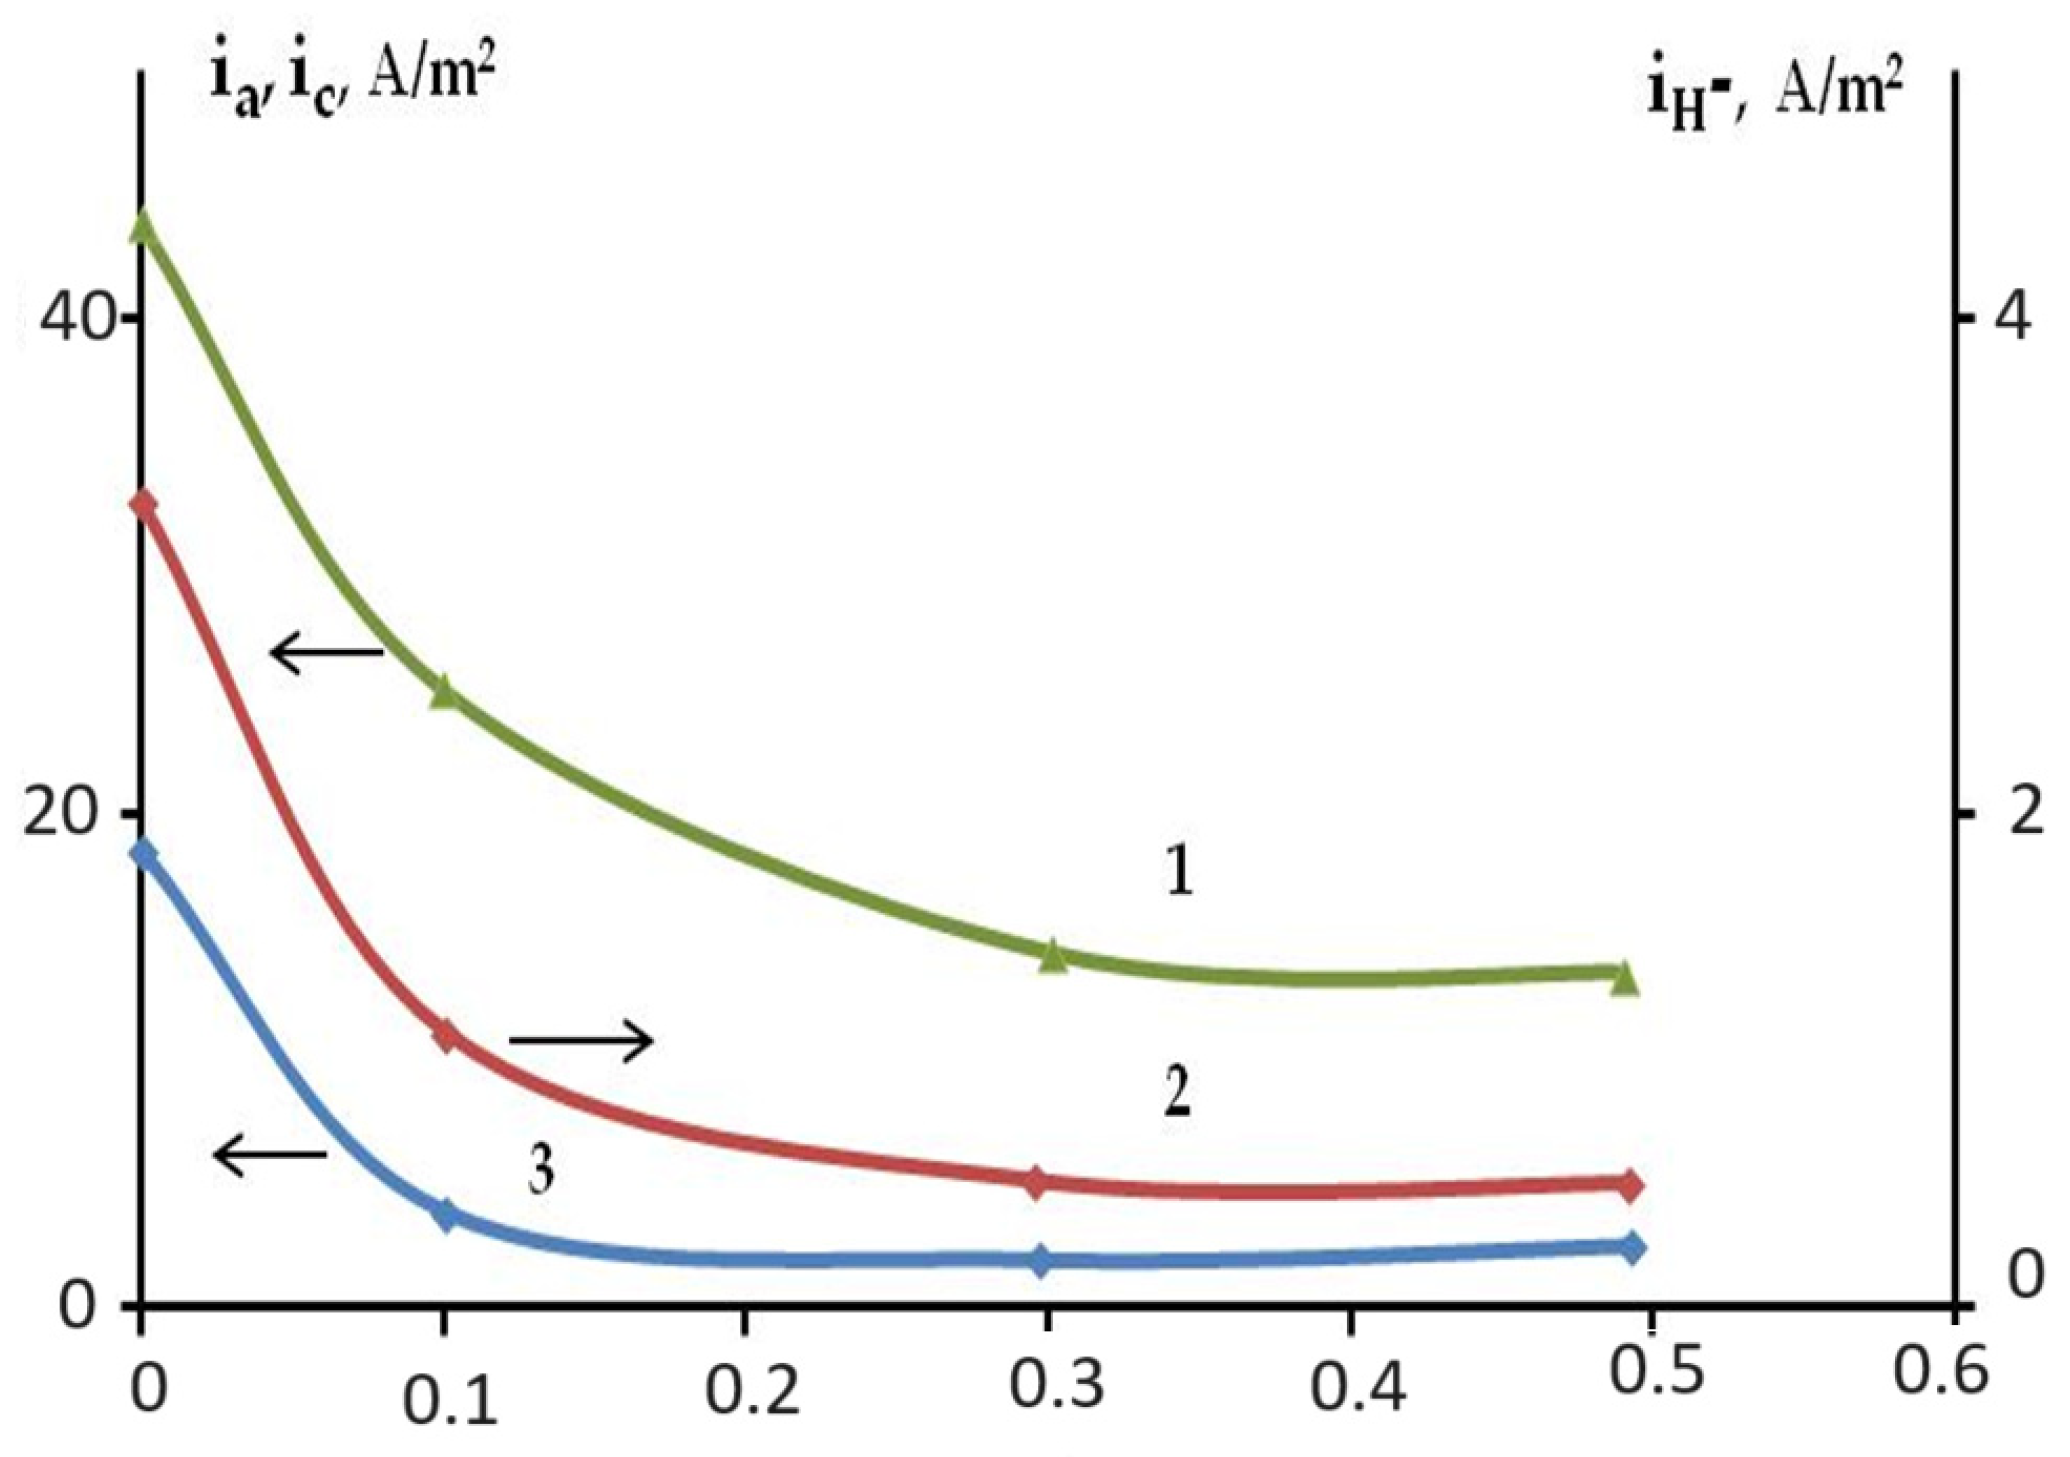
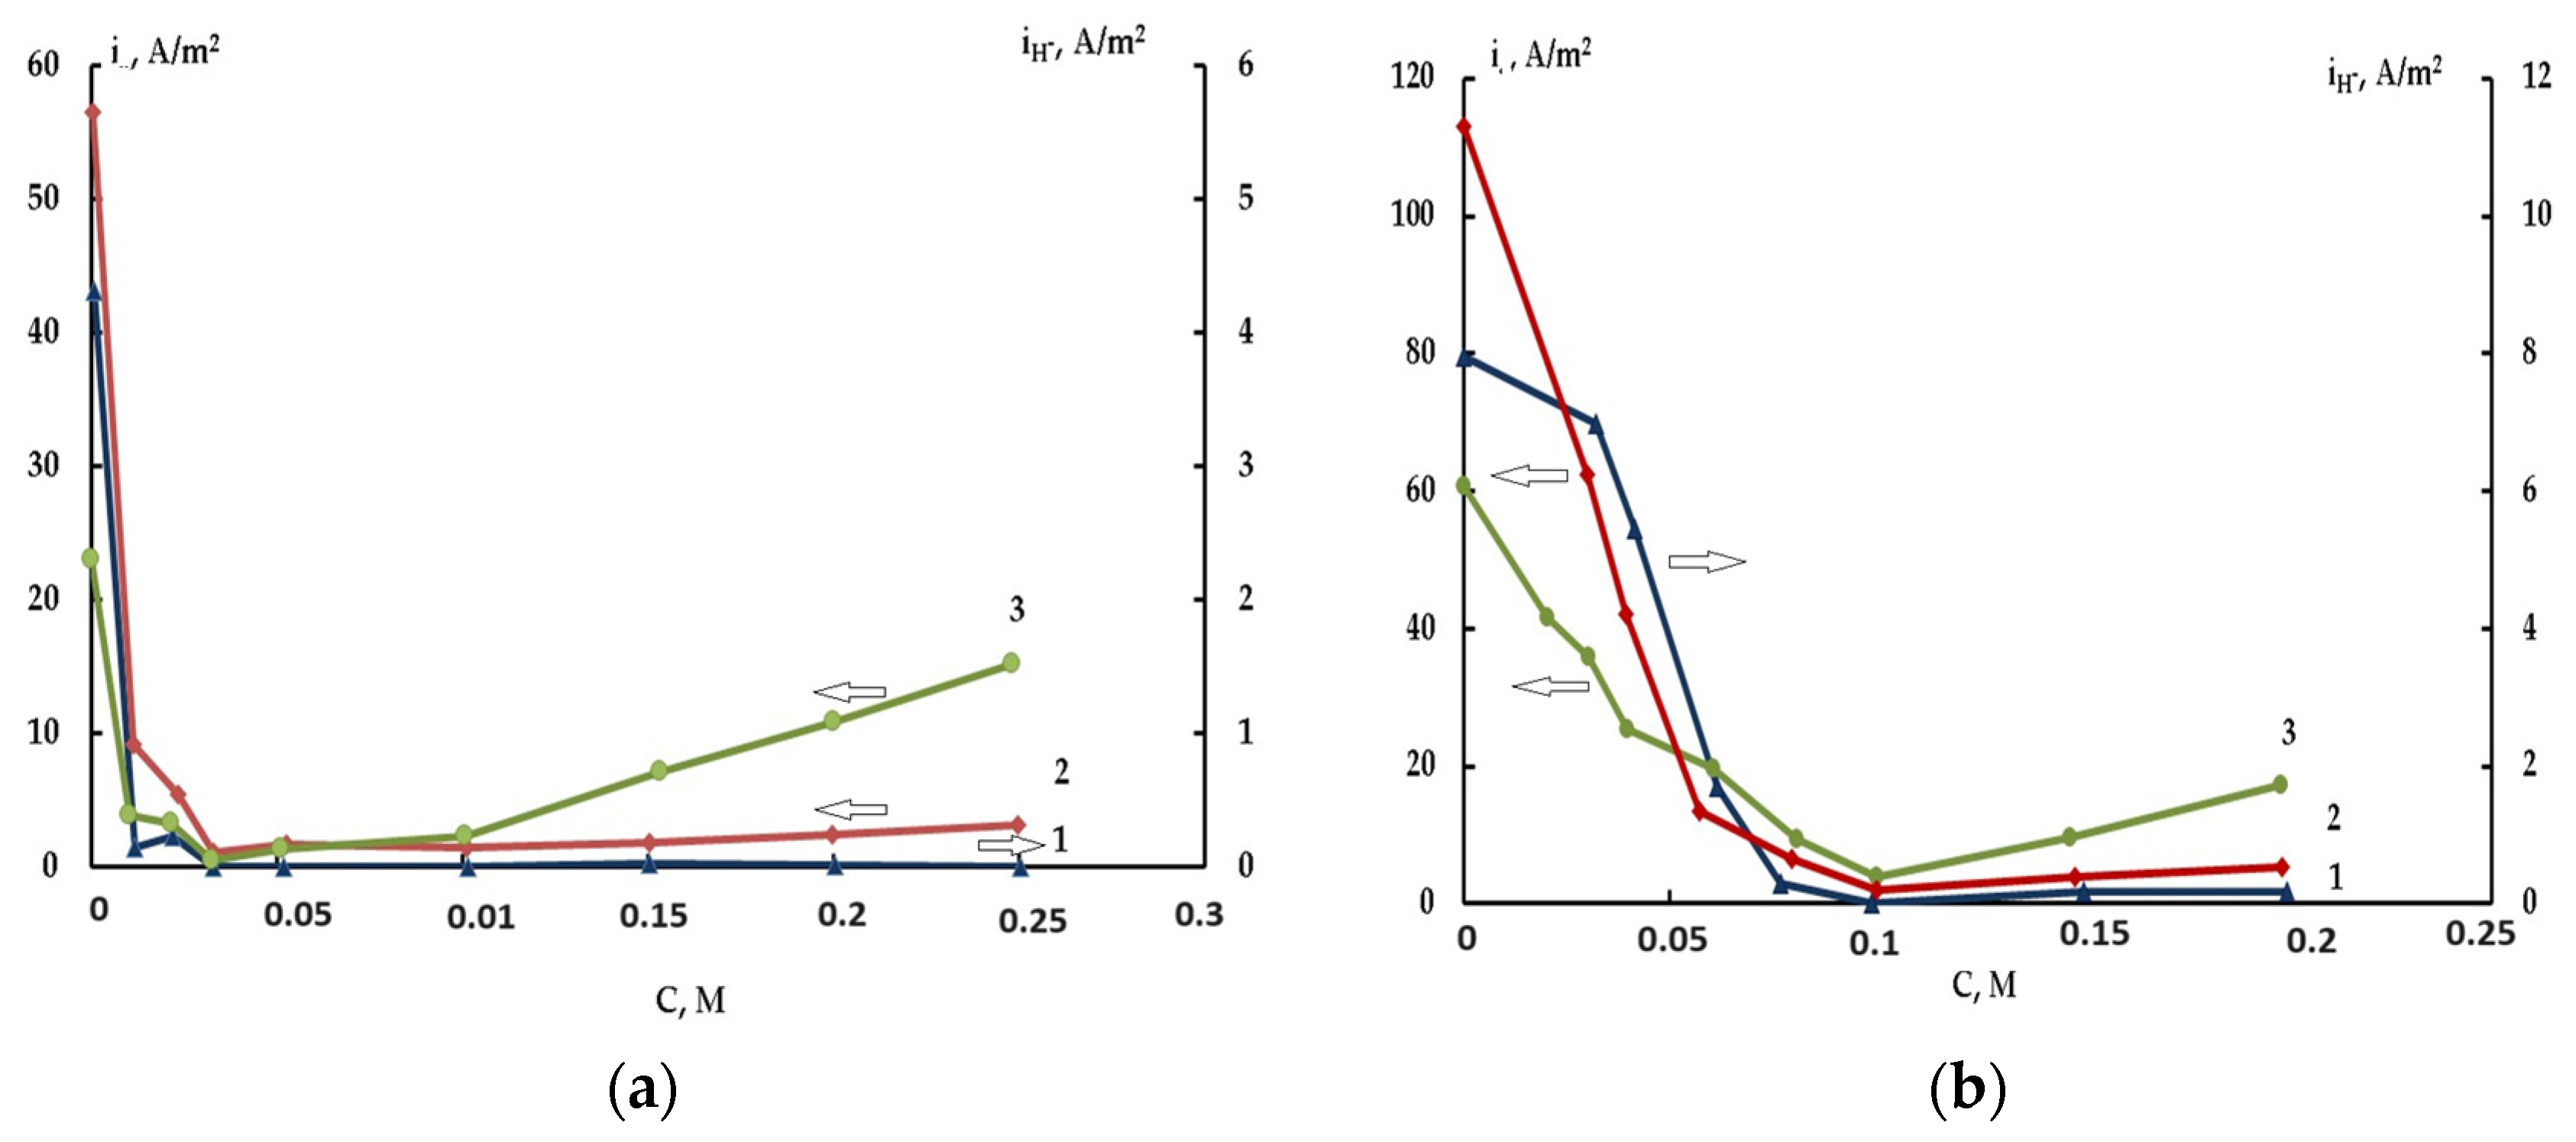
Figure 7 shows the influence of KI additions to 0.1 M NaCl on the rates of anodic dissolution, self-corrosion, and hydride formation at a fixed potential. The addition of I leads to the passivation of the Mg anode and decreases HE by a factor of 3 and hydride formation by a factor of 16 [50]. Passivation can result from adsorption and the replacement of Cl or water from the surface. The strong interrelation between HE and hydride formation rates (Figure 6 and Figure 7) shows that the hydride ions are an intermediate species of the process of self-corrosion. The rate of HE at the NDE is a function of the active area and the potential of the anode, which determines the rate of hydride formation and oxidation.

3. Impact of Addition of Complex Formed Ligands on the Self-Corrosion and Hydride Formation Rates

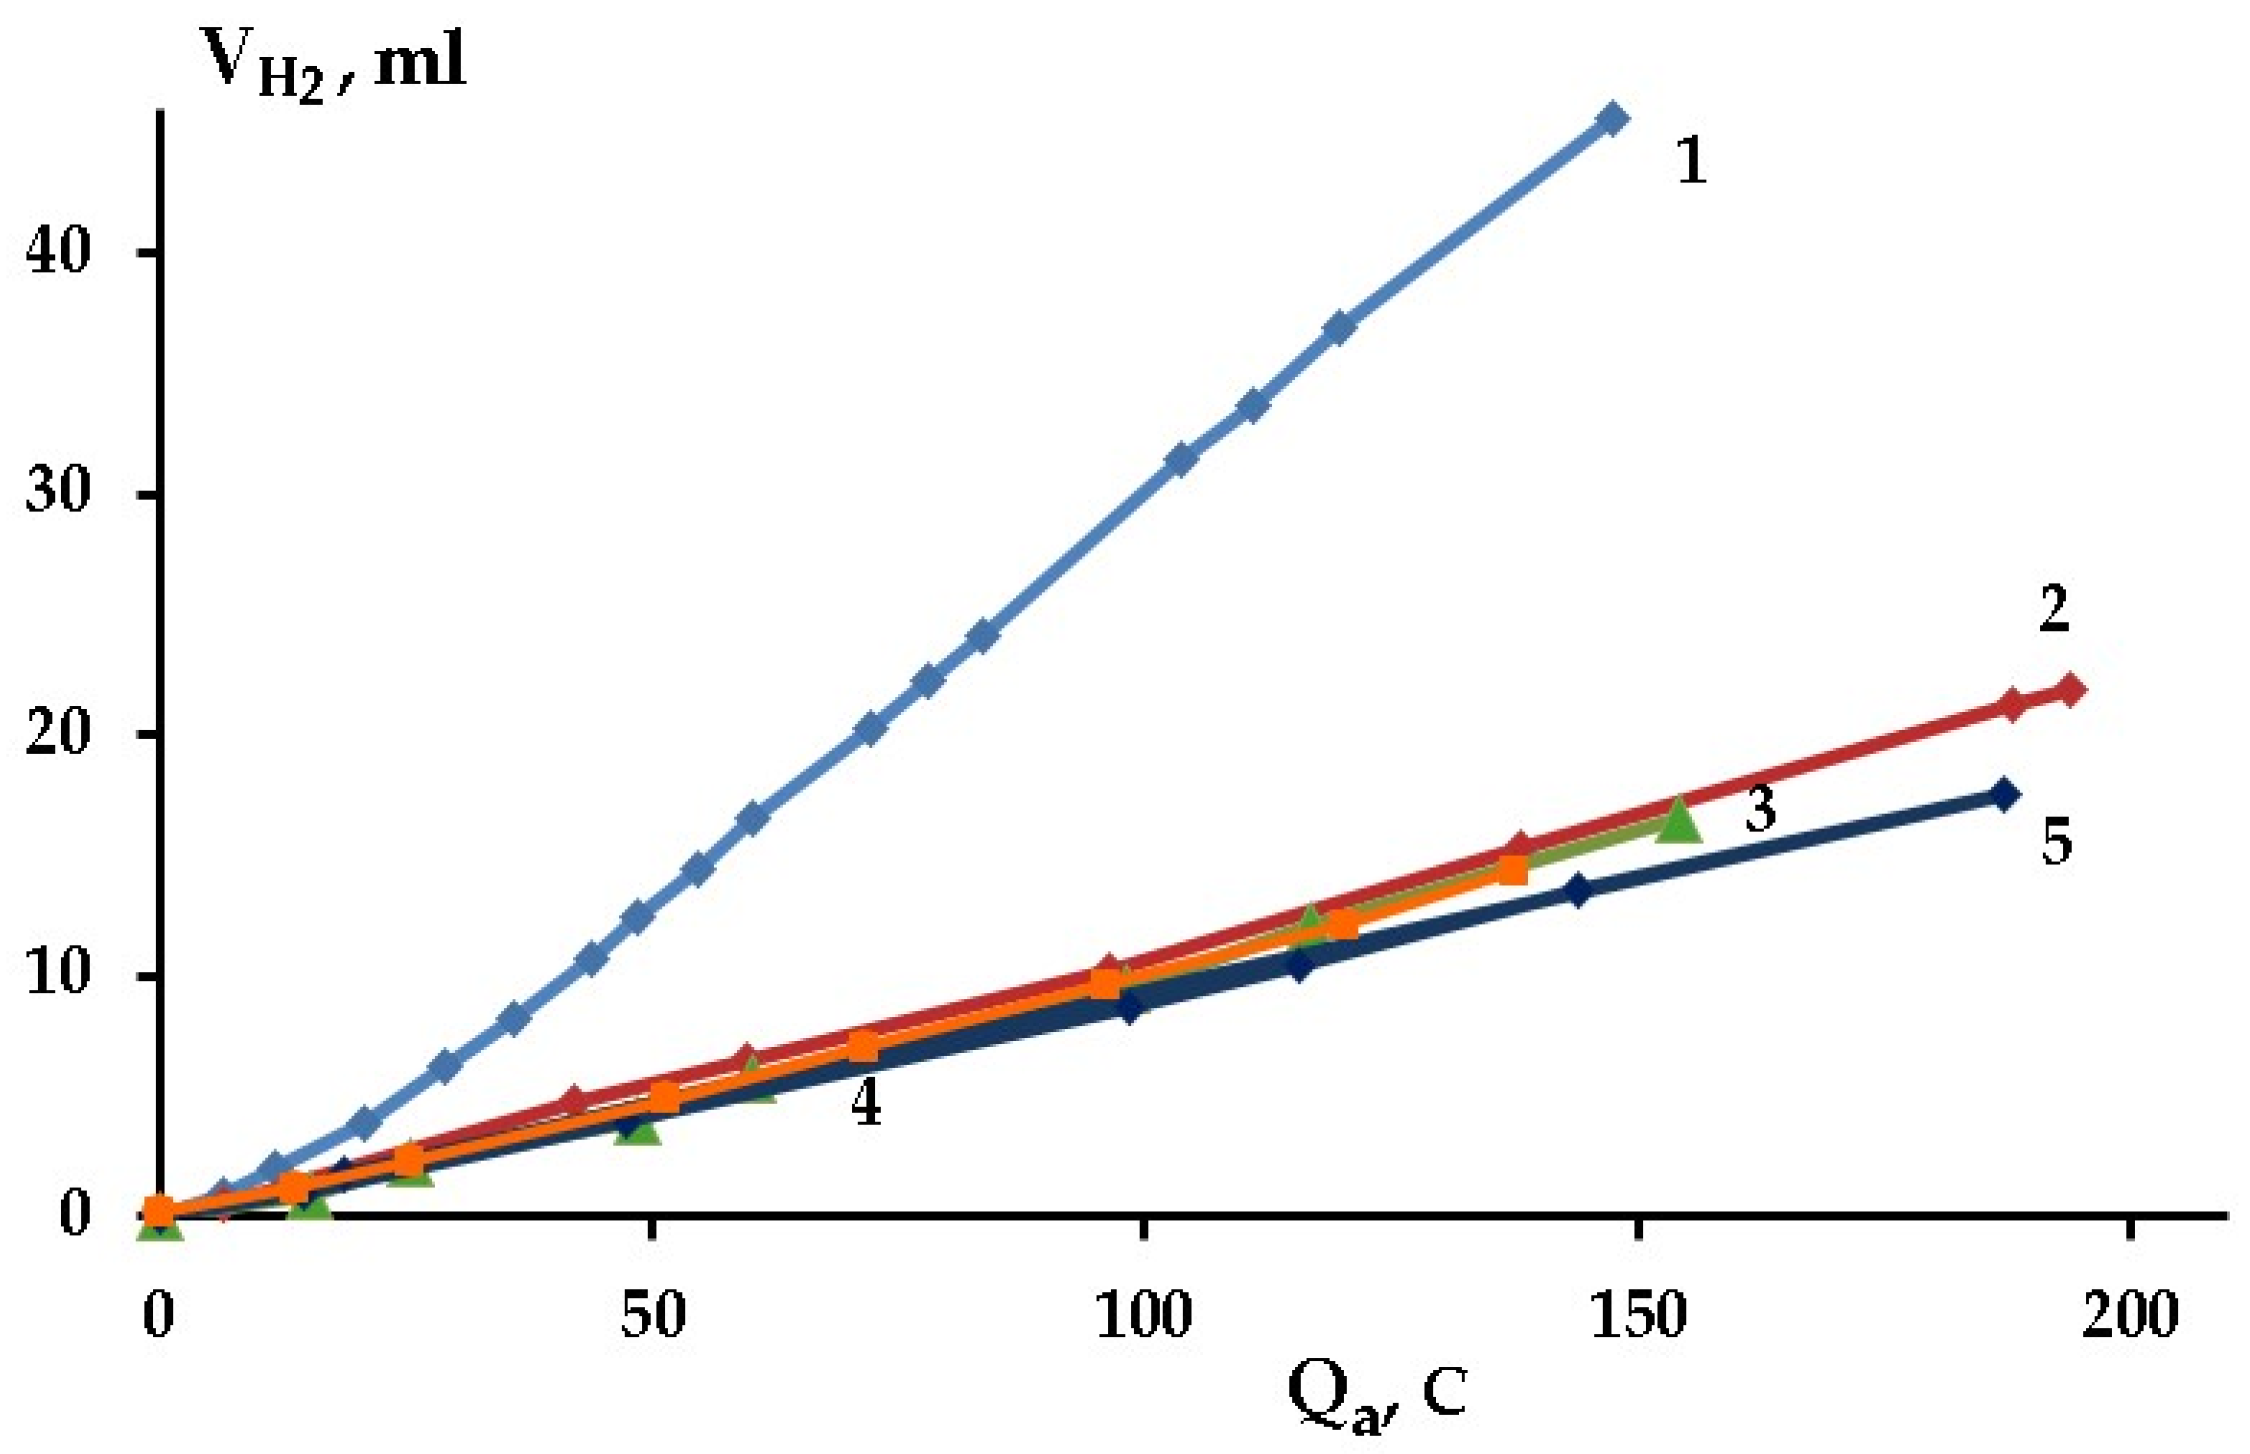
Magnesium alloys are applied as biodegradable materials for implants. Understanding the influence of carboxylic, amino acids, or complex-forming ligands on anodic dissolution and self-corrosion rates is important. The effect of carboxylate anions on Mg dissolution under NDE conditions was studied in [49,51]. Figure 8 shows the influence of sodium acetate additions to 0.1 M NaCl aqueous electrolyte solution on HE as a function of the amount of passed anodic electricity at a fixed potential. The anodic current initially increased from 20 to 44 and then decreased to 31 A/m2 without a significant rise in HE and hydride formation (3 A/m2) currents. The ratio R rose from 0.29 to 0.4, indicating that acetate ions can slightly increase the efficiency of anodic dissolution but do not significantly change the active area of the anode. These results were reported in [51].
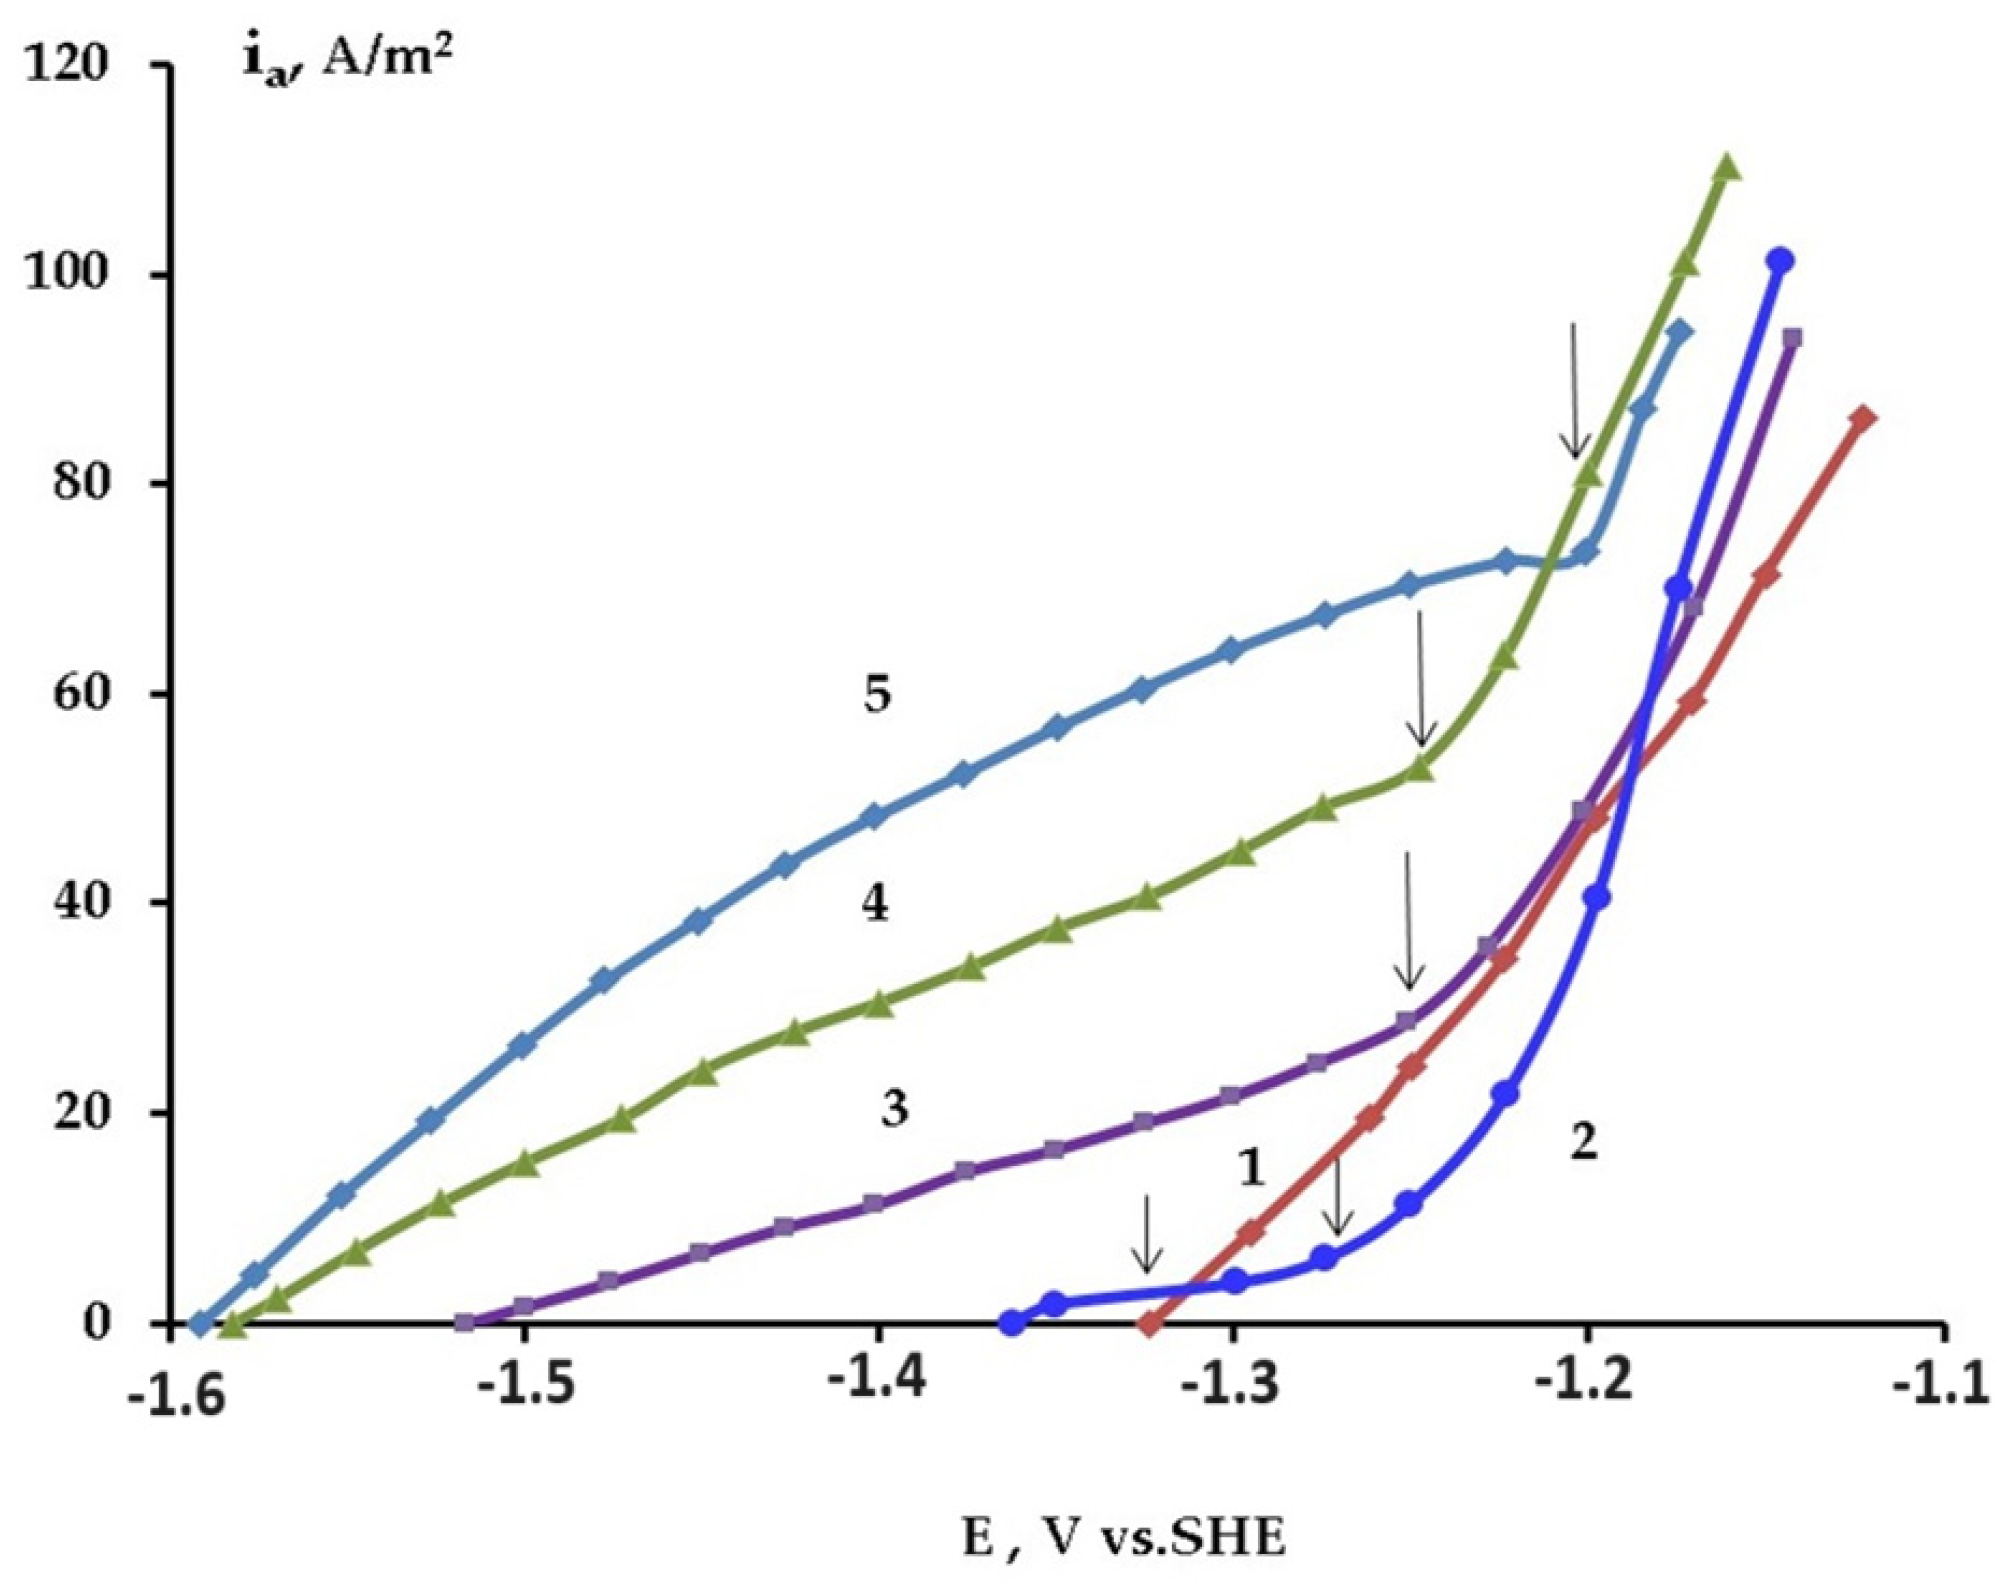
The effect of sodium oxalate, forming stable complexes with Mg2+, on anodic dissolution and HE in 0.1 M NaCl aqueous electrolyte was studied in [49,51]. The standard potential (Equation (12)) of the [Mg(C2O4)2]2− complex was calculated using the thermodynamic constant of complex formation (log β = 4.38). Thus, the anodic reaction with oxalate can be thermodynamically more efficient than the reactions of Mg with water and chloride ions (Equations (10) and (11)). Figure 9 shows the anodic polarization curves in the NaCl electrolyte solution with the additions of (C2O4)2− at pH 10.2. Without the addition, anodic dissolution proceeds with pitting formation and hydride formation. Oxalate shifts the anodic polarization curves to negative potentials due to the activation of anodic dissolution of Mg and dissolution of the oxide–hydroxide film, creating stable soluble complexes (Equations (12) and (13)). The curves have the following two parts: at more negative potentials, Mg dissolves uniformly without forming pits and dark grey deposits. At more positive potentials, the anodic curve decreases the slope (dE/dlog ia), the oxide film breaks down, and dissolution proceeds from active locations. Oxalate increases the potential of pitting formation (arrows in Figure 9), showing the inhibition of oxide film breakdown.
Mg + 2 C2O42−→[Mg(C2O4)2]2− + 2e
E = −2.94 − 0.059 log [C2O42−]
Mg(OH)2 +2 C2O42−→[Mg(C2O4)2]2− + 2OH
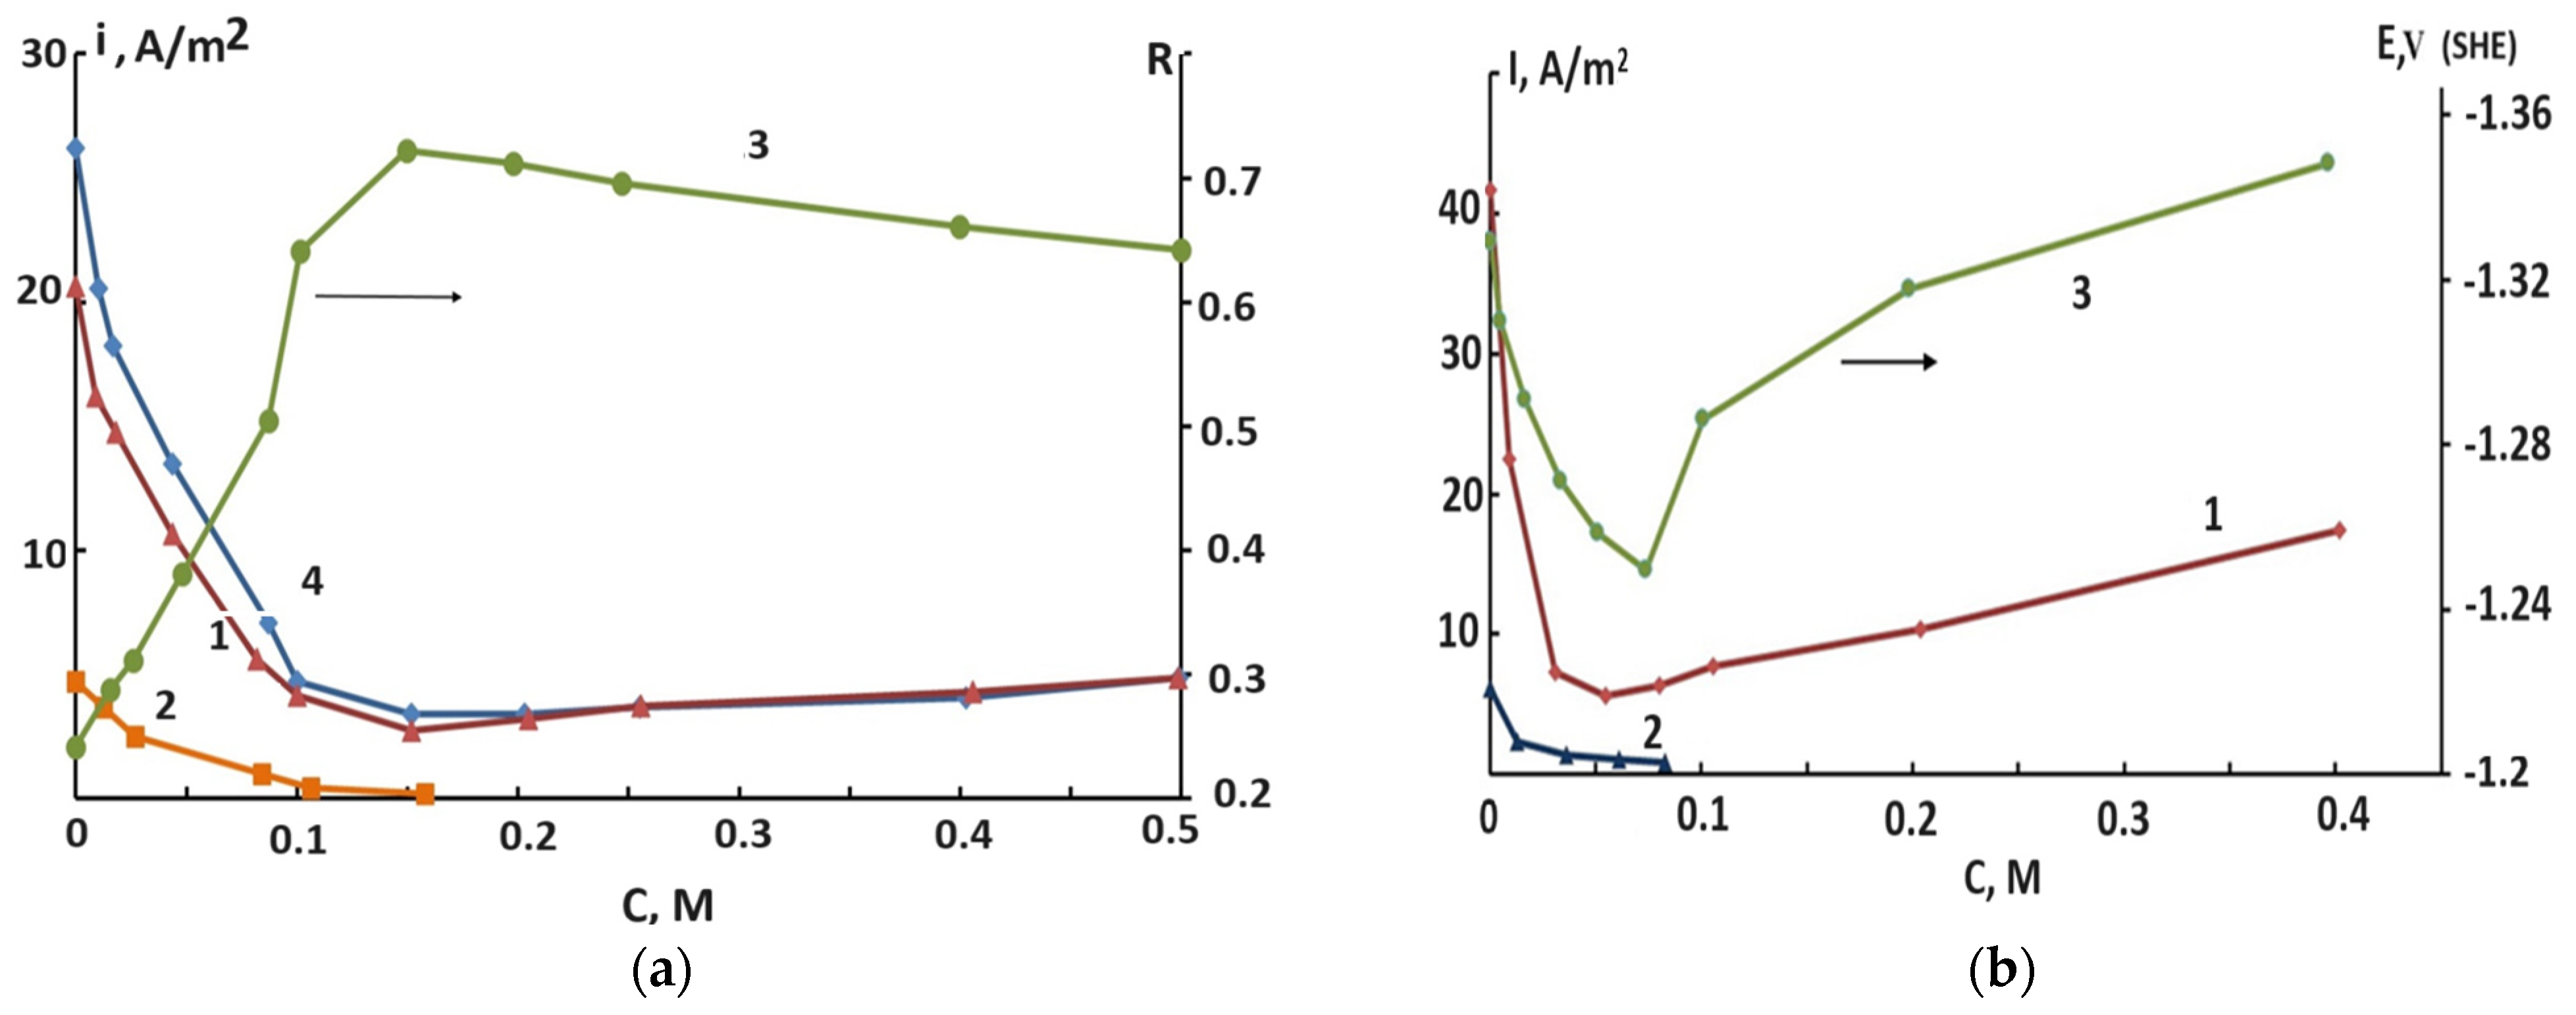
The effect of oxalate addition on the HE and hydride formation was studied [49]. Figure 10 illustrates the galvanostatic dissolution and the impact of oxalate addition to 0.1 M NaCl aqueous electrolyte. Oxalate concentrations of 0.08–0.15 M inhibited HE and hydride formation. The ratio R (Equation (9)) increased from 0.3 to 0.72 and then decreased to 0.62 with excess oxalate in the solution. Anode passivation by low oxalate amount likely resulted from oxalate complex formation with Mg2+ (Equation (12)). Higher oxalate concentrations increased the gaseous HE rates without hydride formation due to a negative potential shift and accelerated water reduction.
Similar investigations were carried out at fixed potentials. Oxalate passivates the anode and inhibits HE, pitting/hydride formation (Figure 11). It was calculated [51] that the concentration of passivation is determined by ligand diffusion flux to the anode surface, corresponding to complex formation stoichiometry near the electrode-electrolyte interface (Equations (14)–(17)). Increased ligand flux accelerates anodic dissolution across the MgO/Mg(OH)2 passive film surface without breakdown [49,51]. No significant HE was observed at the fixed potential with the increased concentration of the ligand.
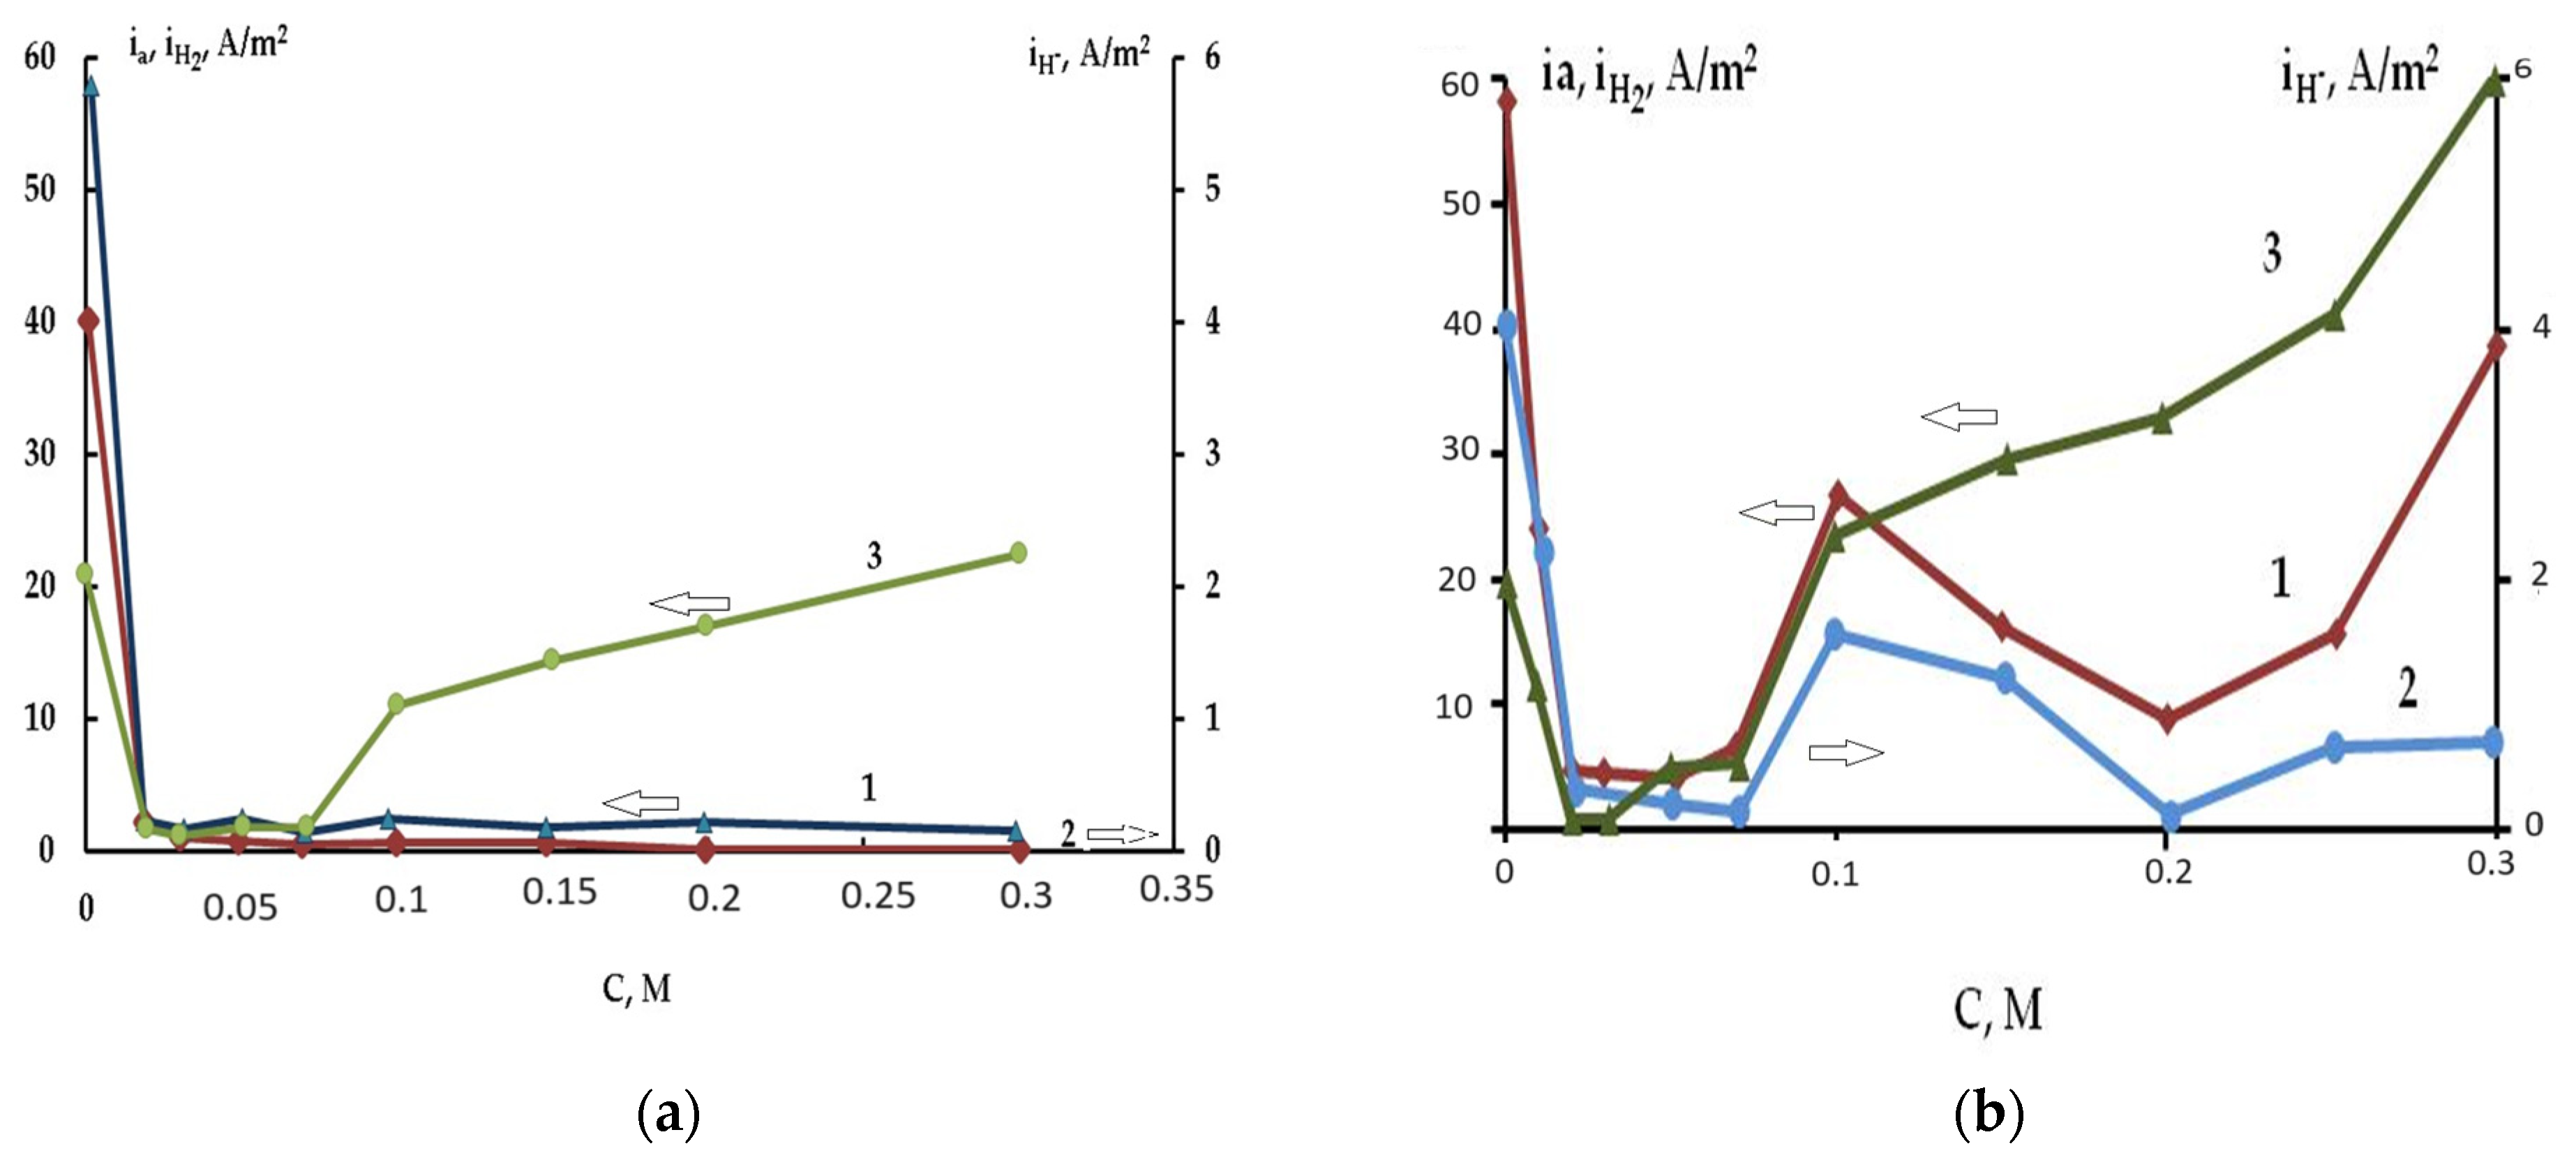
The study of Mg anodic dissolution with sodium glycinate at fixed potential was reported in [51]. Anode passivation occurred at 0.02 M Gl (Figure 12), inhibiting pitting and hydride formation. Increased ligand concentration accelerated anodic dissolution without hydride formation and significant HE [51]. Anodic dissolution efficiency R rose from 0.25 to 0.92. Some minor HE was observed due to the negative electrode potential permitting water reduction. The passive film separates Mg bulk from the electrolyte, changing the dissolution mode from NDE to PDE, as noted in [51].
Tartrate and nitrilotriacetate ions can also passivate the Mg anode [51]. However, the passivity of the surface is not stable, and pitting formation is accompanied by hydride formation. The excess of ligand creates the soluble complex of magnesium that dissolves the passive oxide–hydroxide film and significantly increases the anodic current (Equations (14)–(17)).
Mg(OH)2 + L→[Mg L] + 2OH
Mg(OH)2 = Mg2+ + 2OH
[Mg2+]S [OH]S2 = 5.5 * 10−12
Ia = 2F DMg2+ Sp/(δ[OH]s2) = 2F DMg2+ [Mg2+]s/δ,
where F—Faraday constant, DMg2+—the diffusivity of the magnesium ions, Sp—the solubility product of Mg(OH)2, δ—the thickness of diffusion electrolyte layer, and [OH]s or [Mg2+]s—surface concentration of hydroxide or magnesium ions. The inhibiting effect is determined by the stability constants pK1 and pK2 of the corresponding Mg compounds. Those are increased in the following order: acetate (0.8) > tartrate (1.36) > hydroxide (2.58) > oxalate (3.43 and 4.38) > glycine (3.44 and 6.46). The efficiency of anodic dissolution R (Equation (9)) at the fixed potential increased from 0.28 to 0.92 for glycine or oxalate.
These findings align with studies [53,54,55] investigating Mg corrosion inhibition by carboxylate ions. FTIR and EIS techniques demonstrated increased carboxylate and heterocyclic anion absorption ability on the MgO-Mg(OH)2 oxide film. It was pointed out that the formation of magnesium carbonate can improve the stability of the surface film and inhibit corrosion AZ31 in NaCl aqueous electrolyte [55]. Thus, modifying the oxide films is an important factor in inhibiting the free corrosion of Mg, proceeding at the low anodic current. Similarly, oxalate and glycine form sparingly soluble MgL and MgL+ species modifying the oxide–hydroxide film that can enhance ligand inhibition power. However, at the anodic polarization, in case of high local fluxes of Mg2+, the ligands forming stable soluble complexes such as nitrilotriacetates, ethylene diamine tetra-acetate, and tartrate also passivate the anode [51]. These chelating ligands dissolve the passive oxide film, increasing the anodic dissolution current. As the study [51] indicates, chelating ligands replace Mg’s anodic reaction with water or chloride, inhibiting electrolyte acidification (Equation (10)). This enhances the passivation, inhibits the hydrogen absorption, and provides anodic dissolution across the passive film.

4. Influence of Buffering the Acidity of Aqueous Electrolyte on Hydrogen Absorption and Mg Self-Corrosion

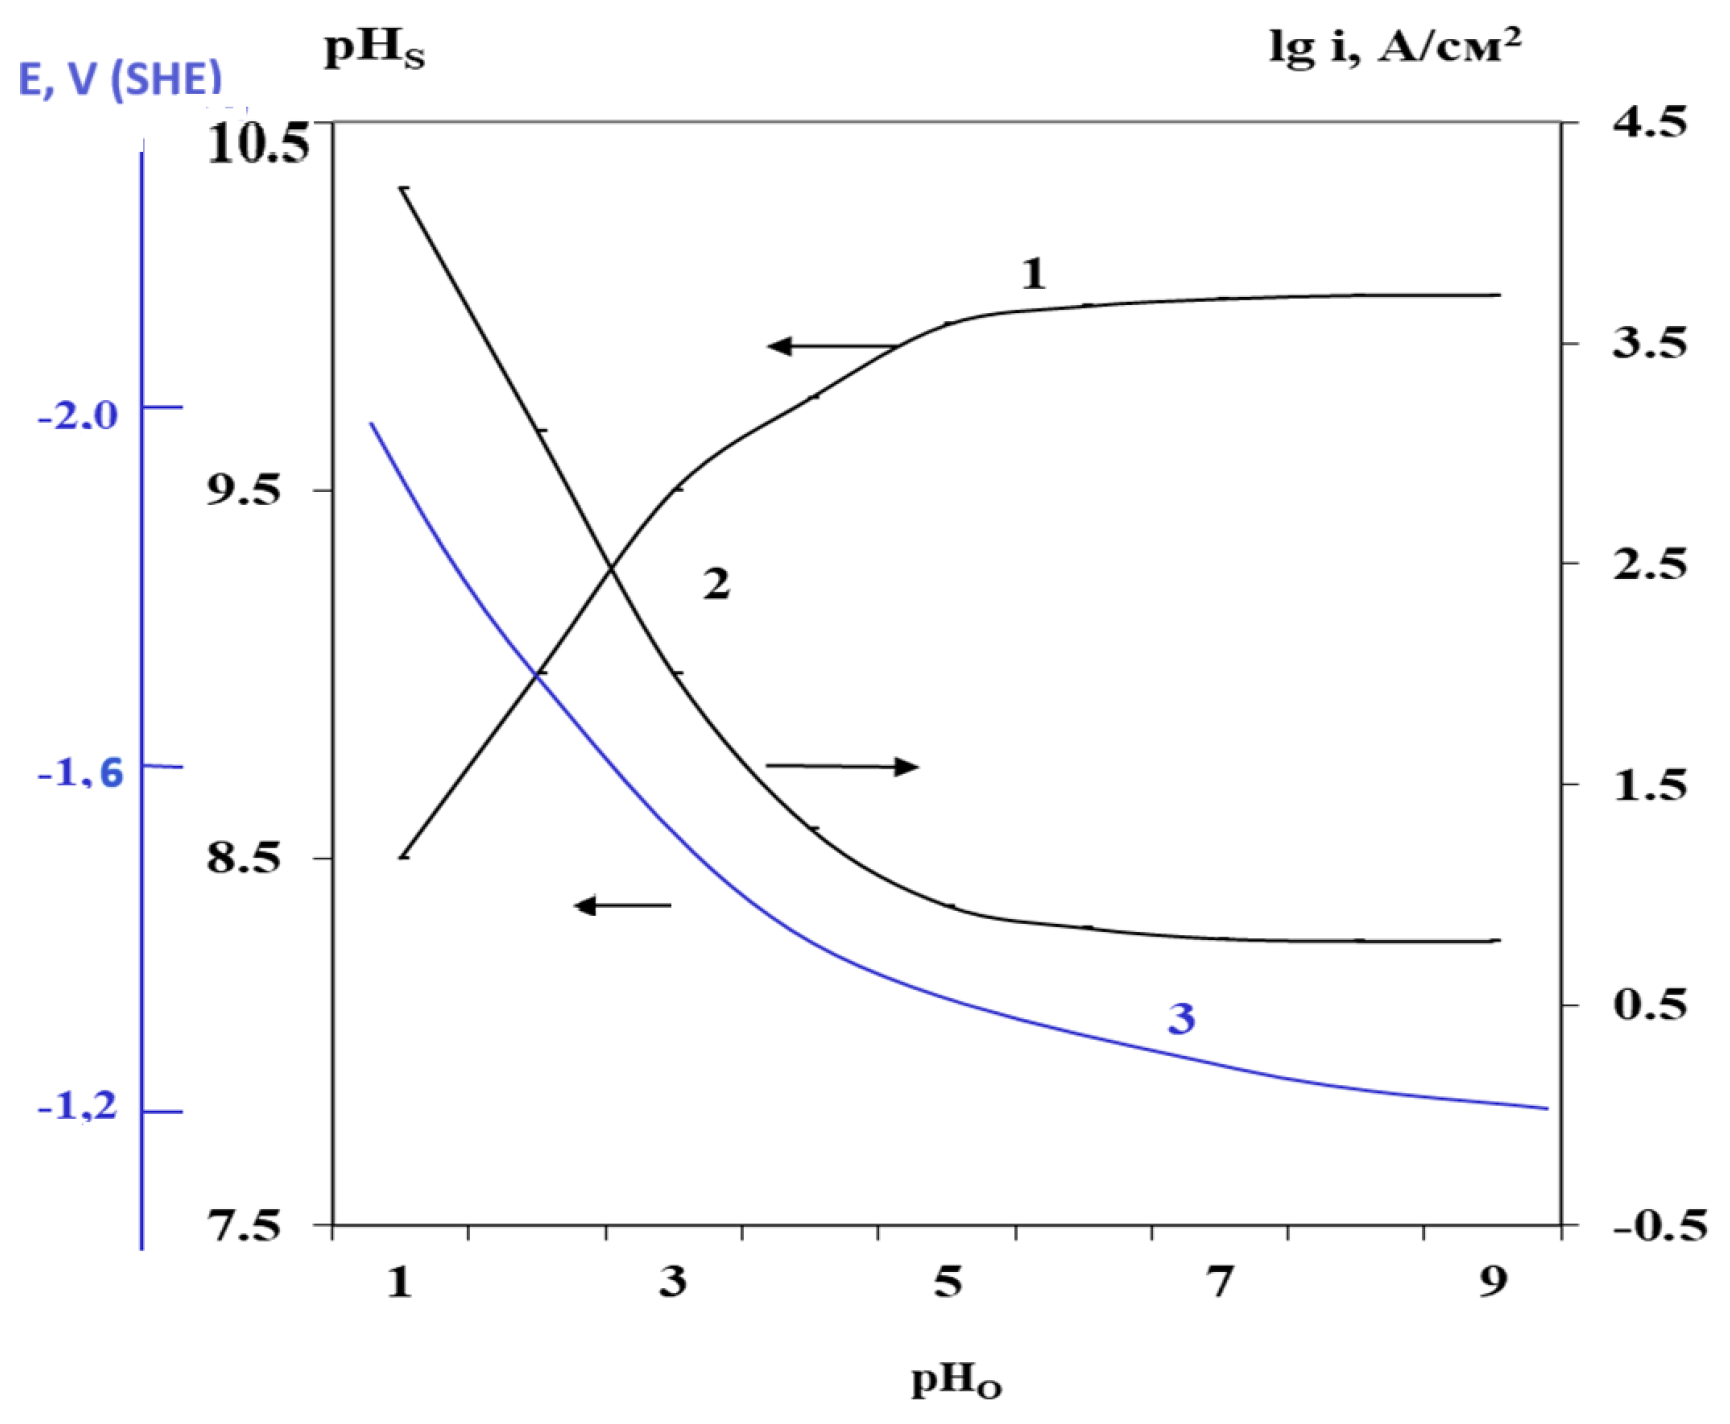
The results discussed above showed that the kind of anodic dissolution, and the rates of both hydrogen absorption and HE are determined by the conditions of the oxide film. A similar point was formulated in the recent studies [28,29,30,31,35,48,56]. The primary corrosion product of Mg is hydroxide, which buffers the aqueous electrolyte near pH 10.2–10.4. The buffering of low electrolyte pH leads to acidic corrosion. The corrosion rate is a function of the stirring and the viscosity of the electrolyte [57,58]. Thus, it was concluded in [59] that Mg dissolution is diffusion-controlled and proceeds through the step of formation–dissolution of an oxide–hydroxide layer (Equations (15)–(17)). The diffusion of hydronium ions to the electrode dissolves the film and negatively shifts the electrode potential, accelerating the cathodic water reduction and Mg corrosion [59,60]. The rate of anodic dissolution (a) depends on the rate of diffusion of Mg2+ ions from the Mg surface to the electrolyte bulk (Equation (17)) [59]. As was shown above, complex-formed species also bind Mg2+ ions, dissolving oxide film and accelerating anodic dissolution. Figure 13 shows the calculated near electrode pHs as a function of volume pHo using Equations (15)–(17). Thus, even in an acidic electrolyte with pH 3, the pH close to the Mg surface is 9.5. At these conditions, water is the main oxidizer for Mg corrosion. At pH lower than three, the direct reduction of hydronium ions and its effect on corrosion becomes more important.
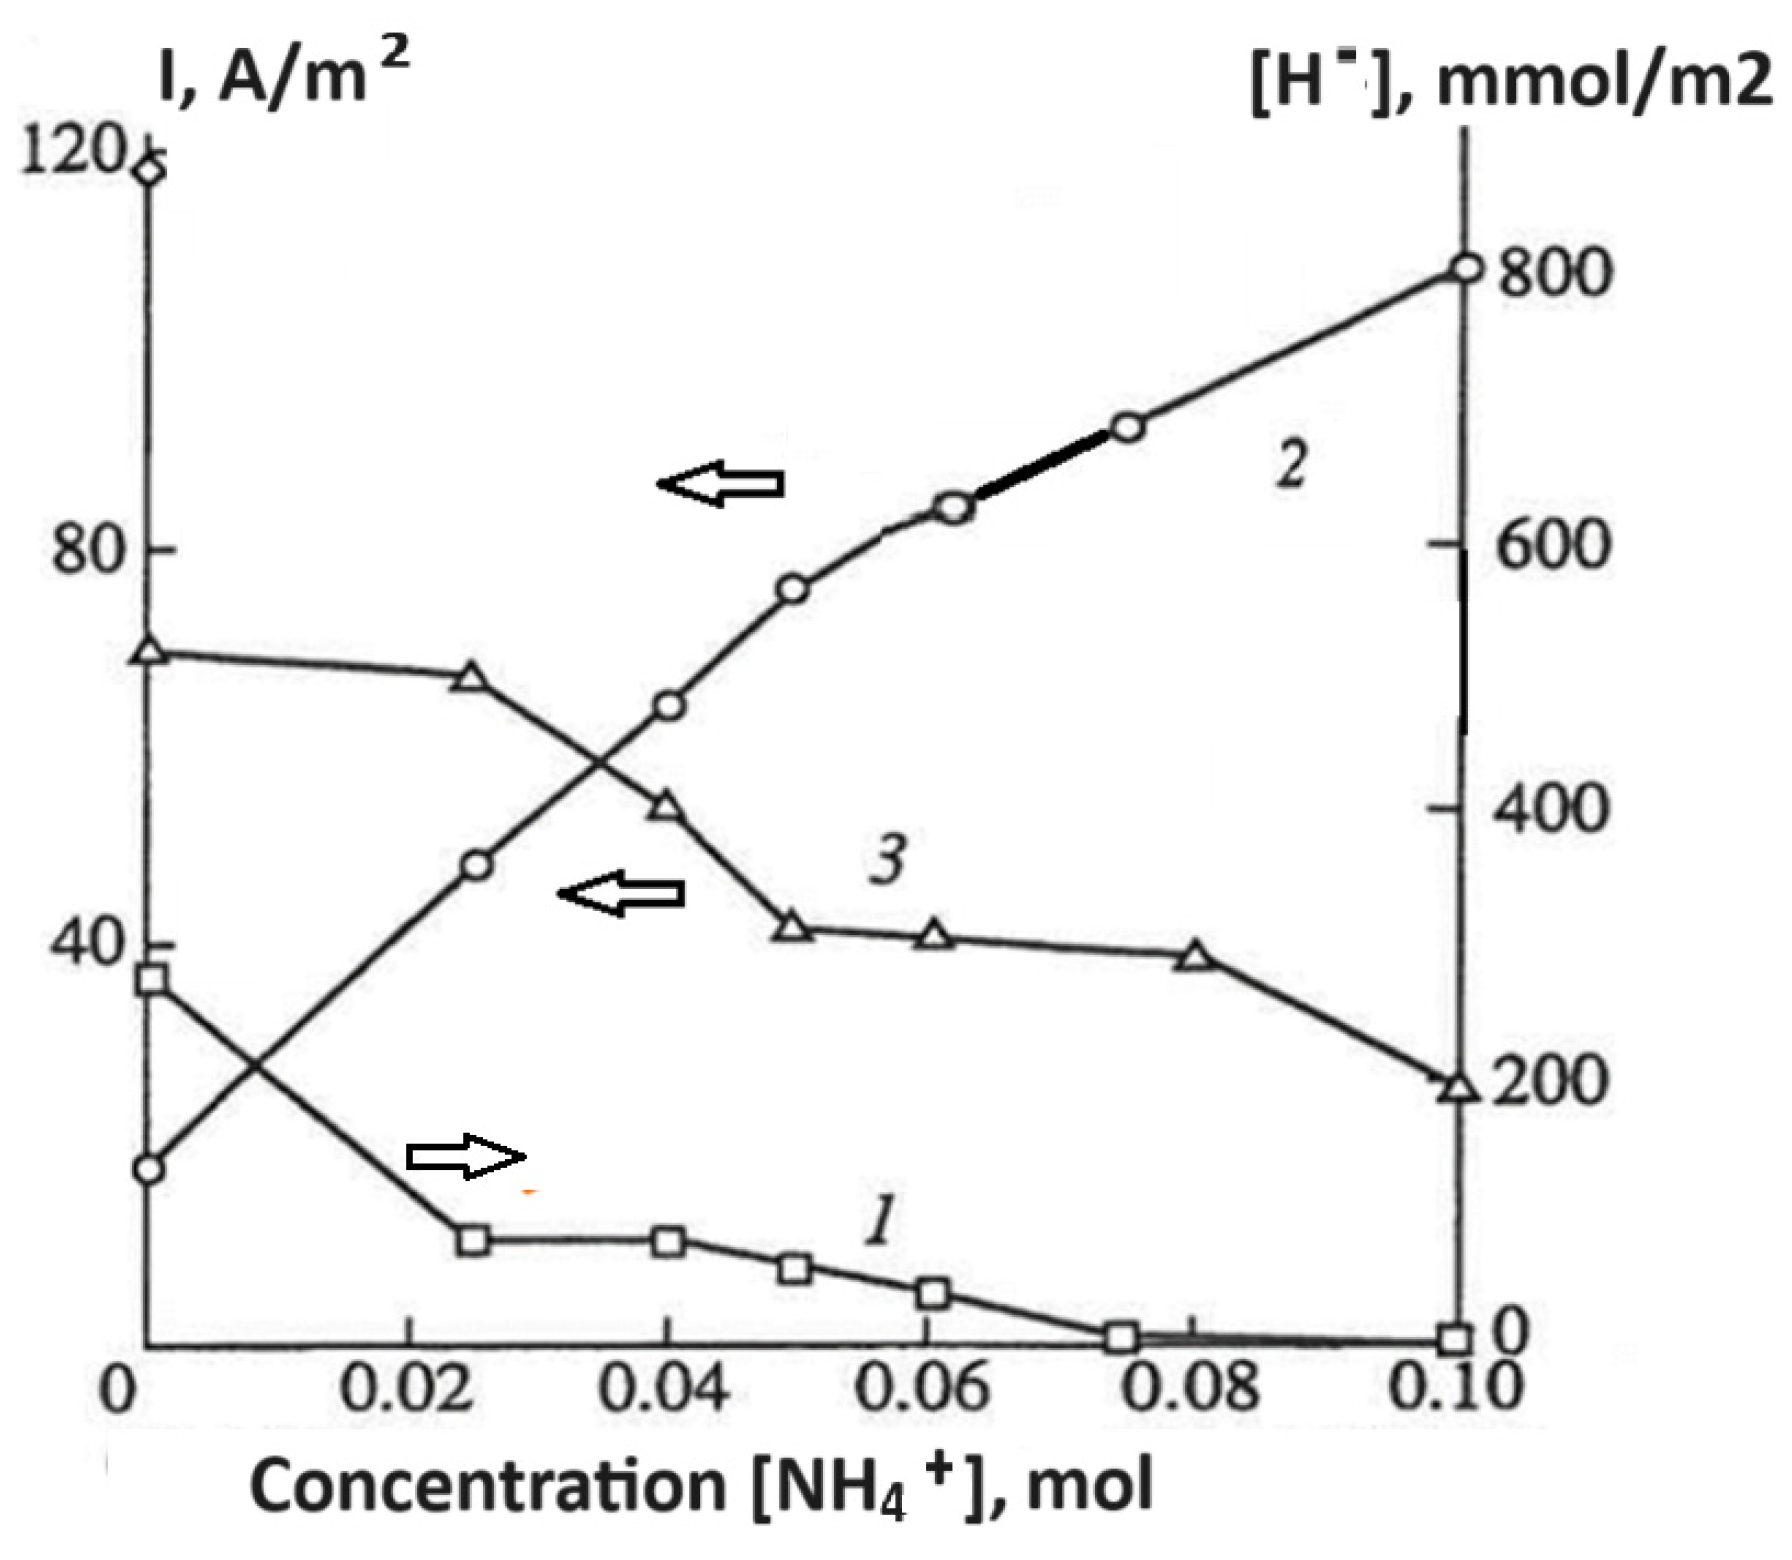
The impact of buffering low pH on the self-corrosion and hydrogen absorption of the Mg anode in the presence of chloride ions was studied in [60]. The anodic dissolution was carried out at the fixed potential at 0.1 M [Cl], with the cation type varying from Na+ to NH4+. Mg(OH)2 maintains a pH of close to 10.2 in NaCl, whereas for 0.1 M NH4Cl electrolyte, the bulk pH is 5.5 and pHs can be close to 8.7 (NH4+, pKa = 9.25). The influence of buffering on the anodic and HE current density, and hydride ion surface concentration are shown in Figure 14. Buffering at lower pH increases the current of anodic dissolution by a factor of five, decreases the current of self-dissolution nearly 1.7 times, and inhibits the formation of the surface hydride phase. Dissolution changed from localized to uniform through the passive oxide film. The ratio (R) of the efficiency of the anodic dissolution increased from 0.25 to 0.58. Thus, at the fixed potential, the local kind of anodic dissolution changed to a more uniform one that decreases the self-corrosion rate.
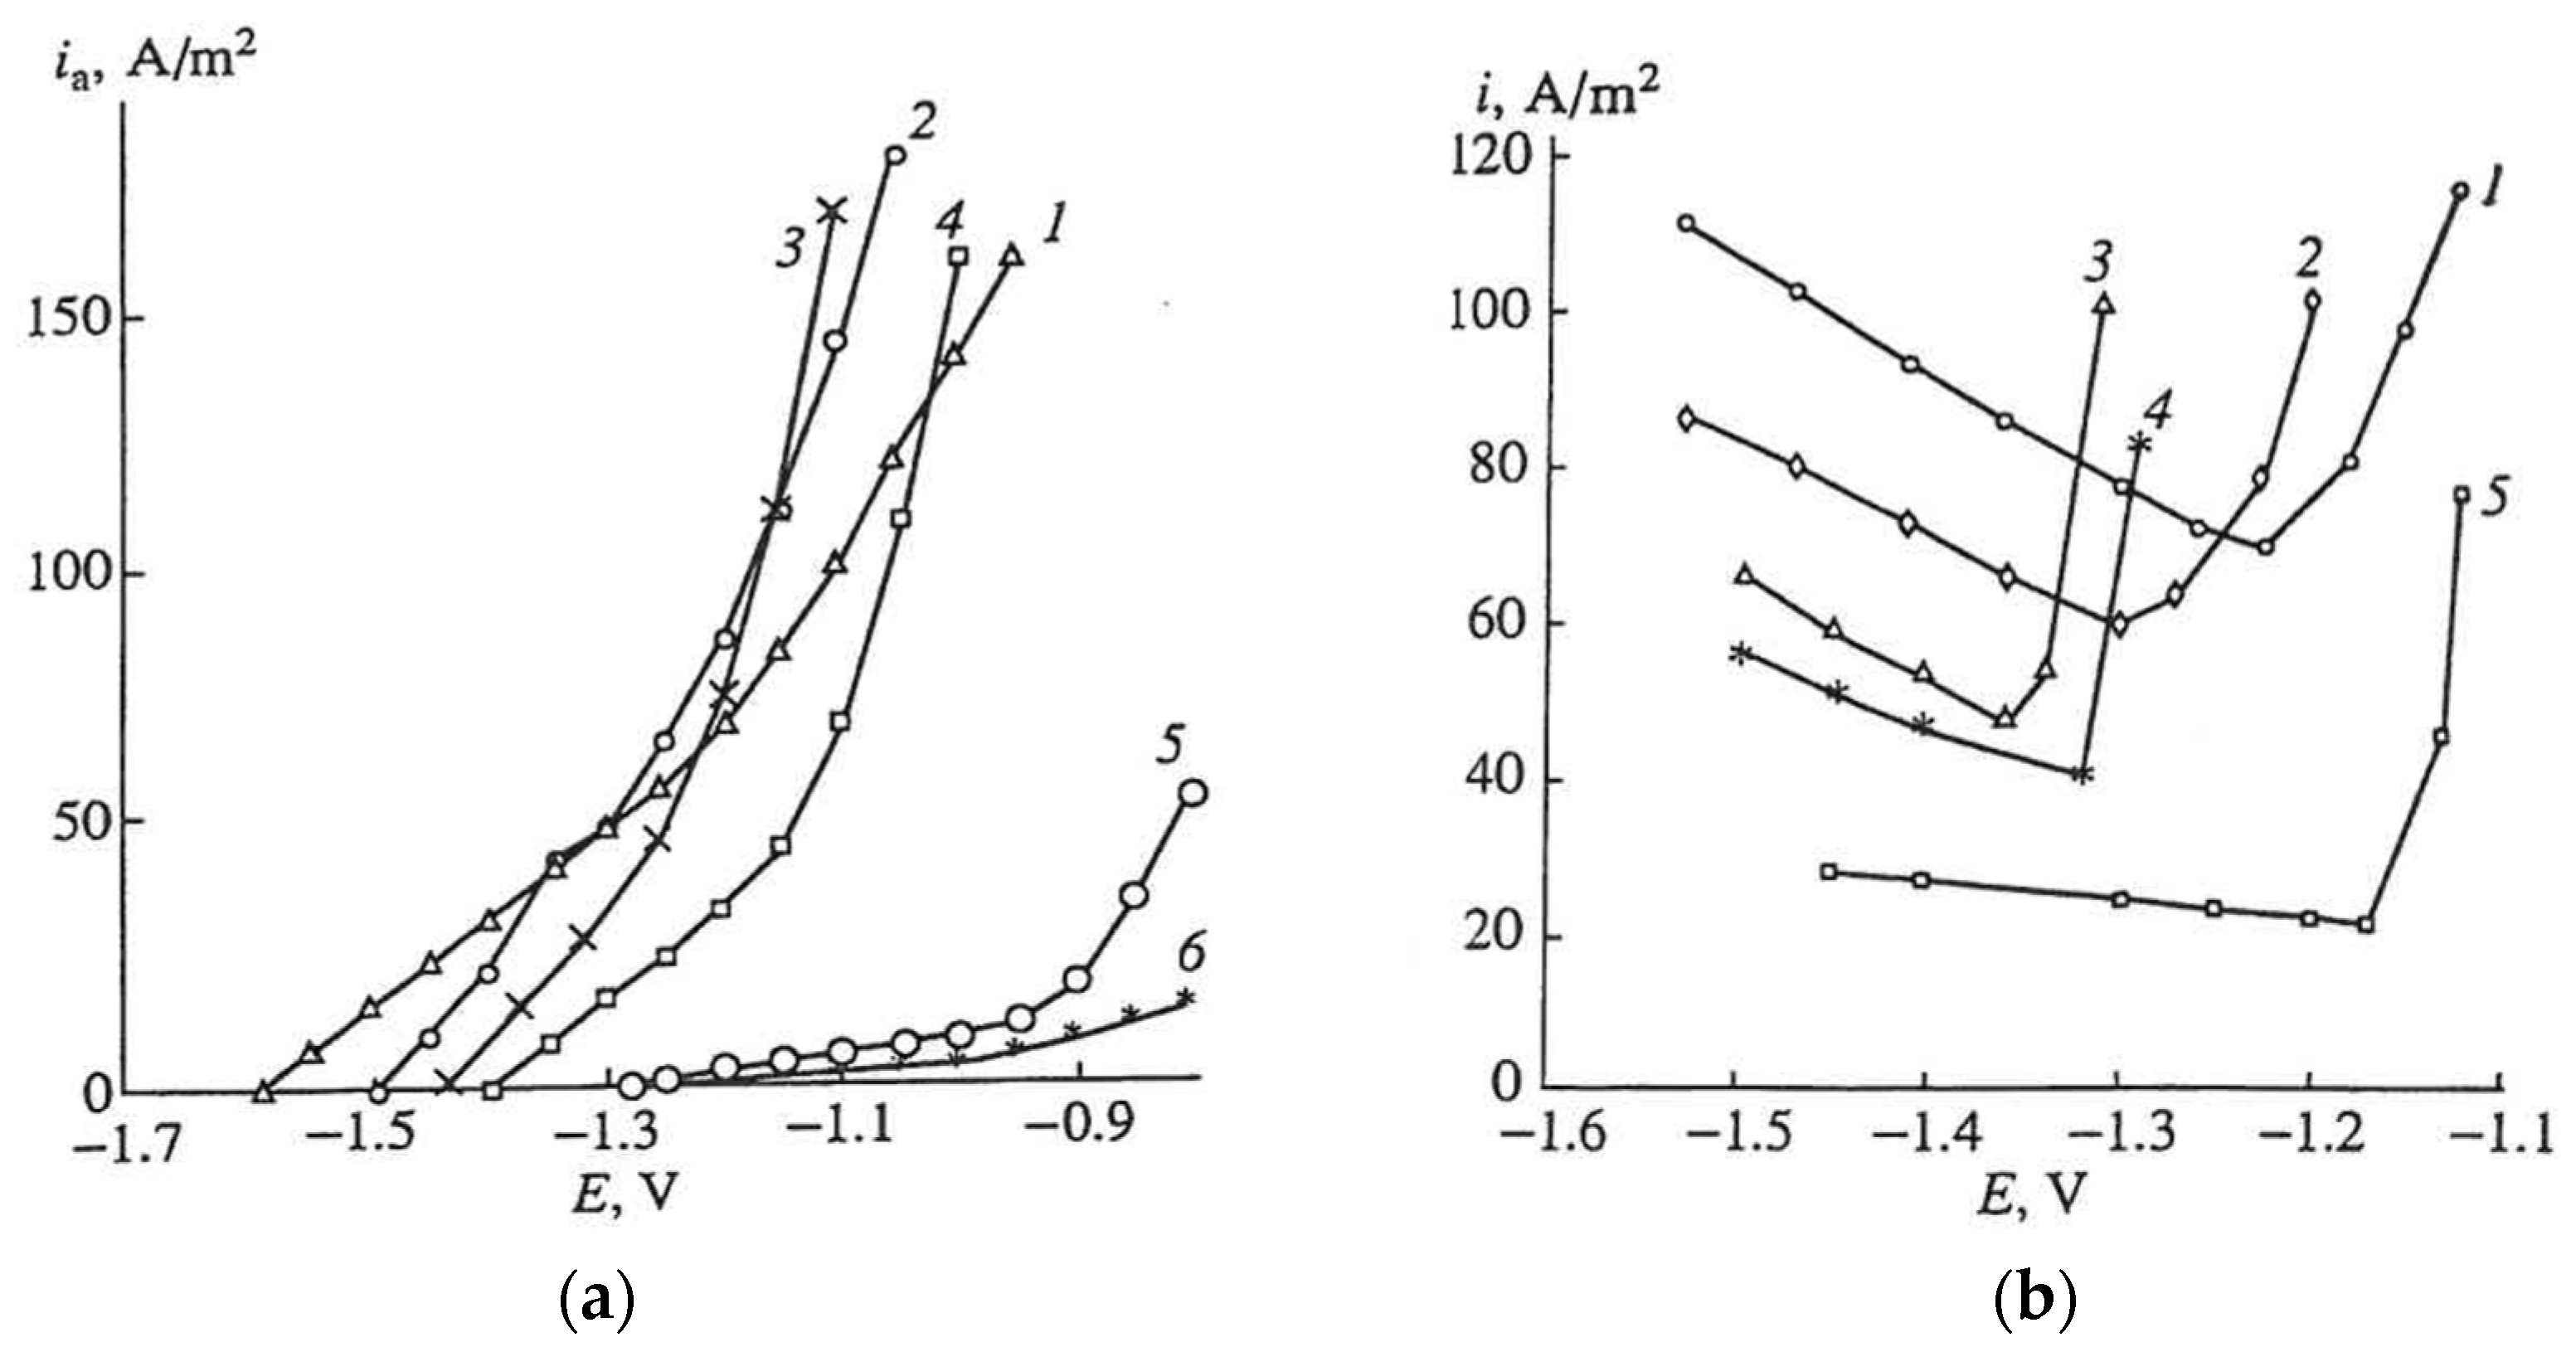
This dissolution can be evaluated from the anodic polarization and self-corrosion curves (Figure 15). Acidic electrolytes shift the anodic polarization curves to less noble potentials due to the dissolution of the surface oxide film (Equations (15)–(17)). The curves consist of two parts with different slopes. At more negative potentials the anodic dissolution proceeds through the passive film. At higher currents, due to the breakdown of the surface oxide, the anode dissolves from the active locations. The self-corrosion rate measured by HE volumetry also shows two parts with different slopes. At more negative potentials, the rates decreased with an increase in potential that corresponded to uniform dissolution in PDE conditions. At the pitting formation potential, the slope changes and the rate of hydrogen release increases with the potential corresponding to NDE conditions.
Thus, these data show that NDE can change to PDE depending on the acidity of the electrolyte and the potential of the electrode. These parameters are linked to the stability of the oxide–hydroxide film. These points are in line with the studies of James W.J. et al. [16] and more recent works [28,29,30,31,35,48]. The measurements of HE over a range of solutions (buffered and unbuffered) with varying pH of 3 to 10.5 showed that, for low anodic currents in neutral buffers, no anomalous HE was found. However, for unbuffered solutions (0.1 M sodium chloride) with high pH and high anodic currents, anomalous HE was detected [29,30,35]. It was proposed in [60] that the transition from PDE to NDE depends on the permeability of the ions or their vacancies across the Mg/MgO-Mg(OH)2 film. In the case of relatively high overvoltage and thick films, the cations of Mg2+ cannot be removed easily across the oxide film, and the chloride ions would migrate to the Mg/MgO interface to compensate for the positive charge of the magnesium ions. The oxide breaks down and the active surface interacts with water, forming the hydride phase. Thus, for anodic dissolution from the passive state, with low self-corrosion and hydrogen absorption rates, the passive film has to be relatively conductive for Mg2+ ions. These data align with the recent study [61] that determined hydride formation in ammonium-containing electrolytes.

5. Summary and Conclusions

In summary, it is possible to point out that two kinds of anodic dissolution and HE on the Mg anode (PDE and NDE), depending on the electrolyte solution’s nature, can be distinguished. PDE concerns the case of Mg dissolution from the passive state. Mg2+ transfers across the oxide–hydroxide film by diffusion/migration of ions or their vacancies without passivity breakdown by the chloride ions. In this case, water reduction takes place on the surface of the oxide film and magnesium ions are hydrolyzed mainly in electrolyte bulk. In this case, no adherent layer of corrosion products was observed on the surface, and no delayed surface reduction activity was detected. The self-corrosion rate is determined by the rate of HER on the oxide surface, which decreases with an anodic shift in the potential. Normally, it can be observed in acidic electrolytes, where ionic conductivity in the oxide–hydroxide film enables the removal of anodically produced Mg2+. In this case, a thin oxide–hydroxide film protects the metal from direct interaction with water and hydrogen absorption.
At high anodic current densities and increased pH of the electrolyte, in the presence of halide ions, the oxide film cannot provide good conductivity of ions from the metal surface to the electrolyte. To neutralize Mg2+ ions, the chloride ions migrate to the Mg/MgO interface and break the oxide film. In this case, the PDE transforms to NDE, and the active metal surface interacts with water creating dark grey-colored corrosion products mainly containing MgO/Mg(OH)2 species and an intermediate hydride phase. These areas are normally linked with anomalous HE. The increase in anodic current density increases the active surface area and, correspondingly, the efficiency of formation and oxidation of the intermediate hydride phase.
At the strong cathodic polarization, in alkali or carbonate-containing aqueous electrolytes, Mg forms a thin uniform film containing MgH2. It must be pointed out that the composition, stoichiometry, stability, and structure of the hydride phases and surface films formed at anodic or cathodic polarization of Mg in an aqueous electrolyte solution were not determined in detail.
The hydride phase was found in the active locations as a result of Mg anodic dissolution at NDE conditions. The corrosion products demonstrated delayed reduction activity. This phase pinned the open circuit potential of the Mg/MgH2 electrode in an aqueous electrolyte near −1.4 V (SHE). The amount of hydride on the anode surface can be simply measured either by anodic oxidation or by hydrolyzing in acidic CrO3-AgNO3 electrolytes. In these electrolytes, Mg preserves the passivity, and the hydride ions oxidize with HE. The electrochemical hydrogen extraction in 1 M NaOH at −1.2 V vs. SHE can be a simple method of hydride ion quantification by measuring the amount of passed electricity. Hydrogen, dissolved in the bulk of alloy can diffuse to the surface and contribute to the measured value.
Under NDE and dissolution in galvanostatic conditions, the rates of HE and hydride formation are in a steady state condition that is controlled by the potential of the anode. At a fixed potential, the amount of hydride ions increases with the time of anodic treatment because the hydride formation rate is higher than the oxidation rate. An anodic shift in the potential decreased the concentration of hydride ions at the surface due to their oxidation. Chloride is the most effective activator of passivity, in the order of Br, I, SO42−, and CH3COO ions, and shows increased HE and hydride formation currents. Strong intercorrelation between the HE and hydride formation rates shows that hydride is an intermediate species of the self-corrosion process.
Taylor [62] proposed a first-principles surface reaction kinetic model for H2 evolution on Mg, in an attempt to simulate the electrochemical response of a Mg surface under both cathodic and anodic polarization. The proposed mechanism of HE involves the dissociation of H2O to produce adsorbed radicals, atomic H. and OH., followed by the recombination of H. atoms to produce H2 and oxidation of OH. to produce hydroxide ions.
2Mg + H2O→MgOH.ads + MgH.ads
2MgH.ads→Mg + H2
MgOH.ads + e→Mg + OH
However, at the active locations, instead of the hydrogen recombination (Equation (19)), Mg can chemically interact with atomic hydrogen with the formation of salt-like magnesium hydride (Equation (21)). It is a thermodynamically advantageous reaction and proceeds with the release of the heat.
2MgH.ads→Mg + MgH2
Using SVET showed that the anomalous HE on pure Mg is primarily associated with the anodic dissolution regions [22]. Although local cathodes in the dark corrosion film were revealed, they appeared to play a minor role in the process [22]. Thus, detected low cathodic efficiency can be the result of the chemical interaction of the active surface with water. However, the real ratio between currents of recombination (Equation (19)) and hydride formation (Equation (21)) is not known at present.
The oxide–hydroxide film can protect Mg from anomalous self-corrosion and hydrogen absorption. Buffering of a lower pH changes the local kind of dissolution to a general one, facilitating the dissolution in PDE conditions. The ligands forming stable complexes with Mg2+ inhibit the interaction of the surface with chloride ions and water, leading to Mg passivation. Oxalate and glycine ions passivate the anode and are effective inhibitors of self-corrosion and hydride formation. The formation of soluble complex compounds increases the current of Mg2+ across the oxide film without passivity activation by Cl. These findings can be used to increase the efficiency of Mg anodes in the systems of sacrificial protection or electric power sources.
The results concerning the inhibition of free corrosion of Mg alloys using carboxylates, phosphates, oxalate, glycine, and carbonate were reviewed. Different studies demonstrated stabilization of the MgO-Mg(OH)2 oxide film due to the adsorption and formation of sparingly soluble compounds additionally passivating the surface [51,53,54,55]. Thus, modification of the oxide film is important for the inhibition of free corrosion of Mg.
The dissolution in NDE conditions leads to hydrogen absorption and hydride formation. Pitting and localized corrosion are required to cause hydrogen embrittlement in subsequent slow strain rate tests [12,44,63,64,65,66,67]. Hydrogen absorption dramatically degrades the mechanical properties, indicating that hydrogen embrittlement is the reason for stress corrosion cracking in aqueous solutions. The expansion stress can be caused by hydride formation and the local hydrogen pressure due to its accumulation in metal bulk, resulting in the brittle fracture of Mg alloys. These combined effects promote both corrosion and crack initiation and propagation even without an external load [44]. Thus, the inhibition of passivity breakdown (e.g., modification of the surface oxide–hydroxide film) enables conditions for anodic dissolution in conditions of PDE and will inhibit the hydrogen uptake and embrittlement of Mg alloys.

Author Contributions

Conceptualization, A.N. and A.M. Methodology A.N. and T.Y.; writing—original draft preparation, A.N.; writing—review and editing, A.N. and A.M. All authors have read and agreed to the published version of the manuscript.

Funding

This research received no external funding.

Conflicts of Interest

The authors declare no conflicts of interest.

References

  1. Prasada Satya, S.V.; Prasada, S.B.; Verma, K.; Mishrac, R.K.; Kumar, V.; Singha, S. The role and significance of Magnesium in modern day research—A review. J. Magnes. Alloys 2022, 10, 1–61. [Google Scholar] [CrossRef]
  2. Joost, W.J.; Krajewski, P.E. Towards magnesium alloys for high volume automotive applications. Scr. Mater. 2017, 128, 107–112. [Google Scholar] [CrossRef]
  3. Trang, T.T.T.; Zhang, J.H.; Kim, J.H.; Zargaran, A.; Hwang, J.H.; Suh, B.C.; Kim, N.J. Designing a magnesium alloy with high strength and high formability. Nat. Commun. 2018, 9, 2522–2527. [Google Scholar] [CrossRef] [PubMed]
  4. Kirkland, N.T.; Birbilis, N.; Walker, J.; Woodfield, T.; Dias, G.J.; Staiger, M.P. In-vitro dissolution of magnesium-calcium binary alloys: Clarifying the unique role of calcium additions in bioresorbable magnesium implant alloys. J. Biomed. Mater. Res. Part B 2010, 95B, 91–100. [Google Scholar] [CrossRef]
  5. Zheng, Y.F.; Gu, X.N.; Witte, F. Biodegradable metals. Mater. Sci. Eng. R 2014, 77, 1–34. [Google Scholar] [CrossRef]
  6. Gu, X.; Zheng, Y.; Cheng, Y.; Zhong, S.; Xi, T. In vitro corrosion and biocompatibility of binary magnesium alloys. Biomaterials 2009, 30, 484–498. [Google Scholar] [CrossRef]
  7. Zhang, T.; Tao, Z.; Chen, J. Magnesium-air batteries: From principles to applications. Mater. Horiz. 2014, 1, 196–206. [Google Scholar] [CrossRef]
  8. Peng, B.; Chen, J. Functional materials with high-efficiency energy storage and conversion for batteries and fuel cells. Coord. Chem. Rev. 2009, 253, 2805–2813. [Google Scholar] [CrossRef]
  9. Chen, J.; Cheng, F. Combination of lightweight elements and nanostructured materials for batteries. Acc. Chem. Res. 2009, 42, 713–723. [Google Scholar] [CrossRef]
  10. Esmaily, M.; Svensson, J.E.; Fajardo, S.; Birbilis, N.; Frankel, G.S.; Virtanen, S.; Arrabal, R.; Thomas, S.; Johansson, L.G. Fundamentals and advances in magnesium alloy corrosion. Prog. Mater. Sci. 2017, 89, 92–193. [Google Scholar] [CrossRef]
  11. Huanga, J.; Songa, G.-L.; Atrens, A.; Dargusch, M. What activates the Mg surface—A comparison of Mg dissolution mechanisms. J. Mater. Sci. Technol. 2020, 57, 204–220. [Google Scholar] [CrossRef]
  12. Kappes, M.; Iannuzzi, M.; Carranza, R.M. Hydrogen embrittlement of magnesium and magnesium alloys: A Review. J. Electrochem. Soc. 2013, 160, C168–C178. [Google Scholar] [CrossRef]
  13. Atrens, A.; Chen, X.; Shi, Z. Review Mg corrosion—Recent progress. MDPI Corros. Mater. Degrad. 2022, 3, 566–597. [Google Scholar] [CrossRef]
  14. Tomashov, N.D.; Komisarova, V.S.; Timonova, M.A. Investigation of electrochemical corrosion of magnesium. In Trudy of Institute Physical Chemistry AN SSSR; Publication of Academy of Sciences: Moscow, Russia, 1955; Volume 5, pp. 172–197. [Google Scholar]
  15. Straumanis, M.E.; Bhatia, B.K. Disintegration of magnesium while dissolving anodically in neutral and acidic solutions. J. Electrochem. Soc. 1963, 110, 357–360. [Google Scholar] [CrossRef]
  16. James, W.J.; Straumanis, M.E.; Bhatia, D.K.; Johnson, J.W. The difference effect on magnesium dissolving in acids. J. Electrochem. Soc. 1962, 110, 1117–1121. [Google Scholar] [CrossRef]
  17. Petty, R.L.; Davidson, A.W.; Kleinberg, J. The anodic oxidation of magnesium metal: Evidence for the existence of unipositive Mg. J. Am. Chem. Soc. 1954, 76, 363–366. [Google Scholar] [CrossRef]
  18. Shi, Z.; Cao, F.; Song, G.-L.; Atrens, A. Low apparent valence of Mg during corrosion. Corros. Sci. 2014, 88, 434–443. [Google Scholar] [CrossRef]
  19. Atrens, A.; Song, G.-L.; Liu, M.; Shi, Z.; Cao, F.; Dargusch, M.S. Review of recent developments in the field of magnesium corrosion. Adv. Eng. Mater. 2015, 17, 400–453. [Google Scholar] [CrossRef]
  20. Samaniego, A.; Hurley, B.L.; Frankel, G.S. On the evidence for univalent Mg. J. Electroanal. Chem. 2015, 737, 123–128. [Google Scholar] [CrossRef]
  21. Birbilis, N.; King, A.D.; Thomas, S.; Frankel, G.S.; Scully, J.R. Evidence for enhanced catalytic activity of magnesium arising from anodic dissolution. Electrochim. Acta 2014, 132, 277–283. [Google Scholar] [CrossRef]
  22. Williams, G.; Birbilis, N.; McMurray, H.N. The source of hydrogen evolved from a magnesium anode. Electrochem. Com. 2013, 36, 2–5. [Google Scholar] [CrossRef]
  23. Taheri, M.; Kish, J.R.; Birbilis, N.; Danaie, M.; McNally, E.A.; McDermid, J.R. Towards a physical description for the origin of enhanced catalytic activity of corroding magnesium surfaces. Electrochim. Acta 2014, 116, 396–403. [Google Scholar] [CrossRef]
  24. Frankel, G.S.; Samaniego, A.; Birbilis, N. Evolution of hydrogen at dissolving magnesium surfaces. Corr. Sci. 2013, 70, 104–111. [Google Scholar] [CrossRef]
  25. Thomas, S.; Gharbi, O.; Salleha, S.H.; Volovitch, P.; Ogle, K.; Birbilis, N. On the effect of Fe concentration on Mg dissolution and activation studied using atomic emission spectroelectrochemistry and scanning electrochemical microscopy. Electrochim. Acta 2016, 210, 271–284. [Google Scholar] [CrossRef]
  26. Curioni, M. The behaviour of magnesium during free corrosion and potentiodynamic polarisation investigated by real-time hydrogen measurement and optical imaging. Electrochim. Acta. 2014, 120, 284–292. [Google Scholar] [CrossRef]
  27. Cain, T.; Madden, S.B.; Birbilis, N.; Scully, J.R. Evidence of the enrichment of transition metal elements on corroding magnesium surfaces using Rutherford backscattering spectrometry. J. Electrochem. Soc. 2015, 162, C228–C237. [Google Scholar] [CrossRef]
  28. Bender, S.; Goellner, J.; Heyn, A.; Schmigalla, S. A new theory for the negative difference effect in magnesium corrosion. Mater. Corros. 2013, 63, 707–712. [Google Scholar] [CrossRef]
  29. Rossrucker, L.; Samaniego, A.; Grote, J.-P.; Mingers, A.M.; Laska, C.A.; Birbilis, N. The pH dependence of magnesium dissolution and hydrogen evolution during anodic polarization. J. Electrochem. Soc. 2015, 162, C333–C339. [Google Scholar] [CrossRef]
  30. Rossrucker, L.; Mayrhofer, K.J.; Frankel, G.S.; Birbilis, N. Investigating the real-time dissolution of magnesium using online analysis by ICP-MS. J. Electrochem. Soc. 2014, 161, C115–C119. [Google Scholar] [CrossRef]
  31. Lebouil, S.; Gharbi, O.; Volovitch, P.; Ogle, K. Mg dissolution in phosphate and chloride electrolytes: Insight into the mechanism of the negative difference effect. Corrosion 2015, 71, 234–241. [Google Scholar] [CrossRef]
  32. Swiatowska, J.; Volovitch, P.; Ogle, K. The anodic dissolution of Mg in NaCl and Na2SO4 electrolytes by atomic emission spectroelectrochemistry. Corros. Sci. 2010, 52, 2372–2378. [Google Scholar] [CrossRef]
  33. Salleh, S.H.; Thomas, S.; Yuwono, J.A.; Venkatesan, K.; Birbilis, N. Enhanced hydrogen evolution on Mg(OH)2 covered Mg surfaces. Electrochim. Acta 2015, 161, 144–152. [Google Scholar] [CrossRef]
  34. Lysne, D.; Thomas, S.; Hurley, M.F.; Birbilis, N. On the Fe enrichment during anodic polarization of magnesium and its impact on hydrogen evolution. J. Electrochem. Soc. 2015, 162, C396. [Google Scholar] [CrossRef]
  35. Fajardo, S.; Glover, C.F.; Williams, G.; Frankel, G.S. The evolution of anodic hydrogen on high-purity magnesium in acidic buffer solution. Corrosion 2017, 73, 482–493. [Google Scholar] [CrossRef]
  36. Lynch, S.P.; Trevena, P. Stress Corrosion Cracking and Liquid Metal Embrittlement in Pure Magnesium. Corrosion 1988, 44, 113–120. [Google Scholar] [CrossRef]
  37. Kamilyan, M.; Silverstein, R.; Eliezer, D. Hydrogen trapping and hydrogen embrittlement of Mg alloys. J. Mater. Sci. 2017, 52, 11091–11100. [Google Scholar] [CrossRef]
  38. Perrault, G. Magnesium. In Encyclopedia of Electrochemistry of the Elements; Bard, A.J., Ed.; Marcel Dekker: New York, NY, USA, 1978; pp. 263–319. [Google Scholar]
  39. Perrault, G. The potential–pH diagram of the magnesium–water system. J. Electroan. Chem. 1974, 51, 107–119. [Google Scholar] [CrossRef]
  40. Nazarov, A.; Lisovskii, A.; Mikhailovskii, Y.N. Formation of MgH2 on electrochemical dissolution of magnesium in aqueous-electrolytes. Prot. Met. 1989, 25, 606–610. [Google Scholar]
  41. Nazarov, A.; Yurasova, T. Influence of the Electrolyte Nature on Mg Hydrogenation and Corrosion. In Proceedings of the Eurocorr’91, Budapest, Hungary, 21–25 October 1991; Karl, I., Bod, M., Eds.; European Federation of Corrosion: Bruxelles, Belgium, 1991; Volume 1, pp. 124–129. [Google Scholar]
  42. Gulbrandsen, E. Anodic behavior of Mg in HCO3/CO2−3 buffer solutions. Quasi-steady measurements. Electrochim. Acta 1992, 37, 1403–1412. [Google Scholar] [CrossRef]
  43. Nazarov, A.; Yurasova, T.; Gubin, V.V.; Buriak, A.K.; Glazunov, M.P. On hydrogenation of magnesium at the free corrosion and anodic corrosion in chloride electrolyte. Prot. Met. 1993, 29, 392–397. [Google Scholar]
  44. Chen, J.; Wang, E.; Han, J.; Dong, W.K.; Shoesmith, D.W. Effect of Hydrogen on Corrosion and Stress Corrosion Cracking of AZ91 Alloy in Aqueous Solutions. J. Acta Metallurg. Sin. (Engl. Lett.) 2016, 29, 1–7. [Google Scholar] [CrossRef]
  45. Seyeux, A.; Liu, M.; Schmutz, P.; Song, G.; Atrens, A.; Marcus, P. ToF-SIMS depth profile of the surface film on pure magnesium formed by immersion in pure water and the identification of magnesium hydride. Corros. Sci. 2009, 51, 1883–1886. [Google Scholar] [CrossRef]
  46. Unocic, K.A.; Elsentriecy, H.H.; Brady, M.P.; Meyer, H.M.; Song, G.; Fayek, M.; Meisner, R.A.; Davis, B. Transmission Electron Microscopy Study of Aqueous Film Formation and Evolution on Magnesium Alloys. J. Electrochem. Soc. 2014, 161, C30–C38. [Google Scholar] [CrossRef]
  47. Binns, W.J.; Zargarzadah, F.; Dehnavi, V.; Chen, J.; Noël, J.J.; Shoesmith, D.W. Physical and Electrochemical Evidence for the Role of a Mg Hydride Species in Mg Alloy Corrosion. Corrosion 2018, 75, 58–68. [Google Scholar] [CrossRef]
  48. Cain, T.W.; Gonzalez-Afanador, I.; Birbilis, N.; Scully, J.R. The Role of Surface Films and Dissolution Products on the Negative Difference Effect for Magnesium: Comparison of Cl versus Cl Free Solutions. J. Electrochem. Soc. 2017, 164, C300–C311. [Google Scholar] [CrossRef]
  49. Nazarov, A.P.; Mikhailovski, Y.N. Influence of complex formation on the self-dissolution of Mg-anode. Prot. Met. 1990, 26, 13–18. [Google Scholar]
  50. Nazarov, A.P.; Yurasova, T.A. Anodic dissolution and self-dissolution of magnesium in the presence de-passivating ions. Prot. Met. 1993, 29, 381–391. [Google Scholar]
  51. Nazarov, A.P.; Yurasova, T.A. Hydrogen release, hydride formation and self-dissolution of magnesium in presence of complex formed reagents. Prot. Met. 1995, 31, 139–144. [Google Scholar]
  52. Xu, S.; Dong, X.; Ke, W. Effect of Magnesium Hydride on the Corrosion Behavior of Pure Magnesium in 0.1MNaCl Solution, Hindawi. Int. J. Corros. 2010, 2010, 934867. [Google Scholar] [CrossRef]
  53. Yasakau, K.A.; Maltseva, A.; Lamaka, S.V.; Mei, D.; Orvi, H.; Volovitch, P.; Ferreira, M.G.S.; Zheludkevich, M.I. The effect of carboxylate compounds on Volta potential and corrosion inhibition of Mg containing different levels of iron. Corros. Sci. 2022, 194, 109937. [Google Scholar] [CrossRef]
  54. Fockaert, L.I.; Würger, T.; Unbehau, R.; Boelen, B.; Meißner, R.H.; Lamaka, S.V.; Zheludkevich, M.L.; Terryn, H.; Mol, J.M.C. ATR-FTIR in Kretschmann configuration integrated with electrochemical cell as in situ interfacial sensitive tool to study corrosion inhibitors for magnesium substrates. Electrochim. Acta 2020, 345, 136166. [Google Scholar] [CrossRef]
  55. Prince, L.; Rousseau, M.-A.; Noirfalise, X.; Dangreau, L.; Coelho, L.B.; Olivier, M.-G. Inhibitive effect of sodium carbonate on corrosion of AZ31 magnesium alloy in NaCl solution. Corros. Sci. 2021, 179, 109131. [Google Scholar] [CrossRef]
  56. Atrens, A.D.; Gentle, I.; Atrens, A. Possible dissolution pathways participating in the Mg corrosion reaction. Corros. Sci. 2015, 92, 173–181. [Google Scholar] [CrossRef]
  57. Roald, R.; Beck, W. The Dissolution of Magnesium in Hydrochloric Acid. J. Electrochem. Soc. 1951, 98, 277–298. [Google Scholar] [CrossRef]
  58. Maiangoris, J. Corrosion and Mass Transfer with Chemical Reaction the Dissolution of Mg in HCl. Corrosion 1968, 24, 255–259. [Google Scholar]
  59. Simaranov, A.I.; Sokolova, T.I.; Marshakov, A.I.; Mikhailovskii, Y.N. Corrosion and electrochemistry of magnesium in acidic media contained the oxidizers. Prot. Met. 1991, 27, 403–409. [Google Scholar]
  60. Nazarov, A.P.; Yurasova, T.A. Anodic dissolution of Magnesium under positive and negative difference effect. Prot. Met. 1996, 32, 33–37. [Google Scholar]
  61. Buggio, D.; Trueba, M.; Trasatti, S.P. Corrosion of Mg Alloy in the Presence of Ammonium Ion. Evidence of Hydride Sub-Products. Corros. Sci. 2016, 104, 173–186. [Google Scholar] [CrossRef]
  62. Taylor, C.D. A first-principles surface reaction kinetic model for hydrogen evolution under cathodic and anodic conditions on magnesium. J. Electrochem. Soc. 2016, 163, C602–C608. [Google Scholar] [CrossRef]
  63. Xia, X.; Nie, J.F.; Davies, C.H.J.; Tang, W.N.; Xu, S.W.; Birbilis, N. The Influence of Low Levels of Zinc, Calcium, Gadolinium, Strontium, and Zirconium on the Corrosion of Magnesium for Wrought Applications. Corrosion 2015, 71, 1370–1386. [Google Scholar] [CrossRef]
  64. Lynch, S.P. Chapter 2—Hydrogen Embrittlement (HE) Phenomena and Mechanisms. In Stress Corrosion Cracking: Theory and Practice; Raja, V.S., Shoji, T., Eds.; Woodhead Publishing: Oxford, UK, 2011; pp. 90–130. [Google Scholar]
  65. Stampella, R.P.; Procter, M.; Ashworth, V. Environmentally-induced cracking of magnesium. Corros. Sci. 1984, 24, 325–341. [Google Scholar] [CrossRef]
  66. Bobby Kannan, M.; Dietzel, W. Pitting-induced hydrogen embrittlement of magnesium–aluminum alloy. Mater. Des. 2012, 42, 321–326. [Google Scholar] [CrossRef]
  67. Song, R.G.; Blawert, C.; Dietzel, W.; Atrens, A. A study of stress corrosion cracking and hydrogen embrittlement of AZ31 magnesium alloy. Mater. Sci. Eng. A 2005, 399, 308–317. [Google Scholar] [CrossRef]
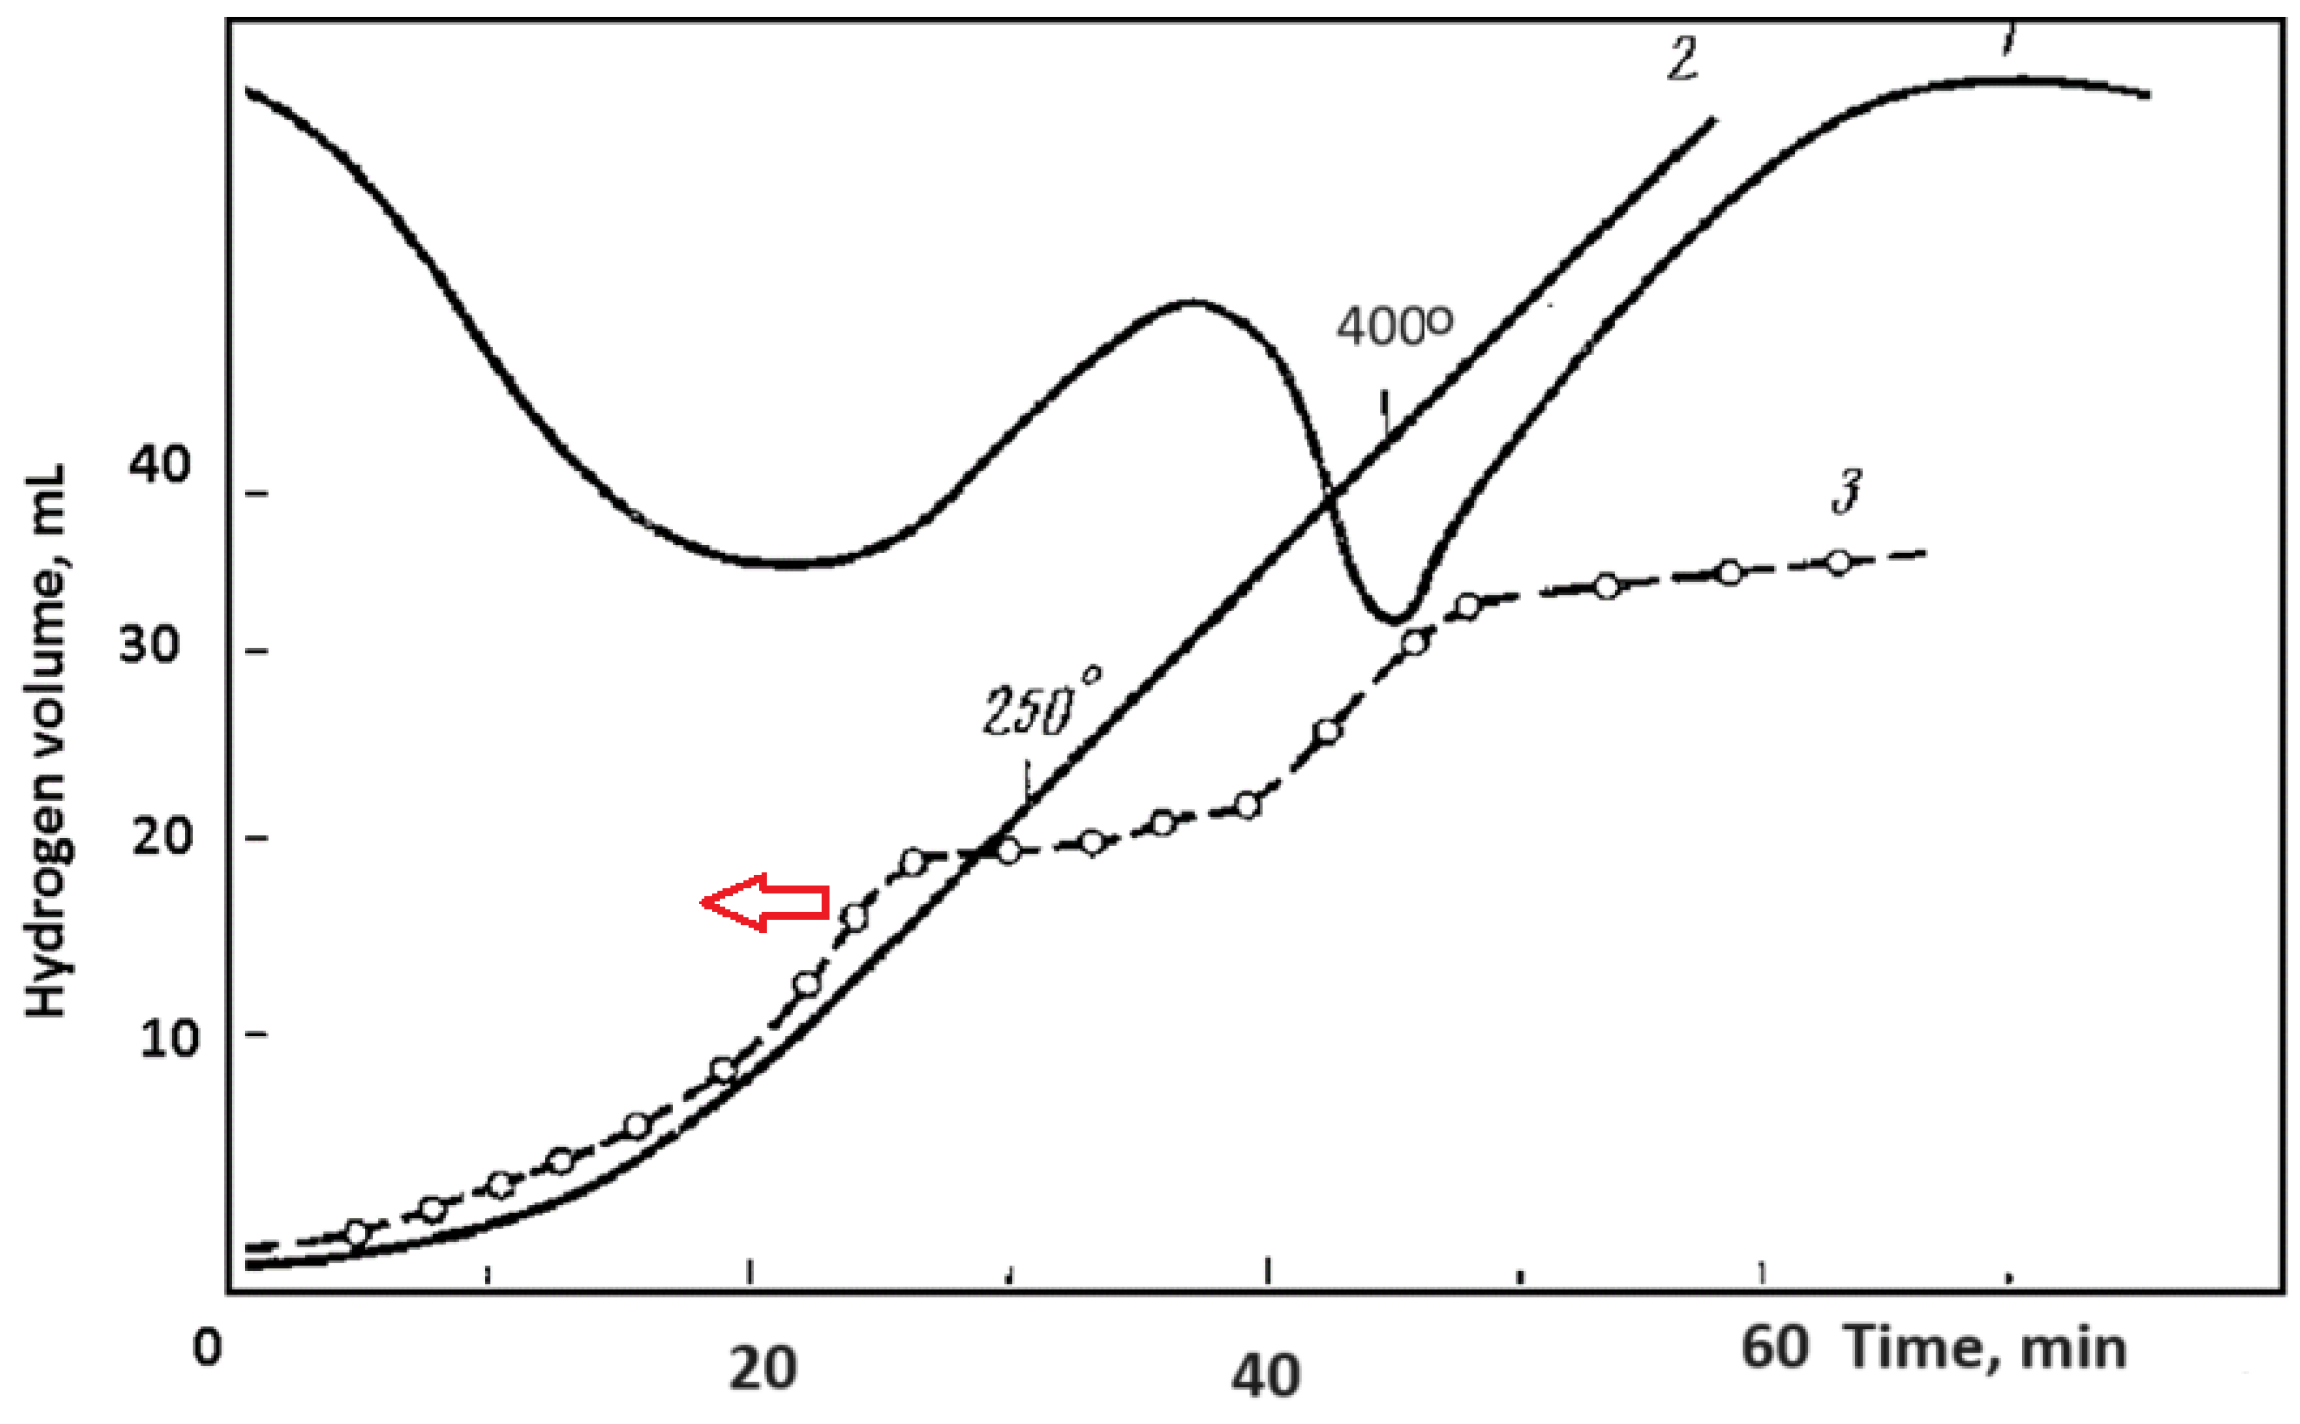
Figure 1. Differential thermogram of corrosion product collected from the dark-grey areas of Mg anode (1), monitoring of temperature (2) and volume of HE (3). The released hydrogen was identified separately by gas chromatography [40]. The copyright permission of Pleiades Publishing.
Cmd 05 00015 g001
Figure 2. (a) The setup of the electrochemical cell for HE rate measurement, RE-Ag/AgCl reference electrode, CE–Pt counter electrodes, RE-working Mg (99.92%) electrode. (b) monitoring of the volume of released gaseous hydrogen (1), the volume of hydrogen stored in the surface hydride phase (2) at galvanostatic anodic polarization by 8.2 A/m2 in 0.1 M NaCl aqueous electrolyte. (c) influence of the anodic current density on the volume of hydride hydrogen, after 3.5 h of anodic polarization (8.2 A/m2) in 0.1 M NaCl aqueous electrolyte. The volume of hydrogen stored in the surface product was determined by treatment of the Mg electrode in chromic acid–silver nitrate solution [40]. The copyright permission of Pleiades Publishing.
Cmd 05 00015 g002
Figure 3. (a) Anodic polarization curves of Mg in 1 M NaOH aqueous electrolyte (potential sweep rate 1 mV/sec). The electrode was preliminary polarized in 0.1 M NaCl at 8 A/m2 during 5 min (1), 2 h (2) and 4 h (3); (b) Anodic oxidation of Mg with the surface phase at −1.2 V (SHE) in 1 M NaOH electrolyte after preliminary free corrosion 24 h in 0.1 M NaCl aqueous electrolyte (1) and anodic polarization (2) of Mg at 8 A/m2 in 0.1 M NaCl, pH 10.2. (c) Thermal ion mass spectra of H2+ ions of the grey corrosion product [43]. The copyright permission of Pleiades Publishing.
Cmd 05 00015 g003
Figure 4. (a) Monitoring of anodic current (1), the current of HE (2), and the surface concentration of hydride ions (3) at the fixed potential −1.25 V (SHE) in 0.1 M NaCl, pH 10.2; (b) Anodic (1), HE (2), and hydride formation (3) current densities vs. the potential of Mg anode. The amount of hydride ions (4) at the anode surface was measured after passing 150 coulombs of anodic electricity [50]. The copyright permission of Pleiades Publishing.
Cmd 05 00015 g004
Figure 5. The current densities of HE (1–3) and hydride formation (1′–3′) vs. density of galvanostatic anodic current at the different concentrations of NaCl 0.01 M (1,1′), 0.1 M (2,2′), and 5 M (3,3′) (pH 10.2) [50]. The copyright permission of Pleiades Publishing.
Cmd 05 00015 g005
Figure 6. (a) The dependence of the self-corrosion (a) and hydride formation (b) current densities vs. density of galvanostatic anodic current in 0.1 M NaCl (1), NaBr (2), KI (3), Na2SO4 (4), NaCH3COO (5) and NaF (6), pH 10.2 [50]. The copyright permission of Pleiades Publishing.
Cmd 05 00015 g006
Figure 7. Influence of additions of KI (M/L) to aqueous electrolyte 0.1 M NaCl, pH 10.2 on the current densities of self-dissolution (1), hydride formation (2), and anodic dissolution (3) at the fixed potential −1.28 V (SHE) [50]. The copyright permission of Pleiades Publishing.
Cmd 05 00015 g007
Figure 8. Effect of addition of acetate sodium to 0.1 M NaCl, pH 10.2, aqueous electrolyte solution on the volume of released gaseous hydrogen at the potentiostatic conditions E = −1.28 V (SHE) vs. the amount of passing anodic electricity. without addition (1), 0.01 M (2), 0.05 M (3), 0.1 M (4), 0.3 M (5) [51]. The copyright permission of Pleiades Publishing.
Cmd 05 00015 g008
Figure 9. Anodic polarization curves of Mg in 0.1 M NaCl aqueous electrolyte with the addition of oxalate Na2C2O4, pH 10.2. 1—0 M/L, 2—0.01 M/L, 3—0.02 M/L, 4—0.1 M/L and 5—0.15 M/L. The arrows mark the potential pitting formation [49]. The copyright permission of Pleiades Publishing.
Cmd 05 00015 g009
Figure 10. (a)—Galvanostatic anodic dissolution at 8.2 A/m2 in 0.1 M NaCl (pH 10.2), electrolyte vs. concentration of potassium oxalate. (a) The experiment duration is 3.5 h, 1,4—self-corrosion current density determined by mass loss and volumetry correspondingly, 2—current density of hydride formation, 3—coefficient R. (b), the experiment duration 20 h, 1—the current density of HE, 2—the current density of the hydride formation, 3—the potential of Mg electrode vs. SHE. Hydride ions concentration was measured by post-anodic polarization of Mg anode in alkali [49,51]. The copyright permission of Pleiades Publishing.
Cmd 05 00015 g010
Figure 11. Influence of the addition of oxalate sodium on the current densities of HE (1), hydride formation (2), and anodic dissolution (3) at the potentiostatic anodic polarization in 0.1 M NaCl, pH 10.2, E = −1.26 V (a) E = −1.2 V (b) vs. SHE [51]. The copyright permission of Pleiades Publishing.
Cmd 05 00015 g011
Figure 12. (a)—Influence of additions of sodium glycinate (a) and sodium tartrate (b) on the current densities of HE (1), hydride formation (2), and anodic dissolution (3) at the potentiostatic anodic polarization in 0.1 M NaCl, pH 10.2, E = −1.26 V (SHE) [51]. The copyright permission of Pleiades Publishing.
Cmd 05 00015 g012
Figure 13. Calculation of near electrode pHs (1), i—the rate of corrosion (2), E (3)—the potential of Mg/Mg(OH)2 electrode as a function of volume pHo [59]. The copyright permission of Pleiades Publishing.
Cmd 05 00015 g013
Figure 14. Influence of the replacement of Na+ to NH4+, [Cl] = 0.1 M, E = −1.26 V vs. SHE. 1—the amount of hydride ion. 2—the anodic current density, 3—HE current density. In each experiment, 150 coulombs of anodic electricity were passed. The amount of the surface hydride in corrosion products on the Mg surface after electrolyzing was detected by anodic oxidation in 1 M NaOH [60]. The copyright permission of Pleiades Publishing.
Cmd 05 00015 g014
Figure 15. (a)—Anodic potentiodinamic (1 mV/s) curves in 0.1 M NH4Cl at pH 5.8 (1), 8.4 (2); 9 (3), 9.5 (4), 10.0 (5), 10.5 (6). (b)—HE current density vs. potential of Mg anode (galvanostatic anodic polarization using step-wise 5–10 mA/cm2) in 0.1 M NH4Cl at pH 5.5 (1) 7.4 (2); 8.7 (3); 9 (4) 9.5 (5). The pH of the electrolytes was adjusted by the addition of NaOH [60]. The copyright permission of Pleiades Publishing.
Cmd 05 00015 g015
Disclaimer/Publisher’s Note: The statements, opinions and data contained in all publications are solely those of the individual author(s) and contributor(s) and not of MDPI and/or the editor(s). MDPI and/or the editor(s) disclaim responsibility for any injury to people or property resulting from any ideas, methods, instructions or products referred to in the content.