5.1. The Anatomy of a BWR
Boiling Water Reactors were developed in the USA primarily by the General Electric Co. from the naval reactor program in the 1950s/60s. Currently, there are 31 BWRs and 63 PWRs operating in the USA for a total of 94 nuclear power plants in the country although this number is reducing as plants are retired from service and few new plants are being built. The reactor is a direct steam cycle system that does not involve heat exchange between a primary circuit and a secondary circuit, as in the case of a PWR (see below). In essence, it is a conventional thermal (fossil fueled) power plant with a ‘different heat source” (a nuclear core vs. a furnace).
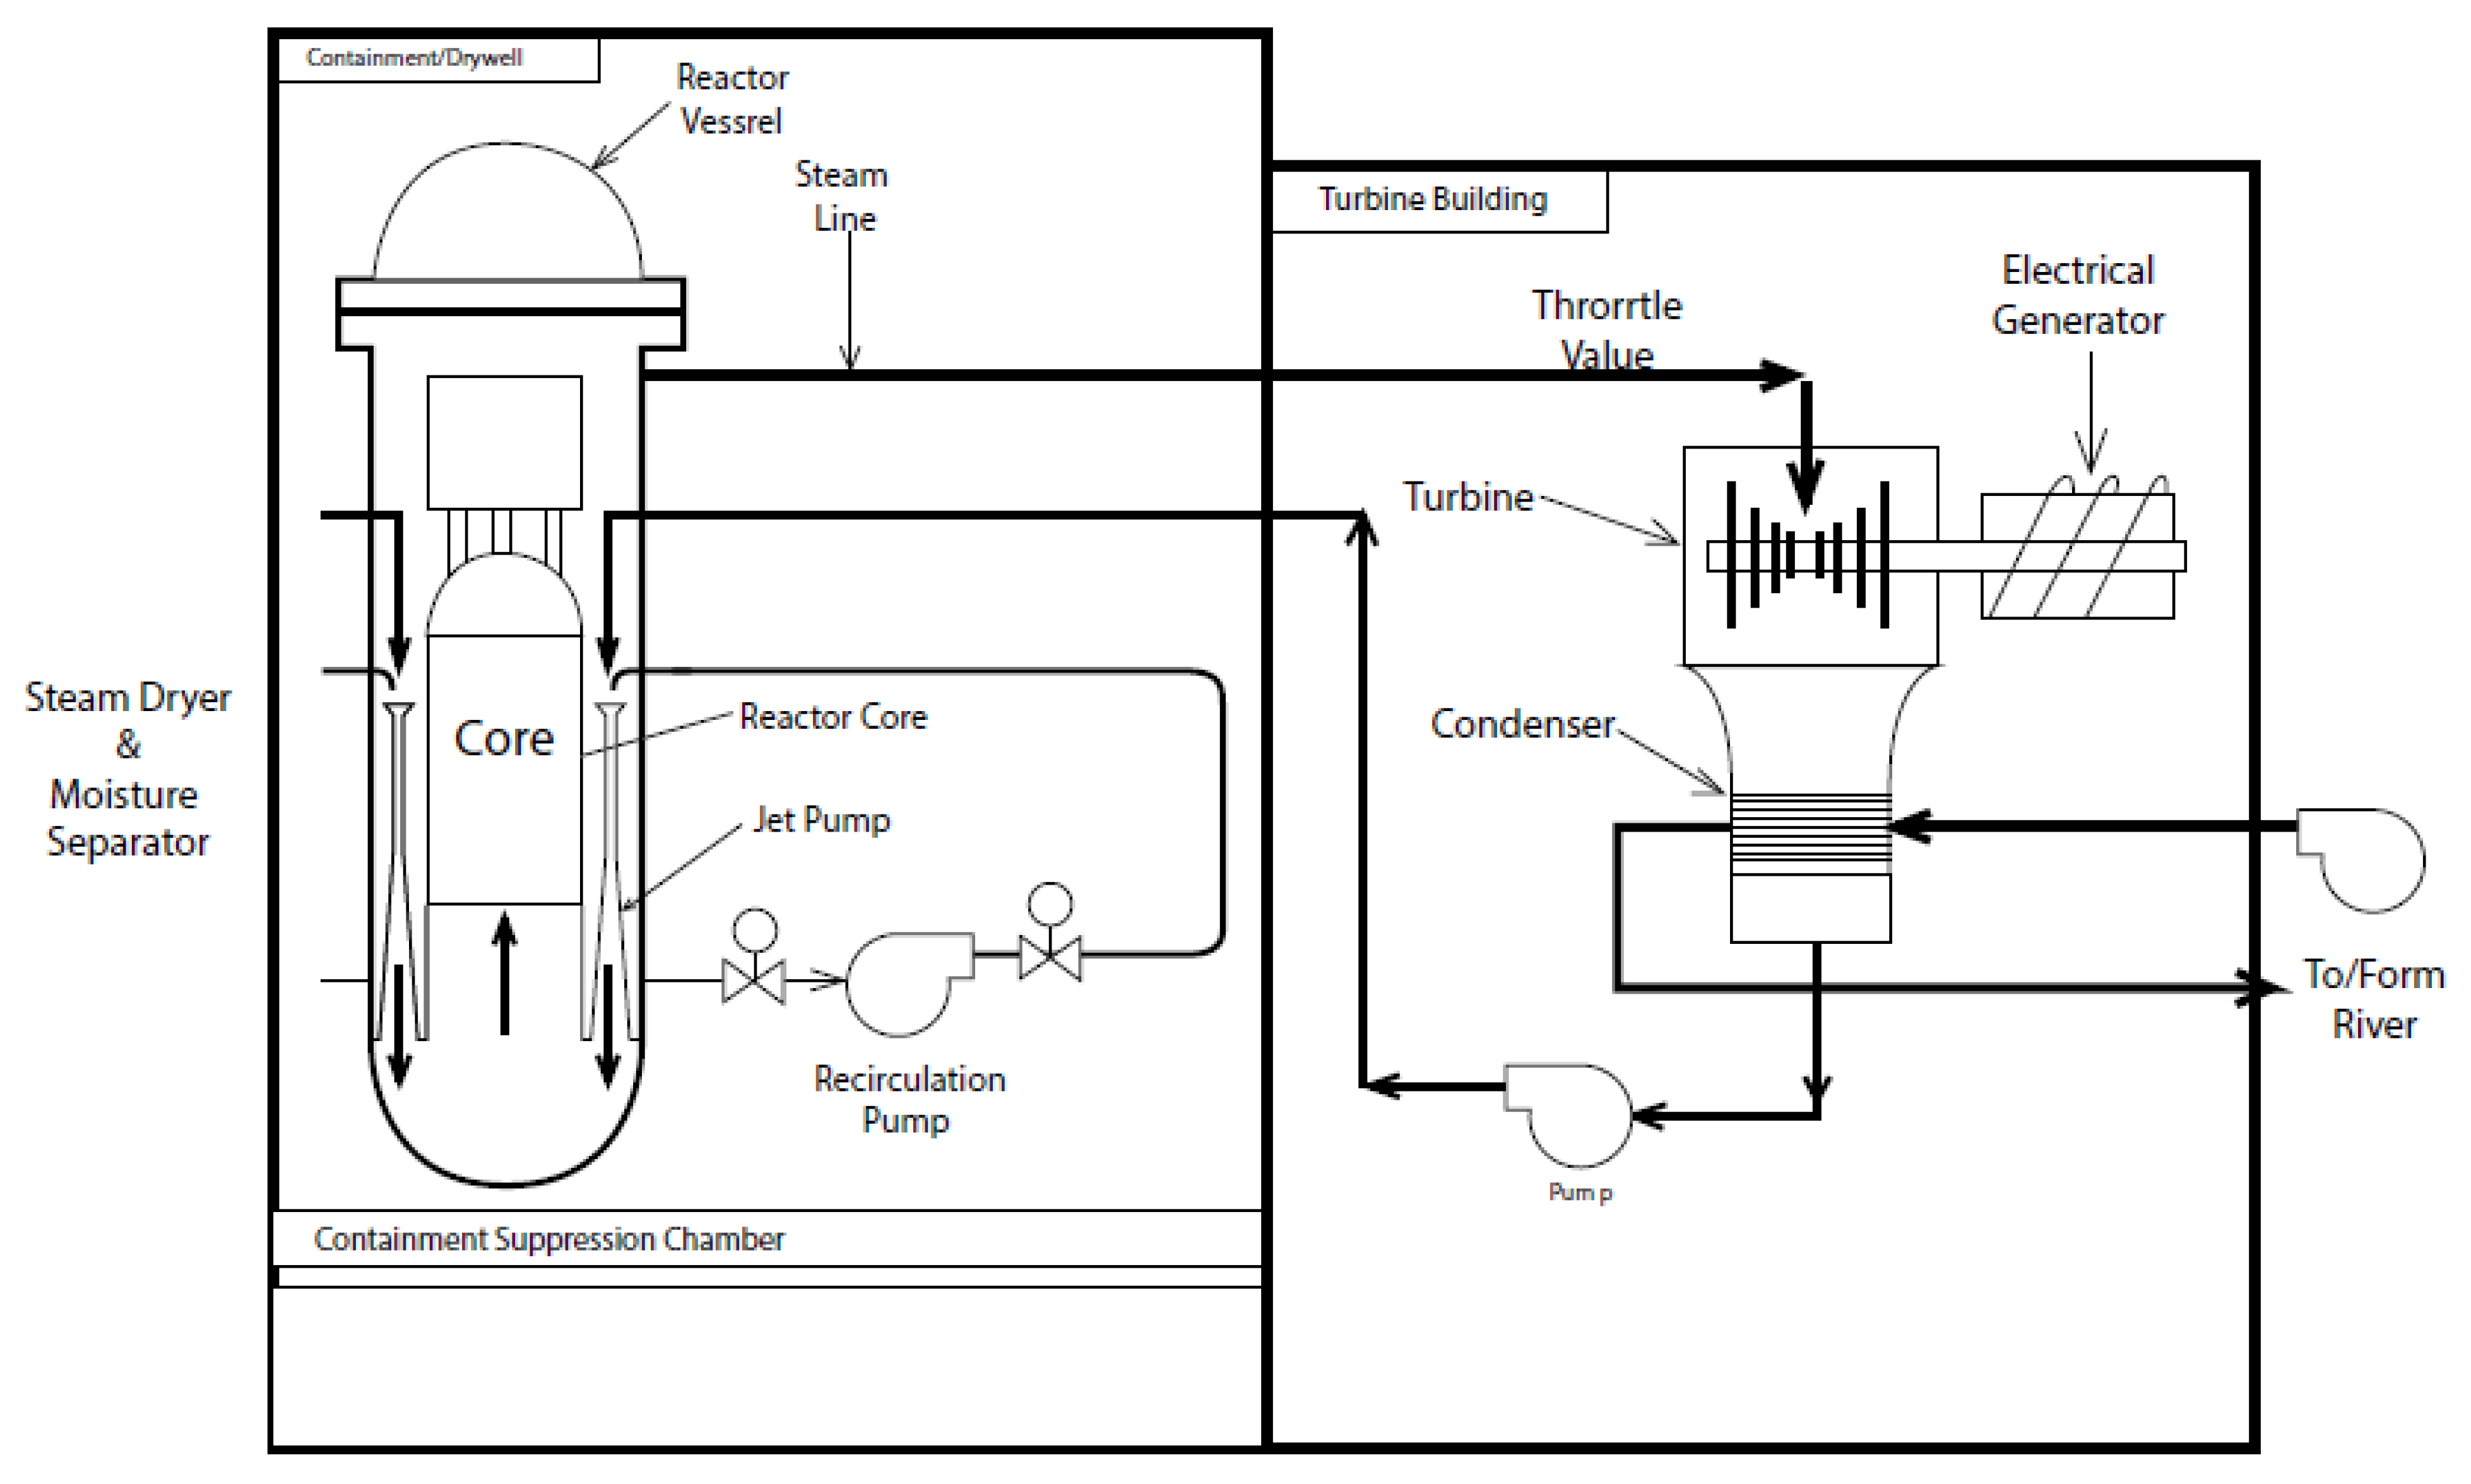
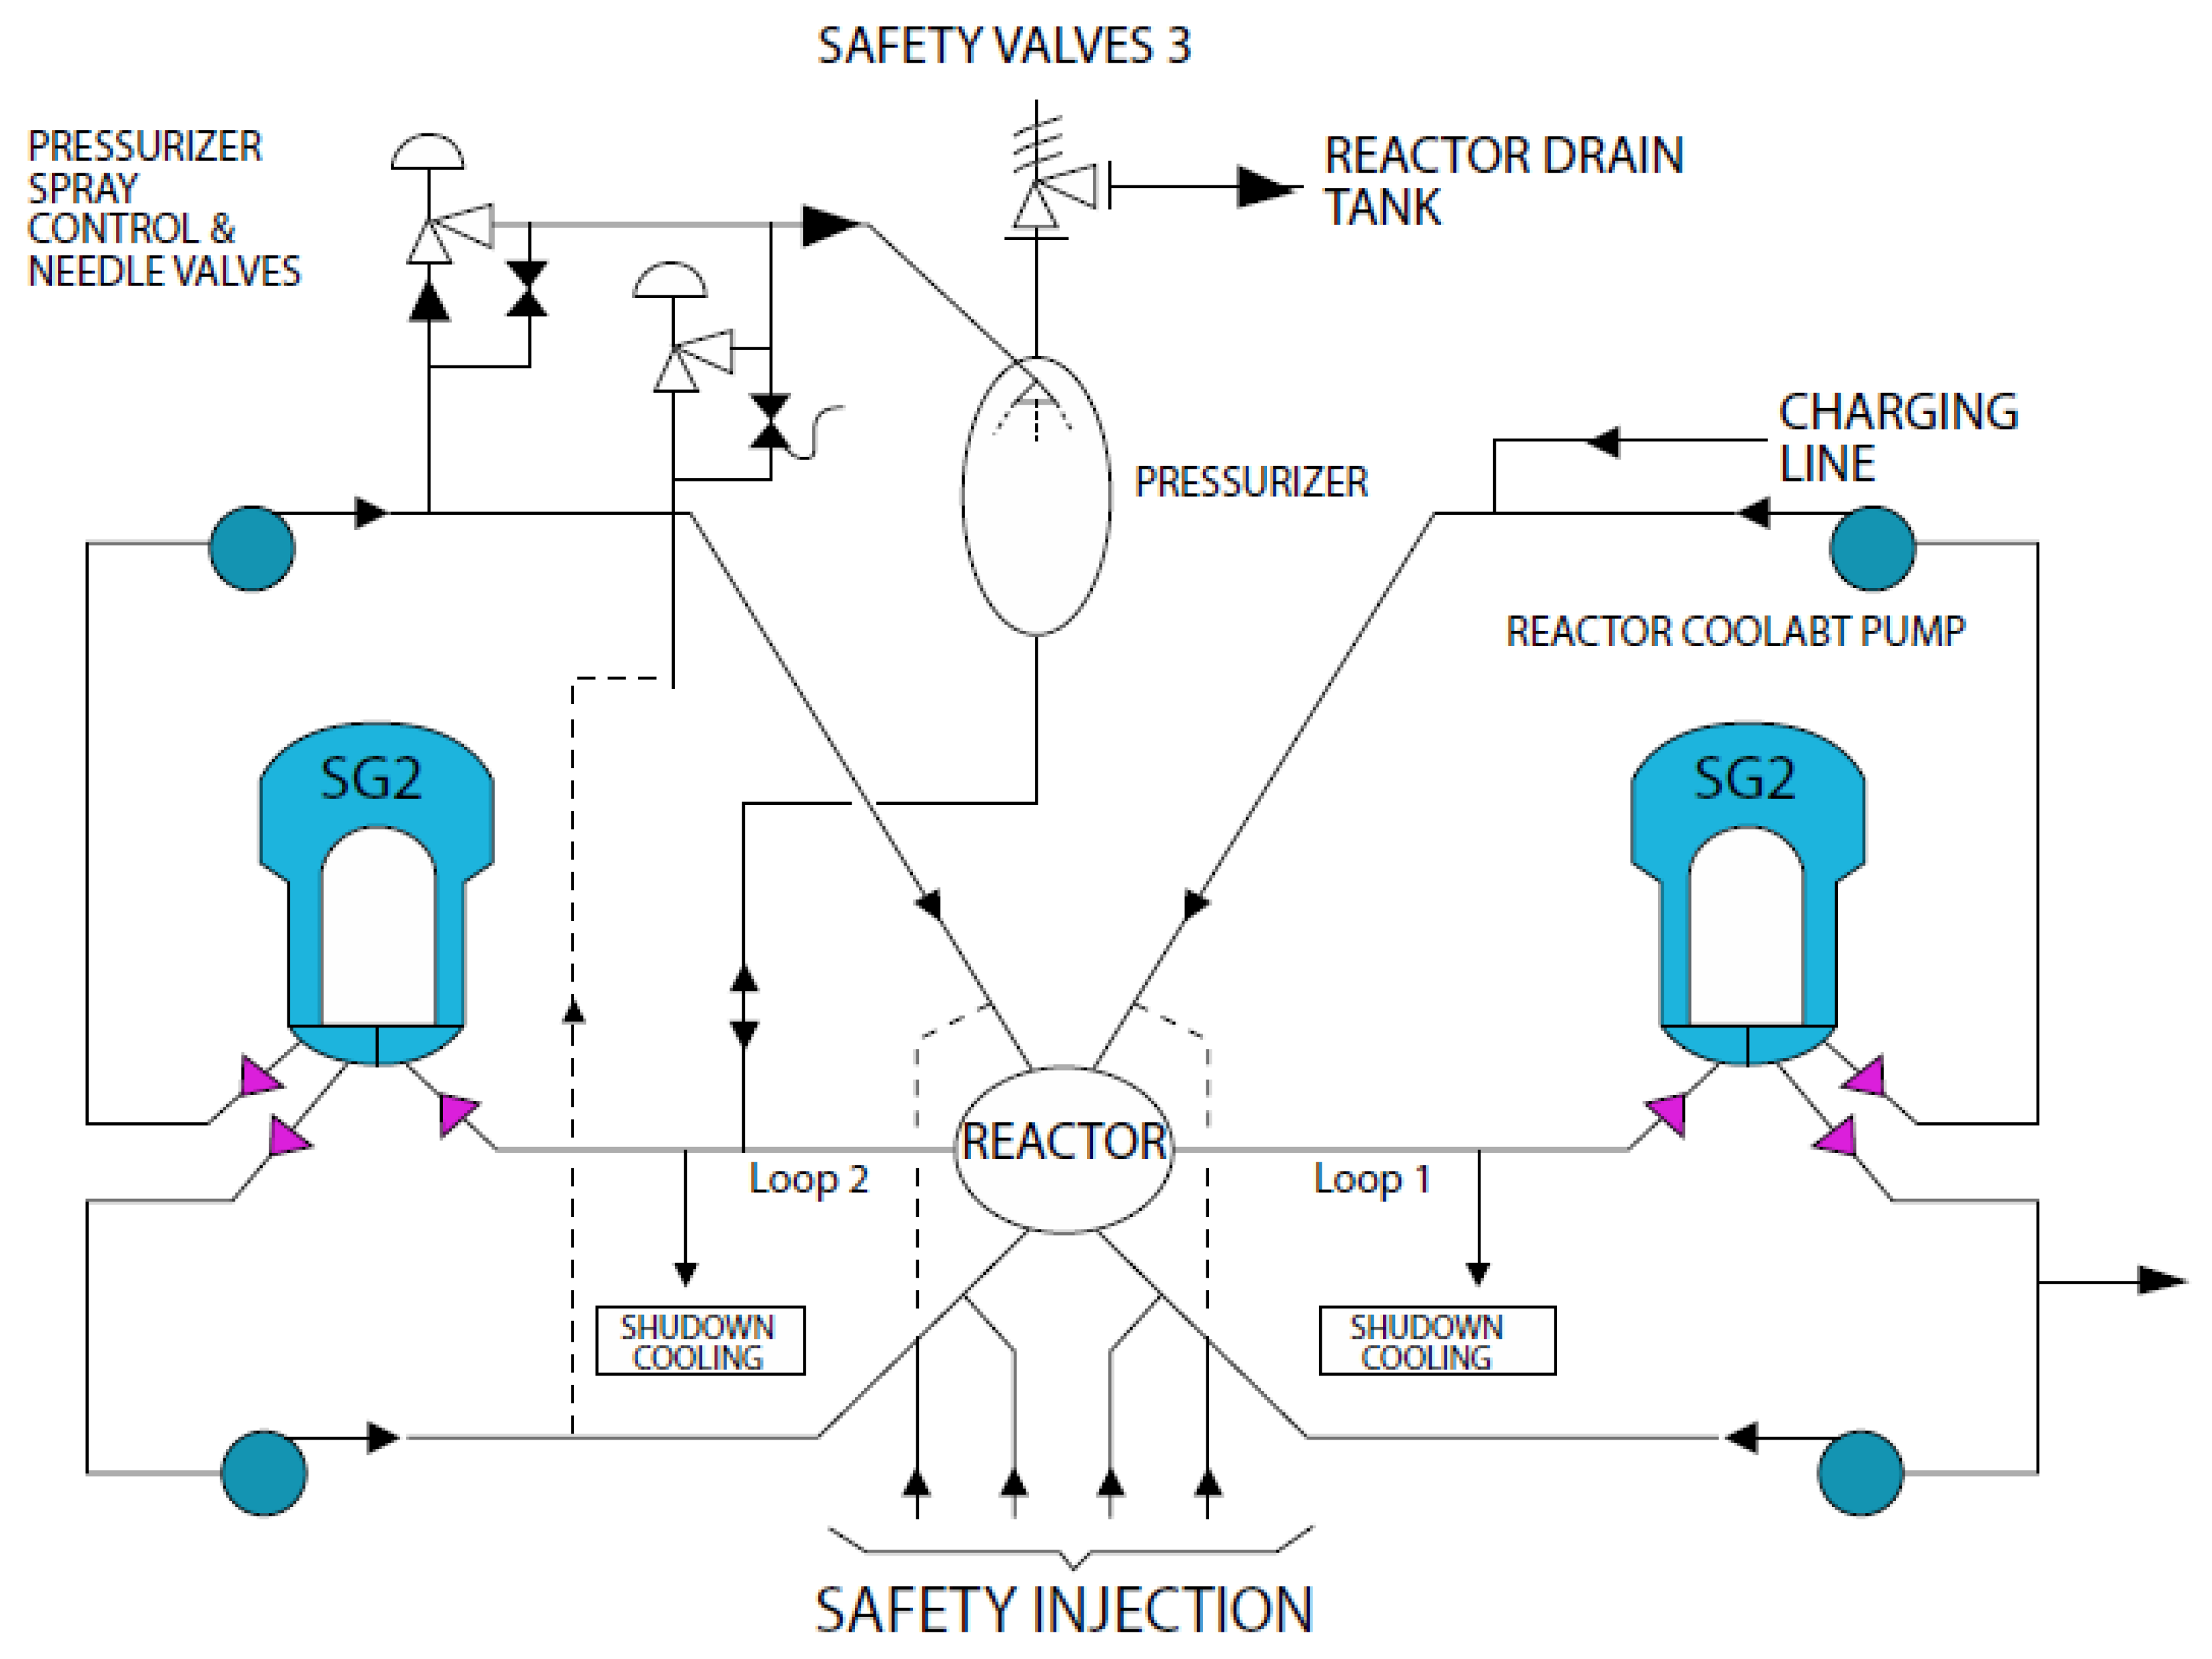
A simplified BWR coolant circuit is shown in
Figure 13 [
40]. Not shown are the other circuits, such as the decay heat removal circuit, reactor water cleanup system, reactor core isolation cooling circuit, standby liquid control system, and the high pressure and low-pressure emergency cooling systems. Briefly, water is boiled in the core and dry steam is sent to the turbines via the piping shown in the figure. The steam exiting the turbines is condensed, cleaned (deionized) via partial flow through the reactor water clean-up system, and returned to the feedwater of the reactor together with make-up water, as is necessary. The piping that flows through the recirculation pump is the recirculation piping system that recirculates liquid water from the upper core through the jet pumps and into the lower core plenum. This circuit contains liquid and is referred to as the “primary coolant circuit” to distinguish it from the steam phase circuit. The water from the lower plenum then flows up through the core where it boils to produce saturated steam exiting the core into the upper plenum, where it is dried and sent to the turbines. The system displayer in
Figure 13 employs external recirculation pumps but BWRs in other countries, particularly in Europe, employ internal recirculation pumps.
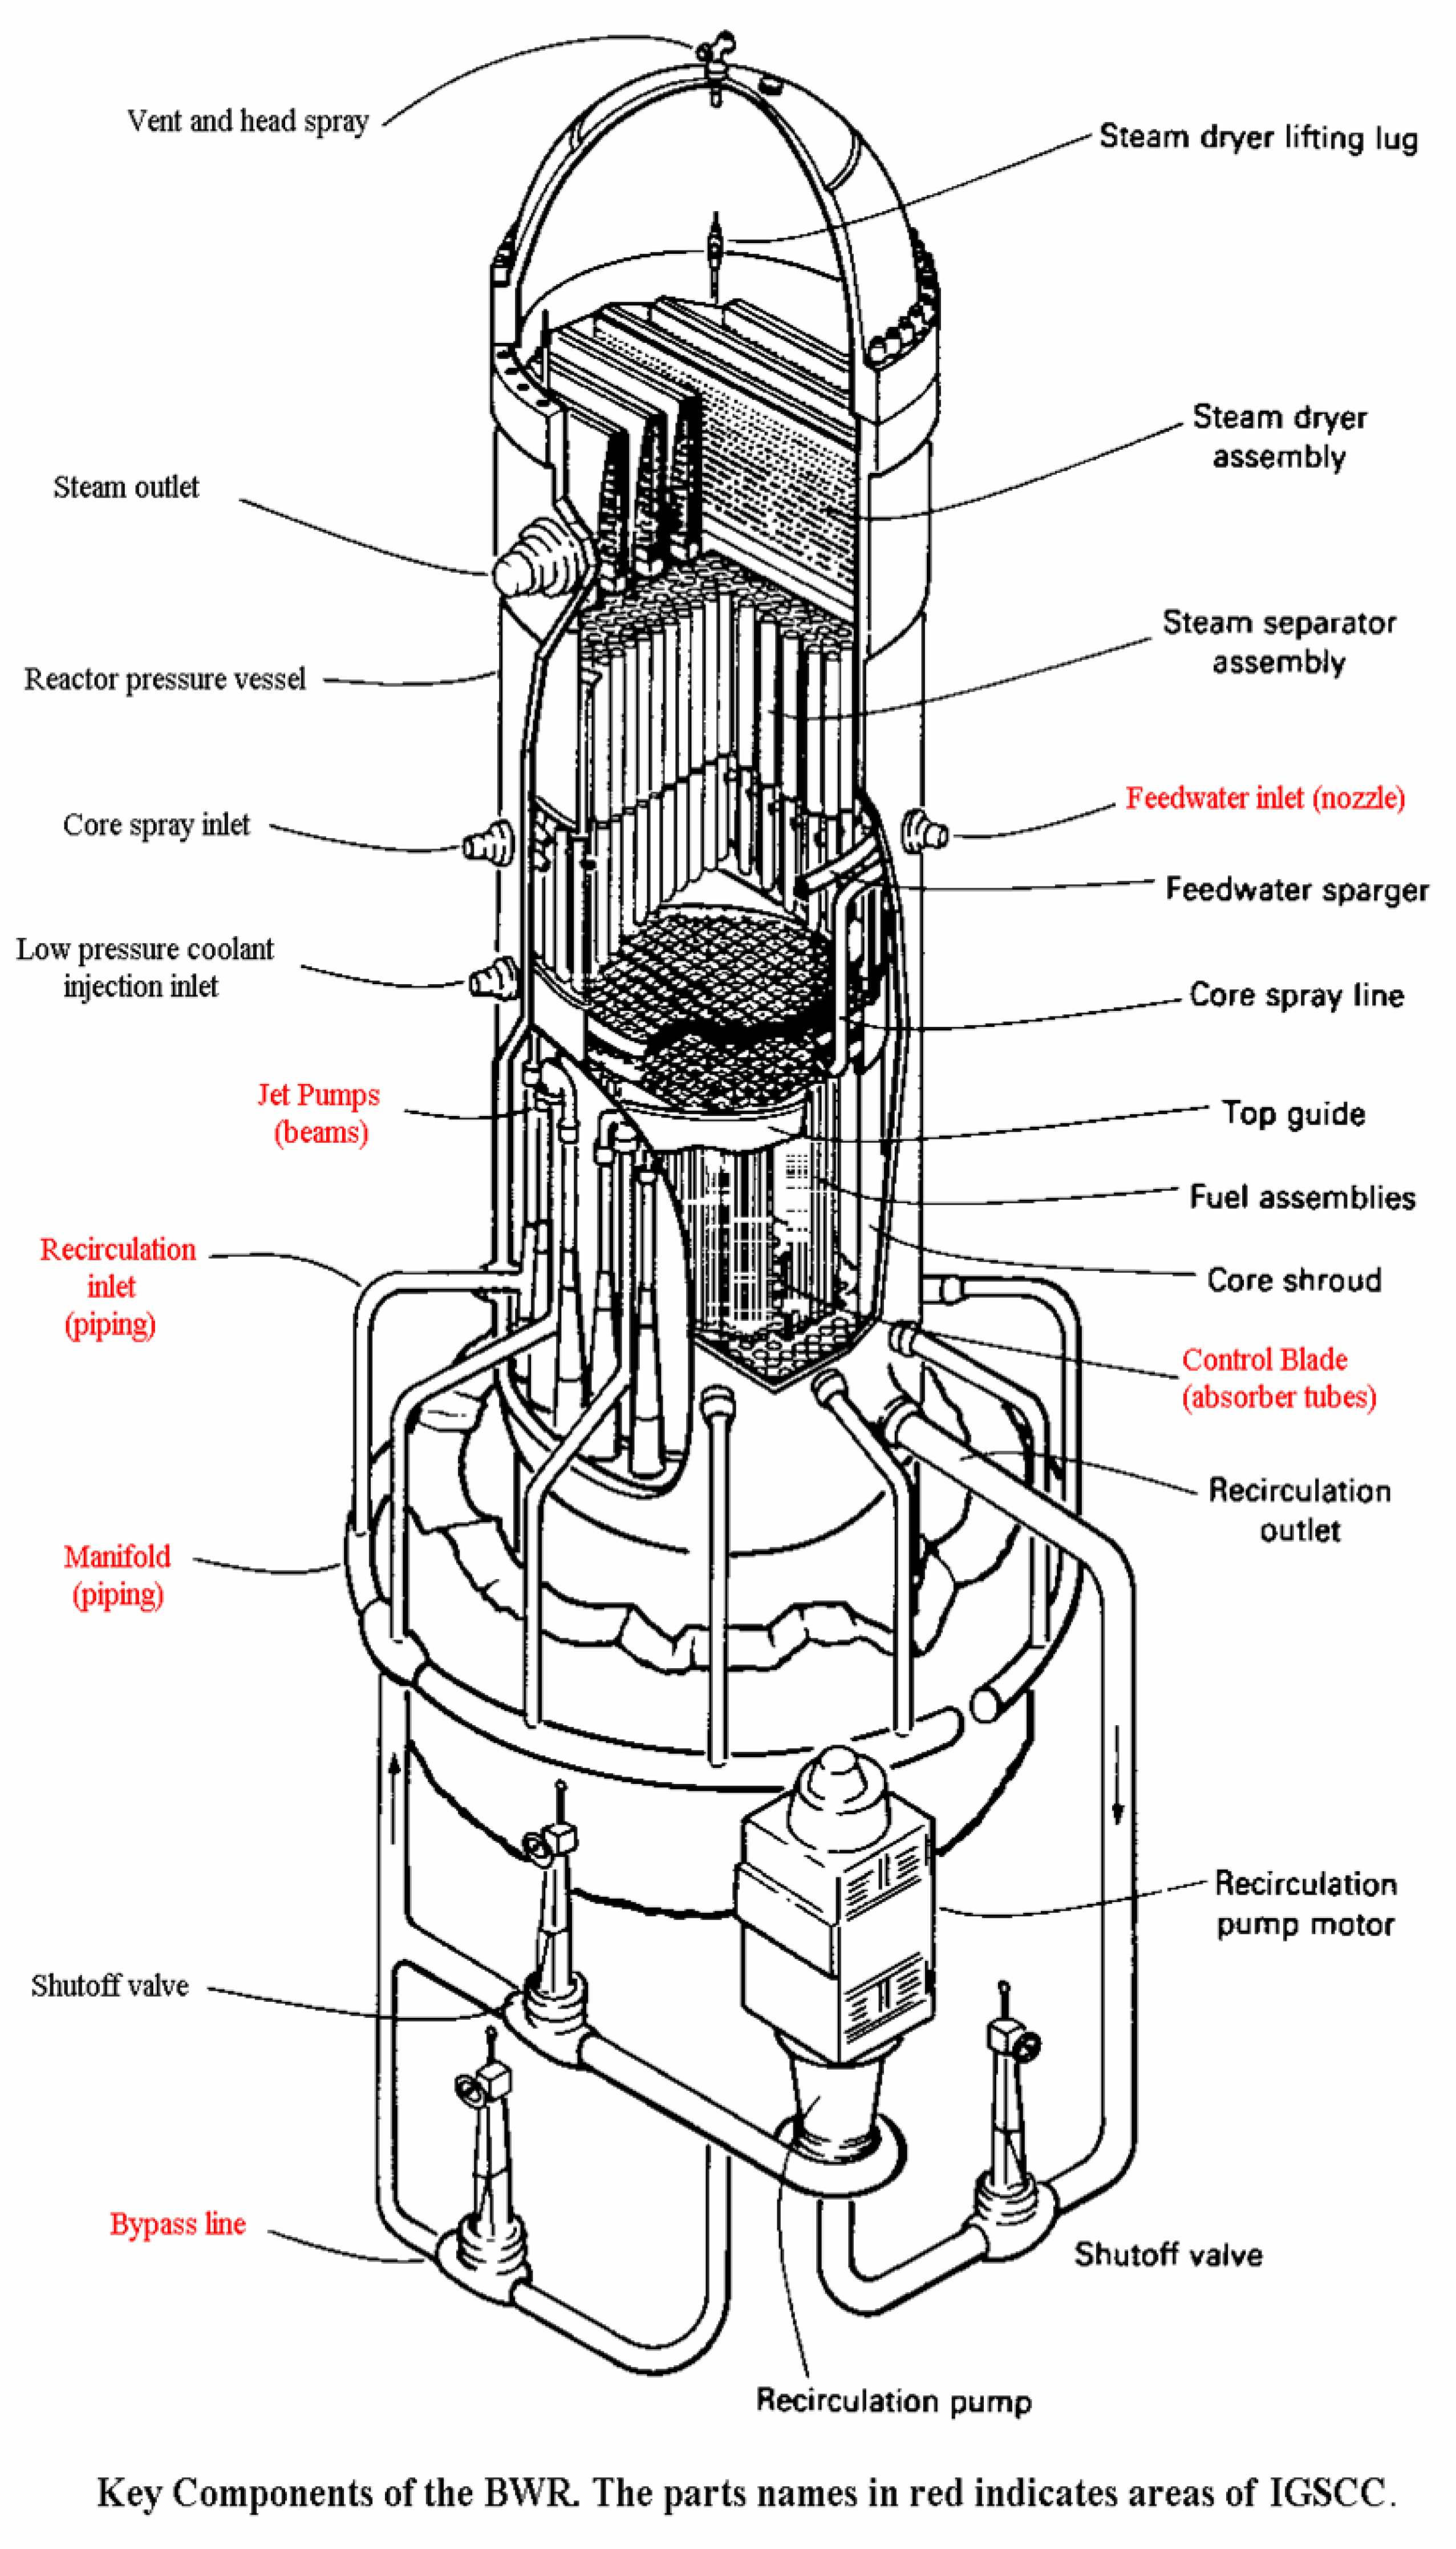
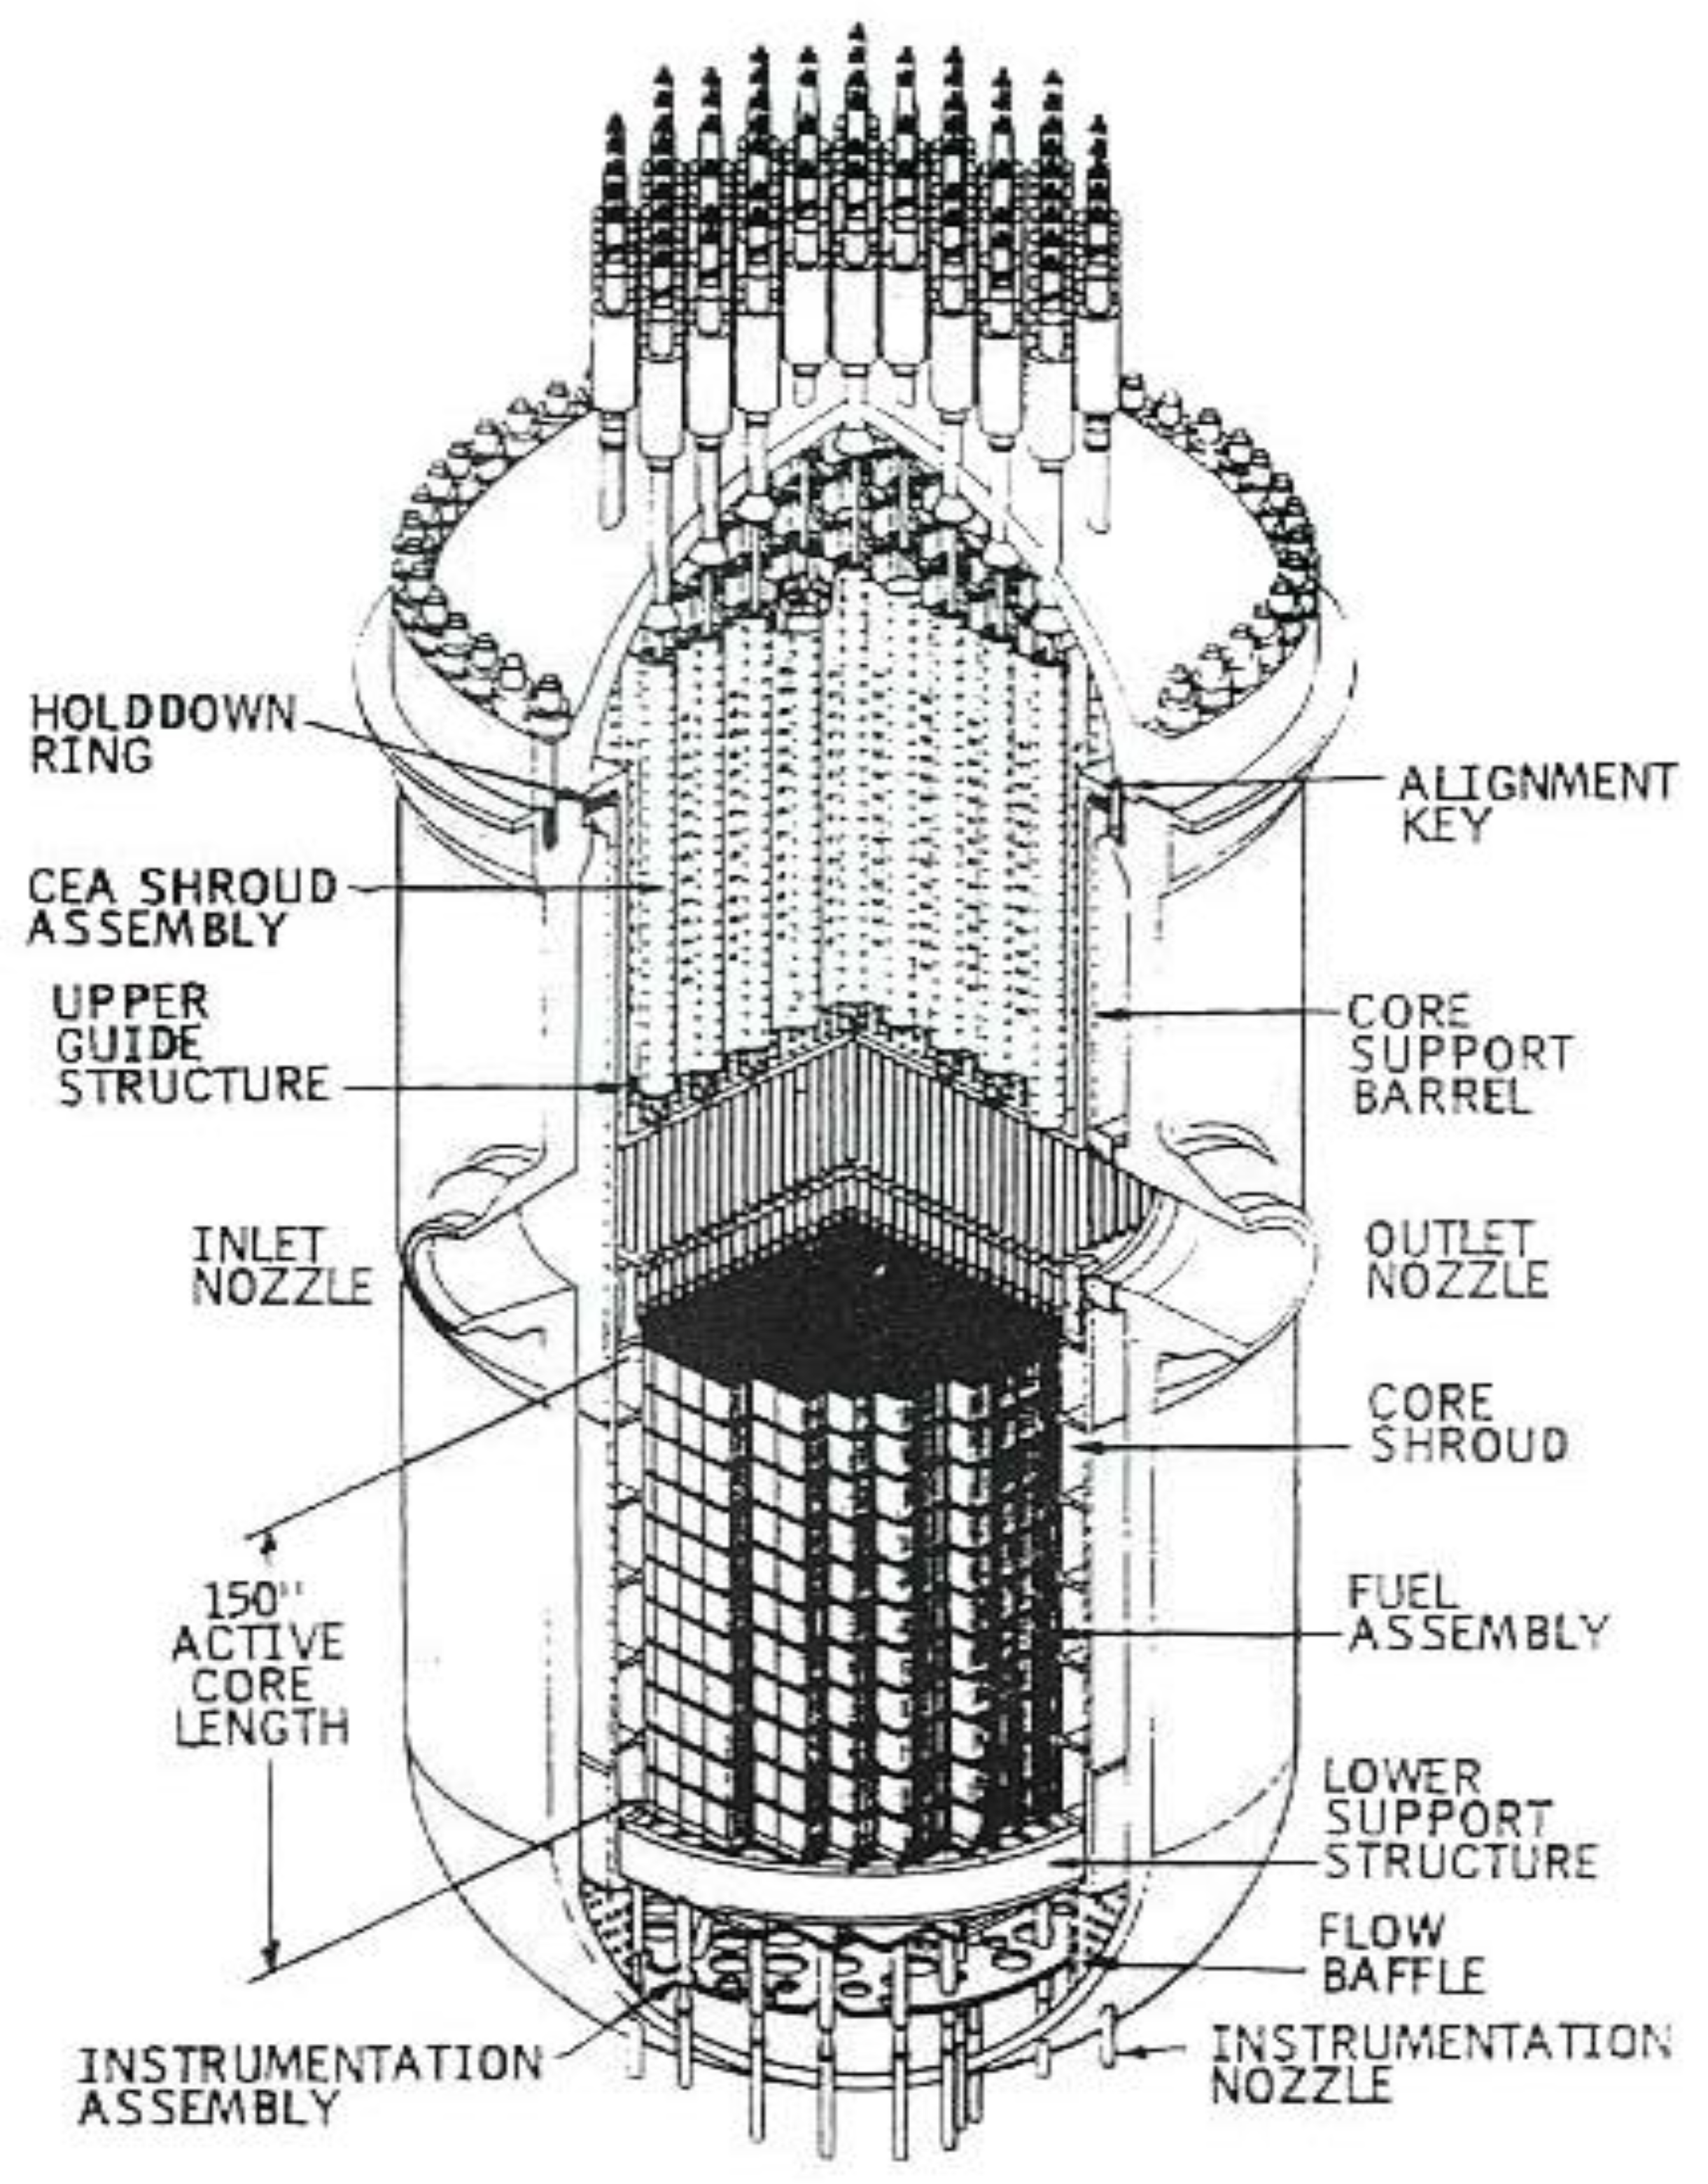
A cutaway view of the core of a GE Model 6 BWR is presented in
Figure 14. In this type of reactor, the neutron-absorbing control rods, which are used to control the core reactivity by absorbing neutrons, project into the core through the bottom of the reactor pressure vessel (RPV); when these rods are fully inserted, the population of thermalized neutrons is such (low) that a chain reaction can no longer be maintained, and the reactor shuts down. Although other means are available for shutting down the reactor in an emergency, such as flooding the core with borated water (
11B
5 +
1n
0 →
7Li
3 +
4He
2) via the standby liquid control system, the control rods are used to control reactor power during normal operation.
Additionally, shown is this figure is the recirculation piping system that is external to the vessel and comprises an array of large diameter (e.g., 36-inch) and small diameter pipes and the main recirculation pump, which are external to the RPV in US plants. As noted above, some BWRs, notably those in Sweden, Switzerland, and Germany, employ coolant pumps that are housed within the RPV. Briefly, the water is taken from the bottom of the downcomer and is pumped into the nozzle of the jet pumps, which then draw water from the upper plenum and injected into the lower plenum where it eventually enters the bottom of the core. The core itself is housed within a stainless-steel drum termed the “core shroud” (
Figure 14). As indicated in
Figure 14, the flow from the lower plenum bifurcates and approximately 10 % flows into the bypass, which is the gap between the inner RPV surface and the outer surface of the core shroud, with the remaining 90 % flowing into the core, where it boils to produce steam. The water in the bypass does not boil but it is subjected to γ- and n-induced radiolysis, albeit at a much lower dose rate than the water in the core.
Figure 14 shows areas, labeled in red, in which IGSCC in weld-sensitized Type 304 SS has been observed in operating BWRs. This figure is a little out-of-date, as extensive cracking has also been observed in the core shroud, for example, in the region of the H3 weld towards the top of the shroud, where the ECP is predicted to be high (see below). While cracking occurred early on in BWR operation (1970s) in the recirculation piping system, and was attributed to weld sensitization, as it appeared in the heat-affected zones (HAZs) adjacent to field welds that are not easily solution annealed, eventually it spread to the RPV internal components (1980s, 90s, and 2000s). Cracking in the internal components also appeared in weld HAZs, but a contributing factor is irradiation-assisted stress corrosion cracking (IASCC), resulting from irradiation of the steel with high energy (> 1 MeV) neutrons [
41,
42], which induces a state that is sometimes referred to as “irradiation-induced sensitization”. IASCC becomes a major factor for neutron fluences above 10
21 n/cm
2. This phenomenon is restricted to high neutron flux areas in the reactor core.
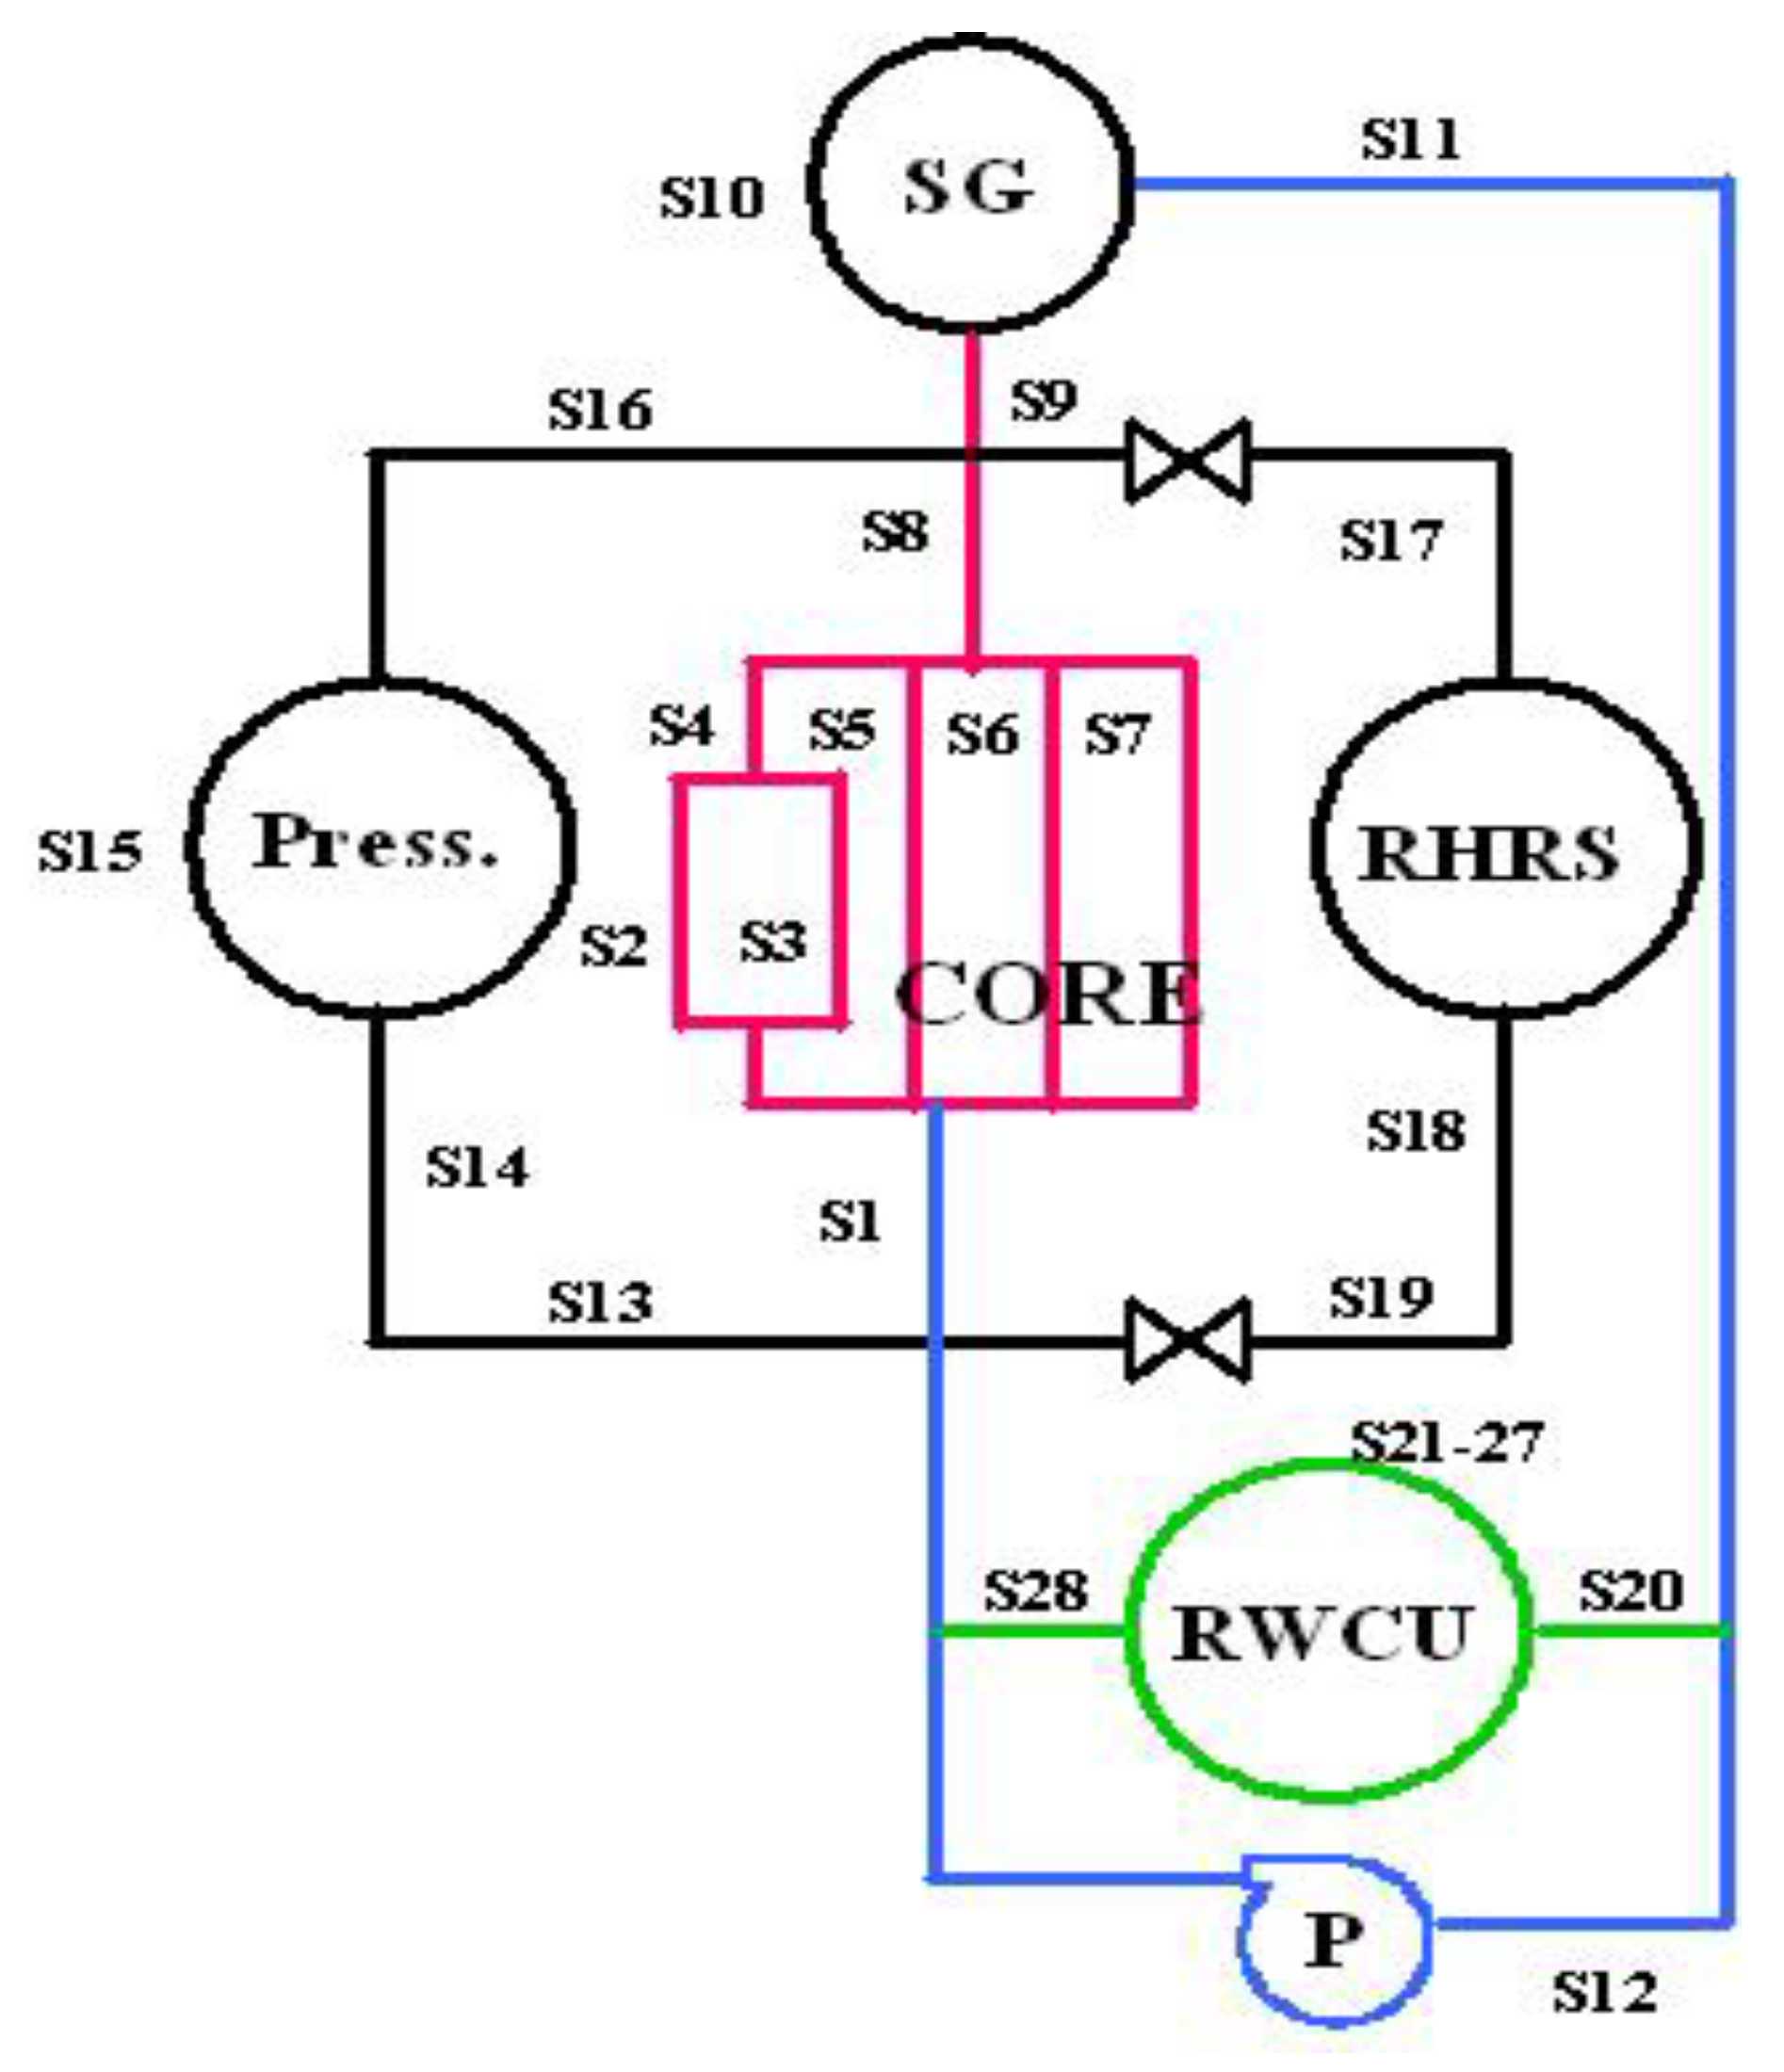
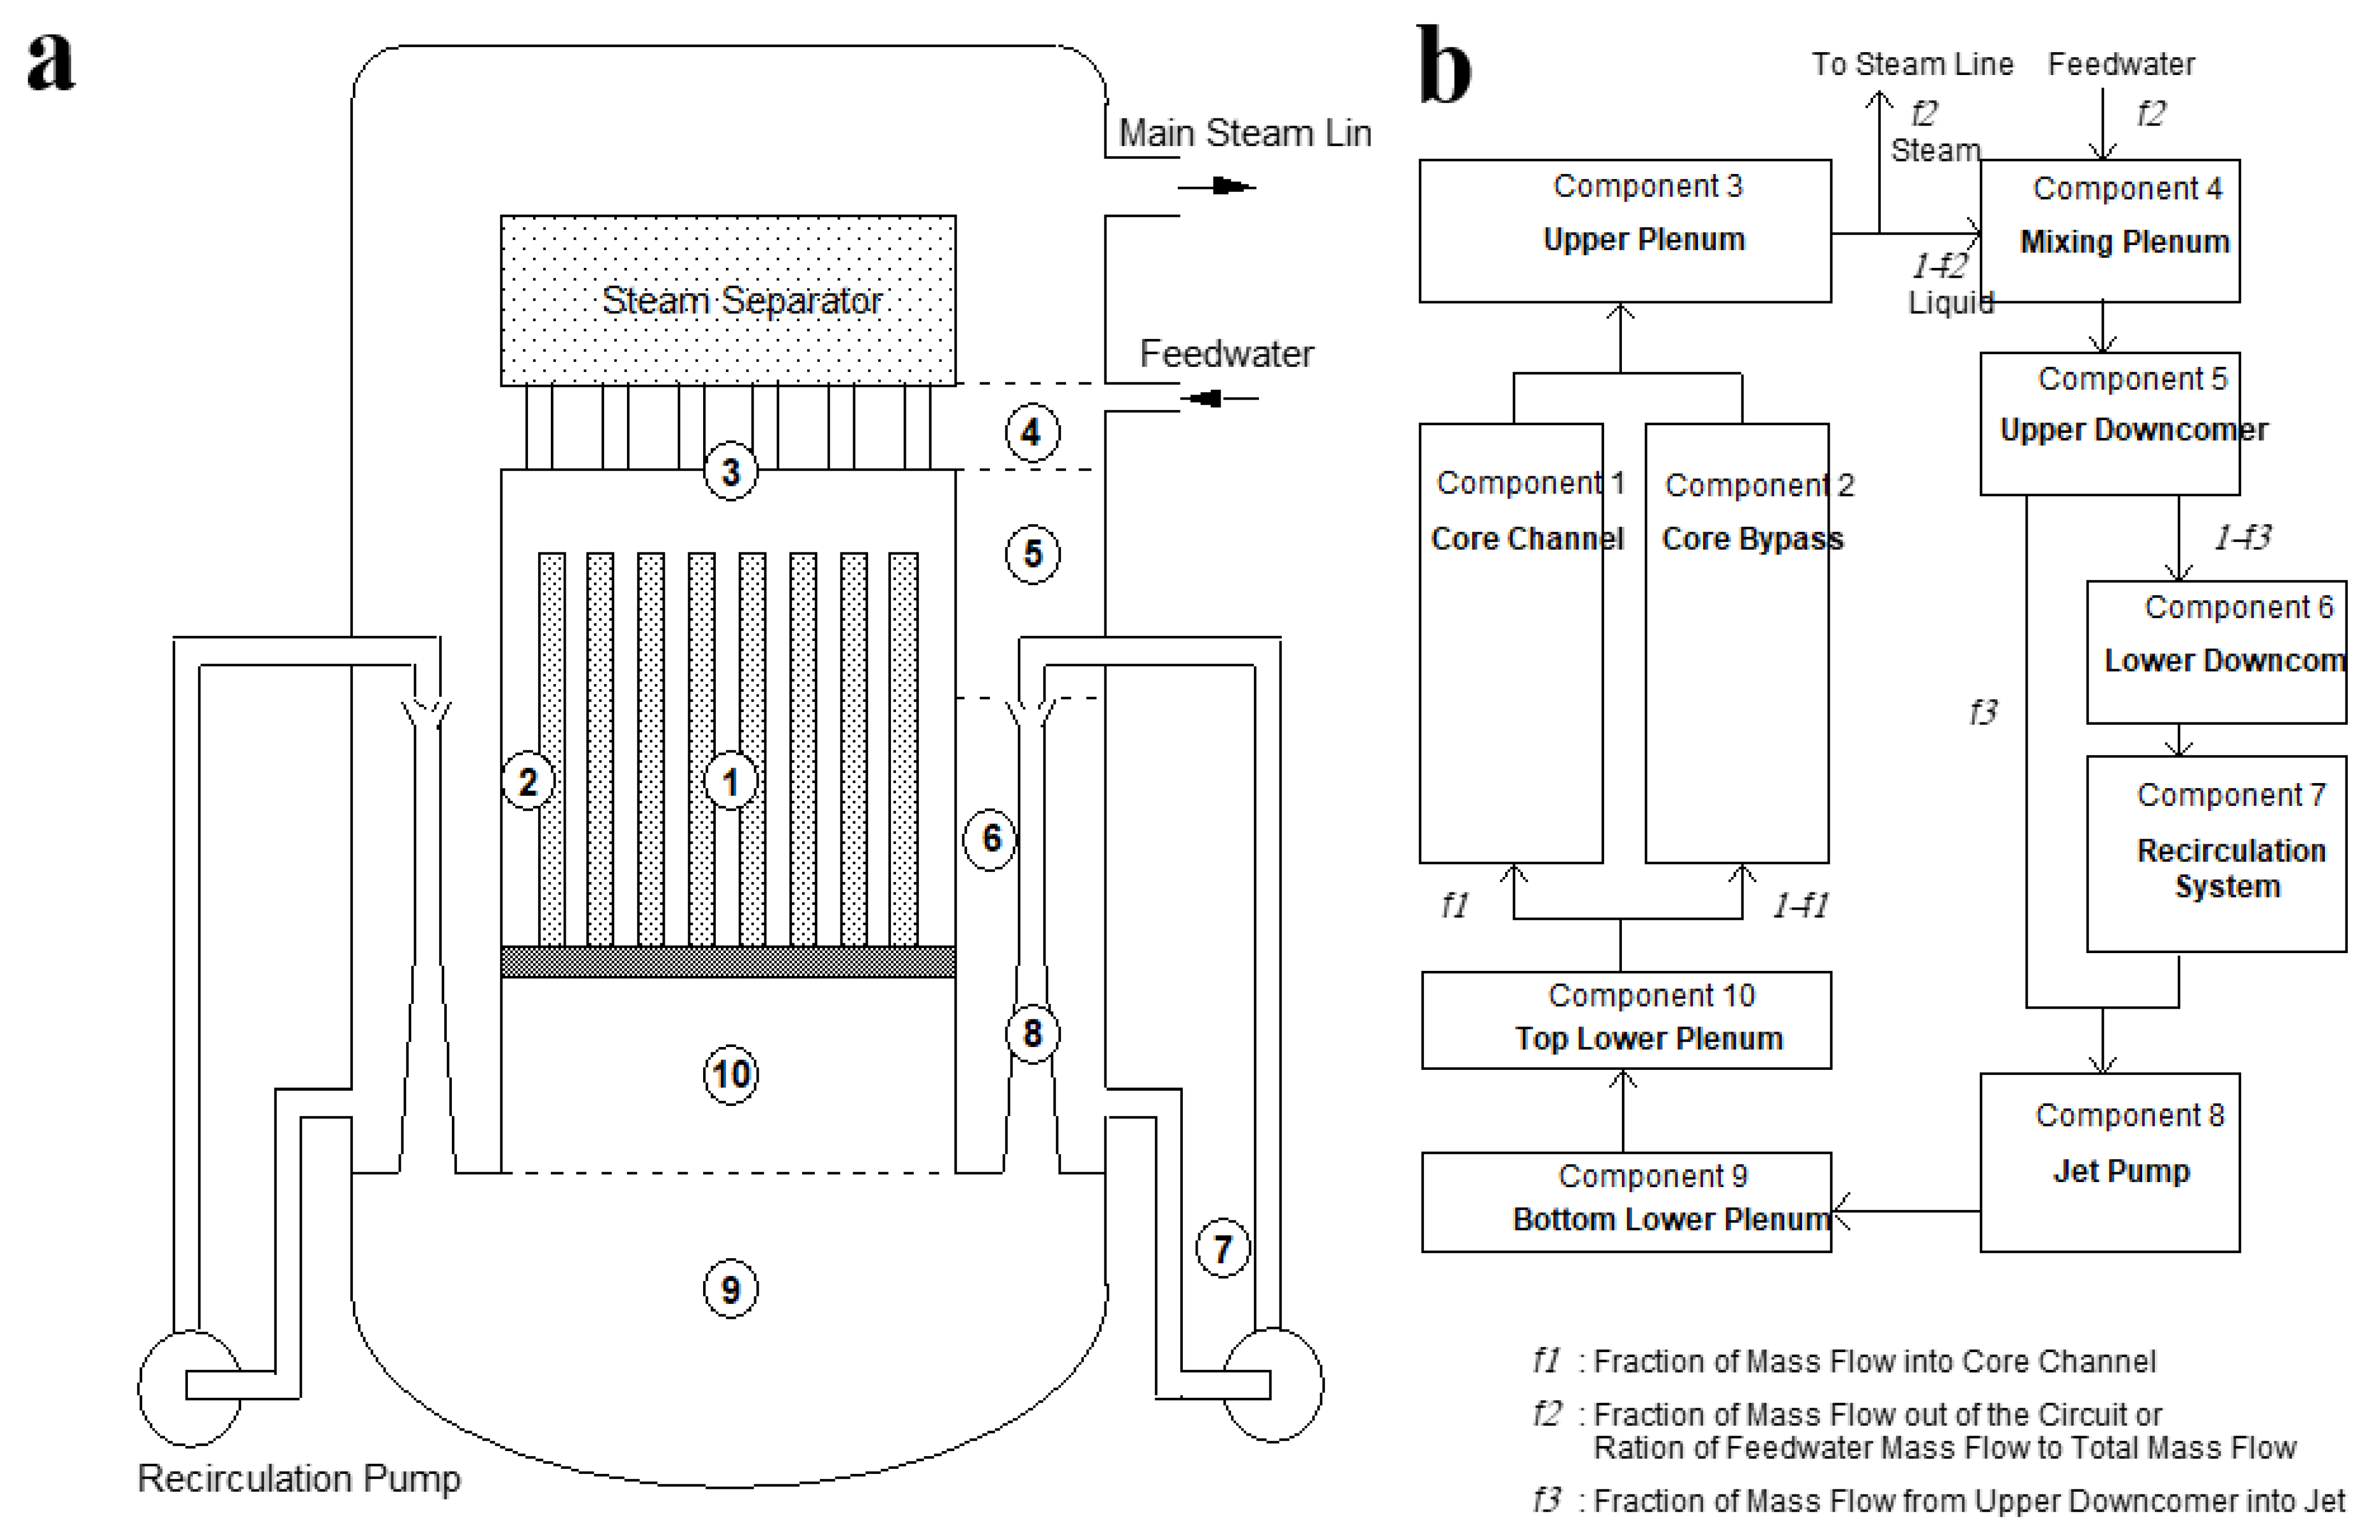
A schematic of the flow path of the PHTS in a BWR is displayed in
Figure 15.
The reader will note that the flow bifurcates in three places in the flow path (
Figure 15b): at the top of the core where dry steam is sent to the turbines; at the mixing plenum where the flow of liquid water is divided into components that go through the recirculation system and a component that flows directly to the lower plenum; and in the lower plenum, where the flow is divided between the core bypass and the core.
In the initial code developed in Macdonald’s group [
1,
18,
19,
21,
22,
43,
44,
45,
46,
47,
48,
49,
50], DAMAGE PREDICTOR, the radiolysis code of Burns and Moore [
18,
43,
44,
45] was adopted with the addition of the thermal decomposition of H
2O
2 (Reaction 30 [
50,
51,
52,
53]). Since the decomposition of H
2O
2 decreases [H
2O
2] but increases [O
2] (H
2O
2 → 1/2O
2 + H
2O), the rate of this reaction, which occurs principally in the recirculation system, because of the long residence time compared with other components in the flow path, has a large impact on the ECP. Accordingly, the rate constant was varied to calibrate the model on plant [O
2] and data from Dresden-2, but the value adopted was restricted to the range of values reported in the literature [
52,
53,
54,
55,
56]. From then on, the value was not changed when modeling the electrochemistry of some of the reactors that spanned the BWR fleet in their response to hydrogen water chemistry (HWC).
Finally, it is important to note that BWRs differ in two important respects with regard to understanding the electrochemistry of the coolant: (1) the fraction of the coolant passing through the core vs. that passing through the bypass; and (2) the residence time that the coolant has in the downcomer, where much of the recombination of radiolysis products is believed to occur. This latter issue will be highlighted later in this paper.
5.2. Radiolysis/ECP/CGR Modeling of BWR PHTSs
Extensive modeling of the electrochemistry and corrosion behavior has been reported; most notably by Macdonald and co-workers in the US, Yeh et al. in Taiwan, and Ibe, et al., and Ishigure and coworkers in Japan Ref. [
1] and citations therein. These analyses all start with using a radiolysis/circuit flow model to calculate the concentrations of radiolysis species at closely spaced points around the PHTS but only the models of Macdonald et al. and Yeh and coworkers proceed to calculate the ECP and CGR of a “standard crack (typically 0.5 cm in length loaded to
KI = 27.5 MPa.m
1/2) with a COD (crack opening displacement) of 0.0005 cm, a crack width of 1.27 cm, and having a Degree of Sensitization EPR (Electro Potentiokinetic Reactivation) value of 15 C/cm
2. Note that the models of these two groups have a common source [
19]. Macdonald et al. [
1,
21] proceed further to calculate the integrated damage (crack length) as a function of the operating history of the reactor. This, more than anything else, renders the modeling of damage to a specific reactor, because reactors differ significantly in their operating histories. The radiolysis codes employed in these models are described in Part I [
1] and in papers cited therein.
The concept of the “standard crack” was introduced in the analysis of BWR circuits [
19] to allow the impact of the environment, through the ECP, temperature, flow velocity, and conductivity, on the tendency for the accumulation of IGSCC damage in sensitized stainless steel, so that different regions of a reactor coolant circuit could be compared. Because the CGR also depends on the stress intensity factor, which depends on the MCL (mechanical crack length) and on the ECL (electrochemical crack length) and on other mechanical/metallurgical/microstructural/microchemical factors, such as modulus, yield strength, grain size, and hardness, among others, a complete specification of the driving force and predicted CGR for IGSCC is currently beyond SCC theory. Additionally, the prediction of the accumulation of SCC damage requires a viable model to predict the crack initiation time. While significant progress has been made toward that goal [
14], a fully operational model is not yet at hand. Thus, we caution the reader to recognize these caveats when interpreting the calculated CGR data reported in this paper.
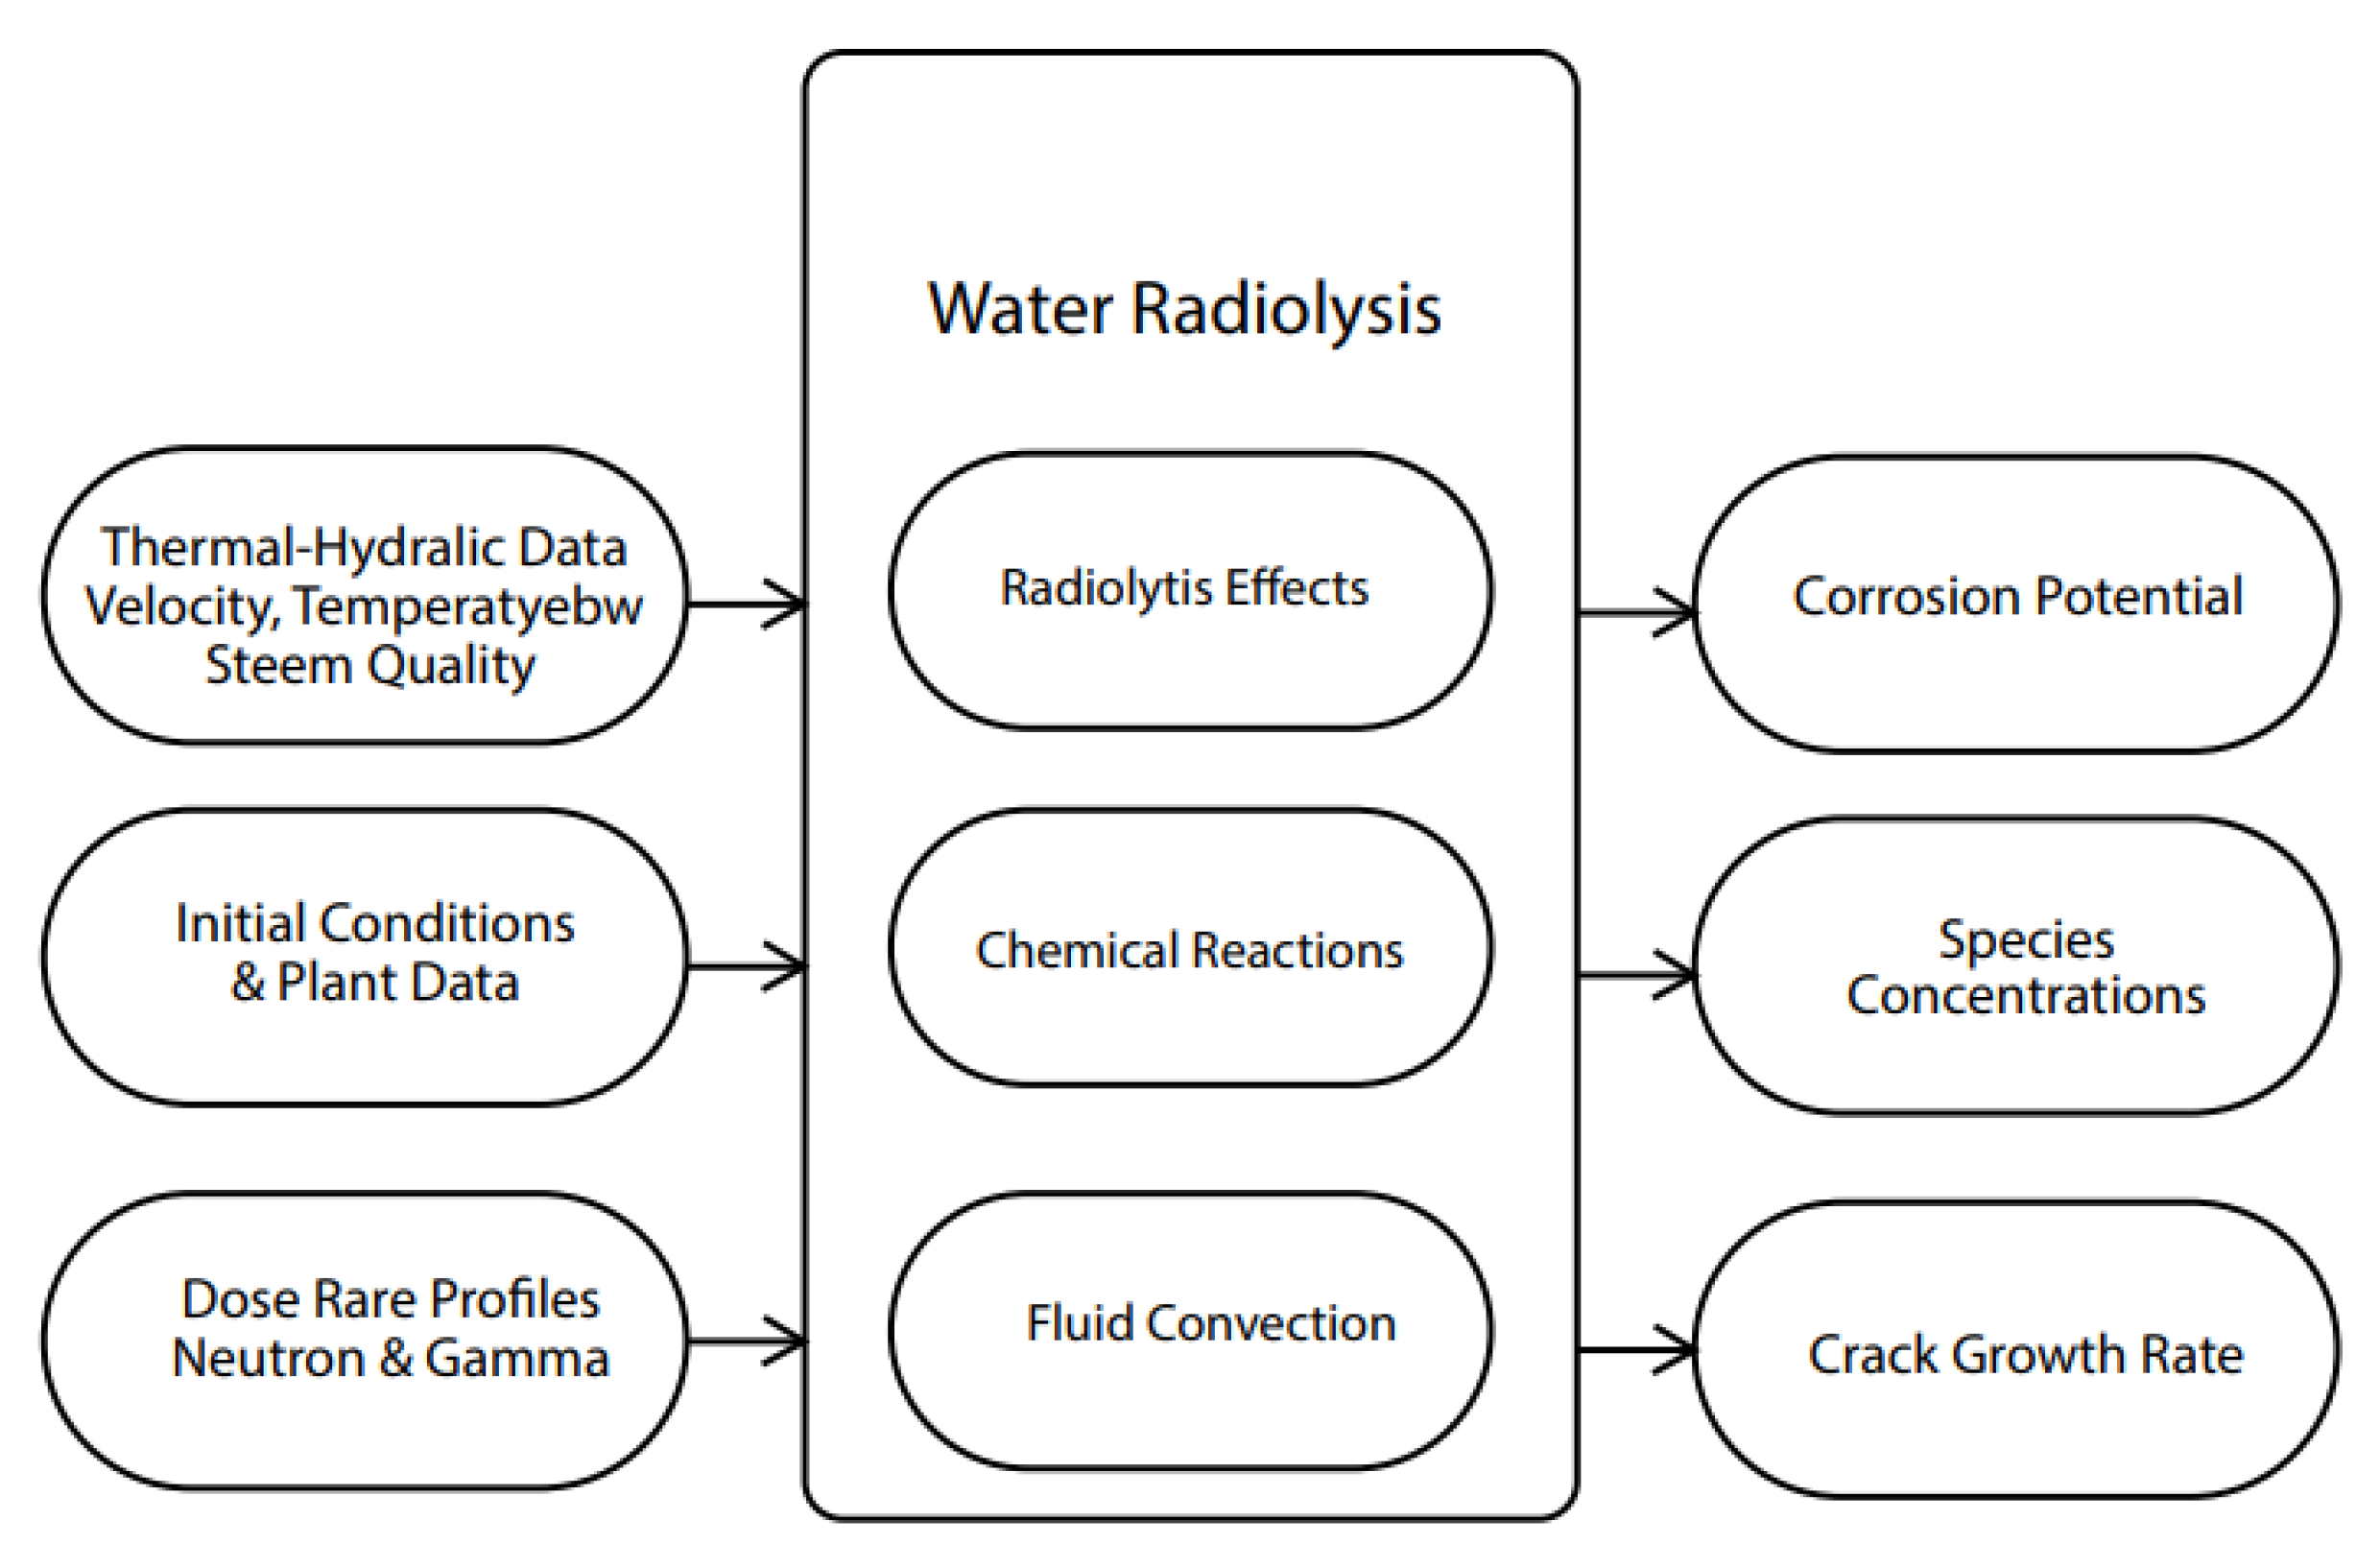
Briefly, the models of Macdonald et al. and Yeh and coworkers [
1] have the general structure shown in
Figure 16. The code accepts inputs of the thermal-hydraulic properties of the circuit (volume flow velocities, hydrodynamic diameter, temperature, as a function of operating power of the reactor), the initial plant conditions (e.g., [O
2]), and the
γ and
n dose rate profiles in the core as a function of elevation in the core channels. The code then proceeds to solve 13 tightly coupled, stiff first-order differential equations (one for each species) to yield the species concentrations around the circuit. These equations contain source terms for species radiolytic production and sink terms for reactions between various species in the system, as described in the radiolysis model, including the all-important thermal decomposition of H
2O
2. As noted previously, the rate constant for this reaction is used to calibrate the model on plant data (e.g., recirculation system [O
2]), as shown in
Figure 5 [
21]. The species concentrations are then used to calculate the ECP and CGR for a model crack at closely spaced locations around the entire primary coolant circuit. The reader is referred to the literature [
18,
19,
21,
43,
44,
45,
46,
47,
48,
49,
50] for a detailed description of the input and output files as they are too voluminous to include here.
A simplified thermal-hydraulic code, ZEBRA [
57], was used to estimate the reactor thermal-hydraulic properties. The ZEBRA code is easier to use than the more sophisticated codes like the transient reactor analysis code 19 (TRAC-BD1 /MOD 1) [
58,
59]. ZEBRA was used to calculate the temperatures of the fuel cladding and coolant in the reactor core for specific plant data. The heat transfer coefficient and steam quality versus core height are also obtained from ZEBRA. The shortcoming of ZEBRA is that subcooled boiling is not considered, although homogeneous, two-phase flow is assumed in the algorithm. At the stage of development of DAMAGE-PREDICTOR in the early 1990s, ZEBRA was acceptable for performing the BWR core thermal-hydraulic analysis. Although the flow velocity and void fraction are not provided in the output of ZEBRA, they can be calculated using Bankoff’s equation and mass balance, as described elsewhere [
19].
Accurately simulating the neutron and gamma dose rates in the primary circuit, especially in the downcomer region, is of the utmost importance [
19,
46,
47,
48,
49,
50]. The decomposition of hydrogen peroxide and the radiolysis of water in the downcomer region have been determined to be important factors in determining the oxygen concentration in the recirculation line. The plant-specific dose rate profiles must be supplied for the PHTS of the plant to be analyzed, although neutron transport codes, such as DOT-III, may be employed for calculating the dose rate profiles to acceptable accuracy. In the current study, the dose rate data were obtained from [
56].
DAMADE PREDICTOR, the initial code developed in Macdonald’s group [
19] in the early 1990s was calibrated against ECP data that had been measured in an autoclave valved into parallel with the recirculation piping system of the Dresden 2 BWR in Illinois. The data for [O
2] are summarized in Ref [
19]. As noted elsewhere, the calibration involved changing the rate constant of the hydrogen peroxide thermal decomposition reaction (H
2O
2 → H
2O + ½O
2) with an increase of the rate constant increasing [O
2] in the recirculation system, until agreement was obtained between the measured and calculated [O
2} in the autoclave valved into the recirculation piping. Once that was done the rate constant was fixed and has never deeded to be changed when modeling the radiolysis in a total of 14 BWRs (including Duane Arnold, Dresden-2, Grand Gulf, Susquehanna, Hamaoka-2, Fermi-2, Riverbend, Perry in the US, Leibstadt in Switzerland, 2 in Spain, 1 in Taiwan, 1 in Mexico, and 1 in Germany).
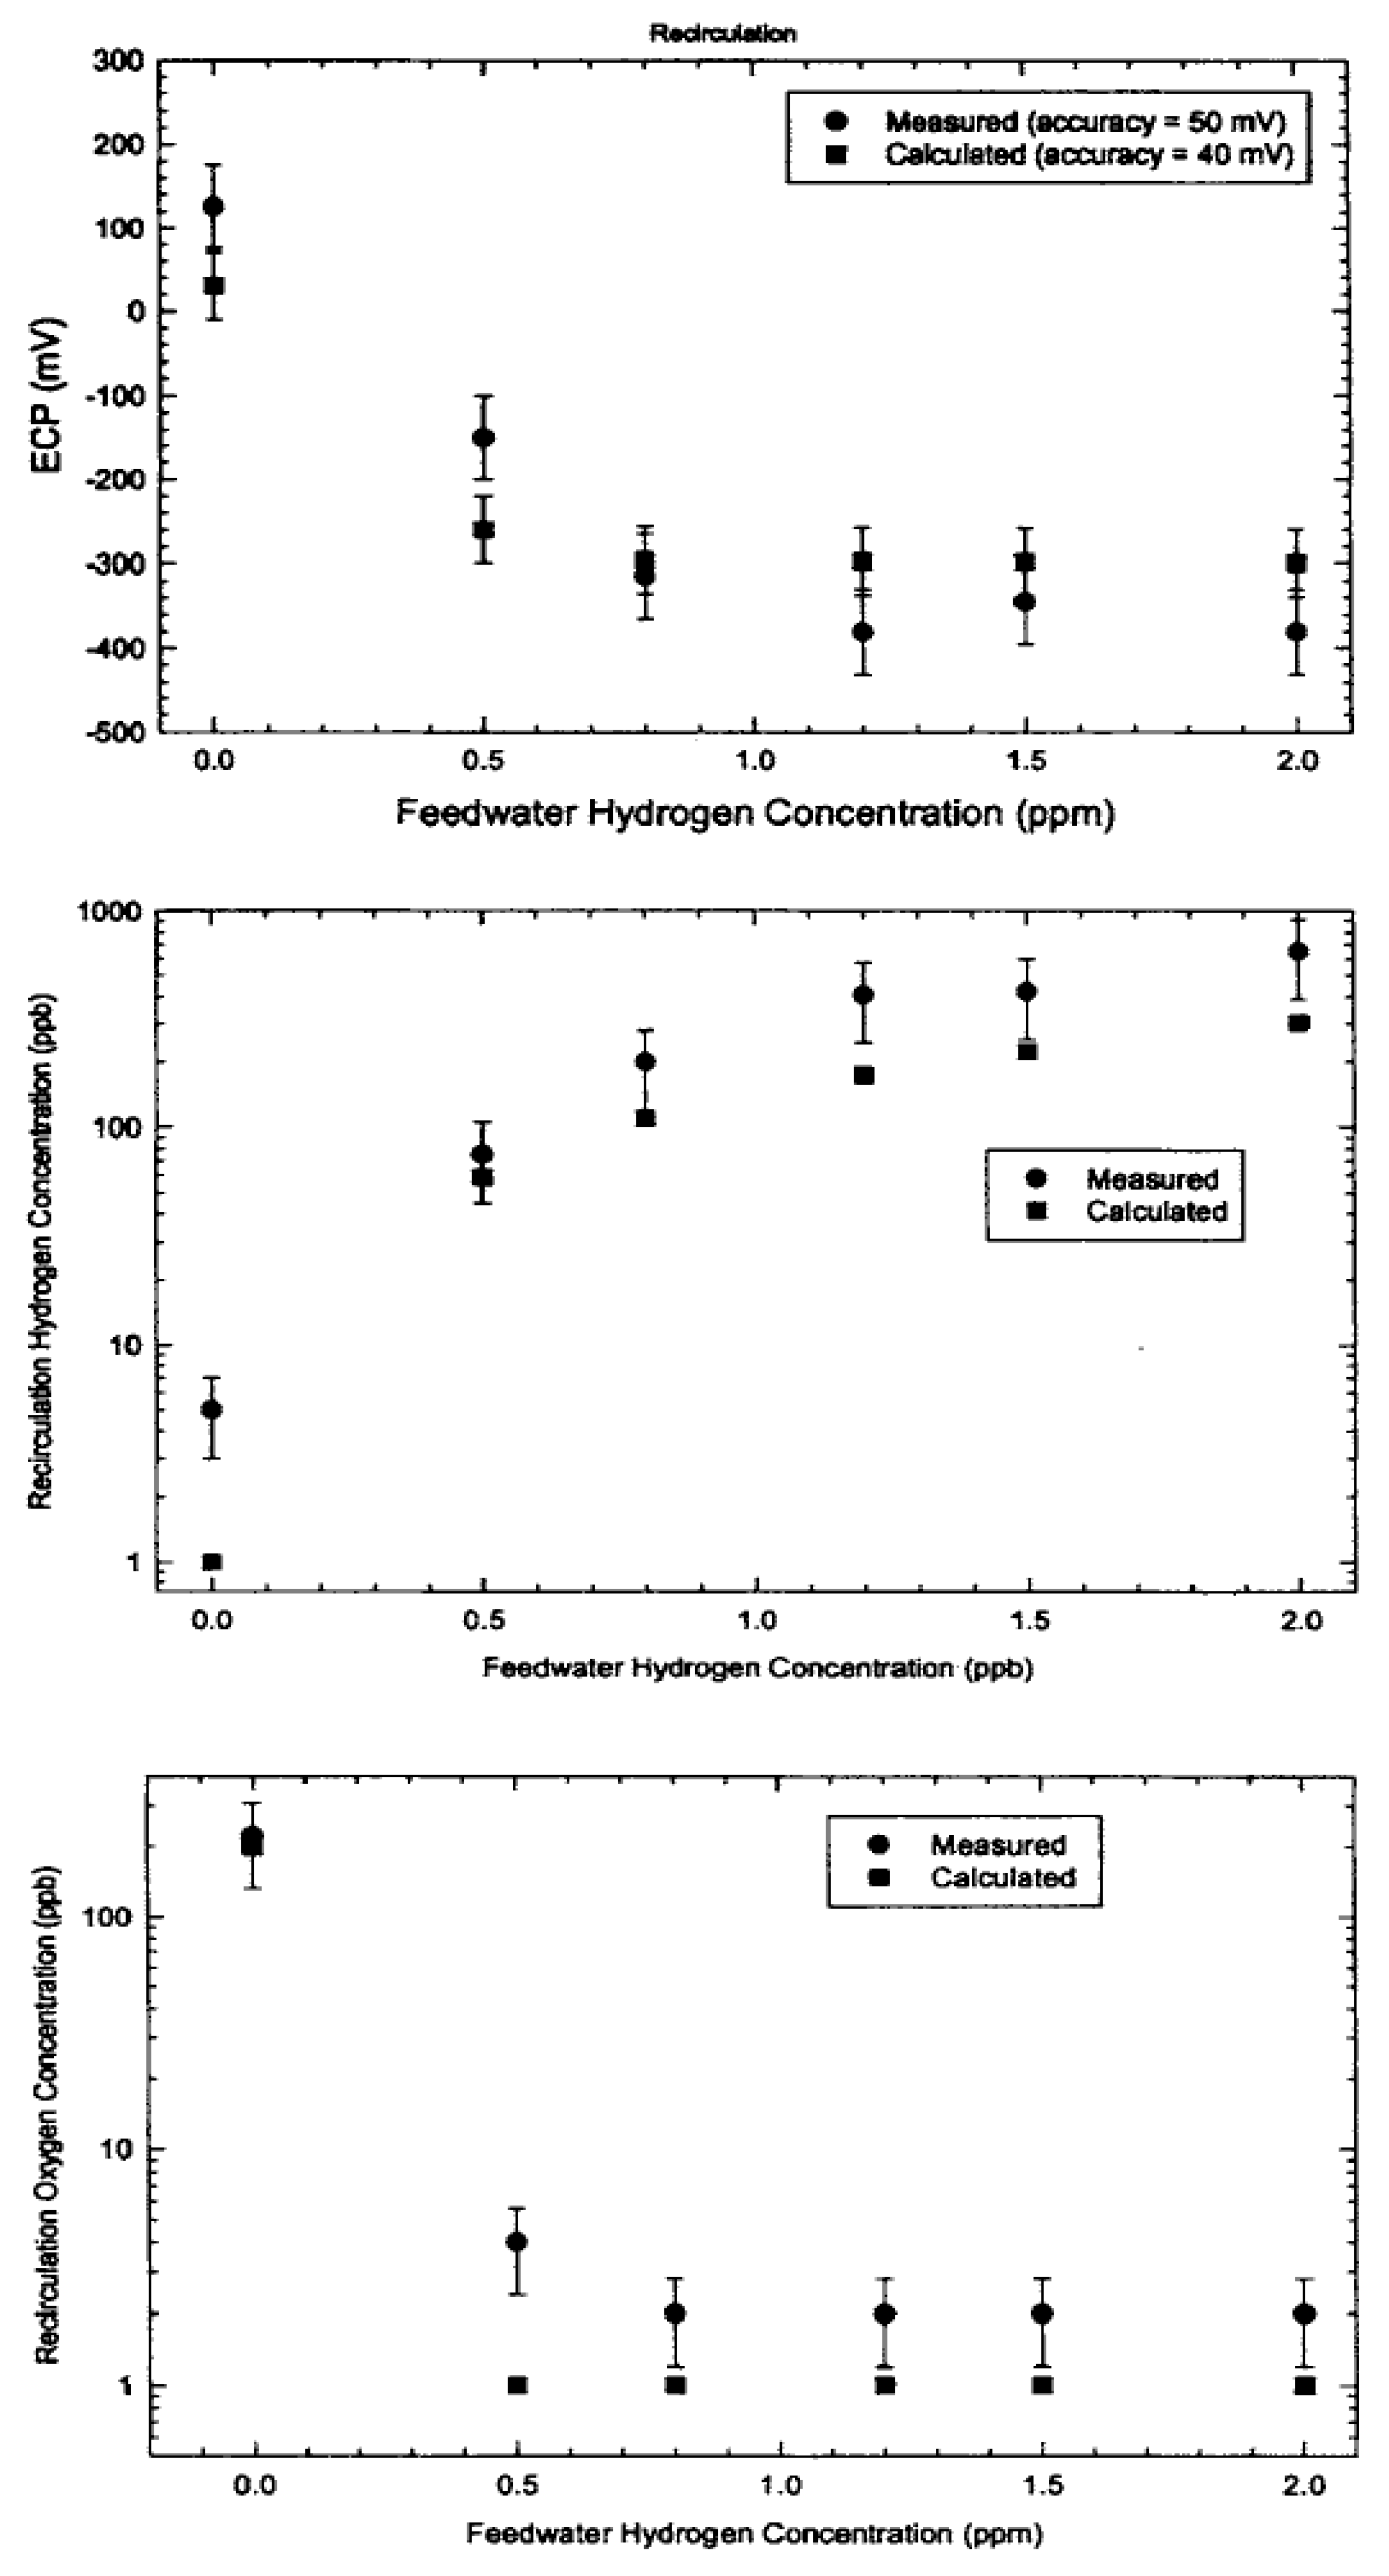
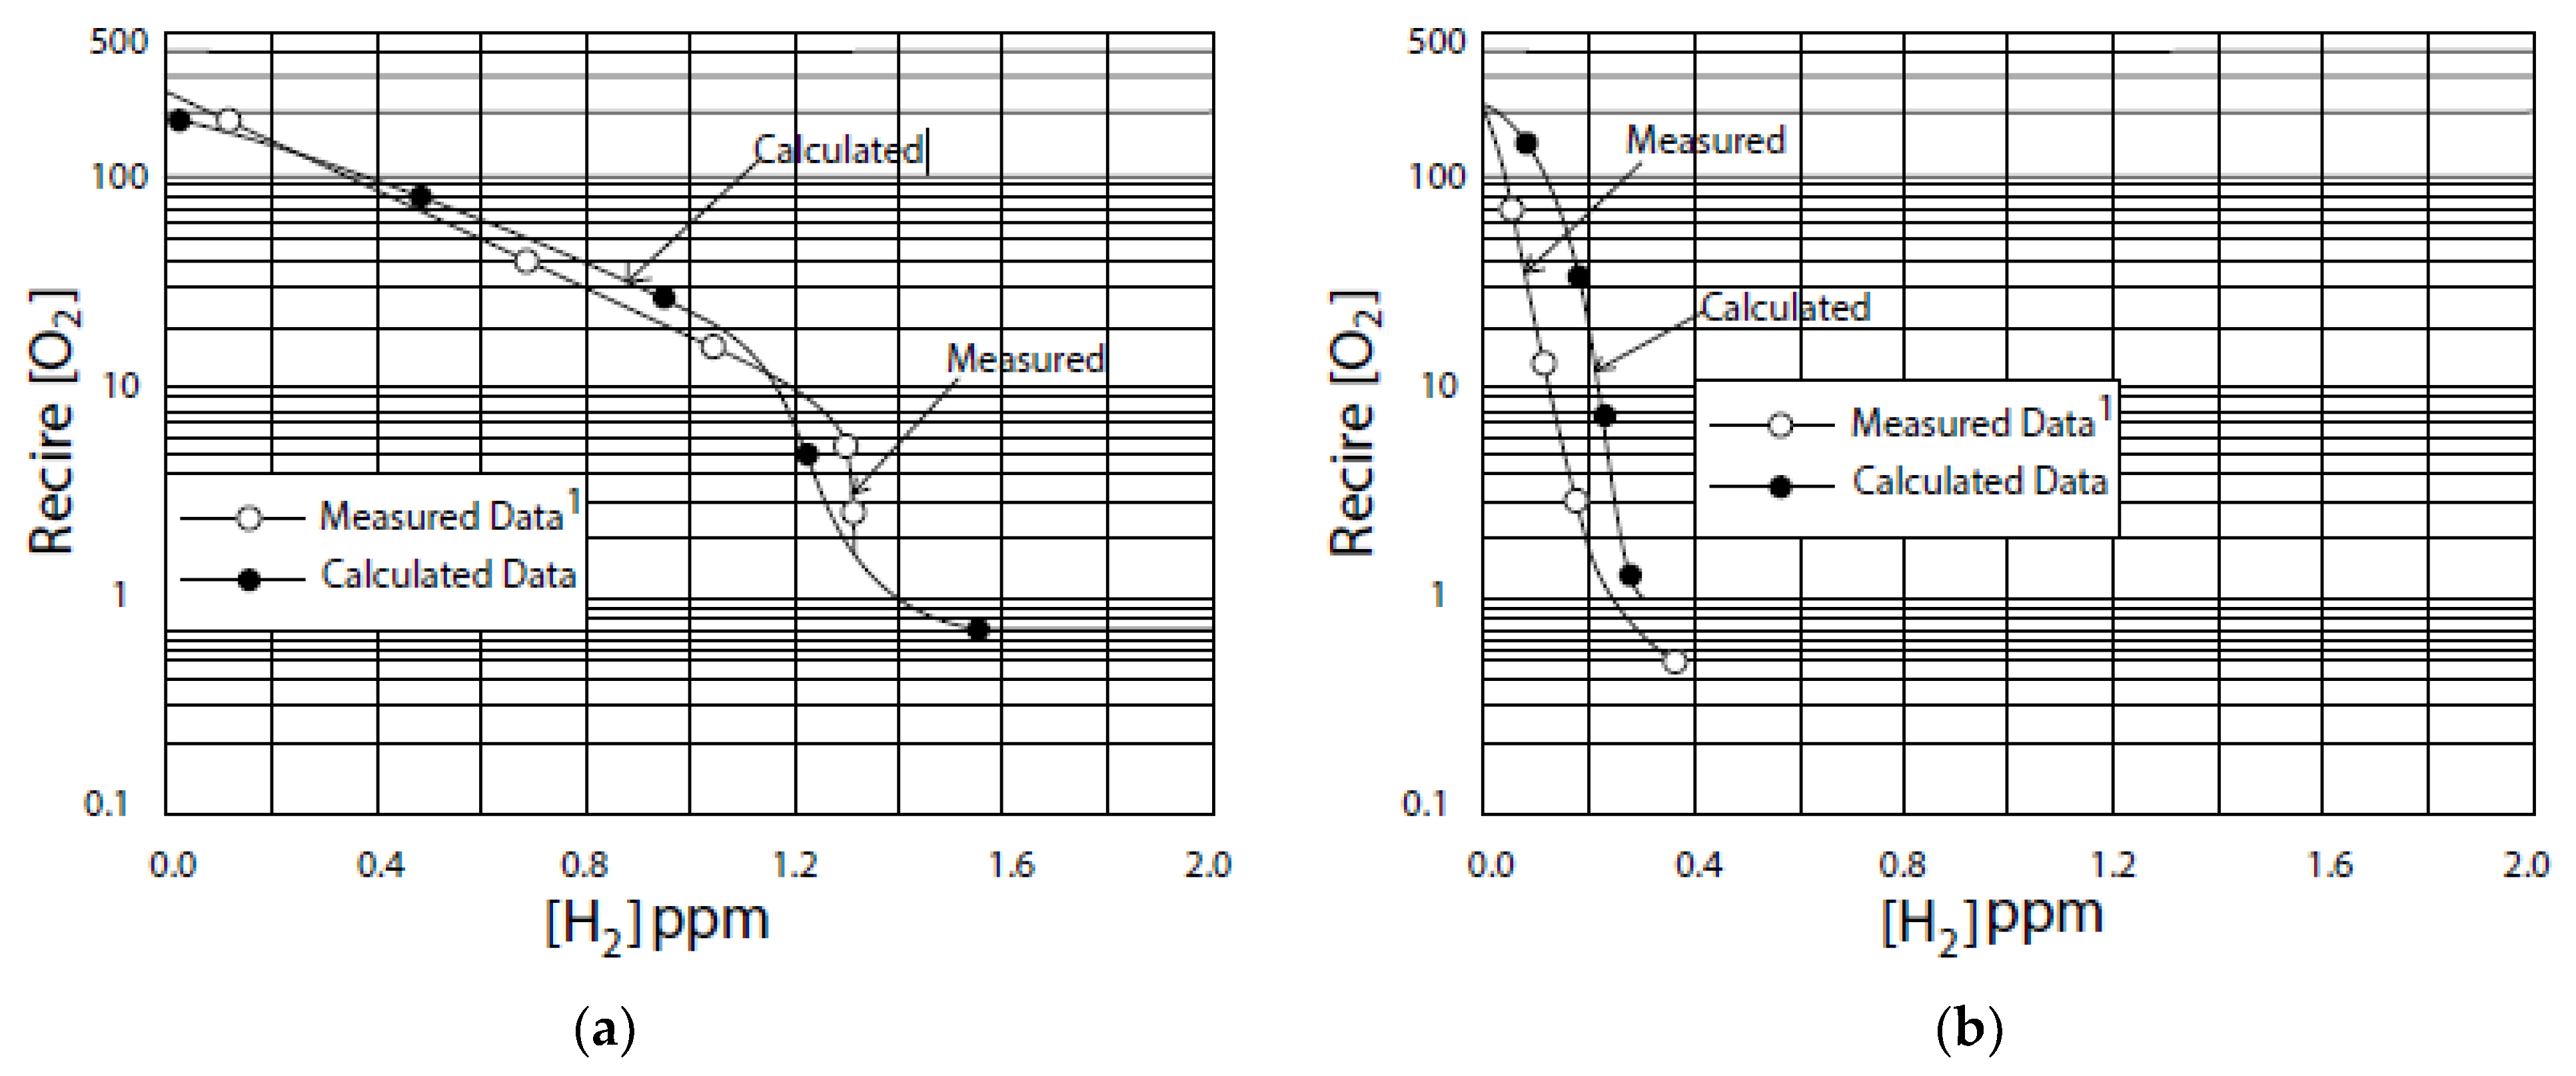
The calibration on Dresden-2 is shown in
Figure 17a, in which the calculated oxygen concentration is compared with the measured concentration in the recirculation system as a function of [H
2]
FW. As seen, good agreement is obtained demonstrating the procedure of modifying the rate constant for the thermal decomposition of H
2O
2 is effective. Without changing in other parameters, including the rate constant for H
2O
2 decomposition, the same comparison is shown for Duane Arnold in
Figure 17b. Again, excellent agreement is obtained. In both cases, the lower limit of [O
2] corresponds to the detection limit (1 ppb) of the oxygen measuring technique. The true [O
2] for high [H
2]
FW is orders of magnitude lower than indicated in the plots.
The two reactors, Dresden-2 and Duane Arnold are at the low and high extremes of the US BWR fleet, respectively, with respect to their response to HWC, as measured by the ECP in the recirculation piping autoclave. Thus, as shown in
Figure 17a, about 1.3 ppm of H
2 is required to “suppress radiolysis” as judged by [O
2] in the case of Dresden-2, whereas a little over 0.2 ppm is sufficient to achieve the same condition in Duane Arnold (
Figure 17b). Accordingly, Duane Arnold is much more sensitive to HWC than is Dresden-2. The difference has been traced to the residence time of the coolant.in the downcomer where radiolysis-catalyzed recombination between O
2 and H
2 occurs with the recombination being more effective in the case of Duane Arnold, with its lager residence time in the downcomer than in the case of Dresden-2, which has a shorter residence time, but other factors may also be at play.
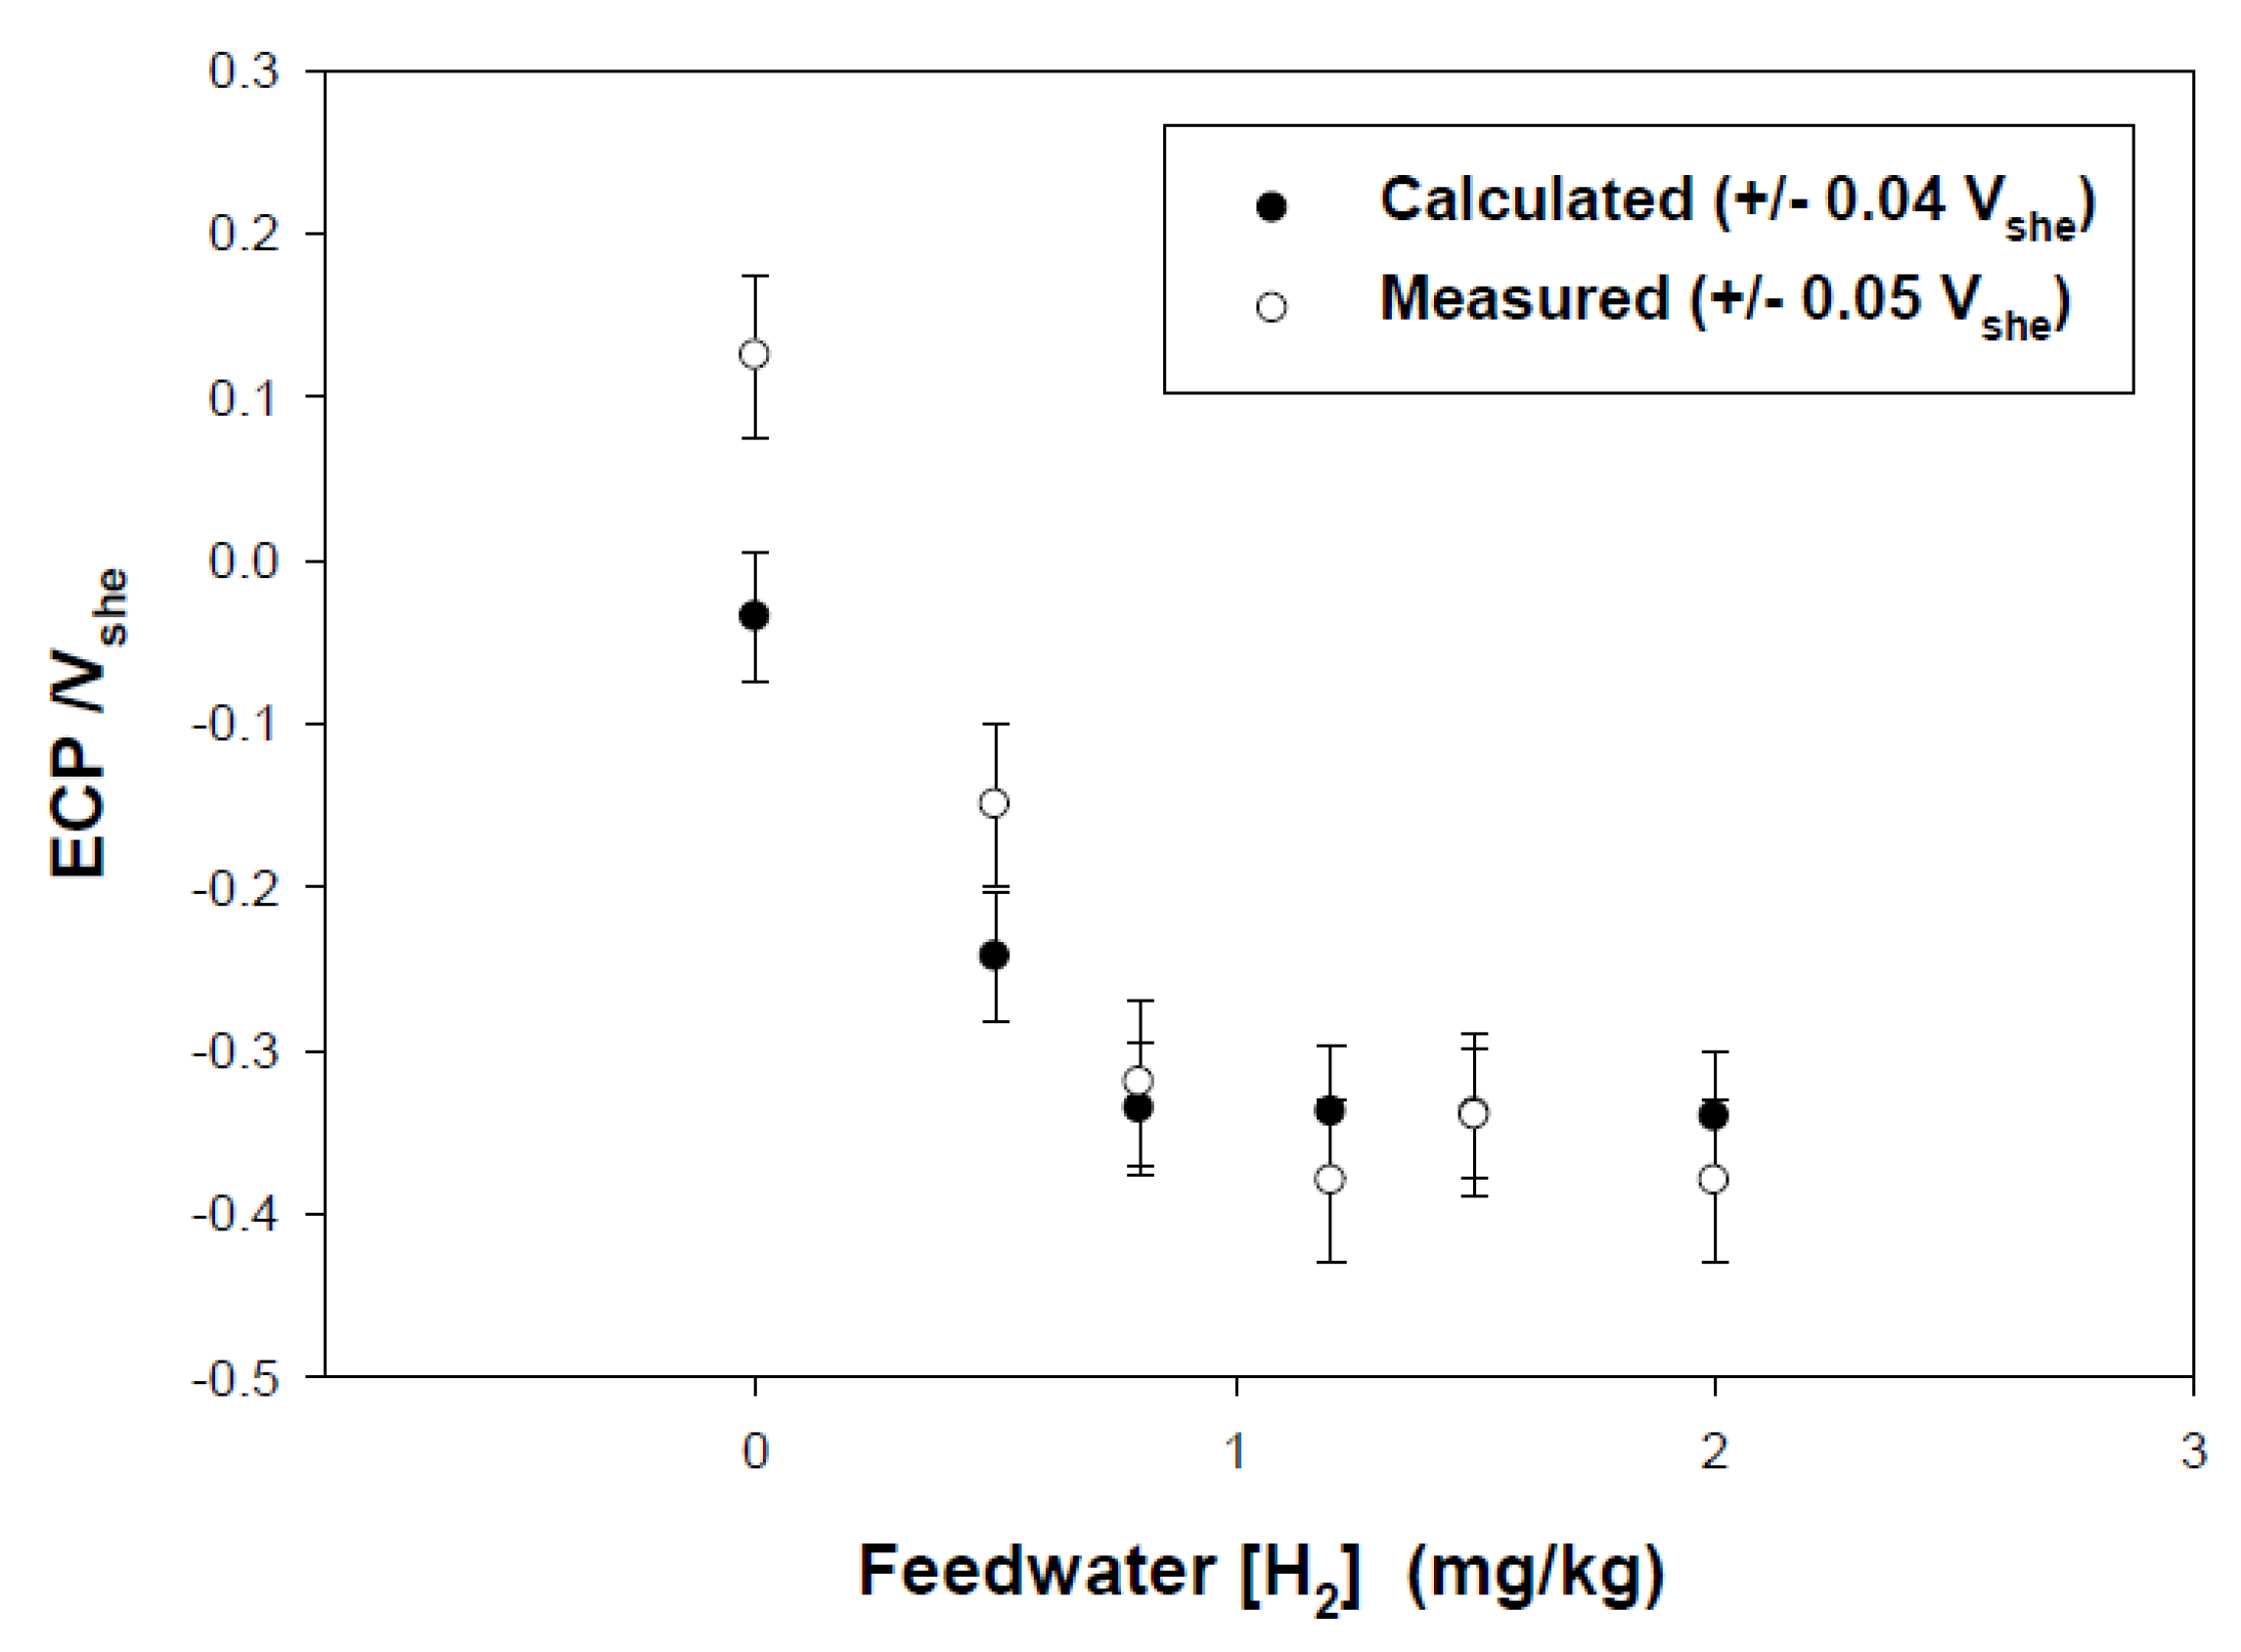
The accuracy with which [O
2], [H
2], and ECP can be calculated may be judged by the comparison of the calculated and measured values for these quantities in an autoclave valved into the recirculation piping in the Leibstadt BWR in Switzerland (
Figure 18) [
21]. One sees that the two sets of data agree very well, even though the exact hydrodynamic conditions in the autoclave were not known with certainty. Values for the measured [O
2] of around 1 ppb reflect the detection limit of the measuring instrument and this limit was adopted for the calculated values even though the calculation yielded values for [O
2] that are orders of magnitude lower than those indicated in
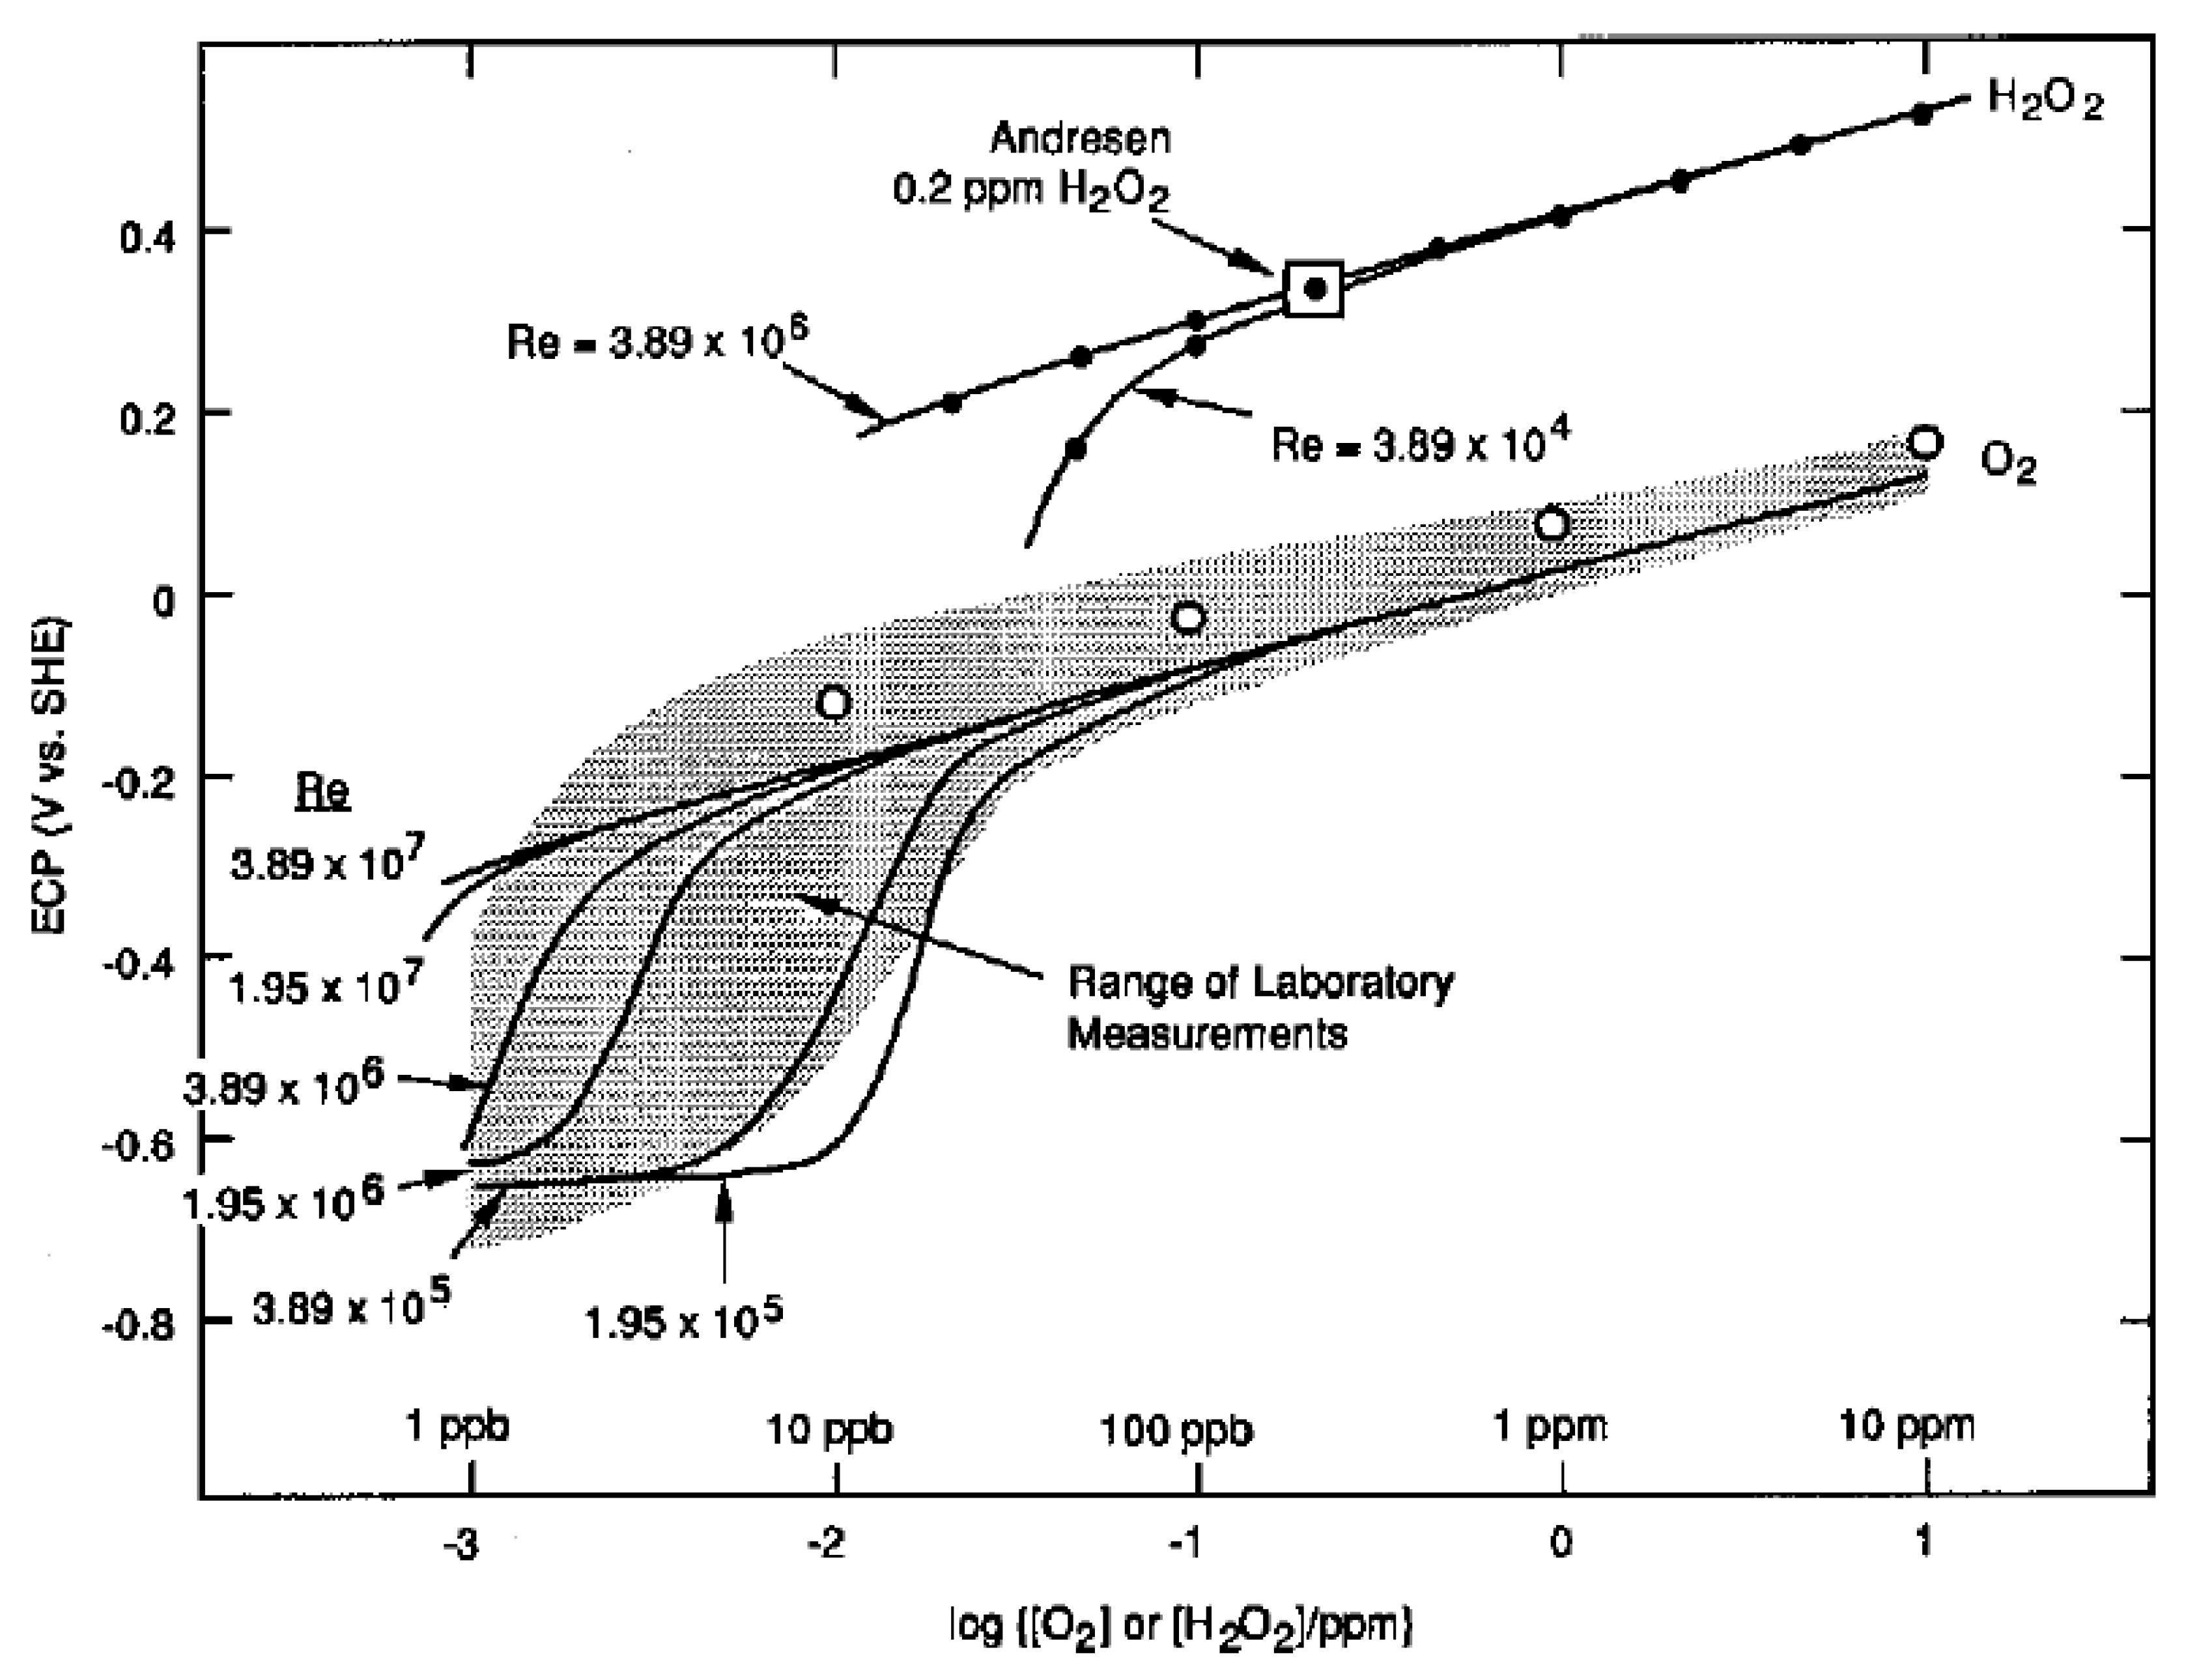
Figure 18. As is evident from the discussion elsewhere in this review (
Figure 4), oxygen levels below about 1 ppb have little impact on the ECP at the low Reynolds numbers that characterize low flow rate autoclaves.
In the late 1990s, DAMAGE PREDICTOR was upgraded successively into two more advanced codes named REMAIN and ALERT [
60,
61,
62,
63,
64] and more recently to BWR_Master [
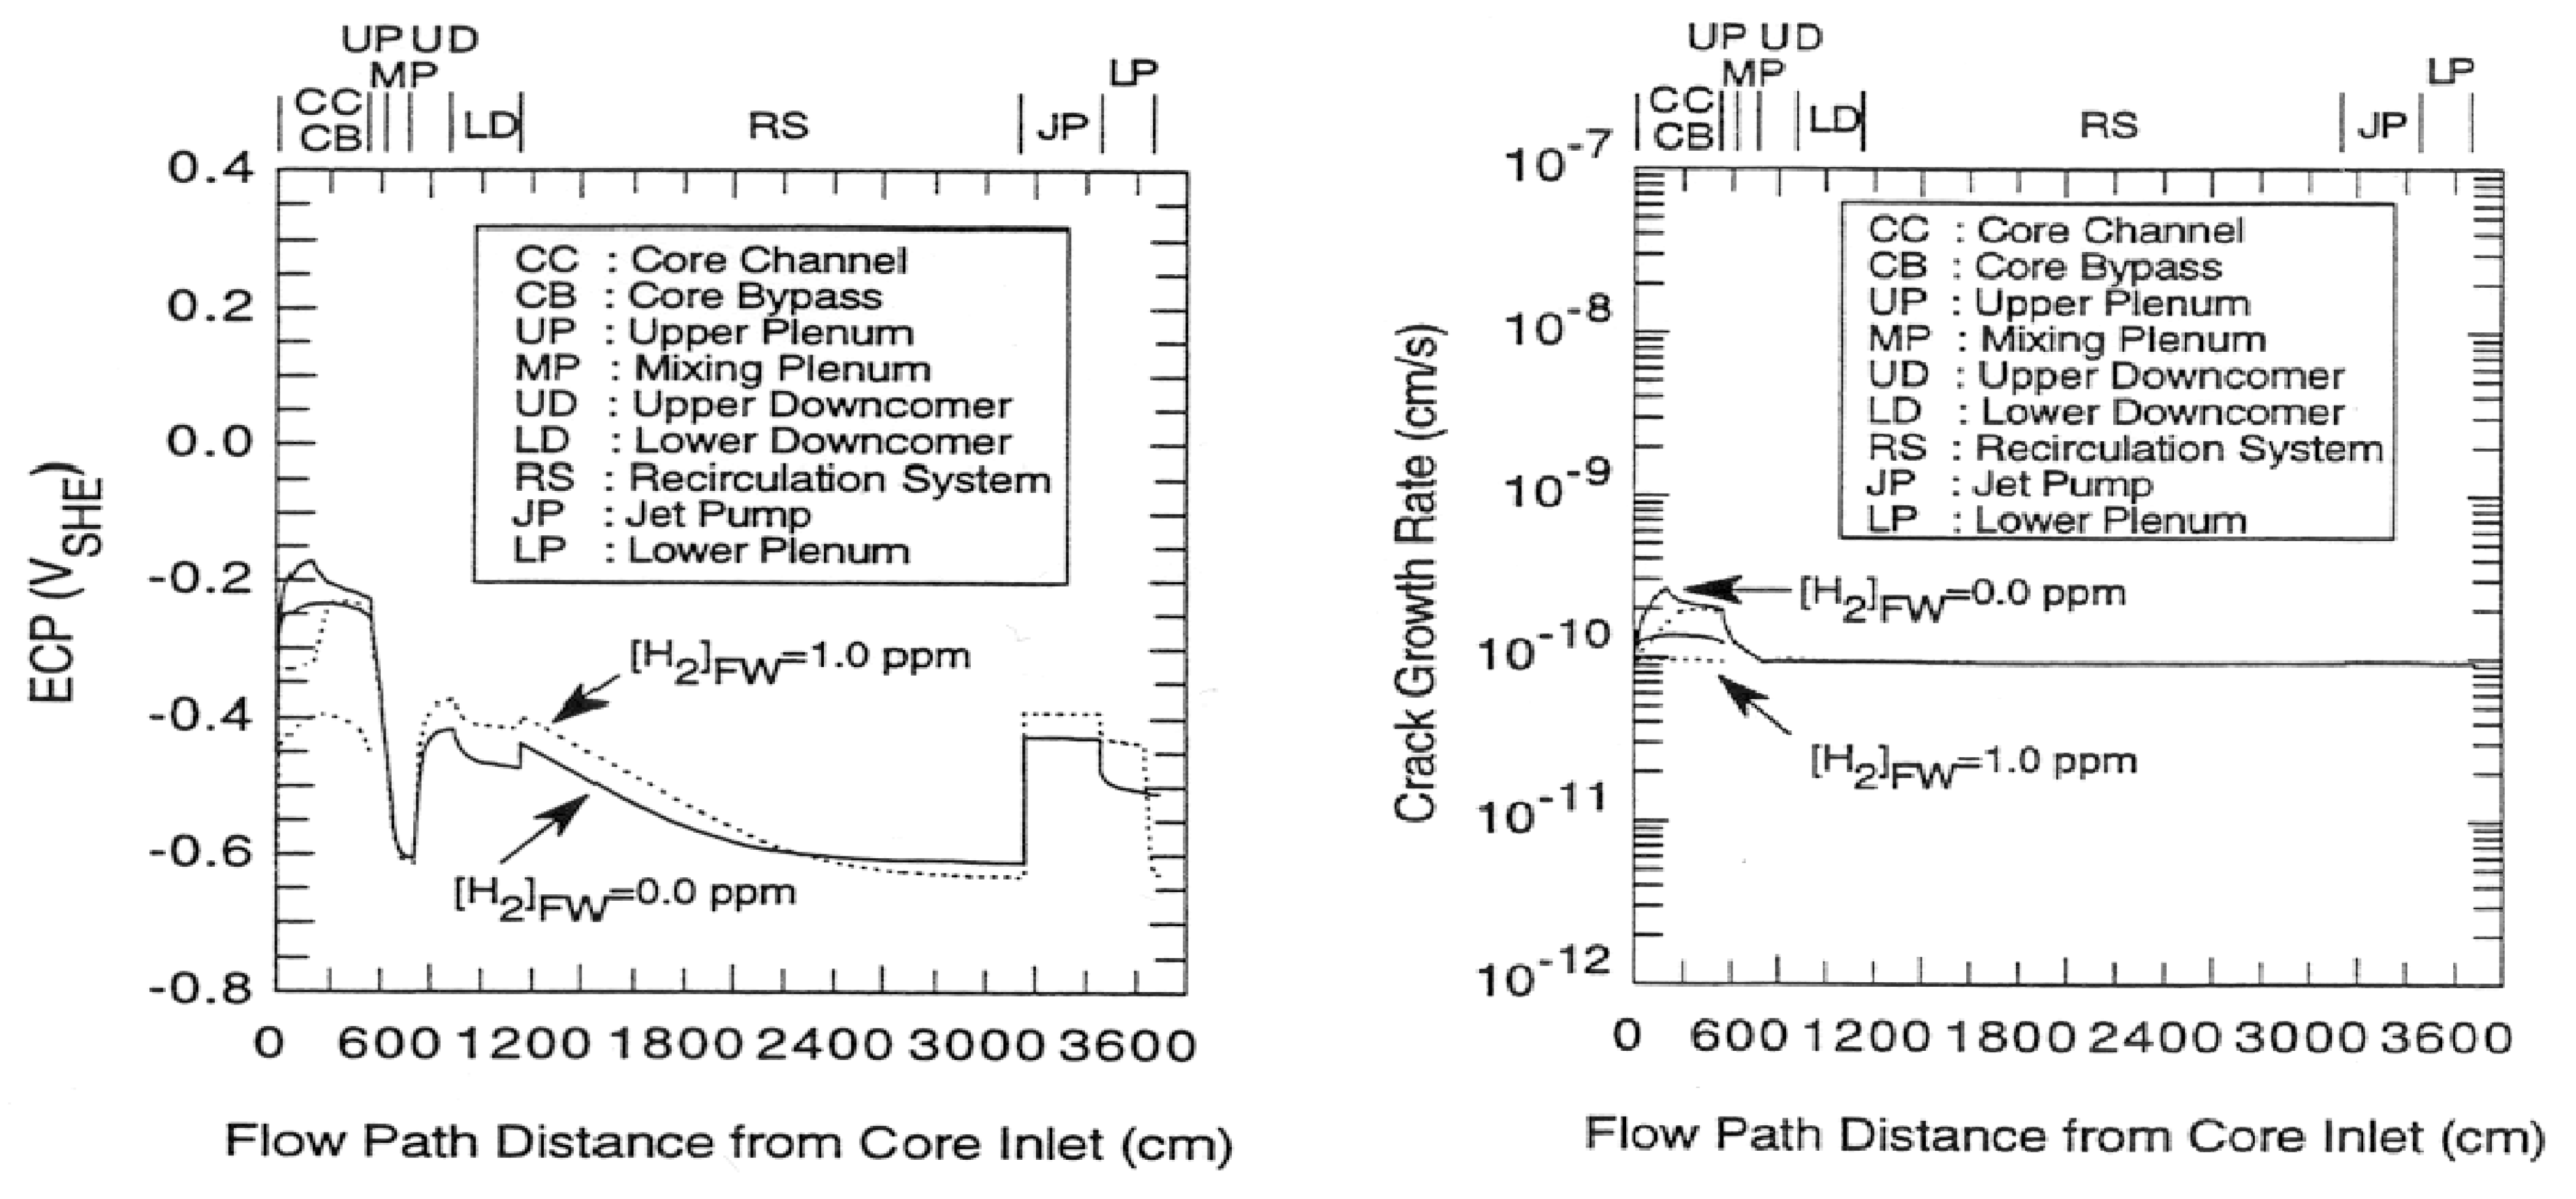
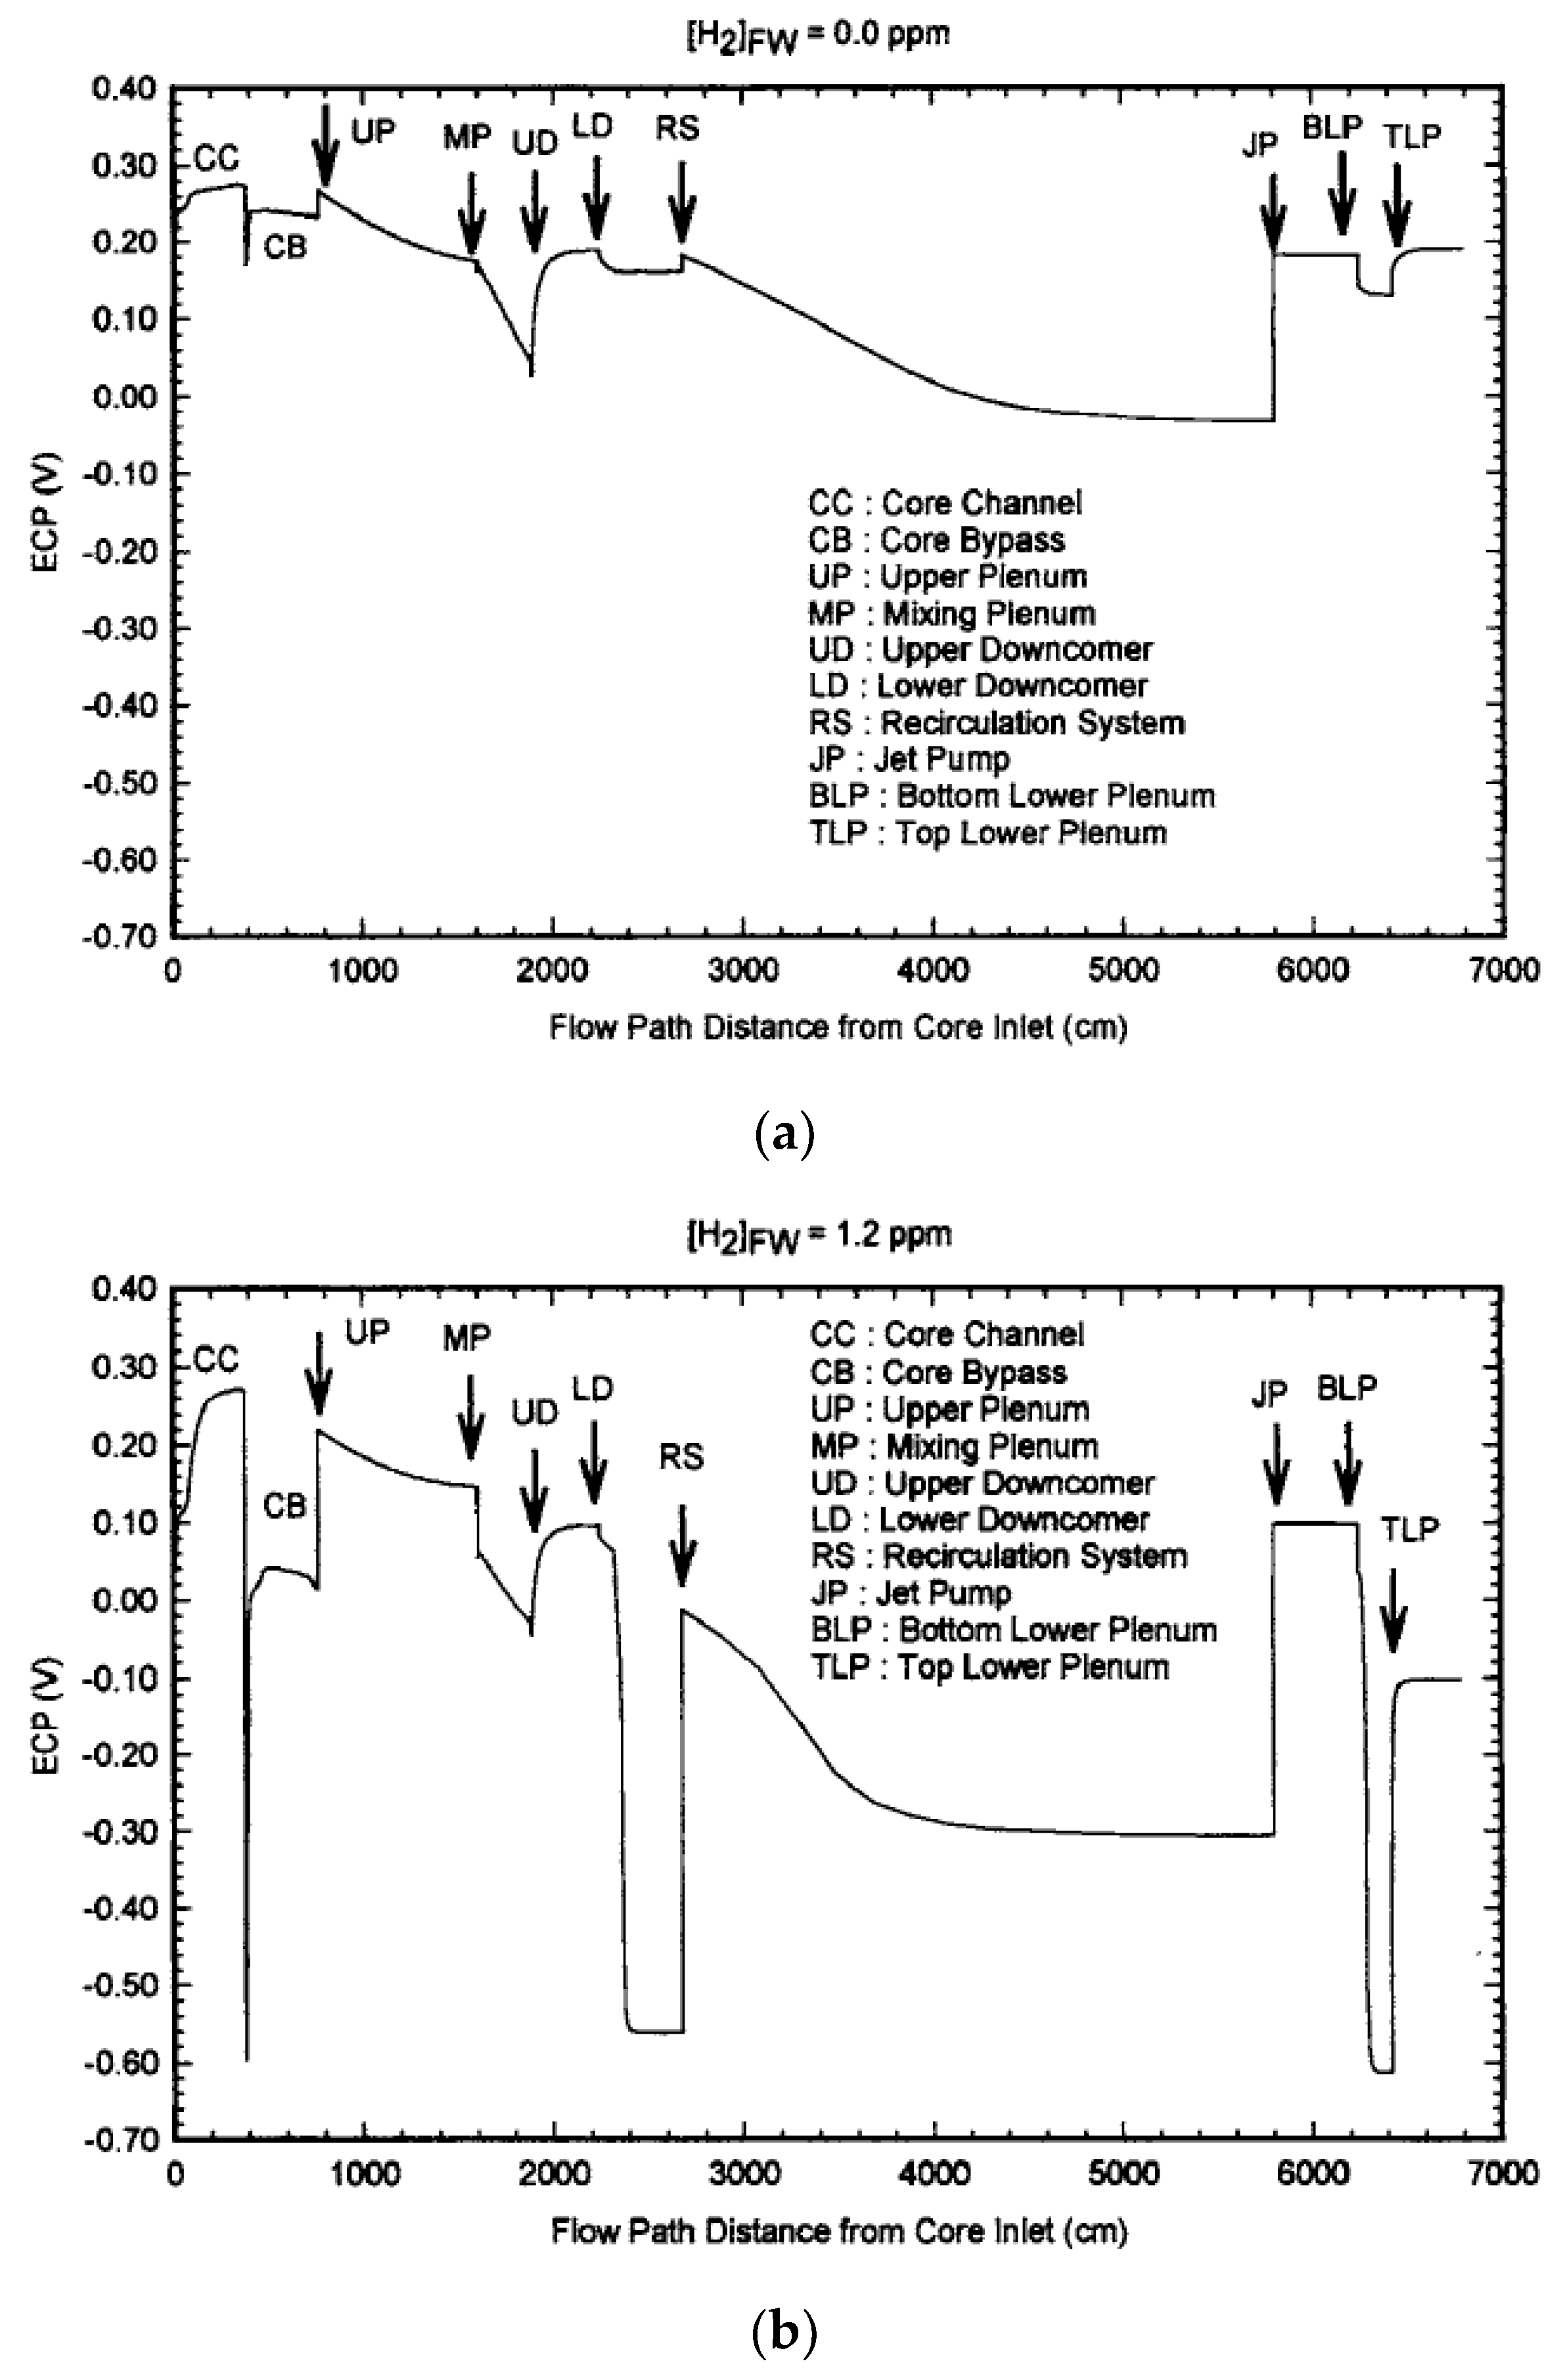
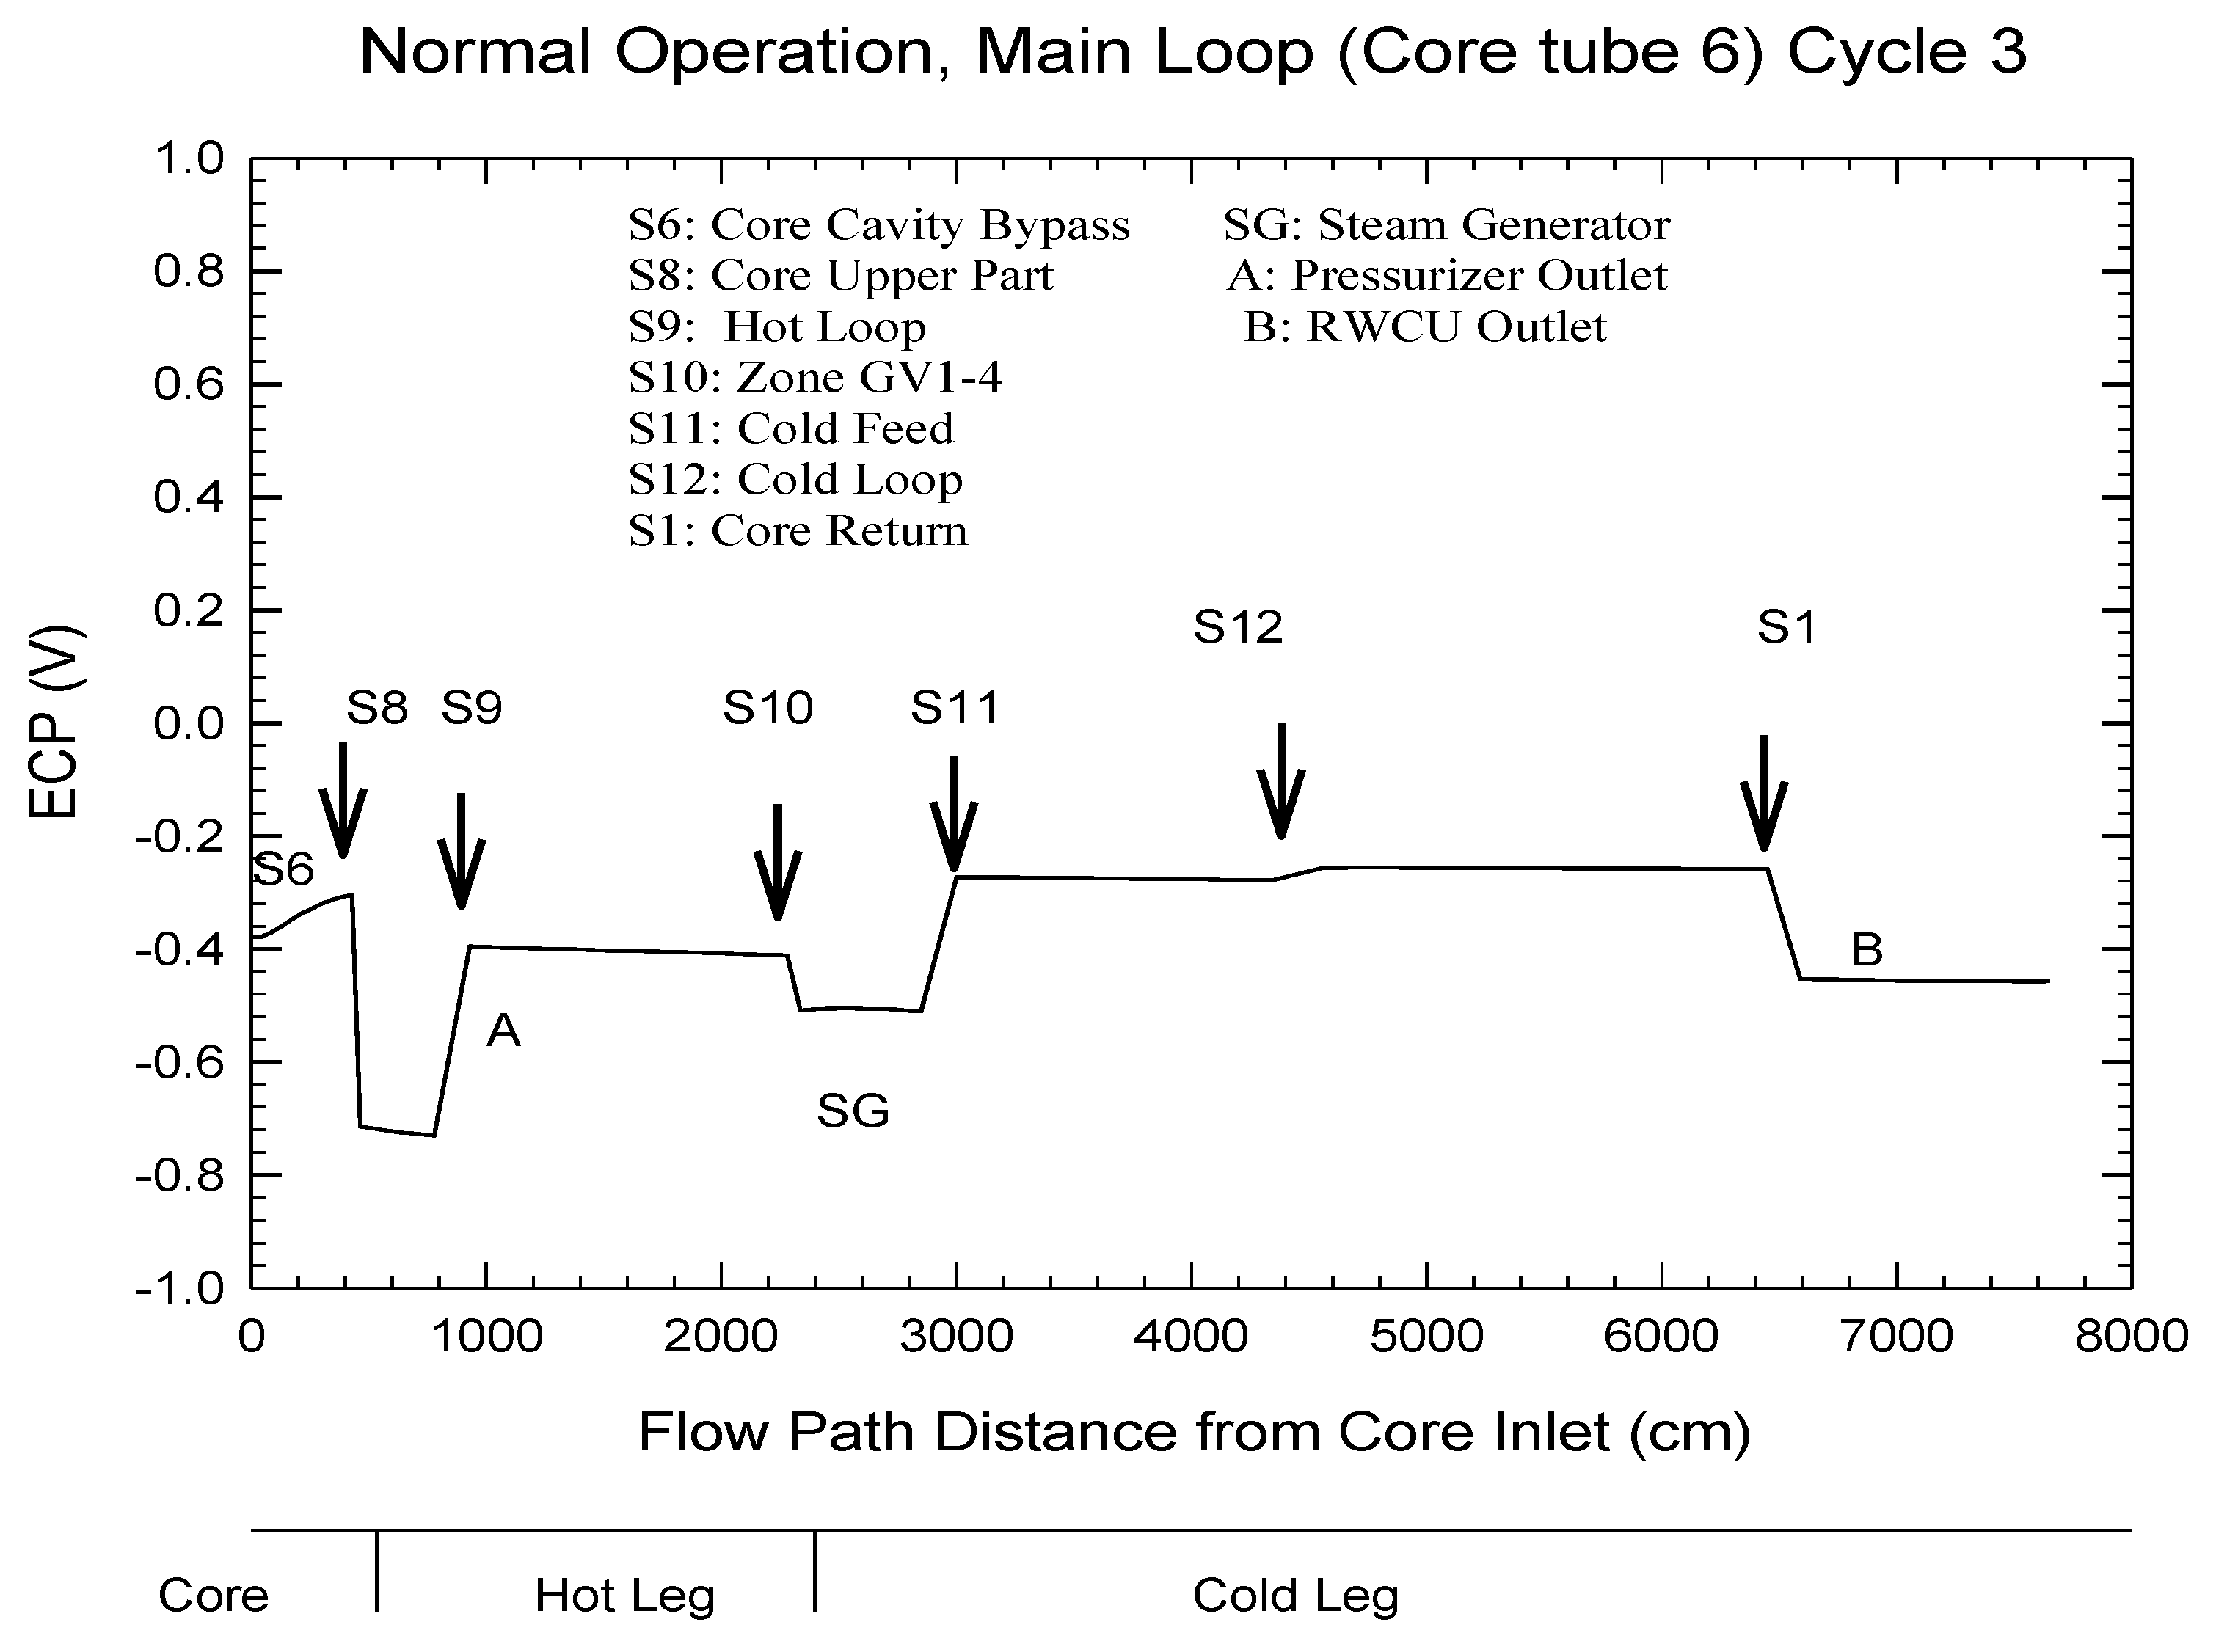
14]. These improved codes employ much more efficient and faster methods for solving the 13 simultaneous, stiff, first order differential equations for calculating the concentrations of radiolysis products around the PHTS and were specifically developed for BWRs that had internal coolant pumps, such as Leibstadt in Switzerland and the BWRs in Sweden and Germany. The calculated ECP around the PHTS of the Leibstadt BWR under NWC conditions ([H
2]
FW = 0) and HWC ([H
2]
FW = 1.2 ppm) is displayed in
Figure 19a,b, respectively [
21].
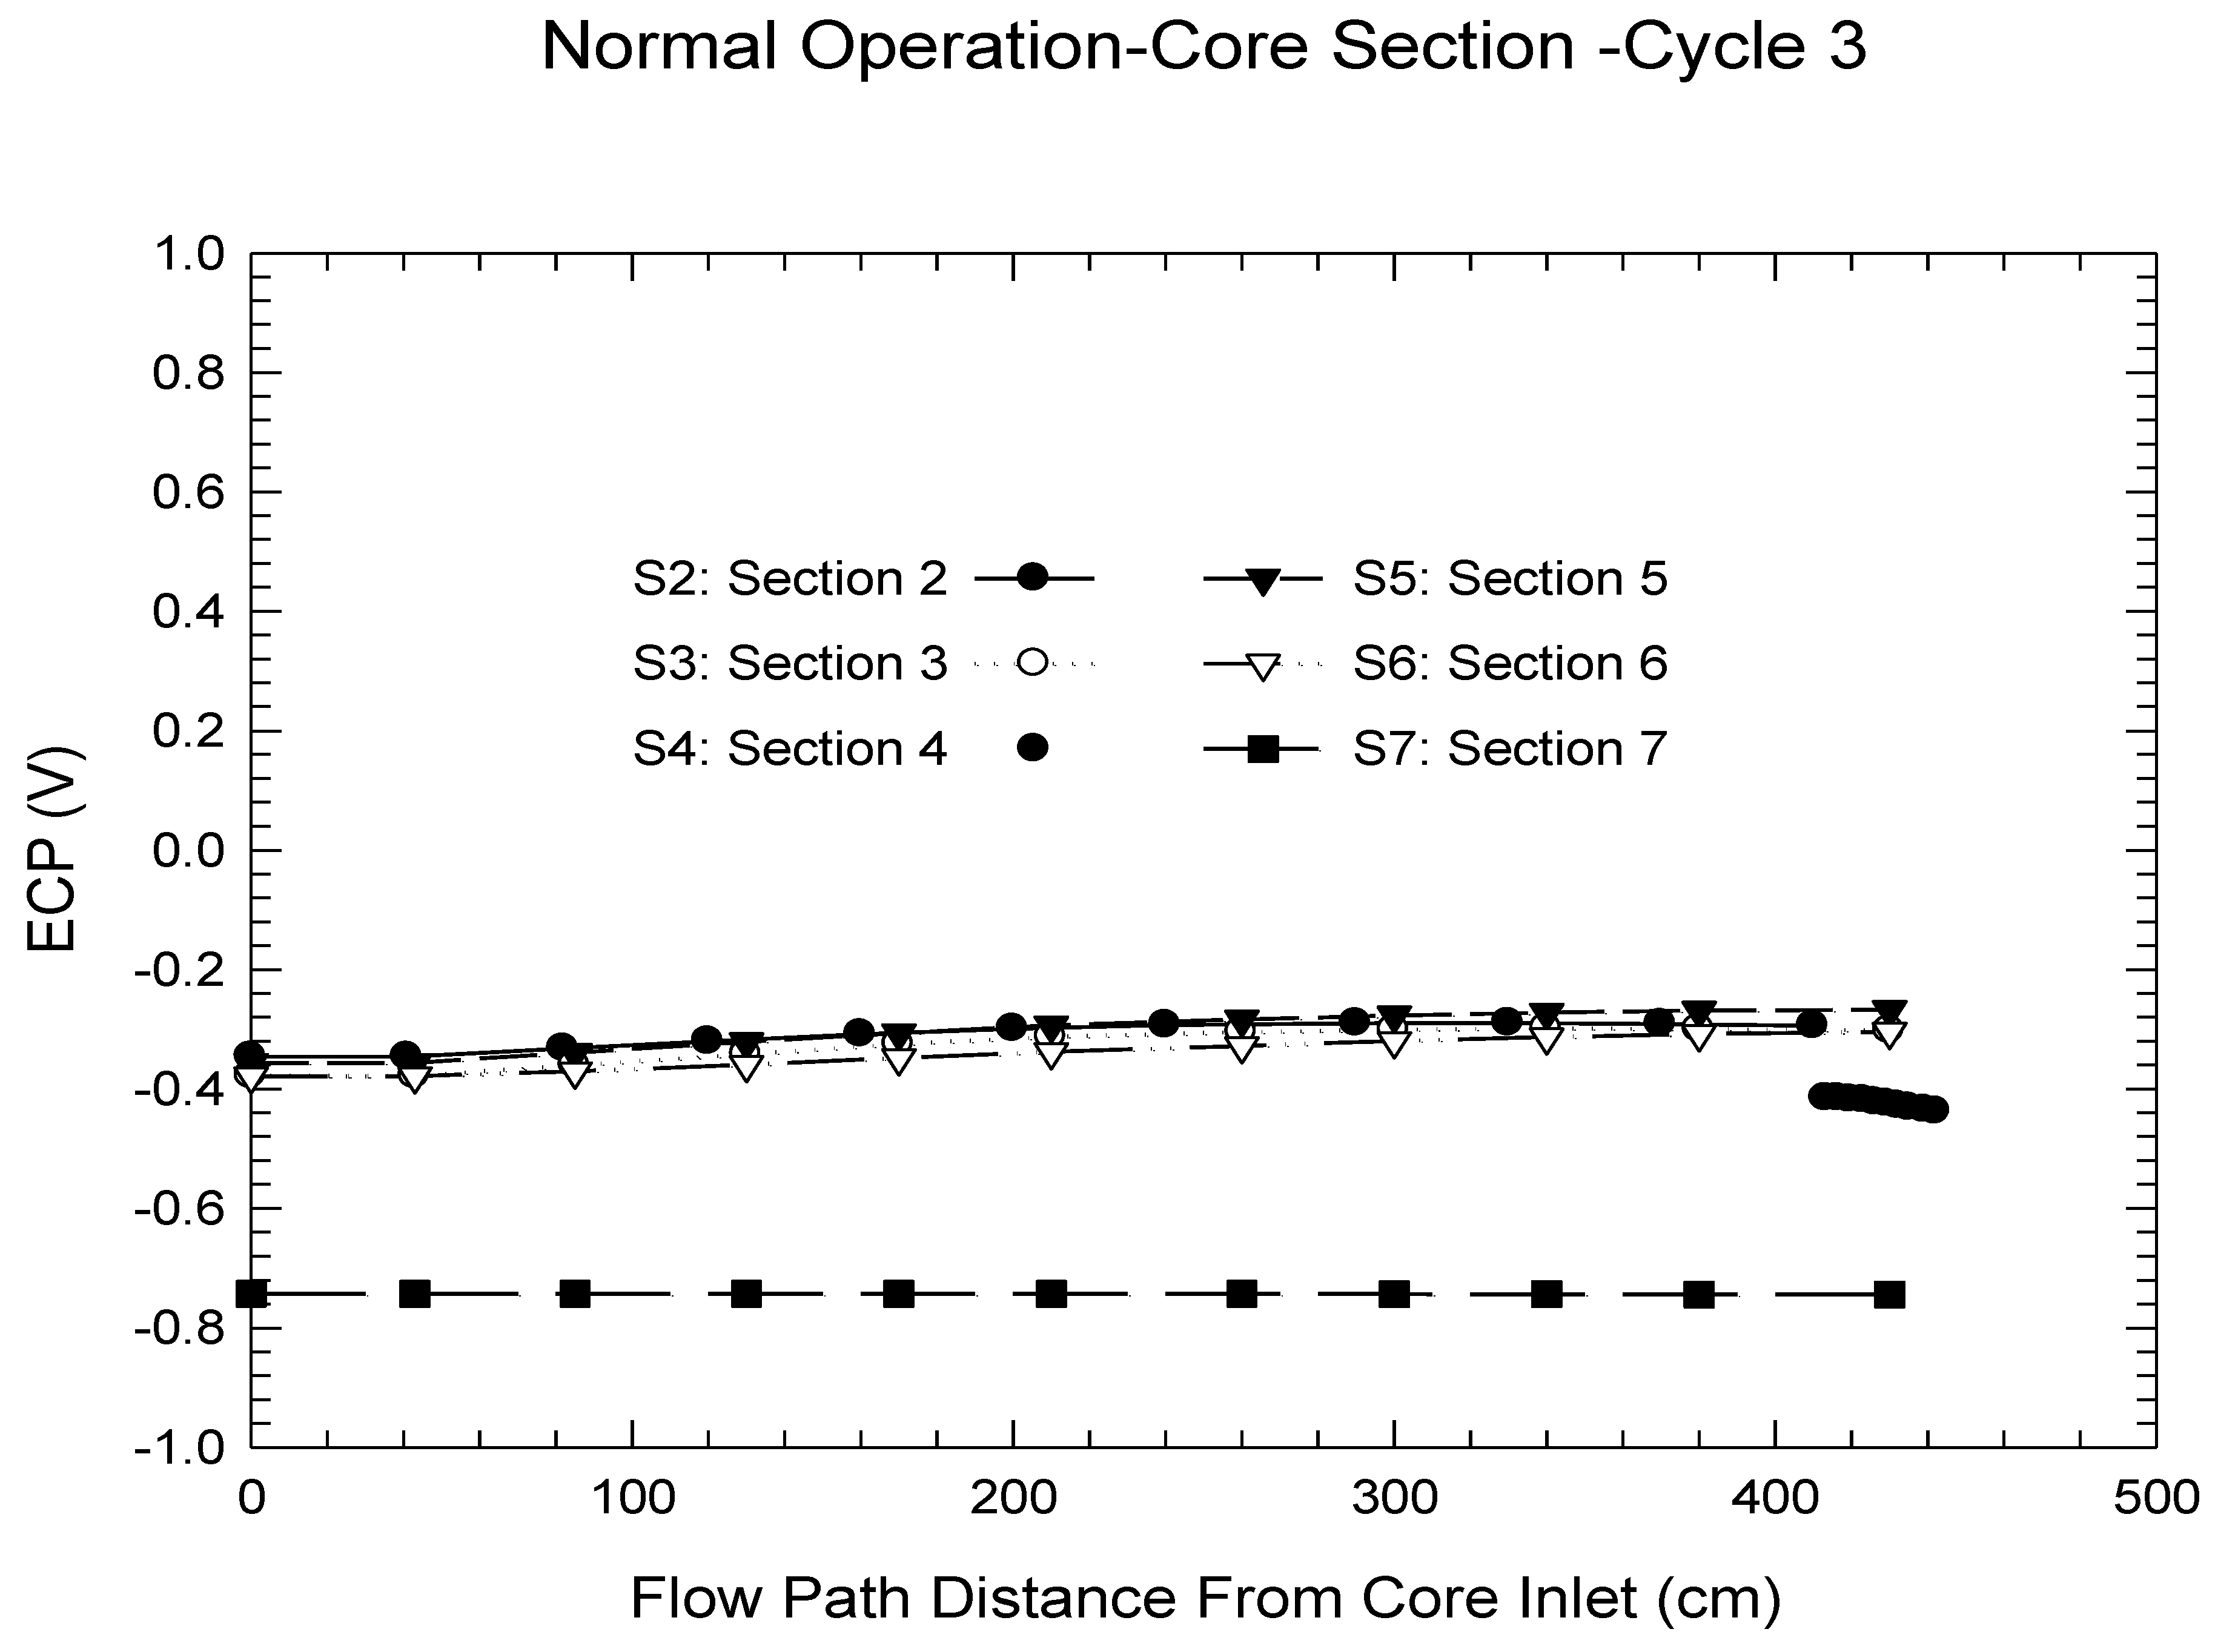
As seen, the ECP is predicted to vary significantly around the entire PHTS with the highest values being predicted for the regions experiencing the greatest radiolysis (core channels and upper plenum). An important finding was that no point in the PHTS had an ECP that was more negative than Ecrit = −0.23 Vshe; the value that had been sanctioned by the NRC as the critical potential for IGSCC in sensitized Type 304 SS. Thus, the entire PHTS in this reactor is in a spontaneous state of cracking and the most likely reason that crack was not more severe than had been observed is that the initiation time is very long and/or the stresses are lower than those used in defining the “standard crack”.
With the addition of 1.2 ppm of hydrogen to the feedwater, however, the ECP for many components is displaced below −0.23 V
she, as depicted in
Figure 17b. Thus, much of the recirculation system, the bottom of the lower plenum, and the lower reaches of the downcomer are protected by this level of HWC, but the core channels, much of the core bypass, the upper and mixing plenums, the upper downcomer, the top of the lower downcomer, the entrance of the recirculation system, the jet pumps, and the top of the downcomer, and the top of the lower plenum are not be protected. This led one of the present authors (DDM) in 1992 to question the viability of HWC in protecting the PHTS of BWRS, particularly, the RPV internal components [
10]; a question for which he was loudly criticized by a vendor but which, in retrospect, was justified. In particular, the subsequent, extensive occurrence of IGSCC in the internal components of BWRs worldwide vindicated this position.
Because of the exponential relationship between CGR and ECP, it is expected that the variation of log(CGR) for a 0.5 cm long standard crack loaded to a stress intensity factor of
KI = 27.5 MPa.m
1/2 as a function of distance around the PHTS would mirror than of the ECP and this is found to be the case as shown by comparing
Figure 19 and
Figure 20. A “standard crack” was defined, because, as we see above, the CGR is a function of the electrochemical crack length (ECL) at constant
KI and is a function of
KI for constant ECL. It is also a function of the degree of sensitization (DoS) of the steel as well as the neutron fluence (“Irradiation-Assisted Stress Corrosion Cracking”, IASCC) [
41]. In an actual reactor, cracks may exist that possess wide ranges in ECL and
KI depending on when they nucleated (i.e., on the growth time), the local ECP and stress, so that it becomes an almost impossible task to fully and accurately describe the state of IGSCC in a reactor PHTS at any given moment without a major computational effort and a viable model for calculating the initiation time. The definition of a “standard crack” appears to be the best compromise.
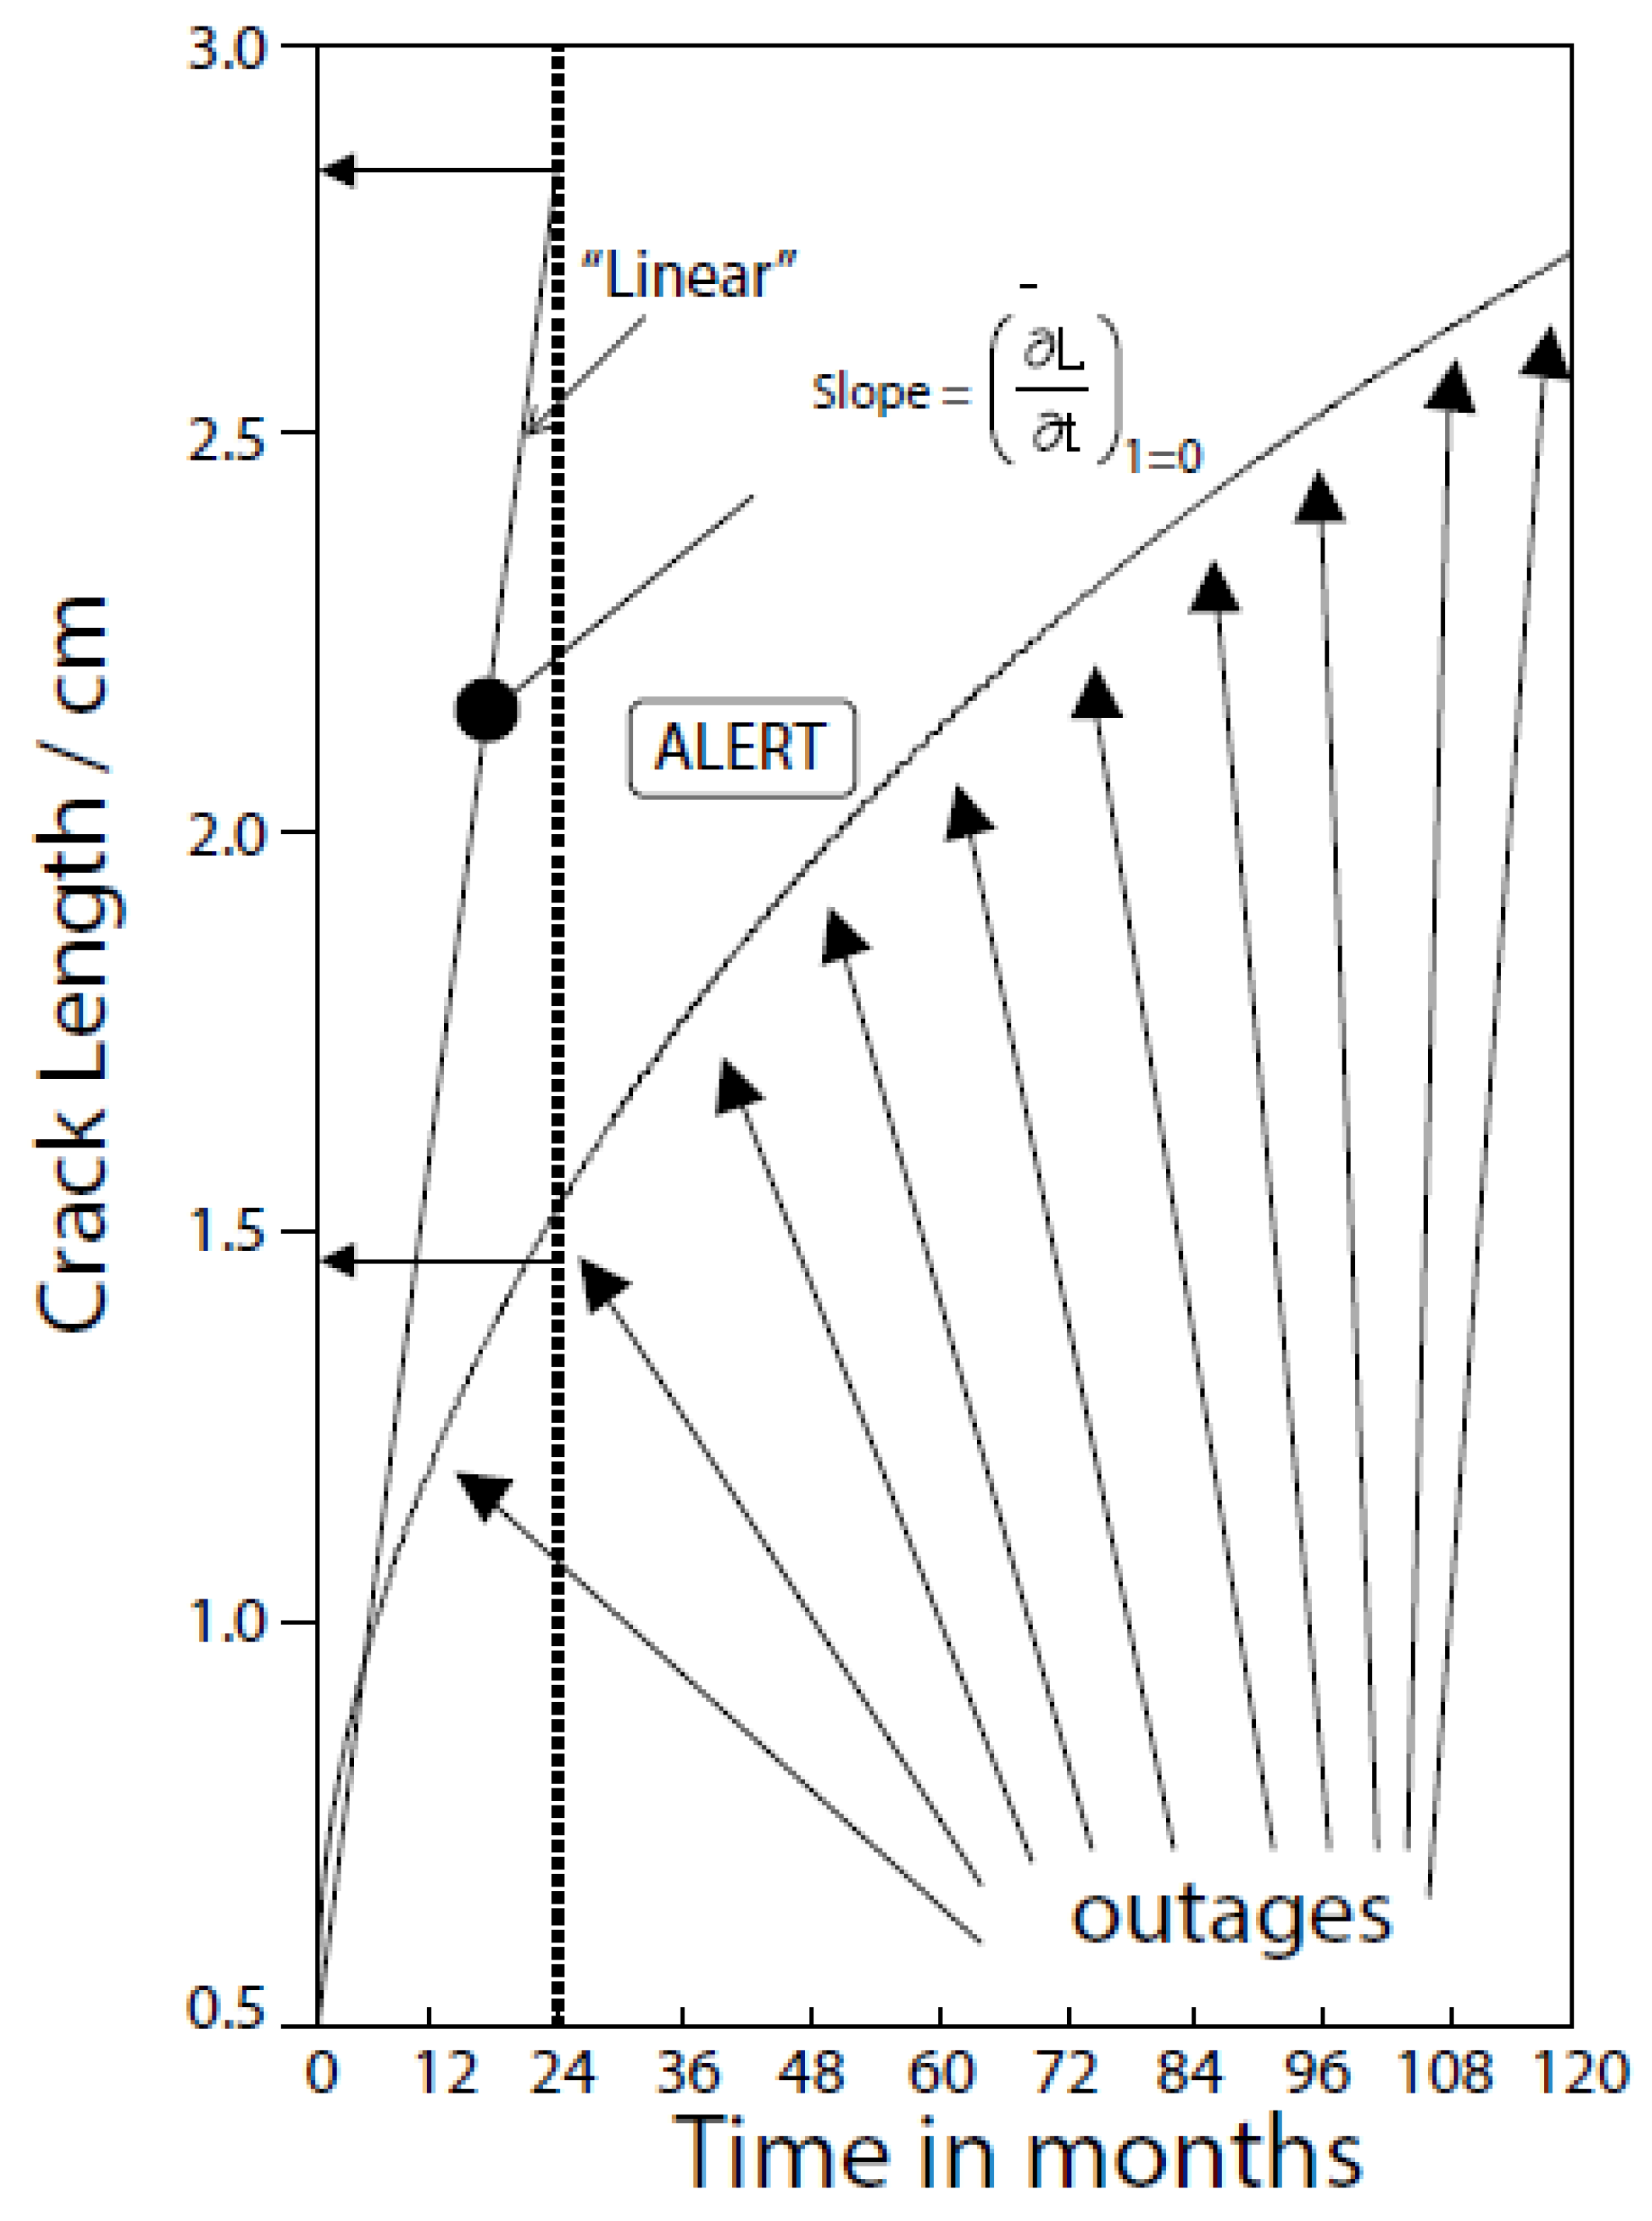
The importance of the effect of ECL on the prediction of CGR is illustrated in
Figure 21 for crack adjacent to the H3 weld in a BWR core shroud. Thus, if no dependence of CGR on ECL was recognized (the “linear” case), crack extension to 2.8 cm would have occurred in 24 months whereas it would take more than 120 months for the crack to extend to that depth if the impact of the ECL on CGR is recognized, as in the case of the CEFM [
23]. In other words, a model that did not recognize the dependence of the CGR on the ECL would greatly over predict the rate of damage accumulation and possibly trigger further inspection and unscheduled maintenance when, in fact, none was called for.
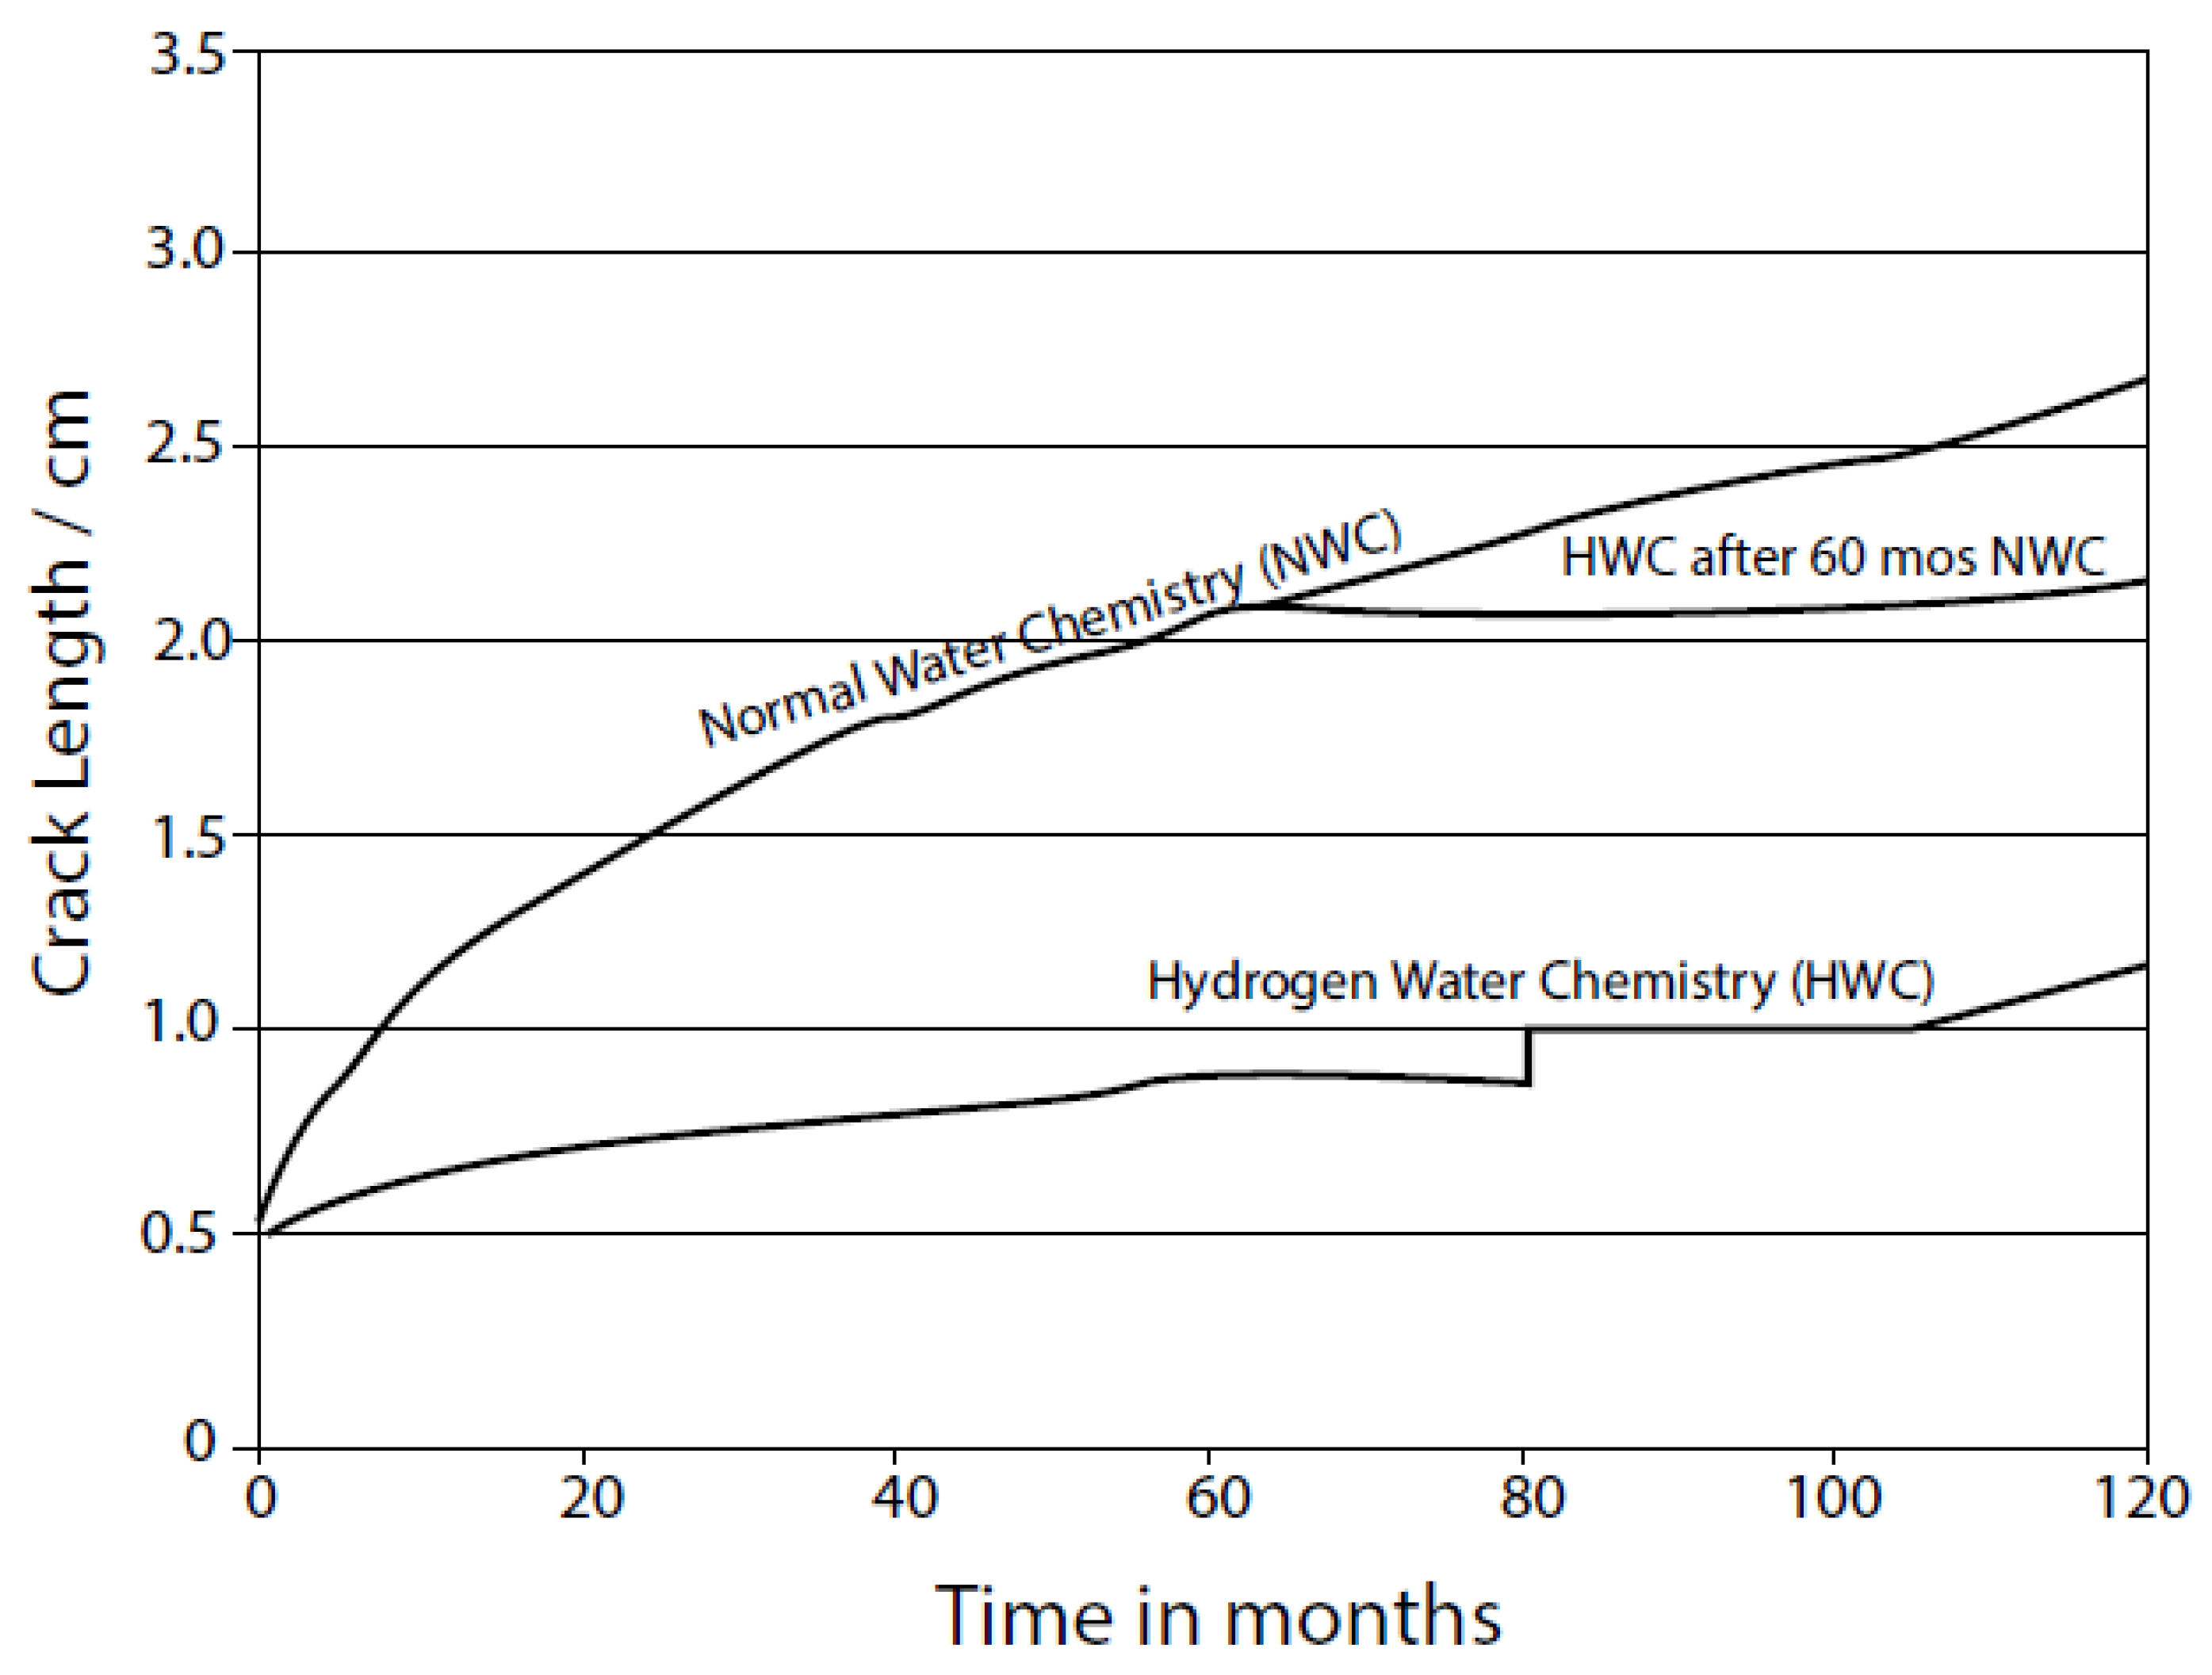
In the early 2000s, REMAIN was upgraded ALERT to predict the accumulated IGSCC damage (crack length) for cracks at specified locations. This required knowledge of (and an input files for) the operating history of the reactor in addition to the reactor specific parameters (geometry and thermal hydrodynamics of the PHTS, dose rate profiles, etc) that had been required previously. The new code, ALERT, represents a powerful predictive code, because it allowed, for the first time, to forge a link between plant operation and accumulated damage for a crack in a specified location in the PHTS. An example of such a calculation for a reactor operating in Taiwan is shown in
Figure 22 [
62]. Three scenarios were explored for a crack in the HAZ of the H3 weld in the outside surface of the core shroud; normal water chemistry (NWC), full Hydrogen Water Chemistry (1 ppm [H
2]
FW), both for 10 years; and a combined protocol of 5 years of NWC followed by 5 years on HWC, as shown in the figure. As seen, the crack extends from an assumed initial length of 0.5 cm to 2.7 cm under NWC over 10 years but under HWC, the crack extends to only 1.1 cm over the same period. If the reactor operates on NWC for the first 5 years, the crack extends to 2.1 cm, but when operating on HWC for the remaining 5-year period, the crack extends further by only about 0.1 cm to 2.2 cm. There are several lessons to be learned from this simulation of IGSCC damage in BWRs: (1) the curves show that, as time proceeds, the CGR (the slope of the curve) decreases, corresponding to the impact of crack length on the CGR (see
Figure 10); (2) The benefits to be obtained by switching from NWC to HWC is governed by the “law of decreasing returns”, in that the cost of operating on NWC for the first year in terms of crack extension is 1.6 cm whereas switching to HWC saves only 0.6 cm in crack extension. This, the operator would have to decide whether the cost of installing and maintaining large amounts of hydrogen on site, as well as the increased man-REM cost due to the transfer of radioactive nitrogen in the form of ammonia to the turbines, is worth the effort. Finally, the ECP at this location is about 0.15 V
she, well above the critical potential for IGSCC in sensitized Type 304 SS of −0.23 V
she, so that the benefits of operating on HWC are evident, in terms of a reduction in ECP and hence in CGR, even though full protection is not achieved.
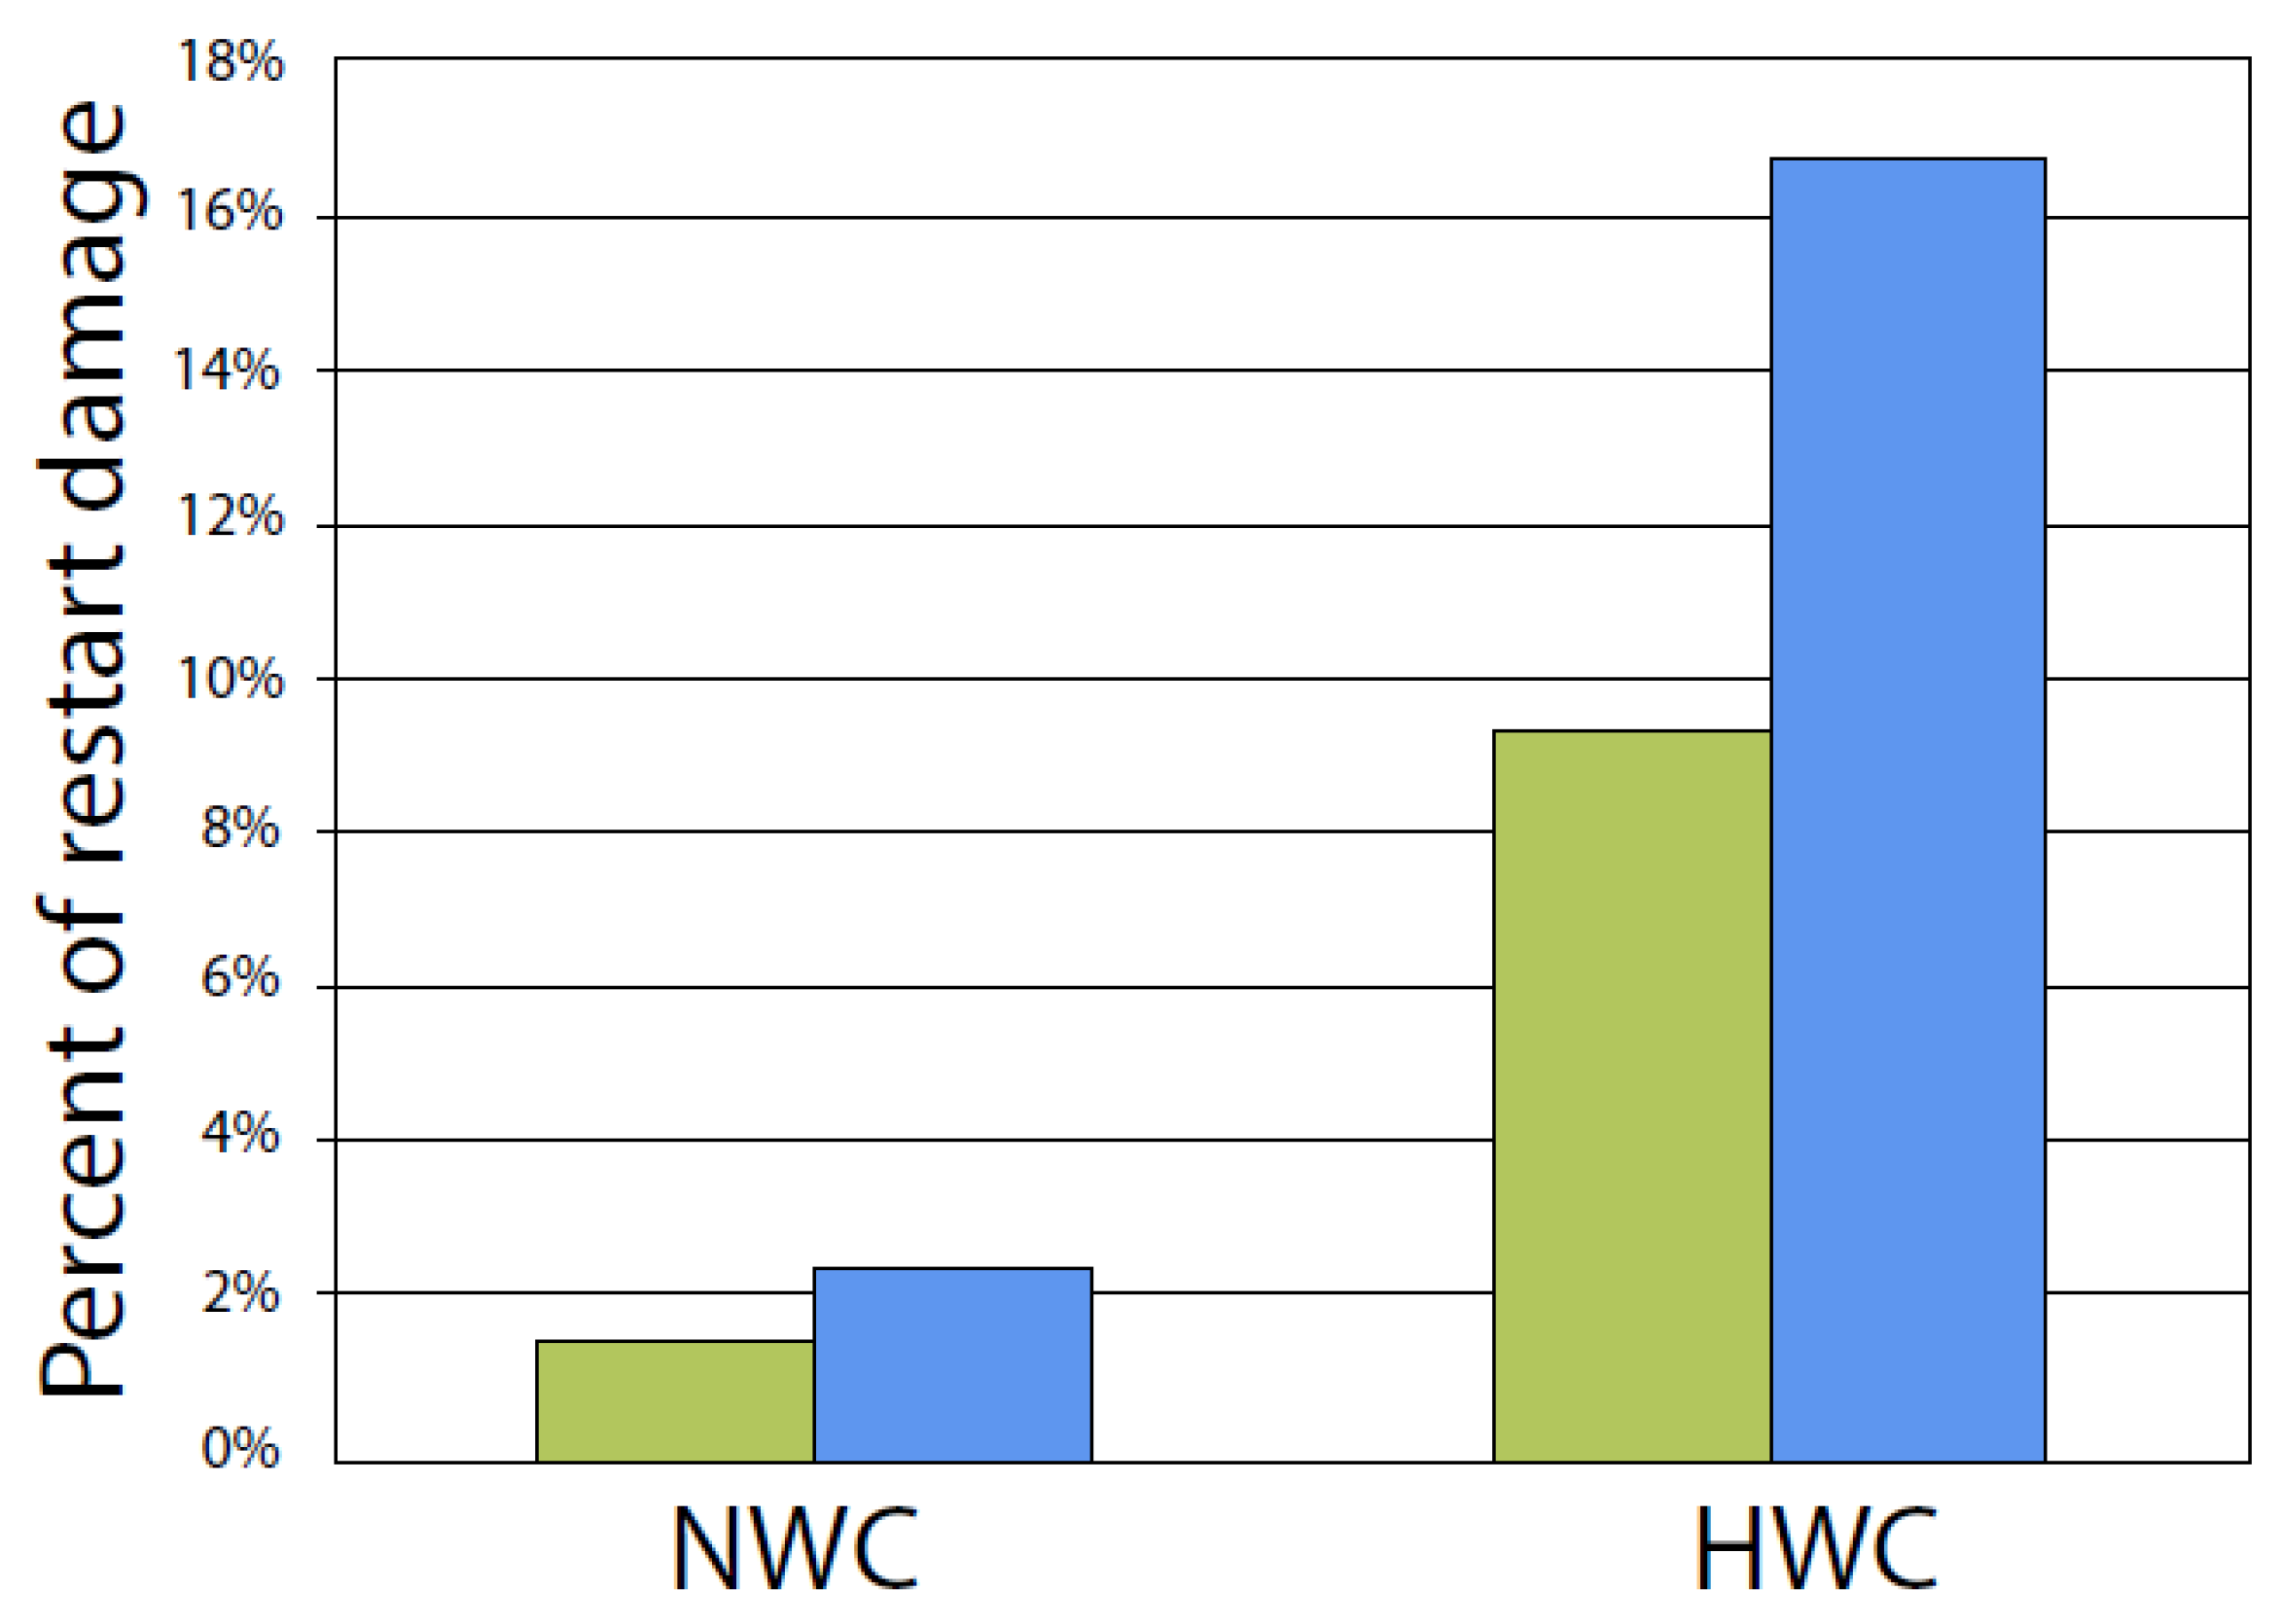
The discontinuities in the crack growth curves displayed in
Figure 22 are due to power transients, including shutdowns and start-ups. These are responsible for a significant fraction of accumulated damage, as indicated in
Figure 23. The calculations were performed assuming “hard” and “soft” restarts, corresponding to a rapid power ramp-up (1 h) and to a slow ramp-up (24 h), respectively. The simulations predict that the restart contributions to the accumulated damage after 10 years of operation are significantly greater when operating on HWC than when operating on NWC and that in each case hard restarts contribute about twice the damage as do soft restarts. However, when corrected to crack extension, the hard restart under NWC amounts to 0.102 cm under HWC and to 0.048 cm under NWC. The relatively poorer performance under HWC, in this regard, is attributed to the transients in temperature and conductivity that accompany start-ups and shutdowns that partially negate the benefits of HWC.
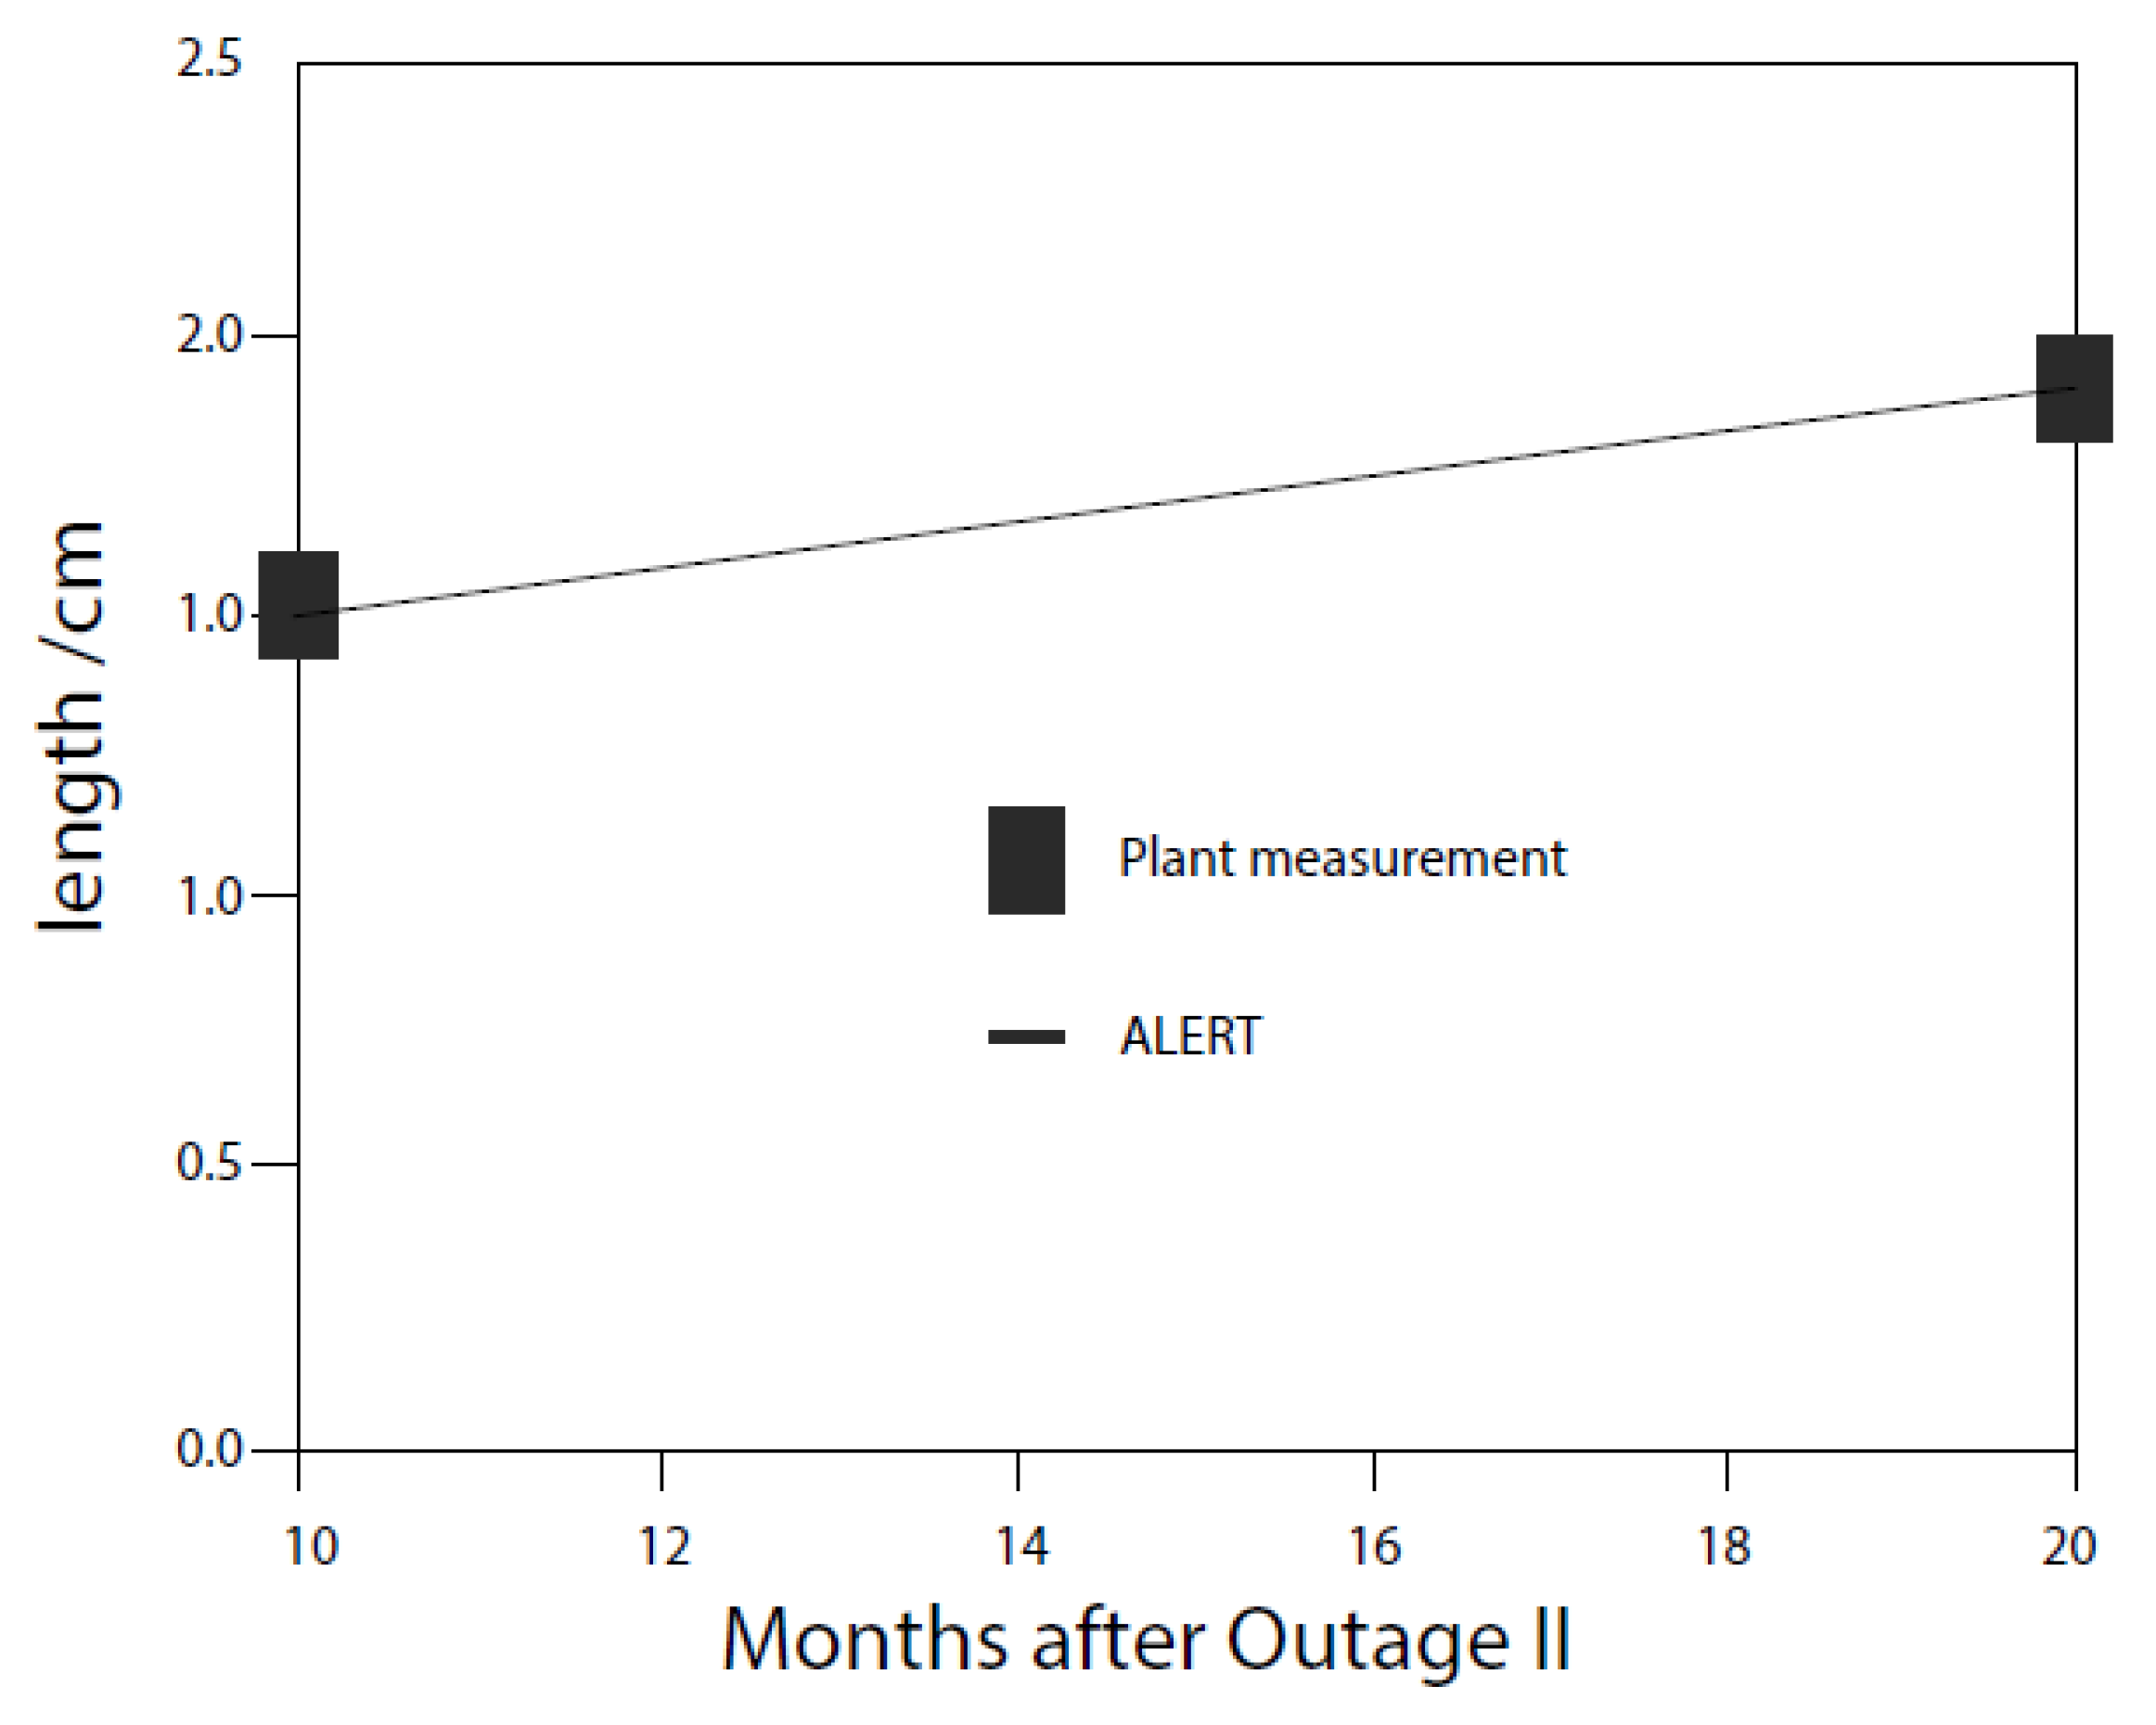
The reader may ask: “How accurate are these simulations?” An answer to that important question is provided in
Figure 24.
In this figure, the initiation time of the crack was adjusted so that the curve passed through the crack depth measured at the beginning of operation after the 11-th outage and the curve is then compared with the crack length measured twenty months later [
62]. Thus, only the comparison at 10 months after Outage 11 has probative value. During that period, the crack was found to have grown about 0.3 cm, whereas ALERT predicted an extension of about 0.25 cm. Given that there was some uncertainty in the operating history and conditions of the reactor, we posit that the agreement is very good.
One important feature of the MPM and the CEFM is that the kinetics of the HER, OER, and HPER on the external surfaces that consume the coupling current and hence determine both the ECP and the CGR, may be manipulated to modify both the ECP and CGR in a manner that reduces the threat of IGSCC during reactor operation. The parameter of each of these reactions that is of interest in this regard is the exchange current density, i0,O/R. This can be done by using a catalyst or an inhibitor the increase or decrease the exchange current density, respectively.
Numerous workers have commented on an apparent relationship between the CGR and the oxide on the external surface and the CEFM provides a theoretical explanation of that relationship. We show in
Figure 25 the ALERT predictions for the case of the general catalysis of the HER, OER, and HPER by a factor of 10
4; that is, by multiplying the exchange current density for each reaction by that amount. Because under NWC conditions the environment is oxidizing in nature, due to low molecular weight hydrogen being preferentially stripped from the coolant by boiling in the core, the molar excess of O
2 and H
2O
2 are rendered more powerful as oxidizing agents by virtue of catalysis, which increases the exchange current densities for the reduction of both species by a factor of 10
4. Recall that the ECP lies closest to the equilibrium potential of that partial process that has the greatest exchange current density, so that the ECP will move closer—in the positive direction- to
EeOER or
EeHPER, because the partial anodic process is not catalyzed and H
2 is greatly reduced in the coolant due to boiling and hence contributes little to the ECP. As a result, the ECP is shifted in the positive direction [compare
Figure 19a and
Figure 25a for the non-catalyzed and catalyzed cases, respectively] changes little around the circuit, because [O
2] + 1/2[H
2O
2] is essentially constant around the circuit. In the case of HWC ([H
2]
FW = 1 ppm, however, hydrogen is now in molar excess in the out-of-core regions and, as the HER is also catalyzed (recall this is for general catalysis where all of the redox reactions are catalyzed to the same extent) hydrogen now becomes a much more powerful reducing agent, resulting in the displacement of the ECP to very negative values [
Figure 25a compaed with the NWC case ([H2]FW = 0ppm). In terms of the CGR, the value predicted for catalysis under NWC conditions [
Figure 25b] is about 8 × 10
−8 cm/s (2.52 cm/year) while under HWC, the crack growth rate for most of the PHTS is the creep limit of about 1 × 10
−10 cm/s (31.5 µm/year), except for the core, where rates as high as 10
−7 cm/s are predicted. This is the underlying basis of NobleChem [
65], as developed by the General Electric Company, in which a noble metal (e.g., Pt) is electrolessly deposited on the PHTS surfaces with the goal of catalyzing the recombination of H
2 with O
2 and H
2O
2. While that may occur, from an electrochemical viewpoint, the principal effect is on enhancing the rates of the HER, OER, and HPER, as discussed above. The effectiveness of general catalysis is further illustrated in
Figure 26 where the accumulated damage is plotted as a function of time over a 20-month operating period for a typical crack in a BWR under full-power conditions. We see that general catalysis effectively suppresses crack extension but only in the presence of excess hydrogen, reinforcing the conclusion drawn above. From the known impact of NobleChem in various reactors, as reported by Balachov, et al. [
62], it is apparent that the level of catalysis achieved in a lot less than the 10
4 assumed in the above calculations, possibly only as much as 10, but that is sufficient to afford significant benefits to plants operating on HWC.
Nevertheless, general catalysis raises an important issue. As seen from
Figure 25 and
Figure 26, catalysis is only effective if the system has a stoichiometric excess of hydrogen in the coolant. If an excess of H
2 does not exist, then both the ECP and the CGR are elevated from their uncatalyzed values; this being due to the catalysis of the OER and the HPER over that of the HER. Thus, if a reactor that has been operating on HWC/NobleChem is forced for any reason to abandon HWC there exists the real possibility that it may experience enhanced rates of accumulated IGSCC damage when operating in the future under NWC. Thus, a method needs to be developed to de-catalyze the steel surfaces in the PHTS of BWRs.
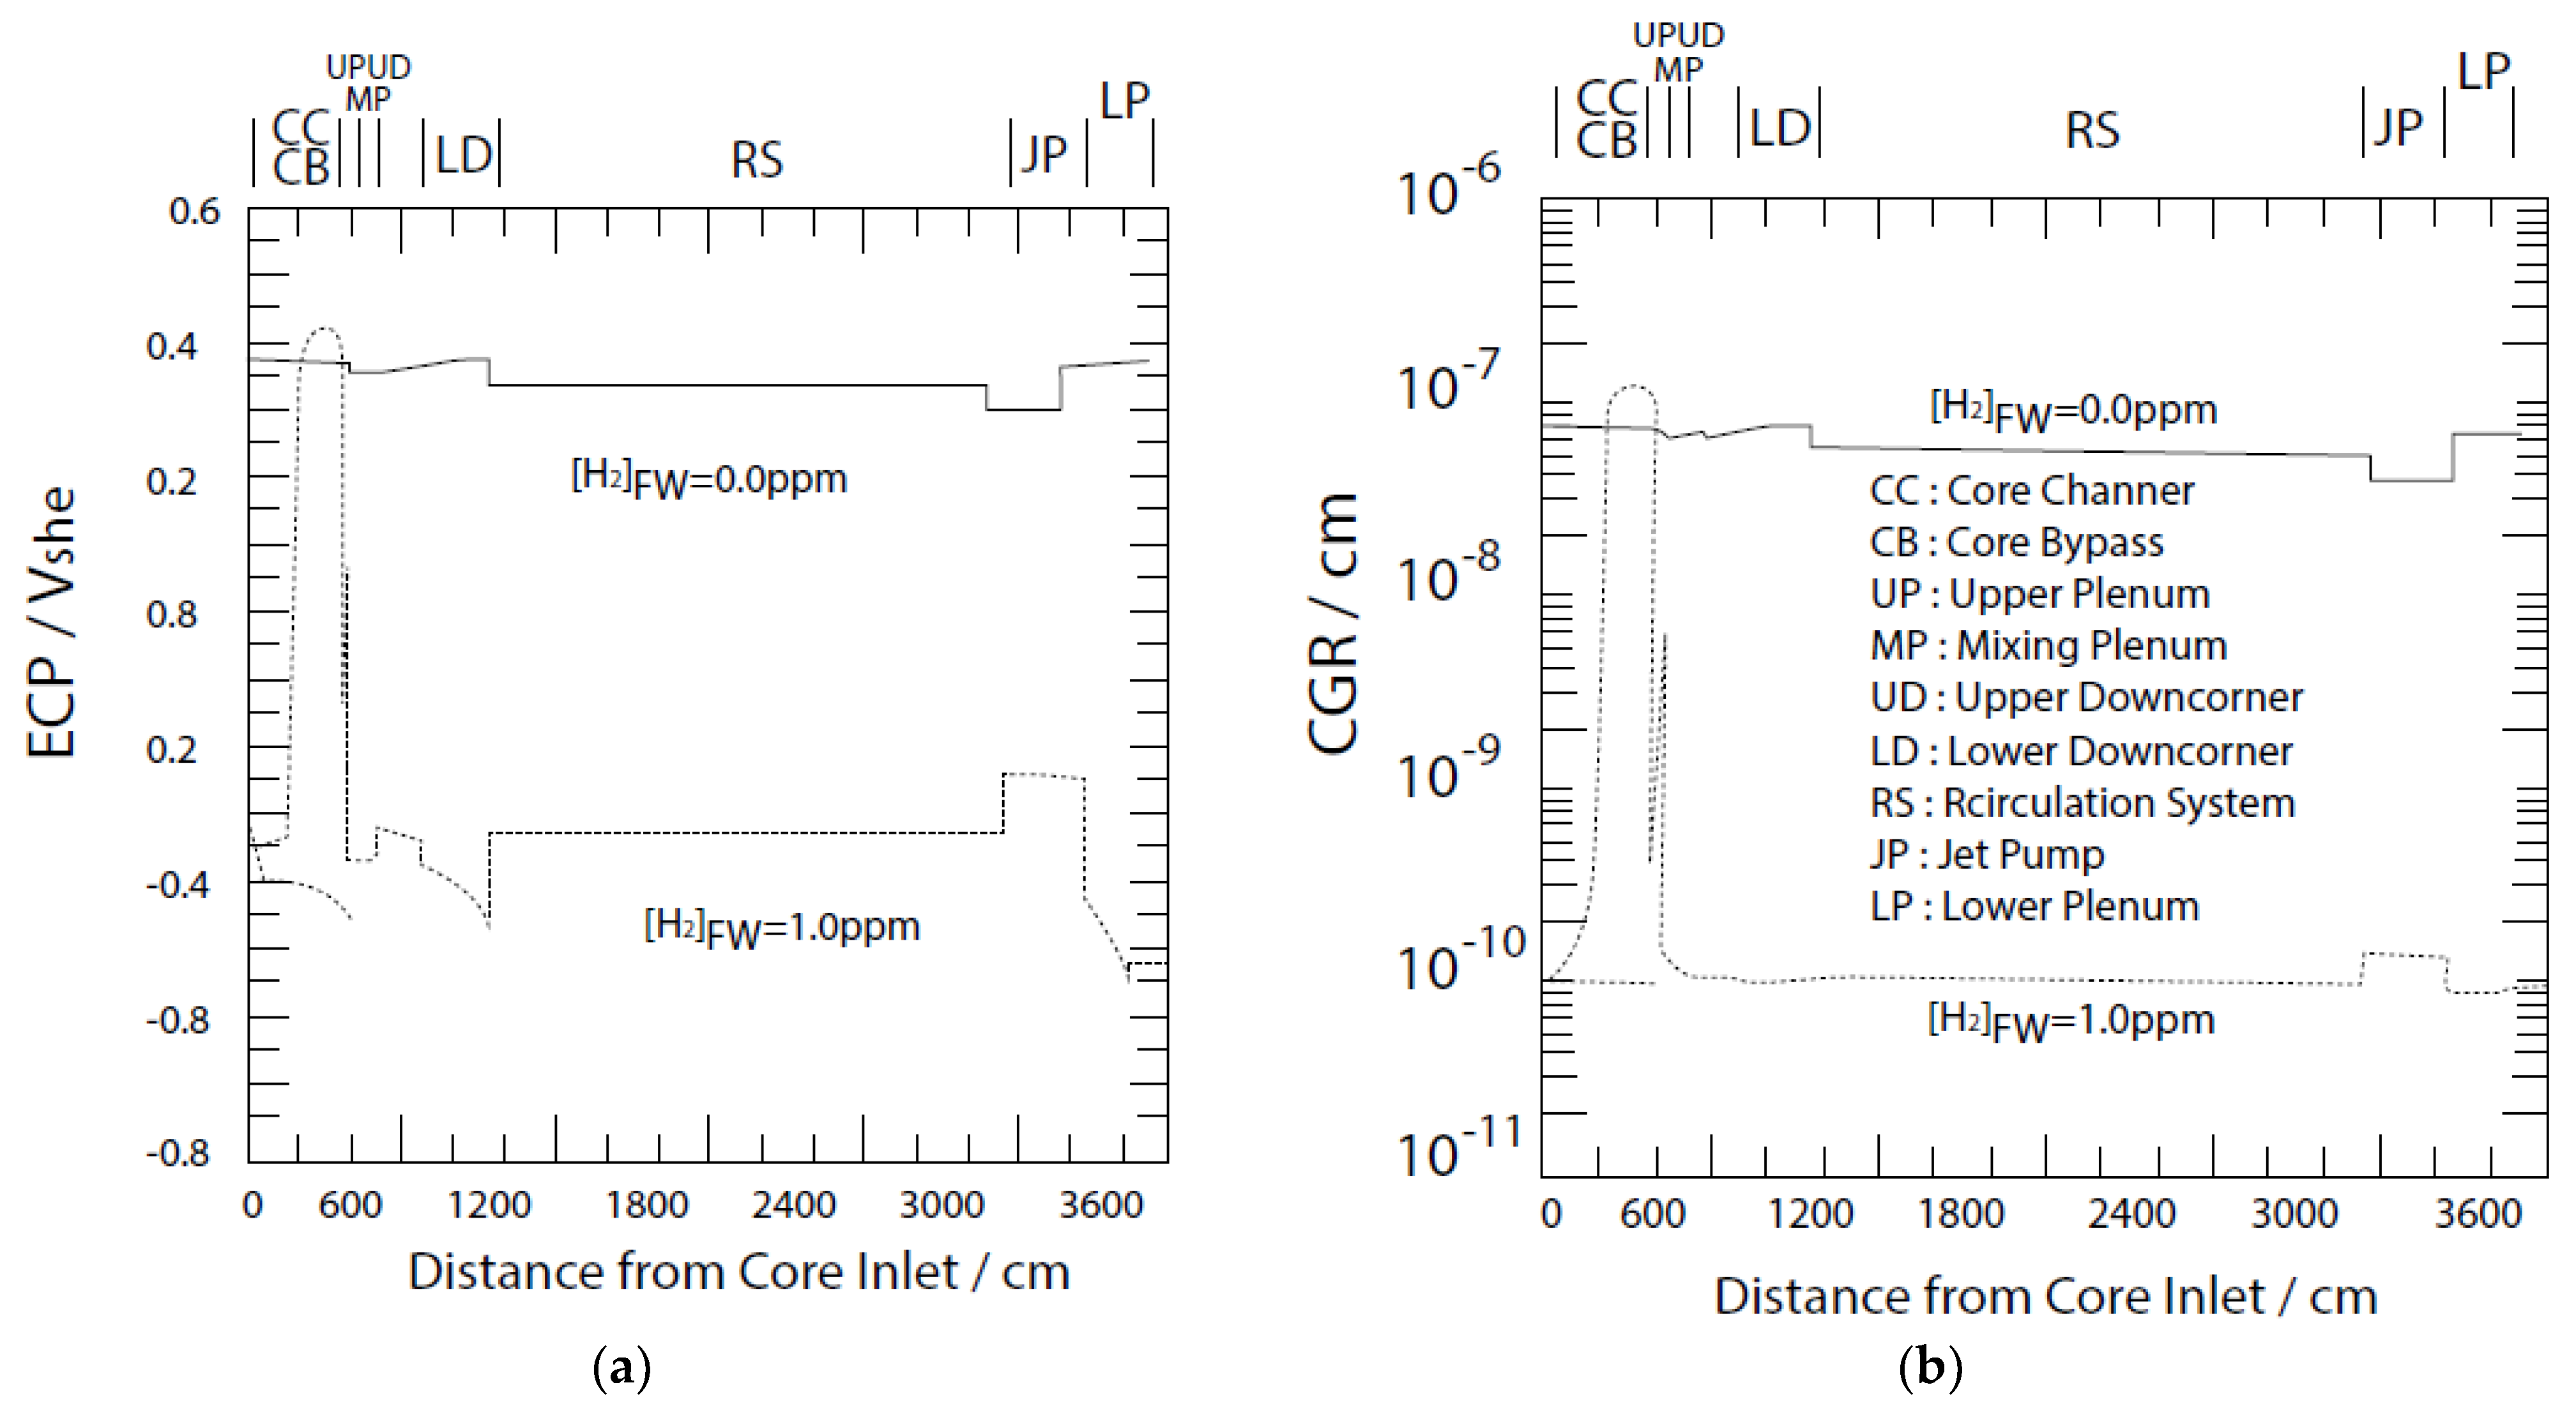
The codes predict that general inhibition might also be an effective method for inhibiting the development of IGSCC damage in BWRs [
21]. In this case, the exchange current densities of the HER, OER, and HPER are reduced by a factor of 10
−4. Predictions of this effect for Dresden-2 are shown in
Figure 27. The effect is predicted to be very significant as the ECP under both NWC ([H
2]
FW = 0) and HWC ([H
2]
FW = 1.0 ppm) are displaced in the negative direction for all components in the PHTS to values that is much lower than
Ecrit, except for the core, where the ECP is at the critical potential [
Figure 27, left frame]. As expected, the CGR is decreased to the creep limit, indicating that IGSCC might be eliminated in the entire PHTS (
Figure 27, right frame). Of great importance, is that general inhibition would eliminate the need for HWC entirely, freeing BWR owners and operators of the costs associated with installing hydrogen water chemistry in their reactors.
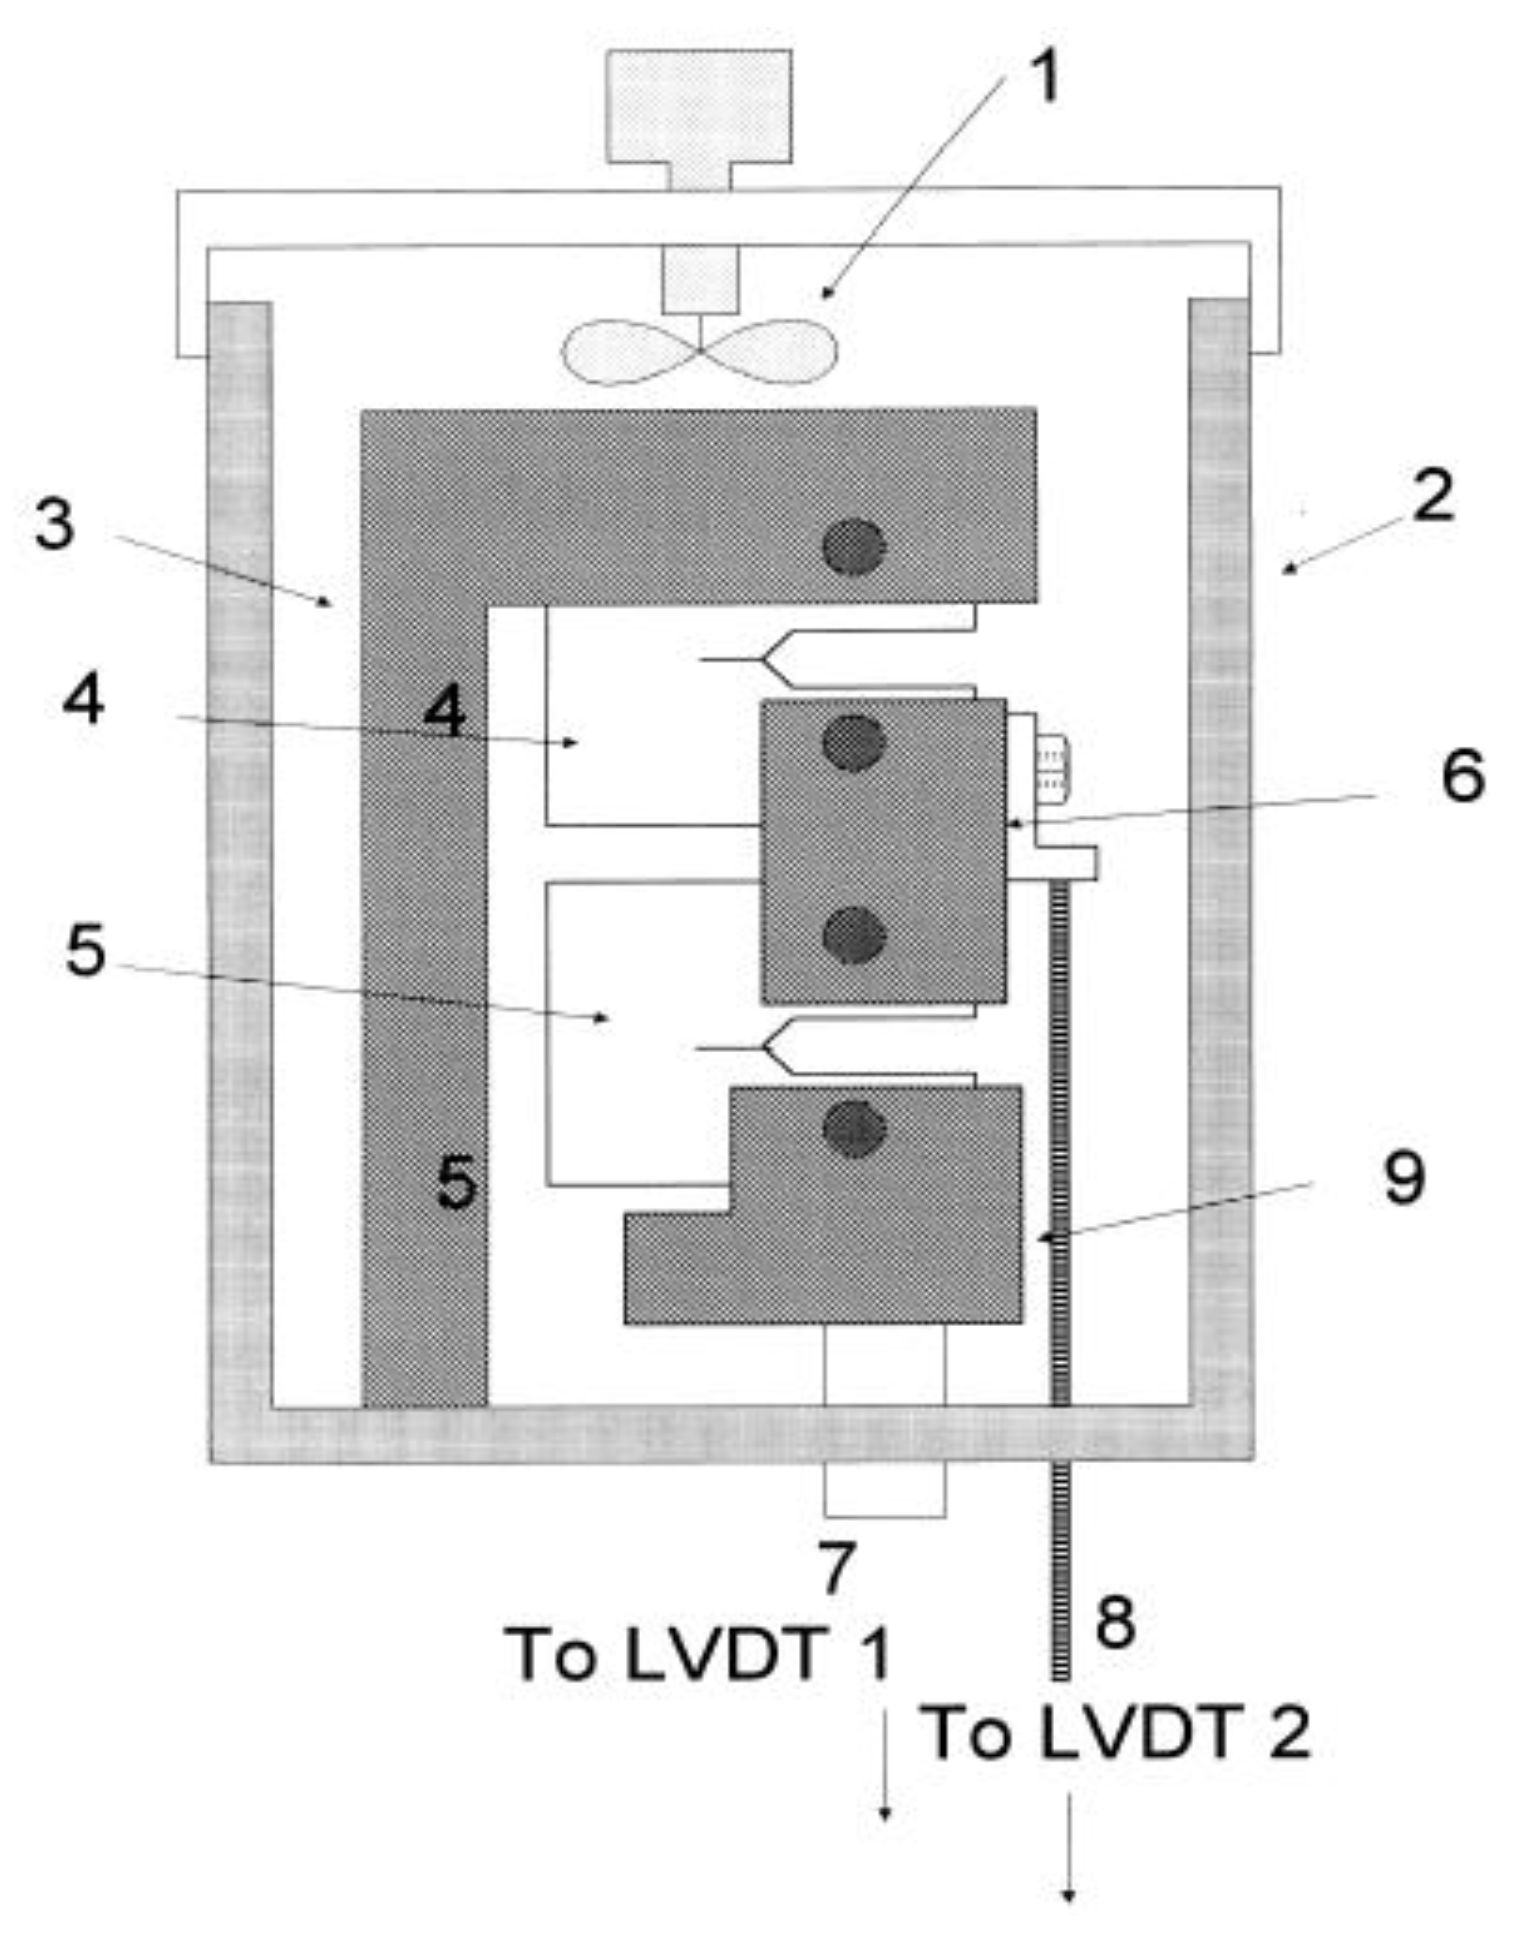
General inhibition has been tested in the laboratory by daisy-chaining two bolt-loaded (
KI ≈ 25 MPa.m
1/2), pre-cracked CT specimens of sensitized Type 304 SS in an autoclave in simulated, conductive coolant containing 0.005 M Na
2SO
4 at 250 °C [
64], as shown in
Figure 28. The solution was sparged in the reservoir at 22 °C with pure oxygen to yield a concentration of 40 ppm (1.25 × 10
−3 m).
One specimen was coated with an electrophoretically deposited ZrO
2 coating that was cured at 250 °C for 48 h to form a resilient ceramic coating. The crack lengths in both specimens were measured by compliance and the results are displayed in
Figure 27. The quality of the coating was measured using electrochemical impedance spectroscopy (EIS) with a 0.01 M Fe(CM)
62−/Fe(CN)
63− + 0.1M NaOH fast redox couple before and after exposure to the high temperature aqueous environment to detect any changes in quality (porosity). It was found that the specific impedance (ohm.cm
2) was 100 to 1000 times higher for the coated than for the uncoated specimen.
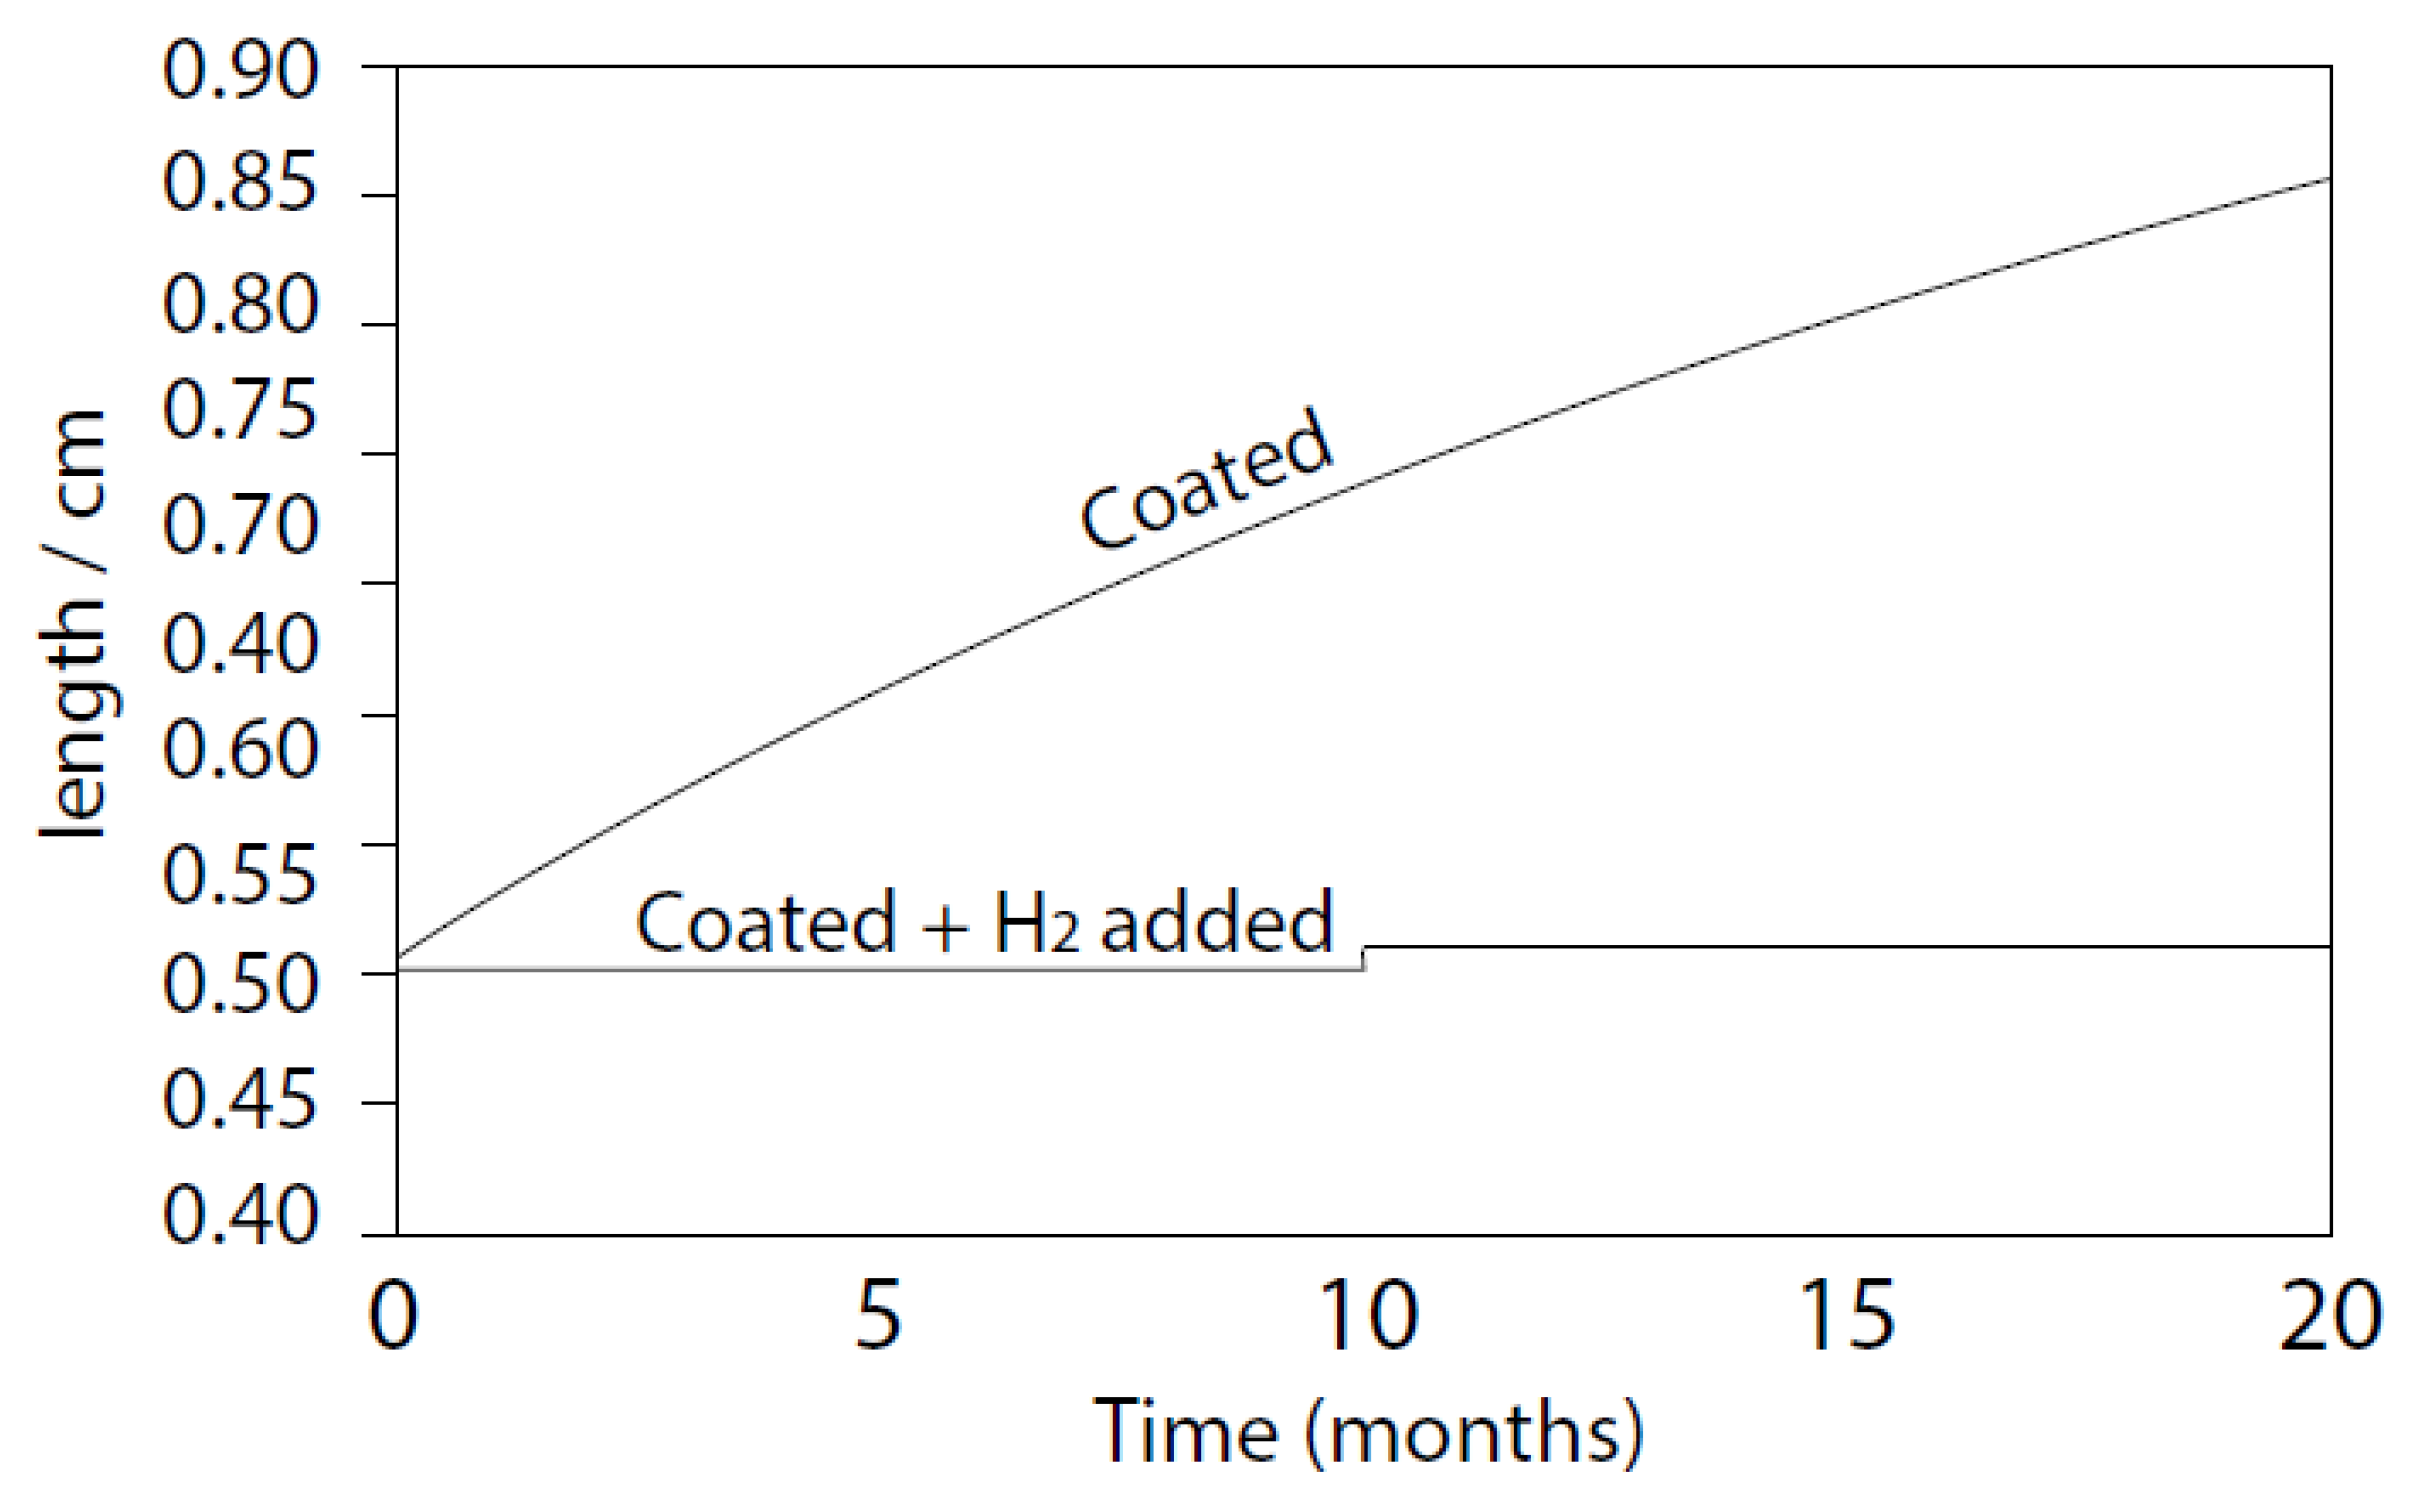
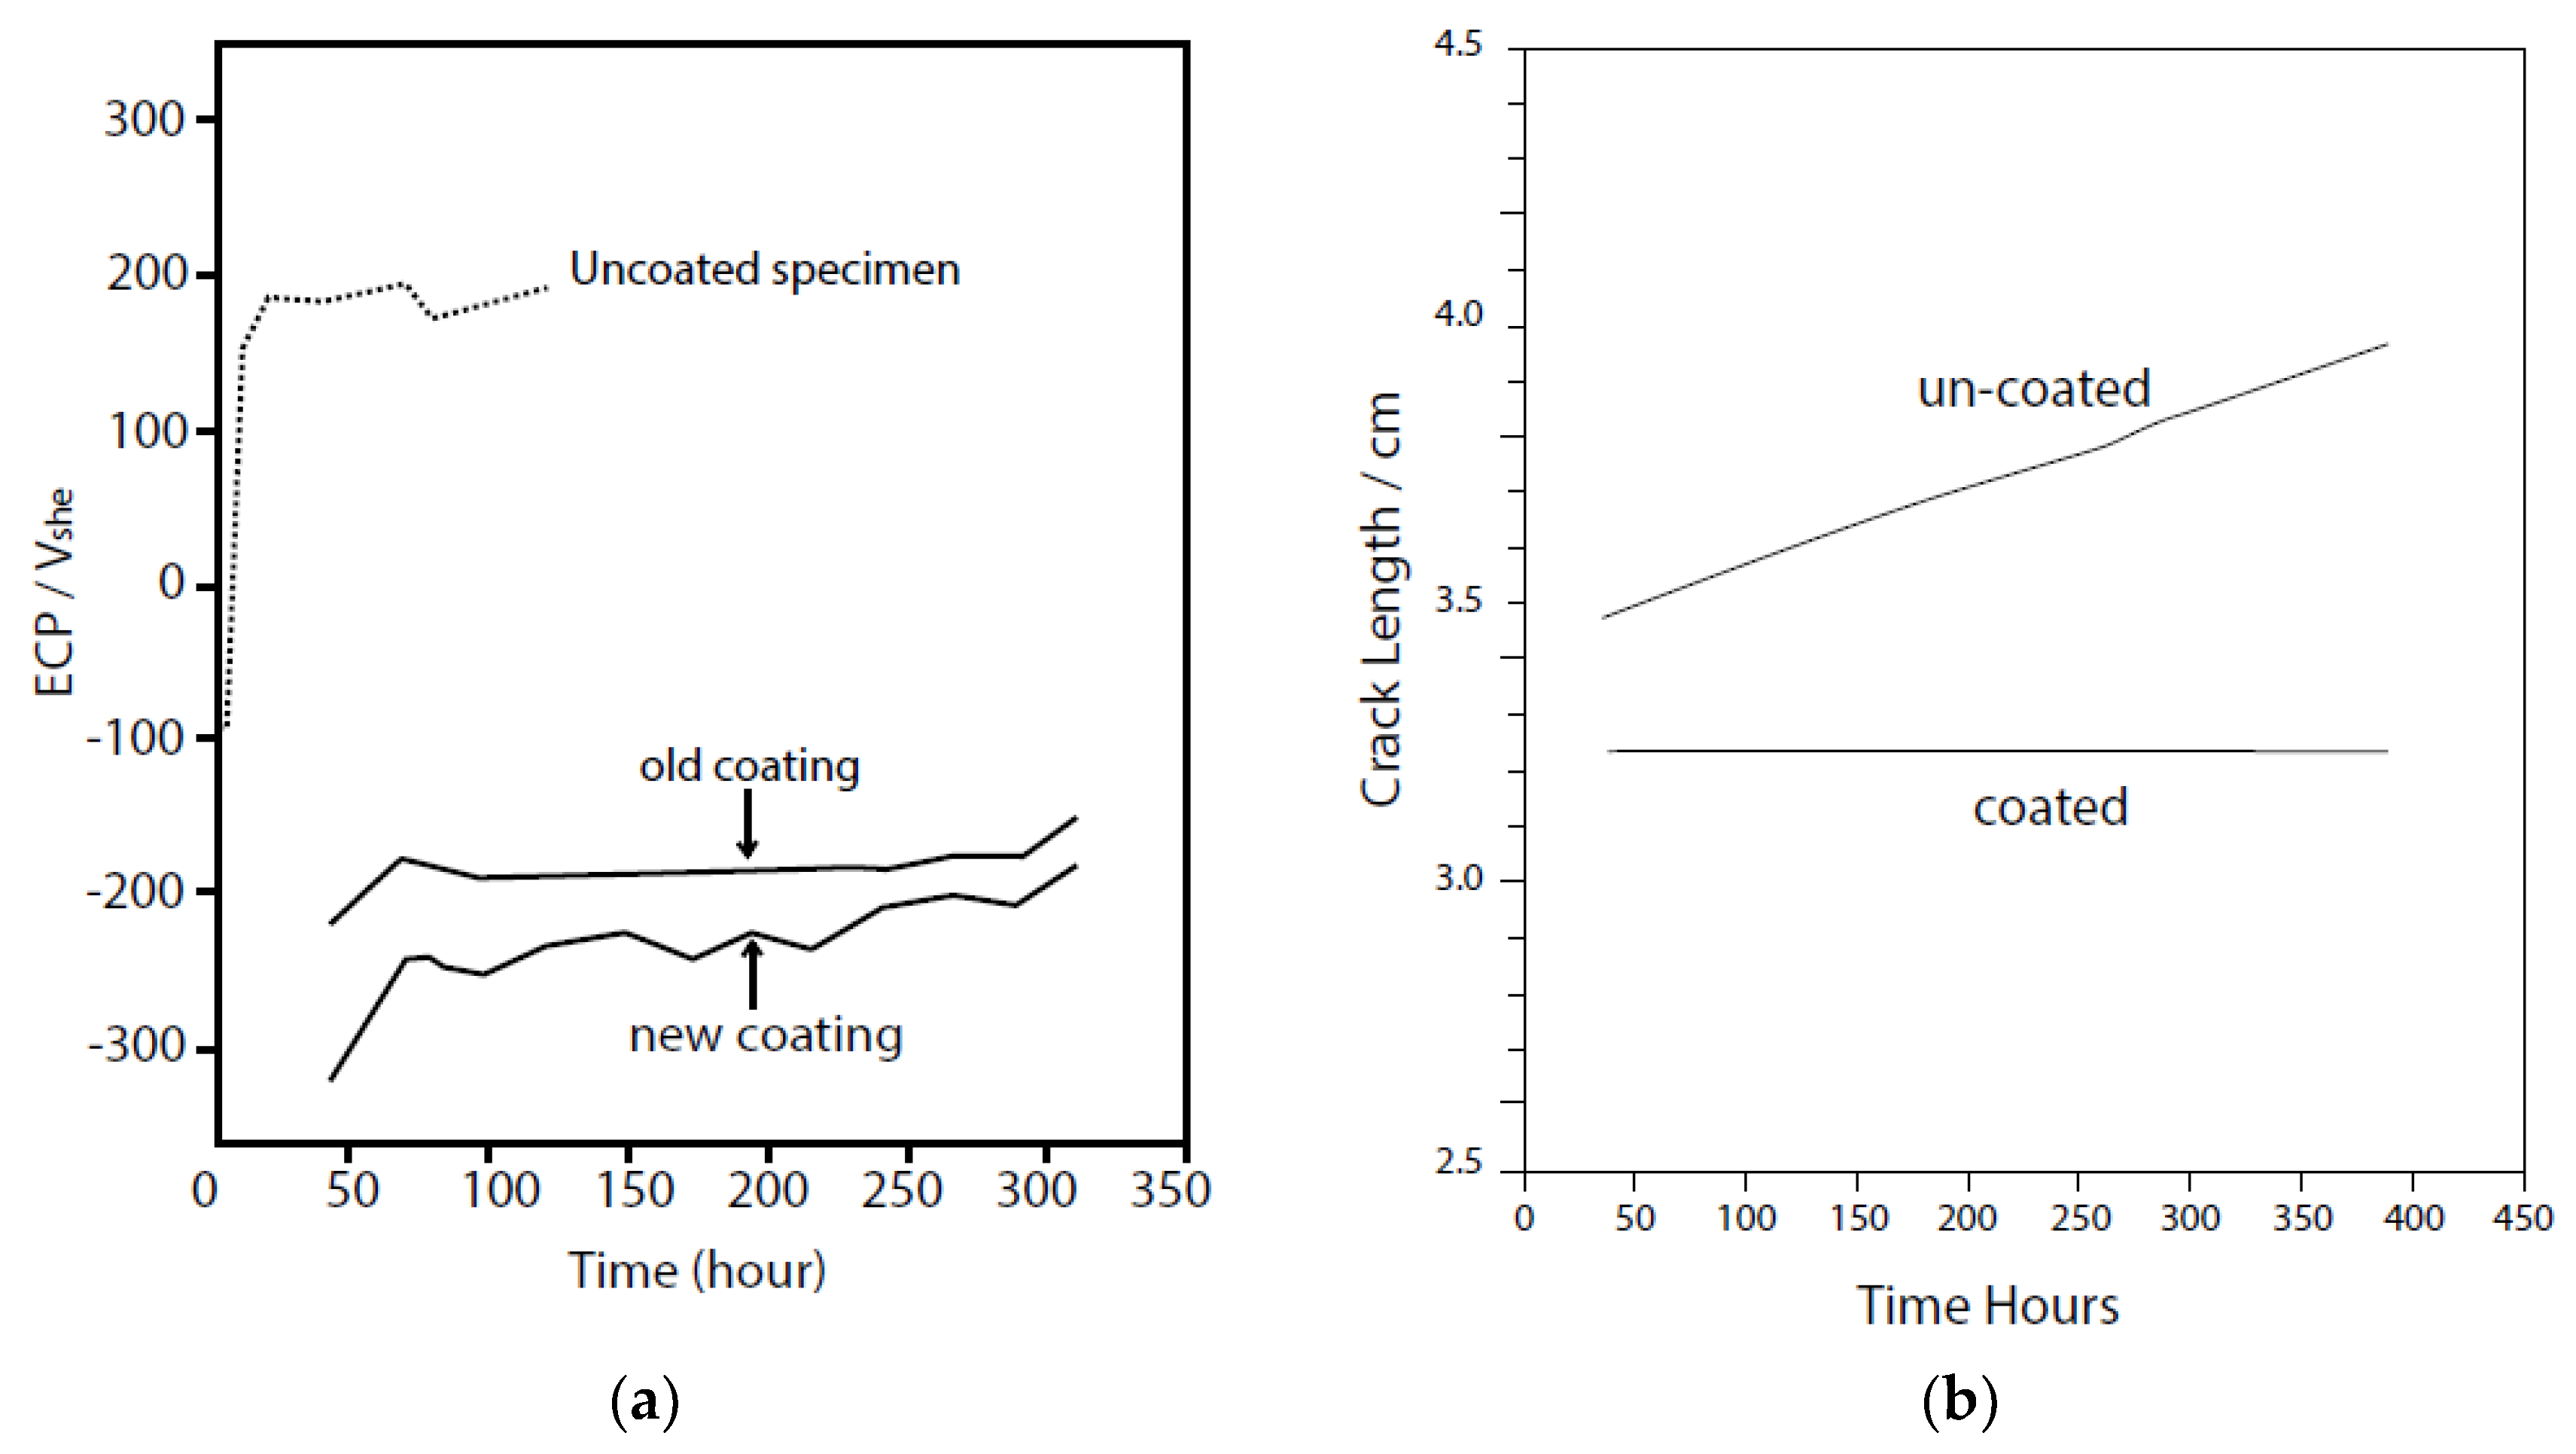
The data shown in
Figure 29a reveal that the ZrO
2 coating displaces the ECP in the negative direction by 400–500 mV and completely suppresses IGSCC crack extension [
Figure 29b] as predicted theoretically (
Figure 27). Indeed, no crack growth was detected in the coated specimen, whereas the crack grew by nearly 0.5 cm over the 400 h exposure period for a CGR of about 3.1 × 10
−7 cm/s. This value reasonably agrees with the data plotted in
Figure 9 for a temperature of 250 °C. According to theory, for an increase in the specific impedance of the surface of a factor of 100 to 1000, due to the presence of the coating, the ECP the ECP should be displaced to −200 mV
she to −350 mV
she, in excellent agreement with experiment [
Figure 29a] while the CGR should be displaced to the creep limit; again in good agreement with the CEFM. Not only do these experiments confirm the validity of the concept of general inhibition, but they provide a robust test against direct experiment of the MPM and the CEFM for estimating ECP and IGSCC CGR in sensitized Type 304 SS, respectfully, under realistically simulated reactor operating conditions. It seems that for this technique to become a practical IGSCC control method for use in operating BWRs, a method must be developed for coating the internal surfaces of the PHTS with a resilient, dielectric coating that can withstand the rigors of exposure to high temperature BWR coolant.
In the opinion of one of the present authors (DDM), the critical potential for IGSCC in sensitized Type 304 SS of −0.23 V
she is possibly a too severe a metric, in that under the conditions assumed for a standard crack, it corresponds to a CGR of about 2 × 10
−10 cm/s, which is slightly above the creep CGR (1.6 × 10
−10 cm/s at 288 °C,
Figure 8). However, a CGR of 2 × 10
−10 cm/s corresponds to a crack extension of 63 µm over a one-year period of operation or 2.52 mm over 40 years. While this estimate does not account for enhanced CGR during temperature (
Figure 10) and conductivity excursions, the worst-case scenario suggests that the accumulated damage might be a factor of 10 higher, amounting to 1-inch (25.2 mm) over 40 years of operation. Noting that an average CGR of 1 × 10
−9 cm/s amounts to a crack extension of 0.315 mm over a one-year exposure and to 1.26 cm (1/2-inch) over 40 years of operation, the corresponding critical ECP (
Ecrit) for IGSCC might be revised upward to −0.05 V
she (
Figure 9) with little apparent risk. This being the case, all the recirculation system should be protected from IGSCC, although the remaining regions all remain susceptible to IGSCC with the accumulated damage being predicted to be in excess of 1-1nch over 40 years.


