


Education for Environmental Justice: The Fordham Regional Environmental Sensor for Healthy Air


Abstract
:1. Introduction
2. Particulate Sensors
2.1. Particulate Matter
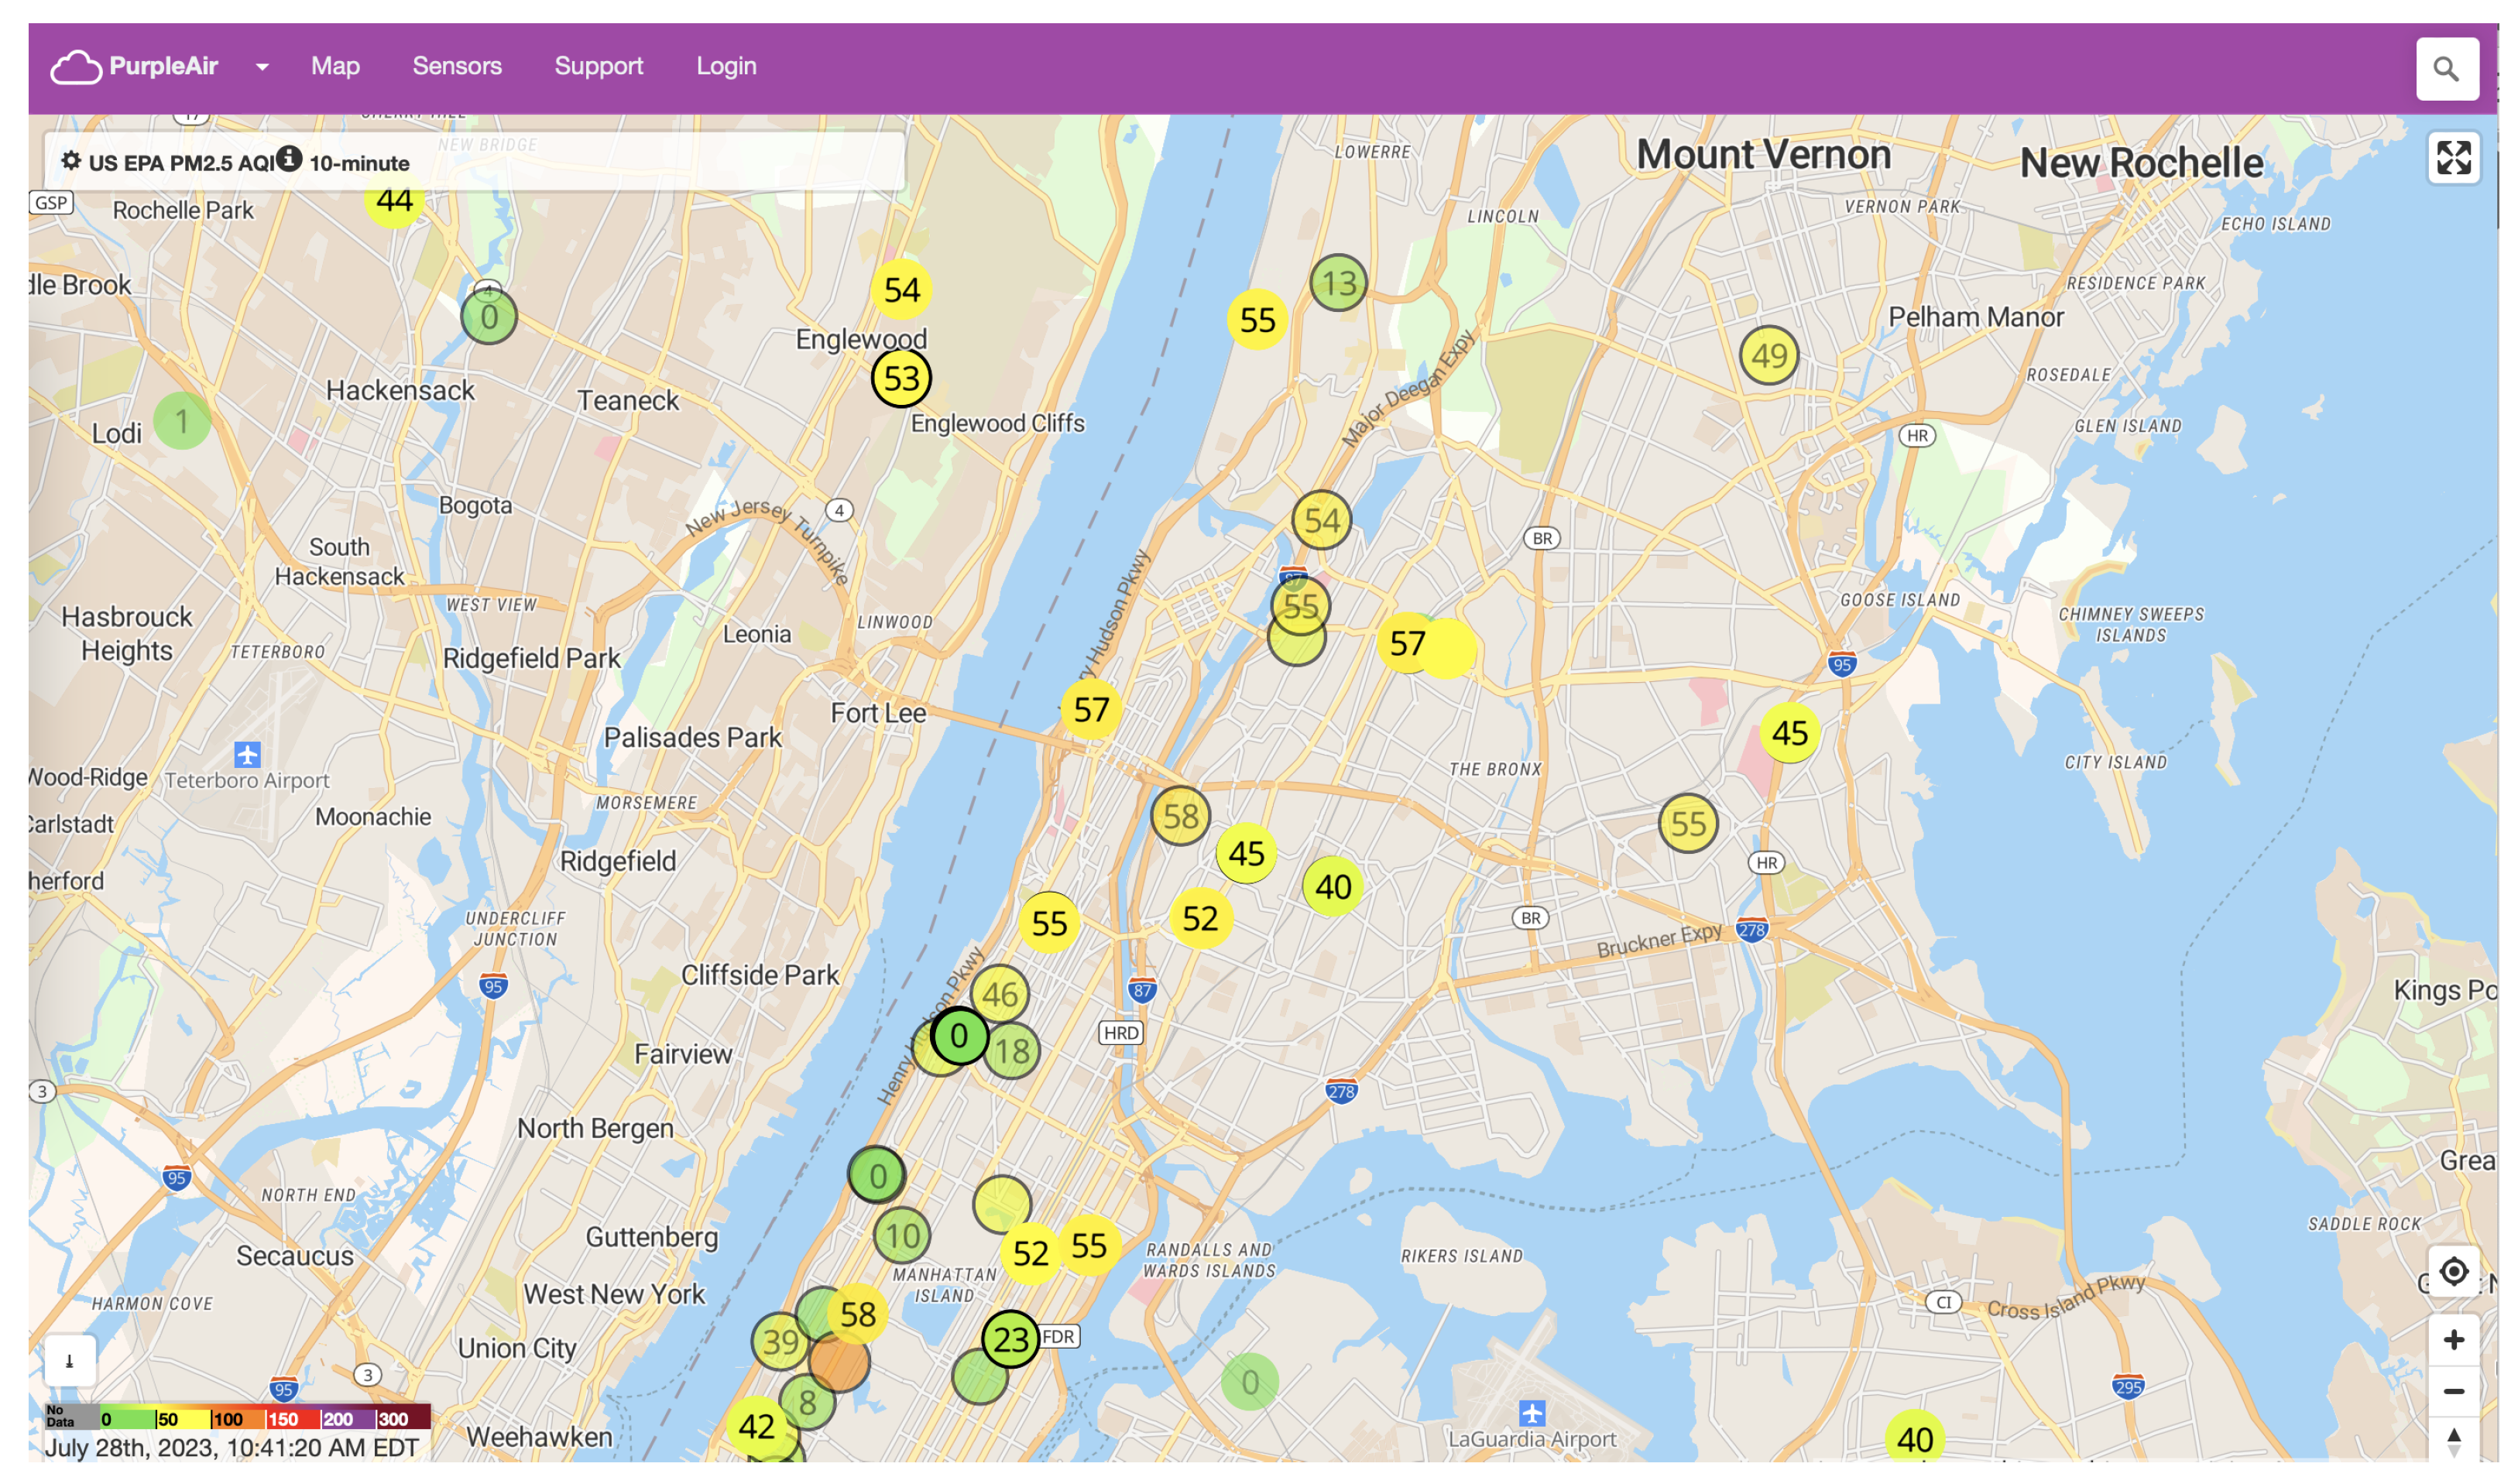
2.2. PurpleAir
2.3. FRESH Air Projects
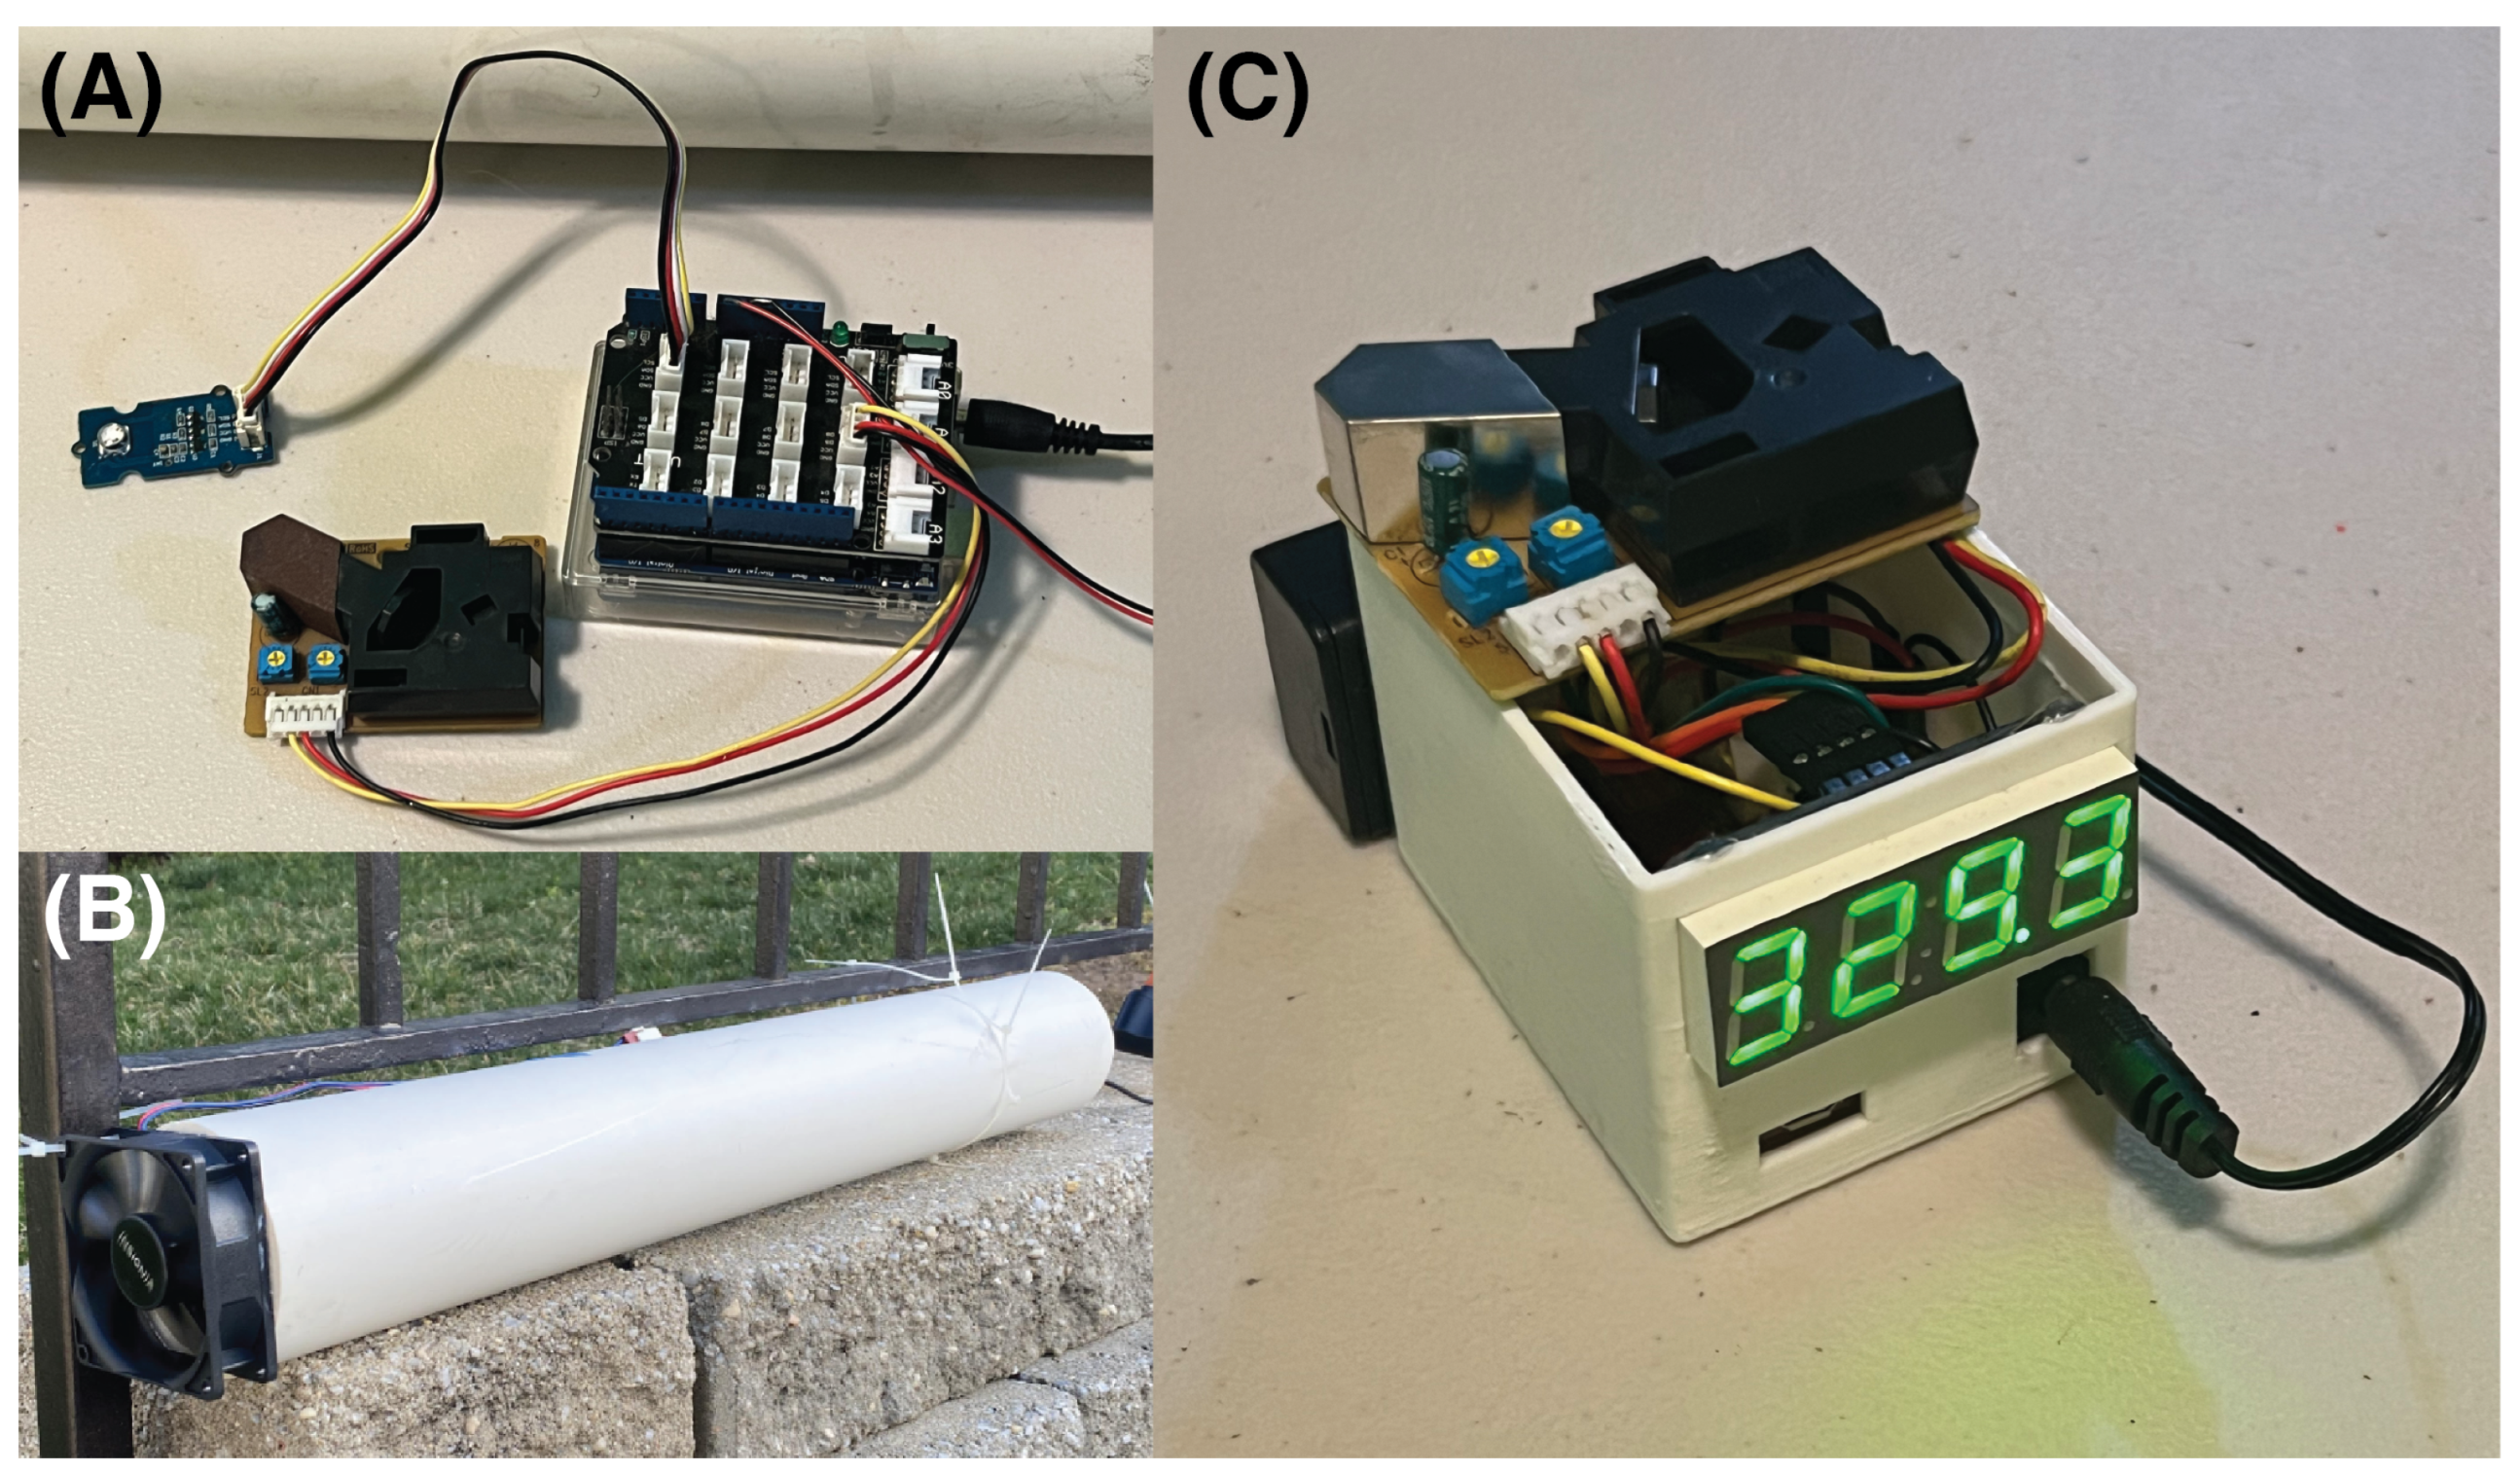
2.3.1. Incubator Prototype
2.3.2. Portable School Kits
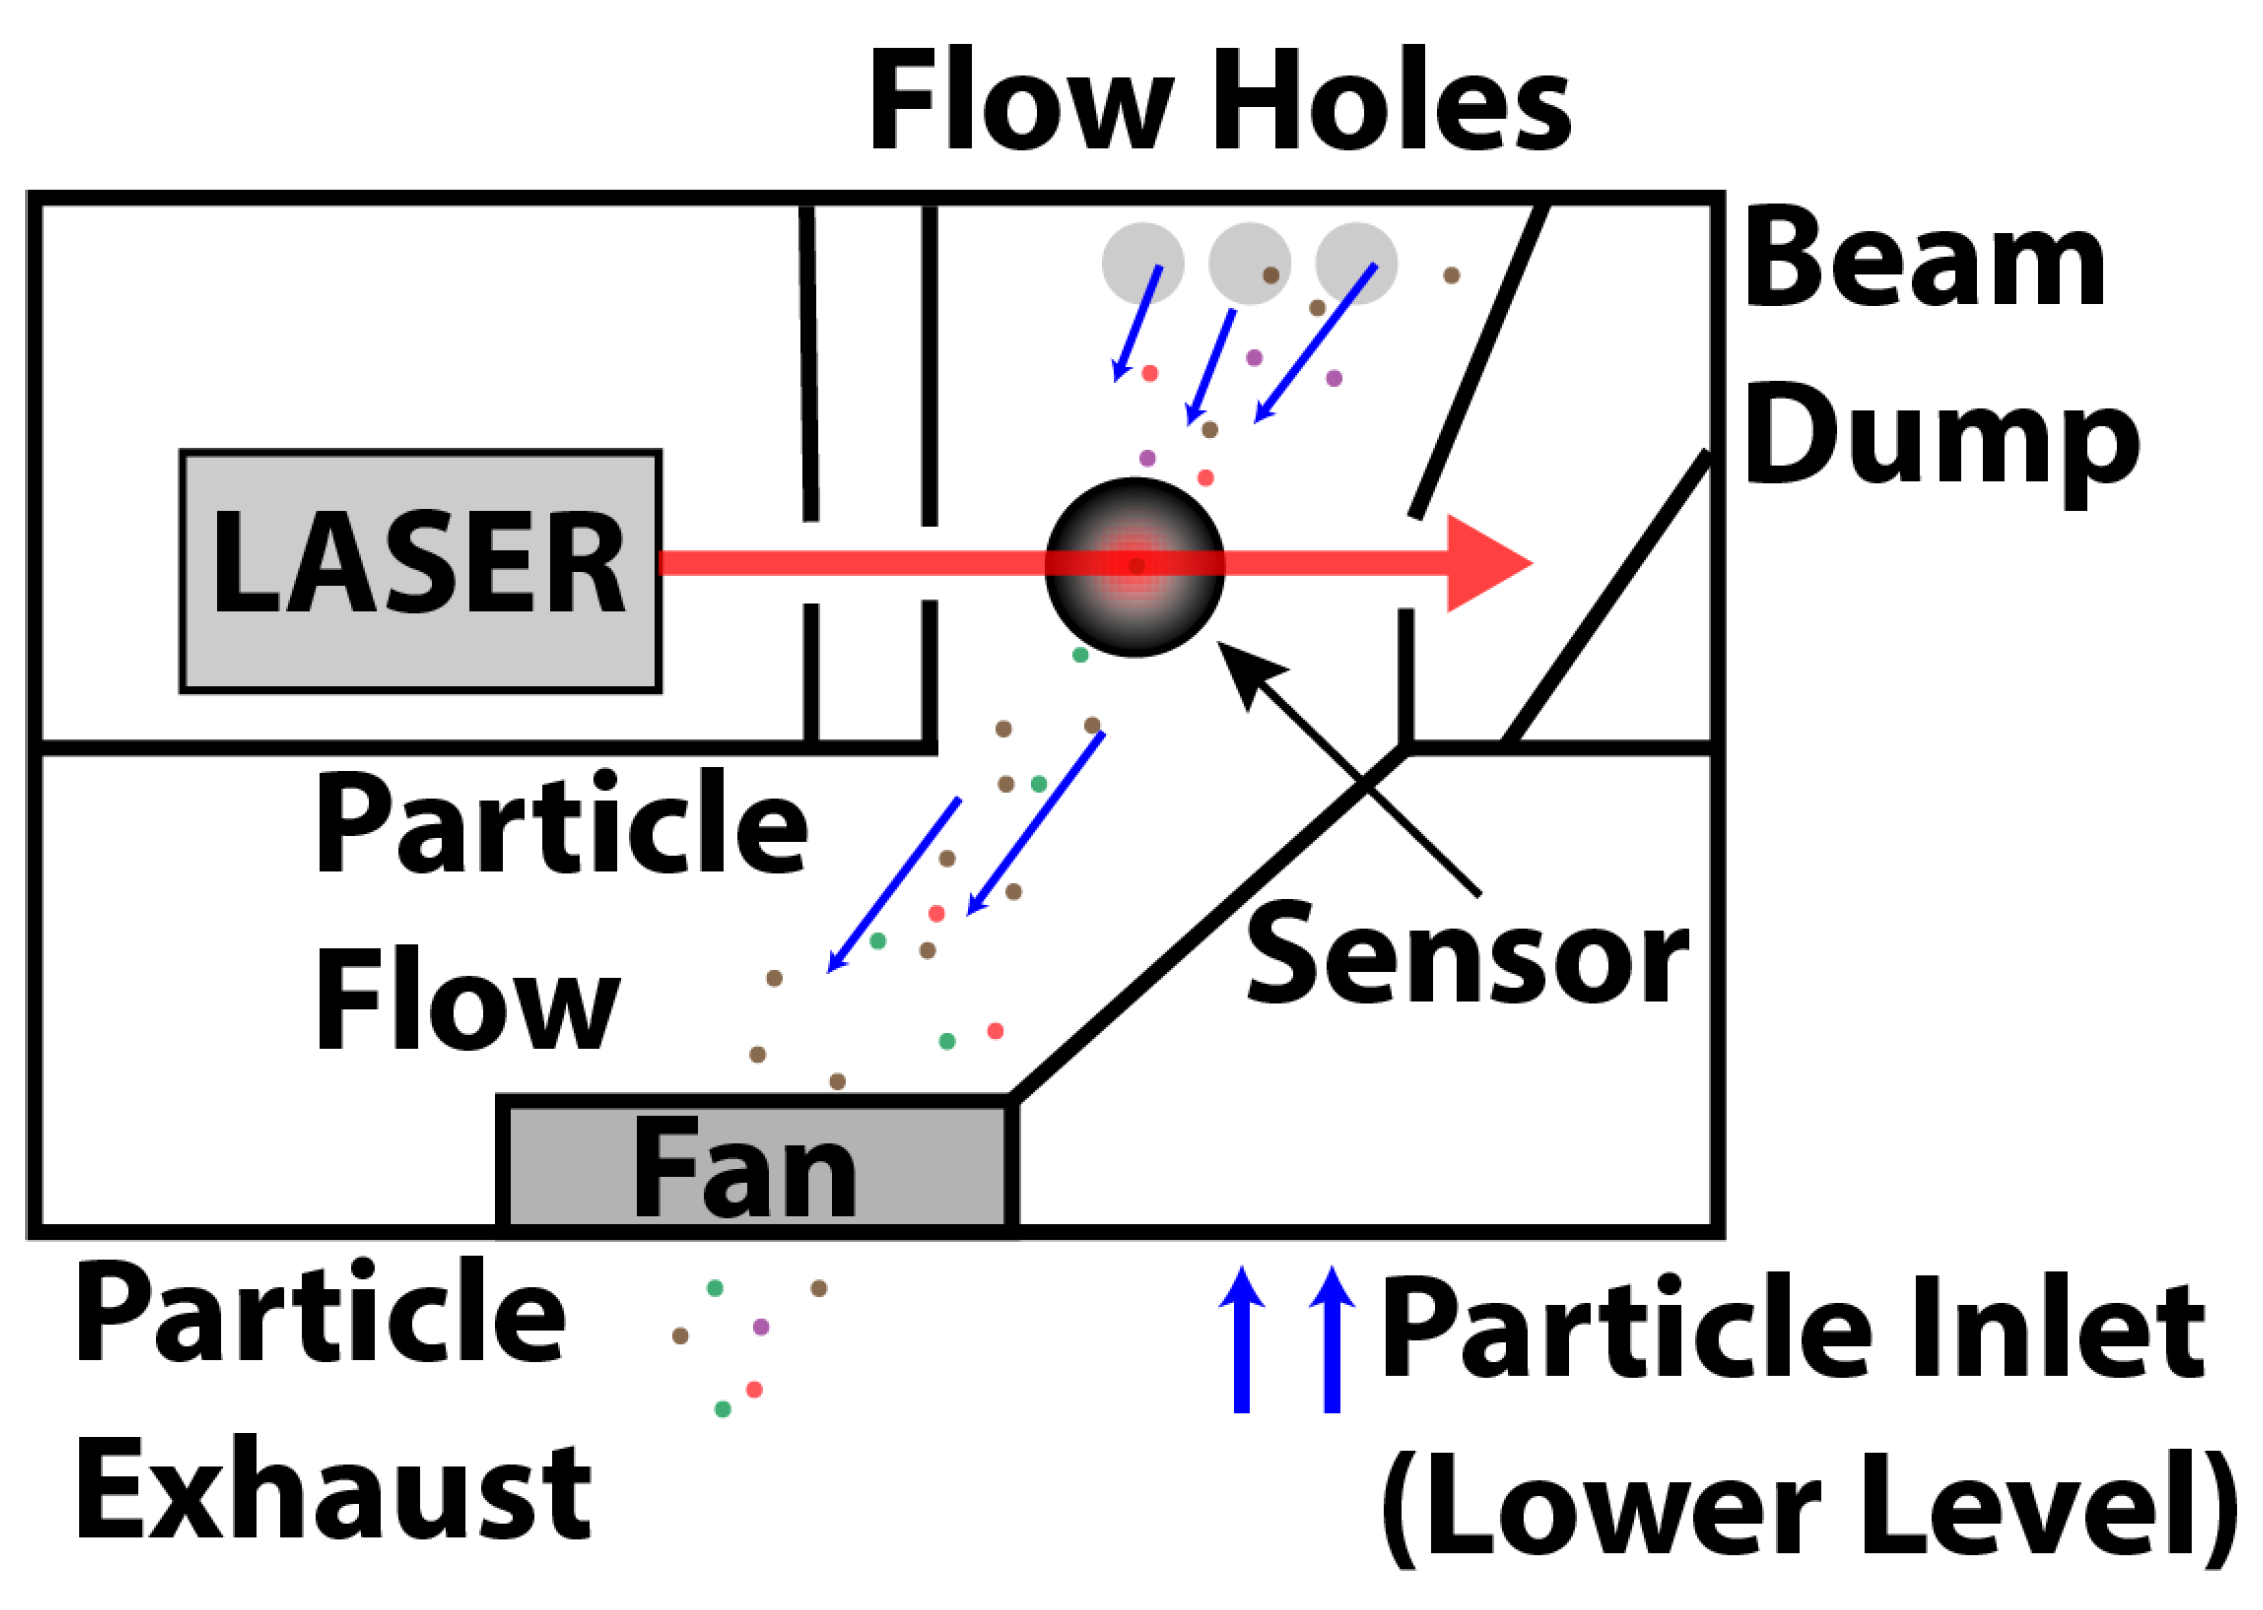
2.4. Particle Counting: Principle of Operation
3. Results and Discussion
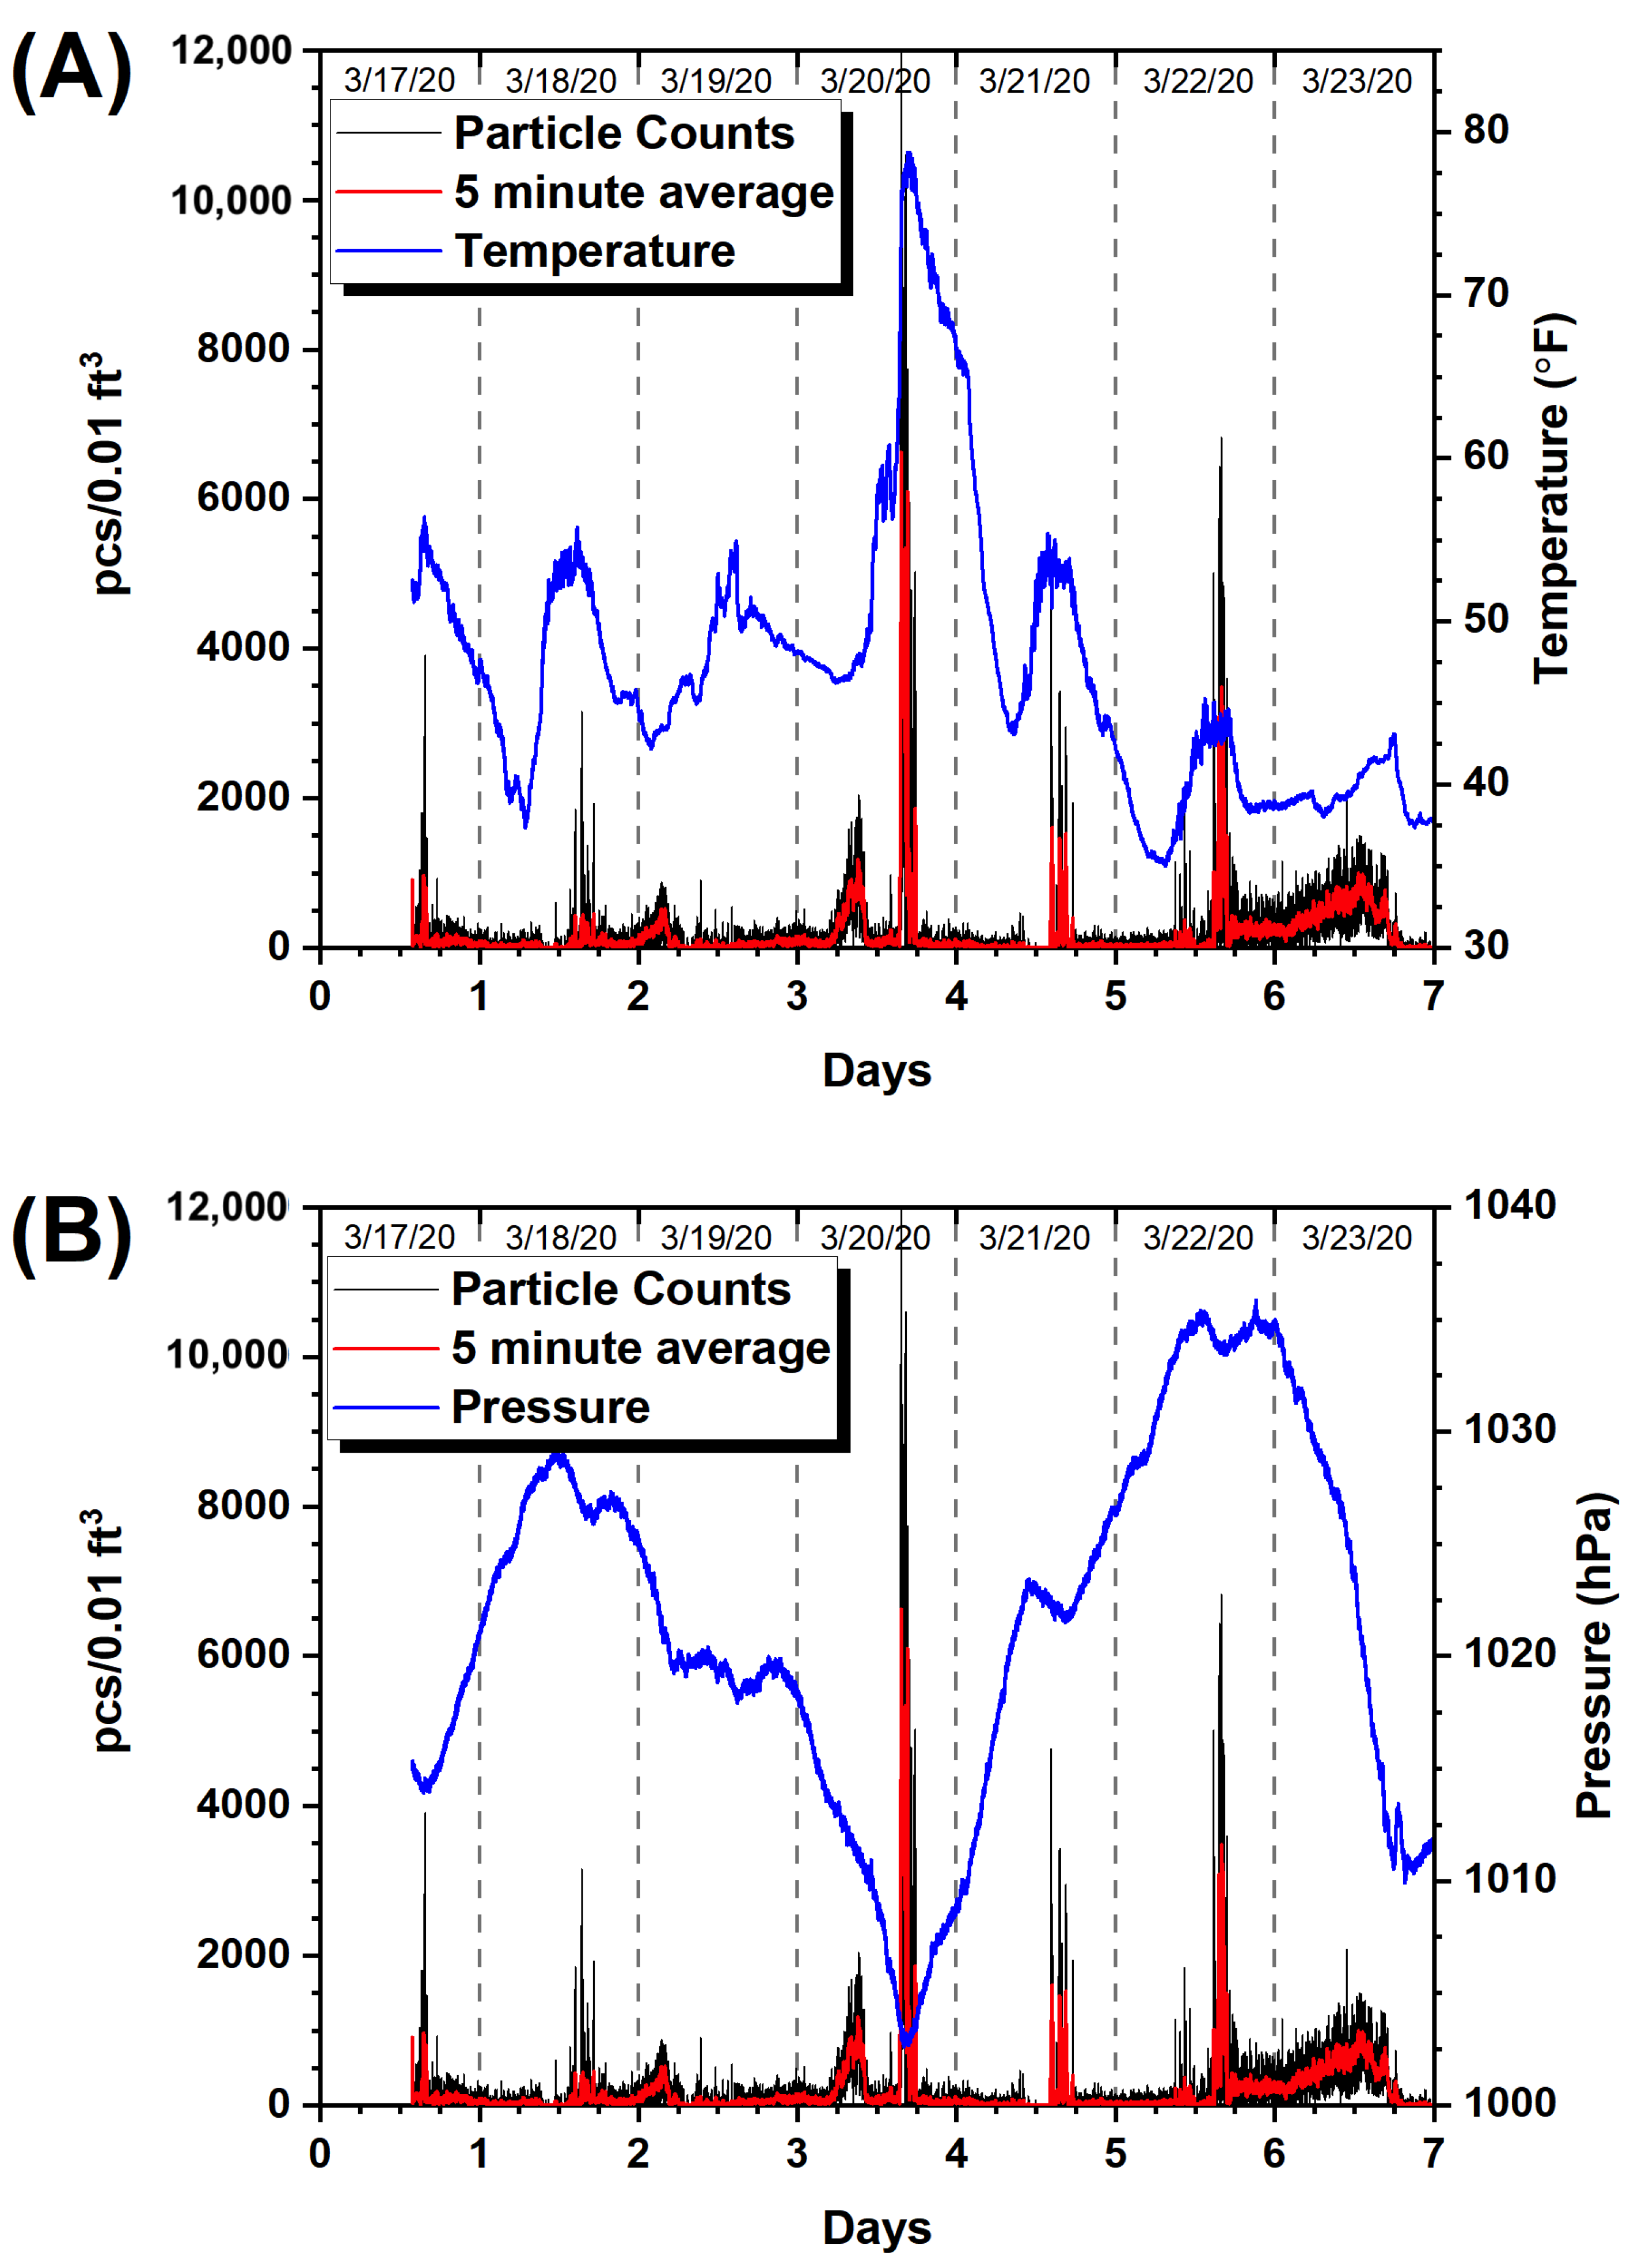
3.1. Incubator Prototype
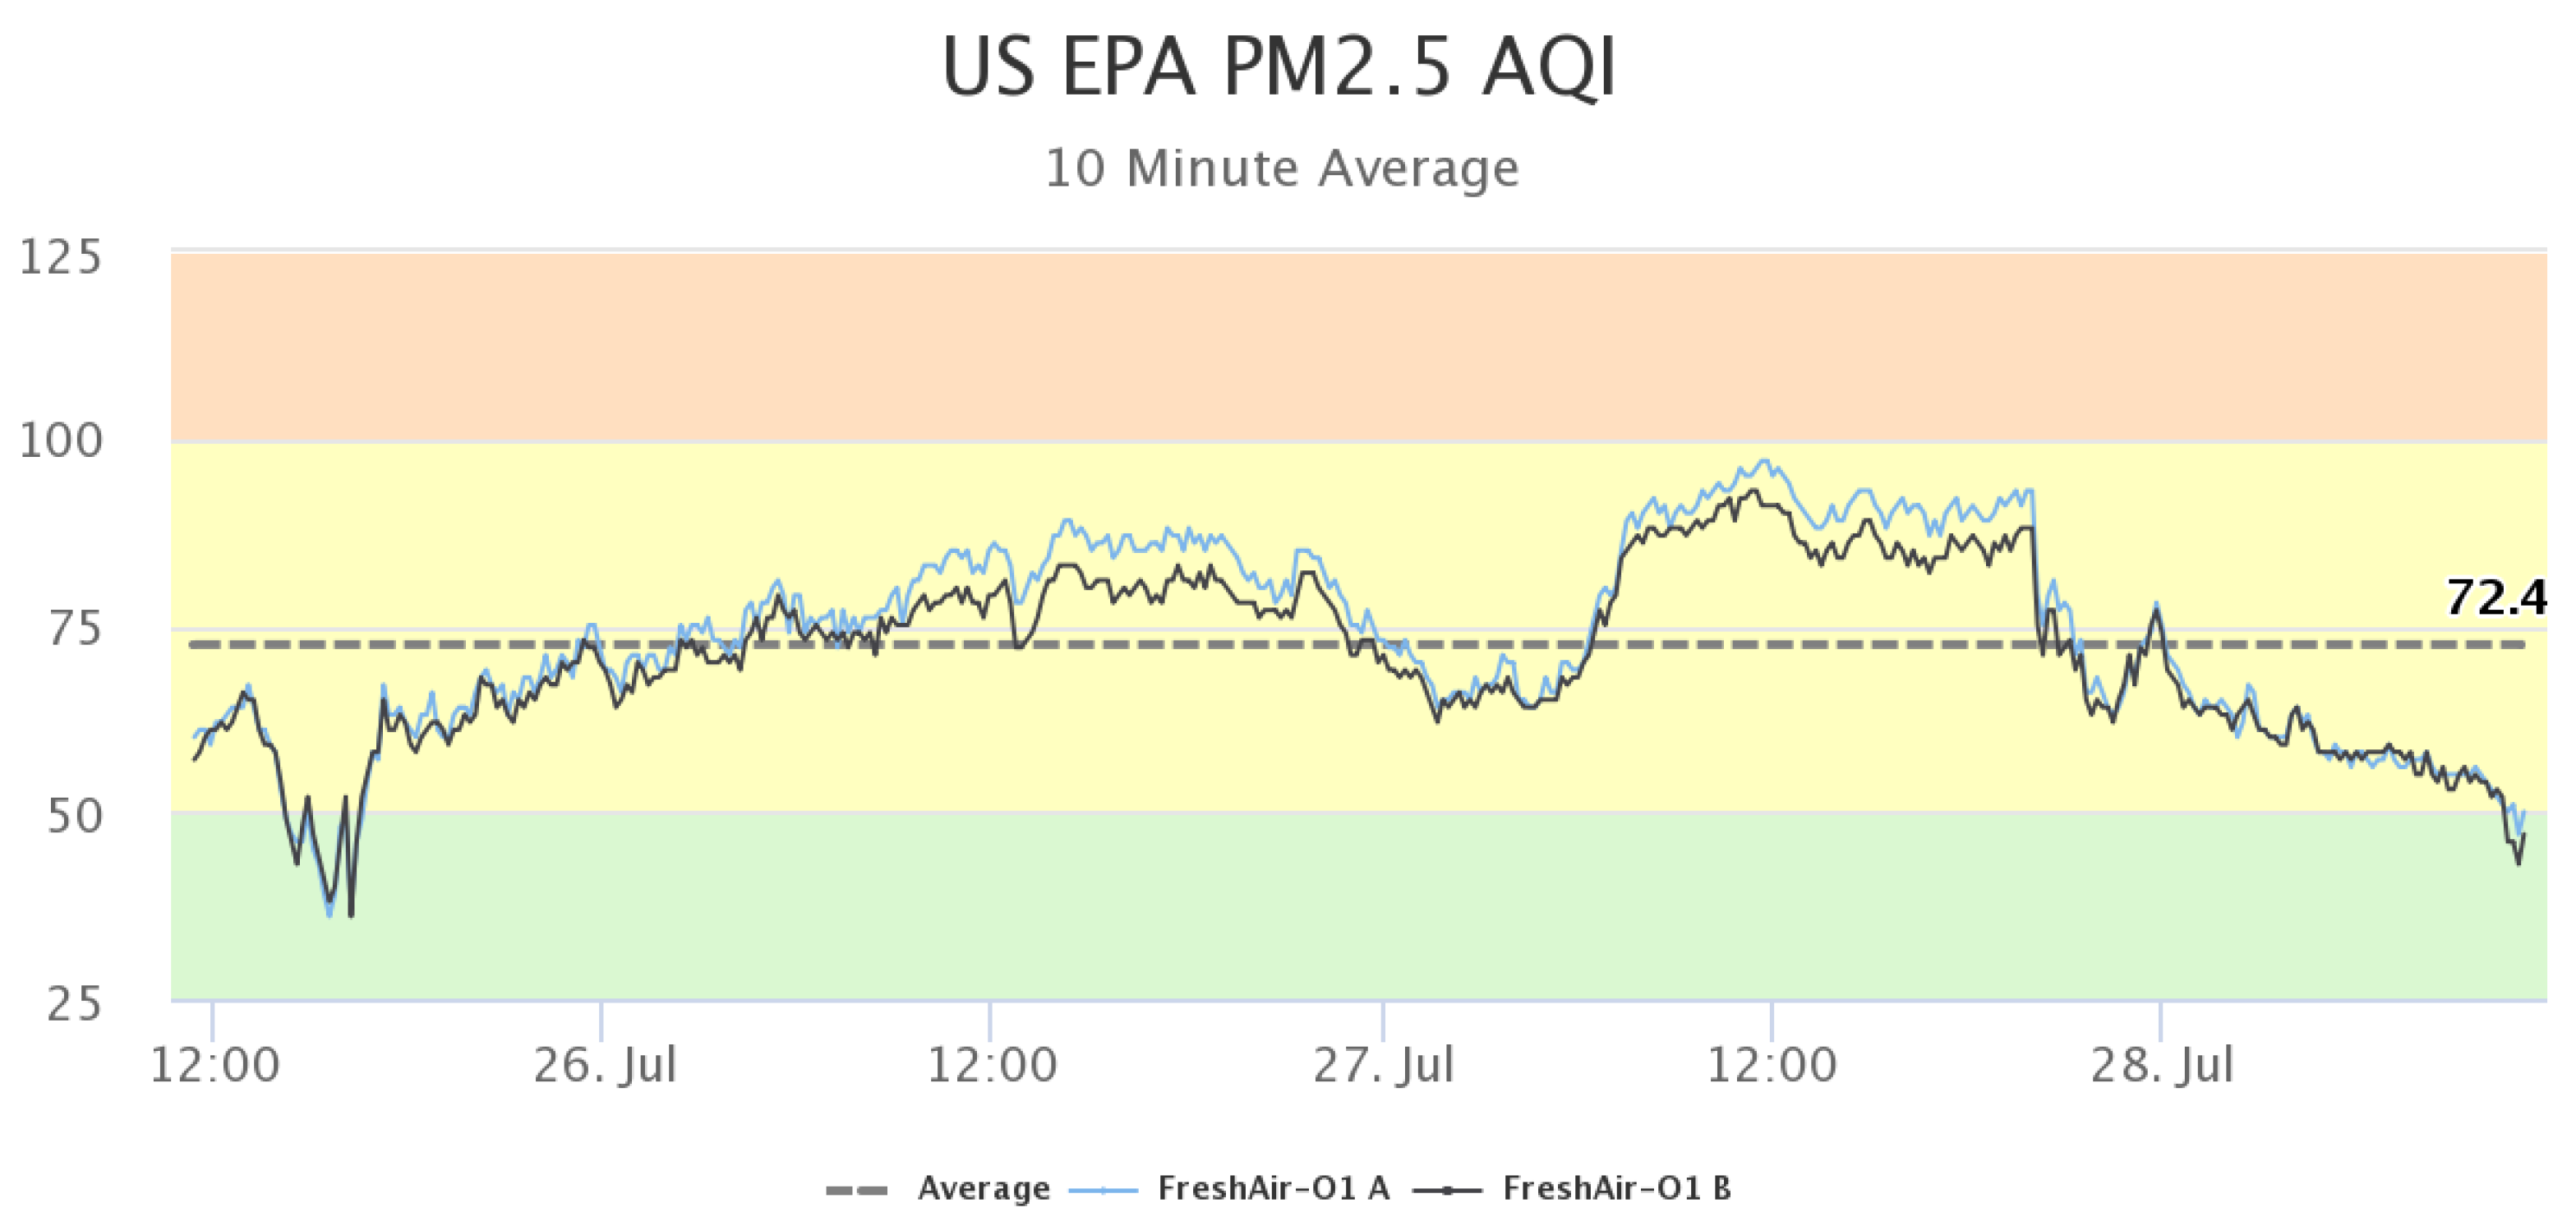
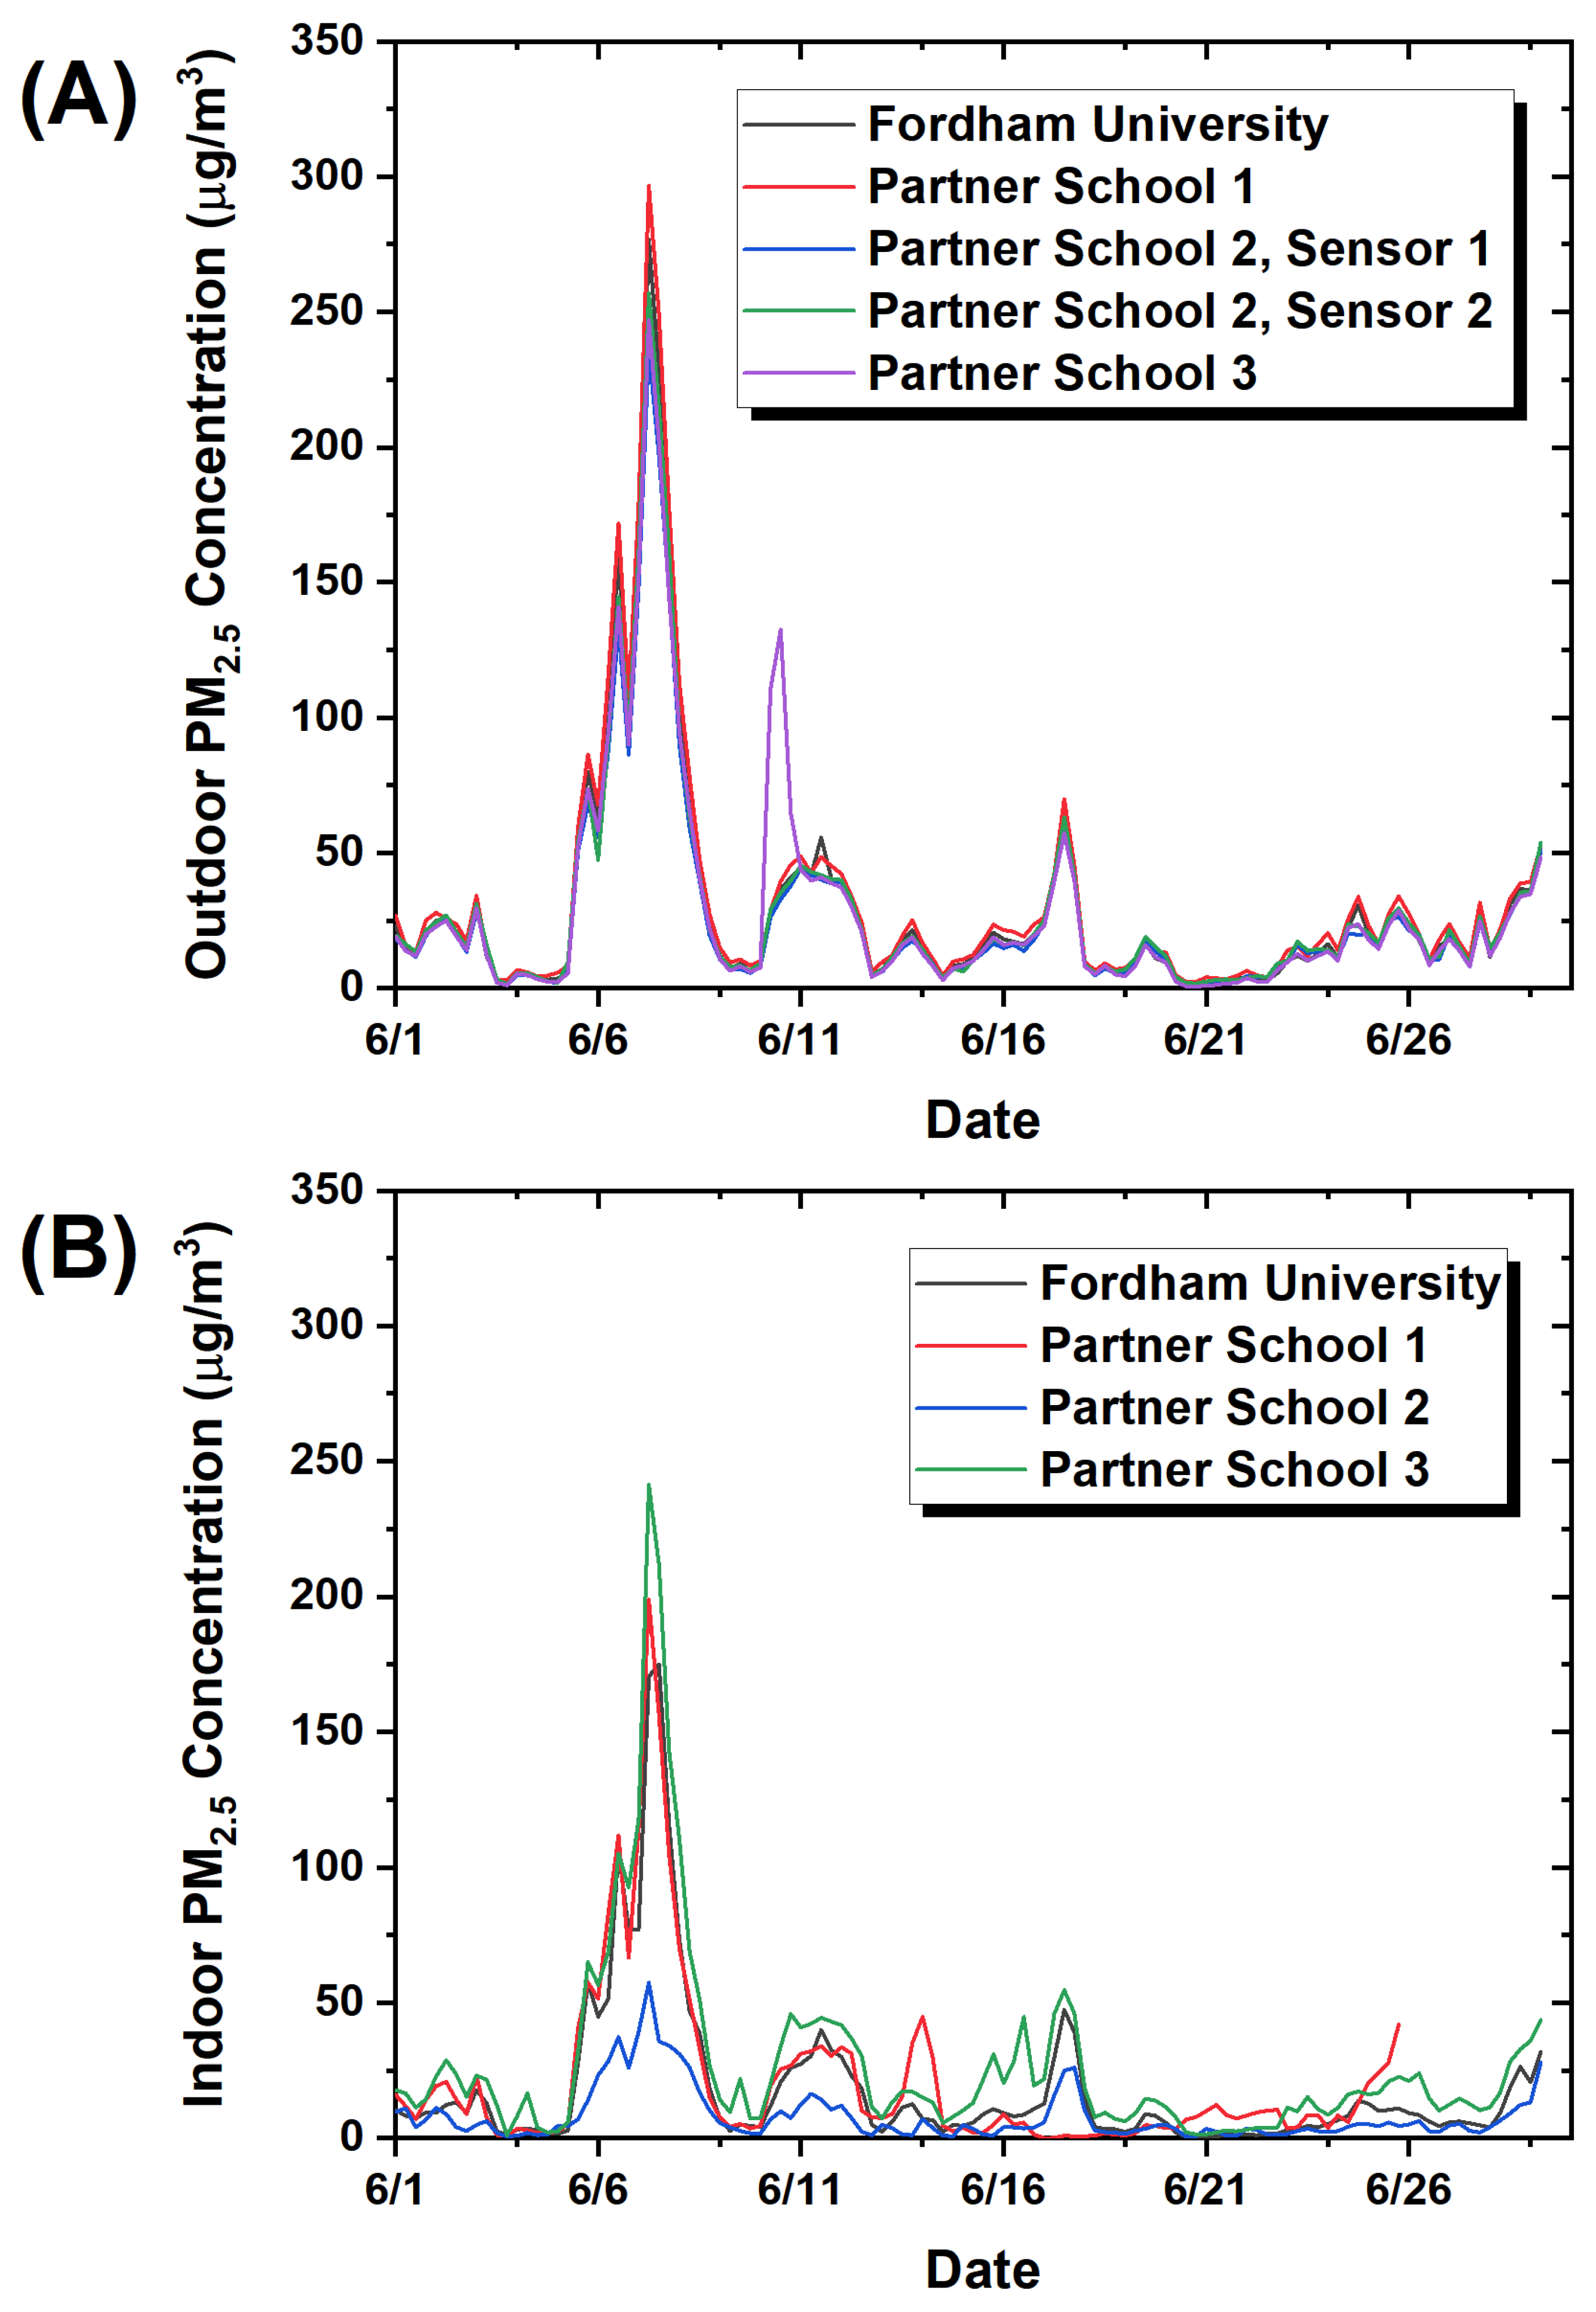
3.2. FRESH Air Schools
3.3. Curriculum Development
- What is air pollution?
- What are the causes of air pollution?
- What are the effects of air pollution?
- How do we measure air pollution?
- MS-ESS3-2: Analyze and interpret data on natural hazards, to forecast future catastrophic events, and inform the development of technologies to mitigate their effects.
- MS-ESS3-3: Apply scientific principles to design a method for monitoring and minimizing a human impact on the environment.
3.4. Webinars
4. Conclusions
Author Contributions
Funding
Institutional Review Board Statement
Informed Consent Statement
Data Availability Statement
Acknowledgments
Conflicts of Interest
Abbreviations
| AQI | Air Quality Index. |
| ESA | European Space Agency. |
| HVAC | Heating, Ventilation, and Air Conditioning. |
| NYC | New York City. |
| pcs | Particle Counts. |
| PM | Particulate Matter. |
| RTC | Real-time Clock. |
| STEM | Science, Technology, Engineering, and Mathematics. |
| STL | Stereolithography. |
| VOC | Volatile Organic Compound. |
Appendix A. Arduino Code for Incubator Prototype
- #include "RTClib.h"
- #include <Wire.h>
- #include <SPI.h>
- #include <SD.h>
- #include <HP20x_dev.h>
- #include <KalmanFilter.h>
- #include "Arduino.h"
- RTC_PCF8523 rtc;
- /* Instance */
- KalmanFilter t_filter; //temperature filter
- KalmanFilter p_filter; //pressure filter
- KalmanFilter a_filter; //altitude filter
- const int chipSelect = 10;
- int pin = 8;
- unsigned long duration;
- unsigned long starttime;
- unsigned long sampletime_ms = 30000;//sampe 30s ;
- unsigned long lowpulseoccupancy = 0;
- float ratio = 0;
- float c = 0;
- // the following variable is long because the time, measured in miliseconds,
- // will quickly become a bigger number than can be stored in an int.
- long timeSinceLastWrite = 0;
- int dataWritten = 0;
- // switch to tell if an SD card is present
- int SDPresent = 1;
- void setup()
- {
- // initialize serial communications at 9600 bps:
- Serial.begin(9600);
- Wire.begin();
- rtc.begin();
- Serial.println("****HP20x_dev by seeed studio****\n");
- Serial.println("Calculation formula: H = [8.5(101325-P)]/100 \n");
- /* Power up,delay 150ms,until voltage is stable */
- delay(150);
- /* Reset HP20x_dev */
- HP20x.begin();
- delay(100);
- if (! rtc.begin())
- {
- Serial.println("Couldn’t find RTC");
- while (1);
- }
- // see if the card is present and can be initialized:
- Serial.print("Initializing SD card...");
- if (!SD.begin(chipSelect))
- {
- Serial.println("Card failed, or not present");
- // don’t do anything more:
- while (1);
- }
- Serial.println("card initialized.");
- pinMode(pin, INPUT); //input pin for the particle sensor
- starttime = millis(); //get the current time;
- }
- void loop()
- {
- // read the value from the sensor:
- duration = pulseIn(pin, LOW);
- lowpulseoccupancy = lowpulseoccupancy + duration;
- if ((millis() - starttime) > sampletime_ms) //if the sample time == 30s
- {
- ratio = lowpulseoccupancy / (sampletime_ms * 10.0); // Integer percentage 0=>100
- c = 1.1 * pow(ratio, 3) - 3.8 * pow(ratio, 2) + 520 * ratio + 0.62; // using spec sheet curve
- Serial.print("concentration = ");
- Serial.print(c);
- Serial.println(" pcs/0.01cf");
- //Serial.println("\n");
- long Temper = HP20x.ReadTemperature();
- Serial.print("Temper:");
- float t = Temper / 100.0;
- Serial.print(t);
- Serial.println("C.");
- /*
- Serial.println("Filter:");
- Serial.print(t_filter.Filter(t));
- Serial.println("C.\n");
- */
- long Pressure = HP20x.ReadPressure();
- Serial.print("Pressure:");
- float p = Pressure / 100.0;
- Serial.print(p);
- Serial.println("hPa.");
- /*
- Serial.println("Filter:");
- Serial.print(p_filter.Filter(t));
- Serial.println("hPa\n");
- */
- writeDataToSD(c, t, p);
- lowpulseoccupancy = 0;
- starttime = millis();
- }
- delay(200);
- }
- void writeDataToSD(float sConc, float sTemp, float sPress)
- {
- // open the file. note that only one file can be open at a time,
- // so you have to close this one before opening another.
- char filename[] = "AQ000000.txt";
- DateTime now = rtc.now();
- int m = now.month();
- int d = now.day();
- int y = now.year() - 2000;
- filename[2] = m / 10 + ’0’;
- filename[3] = m % 10 + ’0’;
- filename[4] = d / 10 + ’0’;
- filename[5] = d % 10 + ’0’;
- filename[6] = y / 10 + ’0’;
- filename[7] = y % 10 + ’0’;
- File dataFile = SD.open(filename, FILE_WRITE);
- // if the file is available, write to it:
- if (dataFile)
- {
- dataFile.print(now.month(), DEC);
- dataFile.print("/");
- dataFile.print(now.day(), DEC);
- dataFile.print("/");
- dataFile.print(now.year(), DEC);
- dataFile.print(" ");
- dataFile.print(now.hour(), DEC);
- dataFile.print(":");
- dataFile.print(now.minute(), DEC);
- dataFile.print(":");
- dataFile.print(now.second(), DEC);
- dataFile.print(" ");
- dataFile.print(sConc);
- dataFile.print(" ");
- dataFile.print(sTemp);
- dataFile.print(" ");
- dataFile.println(sPress);
- dataFile.close();
- }
- Serial.print("Data written to ");
- Serial.println(filename);
- }
Appendix B. Arduino Code for Portable School Kits
- #include <Wire.h>
- #include <SPI.h>
- #include "Arduino.h"
- #include <Adafruit_GFX.h>
- #include "Adafruit_LEDBackpack.h"
- Adafruit_7segment matrix = Adafruit_7segment();
- int pin = 8;
- unsigned long duration;
- unsigned long starttime;
- unsigned long sampletime_ms = 10000;//sample 30000 = 30s ;
- unsigned long lowpulseoccupancy = 0;
- float ratio = 0;
- float c = 0;
- void setup() {
- Serial.begin(9600);
- Wire.begin();
- pinMode(pin, INPUT); //input pin for the particle sensor
- starttime = millis(); //get the current time;
- #ifndef __AVR_ATtiny85__
- Serial.begin(9600);
- Serial.println("7 Segment Backpack Test");
- #endif
- matrix.begin(0x70);
- }
- void loop() {
- duration = pulseIn(pin, LOW);
- lowpulseoccupancy = lowpulseoccupancy + duration;
- if ((millis() - starttime) > sampletime_ms) //if the sample time == 30s
- {
- ratio = lowpulseoccupancy / (sampletime_ms * 10.0); // Integer percentage 0=>100
- c = 1.1 * pow(ratio, 3) - 3.8 * pow(ratio, 2) + 520 * ratio + 0.62; // using spec sheet curve
- Serial.print("concentration = ");
- Serial.print(c);
- Serial.println(" pcs/0.01cf");
- matrix.print(c);
- matrix.writeDisplay();
- lowpulseoccupancy = 0;
- starttime = millis();
- }
- delay(200);
- }
References
- Barkjohn, Karoline K., Brett Gantt, and Andrea L. Clements. 2021. Development and application of a united states-wide correction for pm2.5 data collected with the purpleair sensor. Atmospheric Measurement Techniques 14: 4617–37. [Google Scholar] [CrossRef] [PubMed]
- Barnes, Clair, Yan Boulanger, Theo Keeping, Philippe Gachon, Nathan Gillett, Jonathan Boucher, François Roberge, Sarah Kew, Olivia Haas, Dorothy Heinrich, and et al. 2023. Climate Change More than Doubled the Likelihood of Extreme Fire Weather Conditions in Eastern Canada. Technical Report. London: Grantham Institute for Climate Change. [Google Scholar] [CrossRef]
- Beggs, Paul John, and Hilary Jane Bambrick. 2005. Is the global rise of asthma an early impact of anthropogenic climate change? Environmental Health Perspectives 113: 915–19. [Google Scholar] [CrossRef] [PubMed]
- Bohren, Craig F., and Donald R. Huffman. 1983. Absorption and Scattering of light By Small Particles. New York: Wiley. [Google Scholar]
- Brunekreef, Bert, and Bertil Forsberg. 2005. Epidemiological evidence of effects of coarse airborne particles on health. European Respiratory Journal 26: 309–18. [Google Scholar] [CrossRef] [PubMed]
- Burton, Philip J. 2023. Understanding spring wildfires in Canada’s northern forests. Global Change Biology 29: 5983–85. [Google Scholar] [CrossRef] [PubMed]
- Collins, Timothy W., and Sara E. Grineski. 2022. Racial/ethnic disparities in short-term PM2.5 air pollution exposures in the united states. Environmental Health Perspectives 130: 087701. [Google Scholar] [CrossRef] [PubMed]
- Daouda, Misbath, Lucas Henneman, Jeff Goldsmith, Marianthi-Anna Kioumourtzoglou, and Joan A. Casey. 2022. Racial/ethnic disparities in nationwide PM2.5 concentrations: Perils of assuming a linear relationship. Environmental Health Perspectives 130: 077701. [Google Scholar] [CrossRef] [PubMed]
- Draine, Bruce T., and Piotr J. Flatau. 1994. Discrete-dipole approximation for scattering calculations. Journal of the Optical Society of America A 11: 1491–99. [Google Scholar] [CrossRef]
- Environmental Protection Agency. 2011. National Emissions Inventory Data. Available online: https://www.epa.gov/air-emissions-inventories/2020-national-emissions-inventory-nei-data (accessed on 1 September 2023).
- Fongsodsri, Kamonpan, Supat Chamnanchanunt, Varunee Desakorn, Vipa Thanachartwet, Duangjai Sahassananda, Ponlapat Rojnuckarin, and Tsukuru Umemura. 2021. Particulate matter 2.5 and hematological disorders from dust to diseases: A systematic review of available evidence. Frontiers in Medicine 8: 692008. [Google Scholar] [CrossRef]
- Hadley, Odelle L. 2017. Background pm2.5 source apportionment in the remote northwestern united states. Atmospheric Environment 167: 298–308. [Google Scholar] [CrossRef]
- Hardell, Jennifer, Ellen J. Silver, Ilias Kavouras, Diana S. Lee, and Elissa Gross. 2023. Childhood asthma in the bronx, ny; the impact of pollutants on length of hospital stay. Journal of Asthma 60: 2160–69. [Google Scholar] [CrossRef] [PubMed]
- Kaur, Savneet, David Rosenstreich, Krystal L. Cleven, Simon Spivack, Joseph Grizzanti, Marina Reznik, and Sunit P. Jariwala. 2022. Severe asthma in adult, inner-city predominantly african–american and latinx population: Demographic, clinical and phenotypic characteristics. Journal of Asthma 59: 2341–51. [Google Scholar] [CrossRef] [PubMed]
- Kheirbek, Iyad, Jay Haney, Sharon Douglas, Kazuhiko Ito, and Thomas Matte. 2016. The contribution of motor vehicle emissions to ambient fine particulate matter public health impacts in new york city: A health burden assessment. Environmental Health 15: 89. [Google Scholar] [CrossRef] [PubMed]
- Kordit, David S., Marina Reznik, Cheng-Shiun Leu, and Sunit P. Jariwala. 2020. Longitudinal trends in asthma emergency department visits, pollutant and pollen levels, and weather variables in the bronx from 2001–2008. Journal of Asthma 57: 487–94. [Google Scholar] [CrossRef] [PubMed]
- Liu, Jiawen, Lara P. Clark, Matthew J. Bechle, Anjum Hajat, Sun-Young Kim, Allen L. Robinson, Lianne Sheppard, Adam A. Szpiro, and Julian D. Marshall. 2021. Disparities in air pollution exposure in the united states by race/ethnicity and income, 1990–2010. Environmental Health Perspectives 129: 127005. [Google Scholar] [CrossRef]
- Mackowski, Daniel W., and Michael I. Mishchenko. 1996. Calculation of the t-matrix and the scattering matrix for ensembles of spheres. Journal of the Optical Society of America A 13: 2266–78. [Google Scholar] [CrossRef]
- Mackowski, Daniel W., and Michael I. Mishchenko. 2011. A multiple sphere t-matrix fortran code for use on parallel computer clusters. Journal of Quantitative Spectroscopy and Radiative Transfer 112: 2182–92. [Google Scholar] [CrossRef]
- Martins, Nuno R., and Guilherme Carrilho da Graça. 2018. Impact of pm2.5 in indoor urban environments: A review. Sustainable Cities and Society 42: 259–75. [Google Scholar] [CrossRef]
- McArdle, Cristin E., Tia C. Dowling, Kelly Carey, Jourdan DeVies, Dylan Johns, Abigail L. Gates, Zachary Stein, Katharina L. van Santen, Lakshmi Radhakrishnan, Aaron Kite-Powell, and et al. 2023. Asthma-associated emergency department visits during the canadian wildfire smoke episodes—United States. MMWR Morbidity and Mortality Weekly Report 72: 926–32. [Google Scholar] [CrossRef]
- McDuffie, Erin E., Randall V. Martin, Joseph V. Spadaro, Richard Burnett, Steven J. Smith, Patrick O’Rourke, Melanie S. Hammer, Aaron van Donkelaar, Liam Bindle, Viral Shah, and et al. 2021. Source sector and fuel contributions to ambient pm2.5 and attributable mortality across multiple spatial scales. Nature Communications 12: 3594. [Google Scholar] [CrossRef]
- Mie, Gustav. 1908. Beiträge zur optik trüber medien, speziell kolloidaler metallösungen. Annalen der Physik 330: 377–445. [Google Scholar] [CrossRef]
- Mikati, Ihab, Adam F. Benson, Thomas J. Luben, Jason D. Sacks, and Jennifer Richmond-Bryant. 2018. Disparities in distribution of particulate matter emission sources by race and poverty status. American Journal of Public Health 108: 480–85. [Google Scholar] [CrossRef] [PubMed]
- Nemmar, Abderrahim, Peter H. M. Hoet, Benedicte Vanquickenborne, David Dinsdale, Michiel Thomeer, Marc F. Hoylaerts, Hubert Vanbilloen, Luc Mortelmans, and Benoit Nemery. 2002. Passage of inhaled particles into the blood circulation in humans. Circulation 105: 411–14. [Google Scholar] [CrossRef]
- Nguyen, Nam H., Huy X. Nguyen, Thuan T. B. Le, and Chinh D. Vu. 2021. Evaluating low-cost commercially available sensors for air quality monitoring and application of sensor calibration methods for improving accuracy. Open Journal of Air Pollution 10: 1–17. [Google Scholar] [CrossRef]
- Nurmagambetov, Tursynbek, Robin Kuwahara, and Paul Garbe. 2018. The economic burden of asthma in the united states, 2008–2013. Annals of the American Thoracic Society 15: 348–56. [Google Scholar] [CrossRef]
- NY Department of Health. 2020. Asthma Dashboard. Available online: https://apps.health.ny.gov/public/tabvis/PHIG_Public/asthma/# (accessed on 1 September 2023).
- Orellana, Renan Eduardo, Ismael Moradeyo, and Paul Uzodinma. 2021. Decades in crisis: Adapting a social-ecological framework to assess structural elements impacting asthma rates in the south bronx. Social Medicine 15: 21–31. [Google Scholar]
- Parisien, Marc-André, Quinn E. Barber, Mike D. Flannigan, and Piyush Jain. 2023. Broadleaf tree phenology and springtime wildfire occurrence in boreal canada. Global Change Biology 29: 6106–19. [Google Scholar] [CrossRef] [PubMed]
- Patella, Vincenzo, Giovanni Florio, Diomira Magliacane, Ada Giuliano, Maria Angiola Crivellaro, Daniela Di Bartolomeo, Arturo Genovese, Mario Palmieri, Amedeo Postiglione, Erminia Ridolo, and et al. 2018. Urban air pollution and climate change: “the decalogue: Allergy safe tree” for allergic and respiratory diseases care. Clinical and Molecular Allergy 16: 20. [Google Scholar] [CrossRef]
- Schraufnagel, Dean E. 2020. The health effects of ultrafine particles. Experimental Molecular Medicine 52: 311–17. [Google Scholar] [CrossRef]
- Singh, Nandita, Vishnu Murari, Manish Kumar, Shyamal C. Barman, and Tirthankar Banerjee. 2017. Fine particulates over south asia: Review and meta-analysis of pm2.5 source apportionment through receptor model. Environmental Pollution 223: 121–36. [Google Scholar] [CrossRef]
- Soong, Weily, Bradley E. Chipps, Sean O’Quinn, Jennifer Trevor, Warner W. Carr, Laura Belton, Frank Trudo, and Christopher S. Ambrose. 2021. Health-related quality of life and productivity among us patients with severe asthma. Journal of Asthma and Allergy 14: 713–25. [Google Scholar] [CrossRef] [PubMed]
- van de Hulst, Hendrik C. 1957. Light Scattering by Small Particles. Structure of Matter Series; New York: Wiley. [Google Scholar]
- Veremchuk, Lyudmila Vasilievna, Vera Innokentievna Yankova, Tatyana Isaakovna Vitkina, Anna Vladimirovna Nazarenko, and Kirill Sergeevich Golokhvast. 2016. Urban air pollution, climate and its impact on asthma morbidity. Asian Pacific Journal of Tropical Biomedicine 6: 76–79. [Google Scholar] [CrossRef]
- Waterman, Peter C. 1965. Matrix formulation of electromagnetic scattering. Proceedings of the IEEE 53: 805–12. [Google Scholar] [CrossRef]
- Waterman, Peter C. 1971. Symmetry, unitarity, and geometry in electromagnetic scattering. Physical Review D 3: 825–39. [Google Scholar] [CrossRef]
- Witonsky, Jonathan, Ryan Abraham, Jennifer Toh, Tulsi Desai, Mili Shum, David Rosenstreich, and Sunit P. Jariwala. 2019. The association of environmental, meteorological, and pollen count variables with asthma-related emergency department visits and hospitalizations in the bronx. Journal of Asthma 56: 927–37. [Google Scholar] [CrossRef]


| Component | Part Number | Vendor |
|---|---|---|
| Microcontroller | Arduino Uno | Adafruit |
| Grove Base Shield V2.0 | 103030000 | SeeedStudio |
| Grove Dust Sensor | PPD42NS | SeeedStudio |
| Temperature, Humidity, Pressure Sensor | BME280 | SeeedStudio |
| Data Logger Shield | 1141 | Adafruit |
| 9VDC Power Supply | 63 | Adafruit |
| PVC Pipe, 3 × 3 | – | Home Depot |
| 80 mm fan | – | Amazon |
| SD Card, 8 GB | 1294 | Adafruit |
| Component | Part Number | Vendor |
|---|---|---|
| Microcontroller | Seeeduino V4.3 | SeeedStudio |
| Grove Dust Sensor | PPD42NS | SeeedStudio |
| 7-Segment Display | 880 | Adafruit |
| 9 V Battery Holder | 67 | Adafruit |
| Jumpers F/M 3 | 1953 | Adafruit |
| 9 V Battery | 1321 | Adafruit |
| Level of Concern | Values of Index | Concentration Range (g/m) |
|---|---|---|
| Good | 0–50 | 0–12 |
| Moderate | 51–100 | 12.1–35.4 |
| Unhealthy for Sensitive Individuals | 101–150 | 35.5–55.4 |
| Unhealthy | 151–200 | 55.5–150.4 |
| Very Unhealthy | 201–300 | 150.5–250.4 |
| Hazardous | 300 and higher | 250.5 and higher |
Disclaimer/Publisher’s Note: The statements, opinions and data contained in all publications are solely those of the individual author(s) and contributor(s) and not of MDPI and/or the editor(s). MDPI and/or the editor(s) disclaim responsibility for any injury to people or property resulting from any ideas, methods, instructions or products referred to in the content. |
© 2023 by the authors. Licensee MDPI, Basel, Switzerland. This article is an open access article distributed under the terms and conditions of the Creative Commons Attribution (CC BY) license (https://creativecommons.org/licenses/by/4.0/).
Share and Cite
Holler, S.; Sankar, U.; McNeil, M.; Knuts, M.; Jack, J. Education for Environmental Justice: The Fordham Regional Environmental Sensor for Healthy Air. Soc. Sci. 2023, 12, 681. https://doi.org/10.3390/socsci12120681
Holler S, Sankar U, McNeil M, Knuts M, Jack J. Education for Environmental Justice: The Fordham Regional Environmental Sensor for Healthy Air. Social Sciences. 2023; 12(12):681. https://doi.org/10.3390/socsci12120681
Chicago/Turabian StyleHoller, Stephen, Usha Sankar, Mark McNeil, Melanie Knuts, and Jahred Jack. 2023. "Education for Environmental Justice: The Fordham Regional Environmental Sensor for Healthy Air" Social Sciences 12, no. 12: 681. https://doi.org/10.3390/socsci12120681
APA StyleHoller, S., Sankar, U., McNeil, M., Knuts, M., & Jack, J. (2023). Education for Environmental Justice: The Fordham Regional Environmental Sensor for Healthy Air. Social Sciences, 12(12), 681. https://doi.org/10.3390/socsci12120681