Abstract
A modest, efficient, and sensitive chemically modified electrode was fabricated for sensing curcumin (CRC) through an electrochemically polymerized titan yellow (TY) modified carbon paste electrode (PTYMCPE) in phosphate buffer solution (pH 7.0). Cyclic voltammetry (CV) linear sweep voltammetry (LSV) and differential pulse voltammetry (DPV) approaches were used for CRC detection. PTYMCPE interaction with CRC suggests that the electrode exhibits admirable electrochemical response as compared to bare carbon paste electrode (BCPE). Under the optimized circumstances, a linear response of the electrode was observed for CRC in the concentration range 2 × 10⁻⁶ M to 10 × 10−6 M with a limit of detection (LOD) of 10.94 × 10⁻⁷ M. Moreover, the effort explains that the PTYMCPE electrode has a hopeful approach for the electrochemical resolution of biologically significant compounds. Additionally, the proposed electrode has demonstrated many advantages such as easy preparation, elevated sensitivity, stability, and enhanced catalytic activity, and can be successfully applied in real sample analysis.
1. Introduction
Naturally occurring phytochemical in rhizomes of Curcuma longa or turmeric is poly phenol curcumin (1, 7 bis [4-hydroxy-3-methoxy phenyl]-1, 6, heptadione-3, 5-dione), commonly known for its medicinal properties. In recent years, the primary yellow bioactive component of turmeric, CRC, has received considerable attention in medicine [1,2,3]. It is known for its antiviral, antifungal, antibacterial, antioxidant [4], anti-inflammatory [5], antitumor [6] activities without any side effects [7,8,9]. It also regulates the substitutive typical pathways in the nervous system and also in the handling of dementia, multiple sclerosis, and Alzheimer’s disease [10,11,12]. Yellow-colored CRC is a common food additive used as a spicy and coloring agent. CRC adulteration with non-permitted colored compounds for economic gain is recently observed. Excessive usage of these compounds beyond limits can cause infertility, liver damage, cancer, birth defects, and allergy [13]. Hence, it is very much essential to develop a suitable procedure to monitor the CRC in the presence of non-permitted dyes.
The existence of the methoxy group in the phenyl moiety of CRC makes it exhibit redox properties. In addition, CRC can form stable complexes [14,15,16,17,18,19,20] with metallic cations such as Fe2+, Ni2+, Fe3+, and Co2+ due to its chelating agent property. Medicinal uses of CRC have created tremendous interest in research and a facile process is essential for the reliable determination of the concentration of CRC [21]. Analytical methods such as flow injection analysis [22], capillary electrophoresis [23], thin layer chromatography [24], high-performance liquid chromatography [25,26] are already reported for CRC determination. These methods require complicated sample preparation with a lack of sensitivity. Electroanalytical method is an extremely sensitive procedure to study the redox of behavior biologically important molecules in pharmaceutical, food, and biologicals samples. Because of its simple operation protocol, rapid output with high sensitivity and selectivity. The method has been adopted for the investigation of different electroactive compounds. CRC has methoxy polyphenolic and phenolic groups accompanied by alkene, sufficient enough to become electroactive [27,28,29,30,31,32,33,34,35,36,37,38,39]. Existing electrochemical systems for CRC such as carbon nanotube–carboxymethylcellulose electrode [40], cadmium oxide nano-particles-ionic liquid (1,3-dipropylimidazolium bromide as a binder) modified carbon paste electrode [41] graphene oxide modified glassy carbon electrode [42] multiwalled carbon nanotube modified basal plane pyrolytic graphite electrode [43], etc., were reported.
An electro-polymerization of organic dyes is widely reported as a modifier for electrodes such as poly (aniline blue) [44], poly (nigrosine), [45] poly (methyl blue) [46] poly (thiazole yellow-G), or titan yellow [47], etc. Electro-polymerization of dyes improves the sensitivity, stability, and conductivity properties of the electrode [48]. It is of great interest to cultivate a method for CRC determination with simplicity and better sensitivity under physiological situations and to predict the electrochemical reaction mechanism of CRC. The electrochemical behavior of CRC at BCPE and PTYMCPE was systematically investigated. A voltammetric method to determine CRC at the PTYMCPE under physiological conditions is presented. The probable oxidation mechanism of CRC is shown below in Scheme 1.
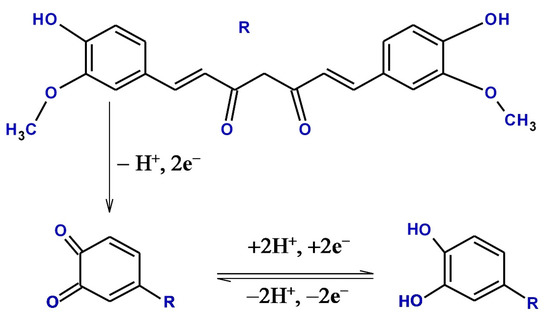
Scheme 1.
Structure and oxidation reaction mechanism of CRC.
2. Methods and Materials
2.1. Reagents
CRC (analyte), riboflavin (RF), and titan yellow (TY) were purchased from Molychem, Mumbai, India. Disodium hydrogen phosphate (Na2HPO4), sodium dihydrogen phosphate (NaH2PO4), and potassium ferrocyanide K4[Fe(CN)6] were obtained from Nice Chemicals, Cochin, India. Graphite (150 mesh) powder was acquired from Nice Chemicals, India. The natural food supplement (liquid) was bought from the neighboring general store, Madikeri, India. One millimeter of natural food supplement liquid was diluted with water (50 mL) and used for the analysis. No pretreatment is required for the real sample. Other chemicals of analytical grade were used without any additional refining. The solution of CRC was prepared in alcohol and other solutions were prepared in distilled water. The entire investigation was carried out at the normal laboratory temperature (27 ± 2 °C).
2.2. Instrumentation
An electroanalyser of model CHI 6038E (CH Instruments, Inc. Austin, TX, USA) was used to perform all the electrochemical studies. A conventional three-electrode system was used for the measurements. PTYMCPE, saturated calomel electrode (SCE), and platinum wire were, respectively, used as working, reference, and counter electrodes. The surface morphology of the electrode was examined through field emission scanning electron microscopy (FESEM) operating at 5.00 kV obtained from DST—PURSE Laboratory, Mangalore University, Mangalore, India.
2.3. Development of BCPE
Graphite powder was mixed well with silicone oil in the ratio of 60:40 (w/w) in a mortar and pestle until a consistent paste is produced. A fraction of the paste was packed tightly in the cavity of a Teflon tube with a 3 mm internal diameter. The electrical contact was provided by copper wire attached to the paste at the end of the tube. The electrode surface was smoothened with tissue paper for a uniform surface.
3. Results and Discussion
3.1. Surface Morphology of Developed BCPE and PTYMCPE
The surface morphological investigation of BCPE and PTYMCPE was carried out by FESEM. Figure 1a,b depicts the morphological characterization of both electrodes. BCPE surface explores rough, porous, and irregular-shaped arrangements. The surface of the PTYMCPE discloses a uniform, compact deposition of thin TY coats on the electrode. This exactly differentiates the electrodes, showing the deposition of the modifier on BCPE.
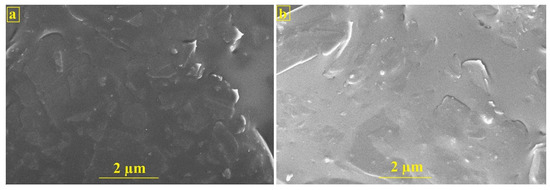
Figure 1.
FESEM images of BCPE (a) and PTYMCPE (b).
3.2. PTYMCPE Preparation
Figure 2 represents the CV cycles (10 cycles) for electro-polymerization of TY [49] on the surface of carbon paste electrode (CPE). Electro-polymerization is carried out in the potential range between −0.25 V and +1.75 V in 0.1 M PBS for 10 cycles at pH 7.0 containing 1 × 10⁻⁴ M TY solution. The 10 polymerization CV cycles afford the optimum peak current response with improved sensitivity for the redox reaction of CRC. So, 10 CV cycles are chosen as optimum for the polymerization of TY on the CPE. The resultant plot represents that the decrease in current with the increase in the number of CV cycles. This indicates the conversion of the monomer of TY into the polymer film of TY on the CPE surface.
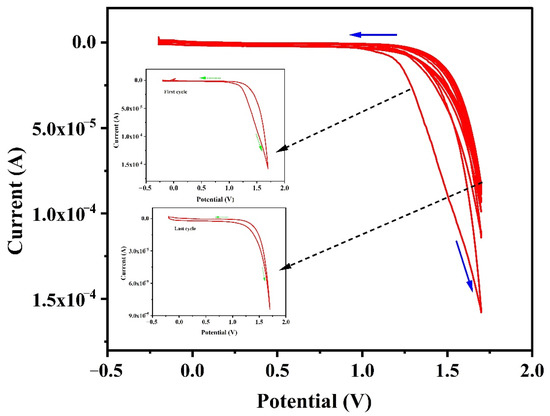
Figure 2.
Cyclic voltammogram of the electro-polymerization of 1 × 10⁻⁴ M TY at CPE in 0.1 M PBS at pH 7.0 for 10 cycles with a sweep rate of 0.1 V/s.
3.3. Electrochemical Behavior of K4[Fe(CN)6] at PTYMCPE
The electrochemical behavior of PTYMCPE was investigated using 0.1 mM K4[Fe(CN)6] as a standard electrochemical redox probe (Figure 3). The cyclic voltammogram developed indicates that the redox peak currents of PTYMCPE (solid line) are higher than the BCPE (dotted line). The PTYMCPE shows a pair of redox peaks with anodic peak current (Ipa) = 2.95 µA, cathodic peak current (Ipc) = 2.21 µA and in case BCPE Ipa = 0.89 µA, Ipc = 0.64 µA. This has shown the excellent catalytic activity of PTYMCPE as compared to BCPE.
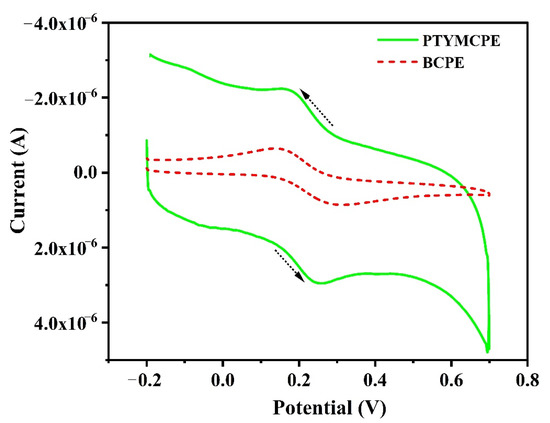
Figure 3.
Electrochemical response of 0.1 mM K4[Fe(CN)6] at BCPE (dotted line), PTYMCPE (solid line) in 0.1 M KCl at scan rate of 0.1 V/s.
3.4. Electrocatalytic Oxidation of CRC at PTYMCPE Using CV, DPV and LSV
CV is an effective tool to examine the electrochemical behaviour of analytes. The electrochemical behavior of CRC at BCPE (dotted line) and PTYMCPE (solid line) in pH 6.5 PBS is shown in Figure 4a. The presence of phenolic hydroxyl and methoxy phenol functional groups on the molecular structure of the CRC makes it oxidize electrochemically. BCPE locates the CRC anodic peak (Epa) and cathodic peak (Epc) at 0.212 V and 0.156 V, respectively, with current responses of Ipa = 0.13 µA and Ipc = 0.08 µA. The potential difference of the reversible peaks was found to be 0.056 V. On the modification of the electrode with poly (TY), the voltammogram has shown enhancement in peak currents. The values of Epa and Epc were found at 0.239 V and 0.116 V and the potential difference found was 0.123 V. In addition, there was an increase in peak currents (Ipa = 0.91 µA, Ipc = 0.97 µA) detected due to the enhancement in the reversibility of the electron transfer procedure and the greater surface area of the layer. This proposes an effective oxidation reaction of CRC at PTYMCPE.
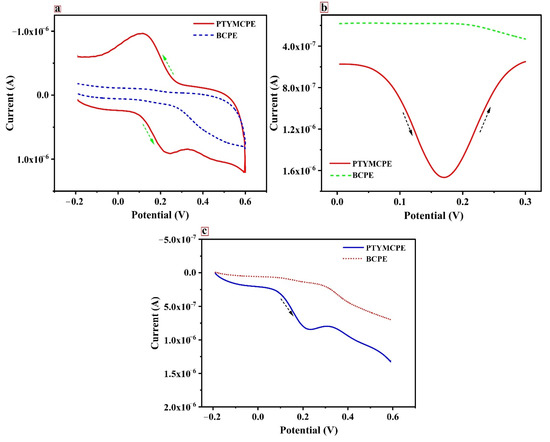
Figure 4.
(a) Cyclic voltammogram of CRC (1 × 10⁻⁵ M) at BCPE (dotted line) and PTYMCPE (solid line) in 0.1 M PBS, 6.5 pH at the sweep rate of 0.1 V/s. (b) Differential pulse voltammogram of solution of CRC (1 × 10⁻⁵ M) at PTYMCPE (solid line) and BCPE (dotted line) in 0.1 M PBS, 6.5 pH at the sweep rate of 0.1 V/s. (c) Linear sweep voltammogram of CRC (1 × 10⁻⁵ M) at BCPE (dotted line) and PTYMCPE (solid line) in 0.1 M PBS of pH 6.5, at a sweep rate of 0.1 V/s.
Figure 4b describes the responses of DPV for the electrochemical reaction of 1 × 10⁻⁵ M of CRC at PTYMCPE (solid line) and BCPE (dotted line). The peak potential (Ep) for the CRC oxidation at PTYMCPE was detected at 0.170 V with a peak current of 1.66 µA and the peak potential of CRC at the BCPE was at 0.163 V with a peak current of 0.18 µA. The peak current enhancement was observed at PTYMCPE. The CRC (1 × 10⁻⁵ M) behavior at PTYMCPE (solid line) and BCPE (dotted line) using LSV are illustrated in Figure 4c. It was observed from the response of the electrodes that the peak potential for the reaction of CRC at PTYMCPE was at 0.229 V with a peak current of 0.84 µA and that of BCPE was at 0.216 V with a peak current of 0.13 µA. Therefore, enhanced CRC detection was observed significantly at PTYMCPE. This shows that the polymer-modified electrode increases the electrochemical performance of the analyte considerably.
3.5. Effect of Solution pH on PTYMCPE
The electrochemical behavior of CRC in 0.1 M PBS is studied at different pH (5.5 to 8.0) at PTYMCPE surface through LSV (Figure 5a). It has been shown that the peak potential and electrocatalytic peak current depend on the pH of the solution. Additionally, it is evident from Figure 5b that the shift of the peak potential (Ep) towards the negative potential with the rise in pH may indicate that the protons are involved directly in CRC oxidation, obeying the following equation: Epa (V) = −0.0678 pH + 0.6846 (R = 0.993). Slope 0.067 (experimental) ≈ 0.059 (theoretical) shows the transfer of equal number of proton and electron in the reaction [50,51]. It is observed that the peak current of CRC reaches its highest value at pH 6.5 and then gradually decreases with an increase in pH (Figure 5c). Hence, pH 6.5 is considered the optimum pH for the determination of CRC. In addition to this, the anodic peak potential (Epa) of CRC at PTYMCPE shifts towards lower negative values with the increase in the pH of the buffer solution.
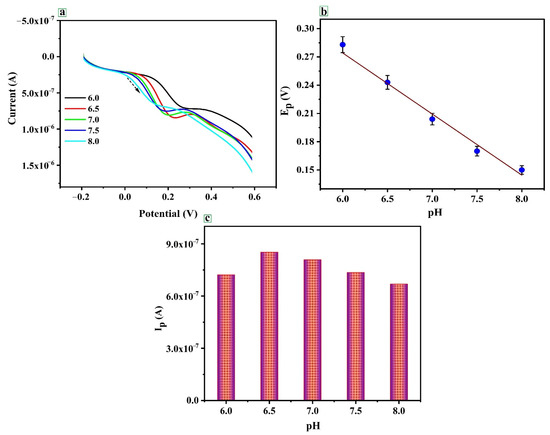
Figure 5.
(a) Cyclic voltammogram of CRC (1 × 10⁻⁵ M) at PTYMCPE in 0.1 M PBS at different pH values, 6.0, 6.5, 7.0, 7.5, 8.0 (b) Epa vs. pH. (c) Ipa vs. pH.
3.6. Scan Rate Effect towards Electrocatalytic Oxidation of CRC
The scan rate influences the electrocatalytic oxidation of the CRC on the PTYMCPE were investigated by LSV; the results are shown in Figure 6. It illustrates the influence of scan rate on electrocatalytic oxidation of CRC on PTYMCPE. Figure 6a shows that the anodic peak current increases linearly with increasing scan rate in the range from 0.1 V/s to 0.225 V/s. In addition, the plot of anodic peak current (Ipa) against the scan rate is shown in Figure 6b. It is evident from the graph that the current varies linearly with the scan rate. The linear regression equation is Ipa (µA) = 0.264 + 4.96 v (V s−1) with a correlation coefficient of 0.99. This confirms that the electrochemical behavior of CRC at the modified electrode was adsorption-controlled.
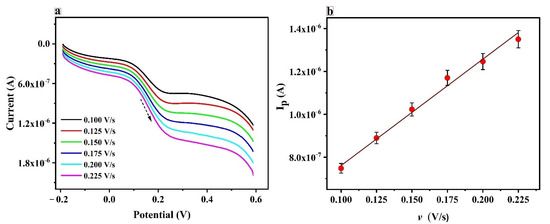
Figure 6.
(a) Linear sweep voltammogram of CRC (1 × 10⁻⁵ M) at PTYMCPE in 0.1 M PBS of pH 6.5 at different scan rates (0.1 to 0.225 V/s). (b) Anodic peak current (Ipa) vs. scan rate (v).
3.7. Electrochemical Response of RF at PTYMCPE
Figure 7a depicts the LSV plot of current versus the potential for RF. The dashed line in the graph corresponds to the voltammogram of RF at BCPE and the solid line in the graph depicts the voltammogram obtained at PTYMCPE. Fortunately, the absolute values of the peak current received for the probe are larger at PTYMPCE than at the BCPE. The results indicate that the PTYMCPE holds a huge surface area and exceptional catalytic activity on the electrode surface.
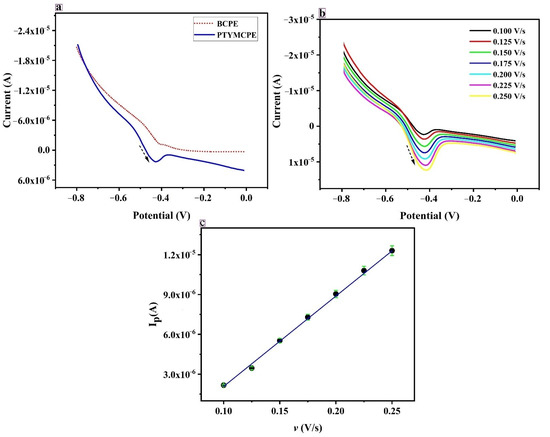
Figure 7.
(a) Linear sweep voltammogram of RF at BCPE (dotted line) and PTYMCPE (solid line) at 6.5 pH, at a sweep rate of 0.1 V/s in 0.1 M PBS. (b) Linear sweep voltammogram of RF at PTYMCPE in 0.1 M PBS of pH 6.5 at different scan rates (0.100 V/s to 0.250 V/s). (c) Anodic peak current (Ipa) vs. scan rate (v).
The scan rate effect on the electrochemical response of RF was studied in the range from 0.100 V/s to 0.250 V/s; the outcome is shown in Figure 7b. It is seen that, with the increase in the scan rate, the peak current gradually increases along with the scan rate. The rapport between the scan rate and the peak current is derived and the results show that the peak current is proportional to the scan rate in the range 0.100 V/s to 0.250 V/s. It indicates that the reaction taking place due to the electron transfer of RF on PTYMCPE was adsorption controlled.
From Figure 7c, the peak current is varied with the increase in the scan rate. A linear relationship between the scan rate and the peak current is established, and a straight line is obtained with the linear regression equation Ipa (µA) = −4.899 + 69.3171 v (V/s), R = 0.999.
3.8. Simultaneous Separation of CRC and RF
The simultaneous detection of CRC with RF has been carried out at PTYMCPE and BCPE through DPV. The electrochemical cell containing PBS of pH 6.5 was filled with the mixture of the solutions of CRC (1 × 10⁻⁵ M) and RF (1 × 10⁻⁴ M) for DPV analysis. Figure 8 shows DPV separation of CRC and RF at PTYMCPE (solid line) and BCPE (dashed line). PTYMCPE identifies CRC at 0.1729 V and RF at −0.493 with good current sensitivity. However, BCPE traces CRC at 0.090 V and RF at −0.480 V with low current signals. Therefore, PTYMCPE separates CRC and RF in a mixture as compared to BCPE.
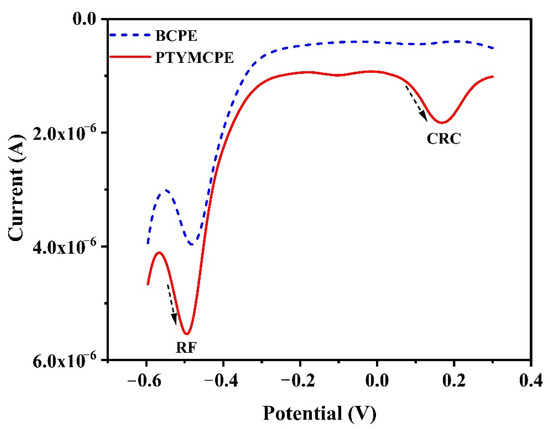
Figure 8.
DPV of the solution containing CRC (1 × 10⁻⁵ M) and RF (1 × 10⁻⁴ M) in 0.1 M PBS (pH 6.5) at the PTYMCPE (solid line) and BCPE (dotted line).
3.9. Calibration Curve and Detection Limit of CRC
The relationship between the concentration and the oxidation peak current of the CRC was studied at PTYMCPE using CV. Different concentrations of CRC and the peak current relation at optimized conditions (pH 6.5, v = 0.1 V/s) are shown in Figure 9a,b. The current response linearly varies with the concentration of CRC in the range of 2.0 × 10⁻⁶ M to 1.0 × 10⁻⁵ M (first linear) and 1.0 × 10⁻⁵ M to 4 × 10⁻⁵ M (second linear). Linear regression equations are Ipa(A) = 6.936 × 10⁻⁷ + 0.02598 C (M), correlation coefficient 0.993 and Ipa(A) = 8.91× 10⁻⁷ + 0.0043 C (M), correlation coefficient 0.98 for the first and second linear, respectively. The LOD is calculated by the formula LOD = 3S/N, whereas the quantification limit (LOQ) is determined by LOQ = 10S/N. Where S is the standard deviation of five blank current values (five blank measurements were performed without analyte), N is the slope from the calibration curve [52]. The values for LOD and LOQ are 10.94 ×10⁻⁷ M and 36.37 × 10⁻⁷ M, respectively, for the first linear from 2.0 × 10⁻⁶ M to 1.0 × 10⁻⁵ M. The second linear LOD and LOQ becomes 6.59 ×10⁻⁶ M and 2.19× 10⁻⁵ M. The LOD calculated during the work has been compared with the different electrodes reported and is presented in Table 1 [53,54,55,56,57,58,59]. The proposed sensor provides a lower LOD (lower concentration range) as compared to GCE [53], PVCAMPE [56], RGO/CPE [57], SPCE [59] and a higher LOD as compared to SDSMCCPE [54] and PGAMCNTPE [55]. The proposed sensor is a low-cost, simple and comparable LOD with a wide linear range.
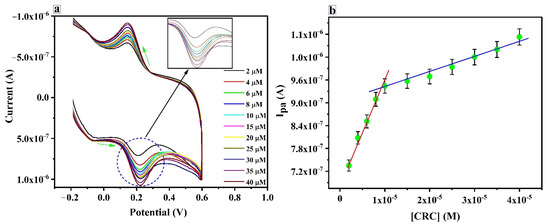
Figure 9.
(a) CV curves for CRC detection from 2.0-40 µM (b) Calibration plot for the determination of CRC at the PTYMCPE in 6.5 pH PBS with the scan rate of 0.1 V/s.

Table 1.
Comparison of the performance of modified electrodes for the determination of CRC.
3.10. Stability, Repeatability and Reproducibility
Stability, repeatability, and reproducibility studies are the main parameters to assess the feasibility of a developed sensor. The study of reproducibility (n = 4) was performed by changing PTYMCPE at each time for CRC (1.0 × 10⁻⁵ M) detection in 0.1 M PBS of pH 6.5. The relative standard deviation (RSD) for reproducibility was originated to be 4.74%. The stability of the developed electrode was examined by running 40 cycles for CRC (1.0 × 10⁻⁵ M) detection at laboratory temperature, as shown in Figure 10. A total of 95.2% of its primary response CRC was retained, even after 40 cycles; this indicates excellent stability of the prepared electrode. The repeatability (n = 4) of the electrode was evaluated by utilizing the PTYMCPE for the CRC (1.0 × 10⁻⁵ M) fresh solutions, with an RSD of 2.73%. This has shown the exceptional repeatability of the developed electrode.
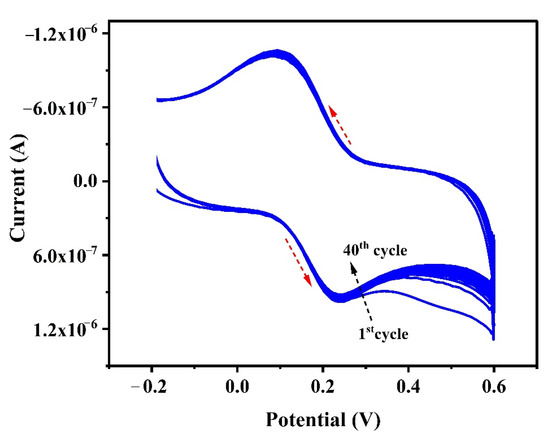
Figure 10.
Cyclic voltammogram for the study of steadiness of CRC (1 × 10⁻⁵ M) at PTYMCPE in 0.1 M PBS (pH 6.5) for 40 cycles.
3.11. Analytical Applications of the PTYMCPE in Real Sample Analysis
Natural food supplement (liquid) was purchased from the local general store and 1 mL of sample is diluted 50 mL of distilled water. A measure of 1.0 mL diluted sample was added to an electrochemical cell containing 0.1 PBS of pH 6.5 and then subjected to voltammetric analysis at a scan rate of 0.1 V/s. During analysis, CRC was not detected in diluted natural food supplement solution. Consequently, the standard addition method was utilized for CRC analysis. CRC recovery was in the range of 96.59 % to 102.18%. The voltammetric data and table for CRC analysis in natural food supplement are shown in Figure 11 and Table 2.
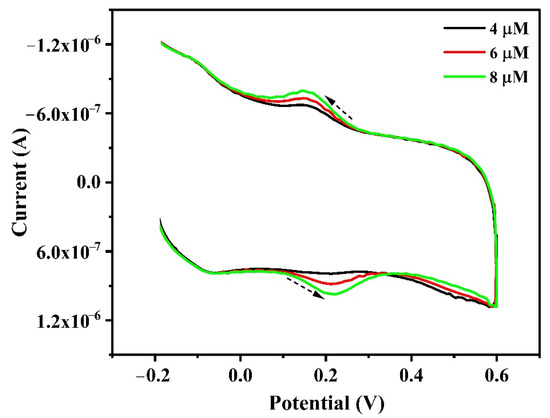
Figure 11.
Cyclic voltammograms for CRC (spiked) analysis in natural food supplement in 0.1 M PBS of pH 6.5 with a scan rate of 0.1 V/s.

Table 2.
CRC assessment in natural food supplement.
4. Conclusions
CPE tailored with TY can be successfully employed for the determination of CRC by electroanalytical technique. Sensor materials were characterized using FESEM and electrochemical methods. The proposed PTYMCPE yields improved sensitivity (0.025 A/M), LOD of 0.10 µM. Additionally, the proposed sensor has good cyclic stability (40 cycles), reproducibility and repeatability towards CRC detection, and a good recovery rate (95.5–102.1%) in natural food supplements with any pretreatment. Moreover, the sensor is efficient in separating CRC and RF in a mixture. The advantages of the electrode are simple cleaning and restoration of their surface before the series of measurements. These results show that PTYMCPE is useful for CRC analysis in food supplements and other real samples.
Author Contributions
Investigation, Writing—original draft, E.S.D.; Supervision, Writing—review & editing, J.G.M.; Visualization, editing, C.R.; Visualization, editing, G.T.; Visualization, H.J.A.; Visualization, S.S. All authors have read and agreed to the published version of the manuscript.
Funding
This research received no external funding.
Institutional Review Board Statement
Not applicable.
Informed Consent Statement
Not applicable.
Data Availability Statement
The data presented in this study are available on request from the corresponding author.
Conflicts of Interest
The authors declare that there is no conflict of interest regarding the publication of this paper.
References
- Kempaiah, R.K.; Srinivasan, K. Influence of dietary curcumin, capsaicin and garlic on the antioxidant status of red blood cells and the liver in high-fat-fed rats. Ann. Nutr. Metab. 2004, 48, 314–320. [Google Scholar] [CrossRef]
- Ahuja, K.D.K.; Kunde, D.A.; Ball, M.J.; Geraghty, D.P. Effects of capsaicin, dihydrocapsaicin, and curcumin on copper-induced oxidation of human serum lipids. J. Agric. Food Chem. 2006, 54, 6436–6439. [Google Scholar] [CrossRef] [PubMed]
- Srinivasan, K. Role of spices beyond food flavoring: Nutraceuticals with multiple health effects. Food Rev. Int. 2007, 21, 167–188. [Google Scholar] [CrossRef]
- Anand, P.; Thomas, S.G.; Kunnumakkara, A.B. Biological activities of curcumin and its analogues (Congeners) made by man and Mother Nature. Biochem. Pharmacol. 2008, 76, 1590–1611. [Google Scholar] [CrossRef]
- Pushpanjali, P.A.; Manjunatha, J.G.; Amrutha, B.M.; Hareesha, N. Development of carbon nanotube-based polymer-modified electrochemical sensor for the voltammetric study of Curcumin. Mater. Res. Innov. 2020. [Google Scholar] [CrossRef]
- Reuter, S.; Eifes, S.; Dicato, M.; Aggarwal, B.B.; Diederich, M. Modulation of anti-apoptotic and survival pathways by curcumin as a strategy to induce apoptosis in cancer cells. Biochem. Pharmacol. 2008, 76, 1340–1351. [Google Scholar] [CrossRef]
- Menon, V.P.; Sudheer, A.R. Antioxidant and anti-inflammatory properties of curcumin. Adv. Exp. Med. Biol. 2007, 595, 105–125. [Google Scholar] [PubMed]
- Aggarwal, B.B.; Sundaram, C.; Malani, N.; Ichikawa, H. Curcumin: The Indian solid gold. Adv. Exp. Med. Biol. 2007, 595, 1–75. [Google Scholar]
- Zhou, H.; Beevers, C.S.; Huang, S. The targets of curcumin. Curr. Drug Targets. 2011, 12, 332–347. [Google Scholar] [CrossRef]
- Hamaguchi, T.; Ono, K.; Yamada, M. REVIEW: Curcumin and Alzheimer’s disease. CNS Neurosci. Ther. 2010, 16, 285–297. [Google Scholar] [CrossRef]
- Kannappan, R.; Gupta, S.C.; Kim, J.H.; Reuter, S.; Agarwal, B.B. Neuroprotection by spice-derived nutraceuticals: You are what you eat! Mol. Neurobiol. 2011, 44, 142–159. [Google Scholar] [CrossRef] [Green Version]
- Xie, L.; Li, X.K.; Takahara, S. Curcumin has bright prospects for the treatment of multiple sclerosis. Int. Immunopharmacol. 2011, 11, 323–330. [Google Scholar] [CrossRef] [PubMed]
- Nath, P.P.; Sarkar, K.; Tarafder, P.; Mondal, M.; Das, K.; Paul, G. Practice of using metanil yellow as food color to process food in unorganized sector of West Bengal—A case study. Int. Food Res. J. 2015, 22, 1424–1428. [Google Scholar]
- Tonnesen, H.H.; Greenhill, J.V. Studies on curcumin and curcuminoids. XXII: Curcumin as a reducing agent and as a radical scavenger. Int. J. Pharm. 1992, 87, 79–87. [Google Scholar] [CrossRef]
- Borsari, M.; Ferrari, E.; Grandi, R.; Saladini, M. Curcuminoids as potential new iron-chelating agents: Spectroscopic, polarographic and potentiometric study on their Fe (III) complexing ability. Inorg. Chim. Acta 2002, 328, 61–68. [Google Scholar] [CrossRef]
- Kunchandy, E. Effect of curcumin on hydroxyl radical generation through Fenton reaction. Int. J. Pharm. 1989, 57, 173–176. [Google Scholar] [CrossRef]
- Yousef, E.M.; Mousavi, M.F.; Ghasemi, S. Nano-structured Ni (II)–curcumin modified glassy carbon electrode for electrocatalytic oxidation of fructose. Electrochim. Acta 2008, 54, 490–498. [Google Scholar]
- Bernabe-Pineda, M.; Ramirez-Silva, M.T.; Romero-Romo, M.A.; Gonzalez-Vergara, E.; Rojas-Hernandez, A. Spectrophotometric and electrochemical determination of the formation constants of the complexes Curcumin–Fe (III)–water and Curcumin–Fe (II)–water. Spectrochim. Acta A 2004, 60, 1105–1113. [Google Scholar] [CrossRef]
- Annaraj, J.P.; Ponvel, K.M.; Athappan, P.; Srinivasan, S. Synthesis, spectra and redox behavior of copper (II) complexes of curcumin diketimines as models for blue copper proteins. Transit. Met. Chem. 2004, 29, 722–727. [Google Scholar] [CrossRef]
- Barik, A.; Mishra, B.; Shen, L.; Mohan, H.; Kadam, R.M.; Dutta, S.; Zhang, H.-Y.; Priyadarsini, K.I. Evaluation of a new copper (II)–curcumin complex as superoxide dismutase mimic and its free radical reactions. Free Radic. Biol. Med. 2005, 39, 811–822. [Google Scholar] [CrossRef]
- Stanic, Z. Electrochemical Investigation of Some Biological Important Compounds Correlated to Curcumin, Biosynthesis, Medicinal Uses and Health Benefits; Nova Science Publishers: New York, NY, USA, 2012. [Google Scholar]
- Thongchaia, W.; Liawruangratha, B.; Liawruangrath, S. Flow injection analysis of total curcuminoids in turmeric and total antioxidant capacity using 2,2′-diphenyl-1-picrylhydrazyl assay. Food Chem. 2009, 112, 494–499. [Google Scholar] [CrossRef]
- Lechtenberg, M.; Quandt, B.; Nahrstedt, A. Quantitative determination of curcuminoids in Curcuma rhizomes and rapid differentiation of Curcuma domestica Val. and Curcuma xanthorrhiza Roxb by capillary electrophoresis. Phytochem. Anal. 2004, 15, 152–158. [Google Scholar] [CrossRef]
- Zhang, J.S.; Guan, J.; Yang, F.Q.; Liu, H.G.; Cheng, X.J.; Li, S.P. Qualitative and quantitative analysis of four species of Curcuma rhizomes using twice development thin layer chromatography. J. Pharm. Biomed. Anal. 2008, 48, 1024–1028. [Google Scholar] [CrossRef]
- Green, C.E.; Hibbert, S.L.; Bailey-Shaw, Y.A.; Williams, L.A.; Mitchell, S.; Garraway, E. Extraction, Processing, and Storage Effects on Curcuminoids and Oleoresin Yields from Curcuma longa L. Grown in Jamaica. J. Agric. Food Chem. 2008, 56, 3664–3670. [Google Scholar] [CrossRef]
- Kim, Y.J.; Lee, H.J.; Shin, Y.J. Optimization and Validation of High-Performance Liquid Chromatography Method for Individual Curcuminoids in Turmeric by Heat-Refluxed Extraction. J. Agric. Food Chem. 2013, 61, 10911–10918. [Google Scholar] [CrossRef] [PubMed]
- Manjunatha, J.G. A novel poly (glycine) biosensor towards the detection of indigo carmine: A voltammetric study. J. Food Drug Anal. 2018, 26, 292–299. [Google Scholar] [CrossRef] [PubMed]
- Manjunatha, J.G. Poly (Nigrosine) Modified Electrochemical Sensor for the Determination of Dopamine and Uric acid: A Cyclic Voltammetric Study. Int. J. Chemtech Res. 2016, 9, 136–146. [Google Scholar]
- Manjunatha, J.G. A novel voltammetric method for the enhanced detection of the food additive tartrazine using an electrochemical sensor. Heliyon 2018, 4, e00986. [Google Scholar] [CrossRef] [Green Version]
- Manjunatha, J.G.; Raril, C.; Prinith, N.S.; Pushpanjali, P.A.; Charithra, M.M.; Grisha, T.; Hareesha, N.; Edwin, S.D.S.; Amrutha, B.M. Fabrication, characterization and application of poly (acriflavine) modified carbon nanotube paste electrode for the electrochemical determination of catechol. In Handbook of Nanomaterials for Sensing Applications; Elsevier: Amsterdam, The Netherlands, 2021; pp. 105–117. [Google Scholar] [CrossRef]
- Manjunatha, J.G.; Deraman, M.; Basri, N.H.; Talib, I.A. Selective detection of dopamine in the presence of uric acid using polymerized phthalo blue film modified carbon paste electrode. Adv. Mater. Res. 2014, 895, 447–451. [Google Scholar] [CrossRef]
- Pushpanjali, P.A.; Manjunatha, J.G.; Tigari, G.; Fattepur, S. Poly(Niacin) Based Carbon Nanotube Sensor for the Sensitive and Selective Voltammetric Detection of Vanillin with Caffeine. Anal. Bioanal. Electrochem. 2020, 12, 553–568. [Google Scholar]
- Basmaz, G.; Ozturk, N. Determination of Curcumin in Turmeric Sample Using Edge Plane Pyrolytic Graphite Electrode. Celal Bayar Univ. J. Sci. 2017, 13, 689–694. [Google Scholar] [CrossRef]
- Raril, C.; Manjunatha, J.G. A simple approach for the electrochemical determination of vanillin at ionic surfactant modified graphene paste electrode. Microchem. J. 2020, 154, 104575. [Google Scholar] [CrossRef]
- Mirzaeia, B.; Zarrabi, A.; Noorbakhshc, A.; Aminide, A.; Makvandi, P. A reduced graphene oxide-β-cyclodextrin nanocomposite-based electrode for electrochemical detection of curcumin. RSC Adv. 2021, 11, 7862–7872. [Google Scholar] [CrossRef]
- Manjunatha, J.G.; Kumara Swamy, B.E.; Shreenivas, M.T.; Mamatha, G.P. Selective Determination of Dopamine in the Presence of Ascorbic Acid Using a Poly (Nicotinic Acid) Modified Carbon Paste Electrode. Anal. Bioanal. Electrochem. 2012, 4, 225–237. [Google Scholar]
- Manjunatha, J.G. A new electrochemical sensor based on modified carbon nano tube-graphite mixture paste electrode for voltametric determination of Resorcinol. Asian J. Pharm. Clin. Res. 2017, 10, 295–300. [Google Scholar]
- Labib, M.; Sargent, E.H.; Kelley, S.O. Electrochemical Methods for the Analysis of Clinically Relevant Biomolecules. Chem. Rev. 2016, 116, 9001–9090. [Google Scholar] [CrossRef]
- Manjunatha, J.G.; Deraman, M.; Basri, N.H. Electrocatalytic detection of dopamine and uric acid at poly (basic blue B) modified carbon nano tube paste electrode. Asian J. Pharm. Clin. Res. 2015, 8, 40–45. [Google Scholar]
- Wada, R.; Takahashi, S.; Muguruma, H.; Osakabe, N. Electrochemical Detection of Curcumin in Food with a Carbon Nanotube-Carboxymethylcellulose Electrode. Anal. Sci. 2020, 36, 1113–1118. [Google Scholar] [CrossRef]
- Cheraghi, S.; Taher, M.A.; Karimi-Maleh, H. Fabrication of Fast and Sensitive Nanostructure Voltammetric Sensor for Determination of Curcumin in the Presence of Vitamin B9 in Food Samples. Electroanalysis 2016, 28, 2590–2597. [Google Scholar] [CrossRef]
- Li, K.; Li, Y.; Yang, L.; Wang, L.; Ye, B. The electrochemical characterization of curcumin and its selective detection in Curcuma using a graphene-modified electrode. Anal. Methods 2014, 6, 7801–7808. [Google Scholar] [CrossRef]
- Chaisiwamongkhol, K.; Ngamchuea, K.; Batchelor-McAuley, C.; Compton, R.G. Multiwalled Carbon Nanotube Modified Electrodes for the Adsorptive Stripping Voltammetric Determination and Quantification of Curcumin in Turmeric. Electroanalysis 2017, 29, 1–8. [Google Scholar] [CrossRef]
- Manjunatha, J.G.; Kumara Swamy, B.E.; Deraman, M.; Mamatha, G.P. Simultaneous Determination Of Ascorbic Acid, Dopamine And Uric Acid At Poly (Aniline Blue) Modified Carbon Paste Electrode: A Cyclic Voltammetric Study. Int. J. Pharm. Pharm. Sci. 2013, 5, 355–361. [Google Scholar]
- Raril, C.; Manjunatha, J.G. Sensitive and Selective Analysis of Nigrosine Dye at Polymer Modified Electrochemical Sensor. Anal. Bioanal. Electrochem. 2018, 10, 372–382. [Google Scholar]
- Christopher, M.A.B.; Gyorgy, I.; Vilmos, K. Poly (methylene blue) modified electrode sensor for haemoglobin. Anal. Chim. Acta 1999, 385, 119–123. [Google Scholar]
- Hareesha, N.; Manjunatha, J.G. Electro-oxidation of formoterol fumarate on the surface of novel poly(thiazole yellow-G) layered multi-walled carbon nanotube paste electrode. Sci. Rep. 2021, 11, 12797. [Google Scholar] [CrossRef] [PubMed]
- Hsieh, M.; Whang, T. Mechanistic investigation on the electropolymerization of phenol red by cyclic voltammetry and the catalytic reactions toward acetaminophen and dopamine using poly(phenol red)-modified GCE. J. Electroanal. Chem. 2017, 795, 130–140. [Google Scholar] [CrossRef]
- Tigari, G.; Manjunatha, J.G.; D’Souza, E.S.; Sreeharsha, N. Surfactant and Polymer Composite Modified Electrode for the Sensitive Determination of Vanillin in Food Sample. Chem. Select. 2021, 6, 2700–2708. [Google Scholar]
- Tigari, G.; Manjunatha, J.G. A surfactant enhanced novel pencil graphite and carbon nanotube composite paste material as an effective electrochemical sensor for determination of riboflavin. J. Sci. Adv. Mater. Devices 2020, 5, 56–64. [Google Scholar] [CrossRef]
- Tigari, G.; Manjunatha, J.G. Optimized Voltammetric Experiment for the Determination of Phloroglucinol at Surfactant Modified Carbon Nanotube Paste Electrode. Instrum. Exp. Tech. 2020, 63, 750–757. [Google Scholar] [CrossRef]
- Chen, C.; Xue, X.; Mu, S. pH Dependence of reactive sites of curcumin possessing antioxidant activity and free radical scavenging ability studied using the electrochemical and ESR techniques: Polyaniline used as a source of the free radical. J. Electroanal. Chem. 2014, 713, 22–27. [Google Scholar] [CrossRef]
- Ziyatdinova, G.K.; Nizamova, A.M.; Budnikov, H.C. Voltammetric determination of curcumin in spices. J. Anal. Chem. 2012, 67, 591–594. [Google Scholar] [CrossRef]
- Raril, C.; Manjunatha, J.G.; Tigari, G. Low-cost voltammetric sensor based on an anionic surfactant modified carbon nanocomposite material for the rapid determination of curcumin in natural food supplement. Instrum. Sci. Technol. 2020, 48, 561–582. [Google Scholar] [CrossRef]
- Tigari, G.; Manjunatha, J.G. Poly (glutamine) film-coated carbon nanotube paste electrode for the determination of curcumin with vanillin: An electroanalytical approach. Monatsh. Chem. 2020, 151, 1681–1688. [Google Scholar] [CrossRef]
- Burç, M.; Gungor, O.; Duran, S.T. Voltammetric Determination of Curcumin in Spices using Platinum Electrode Electrochemically Modified with Poly (Vanillin-co-Caffeic Acid). Anal. Bioanal. Chem. 2020, 12, 625–643. [Google Scholar]
- Mostafa, R.; Rosan, Z.; Ali, A.M.; Maryam, A. An Electrochemical Sensor Based on Reduced Graphene Oxide Modified Carbon Paste Electrode for Curcumin Determination in Human Blood Serum. Port. Electrochim. Acta 2020, 38, 29–42. [Google Scholar]
- Stanic, Z.; Voulgaropoulos, A.; Girousia, S. Electroanalytical Study of the Antioxidant and Antitumor Agent Curcumin. Electroanalysis 2008, 20, 1263–1266. [Google Scholar] [CrossRef]
- Wray, D.M.; Batchelor-McAuley, C.; Compton, R.G. Selective Curcuminoid Separation and Detection via Nickel Complexation and Adsorptive Stripping Voltammetry. Electroanalysis 2012, 24, 2244–2248. [Google Scholar] [CrossRef]
Publisher’s Note: MDPI stays neutral with regard to jurisdictional claims in published maps and institutional affiliations. |
© 2021 by the authors. Licensee MDPI, Basel, Switzerland. This article is an open access article distributed under the terms and conditions of the Creative Commons Attribution (CC BY) license (https://creativecommons.org/licenses/by/4.0/).