Article

Fabrication of Efficient and Selective Modified Graphene Paste Sensor for the Determination of Catechol and Hydroquinone

by
Jamballi G. Manjunatha
Department of Chemistry, FMKMC College, Madikeri, Mangalore University Constituent College, Karnataka 571201, India
Surfaces 2020, 3(3), 473-483; https://doi.org/10.3390/surfaces3030034
Submission received: 13 August 2020 / Revised: 28 August 2020 / Accepted: 31 August 2020 / Published: 3 September 2020

Abstract

:
An electrochemical sensor, based on a graphene paste electrode (GPE), was modified with a polymerization method, and the electrochemical behavior of catechol (CC) and hydroquinone (HQ) was investigated using electroanalytical methods like cyclic voltammetry (CV) and differential pulse voltammetry (DPV). The effect of CC at the modified electrode was evidenced by the positive shift of the oxidation peak potential of CC at the poly (rosaniline)-modified graphene paste electrode (PRAMGPE) and the nine-fold enhancement of the peak current, as compared to a bare graphene paste electrode (BGPE). The sensitivity of CC investigated by DPV was more sensitive than CV for the analysis of CC. The DPV method showed the two linear ranges of 2.0 × 10⁻⁶–1.0 × 10⁻⁵ M and 1.5 × 10⁻⁵–5 × 10⁻⁵ M. The detection limit and limit of quantification were determined to be 8.2 × 10⁻⁷ and 27.6 × 10⁻⁷ M, respectively. The obtained results were compared successfully with respect to those obtained using the official method. Moreover, this sensor is applied for the selective determination of CC in the presence of HQ. The high sensitivity, good reproducibility, and wide linear range make the modified electrode suitable for the determination of CC in real samples. The practical application of the sensor was demonstrated by determining the concentration of CC in water samples with acceptable recoveries (97.5–98%).

1. Introduction

Isomeric benzenediol compounds, for example, hydroquinone (HQ) and catechol (CC), show notable antagonistic impacts on human health and the environment. Such compounds, for the most part, begin from creating solutions in the photography, paper, and rubber industries [1]. From these industrial routes, in addition to some other natural sources, hydroquinone and catechol discover their way to the environment [2]. The poisonousness of phenols produced from bioremediation, for example, fertilizing the soil, can likewise welcome on bothersome environmental impacts and genuinely harm evacuation efficiencies [3,4,5,6,7]. These modern uses of the two compounds not withstanding their poisonousness in the environment demand simple, accurate, precise, sensitive, and selective determination of the two compounds. A few methods have been proposed to determine CC and HQ such as spectrophotometric [8,9], liquid chromatography [10,11], synchronous fluorescence [12], chemiluminescence [13], capillary electrophoresis [14], and gas chromatography/mass spectrometry [15]. Those methods are time-consuming and expensive, they also have low sensitivity. Electrochemical methods are extensively used due to their good sensitivity, reproducibility, and low cost [16,17,18,19,20,21,22,23,24].
As of late, various sorts of monomers have been utilized as surface modifiers in electrochemical sensors. Diverse supporting carbon materials, for example, carbon paste, glassy carbon [25,26,27,28], carbon nanotubes [29,30,31,32,33], graphite [34,35,36,37], and graphene [38,39], have been utilized to stabilize electron transfer mediators, essentially because of their low background currents and wide potential windows. The subsidiaries of the modified carbon electrodes show unrivaled electrochemical properties and exhibit synergist movement toward numerous chemical reactions. Among working electrodes in electrochemical frameworks, the carbon paste electrode (CPE) is generally utilized due to having a few advantages, for example, simple modification, regenerable surface, low background current, outrageous potential window, low ohmic resistance, and minimal effort [40,41]. The graphene paste electrode (GPE) can be widely used in the determination of drugs, biomolecules, and other organic species because of its easy preparation and simple modification. In experimental conditions, GPE has a wider potential window, and its residual currents are lower than those of the glassy carbon electrodes or noble metallic electrodes. Graphene can be fabricated in various effective ways [42,43,44]. Here, in this research work, graphene was used for the construction of a novel working electrode for the simultaneous determination of CC and HQ. Thus, we report, for the first time, the development of a new electrochemical sensor utilizing rosaniline to fabricate a polymer-modified graphene paste electrode for the simultaneous determination of CC and HQ. The proposed strategy displays numerous favorable circumstances, for example, quick reaction, low detection limit, large dynamic range, and great selectivity. Using the developed technique, the determination of CC and HQ is completed effectively in real samples. Furthermore, with the improvement of the interest in environmental quality, there ought to be a lot of quick and proficient identification strategies to coordinate the correlative standard of environment protection.

2. Materials and Methods

2.1. Chemicals

Graphene powder was attained from Tokyo Chemicals, Tokyo, Japan. CC and HQ were purchased from Sisco Research Laboratories, Mumbai, India. Silicone oil was bought from Nice Chemical, Cochin, India. Rosaniline (RA), Disodium hydrogen phosphate, and monosodium dihydrogen phosphate were procured from Himedia, Bangalore, India. The analytes 0.1 mM CC and 0.1 M HQ were prepared by suspending known quantities of the analytes in distilled water. PBS was ready by mixing an appropriate quantity of 0.1 M disodium hydrogen phosphate and 0.1 M monosodium dihydrogen phosphate in a known amount of distilled water.

2.2. Apparatus

The electro-analysis of CC was done through a tri-electrode arrangement attached to a CHI 6038E electrochemical workstation (CH Instruments, Austin, TX, USA). Here, the tri-electrode system was made up ofa saturated calomel electrode (reference electrode), platinum electrode (counter electrode), bare graphene paste electrode (BGPE), and poly (rosaniline)-modified graphene paste electrode (Poly(RA)MGPE) (working electrode). The EQ-610 digital pH tool was used for the preparation of different pH PBS. A VITSIL-VBSD/VBDD water purifier was utilized to get distilled water. FE-SEM was obtained with a device from DST-PURSE Laboratory, Mangalore University, Konaje, India).

2.3. Electrode Preparation

BGPE was equipped by combining graphene powder (60%) and silicone oil (40%) in an agate-mortar through hand mixing till a homogeneous paste was achieved. Afterward, a bit of homogenous paste was packed into the hole of a Teflon tube and electrical connection was completed by a copper wire. The electrode surface was smoothed with a weighing paper and rinsed carefully with distilled water initial to each experiment. Poly(RA)MGPE was prepared by electropolymerization of 1.0 mM RA on the surface of BGPE by running ten cyclic voltammetry (CV) cycles at the potential gap of −0.2 to 1.0 V with a 0.1 V/s scan rate in 0.01 M sodium hydroxide via pre-treatment with sulphuric acid. Then, the prepared electrodes were just washed with distilled water.

3. Results and Discussion

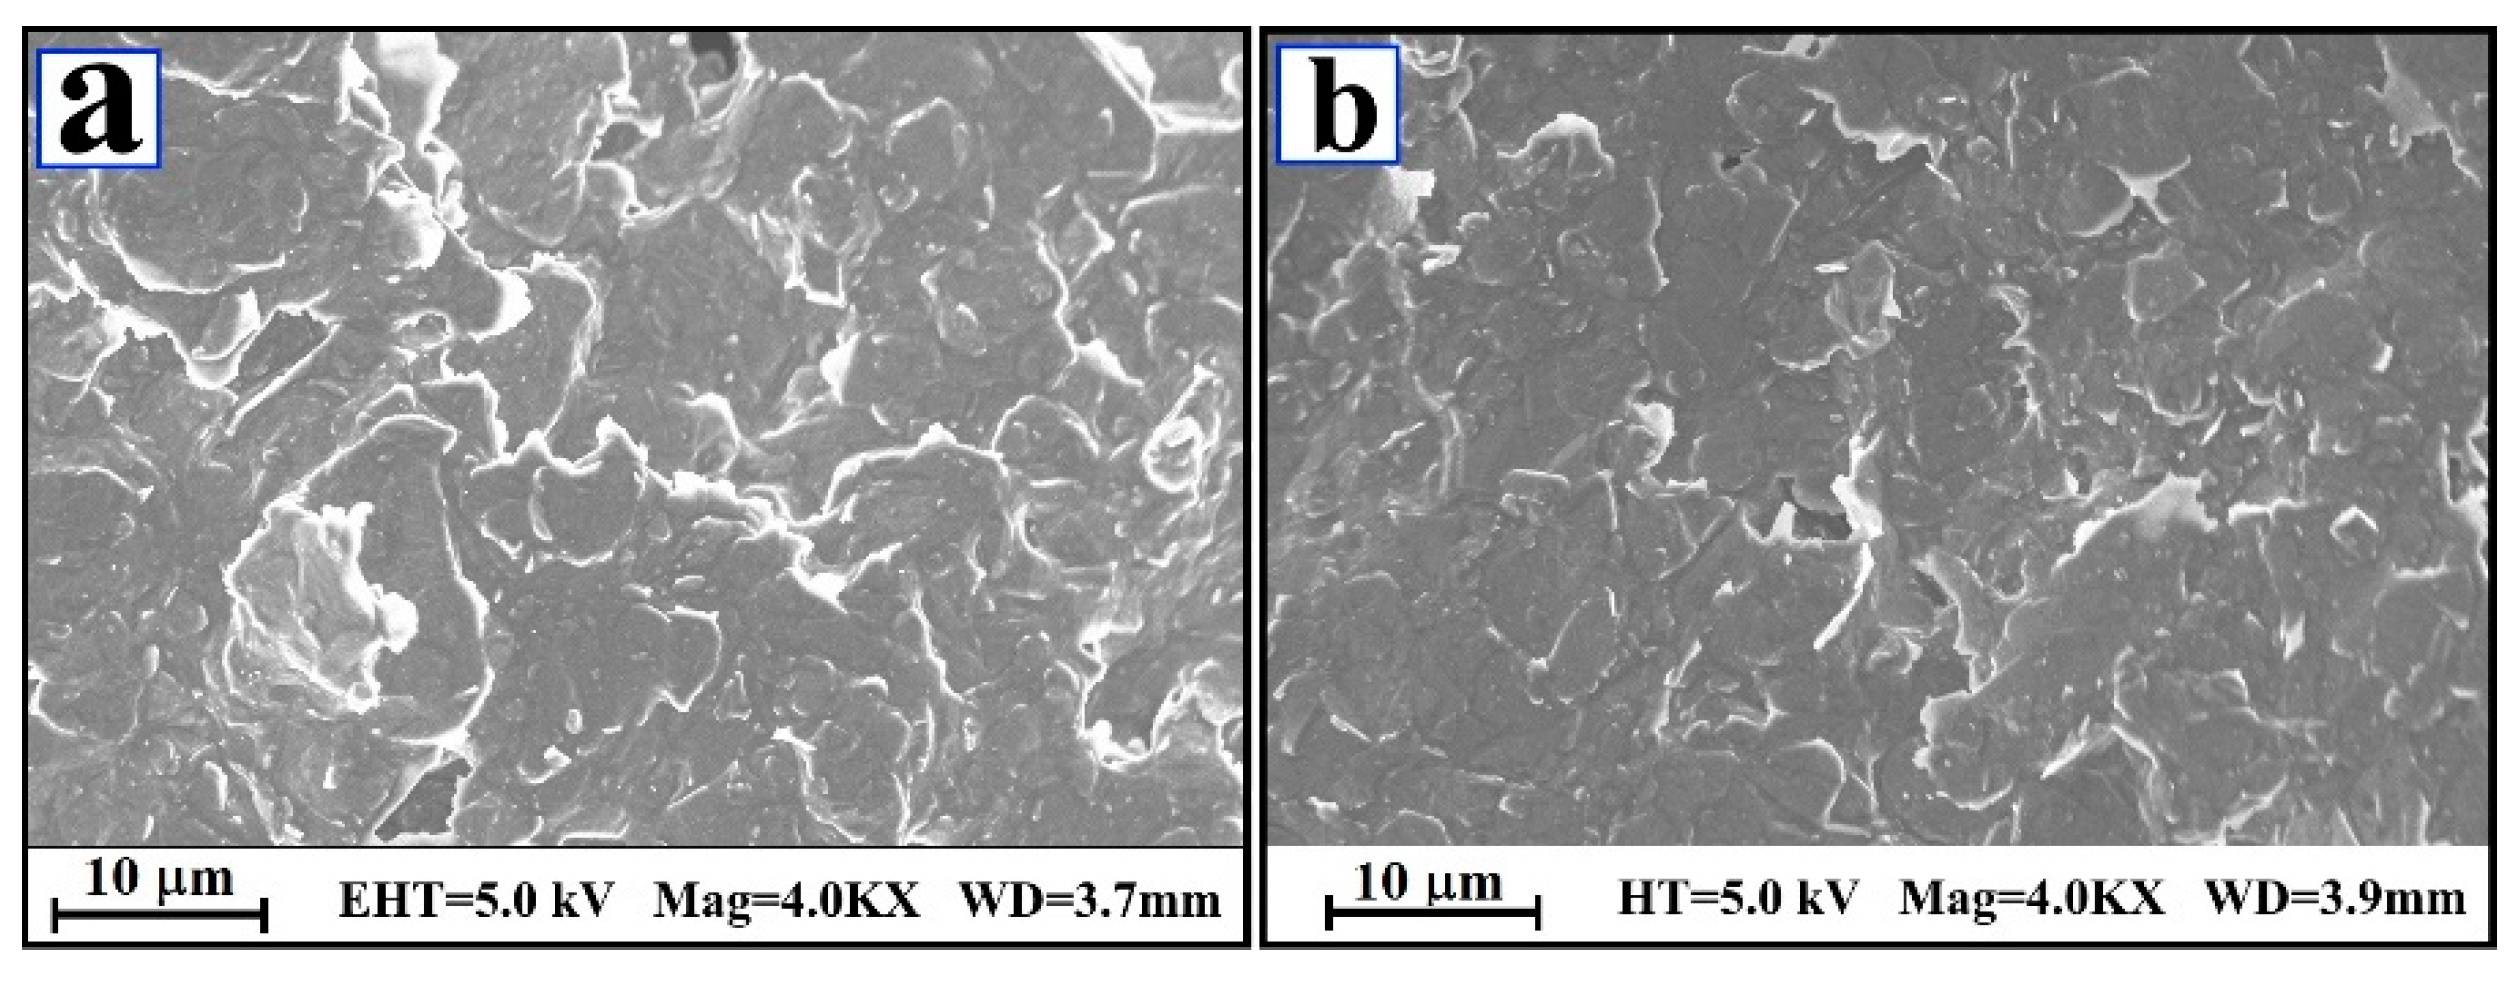
3.1. FE-SEM Inspection

The superficial properties of BGPE and Poly(RA)MGPE were explicated by field emission scanning electron microscopy (FE-SEM) analysis. The inset in Figure 1 picturizes the surface morphology of BGPE (Figure 1a) and Poly(RA)MGPE (Figure 1b). In Figure 1a, the unsystematically distributed flakes of graphene represent the surface of the BGPE material. Conversely, Figure 1b displays the regularly arranged electrochemical polymer layers on the surface of graphene flakes, characterizing the Poly(RA)MGP material. The Poly(RA) layer increases the catalytic activity, active sites, and rate of electron transfer during the redox behavior of CC.

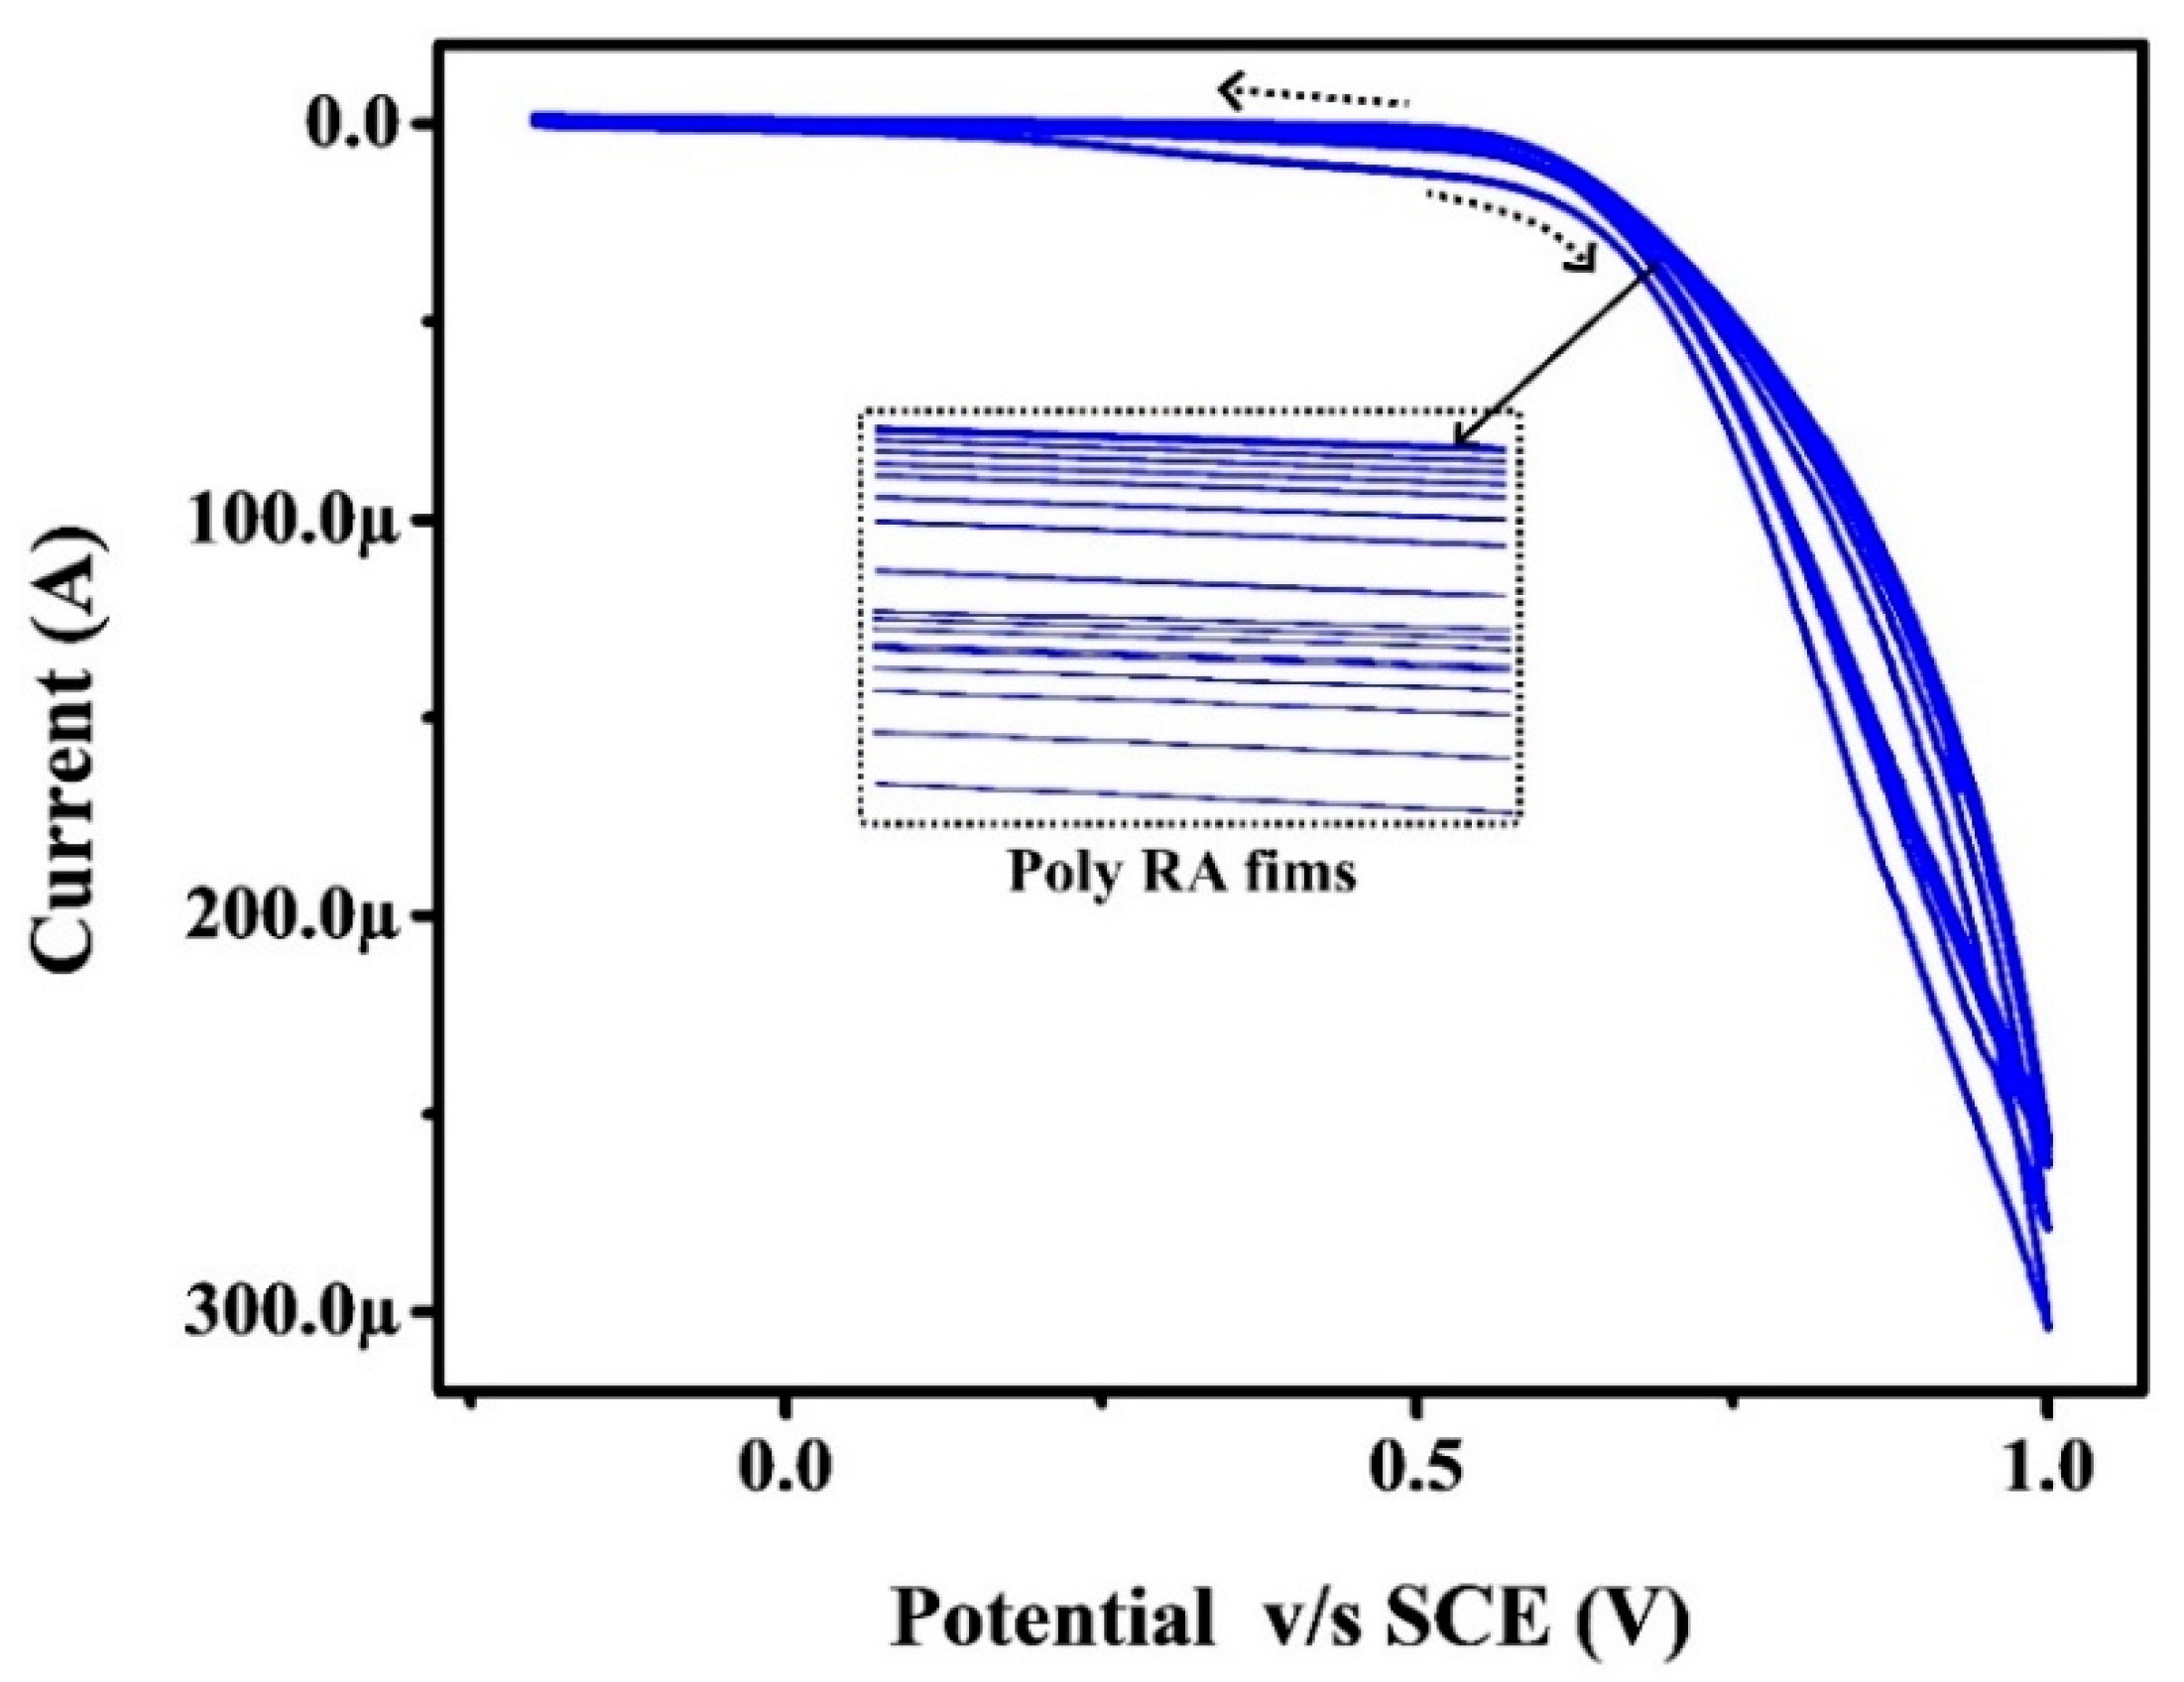
3.2. Electro-Polymerization of RA at BGPE through Pre-Treatment Process

The electro-polymerization of rosaniline on the exterior of BGPE needs two stages [45]. In the primary stage, the BGPE was pre-treated with 1.0 mM RA in 0.1 M Sulphuric acid by ten CV cycles in the potential gap of −0.2 to 1.0 V with a 0.1 V/s scan rate. In the second stage, electro-polymerization of RA was achieved on the pre-treated BGPE surface using 1.0 mM rosaniline in 0.01 M sodium hydroxide. Figure 2 displays the ten cyclic voltammograms (CVs) for the electro-polymerization of RA in 0.01 M sodium hydroxide at BGPE with a −0.2 to 1.0 V potential gap at a 0.1 V/s scan rate. During the electrochemical polymerization, the rosaniline monomer was transformed to an RA polymer and was deposited on the exterior of BGPE, and also the peak current of RA intensified at some certain CV cycles. Subsequently, the peak current of the RA polymer declined due to the saturation of the electrode surface and hindered electron transfer rate, hence the number of CV cycles was fixed to ten. The obtained Poly(RA)MGPE was rinsed with distilled water to eradicate the impurities.

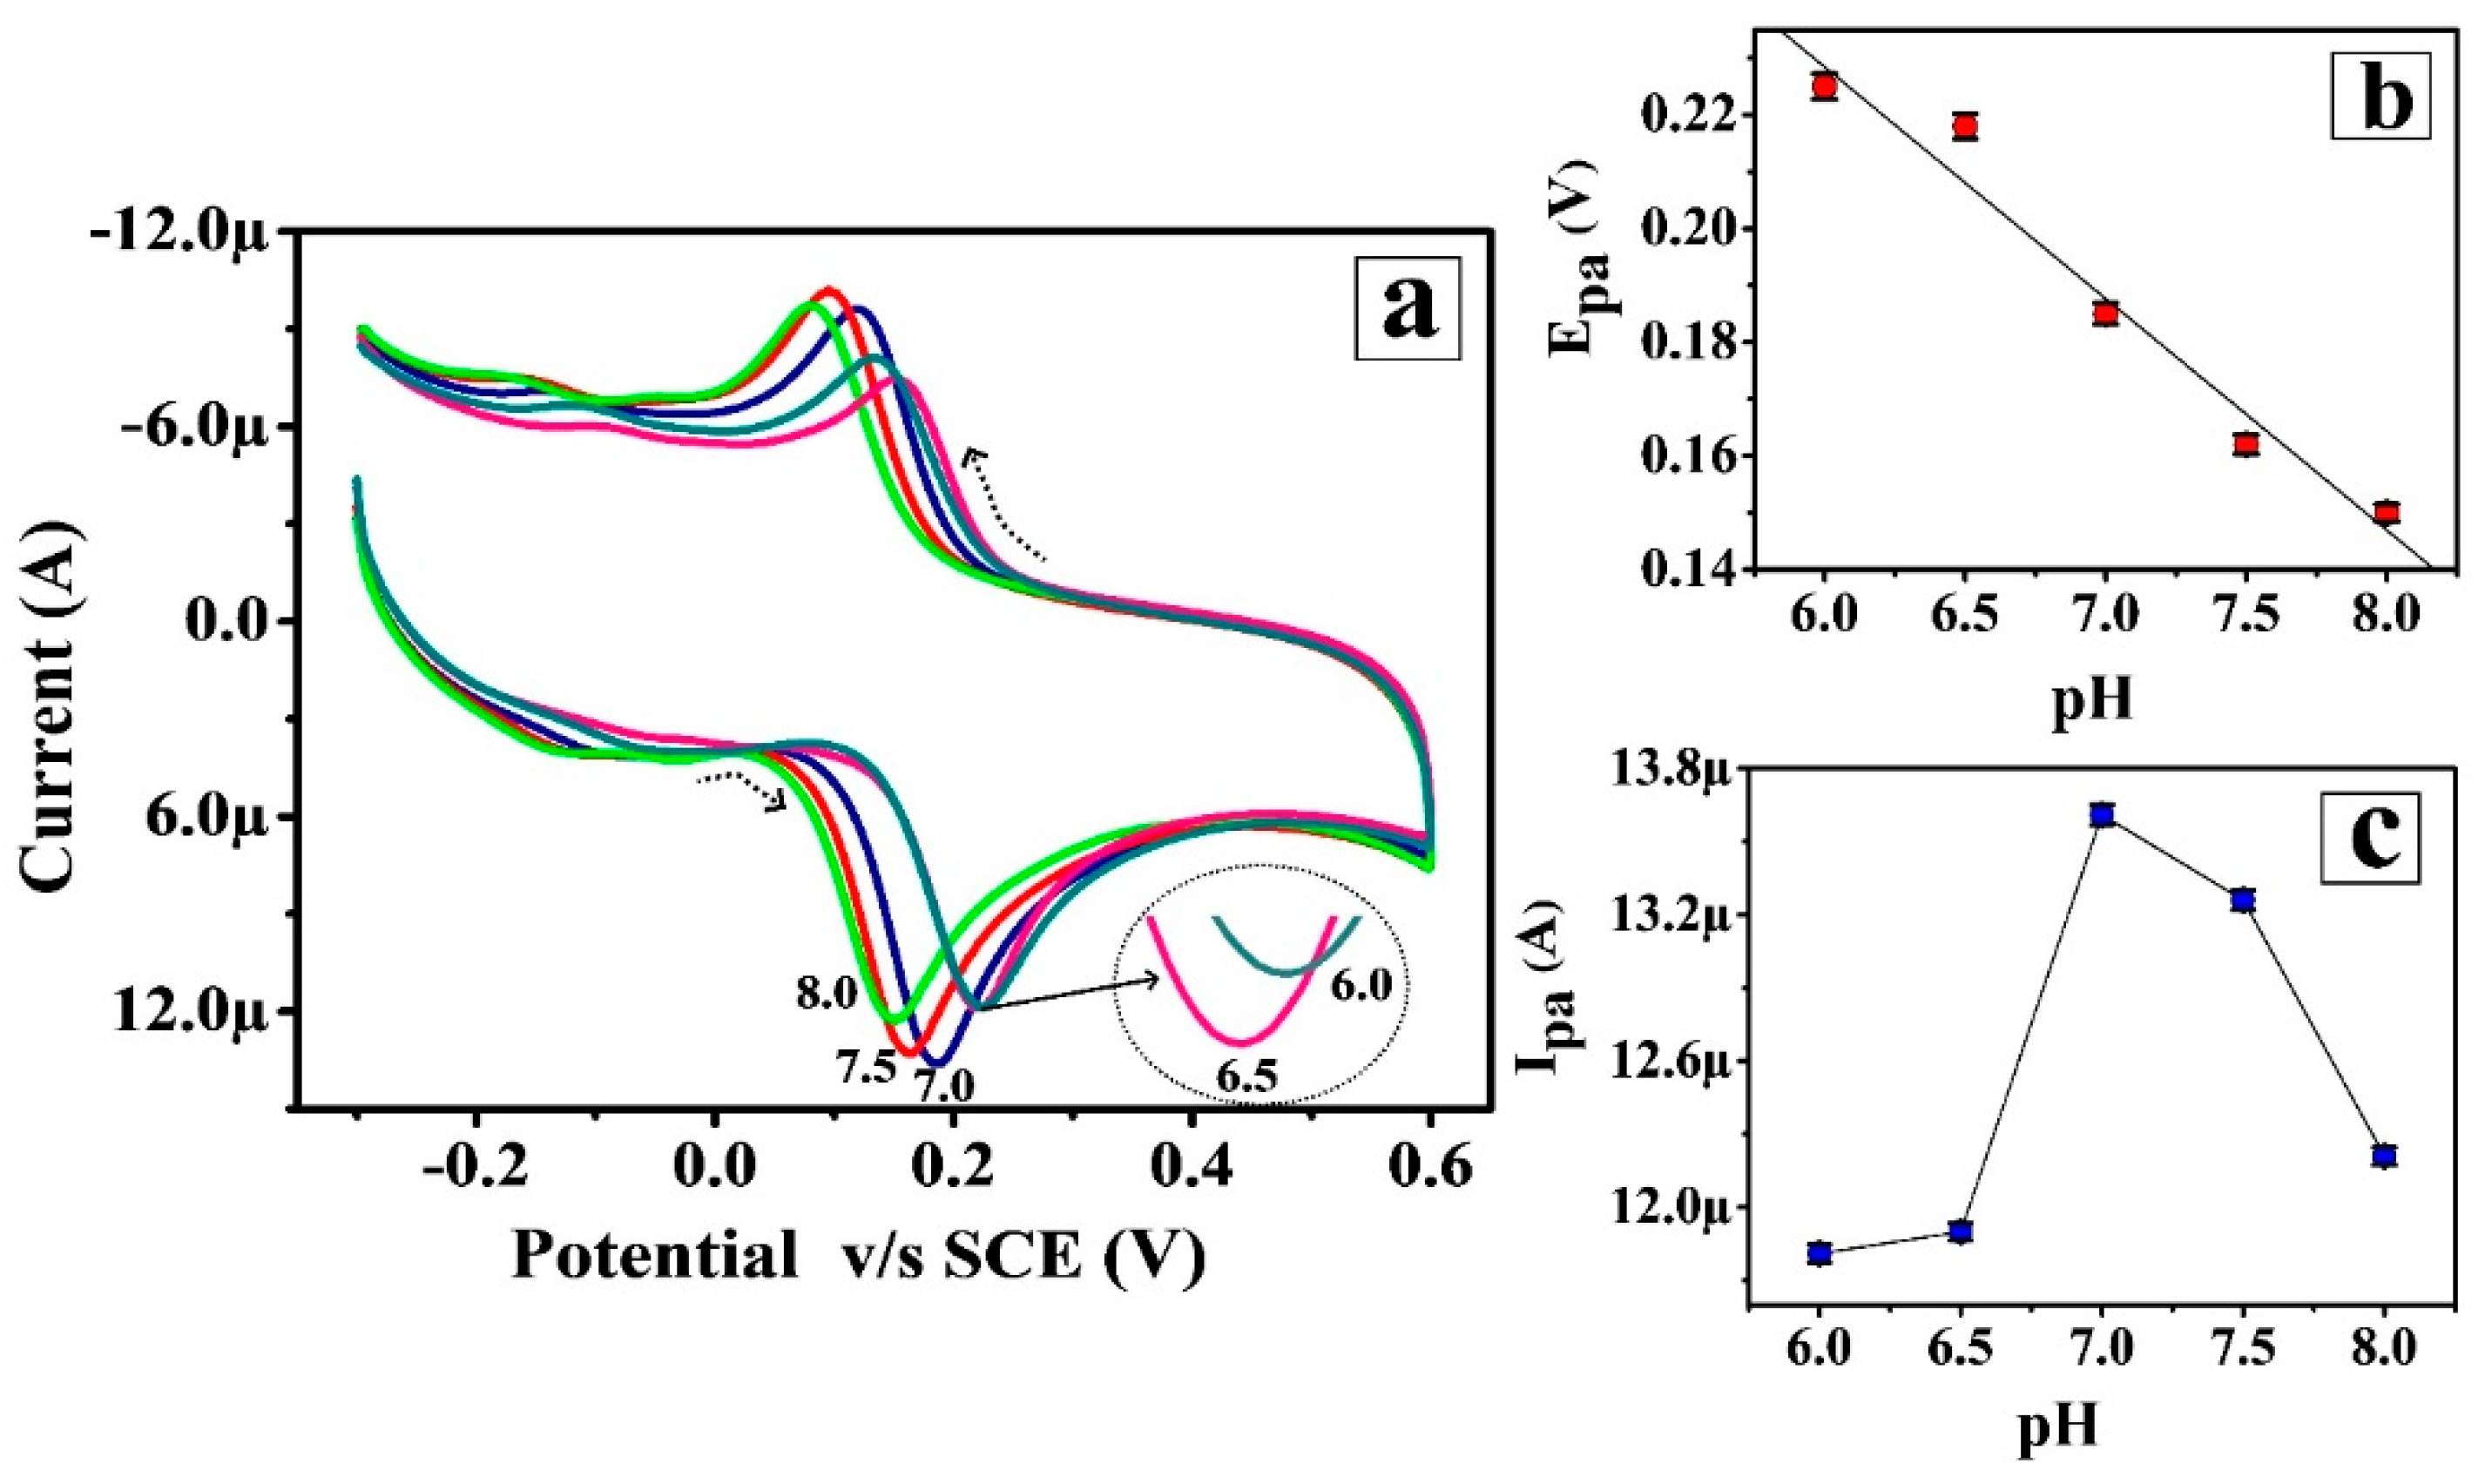
3.3. Impact of Sustaining Electrolyte pH

The influence of sustaining electrolyte pH on the redox action of 0.1 mM CC was described on the surface of Poly(RA)MGPE in altered pH in the range from 6.0 to 8.0 of 0.1 M PBS by CV having the potential window of −0.3 to 0.6 V at a 0.1 V/s scan rate. Figure 3a discloses that the escalation of sustaining electrolyte pH shifts the redox peak potential of CC towards a less positive side. On the basis of the achieved result, the anodic peak potential V/s solution pH graph was plotted (Figure 3b) and presents a decent linear response with a linear regression relation of Epa (V) = 0.5855–0.049 pH (V/pH) and the correlation coefficient (R2) of 0.980. Here, the slope of 0.049 V/pH is approximately nearer to the theoretical value, which describes that the electrode redox reaction mechanism of CC is done with a like number of protons and electrons [46]. Further, Figure 3b shows that the peak current of CC is low at pH 6.0, 6.5, 7.5, and 8.0 with a lower rate of electron transfer, but pH 7.0 provides a high current response with elevated stability and electron transfer rate. Therefore, pH 7.0 was selected as an optimum electrolyte pH for this analysis.

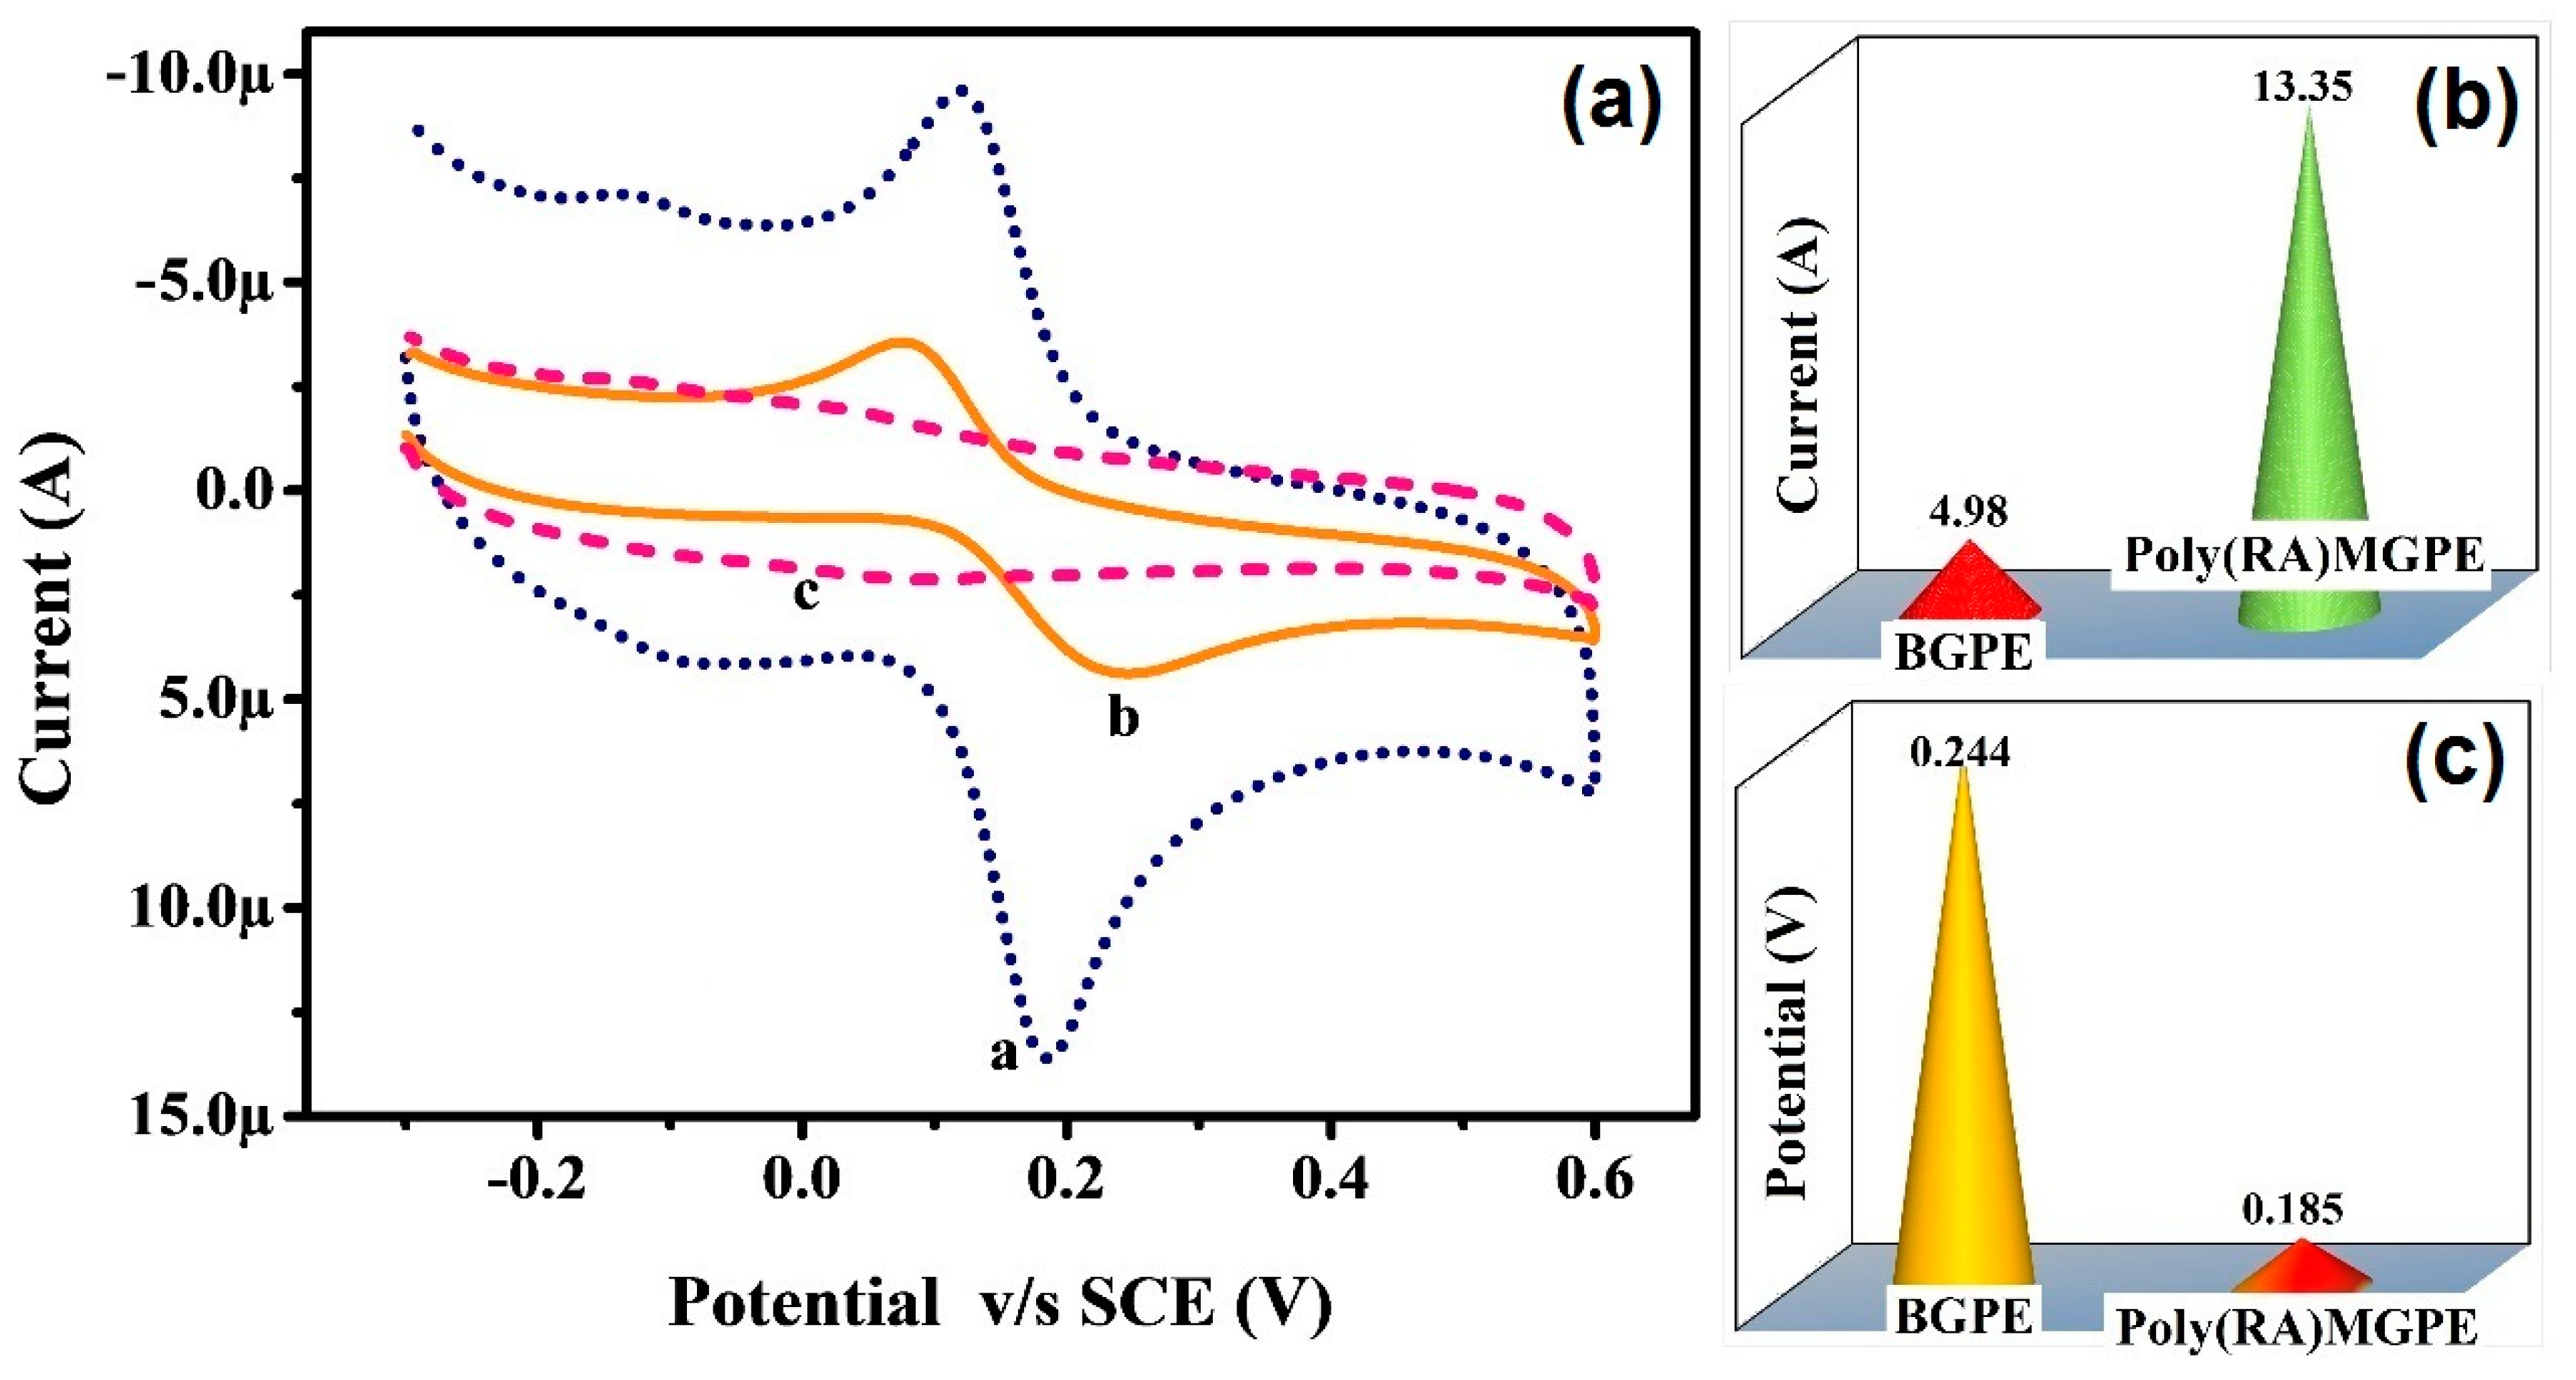
3.4. CV Response of CC at Poly(RA)MGPE and Surface Area

Figure 4 shows the CVs for the presence and absence (curve c) of 0.1 mM CC at Poly(RA)MGPE (curve a) and BGPE (curve b) in 0.1 M sustaining electrolyte having 7.0 pH at a 0.1 V/s scan rate. On BGPE, the oxidation current of CC was lower with a high oxidation potential of 0.244 V, which is due to the less catalytic nature of BGPE and shorter rate of electron transfer in the CC redox reaction. Nonetheless, at Poly(RA)MGPE, CC designates an enhanced oxidation current of 13.35 µA at 0.185 V of peak potential. Further, the modified electrodes do not disclose any electrochemical action in the absence of the analyte CC. These outcomes reveal that the modified Poly(RA)MGPE is very stable and specific for the CC redox nature and also it reduces the over-potential and fouling nature of the electrode material. The dynamic surface area of Poly(RA)MGPE and BGPE is calculated by following the Randles–Sevcik equation [47,48]:
Ip = 2.69 × 10⁵ n3/2 A D1/2 C ν1/2
where “Ip” designates the peak current of the analyte, “n” describes the number of electrons, “A” designates the active surface area, “D” defines the diffusion coefficient, “C” entitles the concentration of the analyte, and “ν” designates the scan rate. The deliberated values of the dynamic surface areas for BGPE and Poly(RA)MGPE were found to be 0.0204 and 0.0445 cm2, respectively.

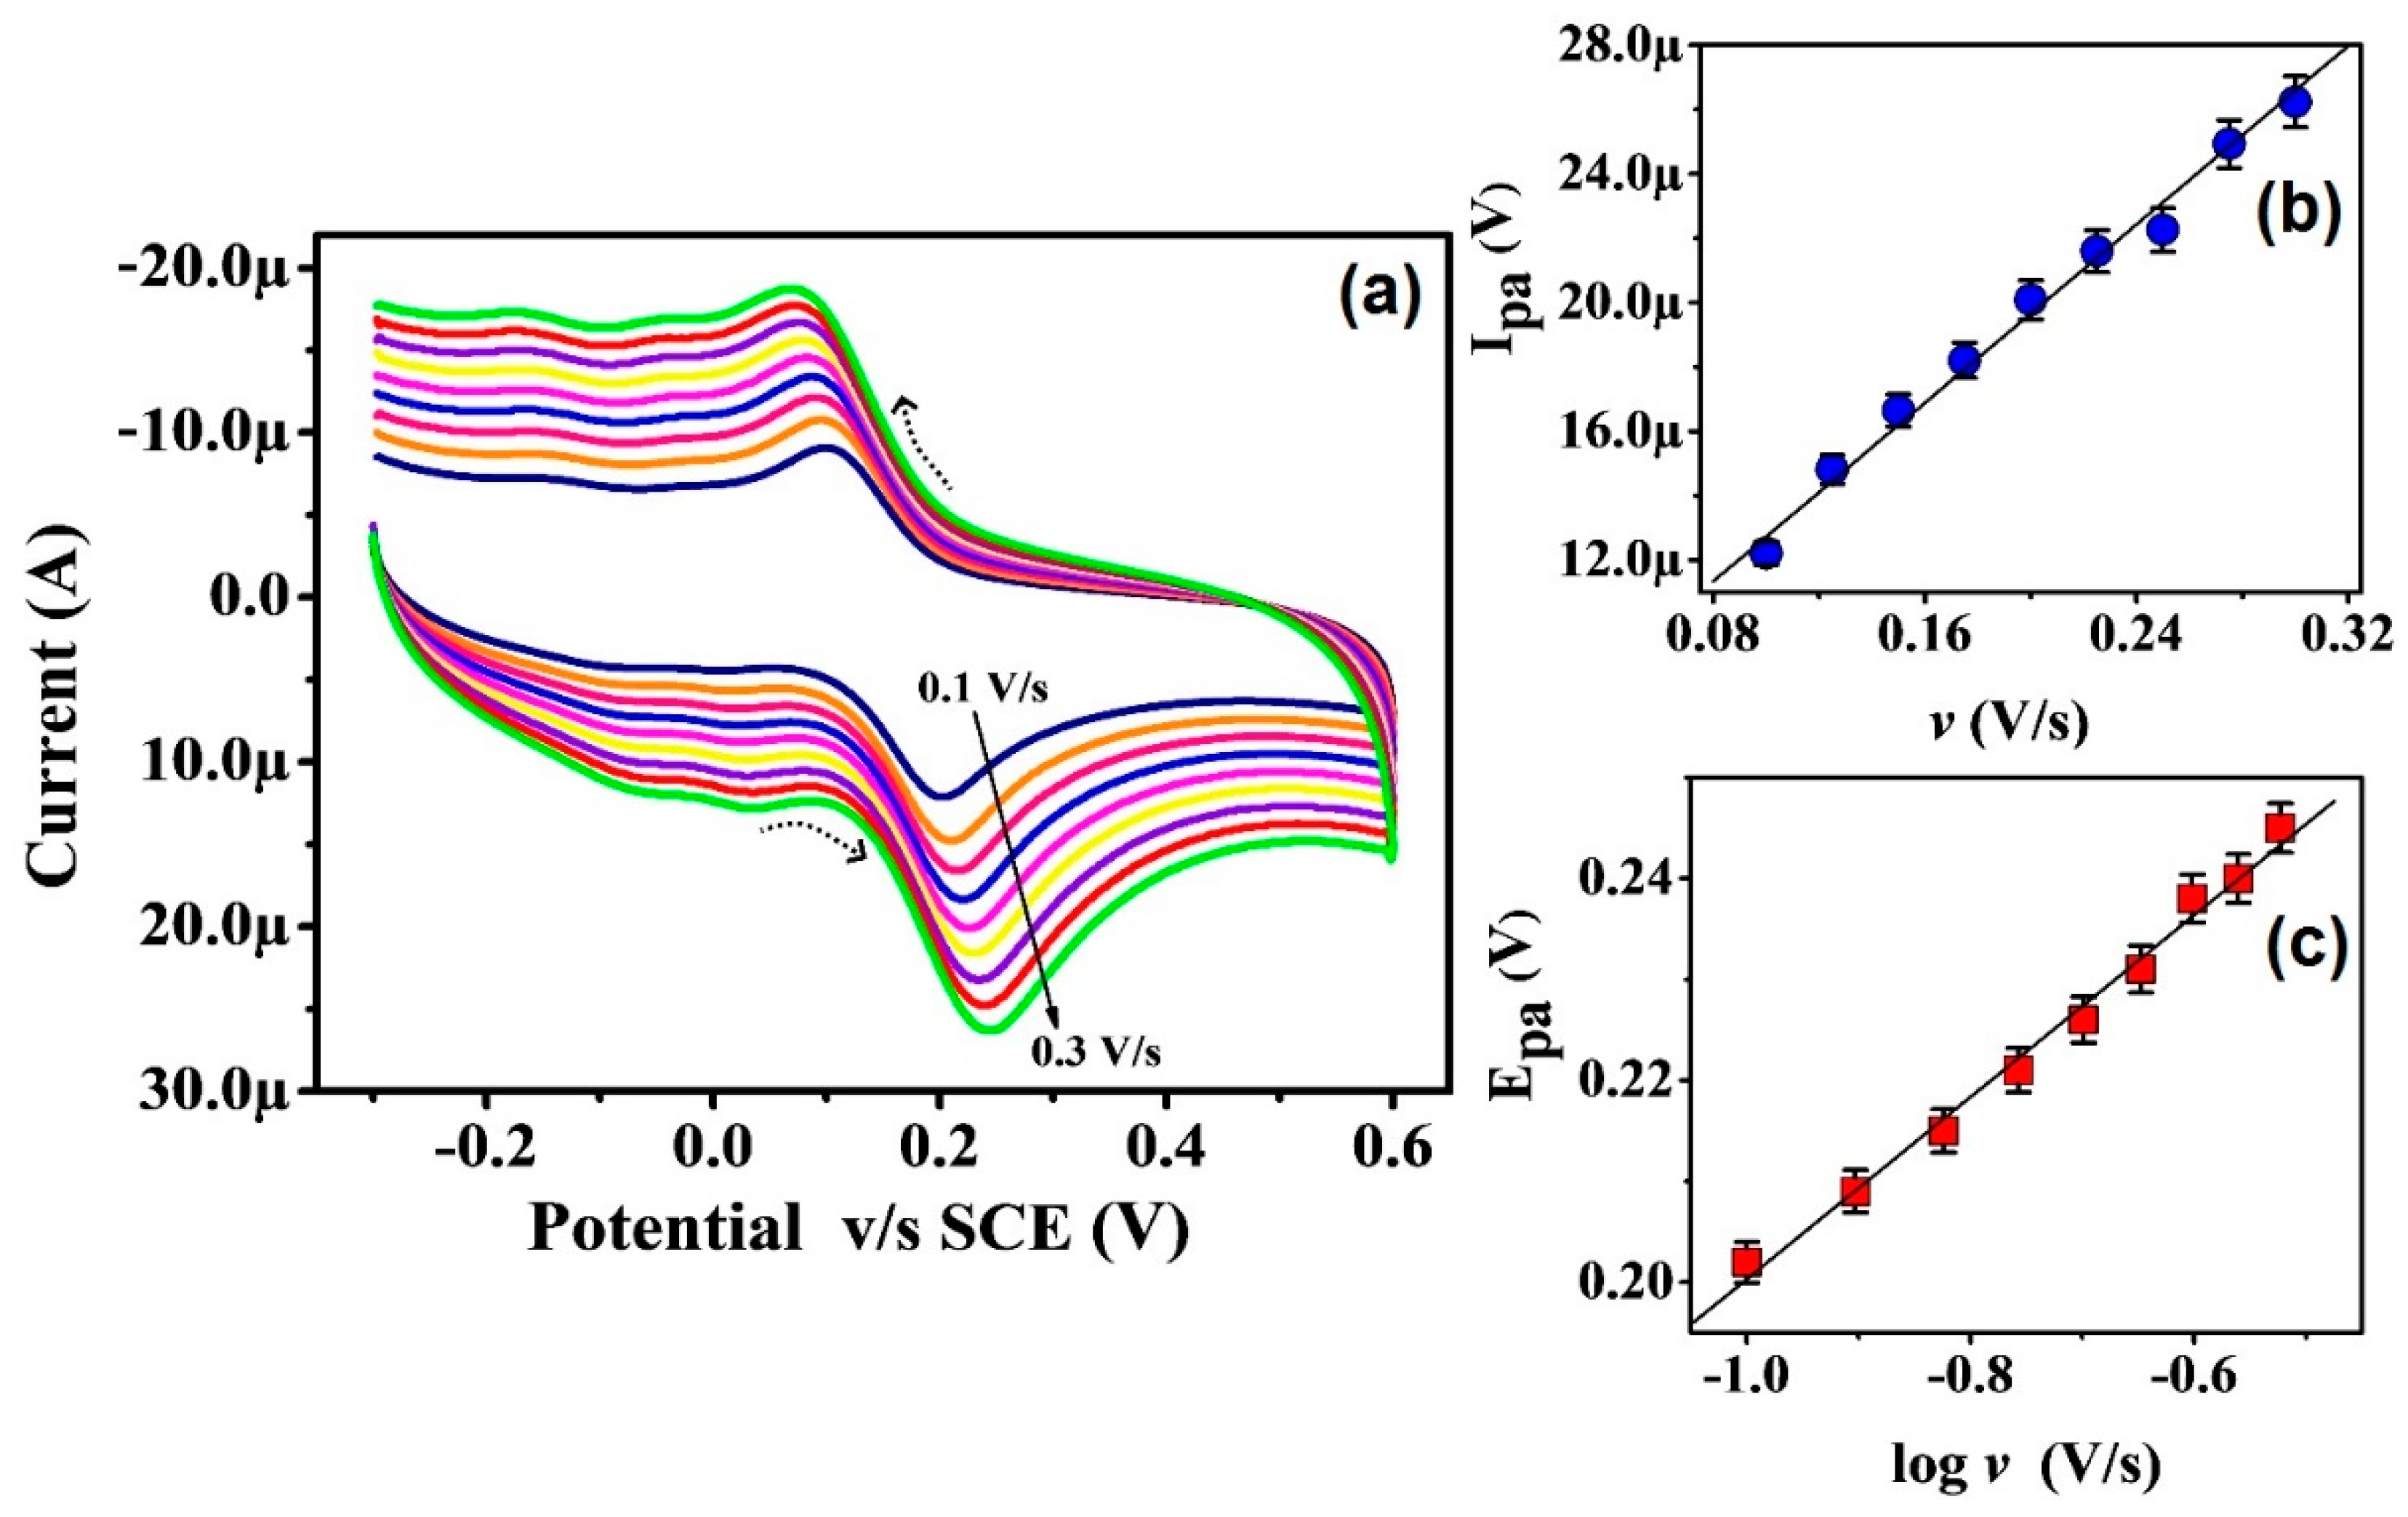
3.5. Scan Rate Impact on Electrode Reaction, Peak Current, and Peak Potential of CC

The scan rate influence on the electrode reaction, peak current, and peak potential for 0.1 mM CC on Poly(RA)MGPE was examined at optimal circumstances. Figure 5a displays the CVs for 0.1 mM CC at Poly(RA)MGPE in 0.1 M PBS of 7.0 pH at a variable scan rate in the range of 0.1 to 0.3 V/s. The plot of the anodic peak current against the scan rate (Figure 5b) illuminates that the peak current of CC was amplified by amplifying the scan rate with a high rate of electron transfer in each increment and shows a fine linear relationship and the linear regression relation of Ipa (μA) = 6.044 + 68.68 ν (V/s) (R2 = 0.997). These data disclose that the redox reaction mechanism of CC at Poly(RA)MGPE was accomplished through adsorption-controlled phenomena [49]. Figure 5c denotes the fine linear relationship among the anodic potential and the logarithmic value of the scan rate with a linear regression relation of Epa(V) = 0.2910 + 0.0908 log ν (V/s) (R2 = 0.995), and it displays that the electro-catalytic redox reaction of CC ensues through the electron transfer step. The obtained slope of 0.0908 was applied for the assessment of the participated electrons number in the redox reaction of CC by following Laviron’s relationship [50,51]:
E p = E 0 + [ 2.303 RT α nF ] log [ RTk 0 α nF ]   + [ 2.303 RT α nF ]   log ν
where “n” indicates the number of electrons, “E0” designates the standard potential, “α” indicates the charge transfer coefficient, “Ep” defines the peak potential, “k0” specifies the heterogeneous rate constant, and the remaining terms represent their respective physical meanings. The value of the charge transfer coefficient was measured by the following equation:
α = 47.7 E p E p / 2
where “Ep/2” denotes the peak potential at exactly half peak current. The premeditated value of α is 0.70 and the transferrable electrons in the CC redox reaction at Poly(RA)MGPE are 2.19 (approximately 2.0). The possible redox reaction mechanism of CC at Poly(RA)MGPE is presented in Scheme 1.

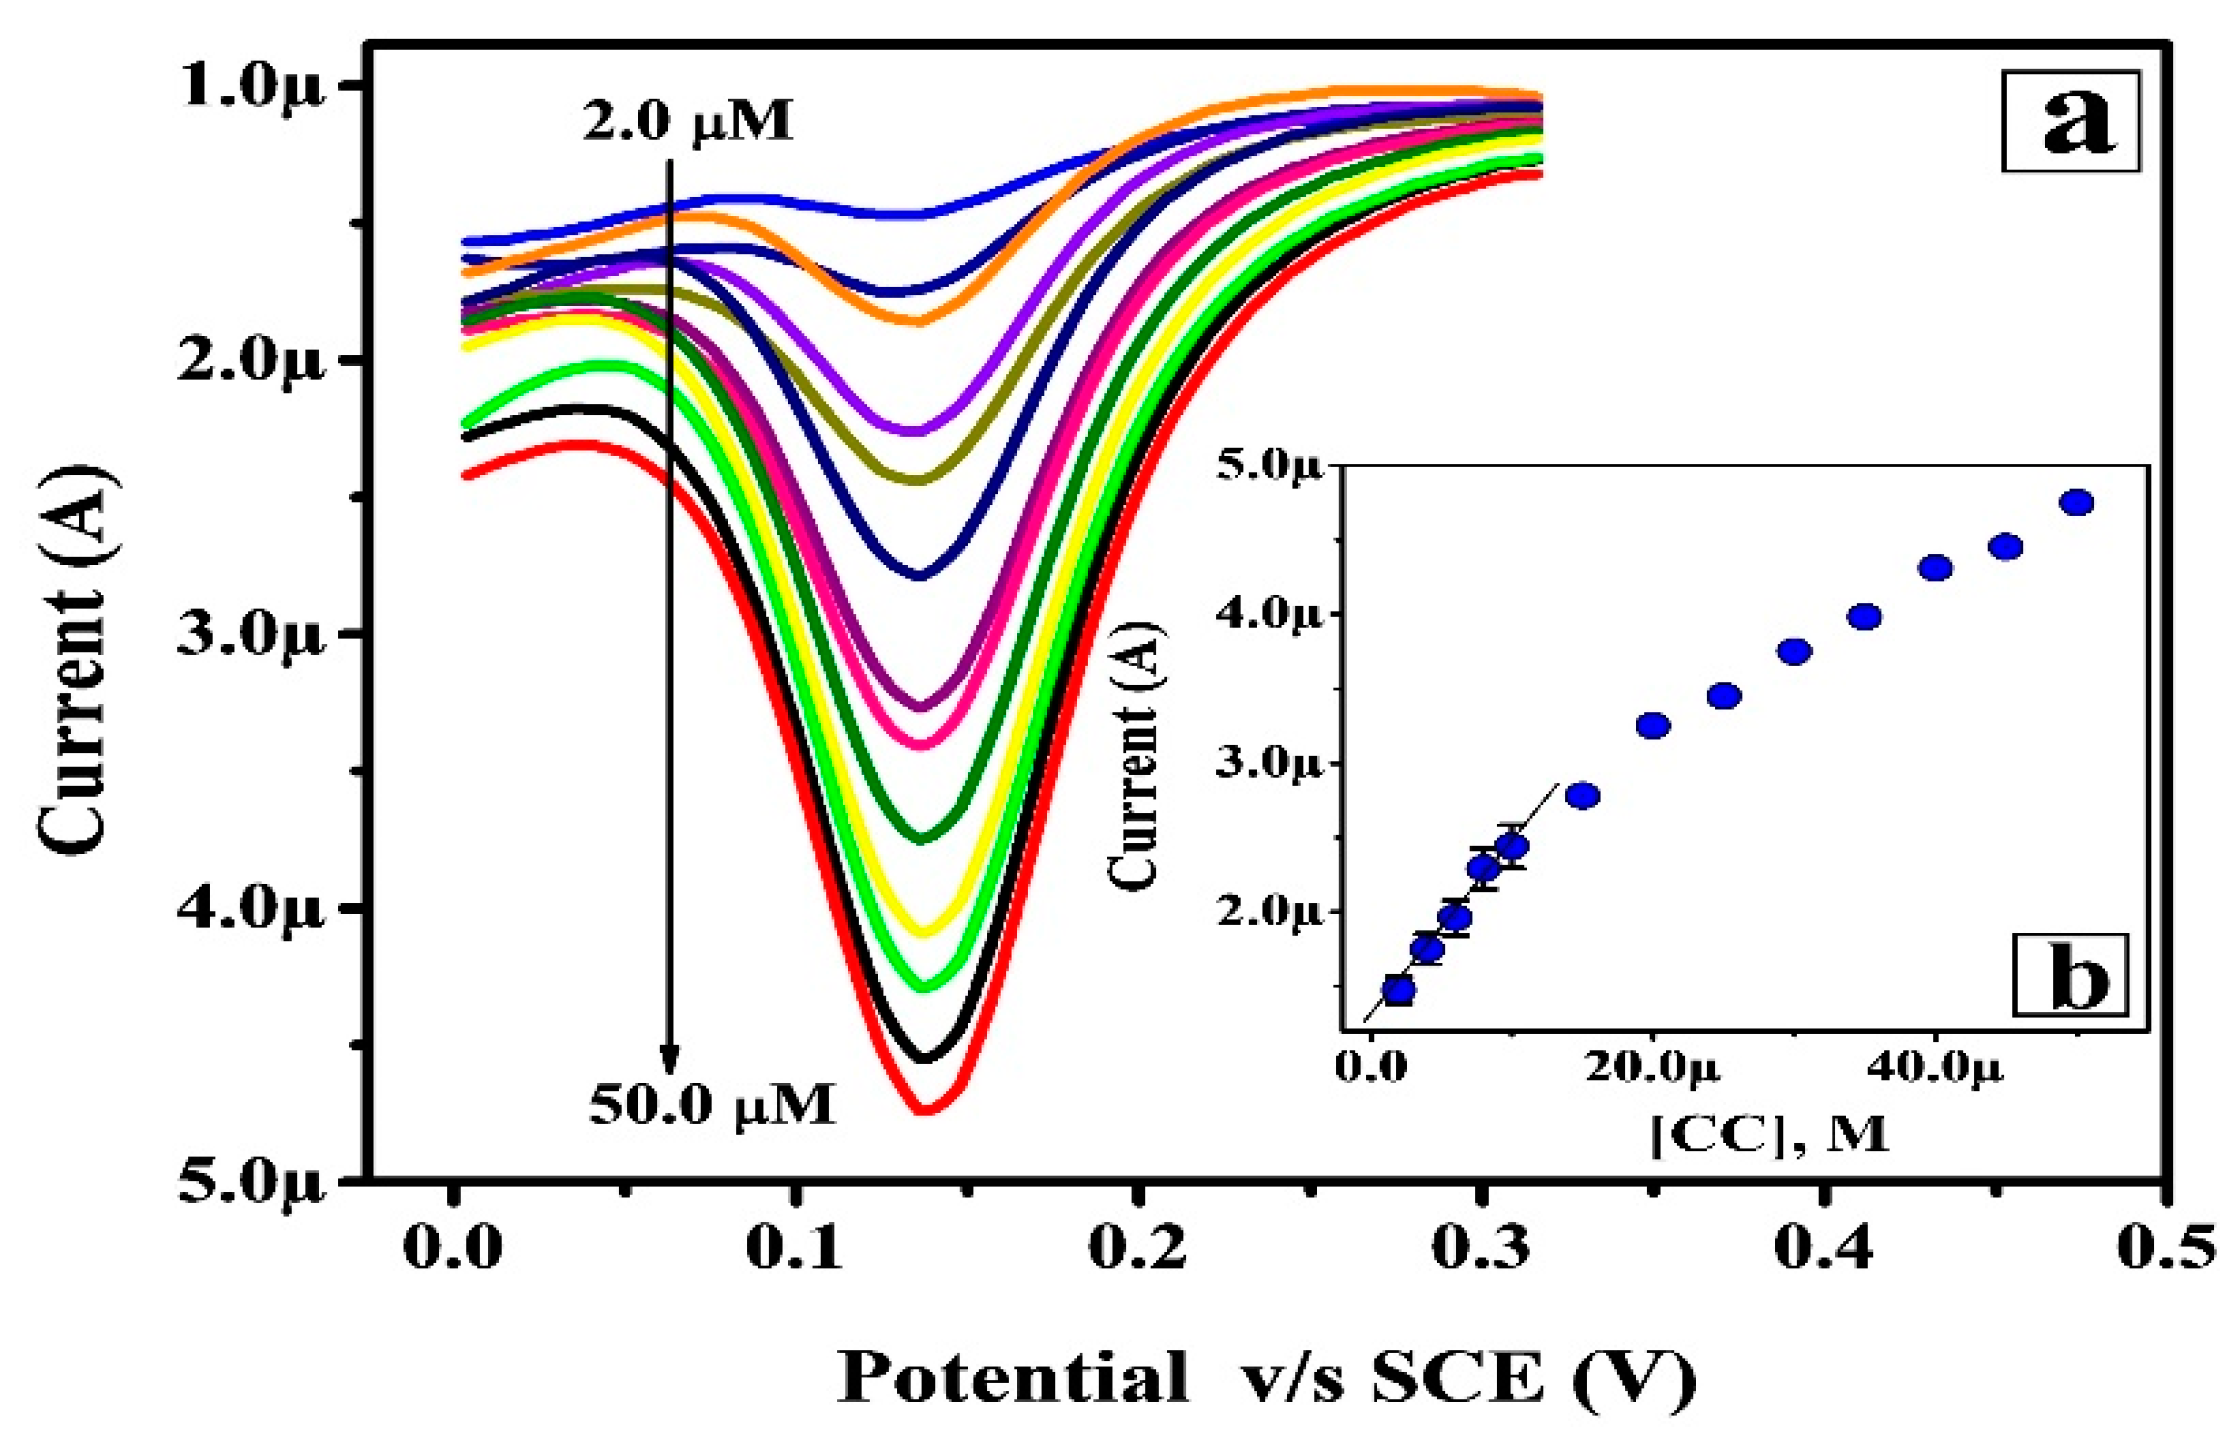
3.6. Limit of Detection and Quantification

The analyzing capability of the modified senor was investigated by the differential pulse voltammetry (DPV) method at a much lower CC concentration ([CC]) range. The differential pulse voltammograms (DPVs) for altered [CC] are in the range from 2.0 to 50 µM in 0.1 M PBS (7.0 pH) (Figure 6a). Further, all the attained DPVs show an enhanced peak current as there is an increase in [CC]. Figure 6b displays the [CC] against an oxidation current plot with two linear ranges. Here, the secondary linear growth provides a fine linear association between the oxidation current and [CC] in the range 15.0 to 50.0 µM with the linear regression relation of Ipa (A) = 1.240 × 10⁻⁶ + 0.133 C (M) (R2 = 0.998). The LOD and LOQ for CC at Poly(RA)MGPE were calculated by LOD = 3 S/M and LOQ = 10 S/M relations (where S is the standard deviation of the blank and M is the slope of the calibration plot). The calculated LOD and LOQ values were found to be 0.82 and 2.76 µM, respectively. The comparison of the presently achieved LOD values with previously reported works are tabulated in Table 1 [52,53,54,55,56]. The tabulated results conclude that the proposed Poly(RA)MGPE and DPV method deliver an improved sensitivity with a lower LOD than listed reports.

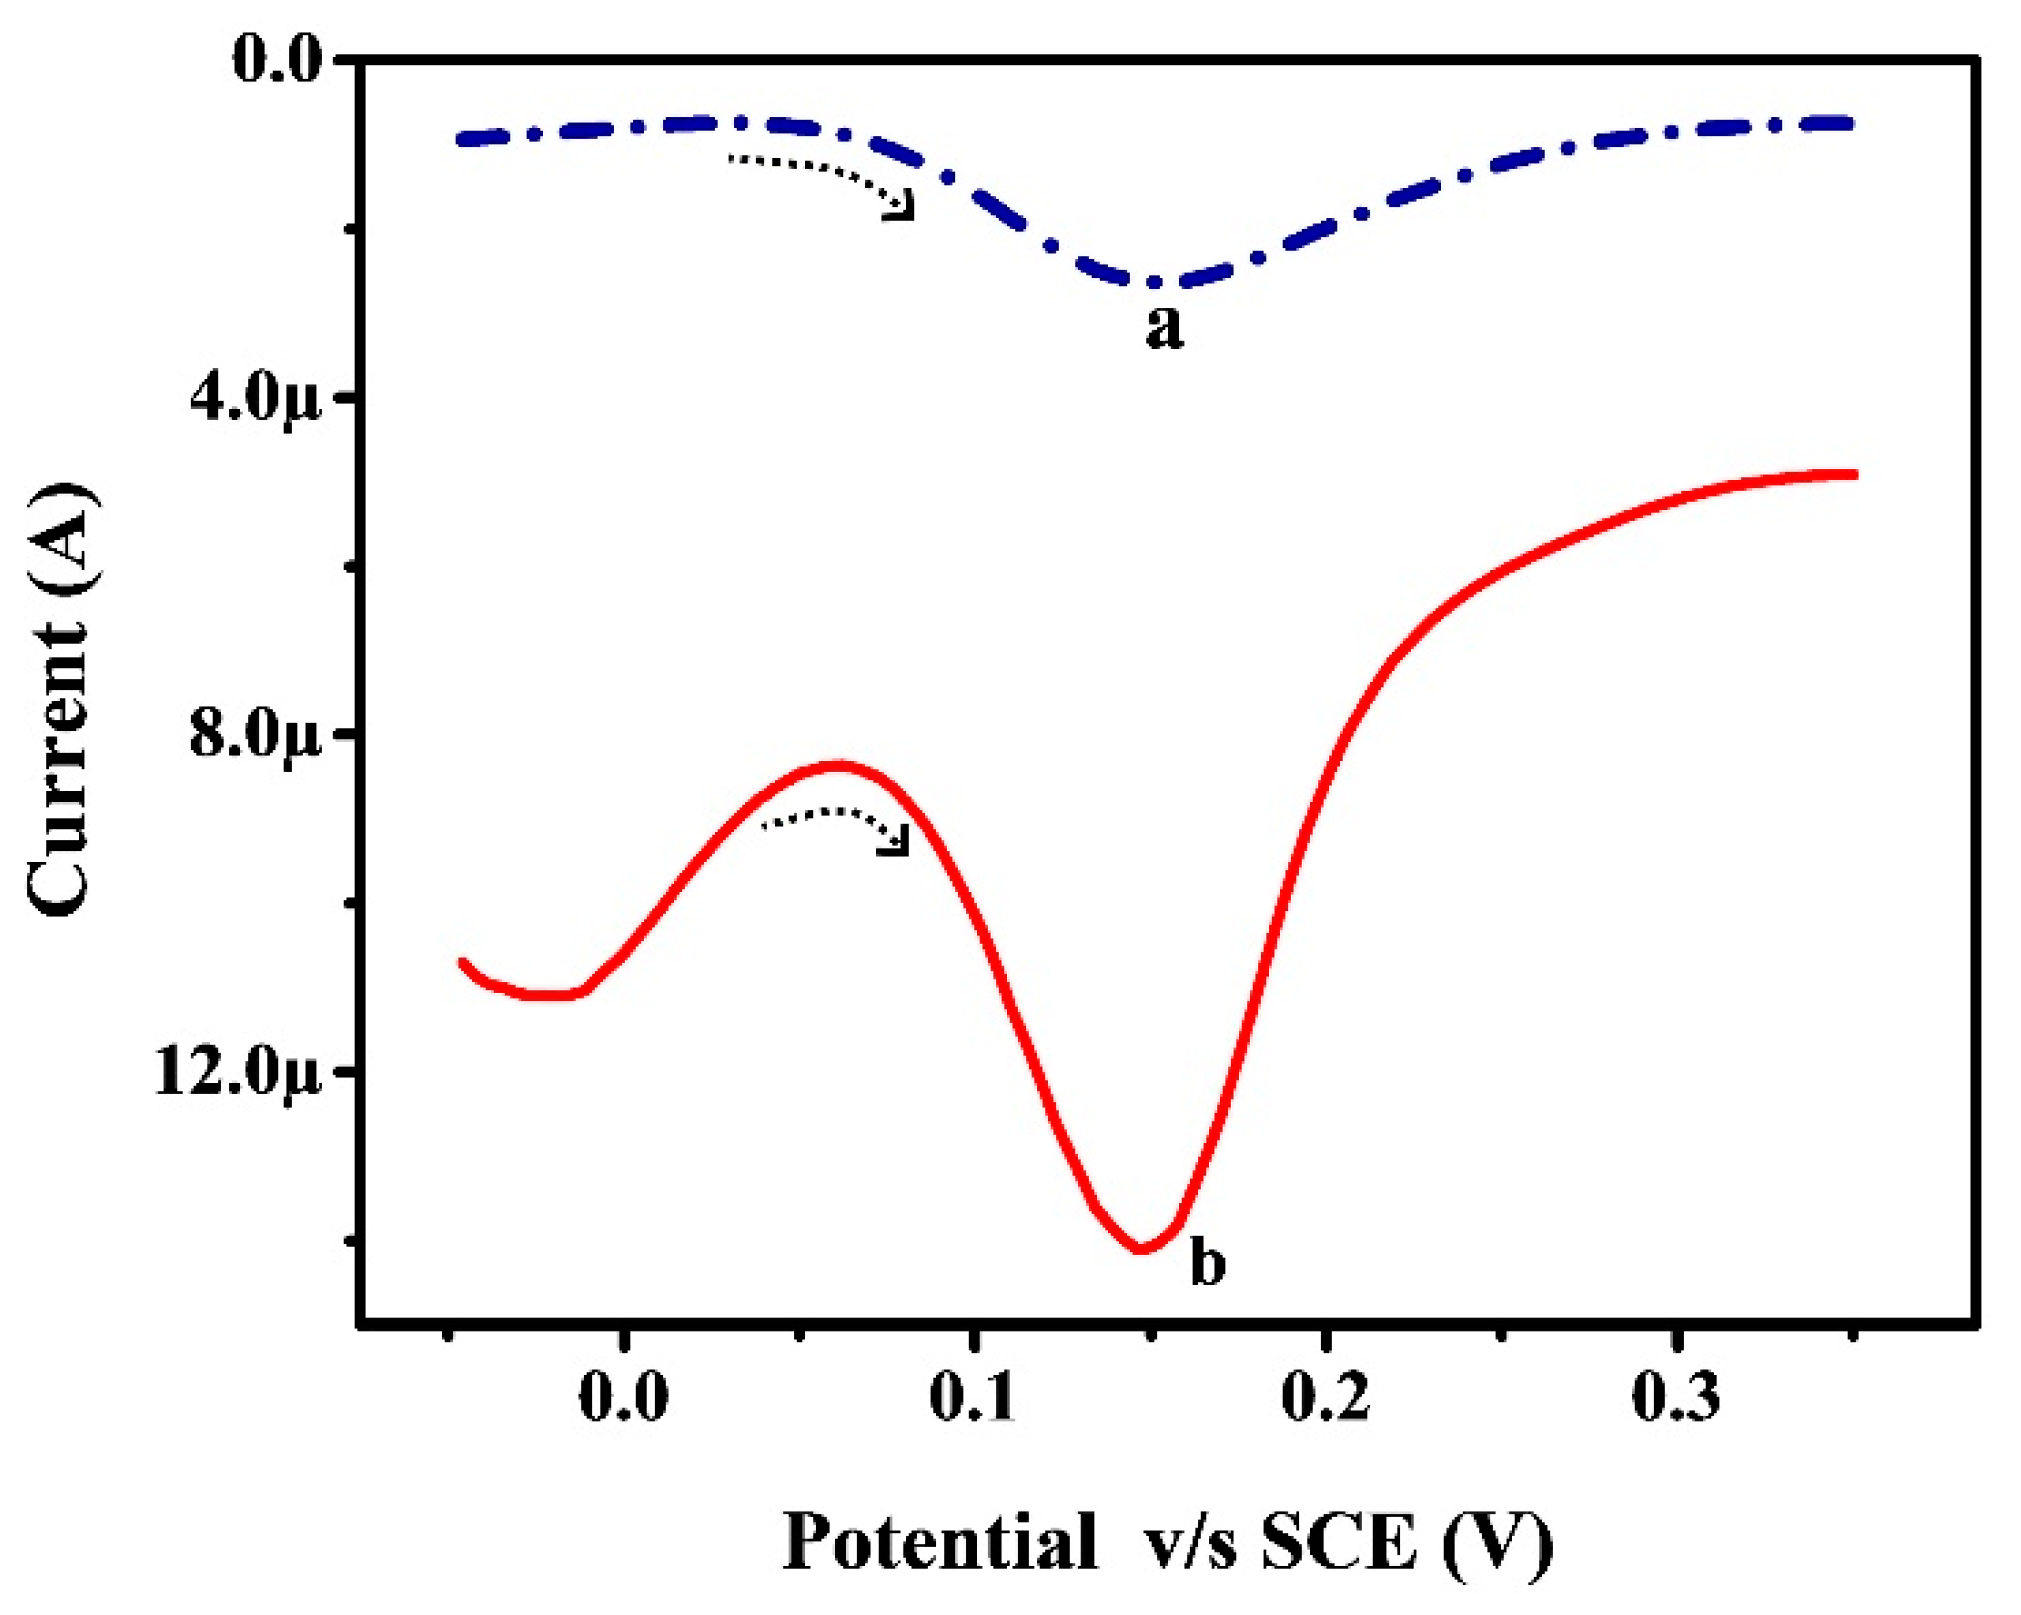
3.7. Oxidative Response of CC at Poly (RA)MGPE and BGPE via DPV

The oxidative response of CC in 0.1 M PBS (pH 7.0) on the surface of Poly(RA)MGPE and BGPE was scrutinized through DPV having the potential gap of −0.05 to 0.35 V. Figure 7 displays the DPVs for CC oxidation at Poly(RA)MGPE (curve b) and BGPE (curve a). The proposed Poly(RA)MGPE specifies the fine and distinctive oxidation CC peak at the peak current and peak potentials of 14.10 µA and 0.146 V, respectively. Nonetheless, BGPE reveals a less sensitive oxidation peak for CC at the peak potential of 0.154 V. This achieved outcome deduces that the projected Poly(RA)MGPE imparts higher sensitivity and a more rapid response than BGPE. Additionally, Poly(RA)MGPE shows some significant properties over BGPE such as a fast rate of electron transfer, its antifouling nature, and reduced over-potential.

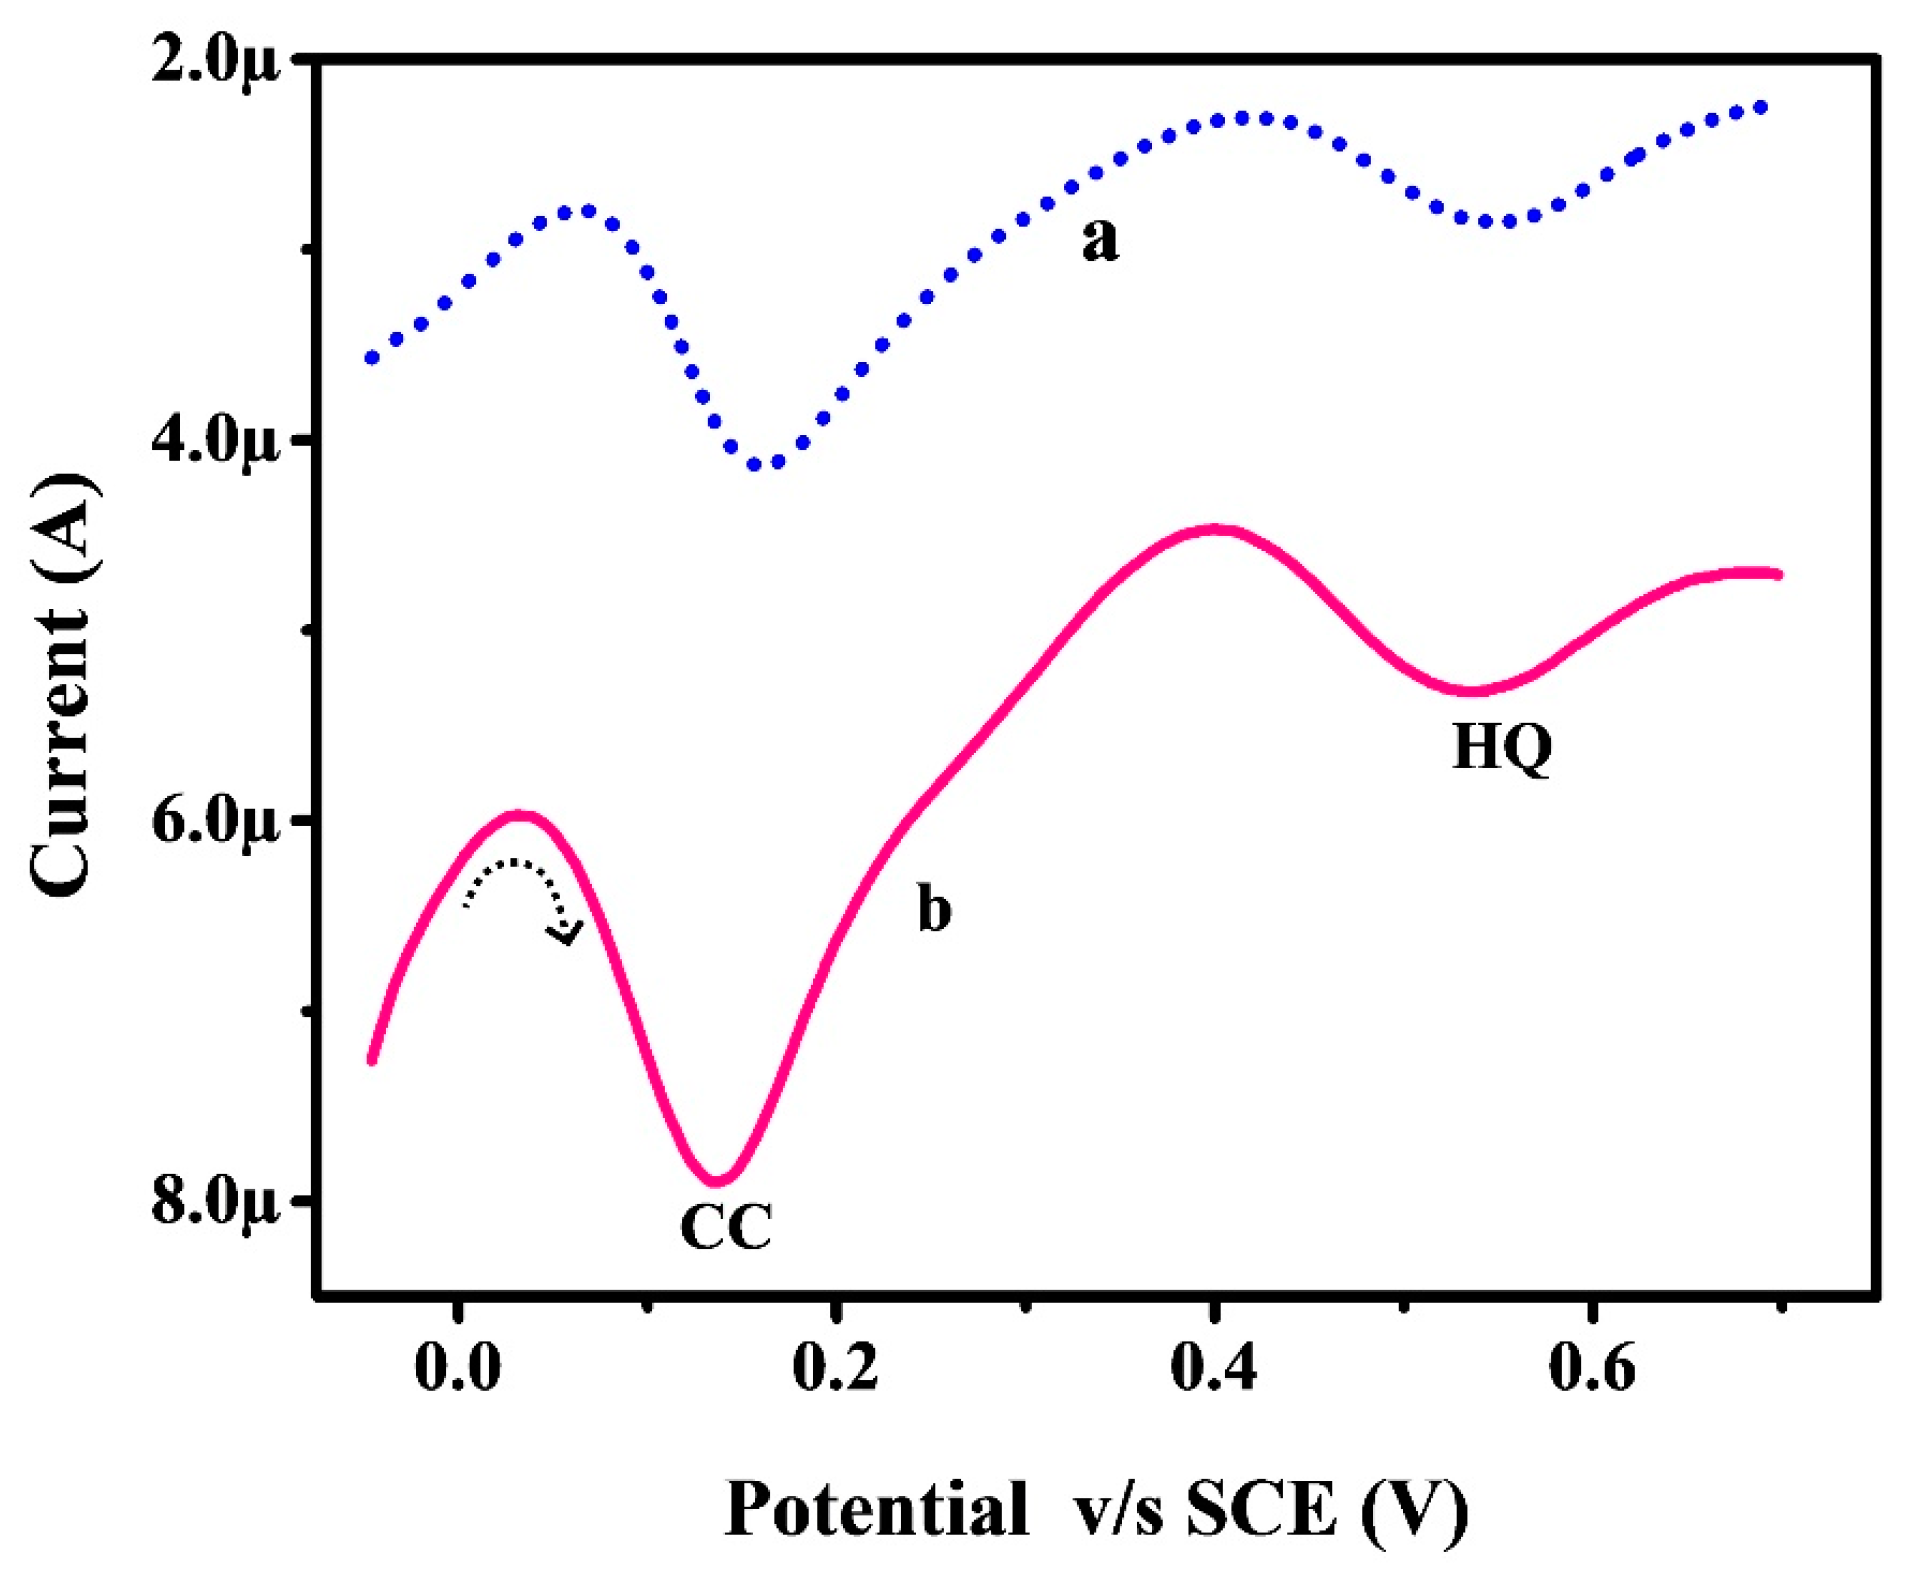
3.8. Selective DPV Analysis of CC with HQ at Poly(RA)MGPE

The selectivity of the projected Poly(RA)MGPE and BGPE towards the electro-oxidation of CC (0.1 mM) with HQ (0.1 mM) in 0.1 M PBS (7.0 pH) was evaluated by cycling DPV in the potential range of −0.05 to 0.7 V. Figure 8 parades the DPV curves for CC in the presence of HQ on the exterior of Poly(RA)MGPE (curve b) and BGPE (curve a). Here, BGPE shows weak electro-oxidation peaks for CC and HQ at the peak potentials of 0.10 and 0.54 V, respectively. Nevertheless, at Poly(RA)MGPE, CC and HQ molecules exhibit distinctive and fine resolved electro-oxidation peaks with the oxidation currents of 7.92 and 5.31 µA at the oxidation potentials of 0.138 and 0.535 V, respectively. The attained result clarifies that the highly sensitive electro-catalytic activity of the modified sensor for the oxidation of CC in the appearance and nonappearance of HQ is virtually identical, therefore the oxidation nature of CC and HQ at Poly(RA)MGPE is different and consequently selective.

3.9. Reproducibility, Repeatability, and Stability

The reproducibility, repeatability, and stability of the projected Poly(RA)MGPE were analyzed by the CV method at optimal circumstances. The Poly(RA)MGPE exposes fine reproducibility during five successive CV cycles having 3.8% of relative standard deviation (RSD). Further, the repeatability was checked by running five sequential CV cycles and provides a fine RSD of 1.28%. Furthermore, the steadiness of Poly(RA)MGPE was revealed by cycling thirty continual CV sequences with 95.25% of the retained initial peak current. These achieved data reveal that the adopted sensor shows acceptable reproducibility, repeatability, and stability for the detection of CC.

3.10. CC Analysis in Water Samples

The examined voltammetric technique was implemented for the inspection of CC in water samples at Poly(RA)MGPE. The concentration, quantity, and recovery rate of CC in water samples (in 0.1 M PBS of 7.0 pH) at Poly(RA)MGPE were detected by a standard addition procedure. The obtained result revealed that the equipped electrochemically stable Poly(RA)MGPE proves a robust electro-catalytic activity towards the redox nature of CC, even in the existence of further electroactive molecules or ions in water samples. The percentage recovery of CC shows that Poly(RA)MGPE is the best alternative for CC detection. Table 2 gives the information about the recovery of CC in water samples.

4. Conclusions

CC inspection was excellently performed on the surface of electrochemical catalyst Poly(RA)MGPE via CV and DPV methodologies. The suggested working electrode reveals some imperious applications such as fine reproducibility, repeatability, high stability, environmentally friendly, easily approachable, low priced, and these applications provide a good platform in the sensor field. Additionally, the proposed sensor exhibits enhanced stability for the electro-reduction of CC in the occurrence of HQ. Poly(RA)MGPE displays a superb linear response, reliability, selectivity, sensitivity and rapid response, and a lower LOD towards CC detection. The suggested voltammetric technique was efficiently applied for CC analysis in water samples.

Funding

This Research was funded by VGST, Bangalore under Research Project No:KSTePS/VGST-KFIST (L1)2016-2017/GRD-559/2017-18/126/333, 21/11/2017.

Conflicts of Interest

The author declares no conflict of interest.

References

  1. Tekalign, K. Cyclic Voltammetric and Electrochemical Simulation on the Electro-Oxidation of Catechol in the Absence of Any Nucleophile: Original Research. Chem. Mater. Res. 2017, 9, 1–12. [Google Scholar]
  2. Alemu, Y.; Amare, M.; Admassie, S.; Tessema, M. Simultaneous determination of hydroquinone and catechol at poly(p-asa)/MWNTS composite film modified glassy carbon electrode. SINET Ethiop. J. Sci. 2012, 35, 29–40. [Google Scholar]
  3. Barner, B.A. Catechol. In Encyclopedia of Reagents for Organic Synthesis; Paquette, L., Ed.; John Wiley & Sons: New York, NY, USA, 2004. [Google Scholar]
  4. Khala, L.; Rafiee, M. Kinetic study of the oxidation andnitration of catechols in the presence of nitrous acid ionization equilibria. J. Hazard. Mater. 2010, 174, 801–806. [Google Scholar] [CrossRef]
  5. Bisby, R.H.; Brooke, R.; Navaratnam, S. Effect of antioxidant oxidation potential in the oxygen radical absorption capacity (ORAC) assay. Food Chem. 2008, 108, 1002–1007. [Google Scholar] [CrossRef] [PubMed]
  6. Rafiee, M. E electron: The simplest chemical reagent. Synlett 2007, 3, 503–504. [Google Scholar] [CrossRef] [Green Version]
  7. Nematollahi, D.; Rafiee, M.; Fotouhi, L. Mechanistic study of homogeneous reactions coupled with electrochemical oxidation of catechols. J. Iran. Chem. Soc. 2009, 6, 448–476. [Google Scholar] [CrossRef]
  8. Gillner, M.; Moore, G.S.; Cederburg, H.; Gustafsson, K. International program on chemical safety. In Environmental Health Criteria 157; World Health Organization: Geneva, Switzerland, 1994; Available online: http://www.inchem.org/documents/ehc/ehc/ehc157.htm (accessed on 2 June 2020).
  9. Bhanger, M.I.; Niaz, A.; Shah, A.; Rauf, A. Ultra-trace level determination of hydroquinone in waste photographic solutions by UV-vis spectrophotometry. Talanta 2007, 72, 546–553. [Google Scholar]
  10. Gao, W.H.; Quigley, C.L. Fast and sensitive high performance liquid chromatography analysis of cosmetic creams for hydroquinone, phenol and six preservatives. J. Chromatogr. A 2011, 1218, 4307–4311. [Google Scholar] [CrossRef]
  11. Lee, B.L.; Ong, H.Y.; Shi, C.Y.; Ong, C.N. Simultaneous determination of hydroquinone, catechol and phenol in urine using high-performance liquid chromatography with fluorimetric detection. J. Chromatogr. A 1993, 619, 259–266. [Google Scholar] [CrossRef]
  12. Pistonesi, M.F.; Di Nezio, M.S.; Centurión, M.E.; Palomeque, M.E.; Lista, A.G.; Fernández Band, B.S. Determination of phenol, resorcinol and hydroquinone in air samples by synchronous fluorescence using partial least-squares (PLS). Talanta 2006, 69, 1265–1268. [Google Scholar] [CrossRef]
  13. Li, S.F.; Li, X.Z.; Xu, J.; Wei, X.W. Flow-injection chemiluminescence determination of polyphenols using luminol–NaIO4–gold nanoparticles system. Talanta 2008, 75, 32–37. [Google Scholar] [CrossRef] [PubMed]
  14. Dong, S.; Chi, L.; Yang, Z.; He, P.; Wang, Q.; Fang, Y. Simultaneous determination of dihydroxybenzene and phenylenediamine positional isomers using capillary zone electrophoresis coupled with amperometric detection. J. Sep. Sci. 2009, 32, 3232–3238. [Google Scholar] [CrossRef] [PubMed]
  15. Nagaraja, P.; Vasantha, R.A.; Sunitha, K.R. A sensitive and selective spectrophotometric estimation of catechol derivatives in pharmaceutical preparations. Talanta 2001, 55, 1039–1046. [Google Scholar] [CrossRef]
  16. Shakeel, N.; Ahamed, M.I.; Ahmed, A.; Rahman, M.M.; Asiri, A.M. Functionalized magnetic nanoparticle-reduced graphene oxide nanocomposite for enzymatic biofuel cell applications. Int. J. Hydrogen Energy 2019, 44, 28294–28304. [Google Scholar] [CrossRef]
  17. Anish, K.; Parwaz Khan, A.A.; Rahman, M.M.; Asiri, A.M.; Alamry, K.A. Preparation of polyaniline grafted graphene oxide–WO3 nanocomposite and its application as a chromium(iii) chemi-sensor. RSC Adv. 2015, 5, 105169–105178. [Google Scholar] [CrossRef]
  18. Chikere, C.O.; Faisal, N.H.; Kong-Thoo-Lin, P.; Fernandez, C. Interaction between Amorphous Zirconia Nanoparticles and Graphite: Electrochemical Applications for Gallic Acid Sensing Using Carbon Paste Electrodes in Wine. Nanomaterials 2020, 10, 537. [Google Scholar] [CrossRef] [Green Version]
  19. Ravishankar, T.N.; Sureshkumar, K.; Teixeira, S.R.; Fernandez, C.; Ramakrishnappa, T. Ag Doped Titanium Dioxide Nanocomposite-Modified Glassy Carbon Electrode as Electrochemical Interface for Catechol Sensing. Electroanalysis 2016, 28, 452–461. [Google Scholar] [CrossRef]
  20. Jahir, A.; Rahman, M.M.; Siddiquey, I.A.; Asiri, A.M.; Hasnat, M.A. Efficient hydroquinone sensor based on zinc, strontium and nickel based ternary metal oxide (TMO) composites by differential pulse voltammetry. Sen. Actuators B Chem. 2018, 256, 383–392. [Google Scholar] [CrossRef]
  21. Lopes de Macedo, I.Y.; Garcia, L.F.; Ribeiro de Souza, A.; Lima da Silva, A.M.; Fernandez, C.; Santos, M.D.G.; Magalhaes, R.S.; Torres, I.M.S.; de Souza Gila, E. Differential Pulse Voltammetric Determination of Albendazole and Mebendazole in Pharmaceutical Formulations Based on Modified Sonogel Carbon Paste Electrodes with Perovskite-Type LaFeO3 Nanoparticles. J. Electrochem. Soc. 2016, 163, B428–B434. [Google Scholar] [CrossRef]
  22. Abu-Zied, B.M.; Alam, M.M.; Asiri, A.M.; Jahir, A.; Rahman, M.M. Efficient hydroquinone sensor development based on Co3O4 nanoparticle. Microchem. J. 2020, 157, 104972. [Google Scholar] [CrossRef]
  23. Karim, M.R.; Rahman, M.M.; Asiri, A.M.; Hayami, S. Branched Alkylamine–Reduced Graphene Oxide Hybrids as a Dual Proton–Electron Conductor and Organic-Only Water-Splitting Photocatalyst. ACS Appl. Mater. Int. 2020, 12, 10829–10838. [Google Scholar] [CrossRef] [PubMed]
  24. Yousaf, A.B.; Rashid, K.; Imran, M.; Fernandez, C.; Cheng-Zong, Y.; Li, S. Synergistic Electronic Pull of Graphene oxide Supported Pd Nanoparticles on Enhancing Catalytic Activity of Electro Deposited Pt Nanoparticles for Methanol Oxidation Reaction. Int. J. Electrochem. Sci. 2016, 11, 6735–6746. [Google Scholar] [CrossRef]
  25. Manjunatha, J.G.; Kumara Swamy, B.E.; Mamatha, G.P.; Chandra, U.; Niranjana, E.; Sherigara, B.S. Cyclic voltammetric studies of dopamine at lamotrigine and TX-100 modified carbon paste electrode. Int. J. Electrochem. Sci. 2009, 4, 187–196. [Google Scholar]
  26. Manjunatha, J.G.; Kumara Swamy, B.E.; Deepa, R.; Krishna, V.; Mamatha, G.P.; Chandra, U.; Sharath Shankar, S.; Sherigara, B.S. Electrochemical studies of dopamine at eperisone and cetyltrimethyl ammonium bromide surfactant modified carbon paste electrode: A cyclic voltammetric study. Int. J. Electrochem. Sci. 2009, 4, 662–671. [Google Scholar]
  27. Manjunatha, J.G.; Kumara Swamy, B.E.; Gilbert, O.; Mamatha, G.P.; Sherigara, B.S. Sensitive voltammetric determination of dopamine at salicylic acid and TX-100, SDS, CTAB modified carbon paste electrode. Int. J. Electrochem. Sci. 2010, 5, 682–695. [Google Scholar]
  28. Manjunatha, J.G.; Kumara Swamy, B.E.; Mamatha, G.P.; Gilbert, O.; Chandrashekar, B.N.; Sherigara, B.S. Electrochemical studies of dopamine and epinephrine at a poly(tannic acid) modified carbon paste electrode: A cyclic voltammetric study. Int. J. Electrochem. Sci. 2010, 5, 1236–1245. [Google Scholar]
  29. Manjunatha, J.G.; Deraman, M.; Basri, N.H.; Talib, I.A. Fabrication of poly (Solid Red A) modified carbon nano tube paste electrode and its application for simultaneous determination of epinephrine, uric acid and ascorbic acid. Arab. J. Chem. 2018, 11, 149–158. [Google Scholar] [CrossRef]
  30. Manjunatha, J.G. A novel poly(glycine) biosensor towards the detection of indigo carmine: A voltammetric study. J. Food Drug Anal. 2017, 26, 292–299. [Google Scholar] [CrossRef]
  31. Manjunatha, J.G. Electroanalysis of estriol hormone using electrochemical sensor. Sens. Bio-Sens. Res. 2017, 16, 79–84. [Google Scholar] [CrossRef]
  32. Manjunatha, J.G. Surfactant modified carbon nanotube paste electrode for the sensitive determination of mitoxantrone anticancer drug. J. Electrochem. Sci. Eng. 2017, 7, 39–49. [Google Scholar] [CrossRef] [Green Version]
  33. Manjunatha, J.G. A new electrochemical sensor based on modified carbon nanotube-graphite mixture paste electrode for voltammetric determination of resorcinol. Asian J. Pharm. Clin. Res. 2017, 10, 295–300. [Google Scholar]
  34. Manjunatha, J.G.; Deraman, M.; Basri, N.H.; Talib, I.A. Selective detection of dopamine in the presence of uric acid using polymerized phthalo blue film modified carbon paste electrode. Adv. Mater. Res. 2014, 895, 447–451. [Google Scholar] [CrossRef]
  35. Manjunatha, J.G. Highly sensitive polymer based sensor for determination of the drug mitoxantrone. J. Surf. Sci. Technol. 2018, 34, 74–80. [Google Scholar] [CrossRef]
  36. Manjunatha, J.G. A novel voltammetric method for the enhanced detection of the food additive tartrazine using an electrochemical sensor. Heliyon 2018, 4, e00986. [Google Scholar] [CrossRef] [PubMed] [Green Version]
  37. Pushpanjali, P.A.; Manjunatha, J.G.; Shreenivas, M.T. The Electrochemical Resolution of Ciprofloxacin, Riboflavin and Estriol Using Anionic Surfactant and Polymer-Modified Carbon Paste Electrode. ChemistrySelect 2020, 4, 13427–13433. [Google Scholar] [CrossRef]
  38. Manjunatha, J.G. Electrochemical polymerised graphene paste electrode and application to catechol sensing. Open Chem. Eng. J. 2019, 13, 81–87. [Google Scholar] [CrossRef]
  39. Manjunatha, J.G. Poly(Adenine) Modified Graphene-Based Voltammetric Sensor for the Electrochemical Determination of Catechol, Hydroquinone and Resorcinol. Open Chem. Eng. J. 2020, 14, 52–62. [Google Scholar] [CrossRef]
  40. Geim, A.K.; Novoselov, K.S. The rise of graphene. Nat. Mater. 2007, 6, 183. [Google Scholar] [CrossRef]
  41. Geim, A.K. Graphene: Status and Prospects. Science 2009, 324, 1530. [Google Scholar] [CrossRef] [Green Version]
  42. Shen, J.; Hu, Y.; Shi, M.; Lu, X.; Qin, C.; Li, C.; Ye, M. Fast and Facile Preparation of Graphene Oxide and Reduced Graphene Oxide Nanoplatelets. Chem. Mater. 2009, 21, 3514–3520. [Google Scholar] [CrossRef]
  43. Hummers, W.S.; Offeman, R.E. Preparation of graphite oxide. J. Am. Chem. Soc. 1958, 80, 1339. [Google Scholar] [CrossRef]
  44. Higginbotham, A.L.; Kosynkin, D.V.; Sinitskii, A.; Sun, Z.; Tour, J.M. Lower-Defect Graphene Oxide Nanoribbons from Multiwalled Carbon Nanotubes. ACS Nano 2010, 4, 2059–2069. [Google Scholar] [CrossRef] [PubMed]
  45. Manjunatha, J.G.; Kumara Swamy, B.E.; Deraman, M. Electrochemical Studies of Dopamine, Ascorbic Acid and Their Simultaneous Determination at a Poly(Rosaniline) Modified Carbon Paste Electrode: A Cyclic Voltammetric Study. Anal. Bioanal. Electrochem. 2013, 5, 426–438. [Google Scholar]
  46. Manjunatha, J.G.; Deraman, M.; Basri, N.H.; Nor, N.S.M.; Talib, I.A.; Ataollahi, N. Sodium dodecyl sulfate modified carbon nanotubes paste electrode as a novel sensor for the simultaneous determination of dopamine, ascorbic acid, and uric acid. C. R. Chim. 2014, 17, 465–476. [Google Scholar] [CrossRef]
  47. Raril, C.; Manjunatha, J.G. A Simple Approach for the Electrochemical Determination of Vanillin at Ionic Surfactant Modified Graphene Paste Electrode. Microchem. J. 2019, 154, 104575. [Google Scholar] [CrossRef]
  48. Hareesha, N.; Manjunatha, J.G. Elevated and rapid voltammetric sensing of riboflavin at poly(helianthin dye) blended carbon paste electrode with heterogeneous rate constant elucidation. J. Iran. Chem. Soc. 2020, 17, 1507–1519. [Google Scholar] [CrossRef]
  49. Manjunatha, J.G. A surfactant enhanced graphene paste electrode as an effective electrochemical sensor for the sensitive and simultaneous determination of catechol and resorcinol. Chem. Data Collect. 2020, 25, 100331. [Google Scholar] [CrossRef]
  50. Lavirons, E. Adsorption, autoinhibition and autocatalysis in polarography and in linear potential sweep voltammetry. J. Electroanal. Chem. 1974, 52, 355–393. [Google Scholar] [CrossRef]
  51. Hareesha, N.; Manjunatha, J.G. Fast and enhanced electrochemical sensing of dopamine at cost-effective poly(dl-phenylalanine) based graphite electrode. J. Electroanal. Chem. 2020, 878. [Google Scholar] [CrossRef]
  52. Ganesh, P.S.; Kumara Swamy, B.E. Electroanalysis of catechol in presence of hydroquinone at poly (calmagite) modified carbon paste electrode: A voltammetric study. Sci. Lett. J. 2016, 5, 236. [Google Scholar]
  53. Li, M.; Ni, F.; Wang, Y.; Xu, S.; Zhang, D. Sensitive and facile determination of catechol and hydroquinone simultaneously under coexistence of resorcinol with a Zn/Al layered double hydroxide film modified glassy carbon electrode. Electroanalysis 2009, 21, 1521–1526. [Google Scholar] [CrossRef]
  54. Hu, F.; Chen, S.; Wang, C.; Yuan, R.; Yuan, D. Study on the application of reduced graphene oxide and multiwall carbon nanotubes hybrid materials for simultaneous determination of catechol, hydroquinone, p-cresol and nitrite. Anal. Chim. Acta 2012, 724, 40–46. [Google Scholar] [CrossRef] [PubMed]
  55. Da Silva, P.S.; Gasparini, B.C.; Magosso, H.A.; Spinelli, A. Electrochemical behavior of hydroquinone and catechol at a silsesquioxane-modified carbon paste electrode. J. Braz. Chem. Soc. 2013, 24, 695–699. [Google Scholar] [CrossRef]
  56. Peng, J.; Gao, Z.N. Influence of micelles on the electrochemical behaviors of catechol and hydroquinone and their simultaneous determination. Anal. Bioanal. Chem. 2006, 384, 1525–1532. [Google Scholar] [CrossRef] [PubMed]
Figure 1. (a) FE-SEM image of BGPE. (b) FE-SEM image of Poly(RA)MGPE.
Surfaces 03 00034 g001
Figure 2. Cyclic voltammogram for the electro-polymerization of 1.0 mM rosaniline in 0.01 M Sodium hydroxide at a 0.1 V/s scan rate in the potential range of −0.2 to 1.0 V.
Surfaces 03 00034 g002
Figure 3. (a) Cyclic voltammogram for 0.1 mM CC in different pH values from 6.0 to 8.0 of 0.1 M PBS at Poly(RA)MGPE at a 0.1 V/s scan rate. (b) The plot of Epa versus pH. (c) The plot of Ipa versus pH.
Surfaces 03 00034 g003
Figure 4. (a) Cyclic voltammograms (CVs) for the presence and absence (curve c) of 0.1 mM CC at Poly(RA)MGPE (curve a) and BGPE (curve b) in 0.1 M PBS (pH 7.0) at a 0.1 V/s scan rate, (b) relation between current response at BGPE and Poly(RA)MGPE, and (c) relationship between current obtained potential at BGPE and Poly(RA)MGPE.
Surfaces 03 00034 g004
Figure 5. (a) CVs for 0.1 mM CC in 0.1 M PBS (pH 7.0) at Poly(RA)MGPE at a variable scan rate in the range of 0.1 to 0.3 V/s. (b) The plot of the Ipa V/s ν. (c) The plot of Epa V/s log ν.
Surfaces 03 00034 g005
Scheme 1. Redox reaction mechanism of CC at Poly(RA)MGPE.
Surfaces 03 00034 sch001
Figure 6. (a) Differential pulse voltammograms (DPVs) for different concentration of CC in 0.1 M PBS (7.0 pH) at a 0.05 V/s scan rate from 2.0 to 50.0 µM. (b) Plot of the [CC] Vs Ipa at Poly(RA)MGPE.
Surfaces 03 00034 g006
Figure 7. DPV response of CC in 0.1 M PBS (pH 7.0) on Poly(RA)MGPE (curve b) and BGPE (curve a) at the potential gap of −0.05 to −0.35 V with the scan rate of 0.05 V/s.
Surfaces 03 00034 g007
Figure 8. DPVs for CC in the presence of HQ in 0.1 M PBS (pH 7.0) at Poly(RA)MGPE (curve b) and BGPE (curve a) at the scan rate of 0.05 V/s.
Surfaces 03 00034 g008
Table 1. Comparison of different LOD values with the present work.
MethodSensorLOD, µMReference
DPVPoly(calmagite) MCPE2.550[52]
DPVZn/Al layered double hydroxide film MGCE1.200[53]
DPVGraphene oxide and multiwall carbon nanotubes1.800[54]
DPVSilsesquioxane-modified carbon paste electrode10.000[55]
DPVInfluence of micelles/GCE3.000[56]
DPVPoly(RA)MGPE0.820Present work
Table 2. Data of CC recovery in water samples.
Environmental SampleAdded Concentration (µM)Found Concentration (µM)Recovery (%)
Water0.1200.11797.50
0.1600.15596.87
0.2000.19698.00

