Article

Monolayer Gas Adsorption on Graphene-Based Materials: Surface Density of Adsorption Sites and Adsorption Capacity

by
Olga Jakšić
*,
Marko Spasenović
,
Zoran Jakšić
and
Dana Vasiljević-Radović
Center of Microelectronic Technologies, Institute of Chemistry, Technology and Metallurgy—National Institute of the Republic of Serbia, University of Belgrade, 11000 Belgrade, Serbia
*
Author to whom correspondence should be addressed.
Surfaces 2020, 3(3), 423-432; https://doi.org/10.3390/surfaces3030031
Submission received: 7 June 2020 / Revised: 15 July 2020 / Accepted: 26 July 2020 / Published: 24 August 2020

Abstract

:
Surface density of adsorption sites on an adsorbent (including affinity-based sensors) is one of the basic input parameters in modeling of process kinetics in adsorption based devices. Yet, there is no simple expression suitable for fast calculations in current multiscale models. The published experimental data are often application-specific and related to the equilibrium surface density of adsorbate molecules. Based on the known density of adsorbed gas molecules and the surface coverage, both of these in equilibrium, we obtained an equation for the surface density of adsorption sites. We applied our analysis to the case of pristine graphene and thus estimated molecular dynamics of adsorption on it. The monolayer coverage was determined for various pressures and temperatures. The results are verified by comparison with literature data. The results may be applicable to modeling of the surface density of adsorption sites for gas adsorption on other homogeneous crystallographic surfaces. In addition to it, the obtained analytical expressions are suitable for training artificial neural networks determining the surface density of adsorption sites on a graphene surface based on the known binding energy, temperature, mass of adsorbate molecules and their affinity towards graphene. The latter is of interest for multiscale modelling.

Graphical Abstract

1. Introduction

The development in micro and nano technologies enabled fabrication of structures whose function depends on adsorption-desorption processes. That dependence can be favorable like in affinity-based (bio)chemical sensors [1] including graphene-based gas sensors [2,3], or undesirable like in microresonators whose adsorption-induced mass fluctuations provoke frequency instabilities [4]. Although the process itself is not new [5], corresponding models are still under development [6]. A requirement for models is that they need to be fast, reliable and flexible, suitable for stand-alone use or incorporation in multiscale models of complex systems [7]. Advances of computing concepts and algorithms based on trained artificial neural networks (ANN) enabled fast yet reliable modeling and inspired for instance developing of ANN, trained on ab initio calculations or experimental results, used for modeling many processes, including the adsorption process. ANN assisted modeling of kinetic parameters and reaction mechanisms is documented in [8], ANN assisted modeling of adsorption capacity of Cu(II) on powders as bio adsorbents for water purification in [9] and ANN assisted modeling of uptake percentage of Pb(II) ions by rice husks as bio-adsorbents in [10]. The list is far from complete, the quoted examples being an illustration only.
Besides modeling of adsorption capacities and parameters for equations of adsorption kinetics and dynamics, the employment of ANN is used to explore the effect of surface structure on the adsorption process. In [11], a combination of molecular simulation and machine learning was used to examine the role of various pore topological structures on the C O 2 capture capabilities of MOFs (metal organic frameworks). In [12] the effects of surface structure (disordered or ordered) on the description of the adsorption isotherm and the isosteric heat of nitrogen and argon adsorption onto graphitized thermal carbon black were studied and it was found that the surface structure had little effect on the adsorption of argon or nitrogen at either 77 K or 87.3 K. All the reported works show that ANN based modeling is feasible and that it gives reliable results. However, significant computer resources and time are needed for good training of an ANN. Thus a simple analytical model, valid for modeling kinetic parameters of the adsorption of an arbitrary gas or a mixture on a solid surface would be of great advantage for the use in multiscale modeling of more complex systems but also for training of future ANNs.
Analytical models of the rate constants for adsorption and desorption, based on the ideal gas theory, applicable to the gas adsorption on a homogeneous crystallographic surface, are presented in [13]. Apart from pressure, temperature, molar mass of the gas and its affinity towards the surface, the surface density of the adsorption sites on the surface and the desorption energy are needed for the calculation of the rate constants. The desorption energy may be determined using computational methods at different levels of theory: density functional theory, empirical force fields, and semi-empirical quantum mechanics. The results on the calculation of the desorption energy of small molecules from graphene are presented in [14] along with a list of referenced experimental data used for the verification of the method. A first principles study of gas adsorption on graphene is given in [15], while hydrogen adsorption is explicitly studied in [16], ozone adsorption in [17], and carbon monoxide adsorption in [18]. First-principles calculations are coupled with statistical mechanics to study adsorption behaviour of various molecules on graphene [19]. Molecular adsorption is reviewed in [20], some referenced experimental data are gathered in [21,22] and the estimation of the desorption energy by using an ANN, trained on calculated or experimentally obtained data, also feasible, is presented in [23]. However, the surface density of adsorption centers is hard to deduce from experiments and the data on it is scarce in the literature.
This work refers to the modeling of surface density of adsorption sites with focus on graphene. This material shows many unique features [24,25,26,27] stemming from its 2D structure. Its crucial role in various application fields nowadays cannot be overestimated (e.g., electronics – both conventional and stretchable, environmental protection, separation science and other applications of (nano)membranes, biomedicine, sensors and actuators, catalysis, electrochemical devices, energy harvesting and conversion and many more [28,29,30,31,32,33]). Adsorption of various species on graphene is important since it affects many applications, and in many cases ensures their basic principle of operation [28,29]. Besides, it influences and modifies the graphene properties in general, since every graphene-based structure and device will have to be immersed in some kind of fluid environment (be it liquid or gas) and thus exposed to adsorption and desorption effects. The influence of adsorption will be quite pronounced in any case, the dimensions of the graphene monolayer being comparable to that of the adsorbed species, contributing to a strong influence of the adsorbate to the physical and chemical properties of graphene. For instance, in [34] it was observed that adsorption of hydrogen on graphene caused bandgap opening and thus the modification of basically all of its physical and chemical properties. Various approaches were taken to determine adatom adsorption on graphene (e.g., [35,36,37,38]). This is only a small fraction of the pertinent literature, since literary tens of thousands of papers related to adsorption on graphene have been published until now, which itself indicates the importance of the problem. In the further text we quote a number of important literature sources related to the topic.
The surface density of adsorption sites is one of input parameters in expressions for the rate constants for adsorption in models of adsorption kinetics, one valid for the first order reactions, first introduced by Lagergren in 1898 [5], the other valid for the second order reactions [39]. Expressions and experimental data met in literature, such as the equation for the ’surface density of adsorption’ reported in [40], are often unrelated to the number of adsorption sites on the surface but to the equilibrium surface density of adsorbate molecules. The expression given in [40] that refers to the equilibrium coverage of adsorbate molecules, is used here reversely, for the calculation of the surface density of adsorption sites on the surface of the sensing or adsorbent device in case adsorption kinetics resembles the kinetics of the first order reactions. This agrees with the criteria investigated in [6] and is valid for a broad range of gas adsorption applications. Hence, our work provides a practical method to calculate a parameter that is of primary importance to theoretical and experimental determination of adsorption-desorption reaction kinetics on graphene and other surfaces.

2. Methods

We consider the monolayer adsorption and set the starting premises and notation: the surface is homogeneous, gas particles do not interact with each other, adsorbed particles do not collide or interact and do not form multilayer islands. Gas molecules, A g , approach the surface, stick to it with a certain probability α s named the sticking coefficient and with certain strength characterized by the desorption energy E d , become adsorbed molecules A a that occupy a previously free adsorption site A f , remain adsorbed for some residential time with mean value τ , before desorbing and moving freely again, becoming available for the next adsorption event. The process is reversible and stochastic, represented by the stoichiometric Equation (1) where k a is the rate constant of the adsorption, k d is the rate constant of the desorption and i is the index referring to the gas species in the multicomponent gas atmosphere.
A g i + A f k a i k d i A a i .
Figure 1a shows a moment of that dynamic process if the adsorbate is a three-component mixture of monatomic gases chosen to have molecules with their diameters smaller than, comparable to or greater than the molecules on the top layer on the solid surface. The illustration is generated by the software package ADmoND [41], written for the MathWorks MATLAB environment, capable of calculations related to mono and multi component adsorption in the time and frequency domain. We assume that the surface density of the adsorption centers for small molecules equals the surface density of the molecules of the adsorbent surface. In the case of monolayer adsorption, small adsorbate molecules cannot populate the places not provided by the surface. Large molecules, on the other hand, cover more than one adsorption center, so the surface density of adsorption sites for them is not equal to the surface density of molecules on the solid surface. As an illustration, the graphene structure is shown in Figure 1b.
However, beside considering the adsorbate molecular sizes or orientations and the adsorbent crystallographic structure, the calculations of the surface density of the adsorption sites on graphene are even more complex because adsorption centers can be carbon atoms at vertices of hexagons, carbon bonds (bridges of hexagons) or centers of hexagons [15,17,42]. The adsorption centers on graphene located on the carbon atoms on the vertices of the hexagons are denoted with T. The adsorption centers on the sides of the hexagons (the “bridges” between atoms) are denoted with B and the adsorption centers located on the centers of the hexagons (above the hollow) are denoted with H. The calculations based on the statistical mechanics performed in [19] resulted with the favored configurations of several gases on graphene: water molecules bind favorably along the long diagonal of the hexagon, oxygen is placed on an H site, similar to ammonia molecules that bind preferably also to H, nitrogen atom being on a H site, carbon monoxide molecules bind preferably with their carbon atom on B and oxygen atom on an H site and the nitrogen dioxide molecules occupy a T site by nitrogen atom and H and B sites by oxygen atoms. The more complex the molecules, the more complex are the ways of adsorption. Figure 2 shows the spacial orientations of carbon monoxide, chlorine and hexane and their molecular projection areas that can be compared with the surface area of a graphene hexagon. The molecule structure is obtained using the chemical structure information available in the PubChem (http://pubchem.ncbi.nlm.nih.gov/) Substance and Compound database through the unique chemical structure identifier CID. Then the molecular projected surface area was obtained using program Marvin 5.9.3, 2012, ChemAxon (http://www.chemaxon.com).
The bond length between two carbon atoms in a single cell of graphene shown in Figure 1b (single hexagon), is 0.142 nm, hence the surface density of carbon atoms in a graphene monolayer is 2 atoms per 5.24 squared angströms; the graphene layer thickness is 0.335 nm [2,43]. In the process of adsorption, different spacial orientations cause different numbers of occupied adsorption centers of the same gas species and in some cases may bond differently with different desorption energies. Consequently, the number of adsorption sites on the graphene surface cannot be modeled solely by using the information on the crystallographic structure of the surface as in the case of adsorption of small molecules on solid surfaces and it can not be modeled solely by using the information on the molecular structure and orientation, which is possible for modeling adsorption on homogeneous surfaces [13].
Here we use the information on the adsorption kinetics in a reverse manner in order to deduce the information on the surface density of the adsorption sites on graphene surface based on the information on the adsorption capacity.
Reaction rate equations that correspond to the stoichiometric Equation (1) in case of an arbitrary number of gases in the adsorbate mixture, r, are represented by the set of the differential equations.
d N a i d t = α s i n s i V k B T 2 π m 0 i N 0 i N a i N a i max j = 1 r n s i n s j N a j N a i τ i
In every of r equations, N a refers to the number of adsorbed molecules, N 0 to the overall number of molecules of that particular component in the adsorbate mixture, V is the volume of the reaction chamber, k B is the Boltzman constant, T temperature, m 0 is the mass of a single molecule, n s is the surface density of adsorption centers available for molecules of the particular adsorbate and N a m a x is the number of the adsorption sites. n s equals the ratio of N a m a x and the active surface area. Equation set (2) is the set of second order Riccati differential equations that can be represented in a matrix form as the matrix Riccati equation and can be solved in a closed form for the monocomponent adsorption only. If the conditions are met that the equation set can be retarded to the set of linear differential equations, for instance if the depletion of the number of molecules in the gas phase due to the adsorption is negligible, then there is a solution in a closed form, as documented in [44]. The process is stable, without oscillations [45]. Whether obtained numerically or analytically, the solutions to rate equations represent the transient response and prove that the monolayer adsorption belongs to the natural processes with exponential relaxation towards the steady state. According to [6], gas adsorption meets the criteria for the validity of the linear rate equations and solutions from [44] are valid. For the monocomponent adsorption the expression for the number of adsorbed molecules in a steady state, written in terms of the rate constant for the adsorption, k a , and the rate constant for the desorption, k d , as defined in [13], is:
N a e q = N a m a x k a N 0 k d + k a N 0 , n e q = n s k a N 0 k d + k a N 0 = n s θ e q .
N a e q is the adsorption capacity of a monocomponent monolayer adsorption with the first order kinetics given as the number of adsorbed molecules. When normalized with the surface area, it refers to the adsorption capacity in terms of the equilibrium surface density, n e q . When normalized with the number of adsorption centers on the surface it refers to the adsorption capacity in terms of the equilibrium coverage, θ e q . As shown in [6], the adsorption capacity of a monocomponent monolayer adsorption with the first order kinetics is close to or higher than the adsorption capacity of a monocomponent monolayer adsorption with the second order kinetics. The criteria for the validity of the first order kinetic model show that gas adsorption in a broad range of applications can be modeled as a first order kinetic reaction. The adsorption capacity can be estimated based on laws of the statistical mechanics, as reported in [19] and in that way it is possible to obtain the expression based on the use of the information on the desorption energy only, as reported in [40]. Thus by the reverse use of these expressions one gets the information on the number of the adsorption sites on the surface.

3. Results and Discussion

Based on the Equation (2), the rate constants for the adsorption and the desorption in the case of monocomponent monolayer adsorption are:
k a = α s n s V k B T 2 π m 0 , k d = 1 τ = 2 π ω g e E d / k B T .
ω g is the characteristic frequency related to the mean residential time of the adsorbed molecule on the surface, τ . In [46] it is reported that the average residence time can be from 10 13 to 10 9 for physical adsorption and from 10 6 to 10 9 for chemisorption due to a high influence of the temperature and the desorption energy. The characteristic frequency met in literature may be constant, such as in [47] where it is 2 π 10 13 , but as stated in [48], it is also dependent on the molecular mass and the desorption energy:
ω g = γ 2 E d m 0 , γ = 5 π 6 10 10 m 1 .
γ is the fitting parameter determined based on [40] where the expressions for the gas adsorption density and the coverage in equilibrium are developed. The gas adsorption density and the equilibrium coverage of monolayer adsorption are estimated using only the binding energy of gas molecules [40]. By combining them according to Equation (3), one obtains the surface density of the adsorption sites as a ratio of the surface density of adsorbed molecules in the equilibrium, i.e., The adsorption capacity, and the equilibrium coverage. The resulting expression is:
n s = ( 2.5 + 71.839 E d k B T e E d / k B T ) p h k B T 2 π m 0 k B T e 2 E d / k B T ,
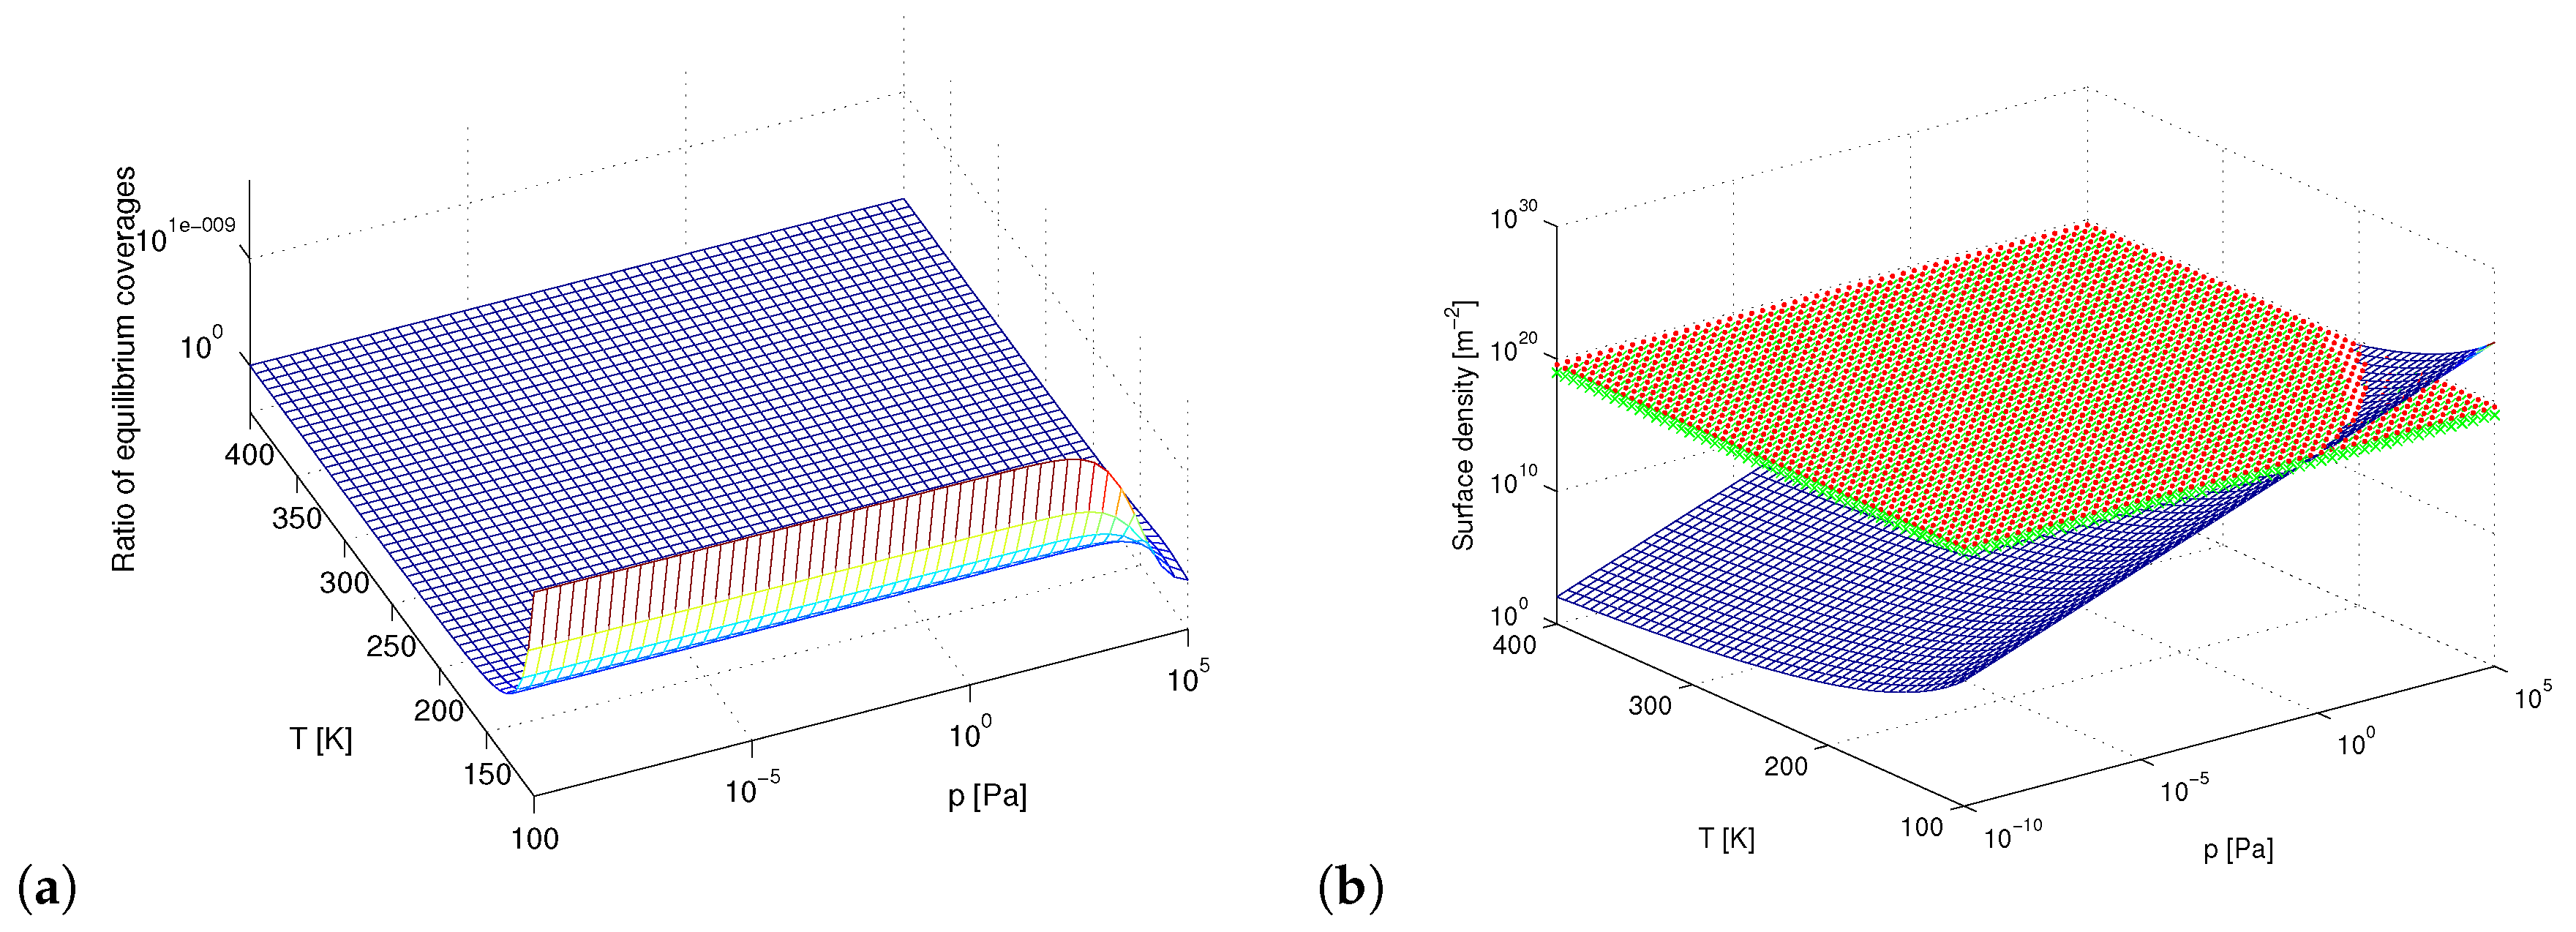
h is the Plank constant. Equation (3) means that even with saturated surfaces the amounts of gas adsorbed are always lower than the amounts needed to form a completely populated monatomic/monomolecular layer. The adsorption capacity, n e q , cannot be greater than the surface density of the adsorption sites, n s . The number of the adsorbed molecules in the equilibrium in Equation (3) is obtained by solving the approximate model, Equation (2) modified so that the depletion of the number of molecules in the gas phase, N 0 , due to adsorption, is neglected. Figure 3a shows the ratio of the approximate expression from Equation (3) and the more accurate expression obtained by solving unmodified Equation (2). The use of the expression from Equation (3) is valid for a vast range of applications. Figure 3b shows the surface densities calculated based on the crystallographic surface of graphene, using the molecular size and orientation and utilizing the expression from [40] based on the desorption energy. Although the desorption energy seems to be more informative because it depends on both the surface and the adsorbate molecule, because it characterizes their interaction, the model has its limitations and does not always give the better result. At low temperatures and high pressures, the assumptions used to derive Equation (6) are not valid. The model is valid for low coverage.
The method based on the minimum of the surface densities calculated using the molecular size and using the size of the crystal unit cell, applied for the estimation of the surface density of adsorption centers on a homogeneous surfaces gave good results for the surface densities as high as 10 18 molecules per squared meter, as shown in Table 1.
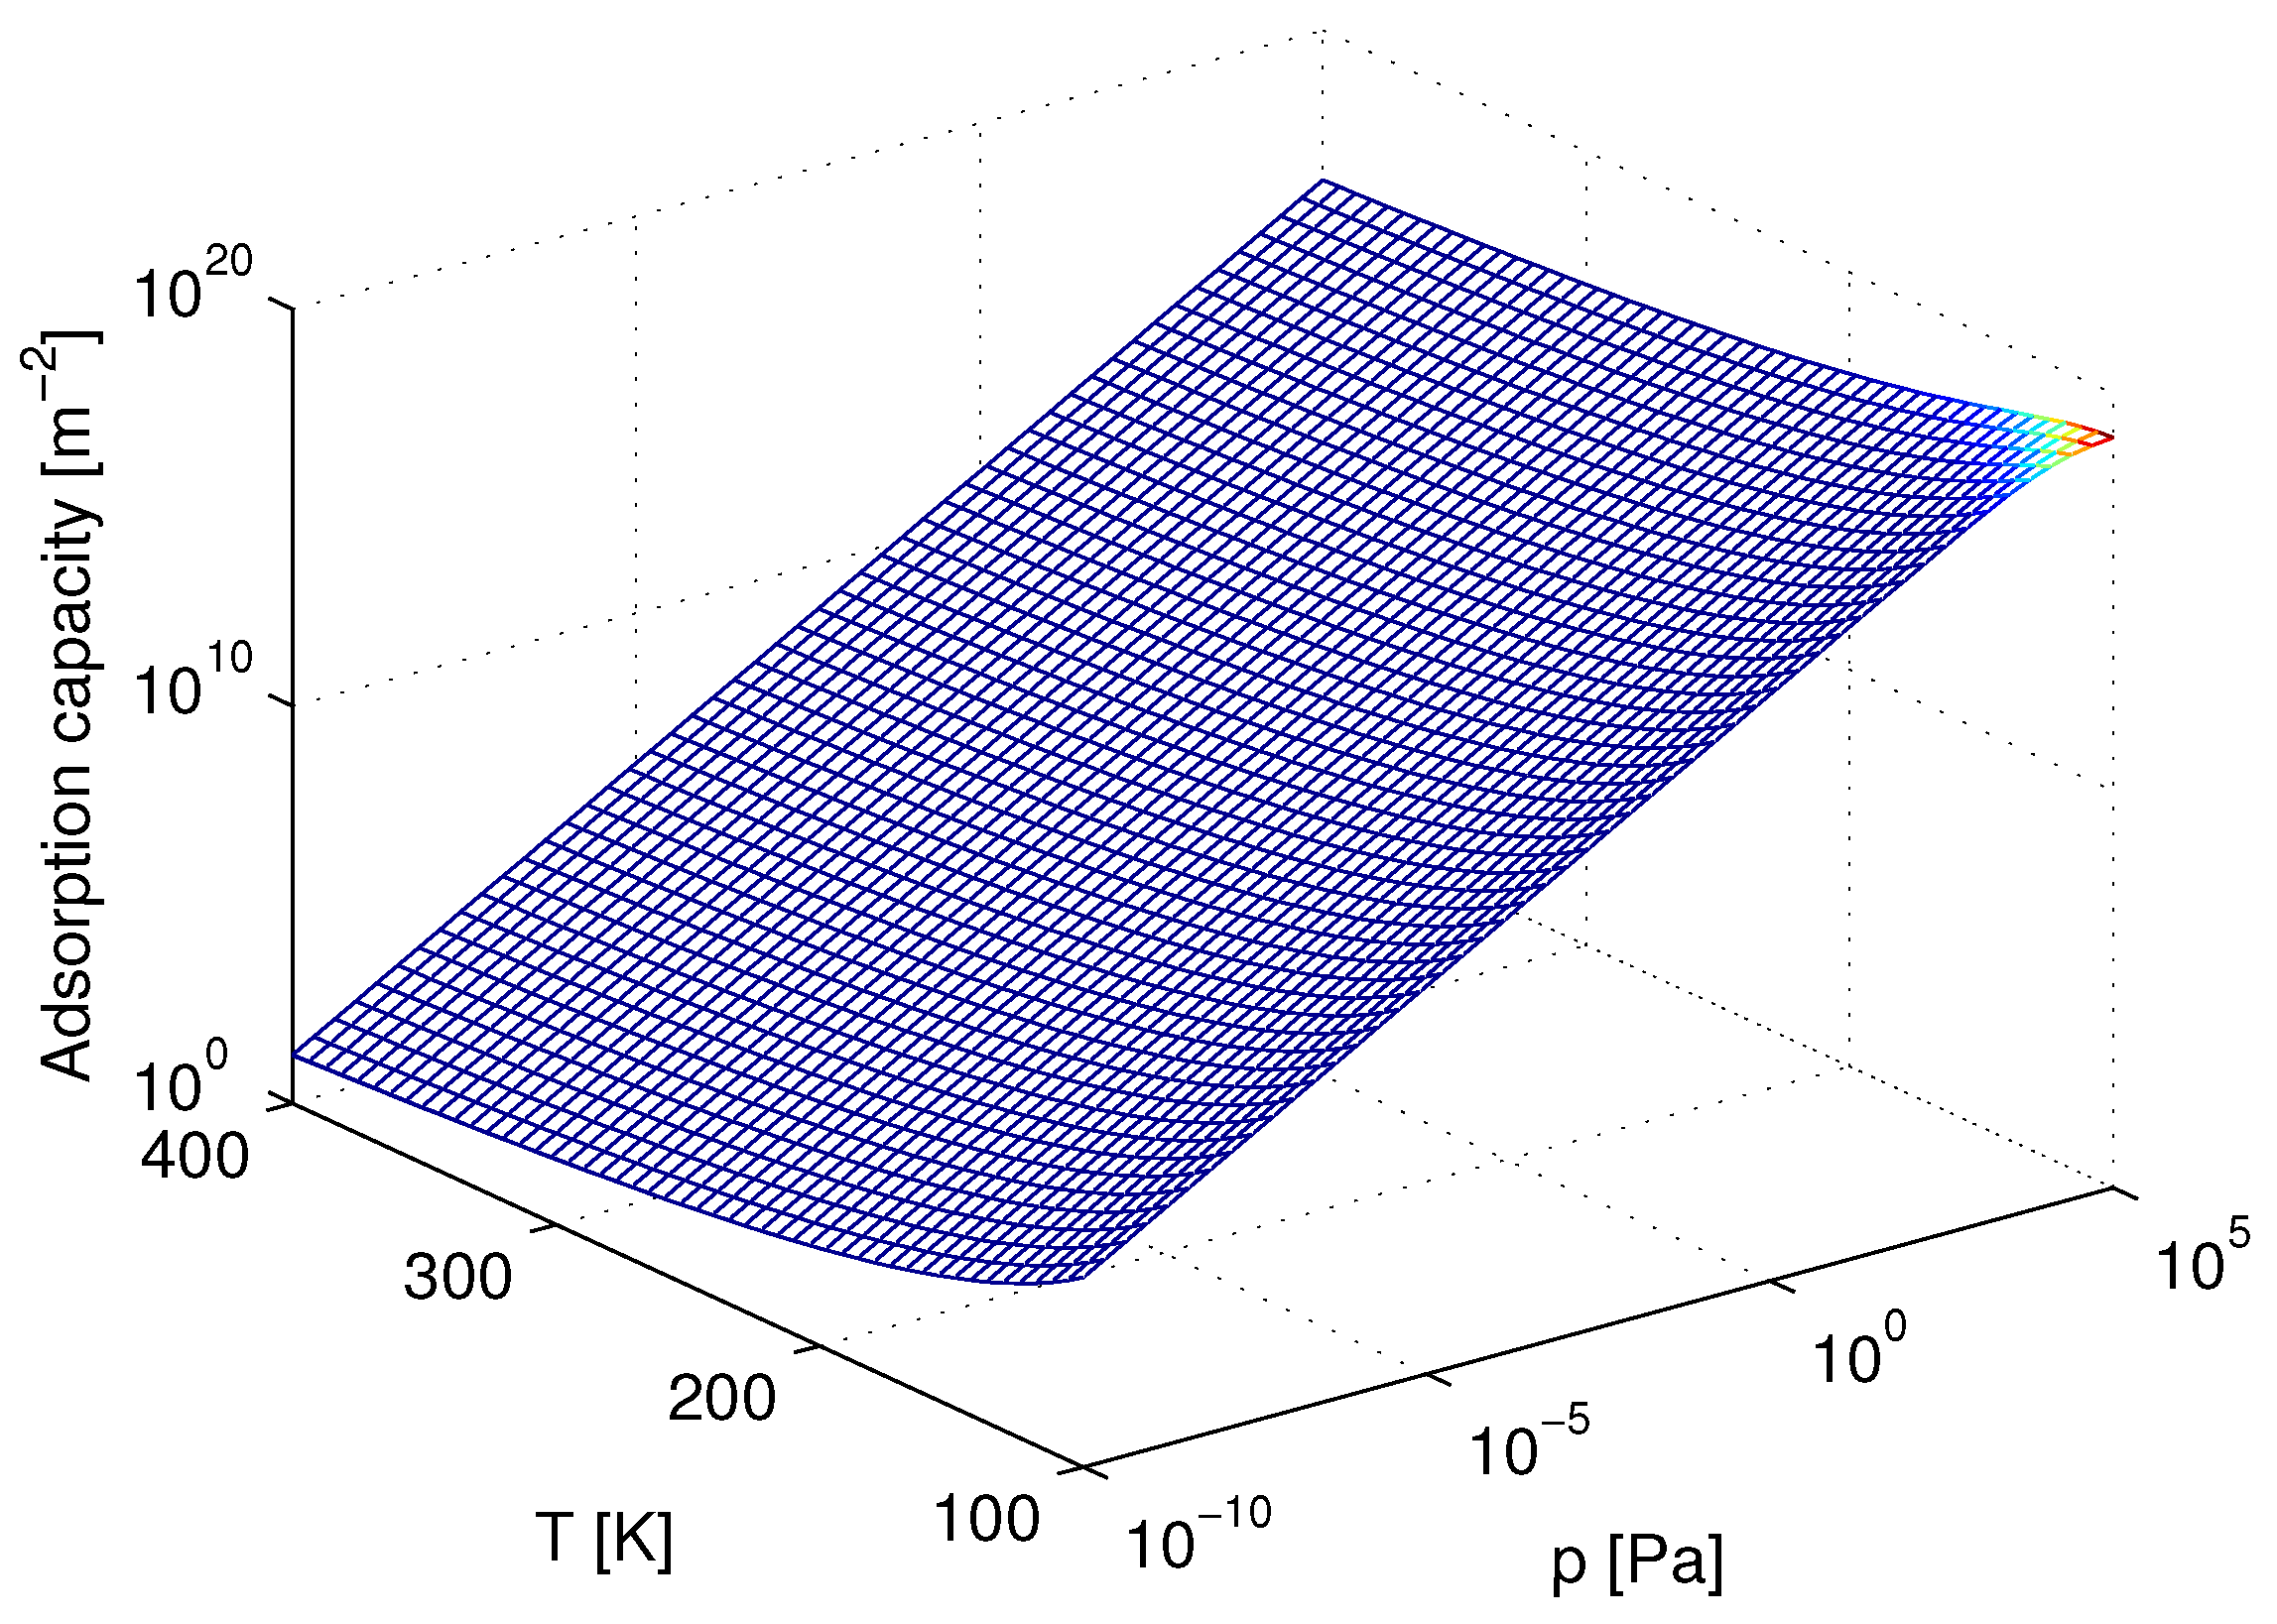
Figure 4 shows the adsorption capacity for carbon monoxide adsorption on graphene.
The result in Figure 4 is obtained by first calculating the potential numbers of adsorption centers using Equation (6). For every pair of (p,T), the number of adsorption centers is specified to be the minimum of the number estimated by Equation (6), the number estimated with the respect to the molecular structure and the number estimated with the respect to the atoms, bridges and holes (T,B,H sites) in the unit cell of the crystallographic surface. The rate constants are calculated using Equations (4) and (5), the number of adsorbed molecules in equilibrium is calculated by solving the unmodified rate Equation (2). Finally, the surface coverage and the surface density of the adsorbed molecules in equilibrium, i.e., The adsorption capacity are calculated using Equation (3). For the data given in [40], referring to C O adsorption on graphene at room temperature and with a 1 ppm gas concentration, (meaning that its partial pressure is 90 Pa), this method gives an equilibrium coverage of 0.345 and the surface density of adsorbed molecules in equilibrium of 4.5 · 10 13 molecules per square meter, which is higher than 0.13 · 10 13 (value estimated in [40]).
Although our work presents a practical method of calculating surface density of adsorption sites on graphene, it does have some limitations which should be accounted for in future research. For example, the power law decay of the substrate-adsorbate may influence the adsorption rate given its close relation to interaction range. In low dimensional materials such as graphene, this power law exponent was recently shown to deviate from conventional pairwise estimates due to many body effects [50,51]. Also, graphene itself or the interplay between graphene and weakly bound layers can produce screening effects both at the electrostatic and electrodynamic (van der Waals) levels [52,53]. In addition, gas adsorption on graphene may cause Fermi level variation or orbital distortion, with measurable effects on graphene conductivity. This implies a a variation of the graphene response, which may be translated into a slightly modified graphene-adsorbate interaction [54].
The aim of this paper was to complement the modeling of the surface density of adsorption sites on the graphene layer with the equation that would take into account the fact that it is impossible to achieve the surface density of the adsorbed molecules greater than the surface density of the centers formed of the top layer atoms of graphene. The exact determination of the applicability range of the models used in this paper is a matter of the future research.

Author Contributions

The manuscript was written with contributions by all authors: conceptualization, O.J. and M.S.; methodology, O.J. and M.S.; software, O.J.; validation, O.J., M.S., Z.J. and D.V.-R.; formal analysis, O.J., M.S., Z.J. and D.V.-R.; investigation, O.J., M.S., Z.J. and D.V.-R.; resources, O.J., M.S. and Z.J.; data curation, O.J.; writing—original draft preparation, O.J., M.S., and Z.J.; writing—review and editing, O.J., M.S., Z.J. and D.V.-R.; visualization, O.J., and Z.J.; supervision, D.V.-R.; project administration, D.V.-R.; funding acquisition, D.V.-R. All authors have read and agreed to the published version of the manuscript.

Funding

The work of O.J., D.V.-R. and M.S. was financially supported by the Ministry of Education, Science and Technological Development of the Republic of Serbia, Grant No. 451-03-68/2020-14/200026.

Acknowledgments

Authors thank Predrag Krstajić for suggestions and comments.

Conflicts of Interest

The authors declare no conflict of interest.

References

  1. Abdulhalim, I.; Zourob, M.; Lakhtakia, A. Surface plasmon resonance for biosensing: A mini-review. Electromagnetics 2008, 28, 214–242. [Google Scholar] [CrossRef]
  2. Tian, W.; Liu, X.; Yu, W. Research progress of gas sensor based on graphene and its derivatives: A review. Appl. Sci. 2018, 8, 1118. [Google Scholar] [CrossRef] [Green Version]
  3. Schedin, F.; Geim, A.K.; Morozov, S.V.; Hill, E.W.; Blake, P.; Katsnelson, M.I.; Novoselov, K.S. Detection of individual gas molecules adsorbed on graphene. Nat. Mater. 2007, 6, 652–655. [Google Scholar] [CrossRef]
  4. Djurić, Z.; Jokić, I.; Djukić, M.; Frantlović, M. Fluctuations of the adsorbed mass and the resonant frequency of vibrating MEMS/NEMS structures due to multilayer adsorption. Microelecron. Eng. 2010, 87, 1181–1184. [Google Scholar] [CrossRef]
  5. Lagergren, S.Y. Zur Theorie Der Sogenannten Adsorption Gelöster Stoffe. Zeitschr f Chem und Ind der Kolloide 1907, 2, 15. [Google Scholar] [CrossRef]
  6. Jakšić, O.; Jokić, I.; Jakšić, Z.; Mladenović, I.; Radulović, K.; Frantlović, M. The time response of plasmonic sensors due to binary adsorption: Analytical versus numerical modeling. Appl. Phys. A 2020, 126, 1–13. [Google Scholar] [CrossRef]
  7. Weinan, E. Principles of Multiscale Modeling; Cambridge University Press: London, UK, 2011; ISBN 9781107096547. [Google Scholar]
  8. González-Hernández, J.L.; Canedo, M.M.; Encinar, S. Application of a Robust Hybrid Algorithm (Neural Networks-AGDC) for the Determination of Kinetic Parameters and Discrimination among Reaction Mechanisms. MATCH Commun. Math. Comput. Chem. 2018, 79, 619–644. [Google Scholar]
  9. Kumar, G.P.; Malla, K.A.; Yerra, B.; Rao, K.S. Removal of Cu(II) using three low-cost adsorbents and prediction of adsorption using artificial neural networks. Appl. Water Sci. 2019, 9, 44. [Google Scholar] [CrossRef] [Green Version]
  10. Ullah, S.; Assiri, M.A.; Al-Sehemi, A.G.; Bustam, M.A.; Sagir, M.; Abdulkareem, F.A.; Raza, M.R.; Ayoub, M.; Irfan, A. Characteristically Insights, Artificial Neural Network (ANN), Equilibrium, and Kinetic Studies of Pb(II) Ion Adsorption on Rice Husks Treated with Nitric Acid. Intern. J. Environ. Res. 2020, 14, 43–60. [Google Scholar] [CrossRef]
  11. Anderson, R.; Rodgers, J.; Argueta, E.; Biong, A.; Gomez-Gualdron, D.A. Role of pore chemistry and topology in the CO2 capture capabilities of MOFs: From molecular simulation to machine learning. Chem. Mater. 2018, 30, 6325–6337. [Google Scholar] [CrossRef]
  12. Do, D.D.; Do, H.D.; Nicholson, D. Effects of surface structure and temperature on the surface mediation, layer concentration and molecular projection area: Adsorption of argon and nitrogen onto graphitized thermal carbon black. Adsorpt. Sci. Technol. 2007, 25, 347–363. [Google Scholar] [CrossRef] [Green Version]
  13. Jakšić, O.M.; Randjelović, D.V.; Jakšić, Z.S.; Čupić, Ž.D.; Kolar-Anić, L.Z. Plasmonic sensors in multi-analyte environment: Rate constants and transient analysis. Chem. Eng. Res. Des. 2014, 92, 91–101. [Google Scholar] [CrossRef] [Green Version]
  14. Conti, S.; Cecchini, M. Accurate and efficient calculation of the desorption energy of small molecules from graphene. J. Phys. Chem. C 2015, 119, 1867–1879. [Google Scholar] [CrossRef]
  15. Leenaerts, O.; Partoens, B.; Peeters, F.M. Adsorption of H2O, NH3, CO, NO2, and NO on graphene: A first-principles study. Phys. Rev. B 2008, 77, 125416. [Google Scholar] [CrossRef] [Green Version]
  16. Casolo, S.; Løvvik, O.M.; Martinazzo, R.; Tantardini, G.F. Understanding adsorption of hydrogen atoms on graphene. J. Chem. Phys. 2009, 130, 054704. [Google Scholar] [CrossRef]
  17. Lee, G.; Lee, B.; Kim, J.; Cho, K. Ozone adsorption on graphene: Ab initio study and experimental validation. J. Phys. Chem. C. 2009, 113, 14225–14229. [Google Scholar] [CrossRef] [Green Version]
  18. Wang, W.; Zhang, Y.; Shen, C.; Chai, Y. Adsorption of CO molecules on doped graphene: A first-principles study. AIP Adv. 2016, 6, 025317. [Google Scholar] [CrossRef]
  19. Lin, X.; Ni, J.; Fang, C. Adsorption capacity of H2O, NH3, CO, and NO2 on the pristine graphene. J. Appl. Phys. 2013, 113, 034306. [Google Scholar] [CrossRef]
  20. Kong, L.; Enders, A.; Rahman, T.S.; Dowben, P.A. Molecular adsorption on graphene. J. Phys. Cond. Matt. 2014, 26, 443001. [Google Scholar] [CrossRef]
  21. Jakšić, O. Parameters for modeling and analysis of adsorption kinetics and dynamics in adsorption based refractometric gas sensors. Mendeley Data 2020. [Google Scholar] [CrossRef]
  22. Jakšić, O. Parameters for adsorption of (CWA) chemical warfare agents and CWA simulants. Harvard Dataverse 2018. [Google Scholar] [CrossRef]
  23. Ulissi, Z.W.; Tang, M.T.; Xiao, J.; Liu, X.; Torelli, D.A.; Karamad, M.; Cummins, K.; Hahn, C.; Lewis, N.S.; Jaramillo, T.F.; et al. Machine-learning methods enable exhaustive searches for active bimetallic facets and reveal active site motifs for CO2 reduction. ACS Catal. 2017, 7, 6600–6608. [Google Scholar] [CrossRef] [Green Version]
  24. Novoselov, K.S.; Geim, A.K. The rise of graphene. Nat. Mater. 2007, 6, 183–191. [Google Scholar] [CrossRef]
  25. Geim, A.K. Graphene: Status and prospects. Science 2009, 32, 1530–1534. [Google Scholar] [CrossRef] [Green Version]
  26. Neto, C.; Guinea, F.; Peres, N.; Novoselov, K.S.; Geim, A.K. The electronic properties of graphene. Rev. Mod. Phys. 2009, 81, 109–162. [Google Scholar] [CrossRef] [Green Version]
  27. Novoselov, K.S.; Geim, A.K.; Morozov, S.V.; Jiang, D.; Katsnelson, M.I.; Grigorieva, I.V.; Dubonos, S.V.; Firsov, A.A. Two-dimensional gas of massless Dirac fermions in graphene. Nature 2005, 438, 197–200. [Google Scholar] [CrossRef]
  28. Mohan, V.B.; Lau, K.; Hui, D.; Bhattacharyya, D. Graphene-based materials and their composites: A review on production, applications and product limitations. Compos. Part B Eng. 2018, 142, 200–220. [Google Scholar] [CrossRef]
  29. Nag, A.; Arkadeep, M.; Mukhopadhyay, S.C. Graphene and its sensor-based applications: A review. Sens. Actuators A Phys. 2018, 270, 177–194. [Google Scholar] [CrossRef]
  30. Wu, Y.; Jianhua, Z.; Huang, L. A review of three-dimensional graphene-based materials: Synthesis and applications to energy conversion/storage and environment. Carbon 2019, 143, 610–640. [Google Scholar] [CrossRef]
  31. Rosli, N.N.; Ibrahim, M.A.; Ludin, N.A.; Mat-Teridi, M.A.; Sopian, K. A review of graphene based transparent conducting films for use in solar photovoltaic applications. Renew. Sustain. Energy Rev. 2019, 99, 83–99. [Google Scholar] [CrossRef]
  32. Lawal, A.T. Graphene-based nano composites and their applications: A review. Biosens. Bioelectr. 2019, 141, 111384. [Google Scholar] [CrossRef] [PubMed]
  33. Spasenović, M. Applications of Graphene. In Surface and Interface Science: Volume 10: Applications of Surface Science II; Wandelt, K., Ed.; Wiley-VCH: Weinheim, Germany, 2020. [Google Scholar] [CrossRef]
  34. Balog, R.; Jørgensen, B.; Nilsson, L.; Andersen, M.; Rienks, E.; Bianchi, M.; Fanetti, M.; Lægsgaard, E.; Baraldi, A.; Lizzit, S.; et al. Bandgap opening in graphene induced by patterned hydrogen adsorption. Nat. Mater. 2010, 9, 315–319. [Google Scholar] [CrossRef]
  35. Grimme, S.; Jens, A.; Ehrlich, S.; Krieg, H. A consistent and accurate ab initio parametrization of density functional dispersion correction (DFT-D) for the 94 elements H-Pu. J. Chem. Phys. 2010, 132, 154104. [Google Scholar] [CrossRef] [Green Version]
  36. Chan, K.T.; Neaton, J.B.; Cohen, M.L. First-principles study of metal adatom adsorption on graphene. Phys. Rev. B 2008, 77, 235430. [Google Scholar] [CrossRef] [Green Version]
  37. Leenaerts, O.; Partoens, B.; Peeters, F.M. Water on graphene: Hydrophobicity and dipole moment using density functional theory. Phys. Rev. B 2009, 79, 235440. [Google Scholar] [CrossRef] [Green Version]
  38. Ambrosetti, A.; Silvestrelli, P.L. Adsorption of rare-gas atoms and water on graphite and graphene by van der Waals-corrected density functional theory. J. Phys. Chem. C 2011, 115, 3695–3702. [Google Scholar] [CrossRef]
  39. Toth, J. Adsorption: Theory, Modeling, and Analysis; Surfactant Sciences Series; Marcel Dekker Inc: New York, NY, USA, 2002; Volume 107. [Google Scholar] [CrossRef]
  40. Pu, H.H.; Rhim, S.H.; Gajdardziksa-Josifovska, M.; Hirschmugl, C.J.; Weinert, M.; Chen, J.H. A statistical thermodynamics model for monolayer gas adsorption on graphene-based materials: Implications for gas sensing applications. RSC Adv. 2014, 4, 47481–47487. [Google Scholar] [CrossRef] [Green Version]
  41. Jakšić, O. ADmoND: MathWorks Matlab Package for simulation of monolayer adsorption processes in nano devices. Mendeley Data 2019. [Google Scholar] [CrossRef]
  42. Nakada, K.; Akira, I. DFT calculation for adatom adsorption on graphene. In Graphene Simulation; Gong, J.R., Ed.; IntechOpen: Rijeka, Croatia, 2011; pp. 1–20. [Google Scholar] [CrossRef] [Green Version]
  43. Jette, E.R.; Foote, F. Precision determination of lattice constants. J. Chem. Phys. 1935, 3, 605–616. [Google Scholar] [CrossRef]
  44. Jakšić, O.; Jakšić, Z.; Čupić, Ž.; Randjelović, D.; Kolar-Anić, L. Fluctuations in transient response of adsorption-based plasmonic sensors. Sens. Actuators B 2014, 190, 419–428. [Google Scholar] [CrossRef]
  45. Jakšić, O.; Jakšić, Z.; Rašljić, M.; Kolar-Anić, L. On Oscillations and Noise in Multicomponent Adsorption: The Nature of Multiple Stationary States. Adv. Math. Phys. 2019, 2019. [Google Scholar] [CrossRef]
  46. Do, D.D. Adsorption Analysis: Equilibria and Kinetics; Imperial College Press: London, UK, 1998; p. 15. [Google Scholar] [CrossRef]
  47. Yong, Y.K.; Vig, J.R. Resonator Surface Contamination—A Cause of Frequency fluctuations? IEEE Trans. Ultrason. Ferroelectr. Freq. Control. 1989, 36, 452–458. [Google Scholar] [CrossRef] [PubMed]
  48. Barakat, T.; Abodayeh, K.; Al-Dossary, O.M. Exact solutions for vibrational levels of the Morse potential via the asymptotic iteration method. Czech J. Phys. 2006, 56, 583–590. [Google Scholar] [CrossRef] [Green Version]
  49. Langmuir, I. The adsorption of gases on plane surfaces of glass, mica and platinum. J. Am. Chem. Soc. 1918, 40, 1361–1403. [Google Scholar] [CrossRef] [Green Version]
  50. Ambrosetti, A.; Ferri, N.; DiStasio, R.A.; Tkatchenko, A. Wavelike charge density fluctuations and van der Waals interactions at the nanoscale. Science 2016, 351, 1171–1176. [Google Scholar] [CrossRef] [PubMed] [Green Version]
  51. Ambrosetti, A.; Silvestrelli, P.L.; Tkatchenko, A. Physical adsorption at the nanoscale: Towards controllable scaling of the substrate-adsorbate van der Waals interaction. Phys. Rev. B. 2017, 95, 235417. [Google Scholar] [CrossRef] [Green Version]
  52. Ambrosetti, A.; Silvestrelli, P.L. Hidden by graphene—Towards effective screening of interface van der Waals interactions via monolayer coating. Carbon 2018, 139, 486–491. [Google Scholar] [CrossRef] [Green Version]
  53. Ambrosetti, A.; Silvestrelli, P.L. Faraday-like screening by two-dimensional nanomaterials: A scale-dependent tunable effect. J. Phys. Chem. Lett. 2019, 10, 2044–2050. [Google Scholar] [CrossRef]
  54. Ambrosetti, A.; Silvestrelli, P.L. Trends in the change in graphene conductivity upon gas adsorption: The relevance of orbital distortion. J. Phys. Chem. Lett. 2020, 11, 2737–2741. [Google Scholar] [CrossRef]
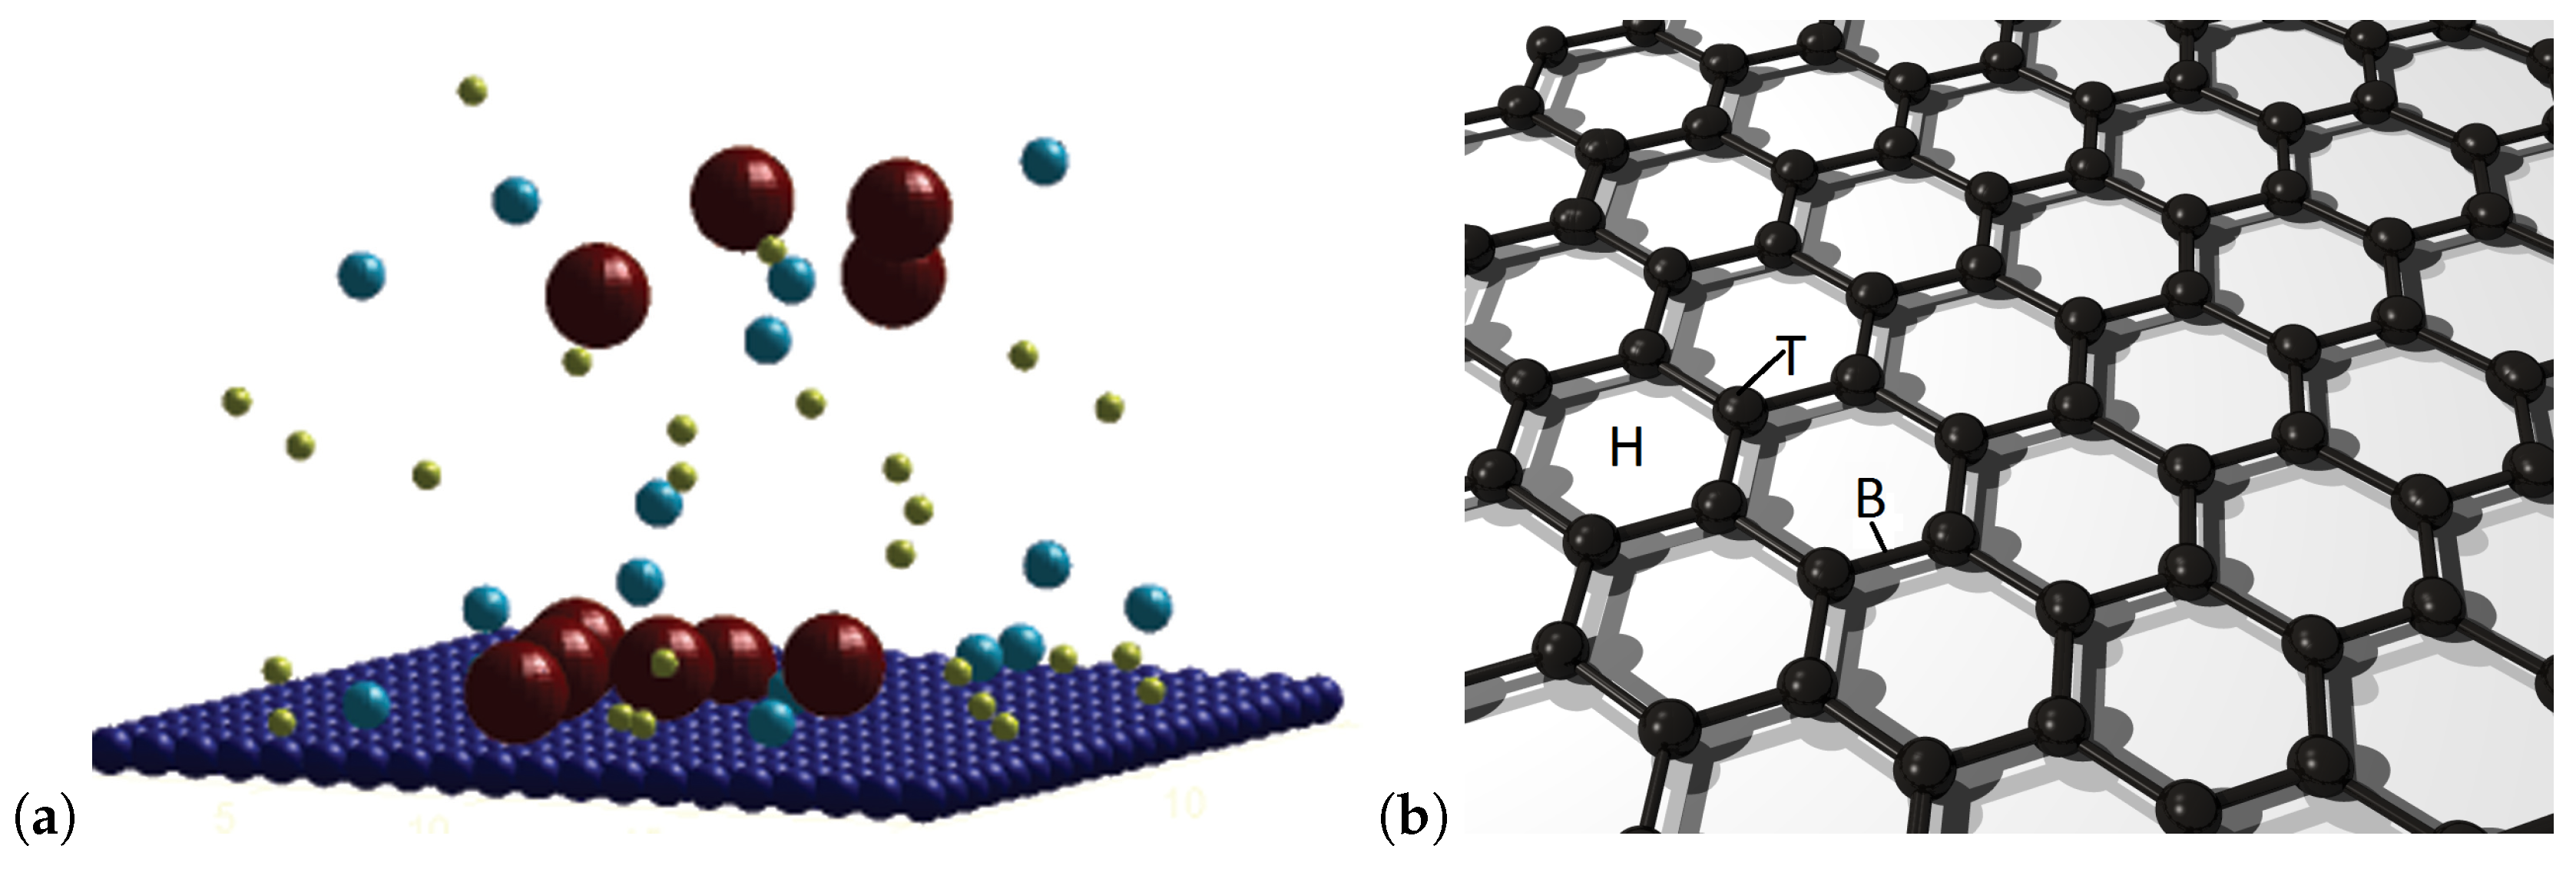
Figure 1. (a) ADmoND-generated picture of a crystal surface surrounded by a mixture of three monatomic gases moving freely, adsorbing and desorbing in a stochastic manner. (b) Graphene structure.
Surfaces 03 00031 g001
Figure 2. Possible spacial orientations of (a) carbon monoxide, (b) chlorine and (c) hexane whose range of molecular projection areas are (8.13–11.01), (9.62–16.70) and (21.59–40.59) angström, respectively.
Surfaces 03 00031 g002
Figure 3. (a) The ratio of the adsorption capacities for the monolayer adsorption of carbon monoxide on graphene, calculated with and without neglecting the depletion of the number of the molecules in the gas phase. (b) Surface densities are calculated in three ways: based on the crystallographic surface of graphene (the plane with red dots), based on the molecular size and orientation (the plane with green plus symbols) and by using the expression from [40] based on the desorption energy (mesh).
Surfaces 03 00031 g003
Figure 4. Adsorption capacity for carbon monoxide adsorption on graphene.
Surfaces 03 00031 g004
Table 1. The maximum number of binding sites in 10 18 molecules/m 2 .
GasCH 4 CON 2 A r O 2 CO 2
[49], p.13906.36.66.67.77.76.1
our data6.527.157.57.087.346.52