Article

Effect of Ni Doping on the MoS2 Structure and Its Hydrogen Evolution Activity in Acid and Alkaline Electrolytes

1
Dipartimento di Scienze Chimiche, Università di Padova, Via Marzolo 1, 35131 Padova, Italy
2
Institute of Physical Chemistry, Justus-Liebig University Giessen, 35392 Giessen, Germany
3
Istituto Italiano di Tecnologia, via Morego 30, I-16163 Genova, Italy
4
Industrial Engineering Department and INSTM, University of Padova, 35131 Padova, Italy
*
Authors to whom correspondence should be addressed.
Surfaces 2019, 2(4), 531-545; https://doi.org/10.3390/surfaces2040039
Submission received: 28 October 2019 / Revised: 26 November 2019 / Accepted: 29 November 2019 / Published: 3 December 2019
(This article belongs to the Special Issue Surface Science and Catalysis of Graphene-Related 2D Materials)

Abstract

:
We have investigated three-dimensional (3D) MoS2 nanoarchitectures doped with different amount of Ni to boost the hydrogen evolution reaction (HER) in alkaline environment, where this reaction is normally hindered. As a comparison, the activity in acidic media was also investigated to determine and compare the role of the Ni sites in both media. The doping of MoS2, especially at high loadings, can modify its structural and/or electronic properties, which can also affect the HER activity. The structural and electronic properties of the Ni doped 3D-MoS2 nanoarchitecture were studied by X-ray diffraction (XRD), Raman spectroscopy, scanning and transmission electronic microscopy (SEM; TEM), and X-ray photoemission Spectroscopy (XPS). XPS also allowed us to determine the Ni-based species formed as a function of the dopant loading. The HER activity of the materials was investigated by linear sweep voltammetry (LSV) in 0.5 M H2SO4 and 1.0 M KOH. By combining the physicochemical and electrochemical results, we concluded that the Ni sites have a different role in the HER mechanism and kinetics in acidic and in alkaline media. Thus, NiSx species are essential to promote HER in alkaline medium, whereas the Ni-Mo-S ones enhance the HER in acid medium.

1. Introduction

Nowadays, molecular hydrogen is considered the most promising energy vector for developing a sustainable energy infrastructure based on the efficient interconversion of chemical energy into electricity and vice versa, also known as hydrogen economy [1]. Therefore, the development of new technologies for clean and cost-effective large-scale production of hydrogen is of utmost importance. Electrolyzers based on the water splitting (WS) are, so far, the most promising devices to obtain clean hydrogen through the hydrogen evolution reaction (HER) at the cathode side of an electrochemical cell [2]. This, however, requires the development and optimization of electrocatalysts, based on cost-effective noncritical raw materials (i.e., noble metal-free), that may guarantee efficiency and durability under operating conditions. As WS also entails the oxygen evolution reaction at the anode side, which requires the use of alkaline conditions when catalyzed by non-noble metal catalysts, many efforts are currently focusing on the identification of new electrocatalysts that can catalyze the HER in alkaline media.
The influence of the pH on the cathodic half-reaction can be easily portrayed starting from the two accredited mechanisms for HER (i.e., Volmer–Heyrovsky and Volmer–Tafel) that result from the combination of two of the following reactions steps [3,4,5].
Volmer step (Electrochemical Hydrogen Adsorption):
Acid :   H 3 O + + e H ads + H 2 O
Base :   H 2 O + e H ads + O H
Heyrovsky step (Electrochemical Desorption):
Acid : H ads +   H 3 O + + e H 2 + H 2 O
  Base :   H ads + H 2 O + e H 2 + O H
Tafel Step (Chemical Desorption):
2 H ads H 2
Therefore, the HER electrocatalyst performance is dramatically influenced by pH, as different species have to be adsorbed and reduced in steps where H3O+/OH are involved. For instance, Durst et al. demonstrated that, in the case of noble metals (Pt, Ir and Ru), the catalytic activity can decrease by two orders of magnitude at high pH [3]. This quite general phenomenon suggests that the energy needed to break the covalent H–OH bond, must be higher than that required by the dative +H–OH2 bond [4]. Moreover, hydroxyl anions could poison the metal sites, so hindering the catalytic activity by strongly adsorbing even on precious metal-based catalysts. Recently, a quite complex debate in the literature has started [4], where the traditional theoretical approach, to predict HER based on the hydrogen adsorption energy as the sole reaction descriptor [3,6], has been challenged to take into account the much more complex phenomenology of the alkaline environment [7].
As an alternative to the Platinum Group Metals (PGMs) based catalysts, which are nowadays in the list of the Critical Raw Materials (CRMs) [8,9], many types of earth-abundant transition metal-based catalysts are intensively investigated [10,11]: metals; alloys; carbides; nitrides [12]; borides [13,14]; and, above all, transition metals dichalcogenides (TMDCs) [15]. TMDCs are 2D-layered materials that have been extensively studied as HER electrocatalysts. Although many papers report on experiments in acidic media, only few studies deal with the electroactivity in alkaline conditions [4,15,16,17]. As demonstrated by Wiensch et al., MoS2 has a variety of possible sites for the HER at different pH [17]. Mo-terminated edge sites are active at low pH because of the thermoneutral adsorption of hydrogen on the Mo site. On the contrary, in a hydroxyl rich environment, the formation of Mo-H species is inhibited and the S-rich terraces become the preferential sites for the HER [18]. As proven by calculations, on the Mo-edge in alkaline conditions, the dissociation of water is the rate determining step, because the formation of strong Mo–OH bond slows down the OH desorption hindering the Volmer step [19,20].
However, TMDCs have some critical issues, such as a limited electrical conductivity and restacking phenomena. Several strategies are currently tested to improve the HER activity of MoS2: doping with transition metals [21,22,23,24,25], anion substitution [26,27,28], preparation of composites [29,30,31], or materials with special morphologies [32,33]. Tsai et al. screened the effect of 19 transition metals dopants on MoS2 by DFT calculations [34]. Moreover, several experimental tests proved that the substitution of Mo cations with other metal can boost the HER performance of MoS2 through electronic and/or structural effects [18,20,35].
In this paper, we combine the transition metal doping approach with the 3D material design. Actually, moving from simple 2D sheets [16,36,37,38,39,40,41] to 3D-structured systems [42,43,44,45,46,47,48] a higher number of exposed catalytic sites can be produced. We prepared 3D-structured MoS2 samples (hereafter 3D-MoS2) through a simple bottom-up strategy that allowed introducing the dopant by a simple one-pot procedure. We studied the effect of Ni doping on the 3D-MoS2 nanoarchitecture and we investigated the HER activity, in both acidic and alkaline media. Gathering all the data, we observed a strong influence of the doping on the MoS2 crystallization and structure, with strong effects on the final performances and reaction kinetics.

2. Materials and Methods

2.1. General

Ammonium molybdate (NH4)6Mo7O24 4H2O (>99.3%), aqueous (NH4)2S solution (20 wt %), sulfuric acid (95–97%), potassium hydroxide (85%), N,N-dimethylformamide (99%), and Nafion solution (5 wt % solids in alcohol and water) were purchased from Sigma-Aldrich (Milan, Italy) and used without any further purification. NiCl2 6H2O (99.95%) was purchased from Alfa Aesar (Kandel, Germany) and used as received. Pt/C (20 wt %. loading) was acquired from Johnson Matthey (London, United Kingdom).

2.2. Ammonium Tetrathiomolybdate (ATM) Synthesis

Details of the ATM preparation, the starting material for the synthesis of the 3D-MoS2, are reported in the Supplementary Information material (SI).

2.3. Synthesis of 3D-MoS2 and Ni-Doped 3D-MoS2

To study the effect of the ATM concentration on the 3D-MoS2 structure, samples with three different ATM concentrations were prepared. In particular, ATM (300 mg; 1.15 mmol) was dissolved in 60, 30, or 12 mL of water (milliQ 18.2 MΩ, degassed with N2 for 1 h), obtaining 5, 10, and 25 mg mL−1 concentration, respectively, and kept under stirring for 2 h. The solution was frozen by dipping the flask into liquid nitrogen and freeze-dried in vacuum. The powder was then treated at 450 °C for 4 h (10 °C min−1 ramp) in 95:5 Ar:H2 atmosphere (100 sccm total flow) in a tubular furnace. After cooling down to RT, the so-obtained gray powder was collected and stored under nitrogen to prevent surface oxidation. The samples (labeled as 3D-MoS2-X, with X = 5, 10 and 25 mg mL−1) were tested, the 3D-MoS2-10 sample was the most active toward the HER (see ESI). Therefore, this is the concentration used for the Ni doping study.
For the synthesis of the Ni-doped 3D-MoS2 samples, NiCl2·6H2O was added to the ATM solution, and the same one-pot synthesis was followed. The amount of precursor was designed to obtain a Ni doping of 2, 5, 10, or 15 at.% vs. Mo (5.5, 13.7, 27.4, and 41.1 mg of NiCl2·6H2O, respectively).

2.4. Physico-Chemical Characterization

Scanning electron microscopy (SEM) micrographs were acquired using a field-emission source equipped with a GEMINI column (Zeiss Supra VP35, Carl Zeiss S.p.A., Milan, Italy) with an acceleration voltage of 5 kV using secondary electron detection.
Annular dark-field scanning transmission electron microscopy (ADF-STEM) and Energy-dispersive X-ray spectroscopy (EDS) analyses were performed by using a JEOL JEM-1400Plus transmission electron microscope (Jeol Italia s.p.a., Milan, Italy) with LaB6 thermionic source operated at 120 kV. The EDS maps were acquired using a JEOL Dry SD30GV silicon-drift detector (SDD), with 30 mm2 effective area.
X-ray diffraction (XRD) characterization was performed with a Philips PW 1729 diffractometer (Koninklijke Philips N.V., Amsterdam, Netherlands), configured with a glancing angle geometry, operating with Cu Kα radiation (λ = 0.15406 nm) generated at 30 kV and 40 mA. The mean crystallite size was calculated from the MoS2 (002) peak using the Scherrer equation: Lc = k·λ/β·cosθ, where k is the shape factor (k = 0.9), λ is the X-ray wavelength, β is the line broadening at half the maximum intensity of the peak, and θ is the Bragg angle. The XRD spectra of 2H-MoS2 and 3R-MoS2 were calculated with Vesta software (3.4.4).
Raman spectra were obtained with a ThermoFisher DXR Raman microscope (Thermo Fisher Scientific, Milan, Italy). The spectra were recorded using a laser with an excitation wavelength of 532 nm (0.1 mW), focused on the sample with a 50× objective (Olympus Italia s.r.l., Milan, Italy).
X-ray photoemission spectroscopy (XPS) data were acquired by a custom-designed UHV system equipped with an EA 125 Omicron electron analyzer with five channeltrons (Scienta Omicron GmbH, Taunusstein, Germany), working at a base pressure of 10−10 mbar. Core level photoemission spectra were taken in normal emission using the Mg Kα emission line (hv = 1253.6 eV) of a non-monochromated dual-anode DAR400 X-ray source. High-resolution spectra were acquired using 0.5 s dwell time, 0.1 eV energy steps, and 20 eV pass energy. In the case of the Ni 2p3/2 region, the parameters were set to 0.25 s dwell time, 0.2 eV energy step, and 50 eV pass energy to obtain a better signal-to-noise ratio. In the same conditions, a set of measurements (not shown) of Mo 3d and S 2p core levels was acquired as well to calculate the surface composition. The multipeak analysis of the S 2p, Mo 3d and Ni 2p3/2 photoemission lines was performed by means of Gaussian−Lorentzian functions and subtracting a Shirley background using the KolXPD software (1.8.0, Kolibrik.net, s.r.o., Žďár nad Sázavou, Czech Republic) [49].

2.5. Electrochemical Characterization

The electrochemical studies were performed in a conventional three-electrode electrochemical cell, using an Ag/AgCl (3 M KCl) electrode (calibrated as +0.218 V vs. the reversible hydrogen electrode, RHE) and a Pt wire as reference and counter electrode, respectively. For the long duration chrono-potentiometric measurements, a glassy carbon (GC) rod was used as counterelectrode. The working electrode was prepared by depositing 2.5 µL of catalyst ink on a GC electrode (2.8 mm diameter), corresponding to an active material loading of 142 µg cm−2. The catalyst ink consisted of 2 mg of active material and 2 mg of Vulcan XC-72 carbon, grinded in a mortar, and subsequently suspended in 0.5 mL of N,N-dimethylformamide and 5 μL of Nafion solution. Carbon was added to the catalyst layer in order to increase its electrical conductivity and to obtain a homogeneous catalyst layer on the glassy carbon electrode. A Pt/C ink was prepared by dispersing 2 mg of commercial Pt/C (JM, Reading, United Kingdom, 20 wt %) and 5 μL of Nafion solution in 0.5 mL of water:ethanol mixture (1:1, v/v). 2.5 µL of Pt catalyst ink were deposited on a GC electrode (2.8 mm diameter). The measurements were carried out in N2-saturated 0.5M H2SO4 or 1.0M KOH at room temperature. Polarization curves were recorded from +0.2 V to −0.5 V vs. RHE using a scan rate of 0.005 V s−1. Currents presented in the text are normalized by the geometrical area and iR-corrected by using the resistance determined by electrochemical impedance spectroscopy (EIS) measurements. EIS was performed at η = 0.28 V (100 kHz to 0.1 Hz) and fitted using a R(RQ) as equivalent circuit.

3. Results

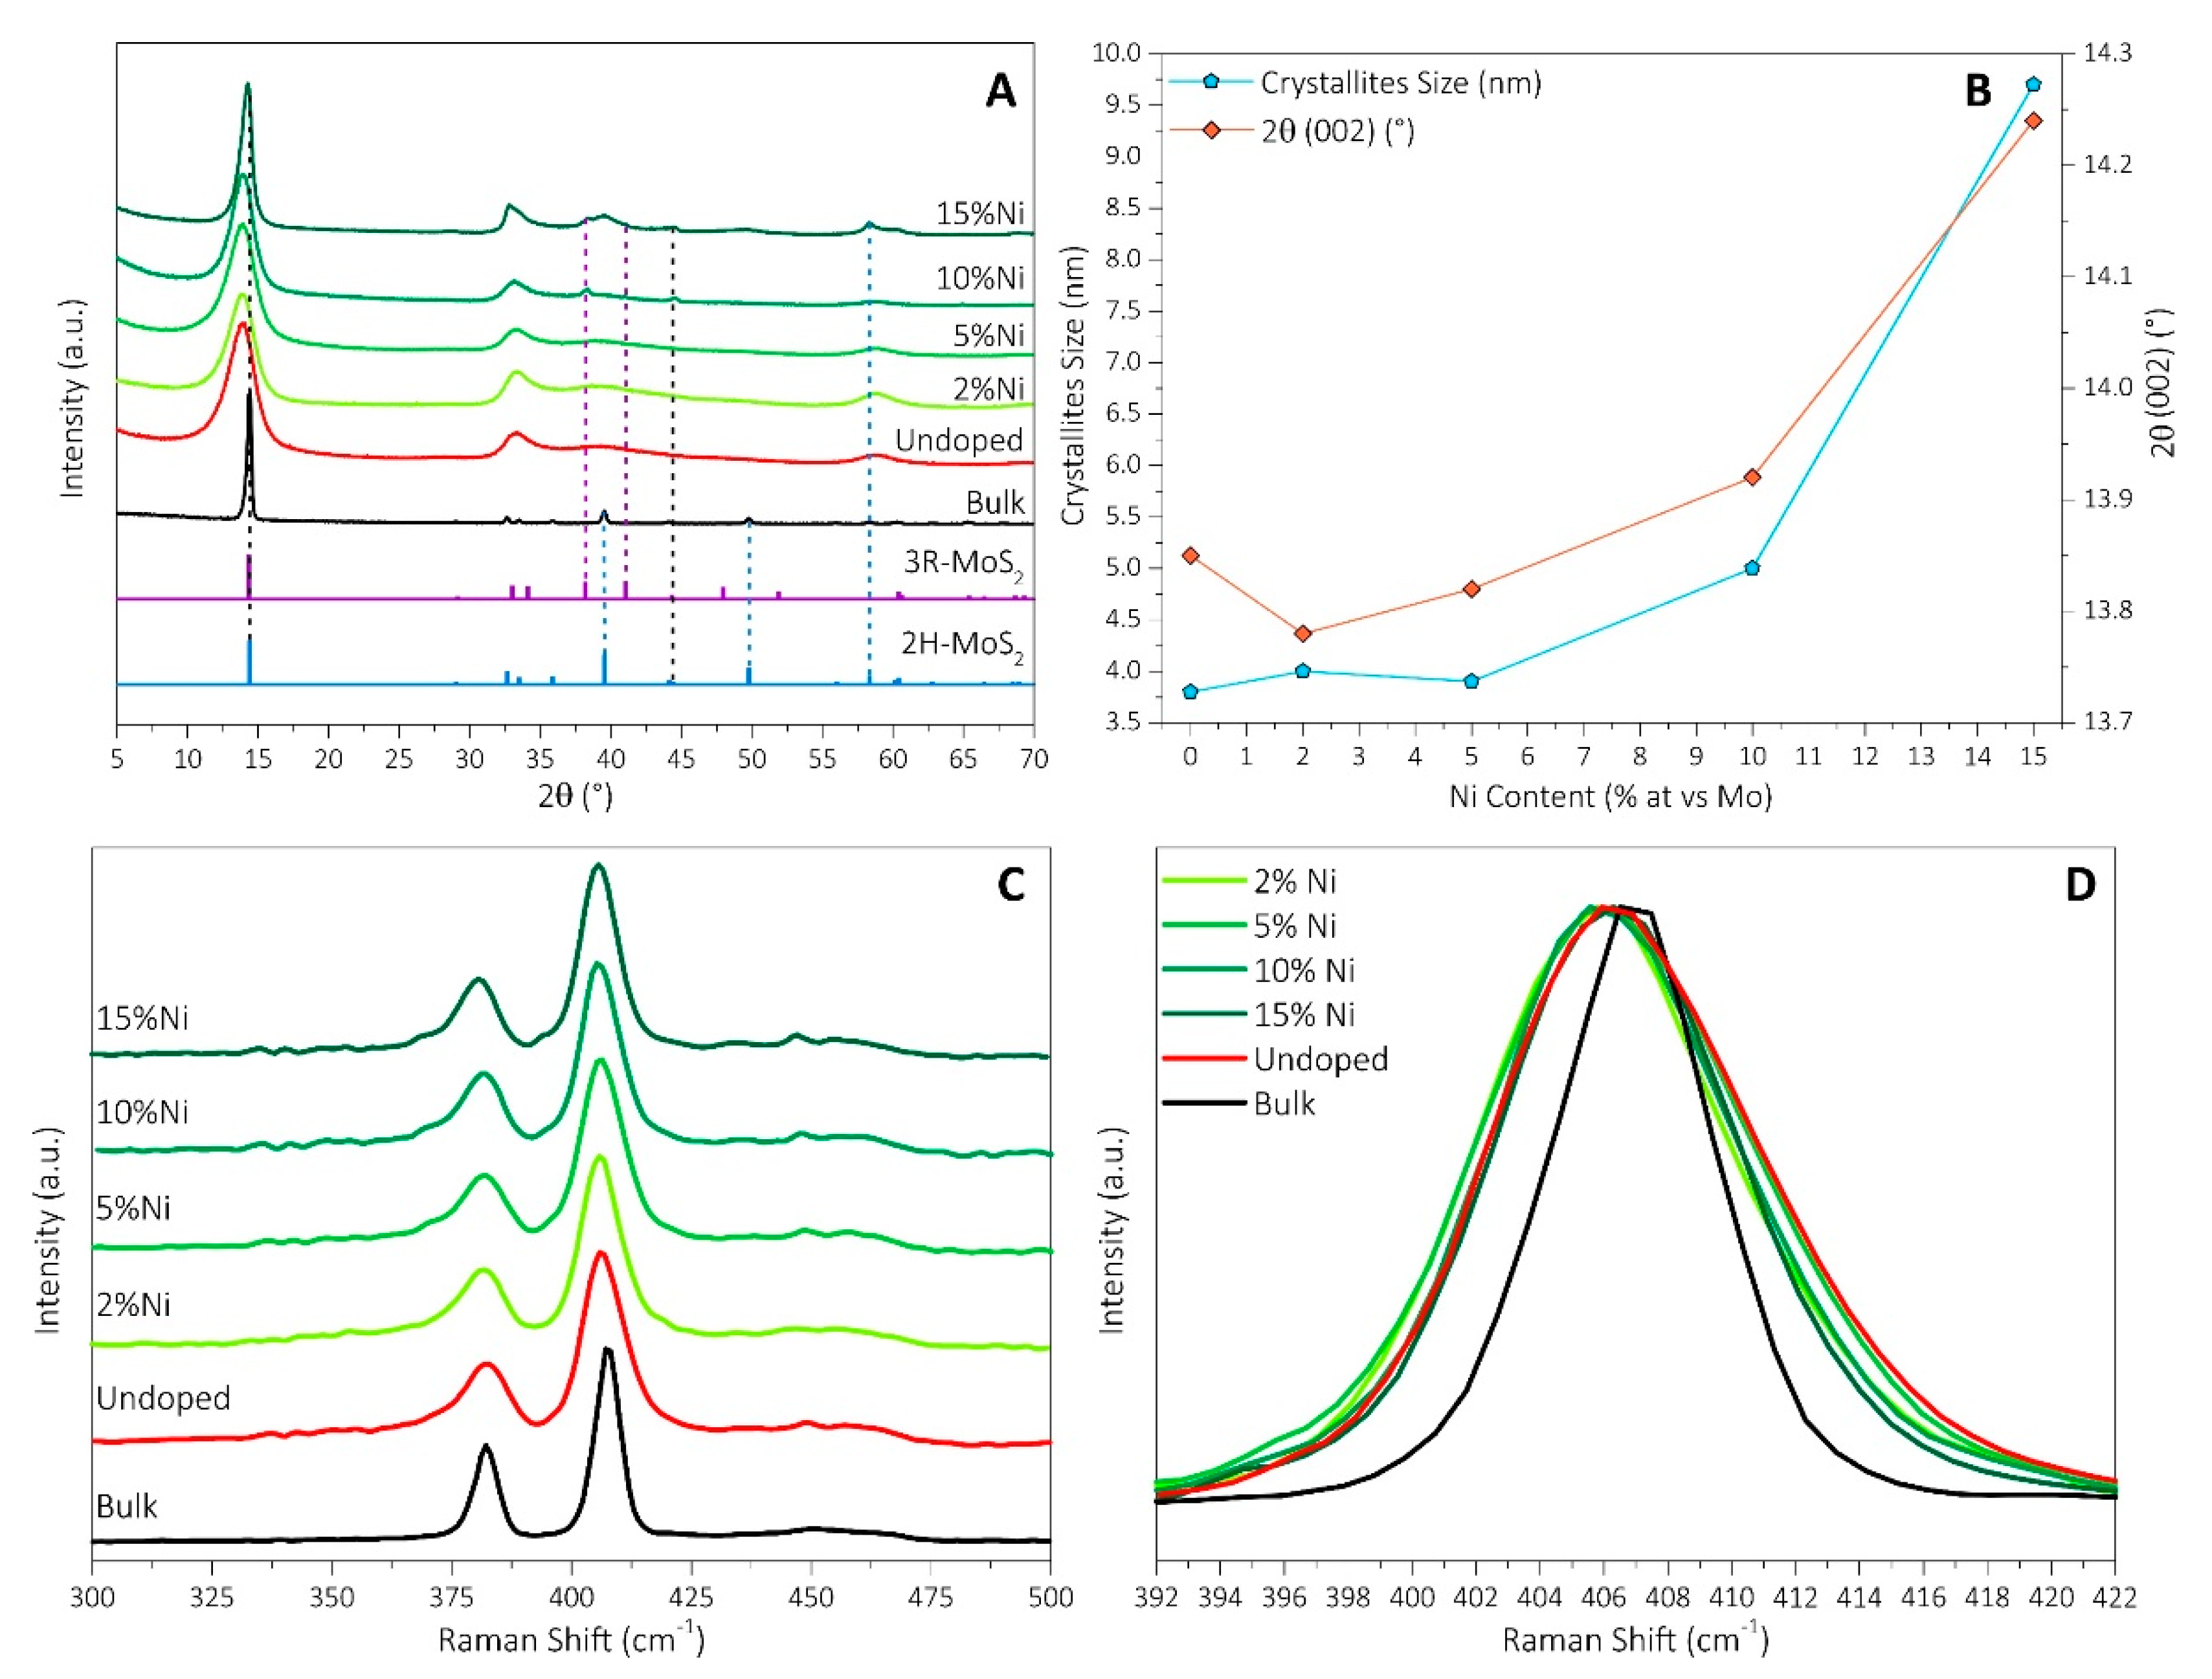
3.1. Synthesis and Physicochemical Characterization

First, we optimized the synthesis of 3D-MoS2 scaffold to maximize the HER performance of the pure material (see Figure S1 and discussion in Supplementary Materials). Then, we studied the effect of Ni loading (2%, 5%, 10%, and 15% at. Vs. Mo) on the optimized scaffold, starting from the structural changes induced by the doping insertion. In Figure 1A, we report a SEM image of the resulting scaffold where the typical lamellar structure of MoS2 is evident. The same lamellar structure is maintained after all the different Ni-doping, as reported in Supplementary Materials (Figure S2). This suggests that the metal doping does not affect the morphology, although a slightly denser structure is observed when higher Ni loadings are used (Figure S2). In all cases, as shown via ADF-STEM and EDS chemical mapping (Figure 1B–Q), we observe a homogeneous distribution of Ni on the 3D-MoS2, no matter the percentage of the Ni-doping.
Figure 2 reports the XRD patterns and the Raman spectroscopy measurements on the Ni-doped 3D-MoS2 samples. Figure 2A shows how the incorporation of Ni in the MoS2 lattice affects the XRD patterns (in comparison with a pure 3D-MoS2 sample). All the samples show four main peaks at 2θ values of 13.8°, 33.1°, 39.3°, and 58.9° attributed to the (002), (100), (103), and (110) reflections of the hexagonal structure of 2H-MoS2 [50].
A shift of the (002) peak to smaller 2θ values was observed for the undoped 3D-MoS2 sample compared to bulk MoS2, indicating an expansion along the c axis in 3D structured sample. 3D MoS2 is a polycrystalline material with many structural defects that clearly interfere with the perfect stacking of the MoS2 layers, thus, resulting in a larger distance between them. However, an opposite trend is observed for the 3D MoS2 samples as the amount of Ni increases. The diffraction peaks slightly shift to higher 2θ values as the Ni content increases, suggesting a contraction of the MoS2 lattice cell due to the incorporation of Ni into the MoS2 structure as a consequence of the smaller atomic radius of Ni (1.49 Å) with respect to Mo (1.90 Å). The presence of Ni in the MoS2 layers can cause the cross-linking between layers reducing the interlayer distance. In addition, the diffraction peaks become narrower when the Ni dose increases, which indicates that Ni induces the growth of larger MoS2 crystallites above a certain amount (see below). No extra peaks associated with Ni sulfides/oxides are observed, further confirming the substitutional incorporation of Ni into the 3D-MoS2 structure. The crystallite size was calculated from the (002) peak by using the Scherrer equation. The pure 3D-MoS2 sample shows a crystallite size of 3.8 nm, that remains almost constant when a 2–5 at.% of Ni was added (~4.0 nm). However, when the Ni content is increased to 10 and 15 at.%, the crystallite size becomes 5 nm and 9.7 nm, respectively (see Figure 2B). Similar effects were recently observed in a microscopy study by Kondekar and co-workers, who undoubtedly demonstrated the strong influence in MoS2 crystal growth from ATM precursor drop-casted on metallic Ni film [51]. Interestingly, in our samples, when the Ni amount reaches 10 at.% vs. Mo, a new peak at 38.3° appears, which, after careful comparison with literature, could not be associated with any NiSx or NiOx. However, we could find a perfect match with the rarest MoS2 polymorph named as 3R, which exhibits the same metal coordination of standard 2H-MoS2 but with a shift of the layers. This is a clear indication that the introduction of Ni can induce a modification of both the crystal growth kinetics and the stacking sequence of the MoS2 layers. The changes in the crystallite dimensions and in the stacking sequence can be also related to the formation of the [Ni(MoS4)2]2− complex in the precursor solution at higher Ni concentrations. These species may provide an alternative route for nucleation and growth with respect to the standard synthesis promoted by pure ATM [52,53].
Figure 2C shows the Raman spectra of the 3D-MoS2 samples and a commercial bulk MoS2 sample (Aldrich) as reference. All samples show two bands at approximately 380 and 405 cm−1 that can be associated with the in-plane E12g and out-of-plane A1g vibrational modes, respectively, which are characteristic of 2H-MoS2 [54]. Compared with the commercial powder, the 3D nanoarchitectures show a broader A1g band that can be associated with a smaller number of stacked layers along the c axis [55], confirming the limited growth and smaller size of the 3D-MoS2 lamellae and the defective nature of these 3D materials. As the amount of Ni dopant increases, a very small shift of the A1g band toward lower values is observed (Figure 2D). The separation between the E12g and A1g modes is usually adopted to calculate the number of stacked layers [55,56], indicating that high Ni loadings induce a higher stacking of the MoS2 layers, in agreement with the XRD results. However, the differences were not significant and all the materials with between 4 and 5 layers.
XPS was used to investigate the incorporation of Ni in the 3D-MoS2 structure and the relative electronic effects, as it can reveal different chemical environments as well as variations of the electronic structure of the 3D-MoS2 scaffold [18]. First, the XPS data allowed obtaining the surface composition of the whole series of Ni-doped samples (see Supplementary Materials, Table S1): in all the cases, the Ni surface amount is proportional to the nominal Ni loading used in the synthesis. The Ni 2p3/2 region of the Ni-doped 3D-MoS2 is shown in Figure 3, whereas the corresponding Mo 3d and S 2p regions can be found in Figure S3. The Mo 3d and S 2p photoemission spectra of the commercial powder are also reported to assess the effect of the morphology on the electronic structure of the material. The Mo 3d peak of the bulk MoS2 was fitted using two doublets whose maxima are centered at a BE of 229.1 and 232.2 eV, respectively. The former is assigned to Mo(IV) in 2H-MoS2, and the latter to Mo(VI) in MoO3 surface oxide (due to the oxidation in air, 4 at.% of total Mo) (Figure S3). The S 2p peak was fitted with a single component at 161.8 eV in agreement with the values reported in the literature [57]. For pure 3D-MoS2, the deconvolution of Mo 3d peak revealed one main component at a BE of 228.9 eV (2H-MoS2) and a smaller amount of MoO3 (232.1 eV) with respect to bulk MoS2 (1.3 at.%). This BE values of the Mo 3d5/2 guarantees that no amorphous [31] or metallic [58,59] MoS2 is present in the sample. The analysis of the S 2p region showed the presence of a single component at 161.7 eV, assigned to S2− species. Moreover, note that the absence of components related to a S22− dimer (expected at ca. 163.0 eV) is a clear indication that there is no residual precursor in the samples, so that the conversion from the ATM to MoS2 was complete [60,61]. The same analysis was performed on Ni-doped 3D-MoS2 samples and similar features were found, i.e., a main component attributed to 2H-MoS2, as well as a minor component related to MoOx species (4–6 at.%, slightly higher than pure 3D-MoS2). A 0.1 eV shift toward lower BEs was observed in the MoS2 component of the Mo 3d peak, compared with the pure sample. This shift can be attributed to the modification of the electronic environment of Mo due to the incorporation of Ni, which, according to the literature, is introduced in the MoS2 lattice by substituting Mo atoms [34]. This is expected to have an effect on the electrochemical properties of MoS2, as it indicates an electron-rich surface [18].
The Ni 2p3/2 peak was separated into chemically shifted components to identify the Ni species. Three components at BEs of 853.5, 855.0, and 856.6 eV were included in the fit, which were attributed to NiSx-like structure, Ni-Mo-S structure, and NiOx species, respectively, according to the literature [52,53,62,63,64]. Then, we analyzed the evolution of each component as a function of the Ni doping (Figure 3E, Table S2). We found a decrease of the lower BE component as the Ni amount increases, while the component at 855.0 eV followed the opposite trend. This suggests that, depending on the Ni amount, different Ni species are exposed, which may influence the electrocatalytic behavior.
Recently, electron microscopy measurements provided experimental evidence that the Ni atoms tends to segregate at the edges [65] and DFT calculations indicate that the formation energy of Ni at the S-edge is lower compared to all other possible structural configurations [65]. However, when inserted in the basal plane, the Ni tends to relax assuming the Ni–Mo–S structure, which is under-coordinated compared with Mo (4-fold S coordination vs. 6-fold S for Mo), leaving unbound S atoms [35,66,67,68,69,70,71]; therefore, justifying the different chemical shift in XPS analysis. Finally, the NiOx component is independent on the Ni content, being due to surface oxidation, and in all the samples is ~30 at.% of the total Ni amount.

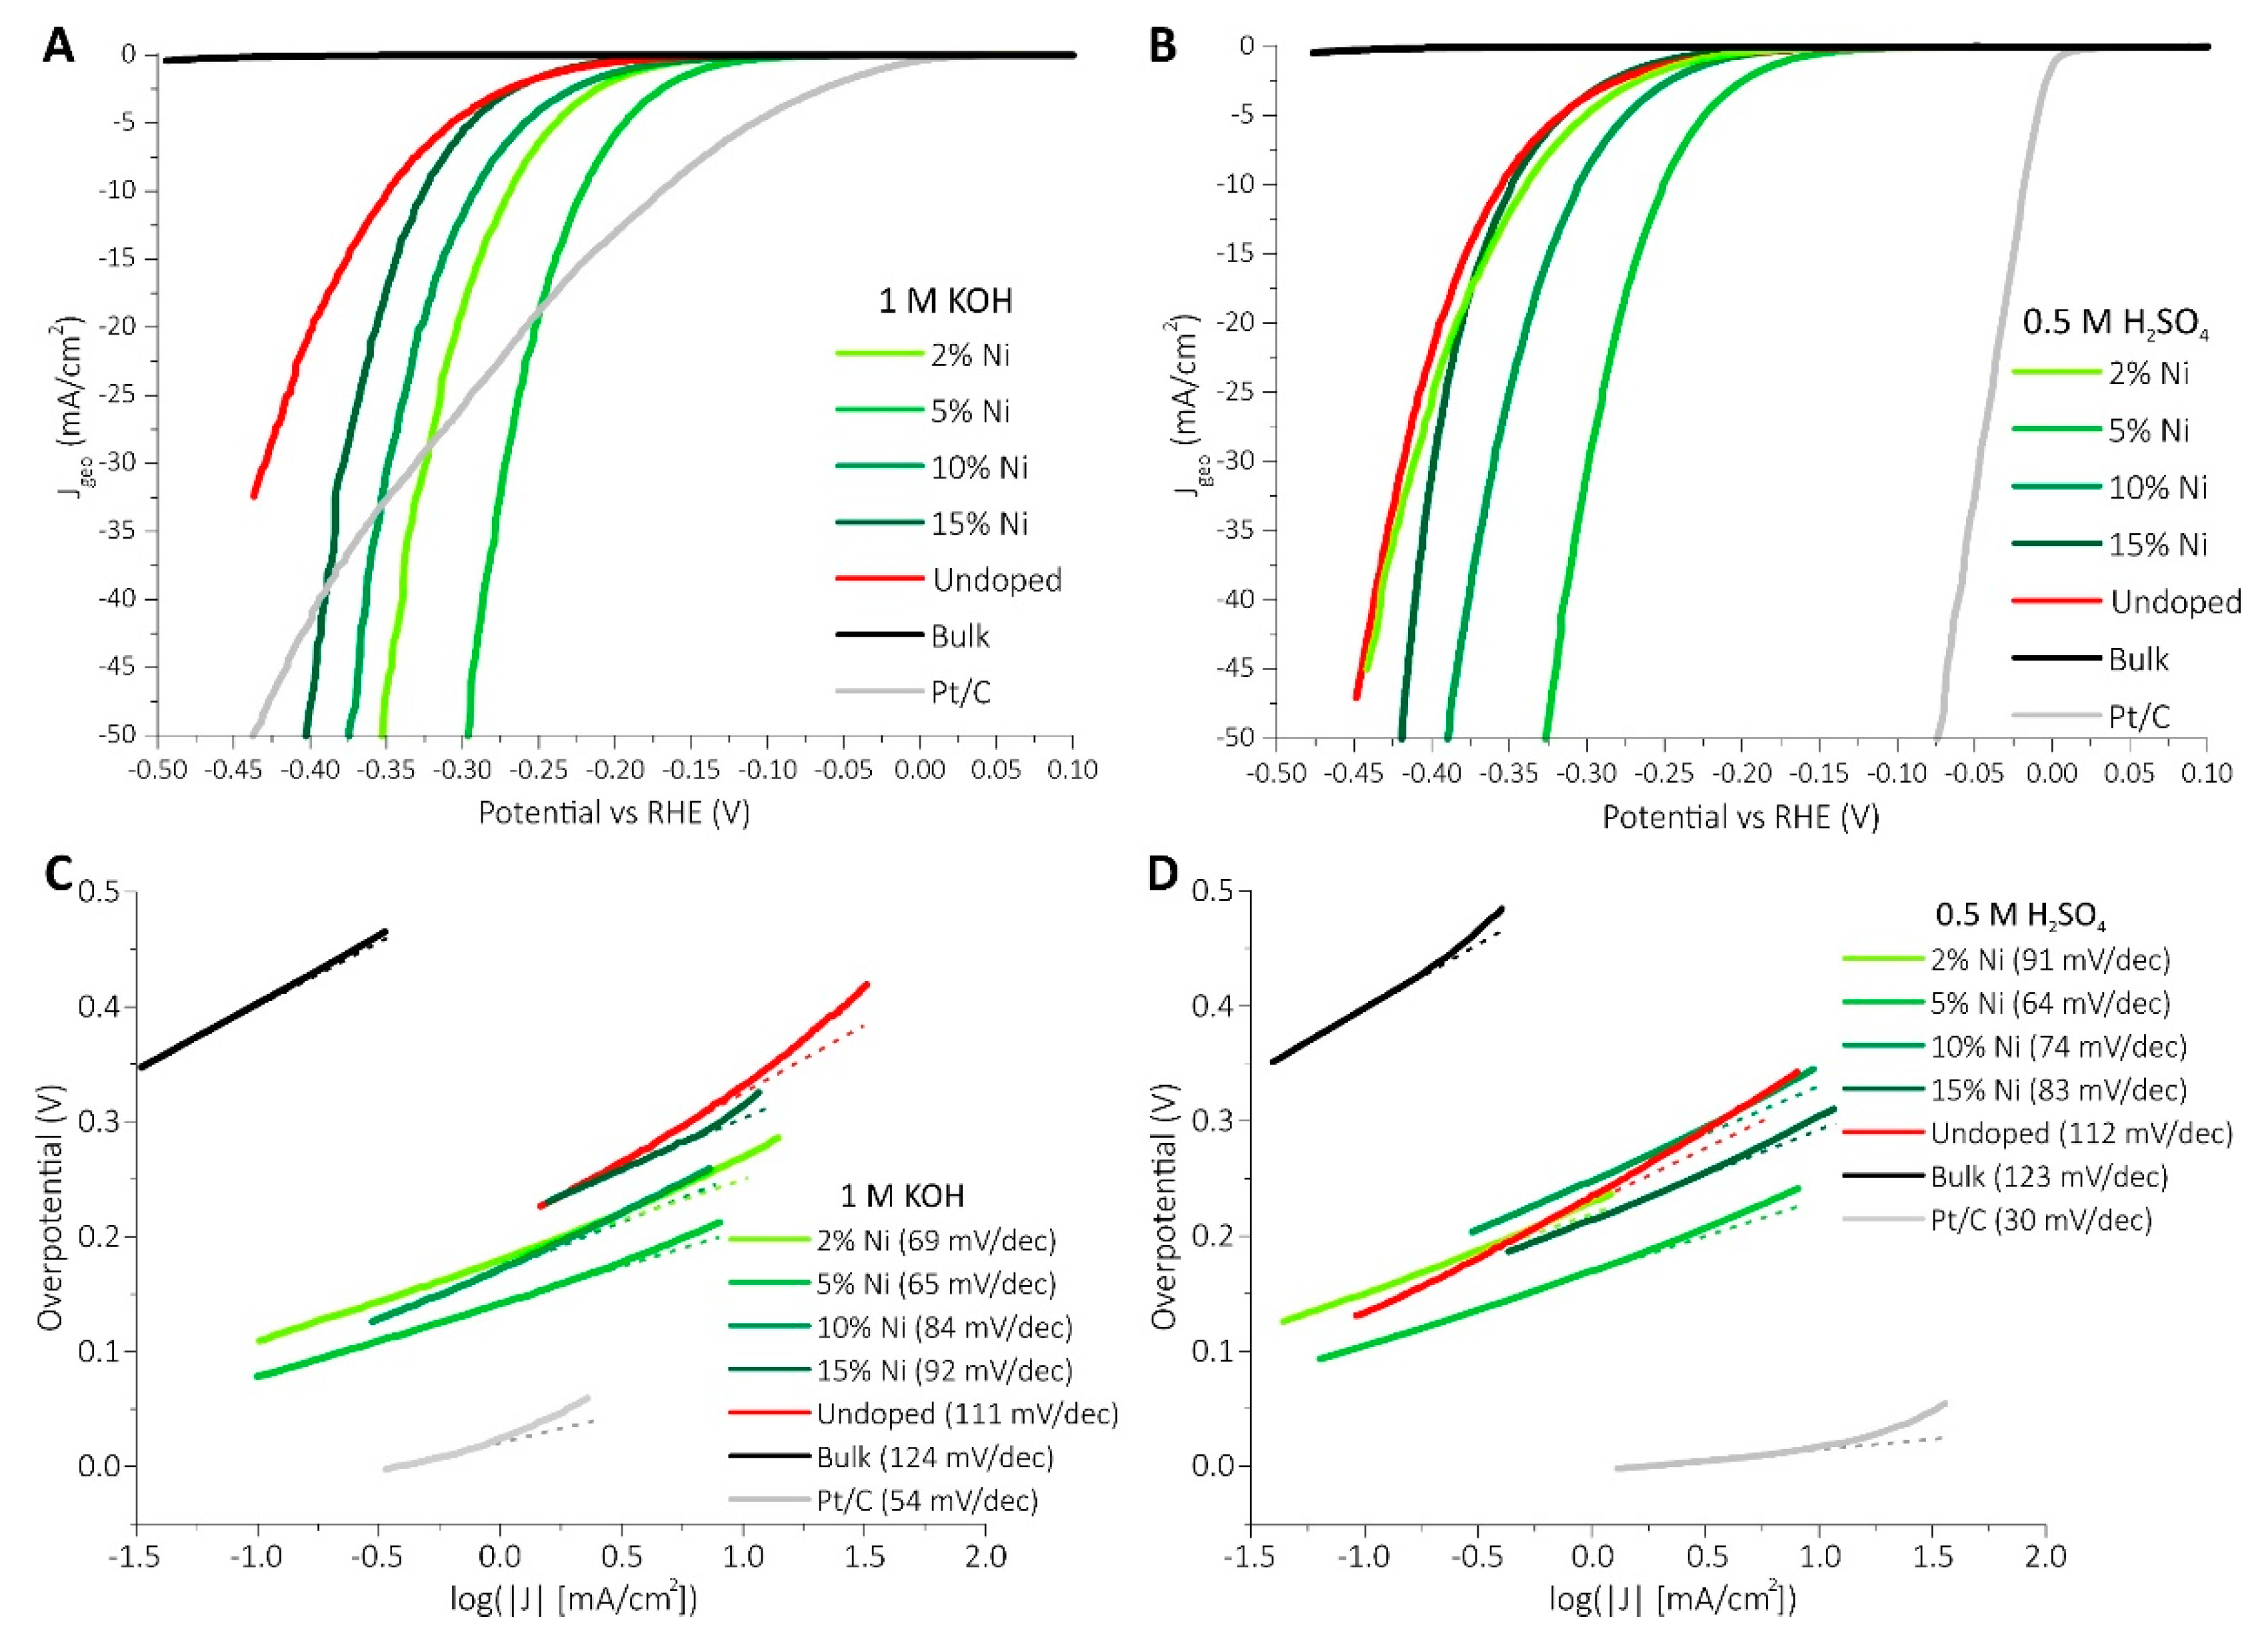
3.2. Electrochemical Characterization

Figure 4 reports the electrochemical HER activities of the Ni-doped 3D-MoS2 materials in alkaline and acid conditions. Commercial bulk MoS2 (Aldrich) and 20 wt % Pt/C (Johnson Matthey) are also included for comparison. As performance descriptors, we report the Tafel slopes and the overpotentials at 10 mA cm−210mA/cm2) in Table 1. The Ni-doping of 3D-MoS2 increases the activity in all cases, decreasing the overpotentials and increasing the current density. However, the differences observed among the Ni-doped 3D-MoS2 samples leads to interesting considerations about the Ni species and their effect on the HER kinetics in acid and alkaline conditions. Note that the pure 3D-MoS2 sample behaves similarly in acid and alkaline solutions, as expected from a polycrystalline material [17]. On the contrary, in presence of Ni doping, relevant differences are found by changing the pH.
In alkaline conditions, an increase of the activity with the amount of Ni is observed up to a 5 at.% doping (Figure 4A and Table 1), whereas higher Ni loadings result in a decrease of the activity. In the literature, it was reported that the doping of MoS2 with Ni accelerates the HER kinetics in alkaline conditions by lowering the energy barrier for the water dissociation and OH desorption steps (see Scheme 1A) [19,20,72]. Late transition metals tend to form weaker bonds with OH with respect to Mo, favoring the by-products desorption. Moreover, as confirmed by XPS, the introduction of Ni causes a slight electron enrichment of Mo, facilitating desorption of Hads species and therefore accelerating the Heyrovsky step [18,65,69,70,71].
From the different Ni species distribution determined from XPS, an interesting correlation between the structural parameters and the HER activity comes up. The activity increases as a function of the amount of Ni atoms in NiSx structures up to a 5 at.% doping, then starts to decrease when the Ni–Mo–S structure sets in (see Figure 3E and Table S2). The total amount of NiSx sites always increases with the Ni content, however the HER activity decreases for loadings higher than 10 at.%. Indeed, as demonstrated above, higher Ni loading induces the growth of larger crystallites and a denser morphology of these materials. Clearly, these modifications result in a smaller surface area exposed to the electrolyte and, especially, in a lower amount of exposed active sites due to the bigger size of the crystallites. This is further proved by Electrochemical Impedance Spectroscopy (EIS) experiments, where higher charge transfer resistance and smaller exchange currents were measured (see Figure S4 and Table S3). This result suggests that the Ni-Mo-S structure is not able to promote the HER activity in alkaline medium as effectively as the NiSx sites do. This is also confirmed by the analysis of the HER kinetics through the Tafel slope values (Table 1). They follow the same trend as the HER activity, that is, the Tafel slope decreases with the amount of Ni up to a 5 at.% Ni-doping and increases for higher Ni loadings. The lowest value, 65 mV dec−1, is obtained for the 5 at.% Ni–MoS2 sample, and is one of the lowest reported in the literature for Ni doped MoS2 [65].
In acidic conditions, HER activities interestingly show some differences with respect to those observed in alkaline media, suggesting variations in the involved active sites. The introduction of 2 at.% Ni does not induce any enhancement of the HER activity, in terms of both onset potential and current density with respect to the pristine 3D-MoS2, contrary to what happens in alkaline media. This result suggests that the NiSx sites, i.e., the main Ni species in this sample, do not have any role in the HER mechanism. However, a further increase of Ni-doping up to 5 at.% significantly improves the HER activity by decreasing the η10mA/cm2 by 0.1 V. Compared to the 2% Ni-MoS2 sample, the relative amount of NiSx species decreases in the 5% Ni sample, whereas the Ni-Mo-S component becomes larger. Therefore, considering that we observed that NiSx sites are inactive in acidic environment (see Figure 4B) [18], we could attribute the enhancement of HER activity to the Ni-Mo-S sites. When the amount of Ni-Mo-S species further increases (10% and 15% Ni samples), the HER is enhanced compared with the pristine and 2% Ni-MoS2 sample, confirming the key role of these species. However, these materials show a lower activity than the 5% Ni-MoS2 sample, due to the increase of charge transfer resistance (see Figure S5 and Table S3) caused by the enlargement of the particle size, as mentioned above.
To elucidate the role of the different Ni species, a modelistic approach to the structural changes caused by the addition of Ni must be considered. The NiSx-like species (Scheme 1A) allows to reduce the adsorption energy in alkaline conditions, so lowering the energy barrier for the water dissociation and OH desorption steps because the M–OH bond formed is weaker than with Mo [19,20]. On the other hand, the Ni–Mo–S structure in MoS2 adopt a relaxed structure, leaving two unbound sulfur atoms as shown in Scheme 1B. In agreement with the literature [18,35,73], the presence of these unsaturated S atoms can favor the proton adsorption step (Volmer step), which is the rate determining step for pure MoS2, as demonstrated by Tafel analysis. The lowering of the Tafel slope with the addition of Ni confirms the acceleration of the proton adsorption. Moreover, as in the case of HER in alkaline medium, XPS data proved the surface electron enrichment induced by Ni; therefore, the adsorption strength of H atom decreases. This would facilitate the subsequent H recombination and release processes, thus accelerating the overall reaction kinetics [18,74,75,76]. Interestingly, the decay of the kinetics in the samples with highest loading and crystallites size (10 and 15% Ni) is faster in alkaline conditions. This indicates that the abundance of Ni-Mo-S sites allows a preferential pathway for protons adsorption cleaving H+–OH2 molecules, but not for the adsorption and the dissociation of neutral water molecules at higher pH.
Finally, the long-term stability of the samples under HER working condition was investigated by chronopotentiometric measurements. Figures S6 and S7 show the V-t curves obtained in alkaline and acid environment, respectively. As observed, the performances are in good agreement with the results showed in Figure 4. The materials presented a high stability in alkaline conditions. The stability in acid conditions was good but a bit lower than in alkaline conditions.

4. Conclusions

In this work, we studied the effect of the introduction of different amounts of Ni on the structure and on the electrocatalytic performances of 3D-structured MoS2 architectures. We observed that large quantities of dopant can strongly influence the catalyst structure, by modifying the nucleation and growth processes, which has an important effect on the HER performances. Thanks to an accurate XPS analysis of the Ni species formed, we identified the ones that promote the HER mechanism in alkaline and acid media: the NiSx species are key to promote HER in alkaline medium, whereas the Ni–Mo–S ones enhanced the HER in acid medium. Therefore, the insertion of Ni into the MoS2 scaffold may induce not only a different crystallization path, but also different kind of Ni-based sites with different activities. Both factors have a strong influence on the electrochemical performance of the final catalyst.

Supplementary Materials

The following are available online at https://www.mdpi.com/2571-9637/2/4/39/s1, Figure S1: Polarization curves (left) and Tafel plot (right) for undoped 3D-MoS2 materials prepared with different starting solutions, Figure S2: SEM images of Bulk MoS2, undoped 3D-MoS2 and Ni-doped 3D-MoS2 samples (scale bar: 2 µm), Figure S3: Mo 3d and S 2p XPS regions for Bulk MoS2, undoped and Ni-doped 3D-MoS2 samples. Dotted lines in graphs refer to BE values found for undoped 3D-MoS2, Figure S4: Nyquist plot for doped and undoped 3D-MoS2 at η = 0.28 V in 1.0 M KOH, Figure S5: Nyquist plot for doped and undoped 3D-MoS2 at η = 0.28 V in 0.5 M H2SO4, Figure S6: Chronopotentiometric stability test at 10 mA cm−2 in 1.0 M KOH, Figure S7: Chronopotentiometric stability test at 10 mA cm−2 in 0.5 M H2SO4, Table S1: Surface composition of Bulk MoS2, undoped and Ni-doped 3D-MoS2 materials, Table S2: Composition of Ni 2p3/2 photoemission line, Table S3: Charge transfer resistance (Rct) and exchange currents (i0) calculated in 0.5 M H2SO4 and 1.0 M KOH.

Author Contributions

Investigation, D.M. and P.T.; Data Analysis, D.M. and T.K.; ADF-STEM/EDS analysis, D.G. and D.D.; XRD analysis, A.M.; Conceptualization, L.C. and S.A.; Supervision, G.G.

Funding

This work was partially supported by the Italian MIUR through the two PRIN projects: SMARTNESS (2015K7FZLH) and MULTI-e (20179337R7). The MAECI (Ministero degli Affari Esteri e della Cooperazione Internazionale, Direzione Generale per la Promozione del Sistema Paese) is gratefully acknowledged for the bilateral Italy−China GINSENG (PGR00953) project.

Acknowledgments

Authors would like to thank Prof. Nicolas Alonso-Vante for critical discussions.

Conflicts of Interest

The authors declare no conflicts of interest.

References

  1. Muradov, N.Z.; Veziroǧlu, T.N. From hydrocarbon to hydrogen-carbon to hydrogen economy. Int. J. Hydrogen Energy 2005, 30, 225–237. [Google Scholar] [CrossRef]
  2. Faber, M.S.; Jin, S. Earth-abundant inorganic electrocatalysts and their nanostructures for energy conversion applications. Energy Environ. Sci. 2014, 7, 3519–3542. [Google Scholar] [CrossRef]
  3. Durst, J.; Siebel, A.; Simon, C.; Hasché, F.; Herranz, J.; Gasteiger, H.A. New insights into the electrochemical hydrogen oxidation and evolution reaction mechanism. Energy Environ. Sci. 2014, 7, 2255–2260. [Google Scholar] [CrossRef] [Green Version]
  4. Mahmood, N.; Yao, Y.; Zhang, J.W.; Pan, L.; Zhang, X.; Zou, J.J. Electrocatalysts for Hydrogen Evolution in Alkaline Electrolytes: Mechanisms, Challenges, and Prospective Solutions. Adv. Sci. 2018, 5, 1700464. [Google Scholar] [CrossRef]
  5. Kucernak, A.R.; Zalitis, C. General Models for the Electrochemical Hydrogen Oxidation and Hydrogen Evolution Reactions: Theoretical Derivation and Experimental Results under Near Mass-Transport Free Conditions. J. Phys. Chem. C 2016, 120, 10721–10745. [Google Scholar] [CrossRef] [Green Version]
  6. Sheng, W.; Zhuang, Z.; Gao, M.; Zheng, J.; Chen, J.G.; Yan, Y. Correlating hydrogen oxidation and evolution activity on platinum at different pH with measured hydrogen binding energy. Nat. Commun. 2015, 6, 5848. [Google Scholar] [CrossRef]
  7. Strmcnik, D.; Lopes, P.P.; Genorio, B.; Stamenkovic, V.R.; Markovic, N.M. Design principles for hydrogen evolution reaction catalyst materials. Nano Energy 2016, 29, 29–36. [Google Scholar] [CrossRef] [Green Version]
  8. European Commission Critical Raw Materials. July 2017. Available online: ec.europa.eu/growth/sectors/raw-materials/specific-interest/critical_en (accessed on 1 December 2019).
  9. European Commission Critical Raw Materials List. December 2017. Available online: http://publications.jrc.ec.europa.eu/repository/handle/JRC108710 (accessed on 1 December 2019).
  10. Jamesh, M.I. Recent progress on earth abundant hydrogen evolution reaction and oxygen evolution reaction bifunctional electrocatalyst for overall water splitting in alkaline media. J. Power Sources 2016, 333, 213–236. [Google Scholar] [CrossRef]
  11. Roger, I.; Shipman, M.A.; Symes, M.D. Earth-abundant catalysts for electrochemical and photoelectrochemical water splitting. Nat. Rev. Chem. 2017, 1, 0003. [Google Scholar]
  12. Ma, L.; Ting, L.R.L.; Molinari, V.; Giordano, C.; Yeo, B.S. Efficient hydrogen evolution reaction catalyzed by molybdenum carbide and molybdenum nitride nanocatalysts synthesized via the urea glass route. J. Mater. Chem. A 2015, 3, 8361–8368. [Google Scholar] [CrossRef]
  13. Park, H.; Encinas, A.; Scheifers, J.P.; Zhang, Y.; Fokwa, B.P.T. Boron-Dependency of Molybdenum Boride Electrocatalysts for the Hydrogen Evolution Reaction. Angew. Chem. Int. Ed. 2017, 56, 5575–5578. [Google Scholar] [CrossRef] [PubMed]
  14. Park, H.; Zhang, Y.; Lee, E.; Shankhari, P.; Fokwa, B.P.T. High-Current-Density HER Electrocatalysts: Graphene-like Boron Layer and Tungsten as Key Ingredients in Metal Diborides. ChemSusChem 2019, 12, 3726–3731. [Google Scholar] [CrossRef] [PubMed]
  15. Ding, Q.; Song, B.; Xu, P.; Jin, S. Efficient Electrocatalytic and Photoelectrochemical Hydrogen Generation Using MoS2 and Related Compounds. Chem 2016, 1, 699–726. [Google Scholar] [CrossRef] [Green Version]
  16. Chia, X.; Eng, A.Y.S.; Ambrosi, A.; Tan, S.M.; Pumera, M. Electrochemistry of Nanostructured Layered Transition-Metal Dichalcogenides. Chem. Rev. 2015, 115, 11941–11966. [Google Scholar] [CrossRef] [Green Version]
  17. Wiensch, J.D.; John, J.; Velazquez, J.M.; Torelli, D.A.; Pieterick, A.P.; McDowell, M.T.; Sun, K.; Zhao, X.; Brunschwig, B.S.; Lewis, N.S. Comparative Study in Acidic and Alkaline Media of the Effects of pH and Crystallinity on the Hydrogen-Evolution Reaction on MoS2 and MoSe2. ACS Energy Lett. 2017, 2234–2238. [Google Scholar] [CrossRef] [Green Version]
  18. Shi, Y.; Zhou, Y.; Yang, D.-R.; Xu, W.-X.; Wang, C.; Wang, F.-B.; Xu, J.-J.; Xia, X.-H.; Chen, H.-Y. Energy Level Engineering of MoS2 by Transition-Metal Doping for Accelerating Hydrogen Evolution Reaction. J. Am. Chem. Soc. 2017, 139, 15479–15485. [Google Scholar] [CrossRef]
  19. Staszak-Jirkovský, J.; Malliakas, C.D.; Lopes, P.P.; Danilovic, N.; Kota, S.S.; Chang, K.-C.; Genorio, B.; Strmcnik, D.; Stamenkovic, V.R.; Kanatzidis, M.G.; et al. Design of active and stable Co–Mo–Sx chalcogels as pH-universal catalysts for the hydrogen evolution reaction. Nat. Mater. 2015, 15, 197–203. [Google Scholar] [CrossRef]
  20. Zhang, J.; Wang, T.; Liu, P.; Liu, S.; Dong, R.; Zhuang, X.; Chen, M.; Feng, X. Engineering water dissociation sites in MoS2 nanosheets for accelerated electrocatalytic hydrogen production. Energy Environ. Sci. 2016, 9, 2789–2793. [Google Scholar] [CrossRef] [Green Version]
  21. Merki, D.; Vrubel, H.; Rovelli, L.; Fierro, S.; Hu, X. Fe, Co, and Ni Ions Promote the Catalytic Activity of Amorphous Molybdenum Sulfide Films for Hydrogen Evolution sulfide films for hydrogen evolution. Chem. Sci. 2012, 3, 2515–2525. [Google Scholar] [CrossRef] [Green Version]
  22. Travert, A.; Nakamura, H.; Van Santen, R.A.; Cristol, S.; Paul, J.F.; Payen, E. Hydrogen Activation on Mo-Based Sulfide Catalysts, a Periodic DFT Study. J. Am. Chem. Soc. 2002, 124, 7084–7095. [Google Scholar] [CrossRef]
  23. Xiong, Q.; Wang, Y.; Liu, P.F.; Zheng, L.R.; Wang, G.; Yang, H.G.; Wong, P.K.; Zhang, H.; Zhao, H. Cobalt Covalent Doping in MoS2 to Induce Bifunctionality of Overall Water Splitting. Adv. Mater. 2018, 30, 1–7. [Google Scholar] [CrossRef] [PubMed]
  24. Tedstone, A.A.; Lewis, D.J.; O’Brien, P. Synthesis, Properties, and Applications of Transition Metal-Doped Layered Transition Metal Dichalcogenides. Chem. Mater. 2016, 28, 1965–1974. [Google Scholar] [CrossRef]
  25. Wu, L.; Dzade, N.Y.; Yu, M.; Mezari, B.; Hoof, A.J.F. Van Unraveling the Role of Lithium in Enhancing the Hydrogen Evolution Activity of MoS2: Intercalation versus Adsorption. ACS Energy Lett. 2019, 4, 1733–1740. [Google Scholar] [CrossRef] [PubMed] [Green Version]
  26. Liu, Q.; Liu, Q.; Kong, X. Anion Engineering on Free-Standing Two-Dimensional MoS2 Nanosheets toward Hydrogen Evolution. Inorg. Chem. 2017, 56, 11462–11465. [Google Scholar] [CrossRef] [PubMed]
  27. Kosmala, T.; Coy Diaz, H.; Komsa, H.P.; Ma, Y.; Krasheninnikov, A.V.; Batzill, M.; Agnoli, S. Metallic Twin Boundaries Boost the Hydrogen Evolution Reaction on the Basal Plane of Molybdenum Selenotellurides. Adv. Energy Mater. 2018, 8, 1–8. [Google Scholar] [CrossRef]
  28. Liu, P.; Zhu, J.; Zhang, J.; Xi, P.; Tao, K.; Gao, D.; Xue, D. P Dopants Triggered New Basal Plane Active Sites and Enlarged Interlayer Spacing in MoS2 Nanosheets toward Electrocatalytic Hydrogen Evolution. ACS Energy Lett. 2017, 2, 745–752. [Google Scholar] [CrossRef]
  29. Li, Y.; Wang, H.; Xie, L.; Liang, Y.; Hong, G.; Dai, H. MoS2 nanoparticles grown on graphene: An advanced catalyst for the hydrogen evolution reaction. J. Am. Chem. Soc. 2011, 133, 7296–7299. [Google Scholar] [CrossRef] [Green Version]
  30. Carraro, F.; Calvillo, L.; Cattelan, M.; Favaro, M.; Righetto, M.; Nappini, S.; Píš, I.; Celorrio, V.; Fermín, D.J.; Martucci, A.; et al. Fast One-Pot Synthesis of MoS2/Crumpled Graphene p-n Nanonjunctions for Enhanced Photoelectrochemical Hydrogen Production. ACS Appl. Mater. Interfaces 2015, 7, 25685–25692. [Google Scholar] [CrossRef]
  31. Kosmala, T.; Mosconi, D.; Giallongo, G.; Rizzi, G.A.; Granozzi, G. Highly efficient MoS2/Ag2S/Ag photo-electrocatalyst obtained from a recycled DVD surface. ACS Sustain. Chem. Eng. 2018, 6, 7818–7825. [Google Scholar] [CrossRef]
  32. Huang, H.; Chen, L.; Liu, C.; Liu, X.; Fang, S.; Liu, W.; Liu, Y. Hierarchically nanostructured MoS2 with rich in-plane edges as a high-performance electrocatalyst for the hydrogen evolution reaction. J. Mater. Chem. A 2016, 4, 14577–14585. [Google Scholar] [CrossRef]
  33. Lu, Z.; Zhu, W.; Yu, X.; Zhang, H.; Li, Y.; Sun, X.; Wang, X.; Wang, H.; Wang, J.; Luo, J.; et al. Ultrahigh hydrogen evolution performance of under-water “superaerophobic” MoS2 nanostructured electrodes. Adv. Mater. 2014, 26, 2683–2687. [Google Scholar] [CrossRef] [PubMed]
  34. Tsai, C.; Chan, K.; Nørskov, K.; Abild-pedersen, F. Rational design of MoS2 catalysts: Tuning the structure and activity via transition metal doping. Catal. Sci. Technol. 2015, 5, 246–253. [Google Scholar] [CrossRef]
  35. Deng, J.; Li, H.; Xiao, J.; Tu, Y.; Deng, D.; Yang, H.; Tian, H.; Li, J.; Ren, P.; Bao, X. Triggering the electrocatalytic hydrogen evolution activity of the inert two-dimensional MoS2 surface via single-atom metal doping. Energy Environ. Sci. 2015, 8, 1594–1601. [Google Scholar] [CrossRef]
  36. Geng, X.; Sun, W.; Wu, W.; Chen, B.; Al-Hilo, A.; Benamara, M.; Zhu, H.; Watanabe, F.; Cui, J.; Chen, T. Pure and stable metallic phase molybdenum disulfide nanosheets for hydrogen evolution reaction. Nat. Commun. 2016, 7, 10672. [Google Scholar] [CrossRef] [PubMed] [Green Version]
  37. Gao, M.-R.; Chan, M.K.Y.; Sun, Y. Edge-terminated molybdenum disulfide with a 9.4-Å interlayer spacing for electrochemical hydrogen production. Nat. Commun. 2015, 6, 7493. [Google Scholar] [CrossRef] [PubMed] [Green Version]
  38. Benck, J.D.; Hellstern, T.R.; Kibsgaard, J.; Chakthranont, P.; Jaramillo, T.F. Catalyzing the hydrogen evolution reaction (HER) with molybdenum sulfide nanomaterials. ACS Catal. 2014, 4, 3957–3971. [Google Scholar] [CrossRef]
  39. Chang, K.; Hai, X.; Pang, H.; Zhang, H.; Shi, L.; Liu, G.; Liu, H.; Zhao, G.; Li, M.; Ye, J. Targeted Synthesis of 2H- and 1T-Phase MoS2 Monolayers for Catalytic Hydrogen Evolution. Adv. Mater. 2016, 28, 10033–10041. [Google Scholar] [CrossRef]
  40. Ahn, E.; Kim, B.-S. Multidimensional Thin Film Hybrid Electrodes with MoS2 Multilayer for Electrocatalytic Hydrogen Evolution Reaction. ACS Appl. Mater. Interfaces 2017, 9, 8688–8695. [Google Scholar] [CrossRef]
  41. Zhang, H.; Yun, Q.; Lu, Q.; Zhang, X.; Tan, C. Three-dimensional architectures constructed from transition metal dichalcogenide nanomaterials for electrochemical energy storage and conversion. Angew. Chem. 2018, 57, 626–646. [Google Scholar]
  42. Subrahmanyam, K.S.; Sarma, D.; Malliakas, C.D.; Polychronopoulou, K.; Riley, B.J.; Pierce, D.A.; Chun, J.; Kanatzidis, M.G. Chalcogenide aerogels as sorbents for radioactive iodine. Chem. Mater. 2015, 27, 2619–2626. [Google Scholar] [CrossRef]
  43. Worsley, M.A.; Shin, S.J.; Merrill, M.D.; Lenhardt, J.; Nelson, A.J.; Woo, L.Y.; Gash, A.E.; Baumann, T.F.; Orme, C.A. Ultralow Density, Monolithic WS2, MoS2, and MoS2/Graphene Aerogels. ACS Nano 2015, 9, 4698–4705. [Google Scholar] [CrossRef] [PubMed] [Green Version]
  44. Liao, L.; Zhu, J.; Bian, X.; Zhu, L.; Scanlon, M.D.; Girault, H.H.; Liu, B. MoS2 formed on mesoporous graphene as a highly active catalyst for hydrogen evolution. Adv. Funct. Mater. 2013, 23, 5326–5333. [Google Scholar] [CrossRef] [Green Version]
  45. Lu, X.; Lin, Y.; Dong, H.; Dai, W.; Chen, X.; Qu, X.; Zhang, X. One-Step Hydrothermal Fabrication of Three-dimensional MoS2 Nanoflower using Polypyrrole as Template for Efficient Hydrogen Evolution Reaction Xin. Sci. Rep. 2017, 7, 42309. [Google Scholar] [CrossRef] [PubMed] [Green Version]
  46. Yang, D.; Tayebi, M.; Huang, Y.; Yang, H.; Ai, Y. A Microfluidic DNA Sensor Based on Three-Dimensional (3D) Hierarchical MoS2/Carbon Nanotube Nanocomposites. Sensors 2016, 16, 1911. [Google Scholar] [CrossRef] [PubMed] [Green Version]
  47. Jia, Y.; Wan, H.; Chen, L.; Zhou, H.; Chen, J. Facile synthesis of three dimensional MoS2 porous film with high electrochemical performance. Mater. Lett. 2017, 195, 147–150. [Google Scholar] [CrossRef]
  48. Cao, X.; Shi, Y.; Shi, W.; Rui, X.; Yan, Q.; Kong, J.; Zhang, H. Preparation of MoS2-coated three-dimensional graphene networks for high-performance anode material in lithium-ion batteries. Small 2013, 9, 3433–3438. [Google Scholar] [CrossRef]
  49. KolXPD Homepage. 2019. Available online: https://www.kolibrik.net/kolxpd/ (accessed on 1 December 2019).
  50. Chung, D.Y.; Park, S.-K.; Chung, Y.-H.; Yu, S.-H.; Lim, D.-H.; Jung, N.; Ham, H.C.; Park, H.-Y.; Piao, Y.; Yoo, S.J.; et al. Edge-exposed MoS2 nano-assembled structures as efficient electrocatalysts for hydrogen evolution reaction. Nanoscale 2014, 6, 2131–2136. [Google Scholar] [CrossRef]
  51. Kondekar, N.; Boebinger, M.G.; Tian, M.; Kirmani, M.H.; McDowell, M.T. The Effect of Nickel on MoS2 Growth Revealed with in Situ Transmission Electron Microscopy. ACS Nano 2019, 13, 7117–7126. [Google Scholar] [CrossRef]
  52. Genuit, D.; Afanasiev, P.; Vrinat, M. Solution syntheses of unsupported Co(Ni)-Mo-S hydrotreating catalysts. J. Catal. 2005, 235, 302–317. [Google Scholar] [CrossRef]
  53. Yang, L.; Wu, X.; Zhu, X.; He, C.; Meng, M.; Gan, Z.; Chu, P.K. Amorphous nickel/cobalt tungsten sulfide electrocatalysts for high-efficiency hydrogen evolution reaction. Appl. Surf. Sci. 2015, 341, 149–156. [Google Scholar] [CrossRef]
  54. Li, H.; Zhang, Q.; Yap, C.C.R.; Tay, B.K.; Edwin, T.H.T.; Olivier, A.; Baillargeat, D. From bulk to monolayer MoS2: Evolution of Raman scattering. Adv. Funct. Mater. 2012, 22, 1385–1390. [Google Scholar] [CrossRef]
  55. Lee, C.; Yan, H.; Brus, L.E.; Heinz, T.F.; Hone, J.; Ryu, S. Anomalous lattice vibrations of single- and few-layer MoS2. ACS Nano 2010, 4, 2695–2700. [Google Scholar] [CrossRef] [PubMed] [Green Version]
  56. Garoli, D.; Mosconi, D.; Miele, E.; Maccaferri, N.; Ardini, M.; Giovannini, G.; Di Palo, M.; Agnoli, S.; De Angelis, F. Hybrid Plasmonic Nanostructures base on controlled integration of MoS2 flakes on metallic nanoholes. Nanoscale 2018, 10, 17105–17111. [Google Scholar] [CrossRef] [PubMed] [Green Version]
  57. Muijsers, J.C.; Weber, T.; Vanhardeveld, R.M.; Zandbergen, H.W.; Niemantsverdriet, J.W. Sulfidation study of molybdenum oxide using MoO3/SiO2/Si (100) model catalysts and mo-IV3-sulfur cluster compounds. J. Catal. 1995, 157, 698–705. [Google Scholar] [CrossRef] [Green Version]
  58. Tuci, G.; Mosconi, D.; Rossin, A.; Luconi, L.; Agnoli, S.; Righetto, M.; Pham-Huu, C.; Ba, H.; Cicchi, S.; Granozzi, G.; et al. Surface Engineering of Chemically Exfoliated MoS2 in a “click”: How to Generate Versatile Multifunctional Transition Metal Dichalcogenides-Based Platforms. Chem. Mater. 2018, 30, 8257–8269. [Google Scholar] [CrossRef]
  59. Mosconi, D.; Giovannini, G.; Jacassi, A.; Ponzellini, P.; Maccaferri, N.; Vavassori, P.; Serri, M.; Dipalo, M.; Darvill, D.; De Angelis, F.; et al. Site-Selective Integration of MoS 2 Flakes on Nanopores by Means of Electrophoretic Deposition. ACS Omega 2019, 4, 9294–9300. [Google Scholar] [CrossRef] [Green Version]
  60. Weber, T.; Muijsers, J.C.; Niemantsverdriet, J.W. The Structure of Amorphous MoS3. Bull. des Sociétés Chim. Belges 1995, 104, 299. [Google Scholar] [CrossRef]
  61. Wang, H.W.; Skeldon, P.; Thompson, G.E. XPS studies on MoS2 formation from ammonium tetrathiomolybdate solutions. Surf. Coat. Technol. 1997, 91, 200–207. [Google Scholar] [CrossRef]
  62. Escobar, J.; Barrera, M.C.; Toledo, J.A.; Cortés-Jácome, M.A.; Angeles-Chávez, C.; Núñez, S.; Santes, V.; Gómez, E.; Díaz, L.; Romero, E.; et al. Effect of ethyleneglycol addition on the properties of P-doped NiMo/Al2O3 HDS catalysts: Part I. Materials preparation and characterization. Appl. Catal. B Environ. 2009, 88, 564–575. [Google Scholar] [CrossRef]
  63. Leyral, G.; Ribes, M.; Courthéoux, L.; Uzio, D.; Pradel, A. Synthesis and structuring of Ni MoS2 by using an ionic liquid. Eur. J. Inorg. Chem. 2012, 4967–4971. [Google Scholar] [CrossRef]
  64. Zhou, W.; Liu, M.; Zhou, Y.; Wei, Q.; Zhang, Q.; Ding, S.; Zhang, Y.; Yu, T.; You, Q. 4,6-Dimethyldibenzothiophene Hydrodesulfurization on Nickel-Modified USY-Supported NiMoS Catalysts: Effects of Modification Method. Energy Fuels 2017, 31, 7445–7455. [Google Scholar] [CrossRef]
  65. Wang, Q.; Zhao, Z.L.; Dong, S.; He, D.; Lawrence, M.J.; Han, S.; Cai, C.; Xiang, S.; Rodriguez, P.; Xiang, B.; et al. Design of active nickel single-atom decorated MoS2 as a pH-universal catalyst for hydrogen evolution reaction. Nano Energy 2018, 53, 458–467. [Google Scholar] [CrossRef]
  66. Hakala, M.; Kronberg, R.; Laasonen, K. Hydrogen adsorption on doped MoS2 nanostructures. Sci. Rep. 2017, 7, 15243. [Google Scholar] [CrossRef] [PubMed] [Green Version]
  67. Sattayanon, C.; Namuangruk, S.; Kungwan, N.; Kunaseth, M. Reaction and free-energy pathways of hydrogen activation on partially promoted metal edge of CoMoS and NiMoS: A DFT and thermodynamics study. Fuel Process. Technol. 2017, 166, 217–227. [Google Scholar] [CrossRef]
  68. Liu, G.; Robertson, A.W.; Li, M.M.J.; Kuo, W.C.H.; Darby, M.T.; Muhieddine, M.H.; Lin, Y.C.; Suenaga, K.; Stamatakis, M.; Warner, J.H.; et al. MoS2 monolayer catalyst doped with isolated Co atoms for the hydrodeoxygenation reaction. Nat. Chem. 2017, 9, 810–816. [Google Scholar] [CrossRef]
  69. Lauritsen, J.V.; Kibsgaard, J.; Olesen, G.H.; Moses, P.G.; Hinnemann, B.; Helveg, S.; Nørskov, J.K.; Clausen, B.S.; Topsøe, H.; Lægsgaard, E.; et al. Location and coordination of promoter atoms in Co- and Ni-promoted MoS2-based hydrotreating catalysts. J. Catal. 2007, 249, 220–233. [Google Scholar] [CrossRef]
  70. Wang, H.; Tsai, C.; Kong, D.; Chan, K.; Abild-Pedersen, F.; Nørskov, J.K.; Cui, Y. Transition-metal doped edge sites in vertically aligned MoS2 catalysts for enhanced hydrogen evolution. Nano Res. 2015, 8, 566–575. [Google Scholar] [CrossRef]
  71. Luo, R.; Luo, M.; Wang, Z.; Liu, P.; Song, S.; Wang, X.; Chen, M. The atomic origin of nickel-doping-induced catalytic enhancement in MoS 2 for electrochemical hydrogen production. Nanoscale 2019, 11, 7123–7128. [Google Scholar] [CrossRef]
  72. Wang, M.; Ju, P.; Li, W.; Zhao, Y.; Han, X. Ag2S nanoparticle-decorated MoS2 for enhanced electrocatalytic and photoelectrocatalytic activity in water splitting. Dalt. Trans. 2017, 46, 483–490. [Google Scholar] [CrossRef]
  73. Dai, X.; Du, K.; Li, Z.; Liu, M.; Ma, Y.; Sun, H.; Zhang, X.; Yang, Y. Co-Doped MoS2 Nanosheets with the Dominant CoMoS Phase Coated on Carbon as an Excellent Electrocatalyst for Hydrogen Evolution. ACS Appl. Mater. Interfaces 2015, 7, 27242–27253. [Google Scholar] [CrossRef]
  74. Maitra, U.; Gupta, U.; De, M.; Datta, R.; Govindaraj, A.; Rao, C.N.R. Highly Effective Visible-Light-Induced H2 Generation by Single-Layer 1T-MoS2 and a Nanocomposite of Few-Layer 2H-MoS2 with Heavily Nitrogenated Graphene. Angew. Chem. Int. Ed. 2013, 52, 13057–13061. [Google Scholar] [CrossRef] [PubMed]
  75. Liu, Q.; Fang, Q.; Chu, W.; Wan, Y.; Li, X.; Xu, W.; Habib, M.; Tao, S.; Zhou, Y.; Liu, D.; et al. Electron-Doped 1T-MoS2 via Interface Engineering for Enhanced Electrocatalytic Hydrogen Evolution. Chem. Mater. 2017, 29, 4738–4744. [Google Scholar] [CrossRef]
  76. Lei, Y.; Pakhira, S.; Fujisawa, K.; Wang, X.; Iyiola, O.O.; Perea López, N.; Laura Elías, A.; Pulickal Rajukumar, L.; Zhou, C.; Kabius, B.; et al. Low-temperature Synthesis of Heterostructures of Transition Metal Dichalcogenide Alloys (WxMo(1-x)S2) and Graphene with Superior Catalytic Performance for Hydrogen Evolution. ACS Nano 2017, 11, 5103–5112. [Google Scholar] [CrossRef] [PubMed] [Green Version]
Figure 1. (A) SEM image of undoped 3D-MoS2 undoped sample (scale bar: 2 µm). (BQ) ADF-STEM/EDS analysis for the Ni-doped 3D-MoS2 samples (scale bar: 300 nm). Energy-dispersive X-ray spectroscopy (EDS) mapping of Mo, S and Ni of 2% Ni, (CE), 5% Ni (GI), 10% Ni (KM), and 15% Ni (OQ), respectively.
Surfaces 02 00039 g001
Figure 2. XRD and Raman data of the Ni-doped 3D-MoS2 as a function of Ni loading. (A) XRD patterns, bulk MoS2 data are reported as a reference; (B) crystallite diameter and 2θ (002) peak position; (C) Raman spectra; and (D) detail of A1g peak for the 3D-MoS2 samples. Reference XRD data are the calculated pattern for 2H-MoS2 (blue line) and 3R-MoS2 (purple line).
Surfaces 02 00039 g002
Figure 3. Multipeak analysis of Ni 2p3/2 photoemission region for Ni-doped 3D-MoS2 samples at different Ni loadings: (A) 2% Ni; (B) 5% Ni; (C) 10% Ni; (D) 15% Ni. (E) Evolution of Ni 2p3/2 components as a function of the Ni content.
Surfaces 02 00039 g003
Figure 4. Polarization curves and Tafel plots in 1.0M KOH (A,C) and in 0.5M H2SO4 (B,D), respectively, for the 3D-MoS2 and Ni-doped 3D-MoS2 materials.
Surfaces 02 00039 g004
Scheme 1. Schematic representation of the different catalytic sites for the HER in alkaline ((A), side view of MoS2 slab) and acidic ((B), top view) conditions.
Surfaces 02 00039 sch001
Table 1. Overpotentials at 10 mA cm−2 and Tafel slopes for the undoped and Ni-doped 3D-MoS2, commercial MoS2 and 20 wt % Pt/C in 0.5M H2SO4 and 1.0M KOH.
MaterialOverpotential at 10 mA/cm2 (V)Tafel Slope (mV/dec)
0.5 M H2SO41.0 M KOH0.5 M H2SO41.0 M KOH
Commercial--123124
Undoped0.350.35112111
2% Ni0.340.279169
5% Ni0.250.226465
10% Ni0.300.297484
15% Ni0.350.338392
Pt/C0.020.172847

