Article

Metallic Iridium Thin-Films as Model Catalysts for the Electrochemical Oxygen Evolution Reaction (OER)—Morphology and Activity

1
The Electrochemical Energy, Catalysis and Materials Science Laboratory, Department of Chemistry, Technical University Berlin, Straße des 17. Juni 124, D-10623 Berlin, Germany
2
Max Planck Institute for Chemical Energy Conversion, Department of Heterogeneous Reactions, Stiftstr. 34, D-45470 Mülheim, Germany
3
Zentraleinrichtung Elektronenmikroskopie, Technische Universität Berlin, D-10623 Berlin, Germany
4
Ertl Center for Electrochemistry and Catalysis, Gwangju Institute of Science and Technology, Gwangju 500-712, Korea
*
Author to whom correspondence should be addressed.
These author contributed equally to this work.
Surfaces 2018, 1(1), 151-164; https://doi.org/10.3390/surfaces1010012
Submission received: 3 November 2018 / Revised: 2 December 2018 / Accepted: 5 December 2018 / Published: 6 December 2018
(This article belongs to the Special Issue Electrochemical Surface Science: Basics and Applications)

Abstract

:
Iridium (Ir) oxide is known to be one of the best electrocatalysts for the oxygen evolution reaction (OER) in acidic media. Ir oxide-based materials are thus of great scientific interest in current research on electrochemical energy conversion. In the present study, we applied Ir metal films as model systems for electrochemical water splitting, obtained by inductive heating in a custom-made setup using two different synthesis approaches. X-ray photoelectron spectroscopy (XPS) and selected area electron diffraction (SAED) confirmed that all films were consistently metallic. The effects of reductive heating time of calcined and uncalcined Ir acetate films on OER activity were investigated using a rotating disk electrode (RDE) setup. The morphology of all films was determined by scanning electron microscopy (SEM). The films directly reduced from the acetate precursor exhibited a strong variability of their morphology and electrochemical properties depending on heating time. The additional oxidation step prior to reductive heating accelerates the final structure formation.

1. Introduction

Water electrolysis as a non-polluting way of producing hydrogen is considered as one of the key technologies for an affordable and sustainable energy cycle [1]. Proton exchange membrane (PEM) electrolyzers are the most promising candidates for the supply of high purity hydrogen, because of their operation at high current densities and low gas crossover rates [2]. Among electrocatalysts applied in acidic media of water electrolysis, Ir oxide represents the state-of-the-art oxygen evolution catalyst with excellent activity and stability [3,4,5]. As a noble metal, it is less sensitive to corrosion in acidic media and further combines a high activity and stability.
The conditions under which the oxide electrodes are formed have a significant influence on the oxygen evolution reaction (OER) performance. In relation to thermally prepared oxides, this comprises the applied temperature [4], gas atmosphere [6], and particularly the precursor [6], which in turn has a significant effect on the morphology. These oxides were reported to have a higher stability, but lower activity in contrast to electrochemically oxidized Ir [7,8]. Accordingly, further investigation of electrochemically formed oxides on metallic Ir surfaces is of great scientific interest. In order to understand the role of morphology and structure of these materials, an adequate model system of well-defined Ir metal thin films is required. The fundamental research with model systems can elucidate the structure–activity–stability challenges of OER materials and, therefore, enable the systematic development and design of enhanced catalysts for industrial applications [9,10]. Given the high sensitivity of the OER kinetics towards the catalyst’s preparation, the variability in either film thickness or film composition in a model system should be kept to a minimum, which facilitates future performance comparisons and performance enhancements.
Here, we present a study of novel Ir metal films on Ti substrate obtained by a precursor-based synthesis route with subsequent reductive heating in a custom-made inductive chamber. The highly accurate temperature and time regulation in the inductive setup guarantees the formation of homogeneous metallic Ir thin films. Design details and capabilities of the setup can be found elsewhere [11]. Herein, the metallic Ir film was obtained by reduction of two distinct Ir species, namely Ir acetate and Ir oxide. The latter was formed from the acetate by an additional calcination step prior to reduction in order to study the templating effect of Ir oxide on the resulting catalyst film. Three different heating times were applied during synthesis to monitor possible sintering processes during heat treatment. In the setup, the morphology of the metallic films can be varied under controlled heating conditions. The catalytically active Ir oxide species was obtained by subsequent electrochemical oxidation. It is well accepted that the synthetic oxidative route from metallic Ir to Ir oxide, that is, either electrochemical or thermal oxidation, has a great influence on the OER performance. To our knowledge, the influence of the synthesis route of the initial metallic Ir, however, has never been taken into account. The present work addresses this issue. It presents a comparative investigation of electrochemically oxidized Ir oxide species, which originate from distinct Ir metal thin films with distinct morphology. In this way, we were able to influence the stability and activity of the catalytic systems to a certain degree by the different arrangement and environment of the active sites.
A wide range of physical and electrochemical characterization, including cyclic voltammetry, stepped potential voltammetry (SPV), X-ray photoelectron spectroscopy, transmission electron microscopy (TEM)/selected area electron diffraction (SAED), and scanning electron microscopy (SEM)/energy-dispersive X-ray spectroscopy measurements (EDX), was performed on the as-prepared and the electrochemically oxidized films to uncover links between structural and catalytic properties.

2. Materials and Methods

As-prepared (AP) iridium acetate films (Chempur, Karlsruhe, Germany) on titanium were prepared via spin coating as described by the authors of [10]. From here, two different synthesis routes were applied. In the direct reduction route, the films were directly reduced in a custom-made inductive cell directly from the acetate in 4% H2/Ar (purity 5N, 99.999%, Linde, Munich, Germany) at 400 °C, while in the oxide route, the acetate films were annealed at 450 °C for 15 min prior to the reduction in the inductive cell. Samples will be referred to as Act (samples reduced directly from the acetate) and Oxt (samples reduced from the oxide), where t is replaced by the time (in min) that the sample was exposed to reduction in the inductive cell. For each synthesis route and each heating time, several samples have been produced to ensure the reproducibility and to provide sufficient samples for the various physical analysis methods, so not every characterization was made with the same sample.
Electrochemical activity and stability measurements were performed at room temperature in 0.05 M H2SO4 (diluted from 95% H2SO4, Suprapure, Carl Roth, Germany) using a potentiostat (SP-240, BioLogic, Seyssinet-Pariset, France) and a common three-electrode rotating disk electrode (RDE) setup. A platinum mesh was used as counter electrode and a mercury/mercury sulfate electrode (Ametek, Berwyn, PA, USA, sat., calibrated against reversible hydrogen electrode, RHE) was used as reference electrode. All potentials were converted into RHE scale (referred to as VRHE). Nitrogen was used for degassing. The electrodes were immersed in the electrolyte at a potential of 0.4 VRHE. First, for surface characterization, cyclic voltammetry was performed in different ranges below the OER onset. The lower turning potential was 0.05 VRHE, the upper turning potential was varied between 0.8 and 1.2 VRHE in 0.2 V steps (five cycles each), followed by 50 cycles between 0.05 and 1.4 VRHE for electrochemical oxidation (samples referred to as _CV). After every 10th cycle of the latter, three cycles in a range of 0.4 to 1.4 VRHE were performed to obtain the anodic charge. A scan rate of 50 mV s-1 was applied. The anodic charge of the last scan was used for charge normalization of the current density curves obtained from the following activity measurements. A rotation speed of 1600 rpm was applied to the RDE working electrode and chronoamperometries (CA) were performed for 15 min at different potentials between 1.534 and 1.784 VRHE, resulting in a stepped potential voltammetry (SPV) curve. In this potential range, adequate currents were obtained in pre-measurements. At each potential, electrochemical impedance spectroscopy was measured to obtain the ohmic resistance. After the last potential, the electrolyte was degassed; the rotation of the RDE was turned off; and again, three cycles at 50 m V s-1 in the potential range of 0.4 to 1.4 VRHE were conducted. The protocol was performed twice, and the respective samples are referred to as _OER.
For electrochemical stability testing, the potential steps in the OER protocol were replaced by one long chronoamperometry at circa 1.734 VRHE (without correction of ohmic resistance) for 20 h.
Scanning electron microscopy (SEM) images were obtained using a JEOL 7401F instrument (Tokyo, Japan) with an accelerating voltage of 10 kV. Corresponding EDX analysis was established by a Bruker XFLASH 4010 (Bruker, Billerica, MA, USA) at an accelerating voltage of 6 keV. The EDX was normalized by the sample current, which was measured in a Faraday cup if not stated otherwise.
XRD patterns were obtained by grazing-incident X-ray diffraction (GIXRD) measurement in a Bruker D8 Advance diffractometer (Bruker AXS). The analysis was performed at a grazing incidence of 1° with a Goebel mirror, a Cu Kα source, a 0.23° secondary Soller, and a scintillation counter as detector. The identification of the individual phases in the measured diffractograms was enabled with reference patterns. Rietveld refinement with the software TOPAS (Bruker AXS) allowed a clear definition of the individual phases present in the sample. A quantitative analysis, however, is not given with Rietveld refinement, as it is primarily aimed at examining powder samples. The structure and composition of film samples thus do not allow an exact determination of concentrations as the individual phases might occupy distant layers, which consequently affects the intensity of the incident beam.
For transmission electron microscopy (TEM), Cu grids with a 200 mesh and a holey carbon layer by Quantifoil (Großlöbichau, Germany) were coated with the dispersed catalyst. The measurements were performed at a FEI Tecnai G220 S-TWIN transmission electron microscope (Hillsboro, OR, USA) with a LaB6 cathode operated at an accelerating voltage of 200 kV. The SAED evaluation was performed by PASAD [12,13] plugin in Digital Micrograph™, and the obtained reciprocal distances were transferred to Cu Kα scale to obtain a calculated diffraction pattern.
For the investigation of a cross section of Ir film on Ti, a TEM lamella was prepared by focused ion beam (FIB). A FEI Helios NanoLab 600 workstation equipped with (1) an Omniprobe lift-out system, (2) a Pt & W gas injector system, and (3) a scanning electron microscope (SEM) detector. High resolution TEM (HRTEM) was performed using an FEI Titan 80-300 TEM electron microscope with a high brightness X-FEG electron source and a Cs corrector for the objective lens. The microscope was operated at 200 kV.
Laboratory-based X-ray photoelectron spectroscopy (XPS) measurements were carried out at room temperature in an ultrahigh vacuum (UHV) setup using a monochromatic Al Kα source at 1486.6 eV (SPECS, Berlin, Germany). The XP spectra were analyzed using CasaXPS software. Fitting of O 1s spectra was performed using three singlets corresponding to lattice O (at ~ 530.0 eV), OH (at ~ 531.4 eV), adsorbed water, and organic O (at ~533.0 eV), respectively. The Ir 4f spectra were fitted with one component (for Ac10_AP and Ox10_AP samples, corresponding to Ir0 species) or three components (for the electrochemically treated samples Ac10_CV, Ac10_OER, Ox10_CV, and Ox10_OER, corresponding to Ir0, IrIV, and IrIII species). The Ir 4f 7/2 positions of the Ir0, IrIV, and IrIII species were located at ~60.9 eV, ~61.7 eV, and ~62.3 eV, respectively. The peak models consist of either a doublet (Ir0 component), a doublet and three satellite peaks (IrIV component), or a doublet and two satellite peaks (IrIII component) [14]. The peak models (including asymmetry parameter) were derived from the fits of the Ir 4f XPS of the polycrystalline metallic Ir standard (for the Ir0 component) or of a rutile-type IrO2 standard sample (for the IrIV component) [15].

3. Results and Discussion

In the study of the morphology, structure, and catalytic activity of supported metallic Ir films, two different synthesis routes were established. The synthesis of the ‘Ox’ films was based on the reductive treatment of Ir oxide films, which were prepared according to a previously reported precursor-based spin coating method [10]. The ‘Ac’ films, however, skipped the calcination step and were directly reduced from the spin coated acetate film.

3.1. Morphology of Ir Metal Thin-Film Catalysts

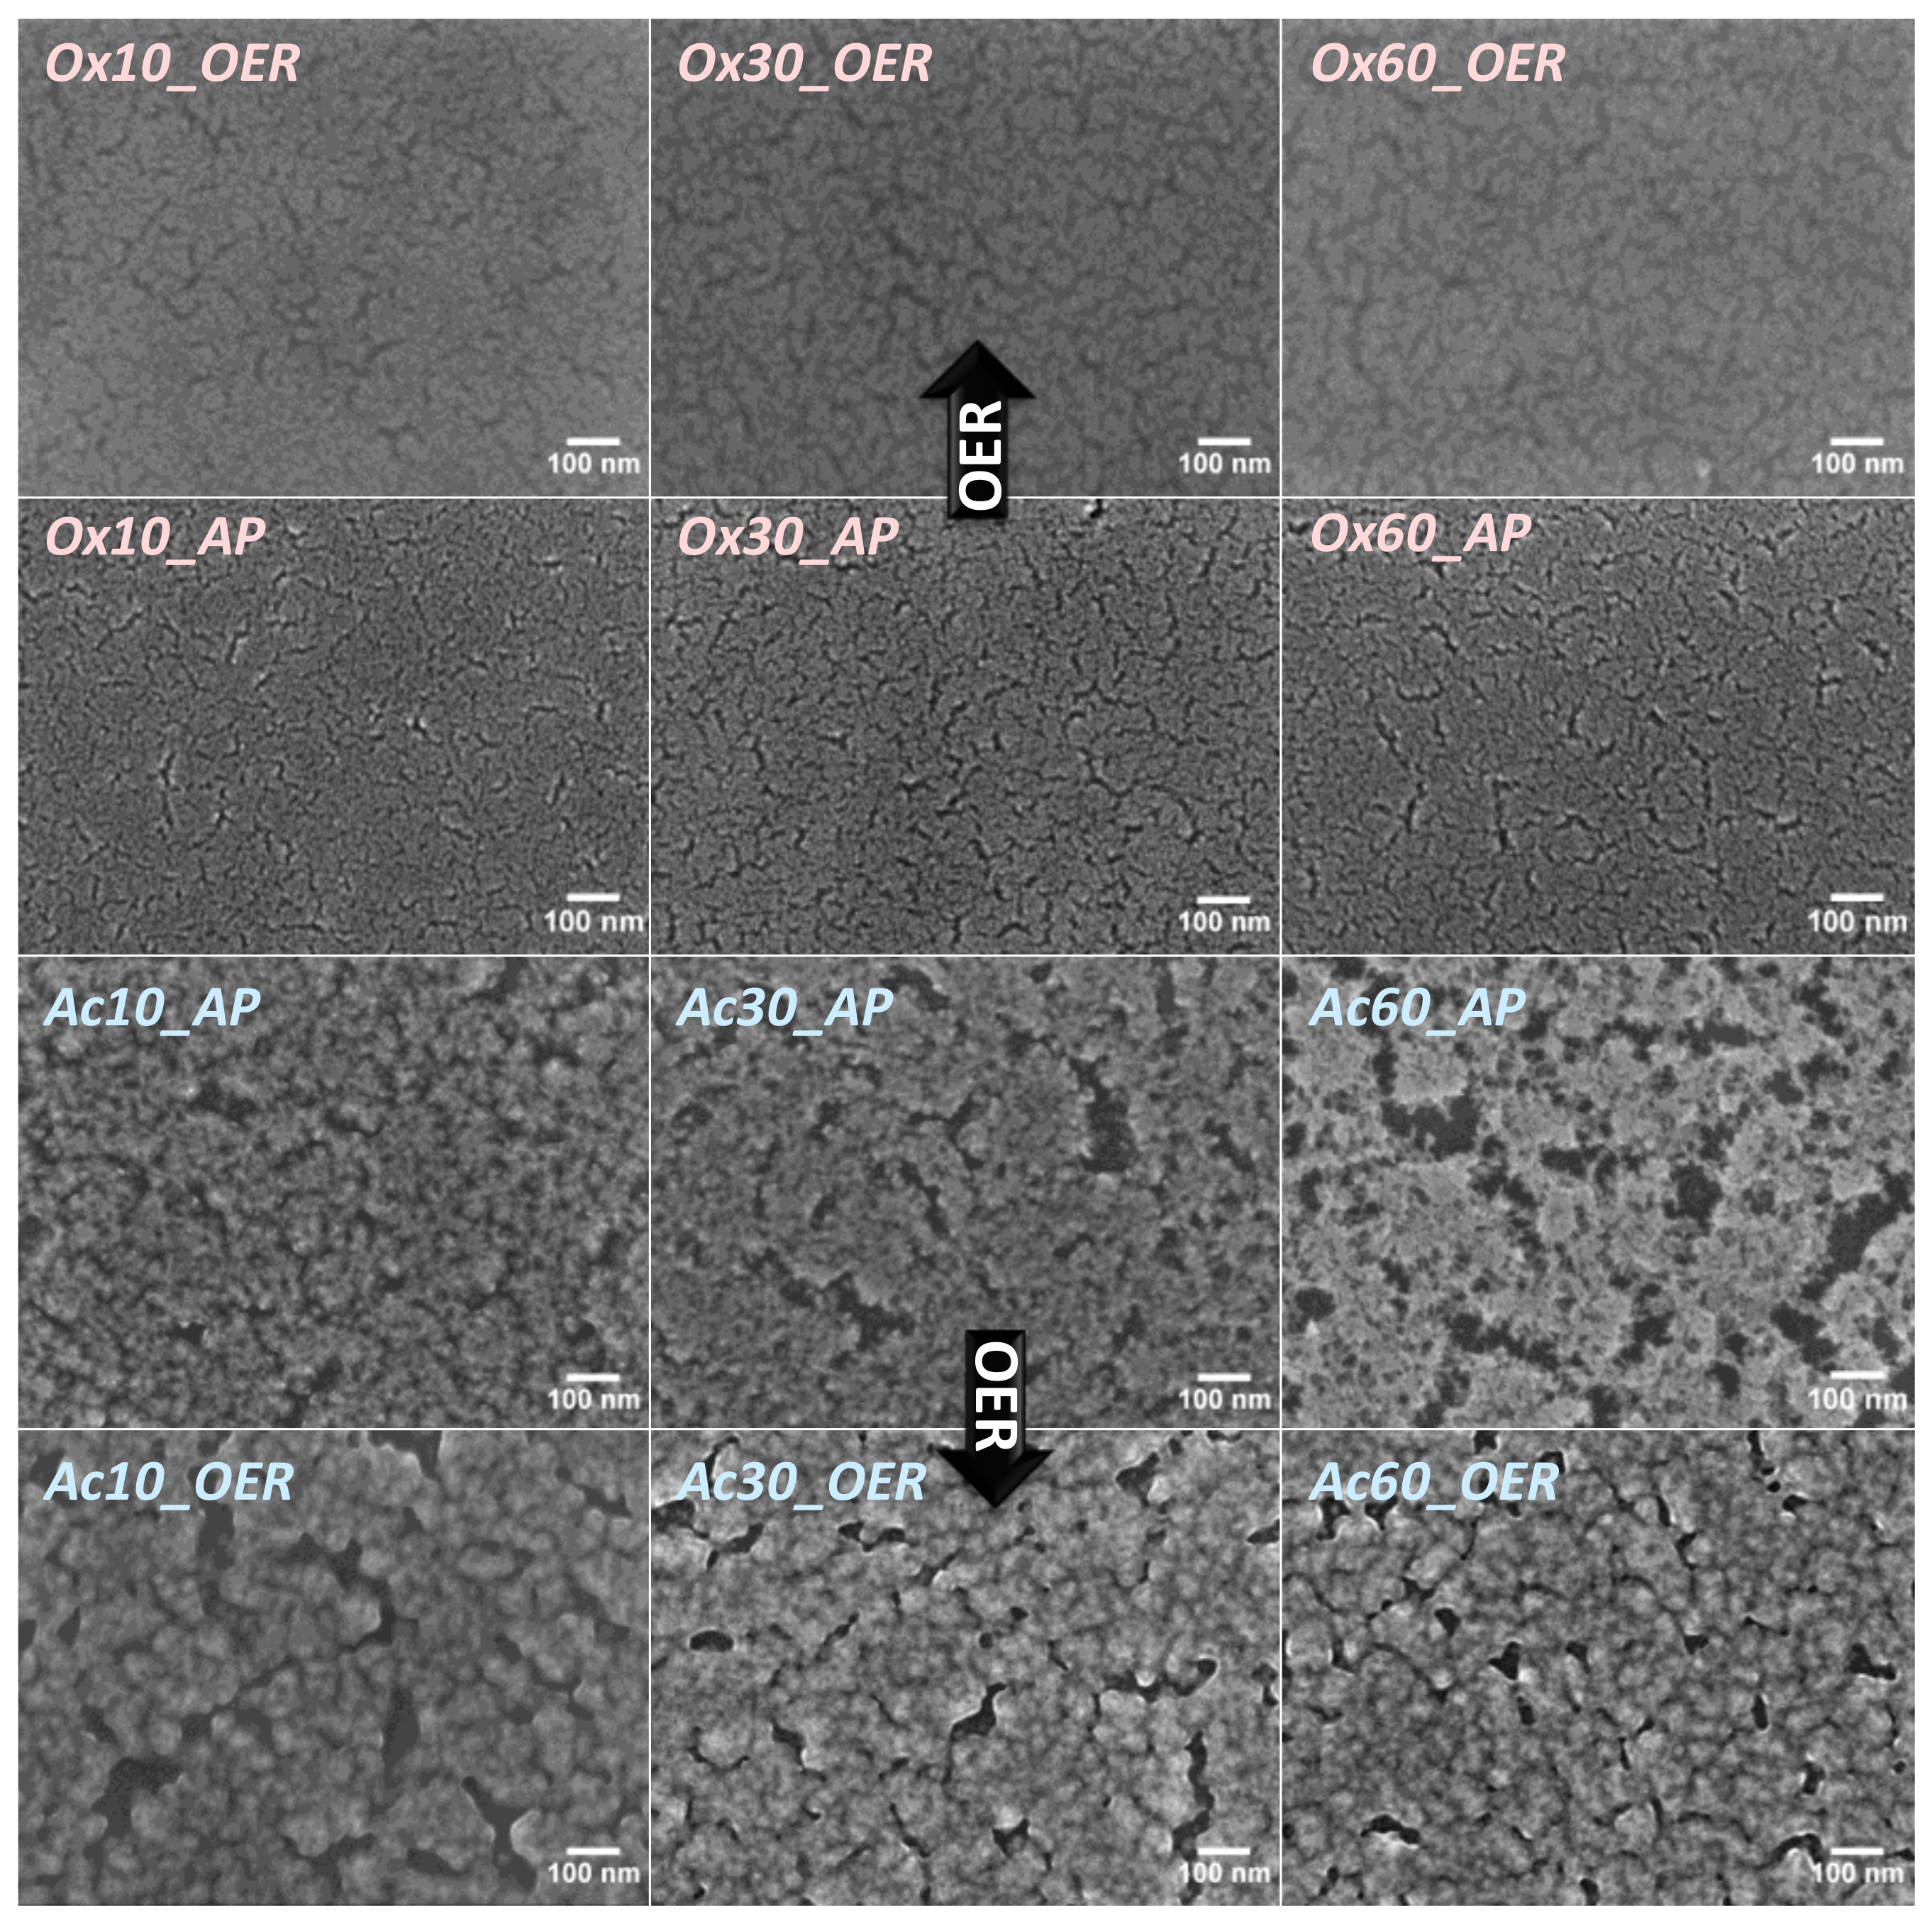
3.1.1. Scanning Electron Microscopy (SEM)

In order to investigate the morphology of the Ox and Ac films, micrographs of the samples before (_AP) and after OER (_OER) measurements were obtained using a scanning electron microscope (SEM). The respective results are displayed in Figure 1. The Ox_AP films (Figure 1, second row) display a homogeneously cracked surface with clear porosity. Their morphology (Ox10, Ox30, and Ox60) does not change significantly with heating time, in contrast to the morphology of the Ac_AP film series. The surface of the Ac films (Figure 1, third row) displays larger cracks compared with that of the Ox films, and in addition, they exhibit a larger crack size distribution. Thus, a clear tendency towards a more cracked surface with a longer annealing time was observed for the Ac_AP films. The morphological restructuring (and probable sintering process) produces a highly cracked, ‘sponge-like’, and more fibrous morphology. It can be assumed that in contrast to the Ac samples, the calcination step in the Ox route creates a defined and crystalline rutile structure [10] from the beginning, which consequently leads to a faster formation of the final metallic Ir structure through reductive heating. After OER measurements, the Ac_OER samples (Figure 1, fourth row) exhibit a swollen and filled surface with rounded edges on the cracks. A similar effect is only weakly visible for the Ox films (Figure 1, first row) as a result of their less pronounced cracks.

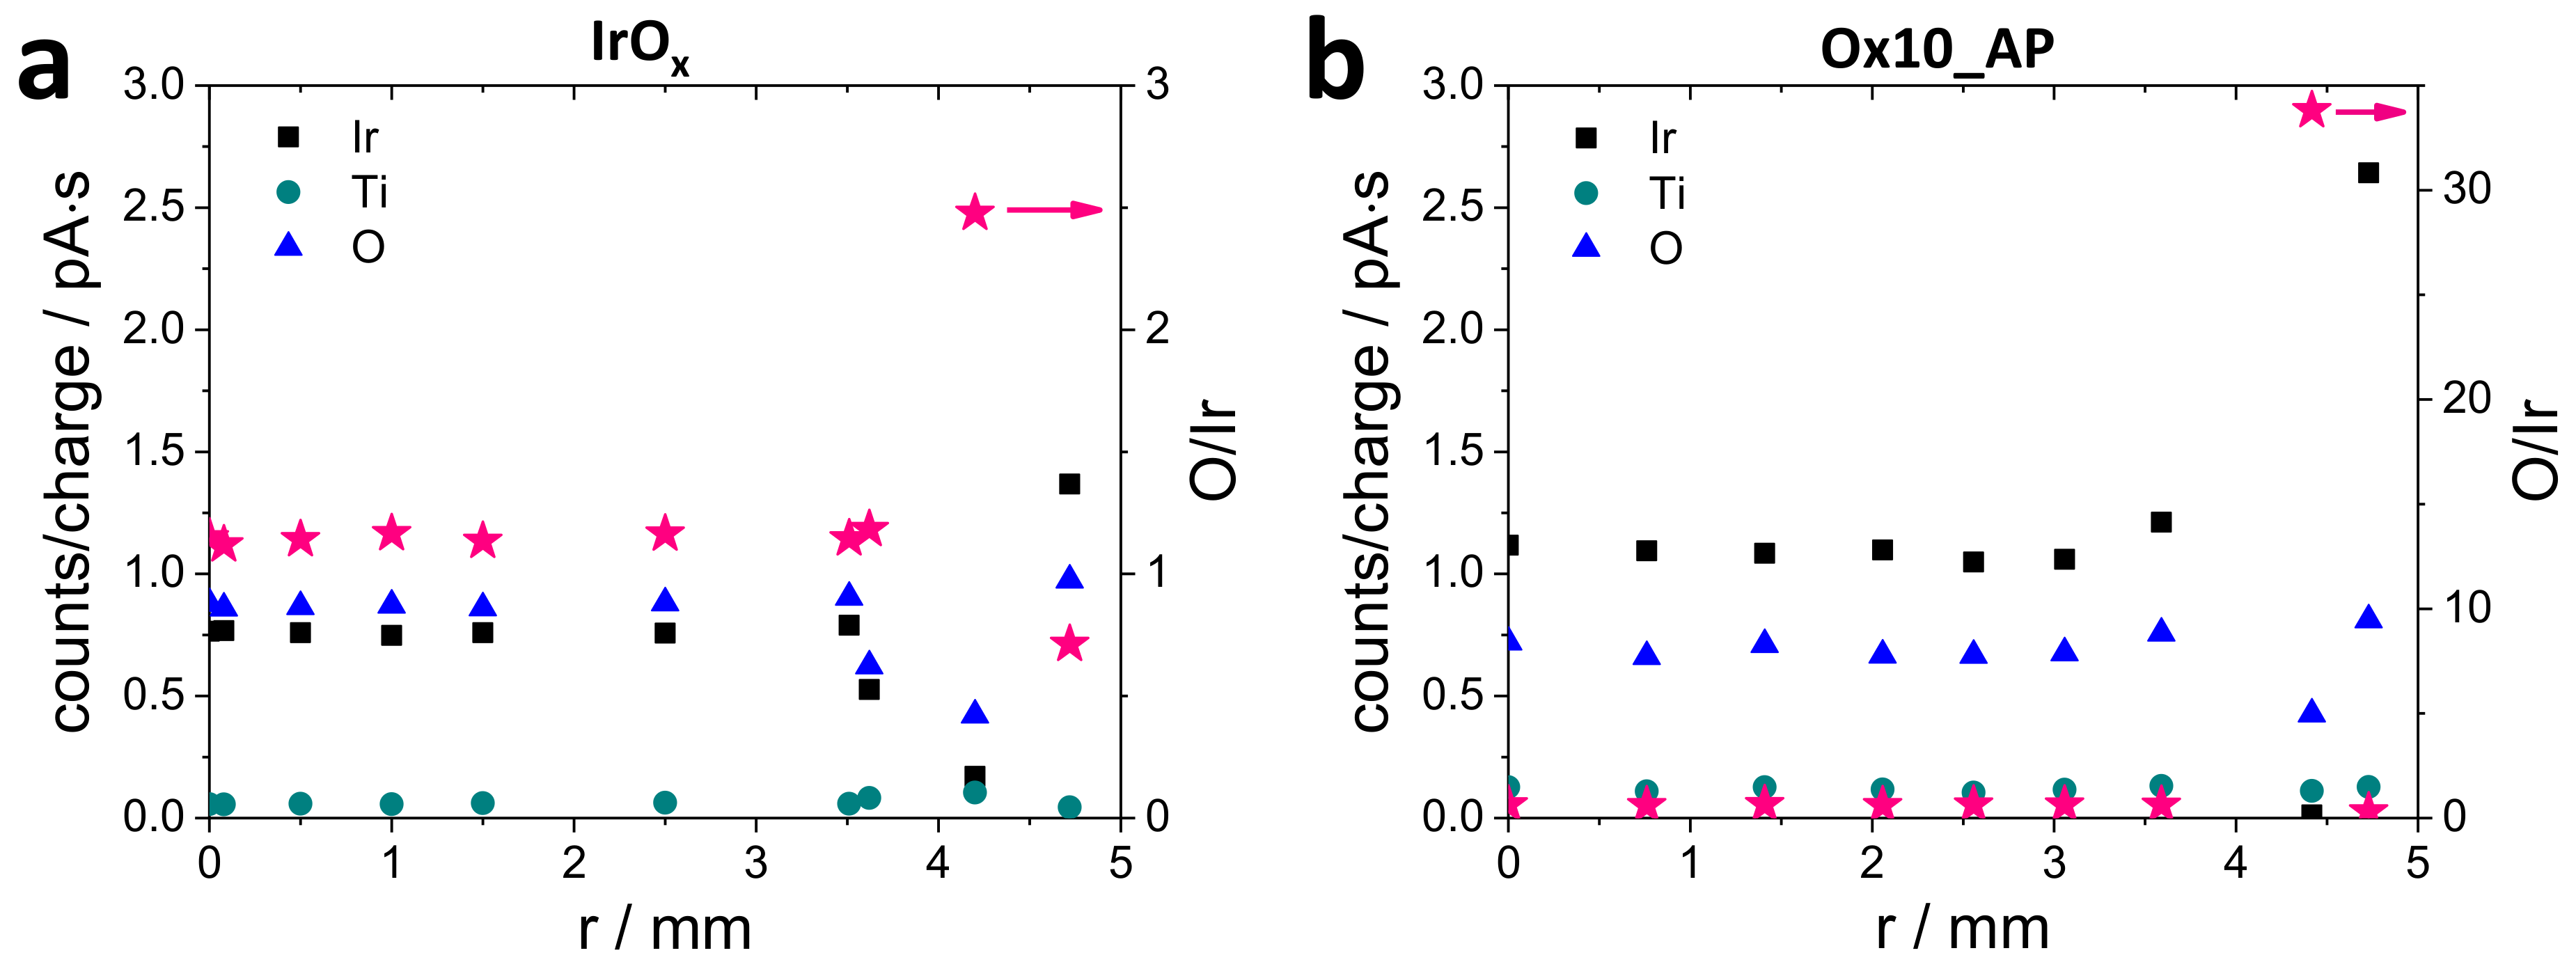
3.1.2. Energy-Dispersive X-ray Spectroscopy Measurements (EDX)

EDX measurements performed on the _AP samples during SEM investigation in Figure S1 (in the Supplementary Information) show the atomic percentage (at%) ratio of O to Ir (not normalized by sample current) depending on the reductive heating time. The results reveal a significantly higher amount of O in the Ox samples than in the Ac samples, regardless of the heating time. This indicates the presence of an O species in the Ox films that cannot be removed by reductive heating under applied conditions, or that occurs while handling the samples under air, respectively. This species might either originate from a small fraction of (re)oxidized Ir in the film; physically adsorbed or trapped O within the pores of the film; or, most likely, a Ti oxide layer formed during the calcination step [10] and not being reduced at applied reduction conditions.
The position of O within the film, however, cannot be obtained by a single EDX measurement. For this purpose, several EDX measurements have been conducted along the radius of an Ox10_AP sample and IrOx film on Ti (before reductive heating). The results are given in Figure 2. Here, the intensity (standardized to the sample current and time) of each element (left y-axis) along with the calculated O/Ir count ratio (right y-axis) is plotted against the radius of the film.
Within a radius of 3.5 mm from the center, both samples show no variation in film thickness. Closer to the edge, the film thickness is altered as a result of the surface tension/boundary effects of the precursor solution during the spin coating process. The uneven film thickness at the edge of the sample and the ability of Ir to partially shield radiation emitted from deeper layers may at least give a hint on the O distribution, considering two extreme cases. If O was (exclusively) homogeneously distributed within the Ir(oxide) film (regardless of the chemical nature of O), the O/Ir ratio would be independent of the film thickness. In other words, at spots with lower Ir counts (lower film thickness), the O counts should also be lower. If oxygen only existed within a Ti oxide layer underneath the film, the O/Ir ratio would increase with decreasing film thickness as a result of lower shielding by Ir. With respect to the IrOx film on Ti (Figure 2a), both cases seem to apply here; a lower amount of Ir accompanied by a lower amount of O (lower film thickness, 3.6 and 4.3 mm from center) points to an oxidized Ir film. At the same time, a higher O/Ir ratio speaks for a Ti oxide or Ir/Ti mixed oxide layer underneath the Ir oxide film. The homogenous part of the Ox10_AP film (Figure 2b) exhibits a drastically lower O/Ir ratio compared with the oxide film (Figure 2a), so a considerable amount of O has been removed from the sample by reductive heating. Even though inductive heating has successfully reduced the film, the location of remaining O has not changed during reduction; areas with a lower Ir amount in Figure 2b (lower film thickness, 4.4 mm) exhibit a larger O/Ir count ratio, indicating a significant amount of O beneath the film incorporated within a TiOx or Ir–Ti mixed oxide layer. At areas with a higher Ir amount (3.6 mm), the O total counts increases with Ir, pointing to a fraction of O existing inside the film. However, the metallic state of the as-prepared film, which was confirmed by XPS (as discussed later in the manuscript), contradicts that the O is chemically bound to Ir.

3.2. Structural Characterization of Ir Metal Thin-Film Catalysts

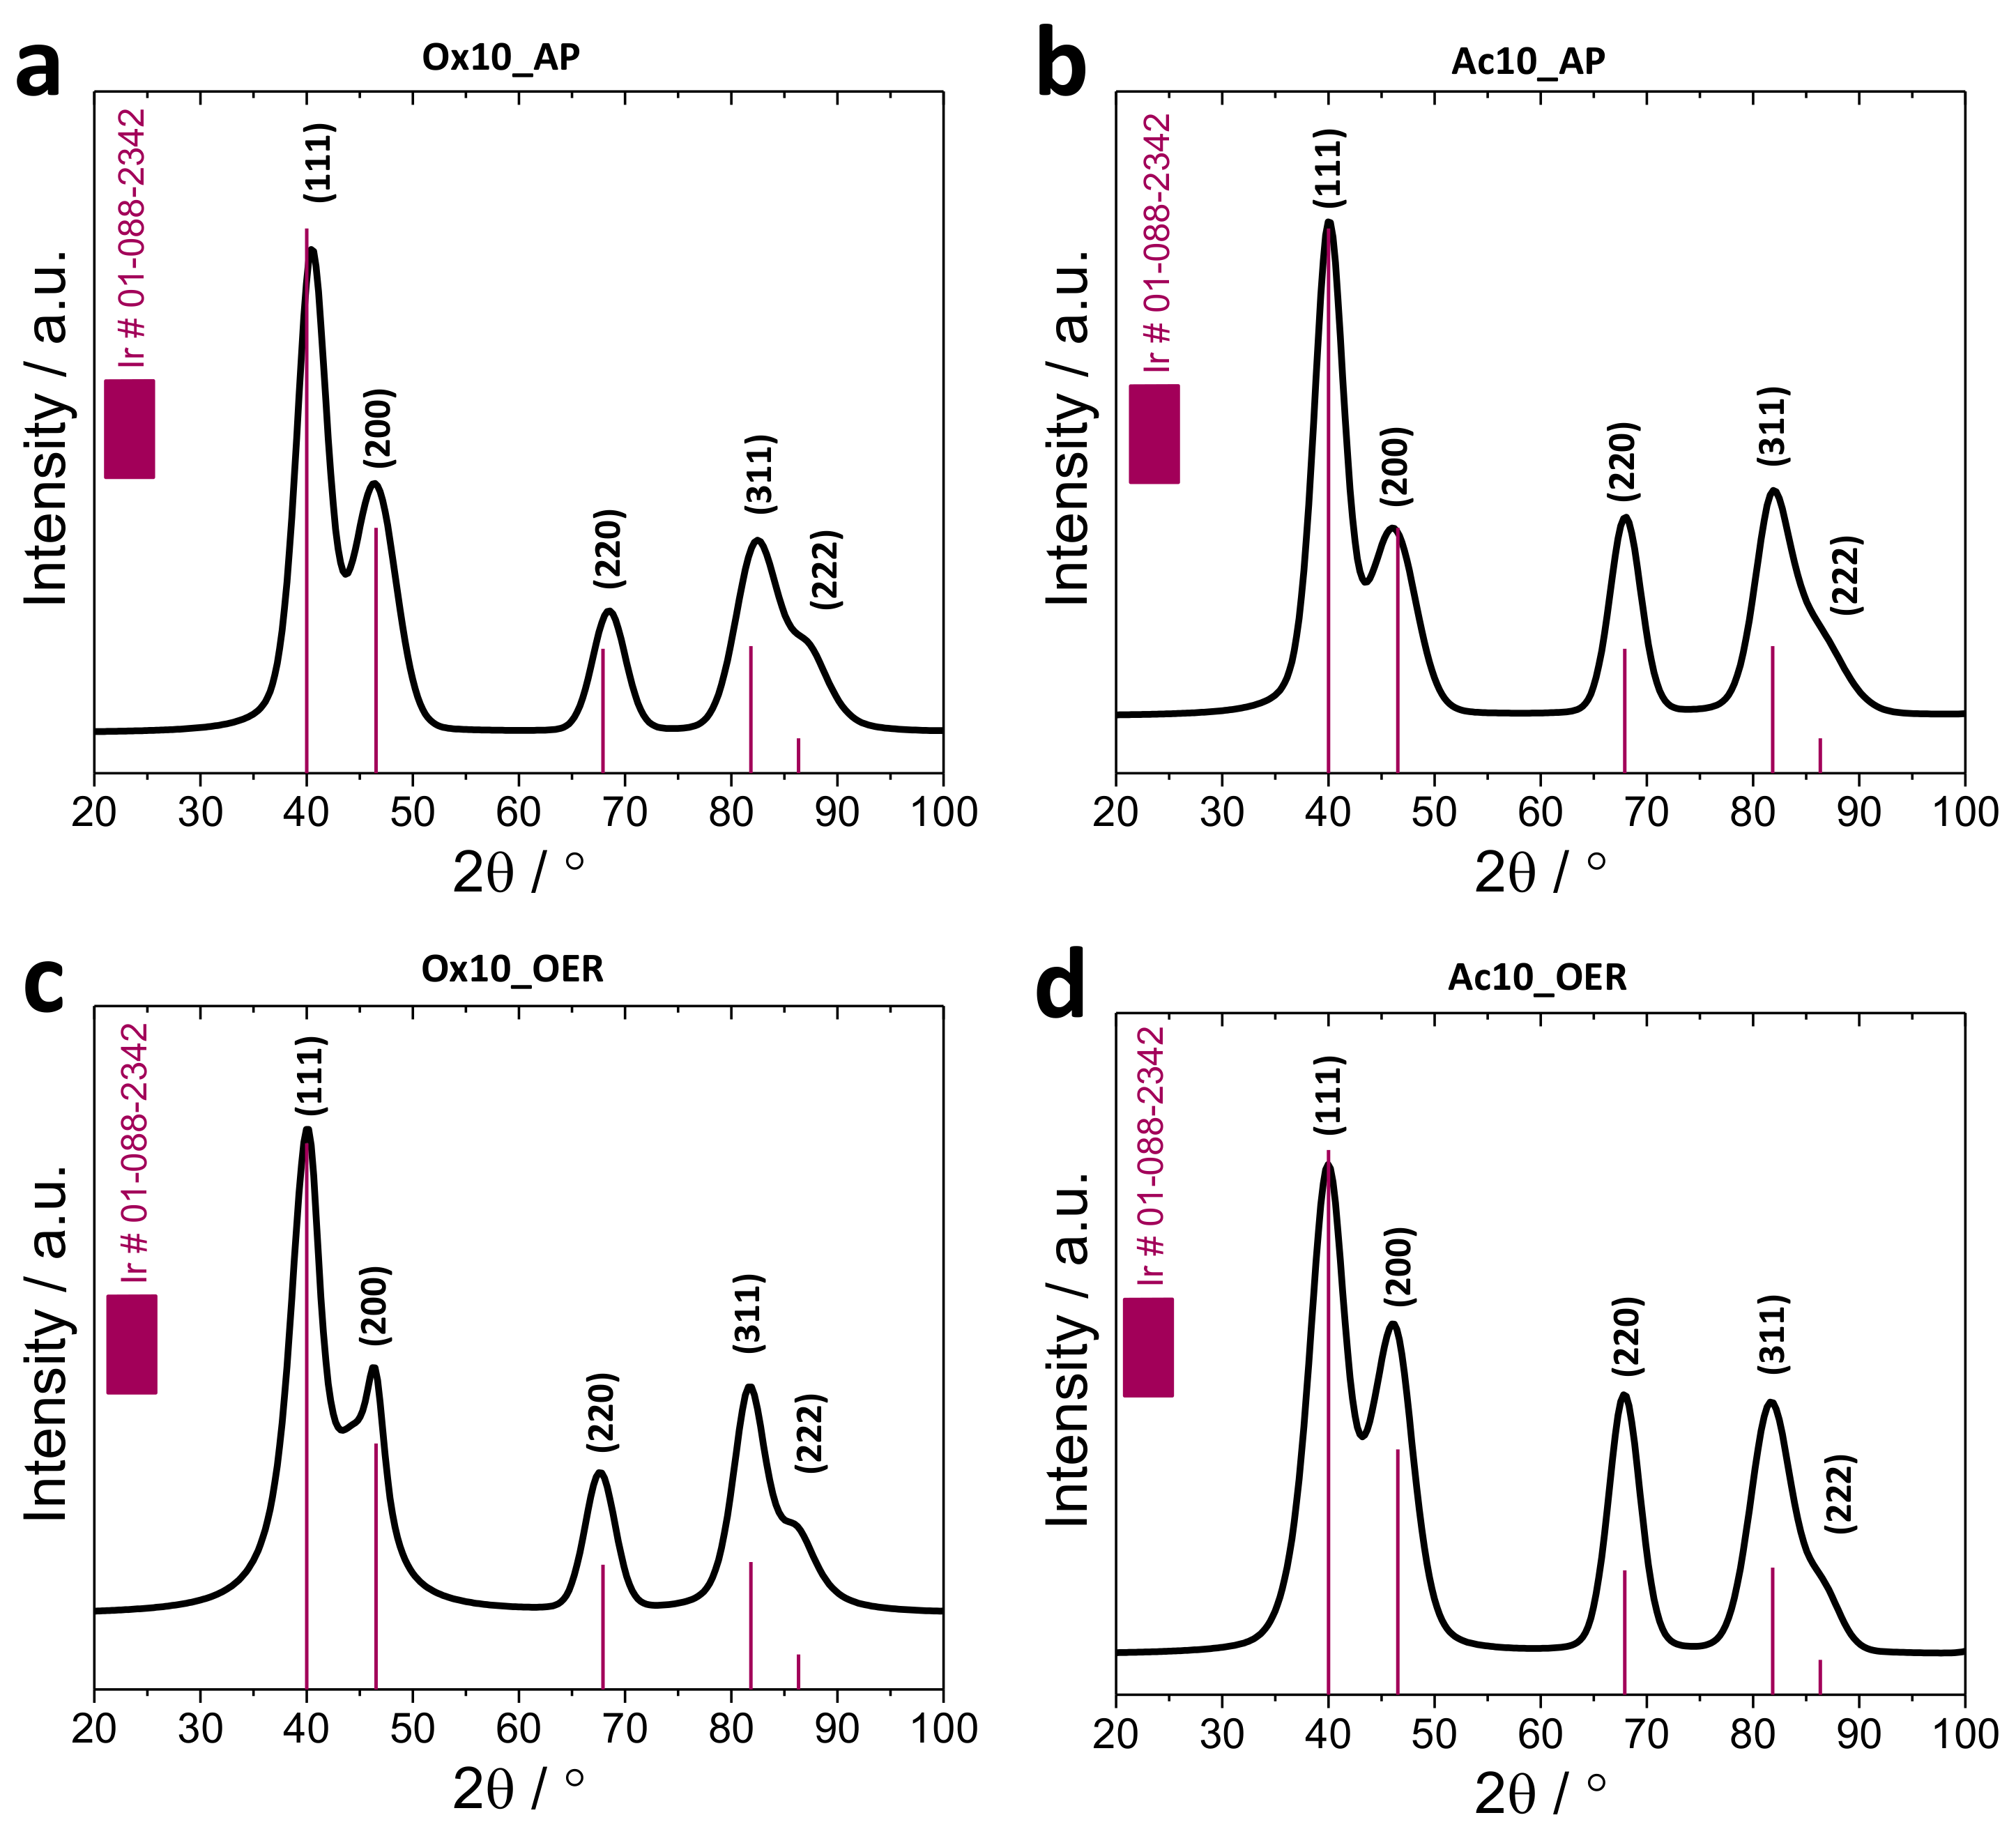
3.2.1. X-Ray Diffraction (XRD)

To examine if the crystallinity and atomic structure of the Ac and Ox films changes depending on the reductive heating time, a grazing-incident X-ray diffraction (GIXRD) analysis was conducted prior to OER measurements (Figure S2). For both preparation methods, two crystalline phases are detected in the as-prepared state, where the dominating reflections (35° and 40°, purple sphere) can be assigned to the hexagonal phase of the Ti substrate. The weak reflections (47° and 68°, red star), however, are assigned to metallic Ir phases, evidencing crystallinity of the films. The low intensity of the reflections is a result of a low amount of Ir, or rather, a low thickness of the film in contrast to the bulk Ti cylinder.
The Rietveld refinement technique was used to analyze the XRD patterns of the as-prepared samples (Figure S3). The analysis evidences the absence of a crystalline IrO2 phase, but suggests the presence of a TiO2 rutile phase to a very small extent. Still, the existence of an amorphous or very nanocrystalline Ir oxide phase cannot be ruled out. To achieve a reasonable Rietveld refinement, an additional hexagonal phase had to be incorporated into the pattern fitting. The fittings further incorporate a metallic Ti phase and a nanocrystalline phase of metallic Ir. This supplementary reflection will be referred to as TiOx and can be assigned to a Ti phase with larger lattice spacing rather than a rutile-type TiO2. The presence of this phase might be deduced as a result of inclusion of oxygen into the lattice of Ti prior to the annealing process.

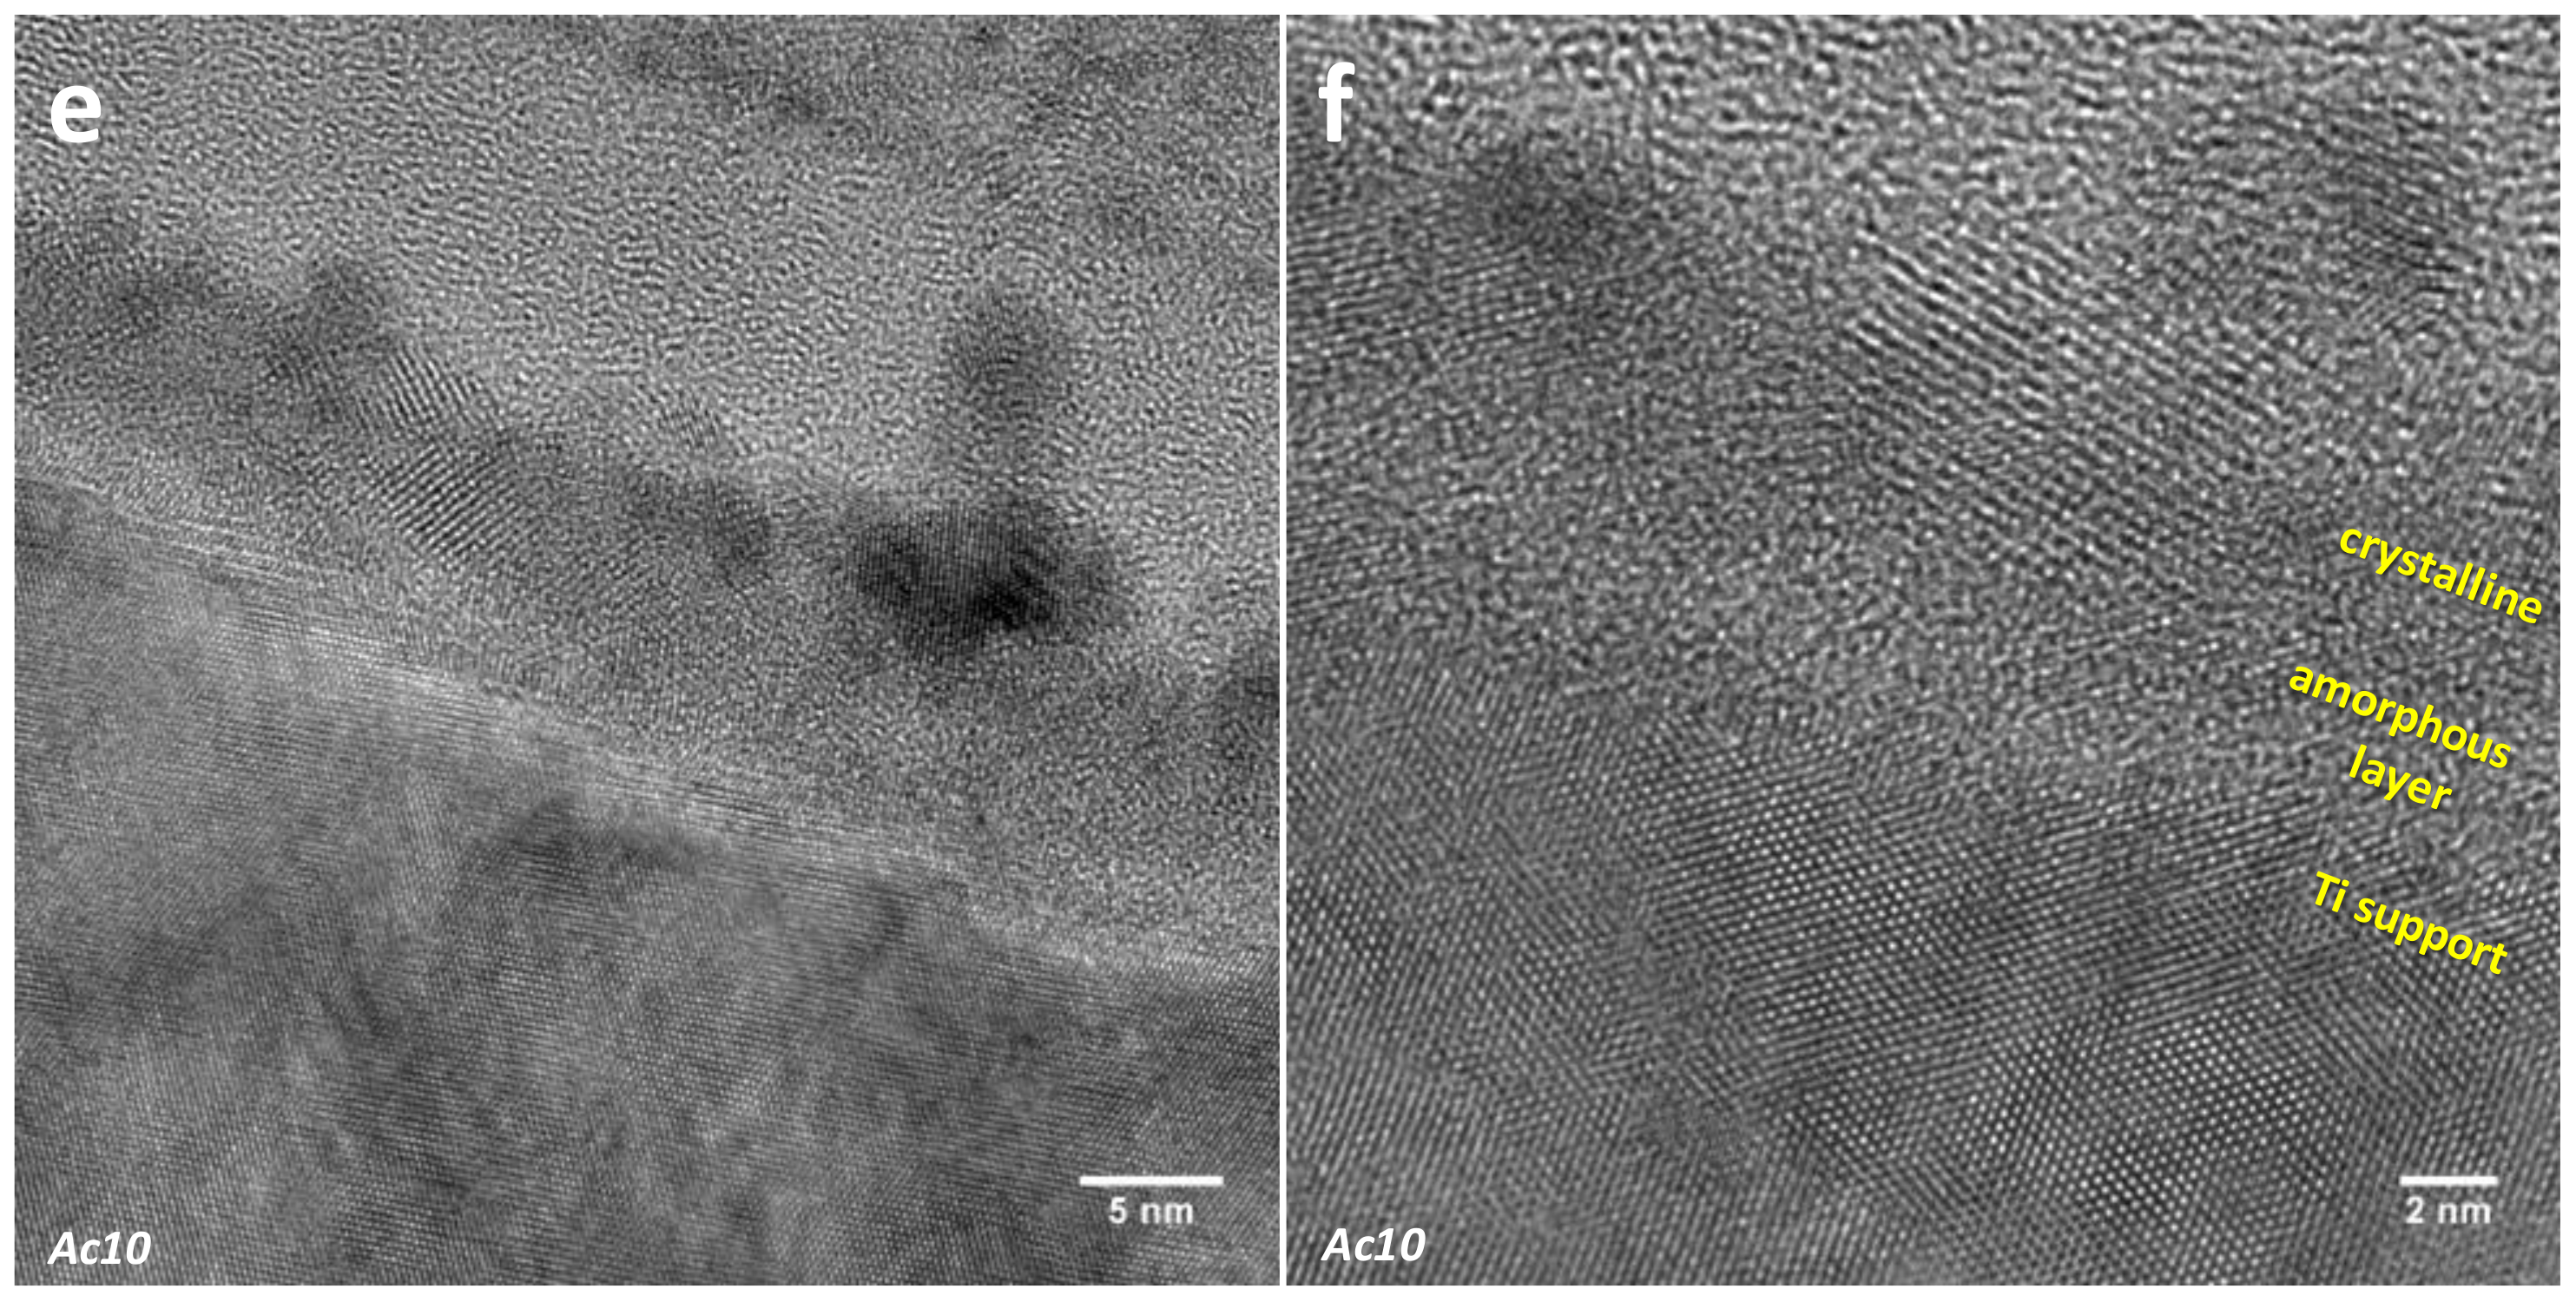
3.2.2. Selected Area Electron Diffraction (SAED)

To investigate the structure of the films at the nanoscale, selected area electron diffraction (SAED) was performed on the Ac_AP and Ox_AP catalyst films, as well as on the electrochemically treated Ac10_OER and Ox10_OER samples. The SAED patterns are given in Figure S4, and the corresponding calculated diffraction patterns (Cu Kα scale) are shown in Figure 3a–d and were made from dispersion of scraped off films. The reciprocal diffraction patterns were converted back into a diffraction pattern on the Cu scale.
For the calcined IrOx film (prior to any reductive treatment), the clear diffraction pattern reveals a rutile-type phase corresponding to IrO2 (Figure S5). According to SAED, after 10 min heating in the reducing atmosphere at 400 °C, the rutile-type reflections are replaced by a metallic Ir phase (Figure 3a), which is still present upon cycling into OER potential regions (Figure 3c). The same applies for the Ac10 catalyst, where the evaluation of the internal order of the catalyst films confirms no IrOx phase at several positions of Ac10, as well as Ac10_OER after polarization into OER potential regions. Accordingly, SAED evaluation conclusively confirms that all investigated films are consistently metallic and that the oxidation observed by XPS analysis (see Section 3.3.3) is limited to near-surface Ir. Furthermore, the morphology of the thin-films was selectively studied on a FIB-prepared TEM cross-section of an Ac10 sample. The resulting images are displayed in Figure 3e and 3f. After 10 min of heating in the reducing atmosphere, the catalyst film including the crystalline particles and the amorphous layer is about 10 nm thick. The high-resolution TEM (HRTEM) images reveal the presence of an amorphous interlayer between the crystalline Ti substrate and crystalline Ir particles. The particles, which are believed to be caused by cracking of the film, cover the amorphous layer unevenly. These particles have also been found in the TEM images of the scraped film (Figure S6).

3.3. Surface Electrochemical Characterization
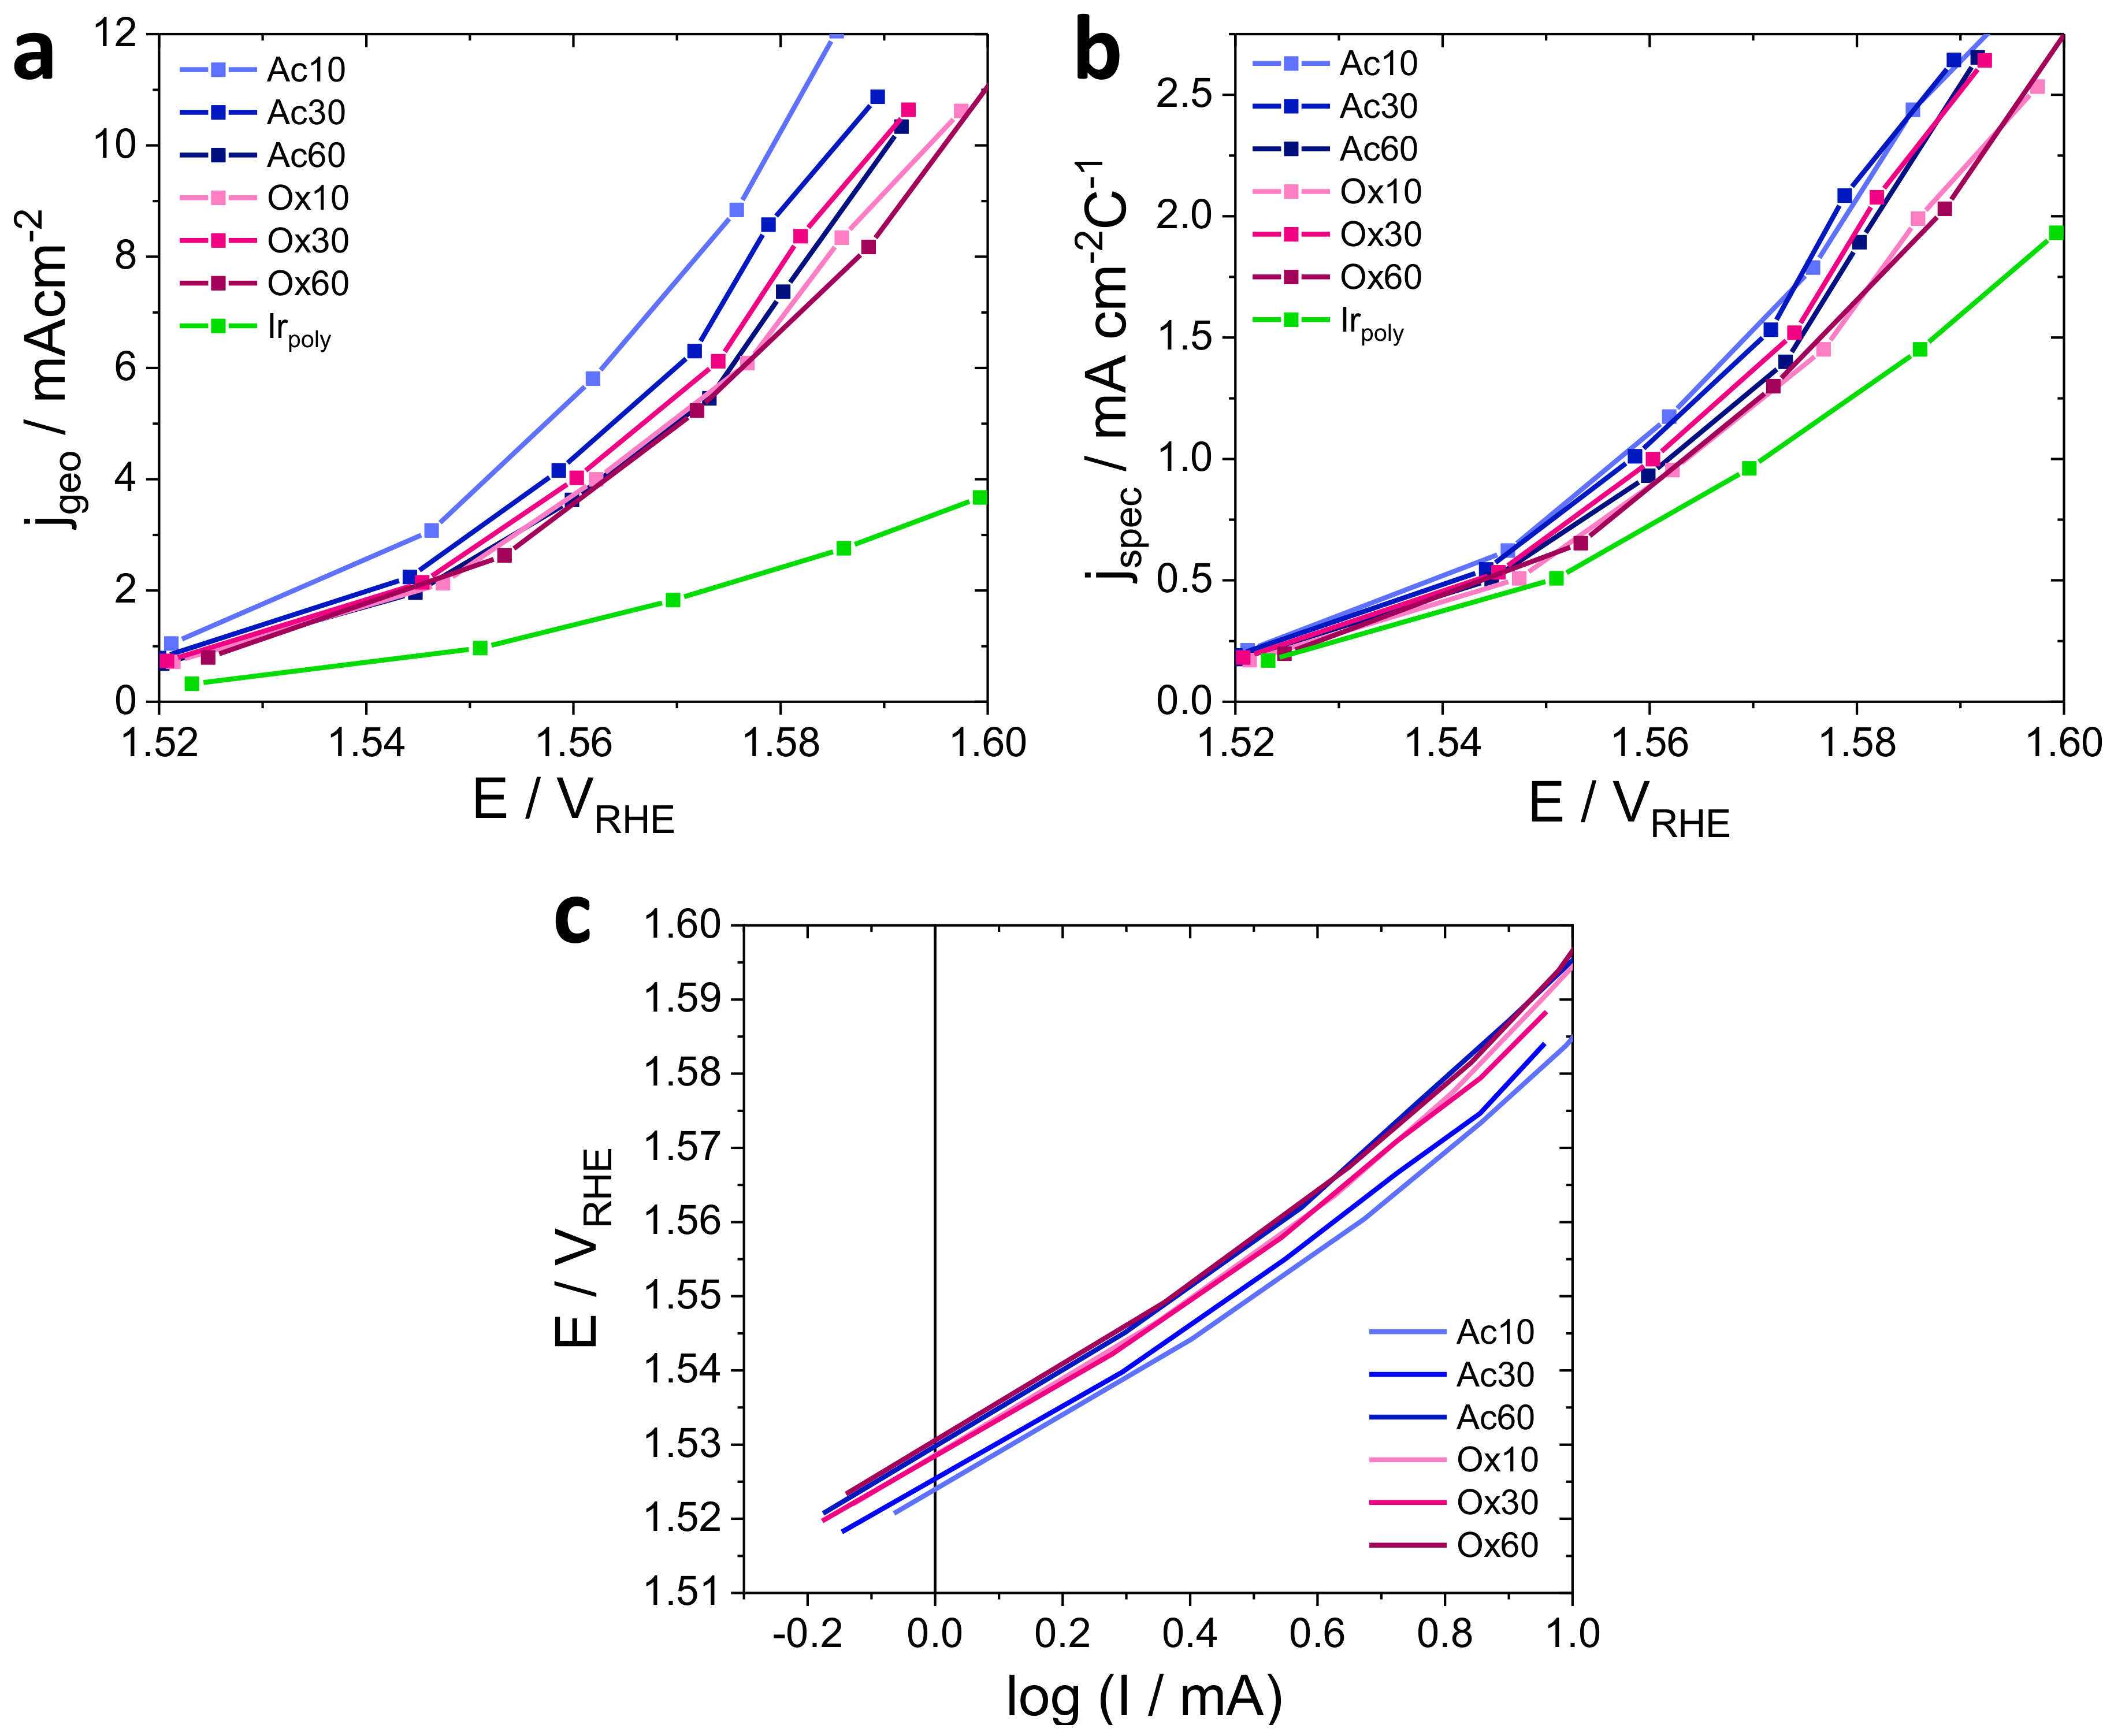
3.3.1. OER Activity

The electrochemical activity curves of the stepped potential voltammetry are depicted in Figure 4a. Ac and Ox samples show different electrochemical behaviors. A longer heating period of the Ac samples is accompanied with a slight decrease in the electrocatalytic activity. The distinct activities of the directly reduced films are likely the result of sintering or reorganization of the surface structure occurring during heating. The Ox samples, however, do not show remarkable differences between different heating times, which agrees with a stable morphology of the films observed by SEM (Figure 1, top row). This indicates the formation of a thermic stable structure, which is possibly benefited by the predefined structure of the former Ir oxide.
A comparison between the current density jgeo (Figure 4a) and the charge normalized current density jspec (Figure 4b) also supports the prediction of a sintering process on the Ac films; the charge normalized curves of the Ac films approach each other in comparison with the unnormalized current density, indicating a decrease of active surface area by sintering. Accordingly, the decrease in electrocatalytic activity with longer heating time mainly results from the smaller active surface area as a result of sintering. On the other hand, the charge normalization barely changes the relative position of the current density curves of the Ox films, which is further proof of the stable morphology of these films. Compared with polycrystalline bulk iridium (measured on a polished Ir cylinder), all films possess higher charge normalized current densities. The slightly non-linear/bend behavior of the Tafel plot (Figure 4c) and the loss of current density during each potential step of the SPV (Figure S7) is an interplay between the approach of the steady-state activity after a sudden potential step and the dissolution of the electrochemically obtained iridium oxides, as was evidenced by Cherevko et al. [16].

3.3.2. OER Stability

The stability performance was investigated by CA at approximately +1.734 VRHE in 0.05 M H2SO4; the results are shown in Figure S8. First, an abrupt drop of the current can be observed, assumed to be an approach to steady-state after quick potential change. The current then decreases slowly and almost linearly, presumably associated with the dissolution of oxidic Ir. After about 3 h, the current becomes almost constant. There are two reasonable explanations for this behavior. Either an equilibrium of formation and dissolution of the active iridium oxide species (oxidation and dissolution rates are the same) is maintained, or a more stable active species is present on the catalyst surface, as was reported by Li et al. [17].
To examine the stability of the catalysts, EDX was measured on all samples, which have undergone electrochemical treatment including OER, stability testing, and Faraday efficiency. Here, a loss of roughly 50 % Ir is observed, with an accuracy deviation of 10 % at most. This behavior agrees with the already mentioned lack of stability of electrochemically oxidized iridium.

3.3.3. X-Ray Photoelectron Spectroscopy (XPS)

The changes in the surface chemical state of Ir after activation and oxidation were traced with X-ray photoelectron spectroscopy (Figure 5).
The Ir 4f XP spectra in Figure 5a of the as-prepared Ac10 and Ox10 samples confirmed the presence of only metallic Ir in the XPS accessible area, indicating that the applied annealing step in H2 is sufficient to reduce Ir on the surface to its metallic state. After the electrochemical treatments, the Ir 4f core-level spectra shifted to higher binding energy as a result of the formation of surface Ir oxide. The line shapes of the Ir 4f signals differ significantly depending on the potential range. Fits of the Ir 4f spectra revealed three different Ir species presented in these samples: metallic Ir0, IrIV, and IrIII species. The Ir species with a binding energy located at ~0.6 eV higher than that of the IrIV species was assigned as IrIII in this work, although the true origin of this component (IrIII or IrV) is still a controversy [14,18]. However, it is unlikely that IrV can exist in an Ir simple oxide under ex situ conditions.
After cycling in the potential range of 0.05–1.4 VRHE, both Ac10 and Ox10 films were oxidized to a major extent; however, there is still discernible contribution of metallic Ir to the line shapes. On closer inspection, the Ir4f XP spectra of both films differ in the IrIII/IrIV species ratio, highlighting different oxidation behaviors. The Ac10_CV sample shows a higher IrIII/IrIV ratio than the Ox10_CV sample, which might be the origin of its higher OER activity. In previous studies by Pfeifer et al. [14,19], electronic defects in the form of O 2p holes (OI- species) were identified in amorphous IrOx. These highly electrophilic OI- species are created by iridium vacancies in the IrOx framework and possess a great activity in catalyzing the OER. The formation of these species is in turn accompanied by the reduction of neighboring IrIV to IrIII species, which appear at an Ir 4f7/2 binding energy of ~0.6 eV higher than that of the IrIV species, according to their density functional theory calculations. Drawing upon these findings, the enhanced activity of the Ac10 catalyst may be deduced to coordination defects in the amorphous morphology facilitating the O-O formation in the OER [19].
Upon exposing the catalysts to higher OER potentials (Ac10_OER and Ox10_OER), the metallic components diminished significantly to below 3 %. Two major oxidic components contribute to the Ir 4f spectrum. The IrIII component in the Ac10_OER sample is now much higher compared with that of Ox10_OER, indicating that the dominant species is IrIII. The higher specific OER activity based on charge normalization gives reason to believe that the OI- species are present to a higher concentration on the Ac films. The difference in oxidation behavior of the Ac10 and Ox10 samples is plausibly explained by the difference in the morphology of the as-prepared metallic samples, as discussed previously. The Ac10 film with a highly cracked, sponge-like morphology is prone to defect formation during electrochemical treatment, in contrast to the Ox10 film with a smoother surface and more defined structure, as the starting point of the Ox film series is a rutile phase with Ir in the oxidation state +4.
The O 1s spectra in Figure 5b of the Ac catalysts prior to and after OER testing revealed three different oxygen species, which can be assigned to adsorbed water (~533.1 eV), lattice oxygen (~530.1 eV), and hydroxyl groups (~531.5 eV). All samples are distinguished by a high surface hydroxyl group and very small lattice oxygen contents, typical for electrochemically grown iridium oxide [20]. The O 1s XP spectra indicate that the oxide layers in the electrochemically treated samples are largely amorphous, which explains the absence of any crystalline IrOx phase in the SAED of these samples, as discussed earlier.

4. Conclusions

In the study of the morphology, structure, and catalytic activity of supported metallic Ir films, we presented the successful synthesis of metallic Ir thin-films on Ti substrate using two different synthesis approaches. It was found that the catalyst structure was significantly influenced by the synthesis routes. We emphasize that the choice of the synthesis route to the initial metallic Ir strongly affects the performance of the subsequent electrochemically obtained Ir oxide. Further, these catalytic films exhibited an enhanced stability and activity in the OER compared with the surface of a polished, massive polycrystalline Ir cylinder.
Regardless of the heating time, the Ox route consistently resulted in the identical structure, creating a system insensitive against fluctuations in synthesis parameters. The Ox route might thus also be conducted in a common tube furnace, with a less sharp heating window (heating-up and cool down). In contrast, SEM and TEM revealed that the morphology of the Ir films synthesized over the Ac route exhibited a significant sensitivity towards the heating treatment. The application of a sharp inductive heating accompanied by a defined heating time thus enables one to control the progress of morphological restructuring, like sintering processes. These distinctive morphological properties were found to have a strong effect on the catalytic properties. A slight decrease of the OER activity with increasing heating period was observed. The difference between the catalytic properties of both catalyst types is reduced, as the Ac films approach the Ox samples with a longer heating time. Although this effect is not observable in the given scale of the morphology analysis, it cannot be excluded that structural similarities occur on a smaller scale. As expected, a complete oxidation of surface near Ir occurs during OER, while the majority of the film stays in its metallic state.
In the search for cost-effective materials catalyzing the OER, modifications of Ir with metallic additives are under broad investigation. On the basis of our results, we propose the Ox route as a promising synthesis approach for such bimetallic catalysts, as the final surface structure of the resulting products is quickly formed and is tolerant to different heating periods.

Supplementary Materials

The following are available online at https://www.mdpi.com/2571-9637/1/1/12/s1.

Author Contributions

Conceptualization, E.Ö. and Z.P.; methodology, E.Ö and Z.P.; validation, E.Ö, Z.P., and P.S.; formal analysis, E.Ö., Z.P., S.K., B.P., C.S., and S.S.; investigation, E.Ö., Z.P., S.K., H.N.N, B.P., S.S., and C.S.; resources, P.S., S.S., and C.B.; data curation, E.Ö, B.P, and S.K.; writing—original draft preparation, E.Ö. and Z.P.; writing—review and editing, E.Ö., Z.P., S.K., H.N.N, and C.S.; visualization, E.Ö. and Z.P.; supervision, P.S.; project administration, E.Ö., Z.P., B.P., and P.S.

Funding

This research was funded by Deutsche Forschungsgemeinschaft, grant number SPP1613.

Acknowledgments

We thank the Fritz-Haber-Institut of the Max-Planck-Gesellschaft for access to XPS and ZELMI for access to TEM/SAED and the focused ion beam preparation of a cross-section lamella.

Conflicts of Interest

The authors declare no conflict of interest. The funders had no role in the design of the study; in the collection, analyses, or interpretation of data; in the writing of the manuscript; or in the decision to publish the results.

References

  1. Singh, S.; Jain, S.; Ps, V.; Tiwari, A.K.; Nouni, M.R.; Pandey, J.K.; Goel, S. Hydrogen: A sustainable fuel for future of the transport sector. Renew. Sust. Energ. Rev. 2015, 51, 623–633. [Google Scholar] [CrossRef]
  2. Carmo, M.; Fritz, D.L.; Mergel, J.; Stolten, D. A comprehensive review on PEM water electrolysis. Int. J. Hydrogen Energ. 2013, 38, 4901–4934. [Google Scholar] [CrossRef]
  3. McCrory, C.C.L.; Jung, S.; Peters, J.C.; Jaramillo, T.F. Benchmarking heterogeneous electrocatalysts for the oxygen evolution reaction. J. Am. Chem. Soc. 2013, 135, 16977–16987. [Google Scholar] [CrossRef] [PubMed]
  4. Cherevko, S.; Reier, T.; Zeradjanin, A.R.; Pawolek, Z.; Strasser, P.; Mayrhofer, K.J.J. Stability of nanostructured iridium oxide electrocatalysts during oxygen evolution reaction in acidic environment. Electrochem. Comm. 2014, 48, 81–85. [Google Scholar] [CrossRef] [Green Version]
  5. Reier, T.; Oezaslan, M.; Strasser, P. Electrocatalytic Oxygen Evolution Reaction (OER) on Ru, Ir, and Pt Catalysts: A Comparative Study of Nanoparticles and Bulk Materials. ACS Catal. 2012, 2, 1765–1772. [Google Scholar] [CrossRef]
  6. De Oliveira-Sousa, A.; da Silva, M.A.S.; Machado, S.A.S.; Avaca, L.A.; de Lima-Neto, P. Influence of the preparation method on the morphological and electrochemical properties of Ti/IrO2-coated electrodes. Electrochim. Acta 2000, 45, 4467–4473. [Google Scholar] [CrossRef]
  7. Danilovic, N.; Subbaraman, R.; Chang, K.-C.; Chang, S.H.; Kang, Y.J.; Snyder, J.; Paulikas, A.P.; Strmcnik, D.; Kim, Y.-T.; Myers, D.; et al. Activity-Stability Trends for the Oxygen Evolution Reaction on Monometallic Oxides in Acidic Environments. J. Phys. Chem. Lett. 2014, 5, 2474–2478. [Google Scholar] [CrossRef] [PubMed]
  8. Cherevko, S.; Geiger, S.; Kasian, O.; Mingers, A.; Mayrhofer, K.J.J. Oxygen evolution activity and stability of iridium in acidic media. Part 2.—Electrochemically grown hydrous iridium oxide. J. Electroanal. Chem. 2016, 774, 102–110. [Google Scholar]
  9. Bandarenka, A.S.; Koper, M.T.M. Structural and electronic effects in heterogeneous electrocatalysis: Toward a rational design of electrocatalysts. J. Catal. 2013, 308, 11–22. [Google Scholar] [CrossRef]
  10. Reier, T.; Teschner, D.; Lunkenbein, T.; Bergmann, A.; Selve, S.; Kraehnert, R.; Schlögl, R.; Strasser, P. Electrocatalytic Oxygen Evolution on Iridium Oxide: Uncovering Catalyst-Substrate Interactions and Active Iridium Oxide Species. J. Electrochem. Soc. 2014, 161, F876–F882. [Google Scholar] [CrossRef] [Green Version]
  11. Özer, E.; Paul, B.; Spöri, C.; Strasser, P. Coupled Inductive Annealing-Electrochemical Setup for Controlled Preparation and Characterization of Alloy Crystal Surface Electrodes. Small Methods 2018, 0, 1800232. [Google Scholar] [CrossRef]
  12. Gammer, C.; Mangler, C.; Rentenberger, C.; Karnthaler, H.P. Quantitative local profile analysis of nanomaterials by electron diffraction. Scripta Mater. 2010, 63, 312–315. [Google Scholar] [CrossRef]
  13. PASAD. Available online: http://www.univie.ac.at/pasad/ (accessed on 18 May 2018).
  14. Pfeifer, V.; Jones, T.E.; Velasco Velez, J.J.; Massue, C.; Greiner, M.T.; Arrigo, R.; Teschner, D.; Girgsdies, F.; Scherzer, M.; Allan, J.; et al. The electronic structure of iridium oxide electrodes active in water splitting. Phys. Chem. Chem. Phys. 2016, 18, 2292–2296. [Google Scholar] [CrossRef] [PubMed] [Green Version]
  15. Reier, T.; Pawolek, Z.; Cherevko, S.; Bruns, M.; Jones, T.; Teschner, D.; Selve, S.; Bergmann, A.; Nong, H.N.; Schlögl, R.; et al. Molecular Insight in Structure and Activity of Highly Efficient, Low-Ir Ir–Ni Oxide Catalysts for Electrochemical Water Splitting (OER). J. Am. Chem. Soc. 2015, 137, 13031–13040. [Google Scholar] [CrossRef] [PubMed]
  16. Cherevko, S.; Geiger, S.; Kasian, O.; Mingers, A.; Mayrhofer, K.J.J. Oxygen evolution activity and stability of iridium in acidic media. Part 1.—Metallic iridium. J. Electroanal. Chem. 2016, 773, 69–78. [Google Scholar] [CrossRef]
  17. Li, T.; Kasian, O.; Cherevko, S.; Zhang, S.; Geiger, S.; Scheu, C.; Felfer, P.; Raabe, D.; Gault, B.; Mayrhofer, K.J.J. Atomic-scale insights into surface species of electrocatalysts in three dimensions. Nat. Catal. 2018, 1, 300–305. [Google Scholar] [CrossRef]
  18. Sanchez Casalongue, H.G.; Ng, M.L.; Kaya, S.; Friebel, D.; Ogasawara, H.; Nilsson, A. In situ observation of surface species on iridium oxide nanoparticles during the oxygen evolution reaction. Angew. Chem. Int. Ed. 2014, 53, 7169–7172. [Google Scholar] [CrossRef] [PubMed] [Green Version]
  19. Pfeifer, V.; Jones, T.E.; Velasco Vélez, J.J.; Arrigo, R.; Piccinin, S.; Hävecker, M.; Knop-Gericke, A.; Schlögl, R. In situ observation of reactive oxygen species forming on oxygen-evolving iridium surface. Chem. Sci. 2017, 8, 2143–2249. [Google Scholar] [CrossRef] [PubMed]
  20. Saveleva, V.A.; Wang, L.; Teschner, D.; Jones, T.; Gago, A.S.; Friedrich, K.A.; Zafeiratos, S.; Schlögl, R.; Savinova, E.R. Operando Evidence for a Universal Oxygen Evolution Mechanism on Thermal and Electrochemical Iridium Oxides. J. Phys. Chem. Lett. 2018, 9, 3154–3160. [Google Scholar] [CrossRef] [PubMed]
Figure 1. Scanning electron microscopy (SEM) images of Ox (top) and Ac (bottom) film series before (_AP, second and third row) and after oxygen evolution reaction (OER) (_OER, first and fourth row). The cracks in the Ac films enlarge with increasing heating time. The weakly cracked morphology of the Ox films does not show any change depending on the reductive heating time.
Surfaces 01 00012 g001
Figure 2. Counts per charge of the three main elements detected in energy-dispersive X-ray spectroscopy measurements (EDX) of (a) IrOx and (b) Ox10_AP. The different intensities are caused by different film thicknesses, mainly due to border effects during spin coating.
Surfaces 01 00012 g002
Figure 3. (ad) Diffraction patterns evaluated from selected area electron diffraction (SAED) patterns (Figure S4) of Ox10 (a and c) and Ac10 films (b and d) before (_AP; a and b) and after electrochemical OER protocol (_OER; c and d). The patterns only show metallic Ir. (e,f) TEM cross-section of Ac10_AP film shows crystalline Ir particles on an amorphous interlayer.
Surfaces 01 00012 g003aSurfaces 01 00012 g003b
Figure 4. Electrochemical OER activity curves of Ac and Ox films obtained by stepped potential voltammetry. (a) Geometrical current densities in 0.05 M H2SO4. The shorter heated Ac films exhibit a slightly higher activity compared with the Ox films and longer heated Ac films. (b) Specific current density in 0.05 M H2SO4 based on the anodic charge obtained from the last scan (between 0.4 and 1.4 VRHE) before SPV. Because of charge normalization, the activities of the Ac films no longer differ significantly from each other. The relation of the Ox films’ activities to each other is not affected. (c) Tafel plot of the _OER films extrapolated from the stepped potential voltammetry (SPV) measurements.
Surfaces 01 00012 g004
Figure 5. X-ray photoelectron spectroscopy of the Ac10 and Ox10 films at as-prepared states (_AP), after cyclic voltammetry between 0.05–1.4 VRHE (_CV) and OER activity testing (_OER) with fitted components of (a) Ir 4f and (b) O 1s species. The as-prepared samples only show metallic Ir (Ir0). Through potential cycling, the major part of metallic Ir was oxidized to IrIII and IrIV. After stepped potential voltammetry with potentials up to 1.60 VRHE, almost no Ir0 is left and the ratio of IrIII to IrIV is increased.
Surfaces 01 00012 g005

