Article

Probabilistic Projections of South Korea’s Population Decline and Subnational Dynamics

Texas Demographic Center, The University of Texas, San Antonio, TX 78249, USA
Forecasting 2025, 7(3), 40; https://doi.org/10.3390/forecast7030040
Submission received: 2 June 2025 / Revised: 10 July 2025 / Accepted: 11 July 2025 / Published: 22 July 2025

Abstract

This study adapts the United Nations’ methodology for national probabilistic population projections to subnational contexts. The Bayesian approach used by the UN addresses data collection complexities effectively. By applying hierarchical model assumptions, national projections can be extended to subnational levels. There is a significant demand for subnational projections with uncertainty measures, especially in South Korea, where low fertility rates have led to rapid population decline, impacting economic and social conditions. The Bayesian hierarchical model predicts South Korea’s population will peak in 2024 and then decline sharply, potentially reaching 30 million by 2100 or below 20 million in lower projections. Seoul’s population may reduce to one-third of its 2020 size by 2100. Persistently low fertility rates result in a high dependency ratio and accelerated aging, particularly in Seoul and Gyeonggi-do. Although old-age dependency ratios might improve slightly by 2100, economic challenges such as reduced purchasing power and socio-economic strain from an aging population and declining fertility remain significant. A probabilistic approach can enhance resource allocation strategies to support the aging population at both national and subnational levels.

1. Introduction

The cohort-component method (CCM) was first introduced by Cannan in 1895 [1]; it was then used by Bowley in 1924 [2] and, later, independently rediscovered by Whelpton in 1928 [3]. It remains the most widely adopted method for generating population projections. The CCM, originally designed for current population estimates, can also be applied to future projections [4]. Although the CCM is a scientific approach to predicting future populations, it has faced criticism for lacking a probabilistic foundation and producing implausible results across different geographic areas or time periods [5].
The United Nations (UN) stands out as the primary organization that regularly produces national population projections by age and sex for all countries [6]. Since 2015, these projections have generally been updated every two years in the World Population Prospects (WPP) reports. The most recent update was released in 2024 [7]. The UN’s official projections have been probabilistic since 2014, employing Bayesian hierarchical models (BHMs) for fertility and mortality [7,8,9,10].
The application of BHMs to subnational or small-area demographic estimation initially focused on core demographic indicators such as life expectancy in the United Kingdom and later expanded to include mortality and life table estimation for smaller geographic units [11,12,13,14]. More recently, BHM approaches have been employed to estimate internal migration rates at the small-area level in countries such as New Zealand and Iceland [15,16].
In addition to these developments, a limited number of studies have addressed the use of probabilistic methods to quantify forecast uncertainty for local and small-area populations. Prior to the adoption of BHMs, Lee and Carter [17] introduced a time series-based approach to forecasting life expectancy and life table functions using a random walk with drift. Building on this foundation, Cameron and Poot [18] developed a probabilistic cohort-component model to forecast district-level populations in New Zealand. Similarly, Wilson et al. [19] constructed empirical prediction intervals for total population forecasts based on an evaluation of 30 years of local-area population projections in Australia.
The three key components of the United Nations’ probabilistic population projections are grounded in BHMs that have been meticulously adapted to function effectively at the national level [20]. However, the applicability of these national models to subnational or small-area settings presents significant challenges, such as missing data and measurement errors. Despite several recent studies concentrating on forecasting the total fertility rate (TFR), life expectancy at birth (e0), and net migration rates (NMR) [20,21,22], there remains a significant need for subnational projections. For instance, in the United States, state- and county-level projections are crucial for local government planning, private sector decision-making, and health and social science research focused on subnational variation and inequality [19,23,24]. Furthermore, there is an increasing interest in subnational projections at the international level [25].
While numerous applied demographers have developed methods for small area population projections beyond the cohort-component method (CCM) [23,24], there have been relatively few endeavors focused on subnational probabilistic projections [25,26,27]. This study aims to adapt the United Nations’ methodology for national probabilistic population projections to the subnational context. The existing literature underscores an increasing demand for subnational population projections that incorporate uncertainty bounds. However, generating such projections is inherently complex, necessitating substantial expertise, contextual understanding, and tailored data. These requirements render the production of probabilistic subnational projections particularly challenging [25].
The United Nations’ Bayesian methodologies offer several advantages in addressing the complexities and challenges associated with data collection. The BHM generates uncertainty through probability intervals (PI) for any demographic outcome of interest, which are statistically calibrated if the model is accurate (e.g., 95% intervals encompass 95% of the possibilities). The BHM employs Markov Chain Monte Carlo (MCMC) techniques, which can be implemented, even for relatively large and complex models, more easily than non-Bayesian alternatives, such as maximum likelihood estimation [28]. Additionally, the BHM automatically incorporates information from other countries when producing estimates for a country of interest, which is particularly beneficial when the data quality for the country of interest is poor or missing [29]. Under the hierarchical model’s assumptions, population projections can be extended from the United Nations’ national probabilistic projections to subnational levels. This adaptation involves applying the international framework by treating a country as the “world” and subnational levels as “countries” within the UN probabilistic model. However, the subnational context presents distinct characteristics compared to the national context [25].
Utilizing the cohort-component method (CCM) and Bayesian hierarchical model (BHM), numerous studies have addressed probabilistic projections by decomposing each population component for subnational projections. Methods for the probabilistic subnational projections of each component have been developed for individual countries or regions [30,31,32,33,34,35,36]. For the subnational projection, TFR trajectories at the subnational level using BHMs have been conducted among 49 UN countries [22]. Additionally, mortality rates and life expectancy at the subnational level using BHMs have been studied across 29 countries and 447 subregions [20].
Firstly, correlations in fertility and mortality between subnational areas are generally much higher than those between countries [20]. Secondly, while international migration is globally balanced to net zero, subnational migration does not follow this constraint [37]. Thirdly, the demographic composition of subnational populations, such as sex and age distributions, significantly influences geographic planning for facilities like schools and military barracks [38]. Lastly, some subnational areas have such small populations that stochastic variations in vital events, often overlooked in population projections, can substantially affect the population forecast for those areas [23].
To address these complex challenges, this study employs a probabilistic approach to the subnational population projections. Fertility projections are modeled using the subnational TFR method described by Ševčíková et al. [22], while the subnational mortality projections utilize the technique developed by Ševčíková and Raftery [20]. For probabilistic migration projections at the subnational level, the methodology of Azose et al. [37] is implemented to circumvent the sum-to-zero constraint. Additionally, the R package 4.2.3 ‘bayesPop’ is employed to execute the subnational probabilistic cohort-component method, as outlined by Yu et al. [25].
Finally, we performed two validity assessments utilizing the same models by comparing projected and observed population data at both national and subnational levels. The first validation test involved comparing the 2015 population projections generated by our model with the actual population changes observed in South Korea at the subnational level from 2015 to 2020. The second validation entails comparing our population projections for the period from 2020 to 2070 with the official population projections issued by the Korean government’s official statistical institute (KOSIS) at the national level, which covers the same period from 2020 to 2070.
This paper is structured as follows: First, we provide a brief introduction to the subnational regions of Korea and their demographic characteristics. Next, we describe the two data sources utilized and outline the Bayesian hierarchical model (BHM) probabilistic method employed. Subsequently, we present our projection trajectories at both the national and subnational levels and validation tests. Finally, the paper concludes with a discussion.

2. Korea and Subnational Context

The population of South Korea experienced rapid growth due to two significant baby booms in the 1950s and 1970s. However, declining fertility rates over the past two decades have led to a population peak of 51.7 million in 2024, followed by a subsequent decline, with projections indicating a rapid decrease (KOSIS). The primary factor driving this population peak is the country’s extremely low total fertility rate (TFR) and the resulting natural demographic changes [39]. International net migration remains relatively minor, accounting for approximately 0.2% of the total population. Nonetheless, there is a notable pattern of domestic migration, with regions outside the metropolitan areas surrounding Seoul experiencing population outflows to the capital and its metropolitan area (KOSIS).
The subnational regions of South Korea examined in this study comprise eight major cities and eight provinces, amounting to a total of 17 subnational areas (Figure 1).
The first area, Seoul, is the capital city, with a population of approximately 10 million people. The eighth area, Gyeonggi Province (“do” in Korean), has an estimated population of 13.5 million people. Together, the populations of areas 1, 4, and 8—representing the most densely populated regions in South Korea—account for nearly half of the country’s total population of 51.8 million. Over the past five decades, these three metropolitan regions have experienced significant domestic in-migration due to urbanization and the concentration of job opportunities, while populations in other areas have declined as residents have relocated to these metropolitan centers (KOSIS).
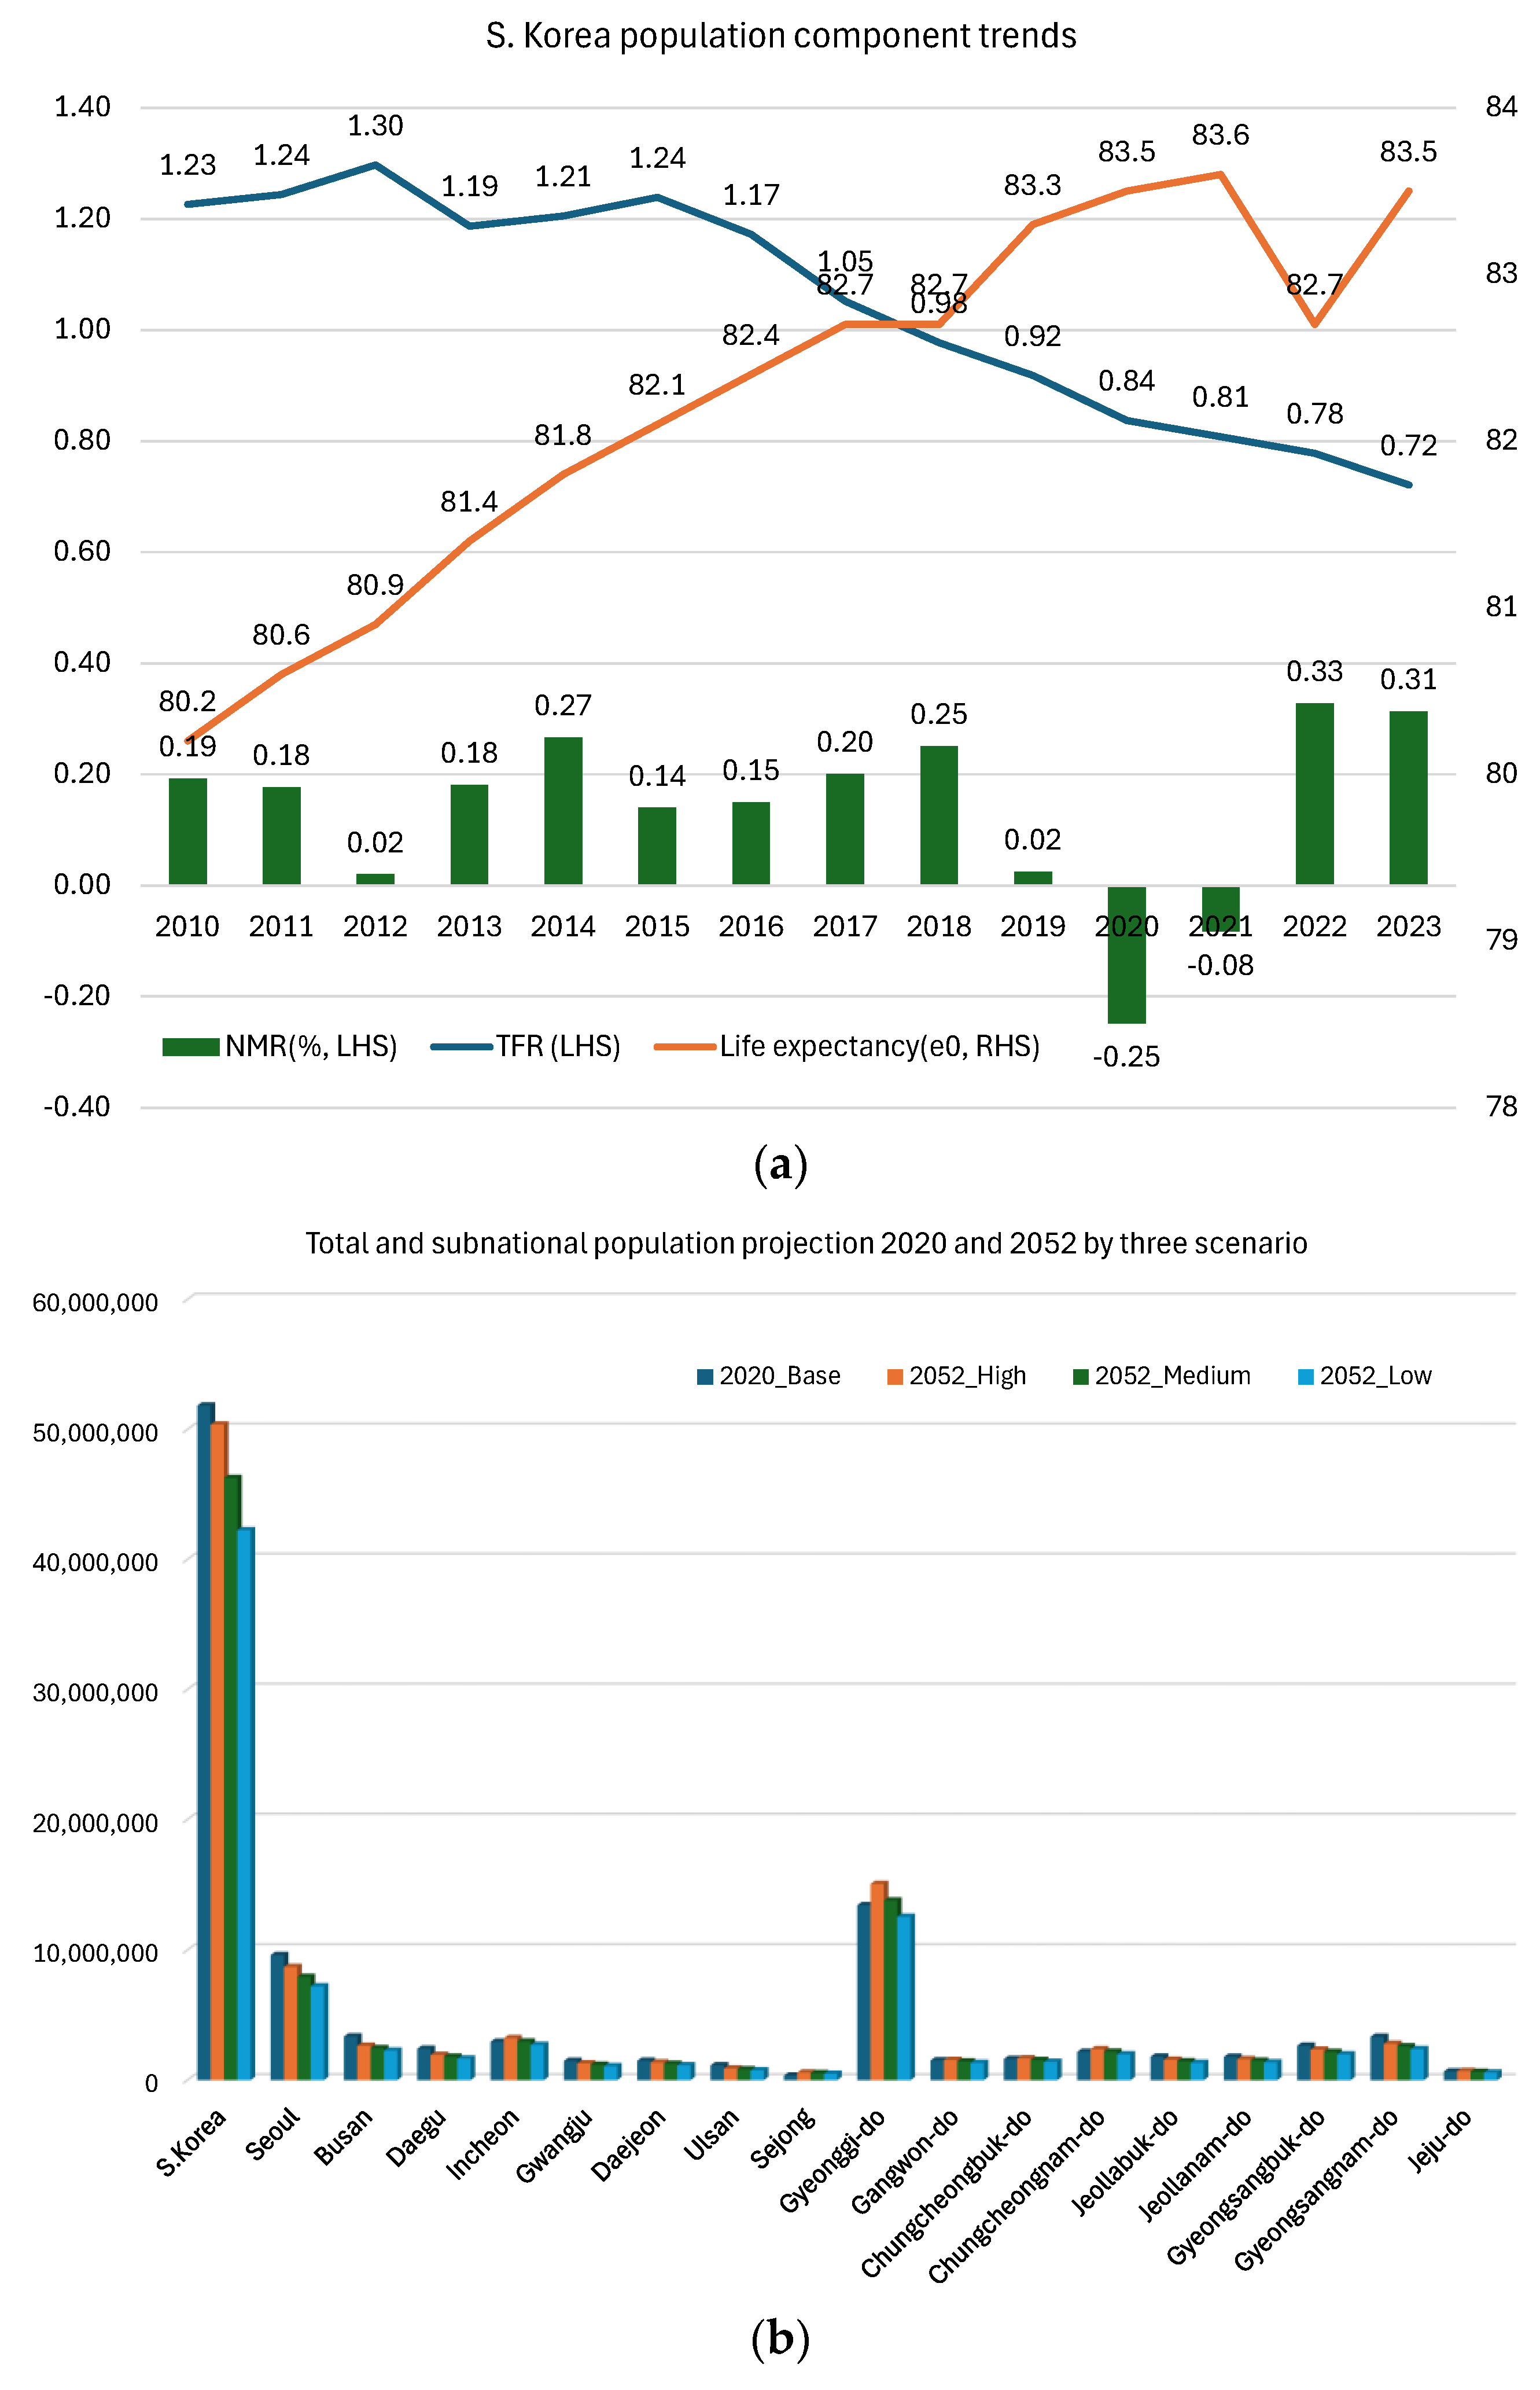
Among the three demographic components, the total fertility rate (TFR) emerges as the most significant determinant in projecting South Korea’s population trends. The national TFR has shown a consistent decline, decreasing from 1.30 to 0.72 children per woman within the recent decade (Figure 2a). Conversely, life expectancy at birth (e0) increased from 80.2 to 83.5 years (Figure 2a). However, due to the spread of COVID-19 variants, there was an unexpected decline of 0.9 years in 2022 [41]. Over the past decade, net migration rates (%) in South Korea have had a relatively minor impact, remaining stable within the range of −0.25 to 0.33 percent of the total population (Figure 2).
The Statistical Information Service [42] has conducted population projections at the subnational level using scenario-based cohort component methods, extending to the year 2052. Figure 2b presents data for the base year, as well as high, medium, and low scenarios for the year 2052, encompassing the total population of South Korea and its 17 subnational areas. The projections indicate a general decline in the total population at the national level. Notably, Gyeonggi-do, the most populous subnational province, is anticipated to maintain its population even under the low growth scenario.

3. Data

The data for the subnational population projection are obtained from two main sources: the United Nations World Population Prospects and the Korean Statistical Information Service (KOSIS). These resources provide data at both the national and subnational levels. The subnational data covers 16 regions, comprising eight metropolitan cities, including Seoul, and eight provinces.
The national-level total fertility rate (TFR), life expectancy (e0), and migration data for South Korea can be extracted from the R package ‘wpp2022’ by the United Nations. This package provides historic national TFR, e0, and net migration rate (NMR) data since 1950. The national-level data and three trajectories can be obtained from the ‘wpp2022’ package.
KOSIS offers detailed demographic components for subnational regions, including fertility rates, life expectancy, and net migration data from 1997 to 2022. The TFR for subnational regions is calculated by summing the age-specific fertility rates (ASFR) for females aged 15 to 49 who gave birth in the previous year. Life expectancy (e0) data are also available from KOSIS for these subnational regions. Additionally, KOSIS provides net migration data, which combine both international and domestic migration for the same geographic levels, covering the period from 1997 to 2022.

4. Methods

4.1. Probabilistic Cohort-Component Method

The cohort-component method (CCM) represents the predominant methodology for population projection. This approach classifies the population at time t into age–sex groups and individually considers the fertility, mortality, and migration behavior of each cohort as it advances from the base year t to the projected date at time t + k [38].
To manage the inherent uncertainty in population forecasting, the United Nations has implemented a probabilistic Bayesian approach. This method utilizes the BHM to estimate future trends in total fertility rates and life expectancy, generating a wide range of potential outcomes through posterior predictive distributions. These projections are then integrated into the cohort-component method to derive probabilistic estimates of future population metrics [9]. Specifically, the process involves simulating 2000 trajectories for fertility rates and joint male-female life expectancy for each five-year interval from 2010 to 2100. These simulations are subsequently translated into age-specific fertility and sex- and age-specific mortality rates using standardized UN methodologies [28].
The UN population projections utilize Markov chain Monte Carlo (MCMC) methods. MCMC combines two key concepts: Monte Carlo sampling, which estimates distributional properties through random sampling, and the Markov chain process, where each sample depends only on the immediate previous one. This sequential dependency characterizes the Markov property. MCMC is especially valuable in Bayesian inference, as it enables approximation of complex posterior distributions that are analytically intractable, facilitating the estimation of quantities such as posterior means and random samples [43,44,45]. Each demographic component is modeled using a Bayesian hierarchical first-order autoregressive, or AR (1):
f c , t + 1 μ c = ρ c f c , t μ c + ε c , t ,    w i t h ε c , t N 0 , σ ε 2
This suggests that for each subnational area c, a demographic component is modeled with a long-term average μc and an autoregressive coefficient ρc, both of which are assumed to come from a broader, national-level distribution. The parameters of this national distribution themselves follow a joint prior, forming a three-tier hierarchical model. These tiers consist of the observed data, the subnational level, and the national (or higher) level. The entire model is estimated using MCMC methods.
To generate subnational probabilistic population projections, we initiate with the existing national-level projection, which employs Bayesian hierarchical models for the total fertility rate (TFR), life expectancy at birth, and net migration rate (NMR) for eight cities and eight provinces in South Korea [8,29,37,46]. Each projection model produces a sample of trajectories, with each trajectory signifying a potential future scenario for the respective demographic quantity [28].
Following the disaggregation of each trajectory into sex- and age-specific values, the cohort-component method is employed to derive a sample of sex- and age-specific population trajectories [20]. This sample is then utilized to obtain any predictive quantile of any demographic quantity of interest, such as its median or a specific probability interval.

4.2. Subnational TFR Projection

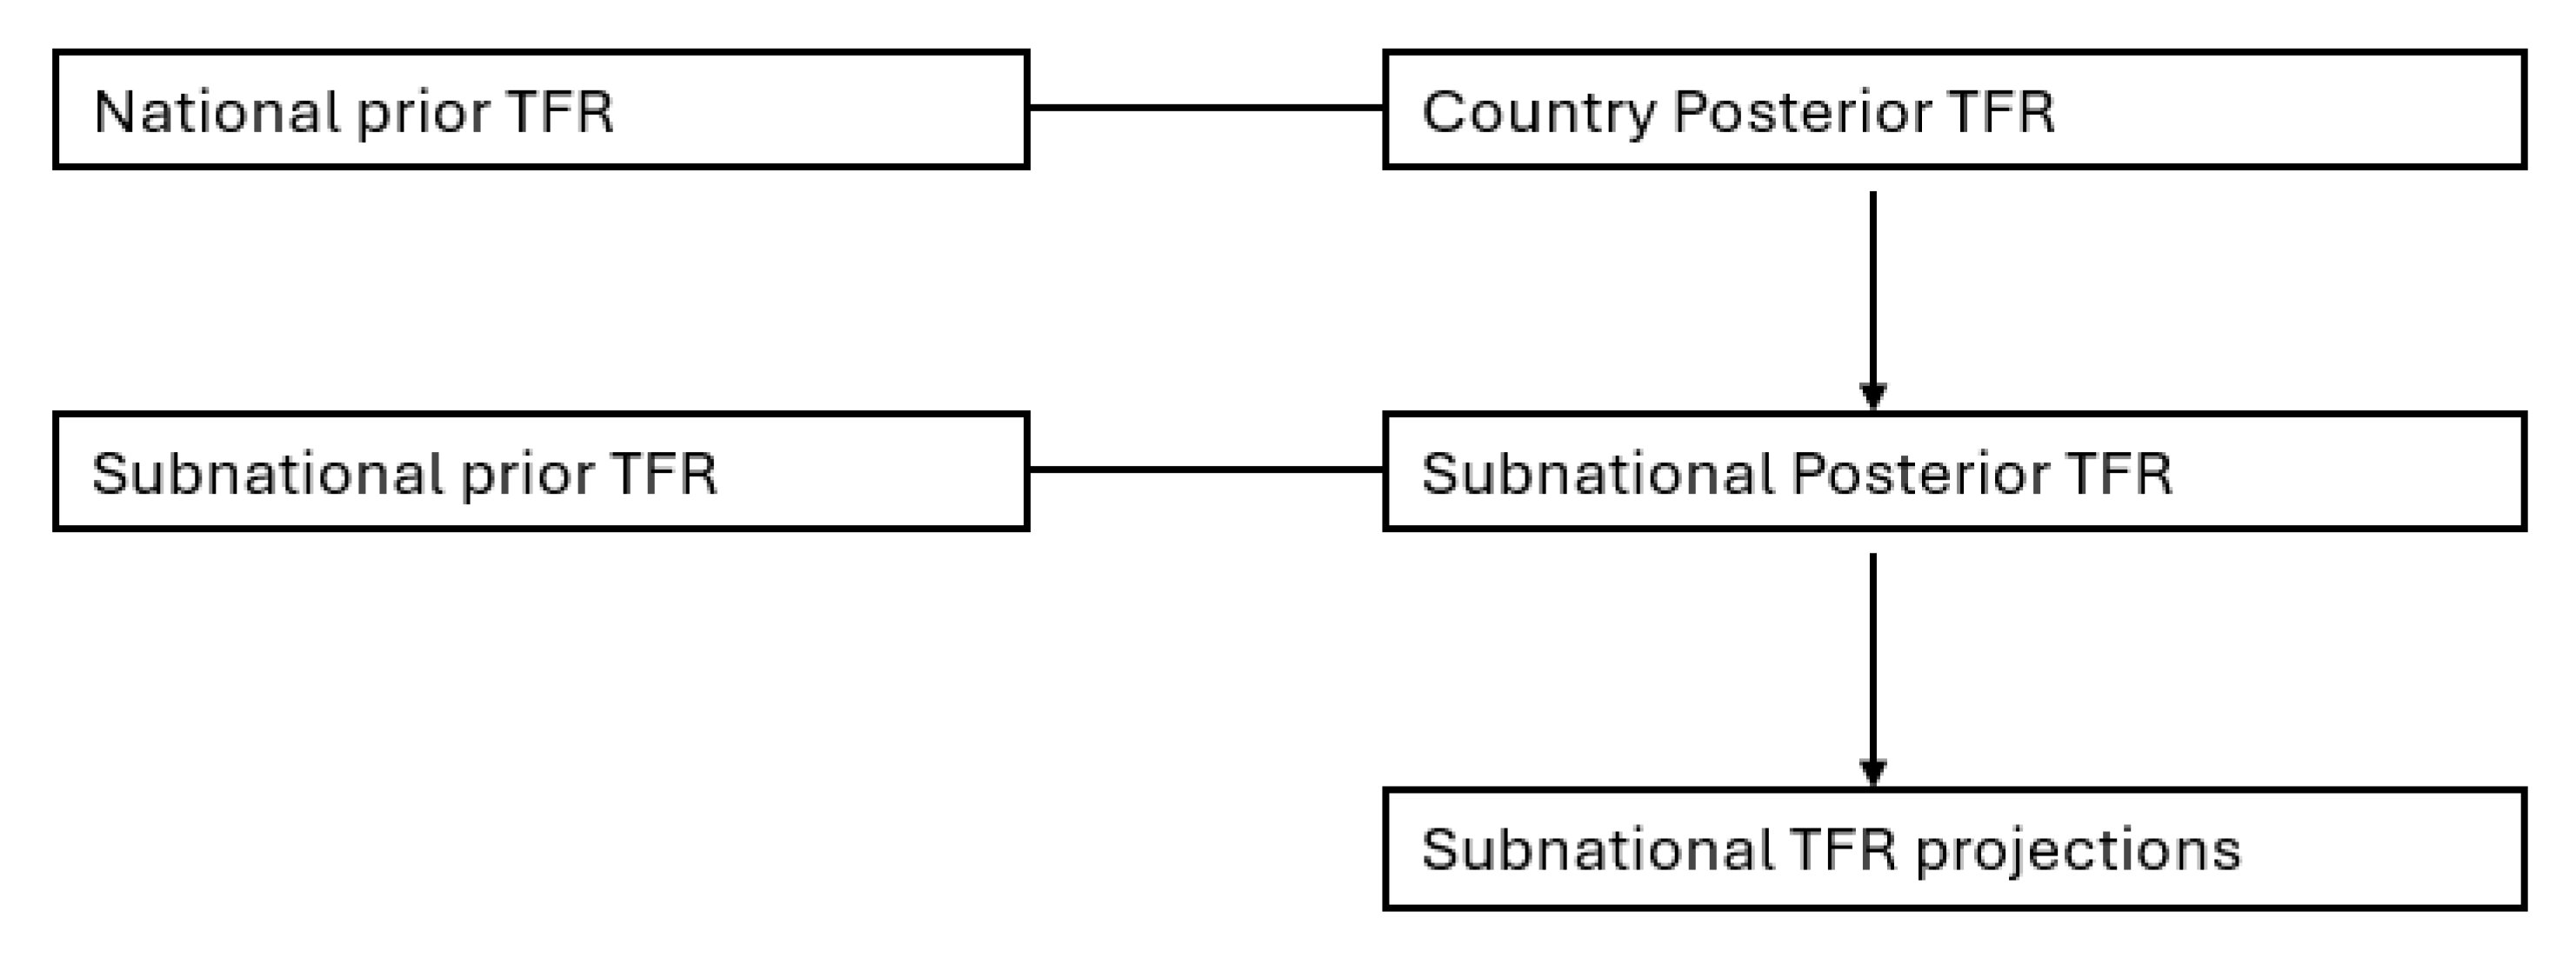
To generate subnational total fertility rate (TFR) trajectories for South Korea, national TFR trajectories are first derived using the R package ‘bayesTFR’ and ‘wpp2022’ (country code: 410). This process can be customized within the MCMC simulation, starting from 1980 and running for over 5000 iterations (Figure 3). For countries with extremely low fertility rates like South Korea, Phase III fertility trajectories are additionally simulated.
Utilizing Bayesian hierarchical models (BHMs), the subnational models extend the posterior distribution from the national-level prior distribution, weighted by observed area-specific data [47]. Probabilistic projections of TFR for subnational areas in South Korea are achieved by scaling the national projections with a time-varying region-specific scale factor. The R package ‘bayesTFR’ models this regional scale factor using a first-order autoregressive, or AR (1), process [22]. To generate subnational TFR trajectories for South Korea, the TFR data from 1997 to 2022 are applied within this BHM framework (KOSIS). The resulting subnational posterior distribution is then utilized to project the subnational TFR (Figure 3).

4.3. Subnational e0 Projection

To derive subnational life expectancy at birth (e0) trajectories for South Korea, national e0 trajectories must first be obtained using the R package ‘bayesLife’ and ‘wpp2022’ (country No. 410). Like subnational TFR, the national-level trajectories are simulated using a Markov chain Monte Carlo (MCMC) process starting from 1980 and running for approximately 5000 iterations. For e0, the ‘bayesLife’ package [20] is utilized, which predicts male e0 after determining female e0 trajectories and incorporating a female–male gap model [10]. Ultimately, the current subnational e0 trajectories are predicted based on the national simulation, assuming that subnational e0 predictions can be accurately derived by adjusting the national predictions using an AR (1) process [20].

4.4. Subnational NMR Projection

Initially, the R package ‘bayesMig’ [21] is employed to generate national-level net migration rate (NMR) trajectories for South Korea. Subsequently, historical NMR data from 1997 to 2022 are incorporated to derive subnational migration projection trajectories for the 17 subnational regions in South Korea. The subnational parameters reflect the long-term average of NMR and the rate of convergence to the long-term average for each subnational region [37].
Regarding the impact of immigration on South Korea’s population projection, it is relatively minor compared to natural population changes by births and deaths. Since 1980, the NMR for South Korea has fluctuated between approximately −0.005 to 0.01 persons per 1000 individuals (KOSIS). Additionally, domestic migration constitutes the primary migration pattern, historically aligning with the urbanization trend observed over recent decades. This trend ranges from approximately −0.001 to 0.118 persons per 1000 individuals from 1997 to 2022 among the 17 subnational regions (KOSIS). Consequently, the NMR has a relatively minor impact on overall population change and South Korea’s population projection.

4.5. Subnational Probabilistic Population Projection

The three subnational trajectories of total fertility rate (TFR), life expectancy at birth (e0), and migration are employed to estimate the future population using the cohort-component method within the R package ‘bayesPop.’ To execute this projection package and predict future subnational populations, we need to input 16 subnational geographic area lists, age- and sex-specific historical population data, and the migration patterns of the net migration rate (NMR) among the subnational areas as base year inputs. The previously generated trajectories for TFR, e0, and migration are then converted into sex- and age-specific rates [22,25].
In particular, to convert NMR trajectories, the bayesPop package applies a Rogers–Castro model migration schedule [25,37,46], which assigns more weight to migrants aged 20–40 and their children. Finally, bayesPop predicts a set of sex- and age-specific population trajectories over five-year intervals for each subnational area in South Korea, targeting specific future years.

5. Result

5.1. National Projection

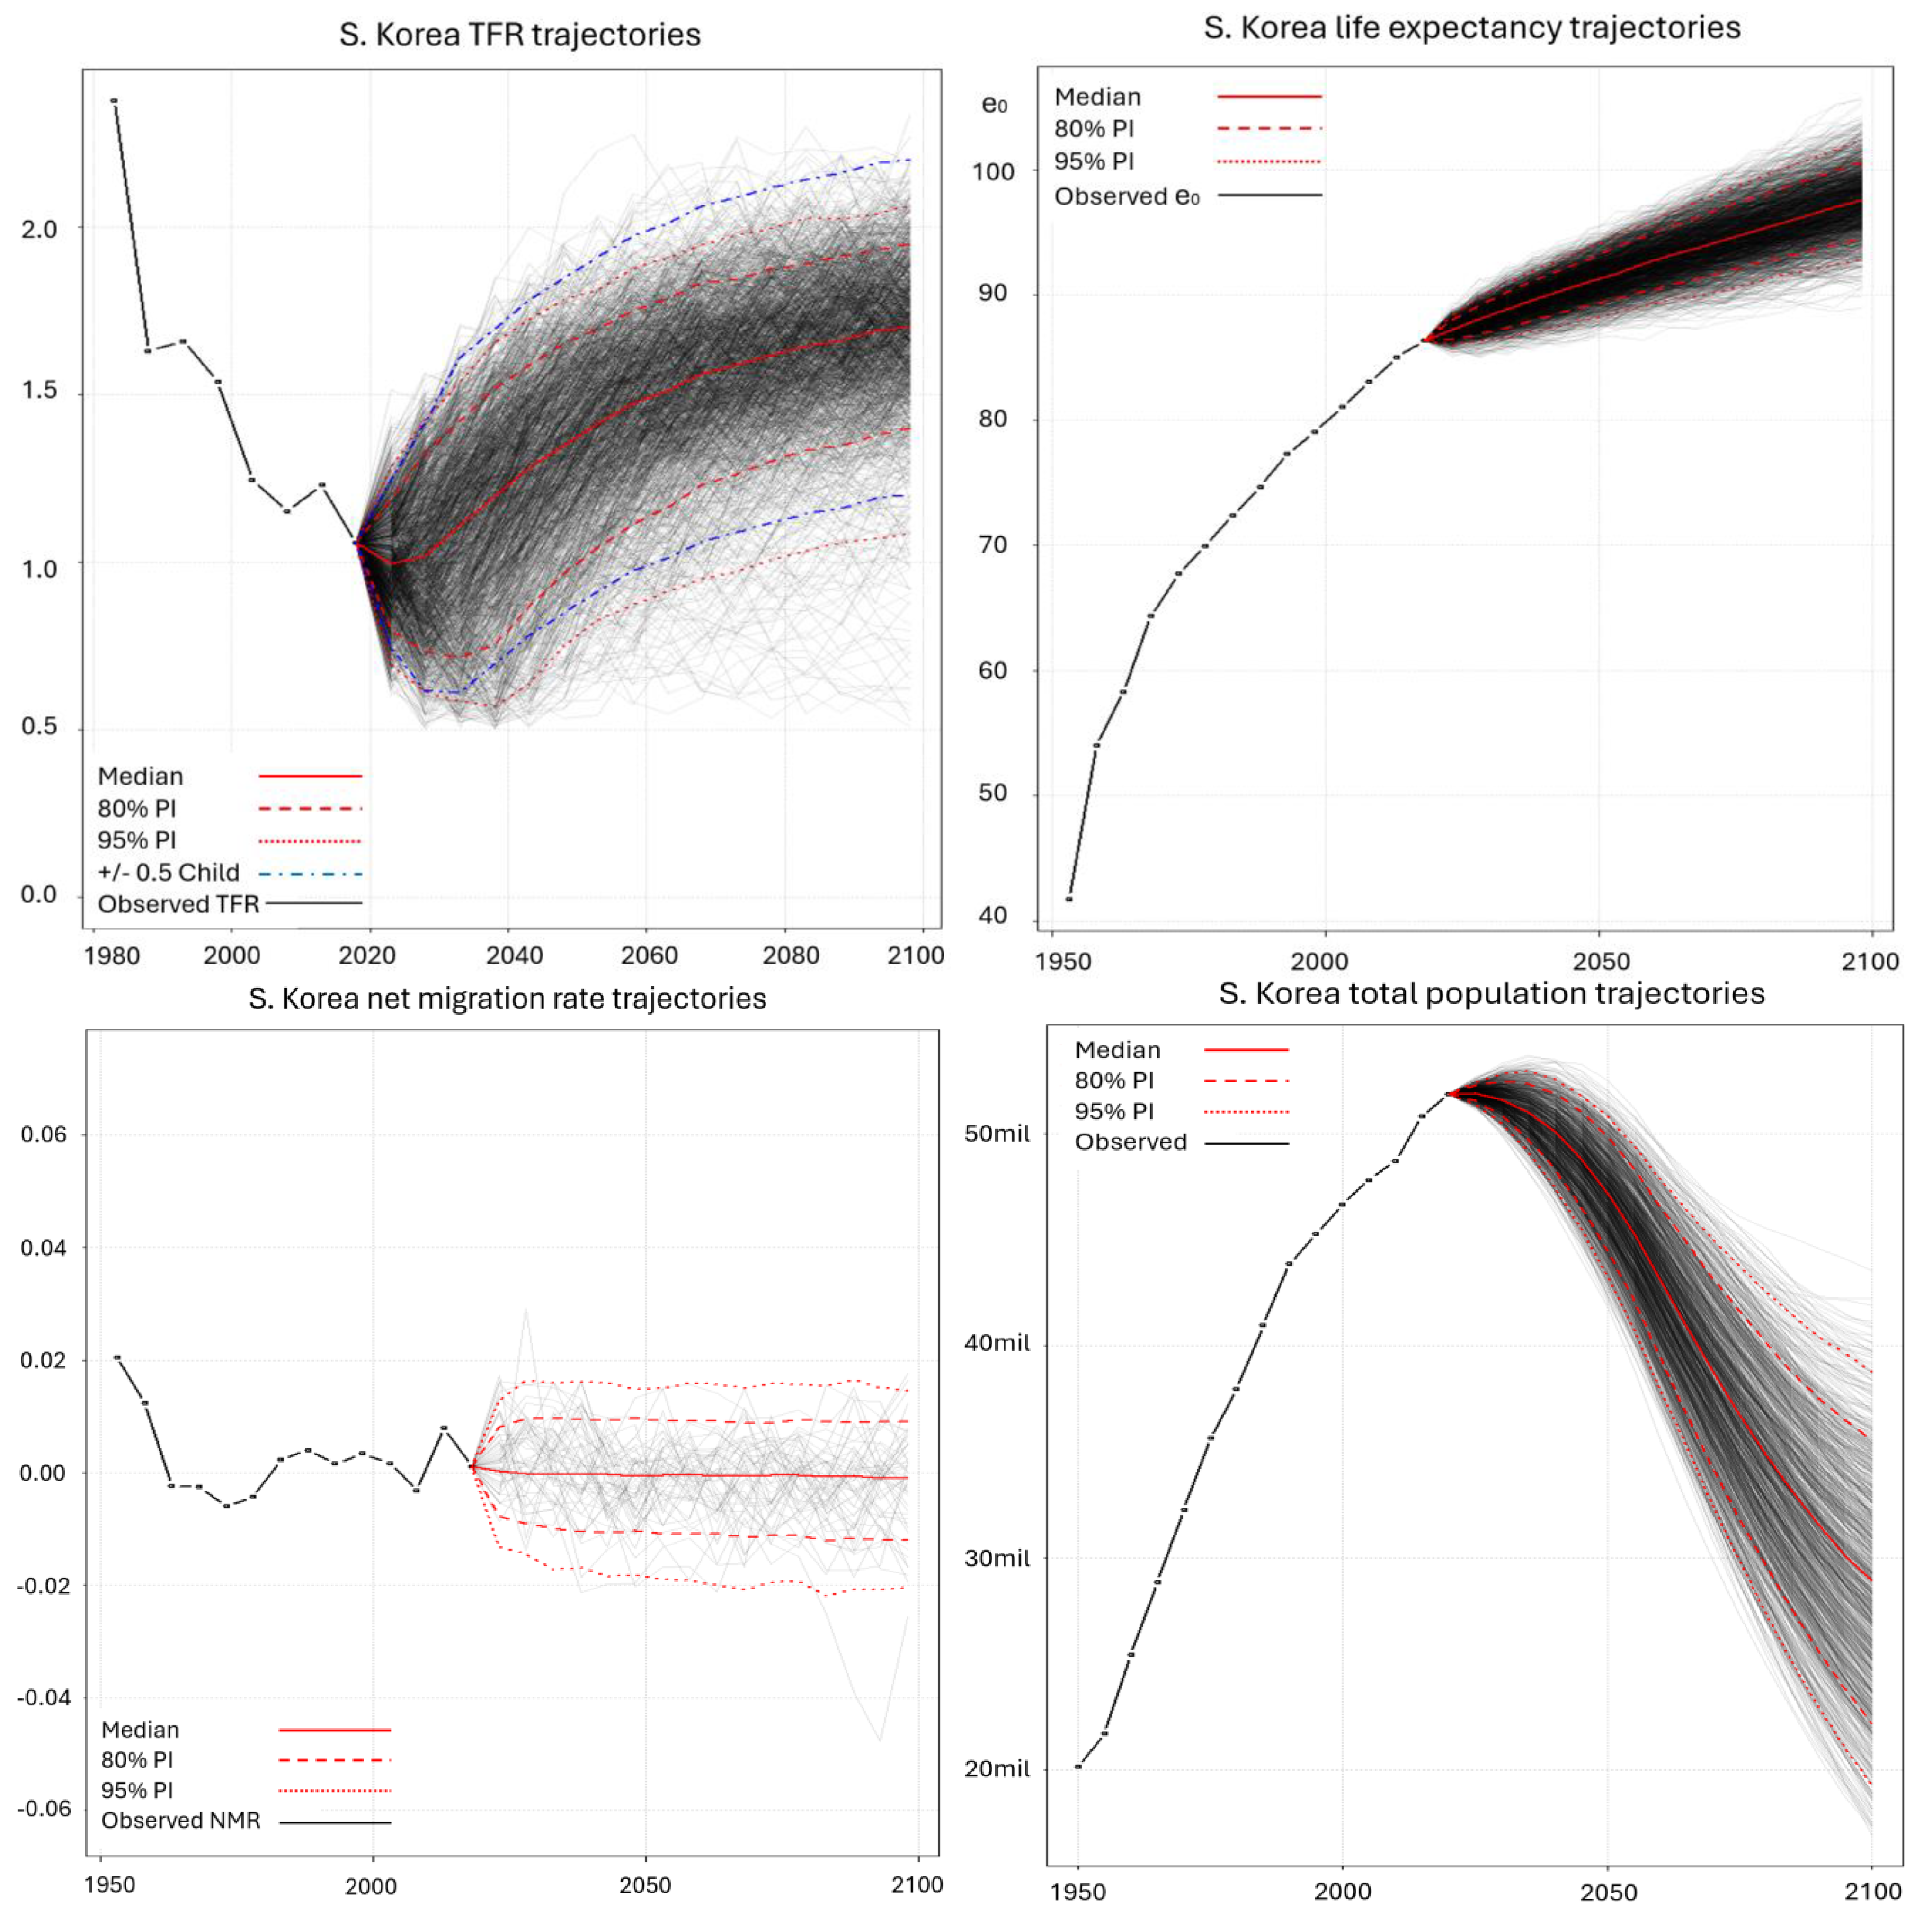
The national total fertility rate (TFR) of South Korea is projected to recover after reaching a record low of 0.7 in the 2030s, as our model in bayesTFR assumes a Phase III TFR. During 2020–2024, the TFR followed the lower 95 percent probability interval (PI) path, resulting in a TFR of 0.7 in 2024. Consequently, it is predicted that South Korea’s TFR will remain below 1.0 until 2100, based on the lower 95 percent PI TFR trajectories (Figure 4 top left)
The national life expectancy at birth (e0) for South Korea is expected to increase continuously and moderately, reaching approximately 95–100 years of life expectancy by 2100 (Figure 4 top right). The national immigration rates of South Korea have shown minimal changes over the past decades and are projected to converge to near-zero rates in the future, maintaining stable trajectories until 2100 (Figure 4 bottom left).
Based on these national demographic component trajectories, probabilistic population projections indicate that South Korea’s population will peak in 2024 and then decline to around 30 million by the median projection in 2100. However, according to observations from the past five years (2020–2024), the lower 95 PI predicts that the population could fall below 20 million by 2100, representing an unprecedentedly rapid decline in human history (Figure 4 bottom right).

5.2. Subnational Projection

The same methodology has been applied to predict subnational population projections. Figure 5 presents a summary of the projected population changes for subnational regions until 2100, including the year 2060, based on the median probability interval (PI). Notably, the rate of population decline accelerates between 2060 and 2100. In particular, the population of Seoul is projected to decrease to approximately one-third of its 2020 level, even according to the median PI. Additionally, the observed trajectories of TFR decline have followed the lower 95 percent PI pace, which may represent a more realistic decline based on population changes observed from 2020 to 2024.
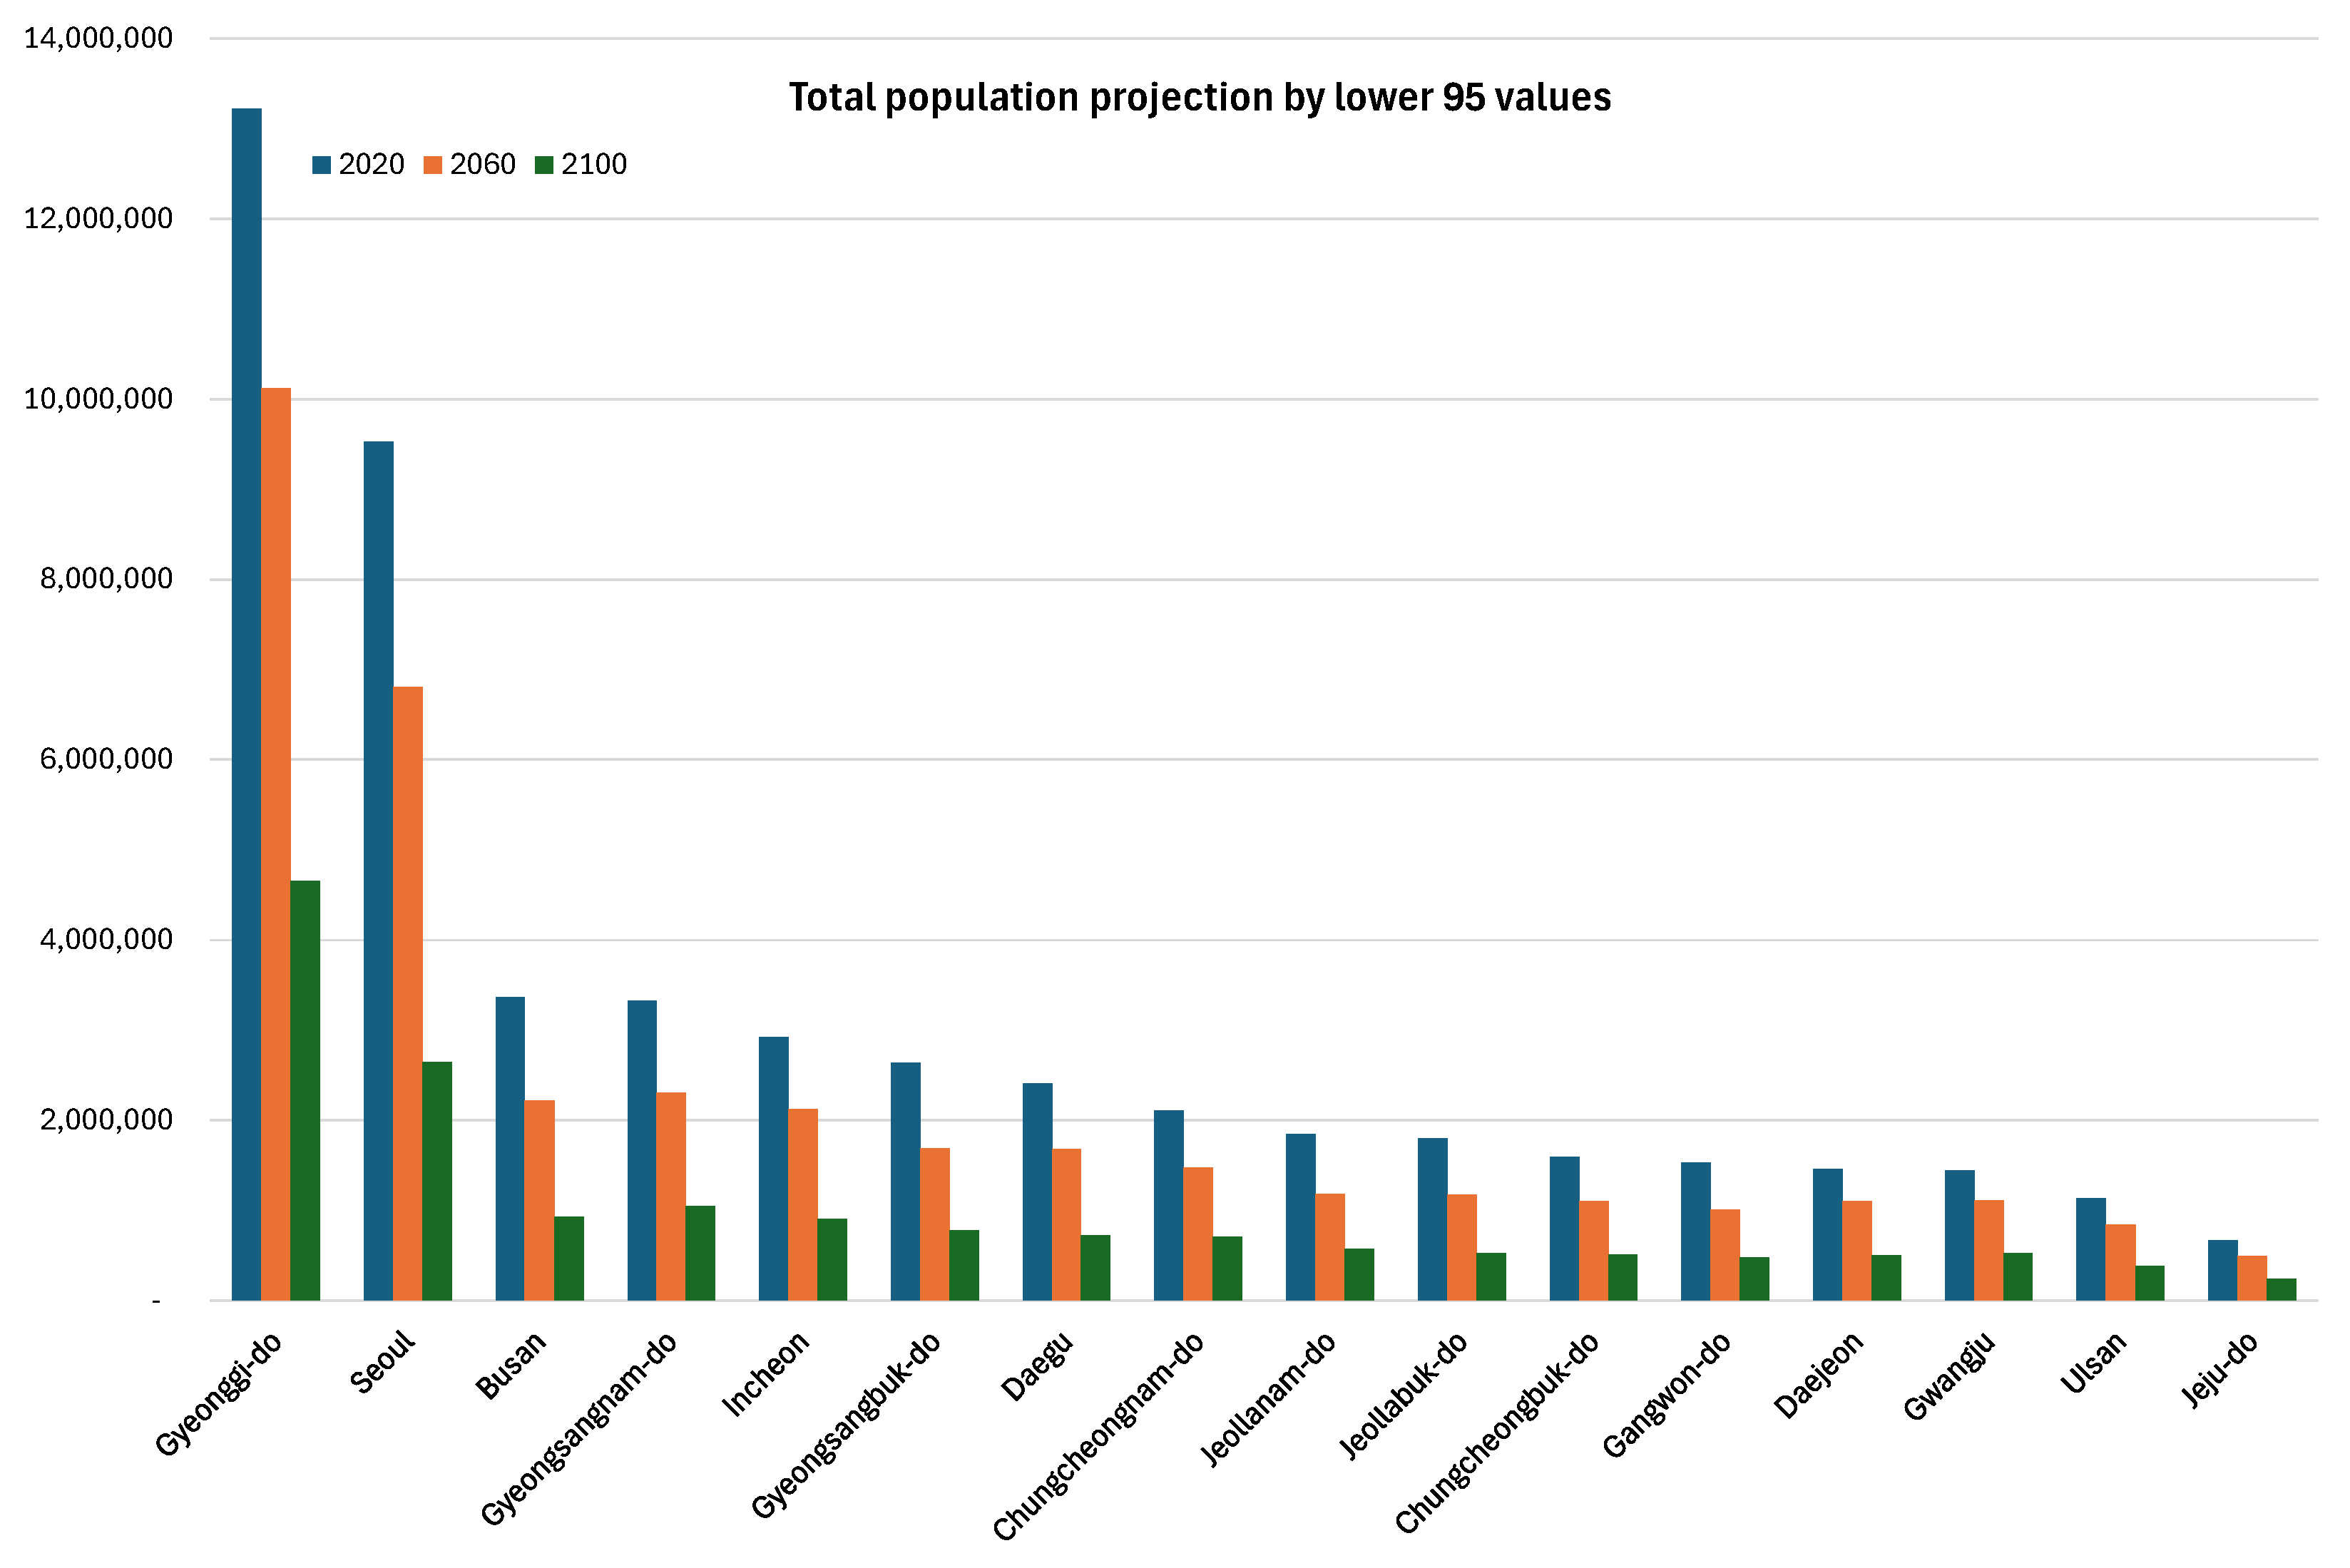
Figure 6 illustrates the lower 95 percent PI population projections for subnational regions. Firstly, the most populous province, Gyeonggi-do, is projected to decline to one-third of its current level by 2100. Most notably, the population of Seoul is expected to decrease to one-fourth of its 2020 level by 2100. Due to domestic migration patterns, individuals are moving from other major cities such as Busan and the eight provinces to Gyeonggi-do and Seoul. This migration pattern results in similar population losses in those areas, despite the higher total fertility rates (TFR) observed in the subnational regions.
Furthermore, population projections for other less densely populated regions exhibit a declining trend similar to that observed in Seoul and Gyeonggi-do. However, the projected population levels of other major cities and rural areas appear to converge toward a comparable lower bound. These subnational regions have already experienced significant demographic contraction historically. Consequently, their projected contribution to the national population by 2100 is expected to be relatively limited (see Figure 6).
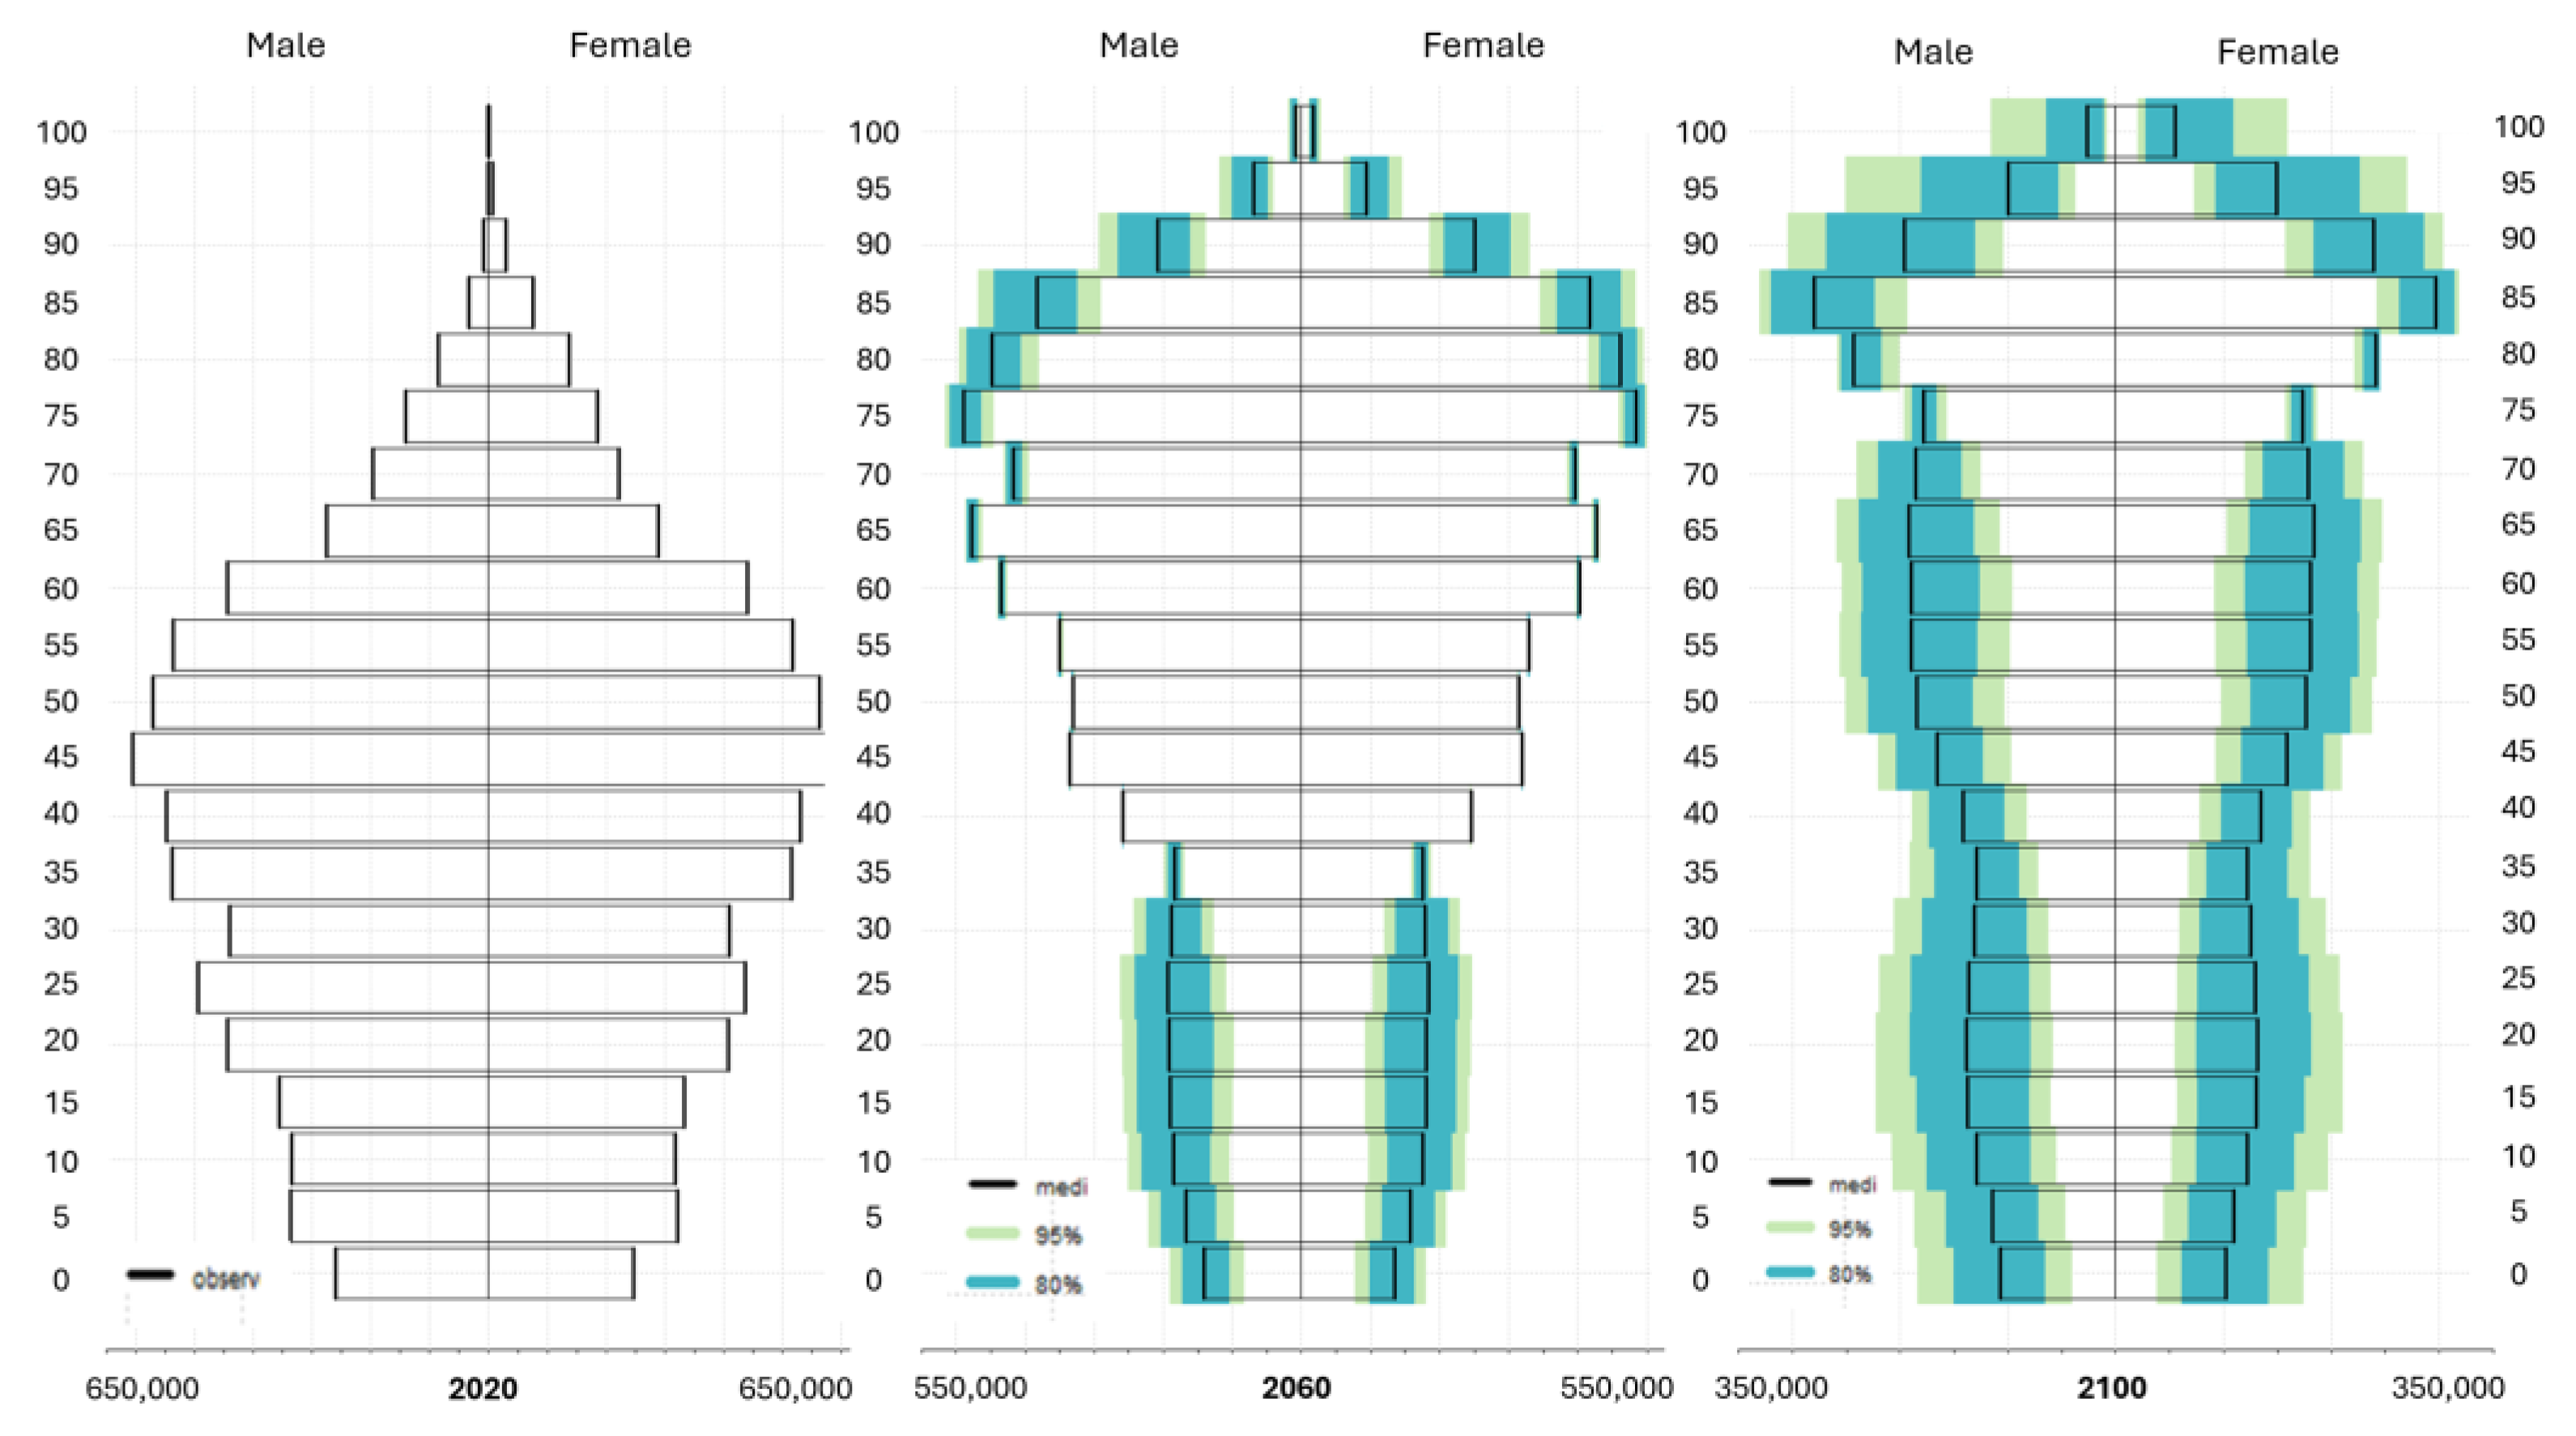
Figure 7 depicts the population pyramids of Gyeonggi-do, the most populated subnational areas in South Korea, using three probability intervals (PI): median, 80%, and 95%. As of 2020, Gyeonggi-do exhibits a significantly low total fertility rate (TFR), resulting in a population pyramid with a high dependency ratio. By 2060, Gyeonggi-do is projected to have a significant proportion of individuals aged 65 and older. The old-age dependency ratio is expected to be higher in 2060 than in 2100. The reduction in the mid-aged population by 2060 will result in an aging population by 2100, which may alleviate some social welfare burdens in terms of the old-age dependency ratio. However, with less than one-fourth of the purchasing power of South Korea expected, this demographic shift may pose additional economic challenges for the country.
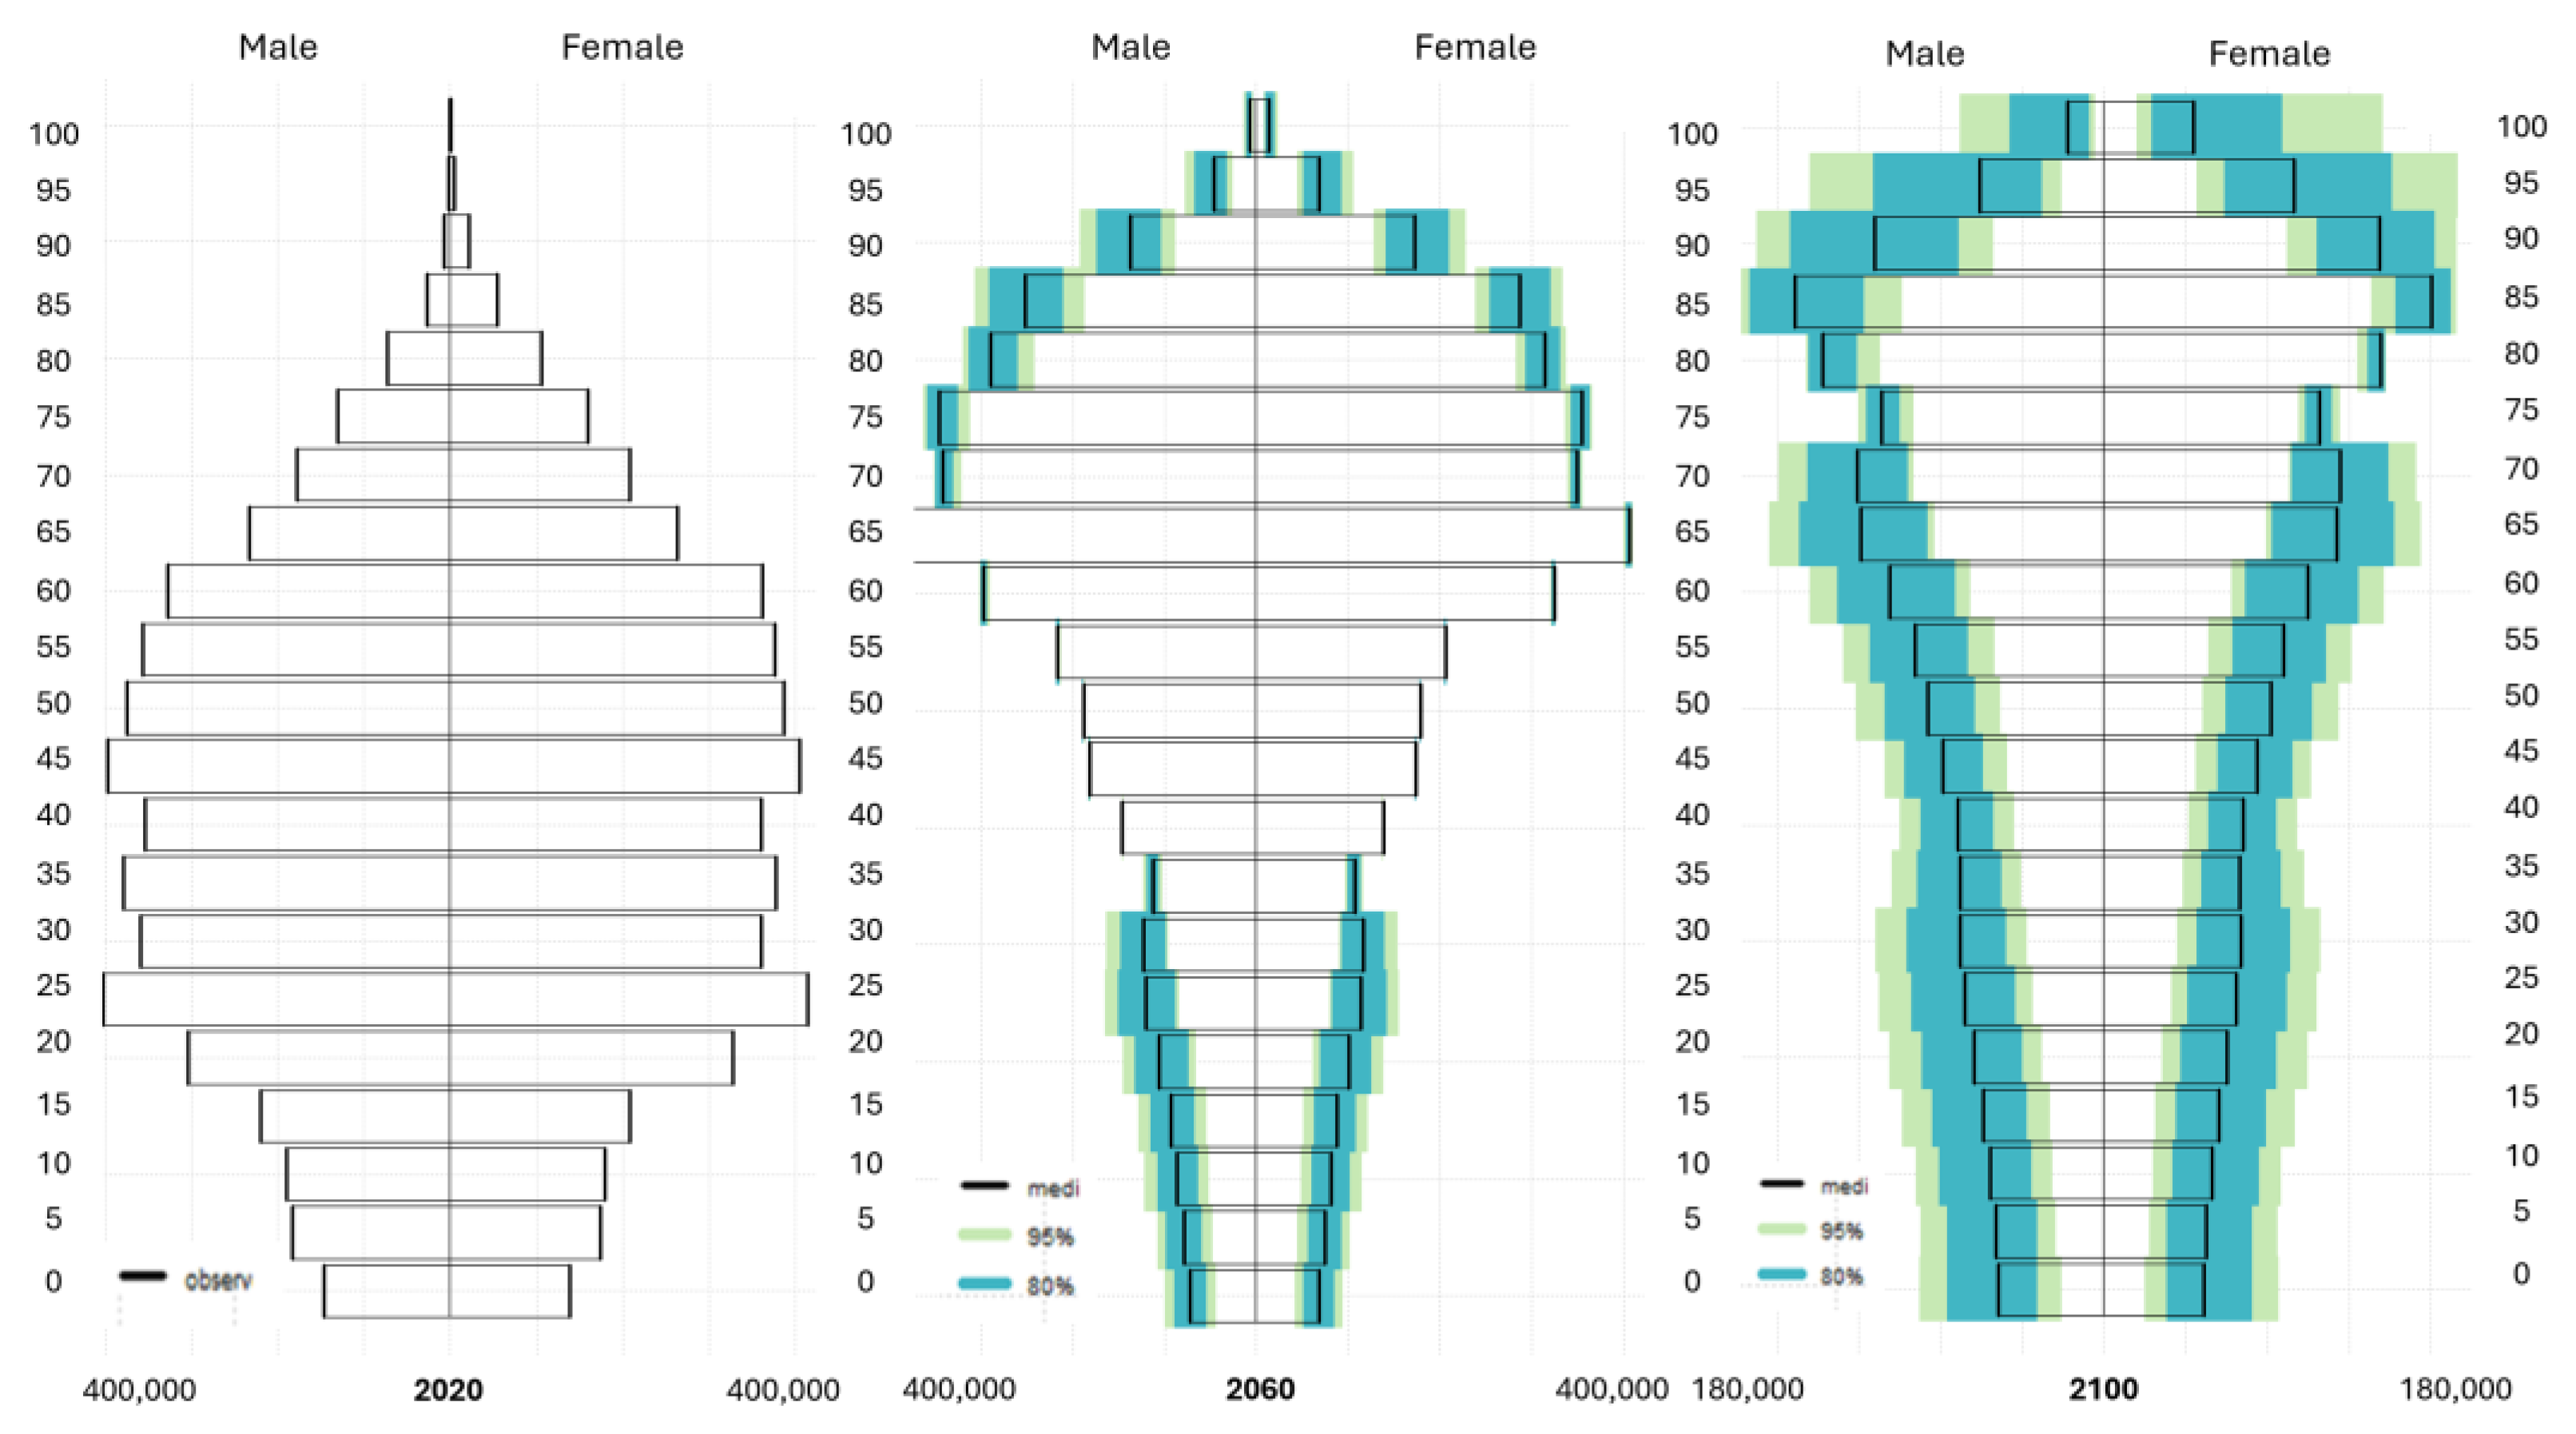
Figure 8 illustrates the population pyramids for Seoul, the capital of South Korea, based on the same PI. Among the subnational regions analyzed, Seoul is projected to experience the most pronounced demographic transformation, with the highest old-age dependency ratio by 2100. This shift is largely driven by continued population migration to Gyeonggi-do, resulting in an increasingly imbalanced age structure in Seoul by 2060. Notably, this severe demographic burden is expected to persist through the end of the century.

6. Validation Test

Forecasting experts generally agree that evaluating models should focus more on how well they perform on data not used during training, rather than how closely they fit the training data. A common method for testing predictive accuracy beyond the estimation period is the “Hold-Out” technique, which involves dividing the dataset chronologically into two parts—one for training the model and the other for testing its predictive ability [48,49,50,51].
To evaluate the validity of the current Bayesian hierarchical model (BHM) approach in projecting the future population of South Korea, we employed the United Nations methodology, utilizing the three component trajectories (bayesTFR, bayesLife, and bayesMig), with 2015 as the base year. The objective of this assessment is to determine the accuracy of the 2020 population projection derived from the 2015 base year. This approach is predicated on using the earliest available model for projection (2015). Consequently, we can evaluate the BHM by comparing the projected 2020 population with the observed 2020 population at the national level. Furthermore, this evaluation tool can be extended to assess the population projections for the 16 subnational areas in South Korea.
Our Bayesian hierarchical model (BHM) projection can be evaluated using the 2020 Korean national quinquennial Population and Housing Census. This census, conducted every five years, ensures that the data collected is current and reflective of demographic and housing trends. Figure 9 presents the national population projection using the BHM, starting from the year 2015. The BHM forecasts a rapid decline in South Korea’s total population, despite an anticipated rise until 2020, primarily due to population structure. This projection aligns with the bottom right panel of Figure 4, as expected.
A b s o l u t e P e r c e n t E r r o r A P E = P r o j e c t e d O b s e r v e d O b s e r v e d     100
We utilize the absolute percent error (APE) to measure the errors of our projection compared to the observed 2020 Census data. The projected median population for 2020 was 51,829 thousand, while the census population was 51,321 thousand, resulting in an APE of approximately 1%. However, the advantage of BHMs is their ability to provide probability intervals (PI) for specific years. Our model projected a range of 50,933 to 51,648 thousand with a 95% PI. This upper 95% PI projection reduces the APE to 0.35%, closely aligning with the observed 2020 population.
When applying the same measurement for subnational projections, the variation is significantly larger compared to national-level projections, despite the projection period being only five years. Figure 10. illustrates that the APE for each subnational population is considerably greater than that of the national-level projection.
The 2020 projections for the two largest subnational areas, Seoul and Gyeonggi-do, exhibit contrasting APE values, with an over-projection for Seoul and an under-projection for Gyeonggi-do (Figure 10). This outcome is noteworthy because the BHM relies on historical long-term trends using statistical probability. However, substantial domestic migration from Seoul to Gyeonggi-do, driven by the unaffordable housing prices in Seoul over the past decade [52], has led to discrepancies in the model’s projections. Consequently, the long-term statistical model inevitably encounters errors in reflecting these recent changes.
In addition to comparing our model with the observed population 2020, we evaluated our national BHM projection against the official national projection provided by the Korean Statistical Information Service (KOSIS) up to 2070. The APE for both projections is remarkably low, indicating a high degree of similarity between the KOSIS official population projection and our BHM projection (Table 1).
The median-level BHM forecast is approximately 2% and 4% higher than the KOSIS projection for 2060 and 2070, respectively. Given that the lowest low TFR trajectory aligns closely with the lower 95% prediction interval (PI), which is the primary driver of South Korea’s population change, we can place greater emphasis on the lower 95% PI. Consequently, with a 95% probability, South Korea’s population is expected to decline to approximately 32.5 million nationally. However, it is important to acknowledge the possibility that the decline phase may be extremely gradual (upper 95%), allowing South Korea to maintain a population of around 45 million within the upper probability interval.

7. Discussion

Population projections play a critical role in ensuring sustainability, providing valuable insights for governments at all levels in planning healthcare systems, and supporting strategic decision-making processes within the private sector. This importance is particularly pronounced within the domains of social science and public health [19,23]. However, traditional deterministic methodologies often fail to incorporate measures of uncertainty, which are essential for evaluating the precision of such projections.
Although the United Nations produces national-level population projections that include uncertainty measures biennially, there exists a significant demand for subnational projections incorporating similar uncertainty assessments [22,27]. This necessity is exemplified by South Korea, where record-low fertility rates over the past five years have contributed to a rapid population decline, exerting profound impacts on both economic conditions and social benefits [39]. Notably, population decline driven by unprecedentedly low fertility rates is a widespread phenomenon observed across economically developed nations globally [6].
According to our BHM, South Korea’s population is expected to peak in 2024 and decline rapidly, potentially dropping to 30 million by 2100 or below 20 million in the lower 95 percent PI projections. This dramatic demographic shift is historically unparalleled. Seoul’s population may shrink to one-third of its 2020 size by 2100, reflecting severe regional impacts.
Persistently low fertility rates contribute to a high dependency ratio, with accelerated aging anticipated by 2060, especially in Seoul and Gyeonggi-do. Though old-age dependency ratios may slightly improve by 2100, economic challenges such as significantly reduced purchasing power and socio-economic strain from an aging population and declining fertility loom large.
Despite the Population and Housing Census conducted by the Korea Statistical Office (KOSTAT) every five years, the total fertility rate (TFR) in Korea has experienced an unpredictable and unprecedented decline, significantly impacting population projections. The United Nations projections for South Korea incorporate Phase III assumptions, which posit that fertility rates will recuperate for all below-replacement levels and eventually converge toward and oscillate around the replacement level [53]. Nationally, this assumption remains overly optimistic. Temporally, there is no evidence to suggest that South Korea’s TFR will recuperate, indicating that this trend may persist as the new normal for a significant period. While a lower percent probability interval (PI) may help address this unrealistic assumption, the Phase III TFR assumption requires modification to reflect a more realistic phase for low-fertility countries like South Korea. A limitation of this study is the reliance on Phase III assumptions without considering the unique demographic trends in South Korea, which may necessitate a new phase reflecting more realistic fertility patterns.
The United Nations World Population Prospects (UN WPP) database presents certain limitations when used to generalize demographic component trajectories at the national level for forecasting purposes. As noted by Li and Gerland [54], the model life tables employed may not accurately capture mortality patterns at the extreme, particularly in countries experiencing rapid improvements in life expectancy. Similarly, Atance et al. [48] highlight issues of overgeneralization across countries and inconsistencies in data quality and completeness within the UN WPP database. Consequently, the use of higher-level trajectories within the Bayesian hierarchical model (BHM) framework in this study may be constrained in its ability to produce fully generalizable national-level forecasts.

8. Conclusions

This study modifies the United Nations’ methodology for probabilistic population projections to address subnational contexts, responding to the rising need for projections with uncertainty bounds. It uses the BHM to analyze fertility rates, life expectancy, and migration across eight cities and eight provinces in South Korea, where persistent low fertility rates have caused a dramatic population decline, from a 2024 peak of 51.7 million to potentially below 20 million by 2100.
Seoul and Gyeonggi-do are especially affected, with Seoul’s population projected to shrink to one-third of its 2020 size by 2100, creating socio-economic challenges such as an aging population and high dependency ratios. While some improvement in old-age dependency is expected by 2100, reduced purchasing power and economic strain from declining fertility will remain significant hurdles for the nation.
South Korea’s working-age population peaked in May 2017 and has been declining since, which poses significant economic, fiscal, and national security challenges [55]. In response, the Presidential Committee on Aging Society and Population Policy introduced a substantial five-year plan worth KRW 196 trillion (about USD 178 billion) to boost birth rates, including monthly bonuses for families with infants and incentives for parental leave [56].
The McKinsey Global Institute [57] report underscores the demographic challenges confronting South Korea, notably, declining fertility rates and a rising old-age dependency ratio, which may exert significant pressure on social security systems. While the precise future trajectory remains uncertain, employing a probabilistic approach can enhance resource allocation strategies to better support the aging population, both at the national and subnational levels.

Funding

This research received no external funding.

Data Availability Statement

The original data presented in the study are openly available in the Korean Statistical Information Service (KOSIS) at https://kosis.kr/eng/ accessed on 13 December 2023.

Conflicts of Interest

The authors declare no conflict of interest.

References

  1. Cannan, E. The Probability of Cessation of the Growth of Population in England and Wales during the next Century. Econ. J. 1895, 5, 506–515. [Google Scholar] [CrossRef]
  2. Bowley, A. Births and Population in Great Britain. Econ. J. 1924, 34, 188–192. [Google Scholar] [CrossRef]
  3. Whelpton, P. The Population of the United States, 1925 to 1975. Am. J. Sociol. 1928, 34, 253–270. [Google Scholar] [CrossRef]
  4. Smith, S.; Tayman, J.; Swanson, D.A. State and Local Population Projections: Methodology and Analysis; Kluwer Academic Press: New York, NY, USA, 2001. [Google Scholar]
  5. Bongaarts, J.; Bulatao, R.A. (Eds.) Beyond Six Billion: Forecasting the World’s Population; National Academy Press: Washington, DC, USA, 2000. [Google Scholar]
  6. Lutz, W.; KC, S. Dimensions of global population projections: What do we know about future population trends and structures? Philos. Trans. R. Soc. B 2010, 365, 2779–2791. [Google Scholar] [CrossRef] [PubMed]
  7. United Nations Department of Economic and Social Affairs. World Population Prospects 2024 Dataset. 2024. Available online: https://www.un.org/development/desa/pd/content/world-population-prospects-2024-dataset (accessed on 25 June 2025).
  8. Raftery, A.E.; Chunn, J.L.; Gerland, P.; Ševčíková, H. Bayesian probabilistic projections of life expectancy for all countries. Demography 2013, 50, 777–801. [Google Scholar] [CrossRef] [PubMed]
  9. Raftery, A.E.; Alkema, L.; Gerland, P. Bayesian population projections for the United Nations. Stat. Sci. 2014, 29, 58–68. [Google Scholar] [CrossRef] [PubMed]
  10. Raftery, A.E.; Lalic, N.; Gerland, P. Joint probabilistic projection o f female and male life expectancy. Demogr. Res. 2014, 30, 795–822. [Google Scholar] [CrossRef] [PubMed]
  11. Alexander, M.; Zagheni, E.; Barbieri, M. A flexible Bayesian model for estimating subnational mortality. Demography 2017, 54, 2025–2041. [Google Scholar] [CrossRef] [PubMed]
  12. Congdon, P. Life expectancies for small areas: A Bayesian random effects methodology. Int. Stat. Rev. 2009, 77, 222–240. [Google Scholar] [CrossRef]
  13. Jonker, M.F.; van Lenthe, F.J.; Congdon, P.D.; Donkers, B.; Burdorf, A.; Mackenbach, J.P. Comparison of Bayesian random-effects and traditional life expectancy estimations in small-area applications. Am. J. Epidemiol. 2012, 176, 929–937. [Google Scholar] [CrossRef] [PubMed]
  14. Wakefield, J.; Fuglstad, G.-A.; Riebler, A.; Godwin, J.; Wilson, K.; Clark, S.J. Estimatingunder-five mortality in space and time in a developing world context. Stat. Methods Med. Res. 2019, 28, 2614–2634. [Google Scholar] [CrossRef] [PubMed]
  15. Bryant, J.; Zhang, J.L. Bayesian forecasting of demographic rates for small areas: Emigration rates by age, sex, and region in New Zealand, 2014–2038. Stat. Sin. 2016, 26, 1337–1363. [Google Scholar] [CrossRef]
  16. Zhang, J.L.; Bryant, J. Bayesian disaggregated forecasts: Internal migration in Iceland. In Developments in Demographic Forecasting; Mazzuco, S., Keilman, N., Eds.; Springer: Cham, Switzerland, 2020; pp. 193–215. [Google Scholar] [CrossRef]
  17. Lee, R.D.; Carter, L.R. Modeling and forecasting U.S. mortality. J. Am. Stat. Assoc. 1992, 87, 659–671. [Google Scholar] [CrossRef]
  18. Cameron, M.P.; Poot, J. Lessons from stochastic small-area population projections: The case of Waikato subregions in New Zealand. J. Popul. Res. 2011, 28, 245–265. [Google Scholar] [CrossRef]
  19. Wilson, T.; Brokensha, H.; Rowe, F.; Simpson, L. Insights from the evaluation of past localarea population forecasts. Popul. Res. Policy Rev. 2018, 37, 137–155. [Google Scholar] [CrossRef]
  20. Ševčíková, H.; Raftery, A.E. Probabilistic projection of subnational life expectancy. J. Off. Stat. 2021, 37, 591–610. [Google Scholar] [CrossRef] [PubMed]
  21. Azose, J.; Sevcikova, H.; Raftery, A. bayesMig: Bayesian Projection of Migration (R Package Version 0.2-3). 2022. Available online: https://github.com/PPgp/bayesMig (accessed on 13 December 2023).
  22. Sevcikova, H.; Raftery, A.E.; Gerland, P. Probabilistic projection of subnational total fertility rates. Demogr. Res. 2018, 38, 1843–1884. [Google Scholar] [CrossRef] [PubMed]
  23. Rayer, S. Demographic techniques: Small-area estimates and projections. In International Handbook of Population Studies; Springer: Berlin/Heidelberg, Germany, 2015; pp. 345–367. Available online: https://bebr.ufl.edu/sites/default/files/Research%20Reports/Rayer%20%282015%29%20-%20ISB2.pdf (accessed on 25 June 2025).
  24. Smith, J.; Johnson, L. Methods for small area population forecasts: State-of-the-art and research needs. J. Popul. Res. 2021, 38, 123–145. [Google Scholar] [CrossRef]
  25. Yu, C.C.; Ševčíková, H.; Raftery, A.E.; Curran, S.R. Probabilistic county-level population projections. Demography 2023, 60, 915–937. [Google Scholar] [CrossRef] [PubMed]
  26. Swanson, D.A.; Beck, D.M. A new short-term county population projection method. J. Econ. Soc. Meas. 1994, 20, 25–50. [Google Scholar] [CrossRef]
  27. Wilson, T.; Grossman, I.; Alexander, M.; Rees, P.; Temple, J. Methods for small area population forecasts: State-of-the-art and research needs. Popul. Res. Policy Rev. 2022, 41, 865–898. [Google Scholar] [CrossRef] [PubMed]
  28. Raftery, A.E.; Li, N.; Ševčíková, H.; Gerland, P.; Heilig, G.K. Bayesian probabilistic population projections for all countries. Proc. Natl. Acad. Sci. USA 2012, 109, 13915–13921. [Google Scholar] [CrossRef] [PubMed]
  29. Alkema, L.; Raftery, A.E.; Gerland, P.; Clark, S.J.; Pelletier, F.; Buettner, T.; Heilig, G.K. Probabilistic projections of the total fertility rate for all countries. Demography 2011, 48, 815–839. [Google Scholar] [CrossRef] [PubMed]
  30. Lee, R.; Miller, T.; Edwards, R.D. The Growth and Aging of California’s Population: Demographic and fiscal Projections, Characteristics and Service Needs. 2003. Available online: http://repositories.cdlib.org/cgi/viewcontent.cgi?article=1006&context=iber/ceda (accessed on 25 June 2025).
  31. Rayer, S.; Smith, S.K.; Tayman, J. Empirical prediction intervals for county population forecasts. Popul. Res. Policy Rev. 2009, 28, 773–793. [Google Scholar] [CrossRef] [PubMed]
  32. Rees, P.; Turton, I. Investigation of the effects of input uncertainty on population forecasting. In Proceedings of the Geo Computation 98 Conference, Bristol, UK, 17–19 September 1998. [Google Scholar]
  33. Smith, S.K.; Sincich, T. Stability over time in the distribution of population forecast errors. Demography 1988, 25, 461–474. [Google Scholar] [CrossRef] [PubMed]
  34. Smith, S.K.; Tayman, J. Confidence intervals for population forecasts: A case study of time series models for states. In Proceedings of the Population Association of America Meeting, Boston, MA, USA, 1–3 April 2004. [Google Scholar]
  35. Tayman, J.; Schafer, E.; Carter, L. The role of population size in the determination and prediction of population forecast errors: An evaluation using confidence intervals for subcounty areas. Popul. Res. Policy Rev. 1998, 17, 1–20. [Google Scholar] [CrossRef]
  36. Wilson, T. Quantifying the uncertainty of regional demographic forecasts. Appl. Geogr. 2013, 42, 108–115. [Google Scholar] [CrossRef]
  37. Azose, J.J.; Ševčíková, H.; Raftery, A.E. Probabilistic population projections with migration uncertainty. Proc. Natl. Acad. Sci. USA 2016, 113, 6460–6465. [Google Scholar] [CrossRef] [PubMed]
  38. Swanson, D.A.; Tayman, J. Subnational Population Estimates; Springer Science & Business Media: Dordrecht, The Netherlands, 2012; Volume 31. [Google Scholar]
  39. Lim, S. Socioeconomic differentials in fertility in South Korea. Demogr. Res. 2021, 44, 941–978. [Google Scholar] [CrossRef] [PubMed]
  40. Korean Statistical Information Service (KOSIS). Available online: https://kosis.kr/index/index.do (accessed on 5 March 2025).
  41. Statistics Korea. Life Tables for Korea, 2022. 2023. Available online: https://www.kostat.go.kr/boardDownload.es?bid=11746&list_no=429104&seq=2 (accessed on 25 June 2025).
  42. Statistics Korea. Population Projections for Korea (2020~2070). 2021. Available online: https://kostat.go.kr/board.es?act=view&bid=11748&list_no=416209&mid=a20108080000 (accessed on 25 June 2025).
  43. Baxter, J.R. Introduction to Probability; Open Textbook Library: Minneapolis, MN, USA, 2023. [Google Scholar]
  44. Bijak, J.; Bryant, J. Bayesian demography 250 years after Bayes. Popul. Stud. 2016, 70, 1–19. [Google Scholar] [CrossRef] [PubMed]
  45. Van Ravenzwaaij, D.; Cassey, P.; Brown, S.D. A simple introduction to Markov Chain Monte–Carlo sampling. Psychon. Bull. Rev. 2018, 25, 143–154. [Google Scholar] [CrossRef] [PubMed]
  46. Azose, J.J.; Raftery, A.E. Bayesian probabilistic projection of international migration. Demography 2015, 52, 1627–1650. [Google Scholar] [CrossRef] [PubMed]
  47. Lynch, S.M. Introduction to Applied Bayesian Statistics and Estimation for Social Scientists; Springer: New York, NY, 2007; Volume 1. [Google Scholar]
  48. Atance, D.; Debón, A.; Navarro, E. Resampling Methods to Assess the Forecasting Ability of Mortality Models. In Mathematical and Statistical Methods for Actuarial Sciences and Finance: eMAF2020; Springer International Publishing: Berlin/Heidelberg, Germany, 2021; pp. 45–50. [Google Scholar]
  49. Bergmeir, C.; Benítez, J.M. On the use of cross-validation for time series predictor evaluation. Inf. Sci. 2012, 191, 192–213. [Google Scholar] [CrossRef]
  50. Tashman, L.J. Out-of-sample tests of forecasting accuracy: An analysis and review. Int. J. Forecast. 2000, 16, 437–450. [Google Scholar] [CrossRef]
  51. van der Linden, W.J.; Glas, A.W. Elements of Adaptive Testing; Statistics for Social and Behavioral Sciences; Springer: New York, NY, USA, 2010. [Google Scholar]
  52. Jeon, S.; Lee, M.; Kim, S. Factors influencing fertility intentions of newlyweds in South Korea: Focus on demographics, socioeconomics, housing situation, residential satisfaction, and housing expectation. Sustainability 2021, 13, 1534. [Google Scholar] [CrossRef]
  53. Thompson, W.S. Population. Am. J. Sociol. 1929, 34, 959–975. [Google Scholar] [CrossRef]
  54. Li, N.; Gerland, P. Modifying the Lee-Carter Method to Project Mortality Changes up to 2100. United Nations Department of Economic and Social Affairs, Population Division, Technical Paper No. 2011/3. 2011. Available online: https://www.un.org/development/desa/pd/sites/www.un.org.development.desa.pd/files/unpd_2011_mlt_modifying_the_lee-carter_method_to_project_mortality_changes_up_to_2100.pdf (accessed on 25 June 2025).
  55. Byrne, T.; Corrado, J. South Korea’s Demographic Advantage Is Over: The Regional Context and the Economic and Security Implications; Pacific Forum Working Paper; Pacific Forum: Honolulu, HI, USA, 2021. [Google Scholar]
  56. Presidential Committee on Aging Society and Population Policy. Five Key Tasks for Creating a Society in which all Members Care for One Another and Work Together. 2022. Available online: www.betterfuture.go.kr/eng/pcaspp/fertility.do (accessed on 25 June 2025).
  57. McKinsey Global Institute. Dependency and Depopulation? Confronting the Consequences of a New Demographic Reality. 15 January 2025. Available online: https://www.mckinsey.com/mgi/our-research/dependency-and-depopulation-confronting-the-consequences-of-a-new-demographic-reality (accessed on 25 June 2025).
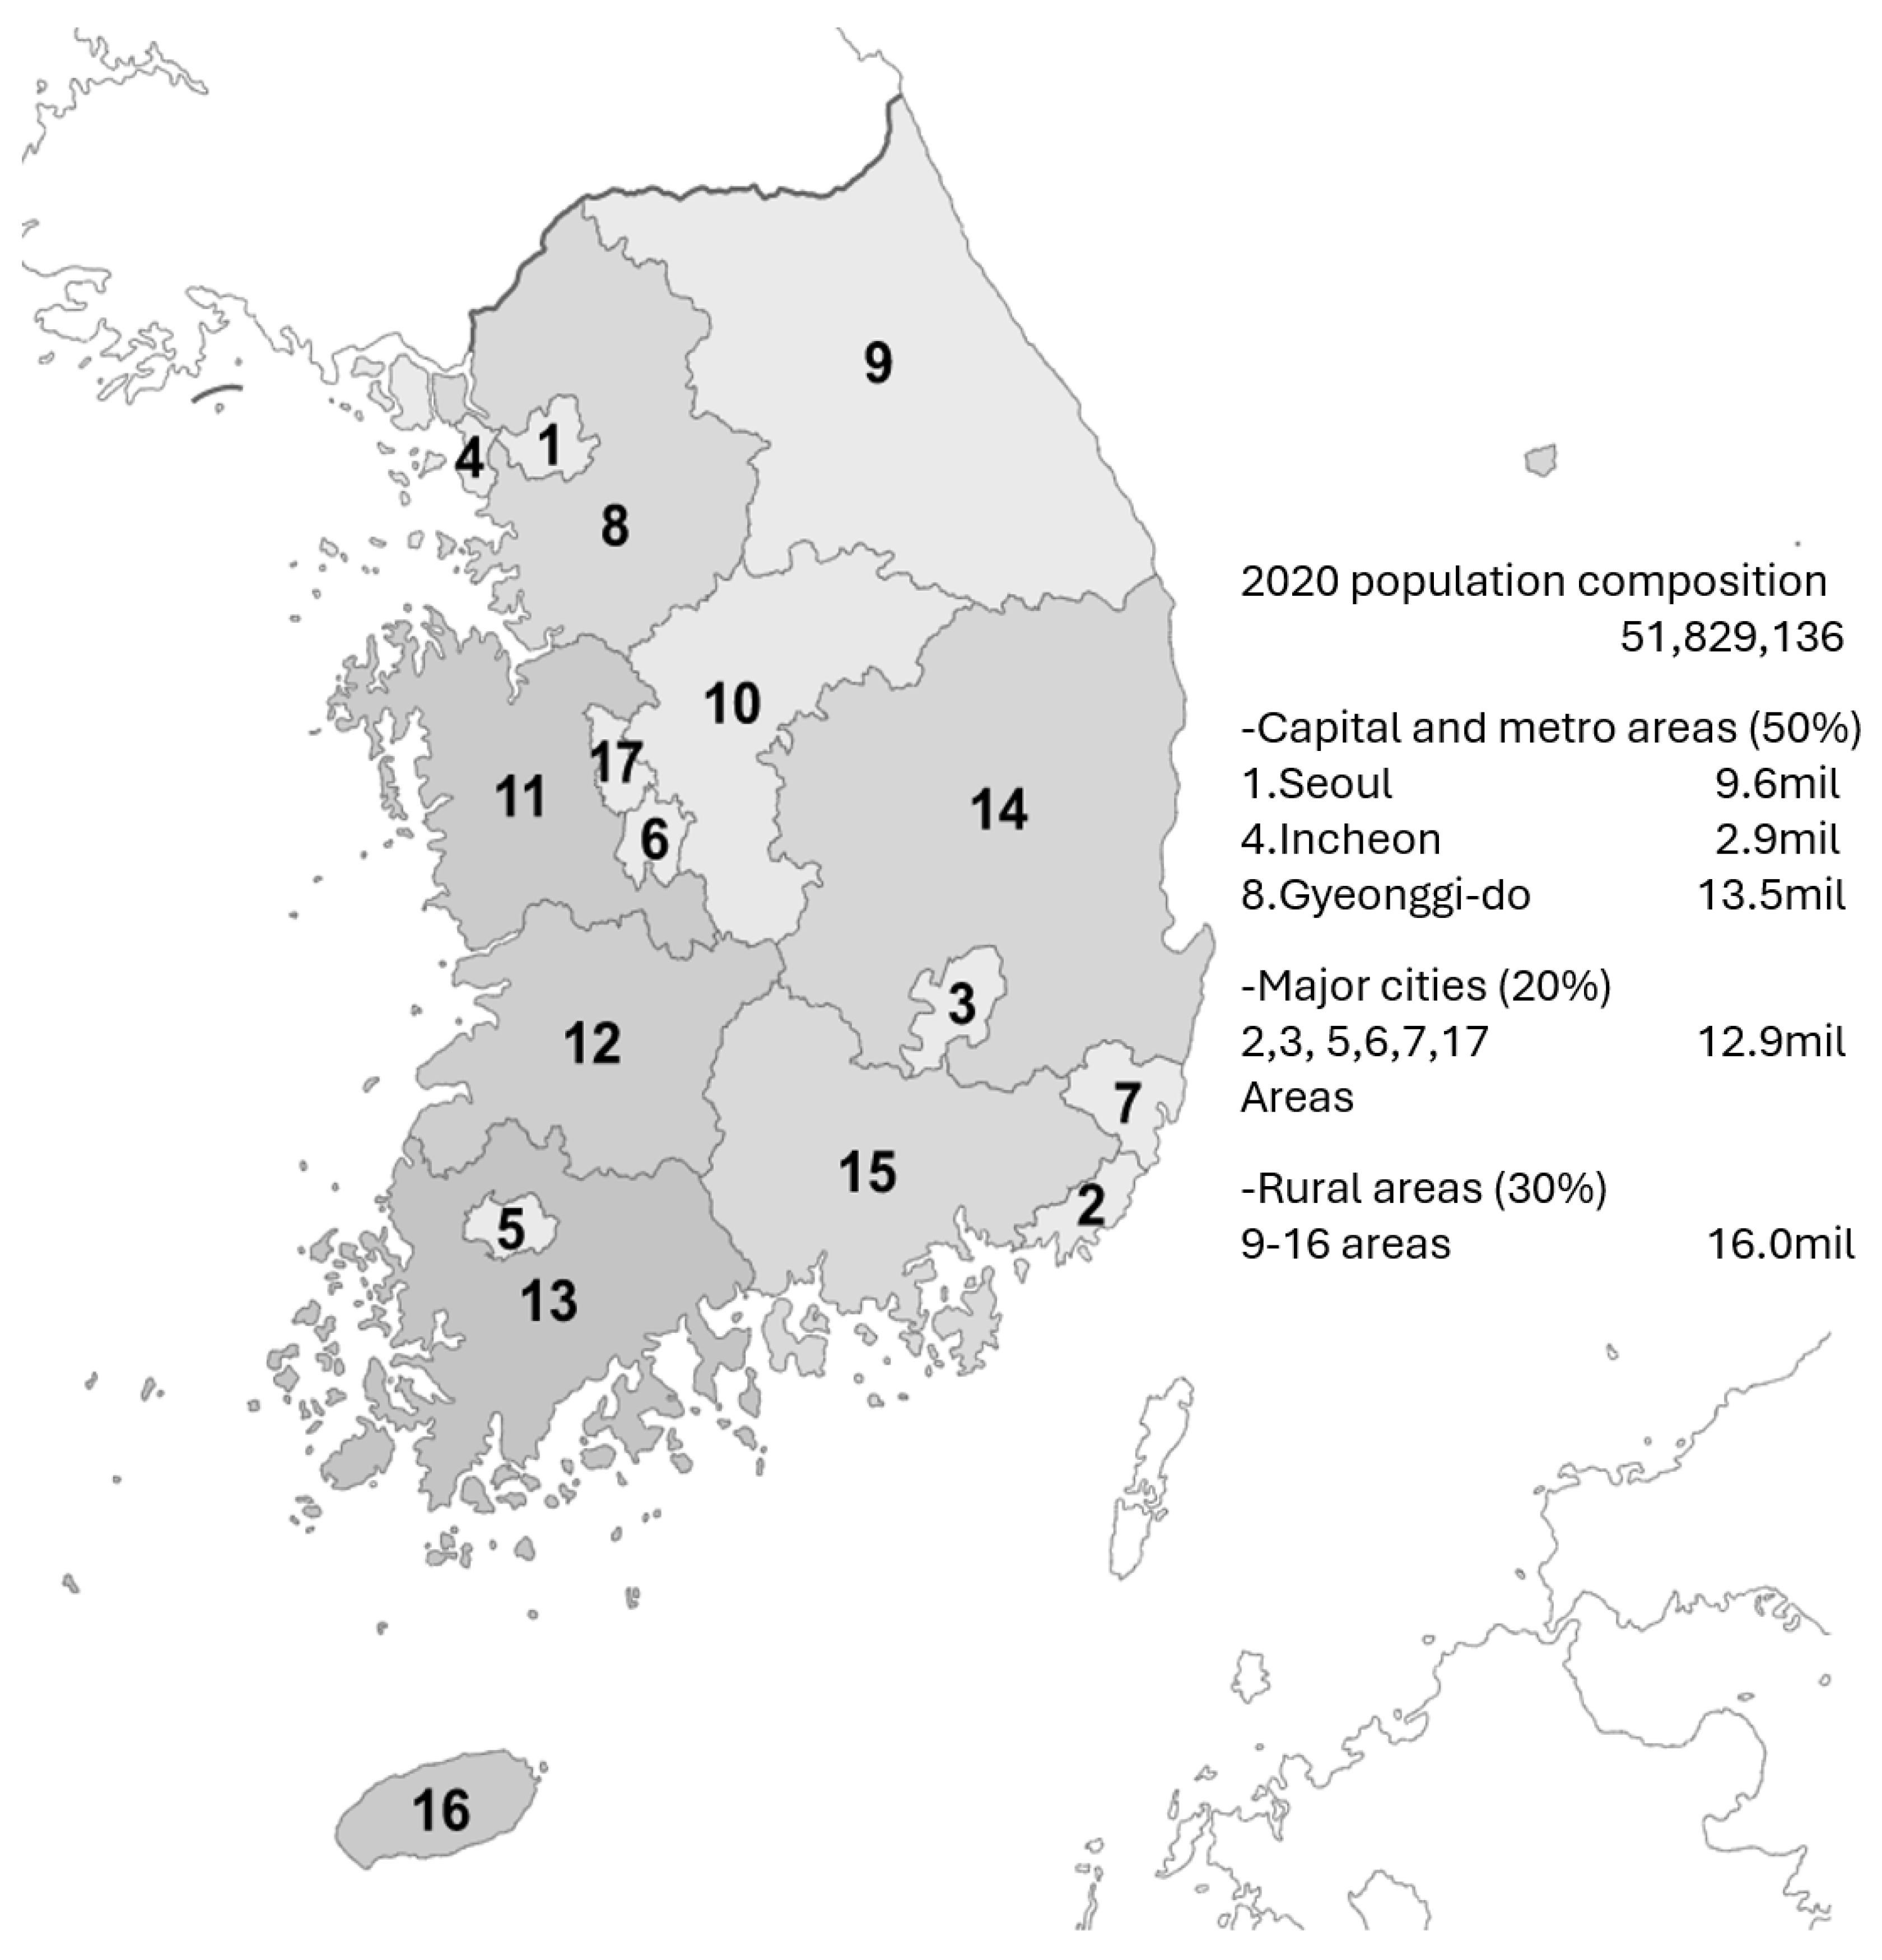
Figure 1. Subnational areas and population composition of South Korea. Source: Korean Statistical Information Service (KOSIS) [40].
Forecasting 07 00040 g001
Figure 2. (a) South Korea national TFR, life expectancy at birth and net migration rates trends. (b) Population projection by KOSIS by 2052. Source: Korean Statistical Information Service (KOSIS).
Forecasting 07 00040 g002
Figure 3. BHM framework for subnational TFR projections. Source: bayesTFR R package [22].
Forecasting 07 00040 g003
Figure 4. South Korea national demography components and total population projection. Source: own research result trajectories from BHM model projection.
Forecasting 07 00040 g004
Figure 5. Subnational population projection by median values in 2020, 2060, and 2100. Source: own research result trajectories from BHM model projection.
Forecasting 07 00040 g005
Figure 6. Subnational population projection by lower 95 percent PI in 2020, 2060, and 2100. Source: own research result trajectories from BHM model projection.
Forecasting 07 00040 g006
Figure 7. Population pyramid of Gyeonggi-do in 2020, 2060, and 2100. Source: own research result trajectories from BHM model projection.
Forecasting 07 00040 g007
Figure 8. Population pyramid of Seoul in 2020, 2060, and 2100. Source: own research result trajectories from BHM model projection.
Forecasting 07 00040 g008
Figure 9. BHM national population projection of South Korea as base year of 2015. Observed data from KOSIS, thousand. Source: own research result trajectories from BHM projection, Korean Statistical Information Service (KOSIS).
Forecasting 07 00040 g009
Figure 10. Evaluation of BHM subnational projection as base year of 2015 vs. 2020 observed. Source: own research result trajectories from BHM projection and KOSIS.
Forecasting 07 00040 g010
Table 1. Evaluation of BHM national projection with base year of 2020 vs. KOSIS projection. Source: own research result trajectories from BHM projection and KOSIS.
20302040205020602070MAPE %
KOSIS Projection51,306,000 50,059,000 47,107,000 42,302,000 37,182,000
Bayesian Projection51,592,000 50,085,000 47,161,000 43,153,000 38,806,000
APE %0.560.050.112.014.371.42
lower 9550,463,000 47,458,000 43,275,000 38,033,000 32,502,000
APE %1.645.208.1310.0912.597.53
upper 9552,796,000 52,536,000 50,803,000 47,906,000 45,028,000
APE %2.904.957.8513.2521.1010.01
Disclaimer/Publisher’s Note: The statements, opinions and data contained in all publications are solely those of the individual author(s) and contributor(s) and not of MDPI and/or the editor(s). MDPI and/or the editor(s) disclaim responsibility for any injury to people or property resulting from any ideas, methods, instructions or products referred to in the content.