Article

Modeling and Forecasting Somali Economic Growth Using ARIMA Models

by
Abas Omar Mohamed
Department of Economics, Faculty of Economics and Management Sciences, Mogadishu University, Mogadishu P.O. Box 004, Somalia
Forecasting 2022, 4(4), 1038-1050; https://doi.org/10.3390/forecast4040056
Submission received: 18 October 2022 / Revised: 22 November 2022 / Accepted: 23 November 2022 / Published: 30 November 2022
(This article belongs to the Special Issue Economic Forecasting in Agriculture)

Abstract

:
The study investigated the empirical role of past values of Somalia’s GDP growth rates in its future realizations. Using the Box–Jenkins modeling method, the study utilized 250 in-sample quarterly time series data to forecast out-of-the-sample Somali GDP growth rates for fourteen quarters. Balancing between parsimony and fitness criteria of model selection, the study found Autoregressive Integrated Moving Average ARIMA (5,1,2) to be the most appropriate model to estimate and forecast the trajectory of Somali economic growth. The study sourced the GDP growth data from World Bank World Development Indicators (WDI) for the period between 1960 to 2022. The study results predict that Somalia’s GDP will, on average, experience 4 percent quarterly growth rates for the coming three and half years. To solidify the validity of the forecasting results, the study conducted several ARIMA and rolling window diagnostic tests. The model errors proved to be white noise, the moving average (MA) and Autoregressive (AR) components are covariances stationary, and the rolling window test shows model stability within a 95% confidence interval. These optimistic economic growth forecasts represent a policy dividend for the government of Somalia after almost a decade-long stick-and-carrot economic policies between strict IMF fiscal disciplinary measures and World Bank development investments on target projects. The study, however, acknowledges that the developments of current severe droughts, locust infestations, COVID-19 pandemic, internal political, and security stability, and that the active involvement of international development partners will play a crucial role in the realization of these promising growth projections.

1. Introduction

As a top intellectually debated topic in development realms and an integral component of mainstream economics research frontier, economic growth theory dates back to mid-20th century neoclassical economists [1]. Following these theoretical foundations, the empirical studies explaining the sources of sustainable development attracted substantial scholarly and policy debates over the past century [2,3,4]. A development indicator extensively studied and unanimously agreed upon as a prerequisite of any meaningful development agenda is the level of economic growth [5,6]. As a positive growth rate of a country’s Gross Domestic Product (GDP) from one year to the next, economic growth facilitates the achievement of state development priorities in terms of creation of sustainable decent employment, reduction of abject poverty rates, generation of sufficient public revenue for quality public service delivery, and enhancement of overall citizens’ standard of living [7]. Hence, contemporary economists agree that GDP is the most suitable variable for measuring a country’s economic performance despite some statistical drawbacks.
Conceptually, GDP is the statistical aggregation of the final monetary value of all goods and services domestically produced within a given period. Kuznets [8], an economics Nobel prize winner, defines economic growth as an increase in the GDP growth rates. According to Wabomba [9] and Dritsaki [10], economists measure GDP in three different yet linked ways depending on the accounting approach. First, the production approach aggregates the value-added amounts of all goods and services at every production stage with net government tax and public subsidy operations. Second, the income approach combines factor income generated by production in the country, i.e., remuneration of employees, capital income, business profit, taxes on production, and imports minus subsidies. Third, the expenditure approach computes household, business, and government purchases of goods and services and net exports.
In Somalia, due to the relative stability, the post-conflict economy has been experiencing an upward trend in GDP growth rates for the past decade despite impediments instigated by recurrent droughts, locust infestations, and COVID-19 triple shocks [11]. Apart from drought and COVID-19 hit years of 2017 and 2020, which experienced negative growth, Somalia’s GDP grew annually by an average of 3 percent since 2014 [12]. Figure 1 below shows the positive trajectory and the negative drought and pandemic shock effects on the Somali GDP growth rates between 2014 to 2021.
The termination of the transitional period (2000–2012) of the Somali governance system offered ample collaborative opportunities and fresh diplomatic and economic interests with the rest of the world. As a result, the influx of official bilateral and multilateral development assistance funds in the form of budget support or separate development projects boomed Somalia’s national budget from a meager $114,355,852 in 2013 to almost a billion dollars of $918,666,761 in 2022. Moreover, as shown in Figure 2 below, the statistics demonstrate a relatively unparalleled growth in the post-2018 investment component of the budget, signaling optimistic expectations for Somalia’s economic performance in the future.
Due to the original differences in governance systems, institutional qualities, degree of industrialization, and the level of development, future uncertainties coupled with adverse shocks like the global financial crisis and the COVID-19 pandemic pose heterogeneous degrees of vulnerabilities and negative impacts on rich and poor countries. As such, a classic root cause of underdevelopment is socio-political uncertainty, which triggers dilemmas in the direly needed public, private, and foreign investments and vulnerability to internal and external economic, political, and natural shocks [13,14,15]. A large sample cross-country study empirically examined the link between macroeconomic policy uncertainty and private investment in developing countries and found a strong and significant negative association after controlling for other standard investment determinants, taking into account their potential endogeneity [16].
The systemic and reliable predictions of future economic conditions help governments not only cope with the current economic challenges but also correctly set the foundations of economic policies that can generate more certain economic outcomes in the future. Hence, empirical studies on development literature place sustained GDP growth among the topmost significant factors that promote higher per capita incomes, reduce poverty rates, and facilitate sustainable development [17,18]. However, unlike sustained growth, the empirical evidence in development literature report that, instead of helping, sporadic GDP growth hinders sustainable development by producing private-sector consumption and investment dilemma and public policy uncertainty in the long run. A classic stylized factor that interrupts the smooth progress in the GDP growth rates is the poor forecasting quality of future business cycle fluctuations. These future uncertainties do not just slow the momentum of sustained economic growth but also create economic policy failures towards future macroeconomic stability [19,20].
Because of the development importance attached to the proper forecasting of GDP growth rates, an extensive amount of scholarly research has been conducted on the subject over the past century [21,22,23,24,25,26,27,28,29]. For instance, Segnon et al. [21] used 96 years of annual time series data to forecast US economic growth and found that accurate forecasting improves future economic policy uncertainty (EPU). Similarly, another study in Euro Area revealed that confidence indicators could help forecast accurate GDP growth rates in the short run [24]. Furthermore, conducting a cross-country analysis, Chuku et al. [25] compared the growth-forecasting quality of various parametric and non-parametric models, and discovered that artificial neural networks (ANN) outperform parametric models in forecasting GDP growth in selected countries. Two more growth-forecasting studies conducted in an African context found the ARIMA (1,2,1) model to be the most appropriate model for Egyptian and Kenyan economies, with relatively sufficient forecasting power within the range of 5% power of significance [9,29].
In Somalia, a decade of relative security and political stability with weak yet sustained economic recovery offered a conducive environment to interact with global economic institutions, notably the World Bank and IMF. The increasing funds of both bilateral and multilateral official development assistance (ODA), gradually growing sector-sensitive foreign direct investments (FDI), and the potential oil and gas explorations inspired the government of Somalia to shift its policy priorities from fragile to more vigorous growth and aim for higher development targets for the next decade. However, the effective austerity measures strongly advised by IMF, the global COVID-19 pandemic, and volatile security shocks can limit full-fledged development-oriented public policies unless they are carefully designed with the input of reliable and high-quality growth forecasts. Despite this dire need for evidence-based macroeconomic forecasts, no such study has ever been conducted in the context of Somalia’s economy, to the best of the author’s knowledge. Hence, this study aims at carrying out GDP growth forecast research on Somalia’s economy. More specifically, the study examined how 250 in-sample quarters of the past GDP growth rates can explain the direction and the intensity of the next 14 out-of-the-sample quarters of Somalia’s GDP growth rates. Furthermore, the study evaluated the impact of the current generous foreign aid and IMF-advised austerity measures on future economic growth realizations. The contribution of this paper is twofold. The first is to expand the growth-forecasting literature by adding Somalia context, and the second is to provide evidence-based empirical economic policy advice for the next phase of Somalia’s development journey. The rest of the paper is organized as follows. Section 2 establishes the methodological framework and identifies the sources of the study datasets. Section 3 presents the study results, while Section 4 discusses the implications. Finally, Section 5 provides concluding remarks and policy recommendations.

2. Materials and Methods

The study aims at establishing a representative yet parsimonious ARIMA model that can effectively estimate and accurately forecast Somalia’s GDP growth rate. This section contains the methodological framework of the model, and the steps followed to achieve the study objective. The study utilizes quarterly time series data of Somalia’s GDP growth rates from World Bank World Development Indicators (WDI) for the period between 1960 quarter one to 2022 quarter two. Forecasting an economic time series is challenging, mainly because of the peculiar idiosyncrasies involved. Economists use various classical and contemporary techniques to forecast the realization of future outcomes reasonably. Chief among them are univariate time series models like Autoregressive Integrated Moving Average (ARIMA) models, multivariate methods like Vector Autoregressive (VAR) models, and Machine Learning and Computer Algorithmic methods like Artificial Intelligence (AI) and Neural Network (NN) models. The following sections provide theoretical foundations of ARIMA modeling, also called the Box–Jenkins forecasting technique.

2.1. Theoretical Foundation of ARIMA Modelling

Autoregressive Integrated Moving Average (ARIMA) modeling, popularly known as Box–Jenkins [30] methodology, was initially contributed by George Box and Gwilym Jenkins in a 1970 seminal book which was later summarized into a paper published in 1976. Economists, since then, have widely used ARIMA models in estimating and forecasting univariate time series economic variables to provide evidence-based economic policy advice. The model assumes that the series at hand is both stationary and invertible. Stationarity entails that both the mean and variance of the series are time-invariant, while invertibility requires the uniqueness of the autocorrelation function of the moving average (MA) component of the model. A classic challenge in time series analysis is that the values of the series at time t tend to correlate with its lagged values and both current and past errors. To deal with this, the paper accommodated autoregressive (AR) and moving average (MA) components. The AR component with “p” lags represents the relationship between the dependent variable and its previous period, as shown in Equation (1) below.
  Y t = α + i = 1 p β Y t i + E t
For any series to be weekly dependent, the AR (p) process presented in Equation (1) assumes that |β| < 1 and the E t is independently and identically distributed (iid). Similarly, the study controlled the moving average (MA) component with “q” lags to take care of the potential dependence of the model residual to its past values, as shown in Equation (2) below.
Y t = α + β E t   + i = 1 q γ E t i
Finally, to incorporate both lag effects of (AR) and moving average (MA) components in a single model, the study specifies ARMA modeling for estimation and forecasting, as shown in Equation (3) below.
Y t = α + i = 1 p β Y t i + j = 1 q γ E t j + E t    
where Y t is the series at hand, p is the order or the number of lags in the (AR) component, q is the order or the number of lags in the (MA) component, and E t is the error term. Two potential possibilities of using the ARMA or ARIMA model emerge depending on the result of the stationary test. Given that most of the time series variables are not stationary at level, the generic form of the model is ARIMA (p,d,q), where “I” corresponding to “d” is the number of times the series is integrated or differenced before it becomes stationary. To correctly estimate the in-sample values of the series and forecast the future out-of-sample of the series, the Box Jenkins follows four steps. The first is the identification process to test for the stationary and the invertibility (determination of p d q orders) of the series. The second is estimating all possible candidate models to identify the most parsimonious one that also fits the data. The third is to run diagnostic tests on the best candidate produced in step three. Finally, step four is to forecast the out-of-sample values of the series, using the best model produced in step two that has also passed the diagnostic tests conducted in step three.

2.2. Model Specification

Following the econometric specifications of growth-forecasting literature, the study established a univariate Box–Jenkins model. The model regresses GDP on its “p” past value lags and the idiosyncratic error term with “q” lags, as shown in Equation (4) below.
G D P t = α + i = 1 p β G D P t i + j = 1 q γ E t j + E t

2.3. Model Identification

The study conducted an identification process of testing stationarity and inerrability assumptions to identify the appropriate lags of AR(p) and MA(q) components of the model. Hence, the study displayed graphical and statistical stationary tests using Augmented Dickey–Fuller (ADF) and Philips Parron (PP) tests to check if the series was white noise, as shown below.
  Y t = ρ Y t 1 + ε t
Y t Y t 1 = ρ Y t 1 Y t i 1 + ε t
Y t = ρ 1 Y t 1 + ε t
Y t = δ Y t 1 + ε t
whereby δ equals to ρ 1 , assuming that if |ρ| = 1 then the series is not stationary. The results of the stationarity tests are shown in Figure 3 below.
Figure 3 above presents the graphical demonstration of quarterly GDP growth data of Somalia for the period between 1960 to 2022 in both levels and first differences. The results show that the series at hand has a unit root problem at levels. In other words, the data became stationary after the first difference was conducted. In addition to the pictorial stationarity check, the study also conducted a formal unit root test using both Augmented Dickey–Fuller (ADF) and Philips Parron (PP) tests. Both results confirm the presence of unit root at level time series with 1% MacKinnon p-value statistics, as shown in Table 1 below.
Furthermore, the study ran autocorrelation (ACF) and partial autocorrelation functions (PACF) at both levels and first differences. As shown in Figure 4 below, the results indicate a slow decay of lags at level series compared to sharp cut-off results in the first difference figure, justifying the first difference or order one integration I(1) of the series. Furthermore, ADF and PACF functions specify the potential lag numbers in both AR(p) and MA(q) models. Consequently, given parsimony priority, the first difference of PACF suggests five AR(p) lags while the ACF suggests two MA(q) lags. Hence, the potential ARIMA models of the study include: ARIMA (1,1,1), ARIMA (1,1,2), ARIMA (2,1,1), ARIMA (2,1,2), ARIMA (3,1,1), ARIMA (3,1,2), ARIMA (4,1,1), ARIMA (4,1,2), ARIMA (5,1,1), and ARIMA (5,1,2).

3. Results

In Section 3.2 above, the study confirmed the number of lags and differences needed for the ARIMA (p,d,q) model and suggested ten potential candidate models.

3.1. Model Estimation

In this section, the study estimates those modes to identify the most suitable one for GDP growth-forecasting conditional on a set of criteria proposed by [30]: paramour significance, loglikelihoods, sigma error variance, and Akaike and Bayesian information criteria. Table 2 below presents the results of candidate models.
Table 2 above presents the results of all candidate models for forecasting purposes. Following the ARIMA theoretical framework, we selected the most suitable model by comparing model results based on four criteria (model fitness, sigma volatility, log-likelihood, and Akaike and Bayesian information criteria) outlined in [30]. Table 3 below shows the model selection criteria.
The results in Table 3 above suggest that ARIMA (5,1,2) is the most suitable model for Somalia’s GDP growth-forecasting. The choice of model is justified as being the one with the most significant parameters, the least error variance, the highest log likelihood, and the least Akaike and Bayesian information criteria. Before ARIMA (5,1,2) was eligible for forecasting purposes, the study ran some diagnostics tests.

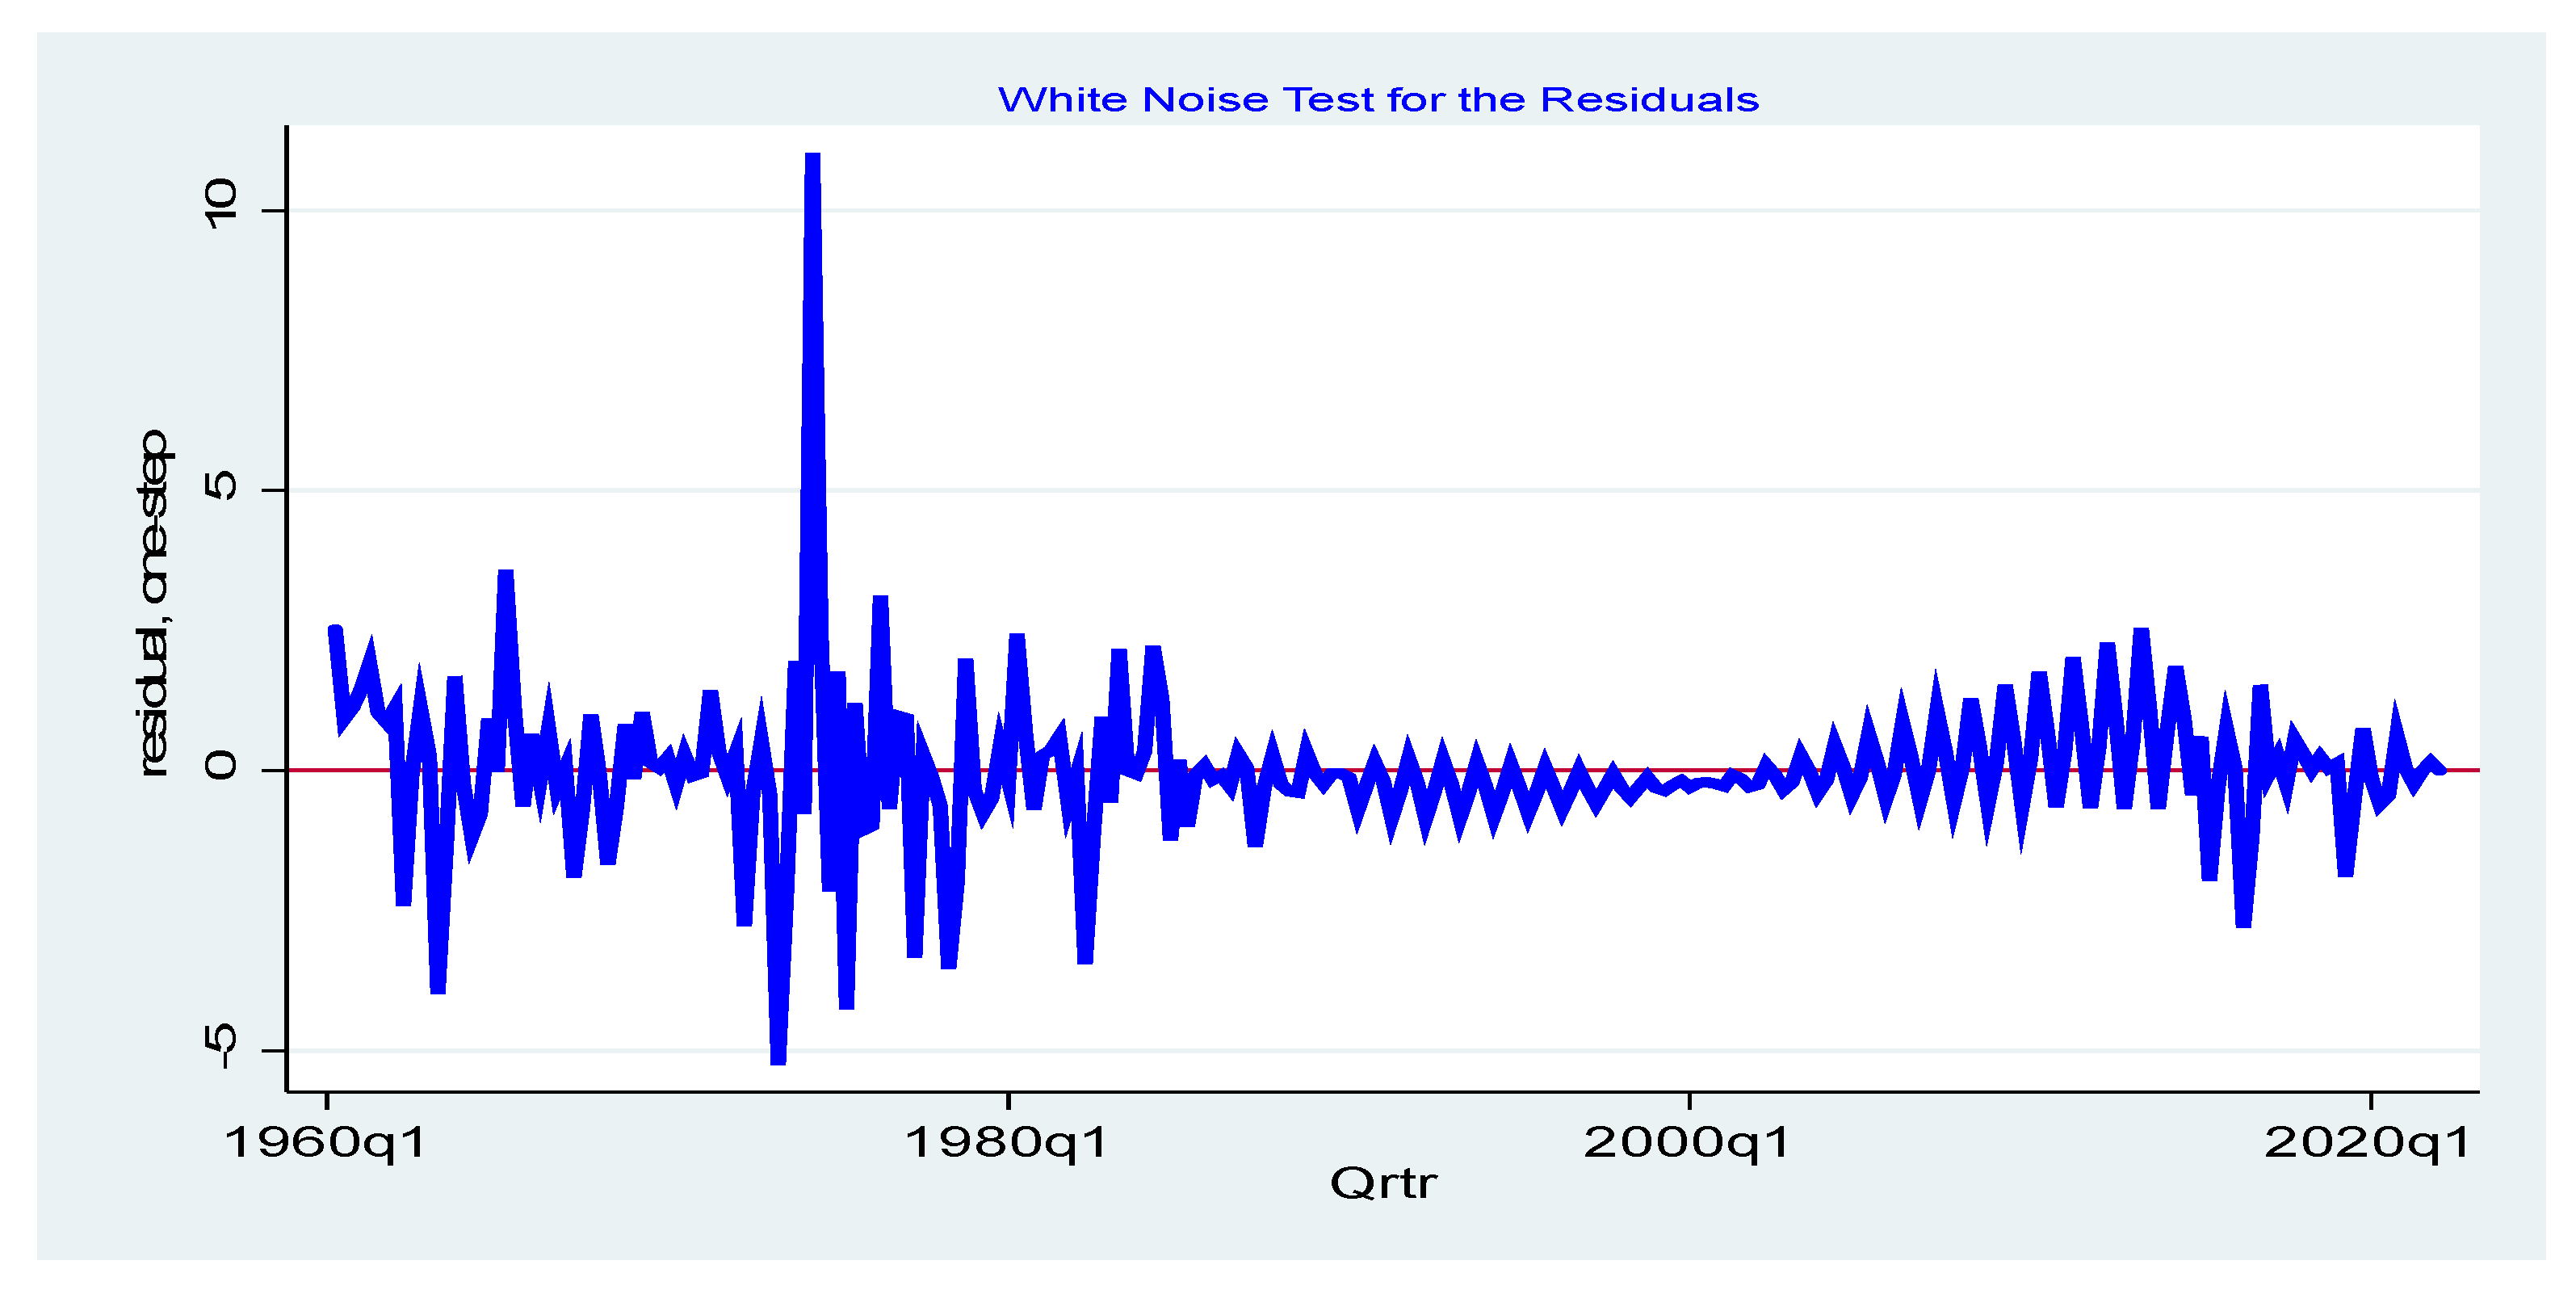
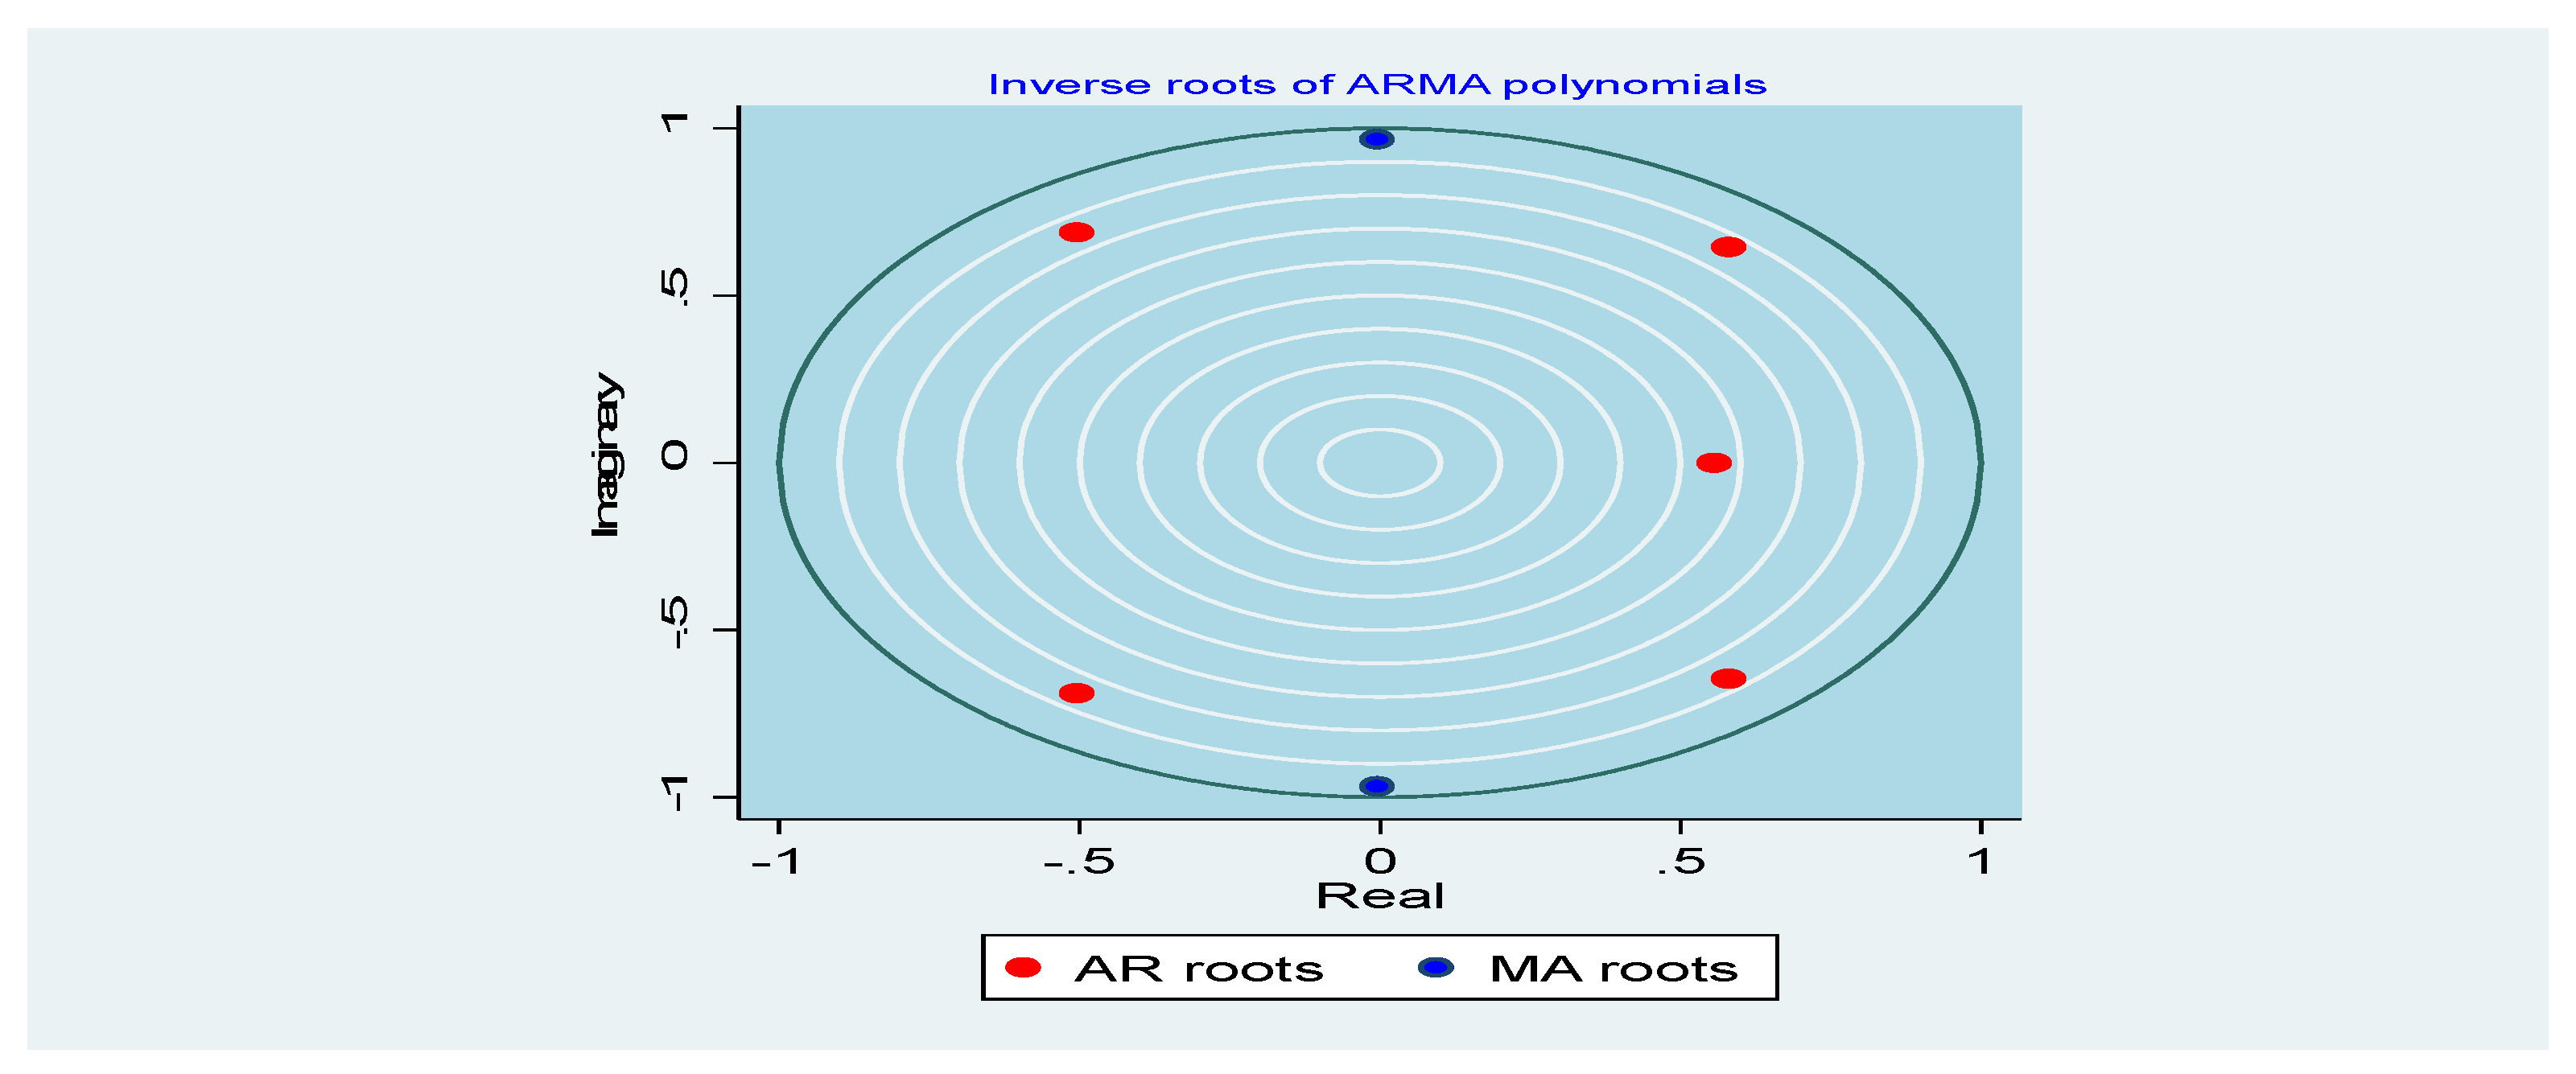
3.2. Model Diagnostics

In Section 3.1, the study proposed ARIMA (5,1,2) as the most appropriate model for economic growth-forecasting. To objectively justify the model selection process, the study ran a test to check if model residuals are white noise and both AR and MA processes are covariance stationary, as shown in Figure 5 below.
Wiggling consistently around the mean, the results in Figure 5 above show that the residuals are white noise and that the series follows a stable univariate process. Moreover, checking that AR and MA processes are covariance stationery, the study ran stationarity and invertibility tests. Figure 6 shows that both AR and MA roots lie inside the unit circle, verifying that the series follows a stable univariate process.

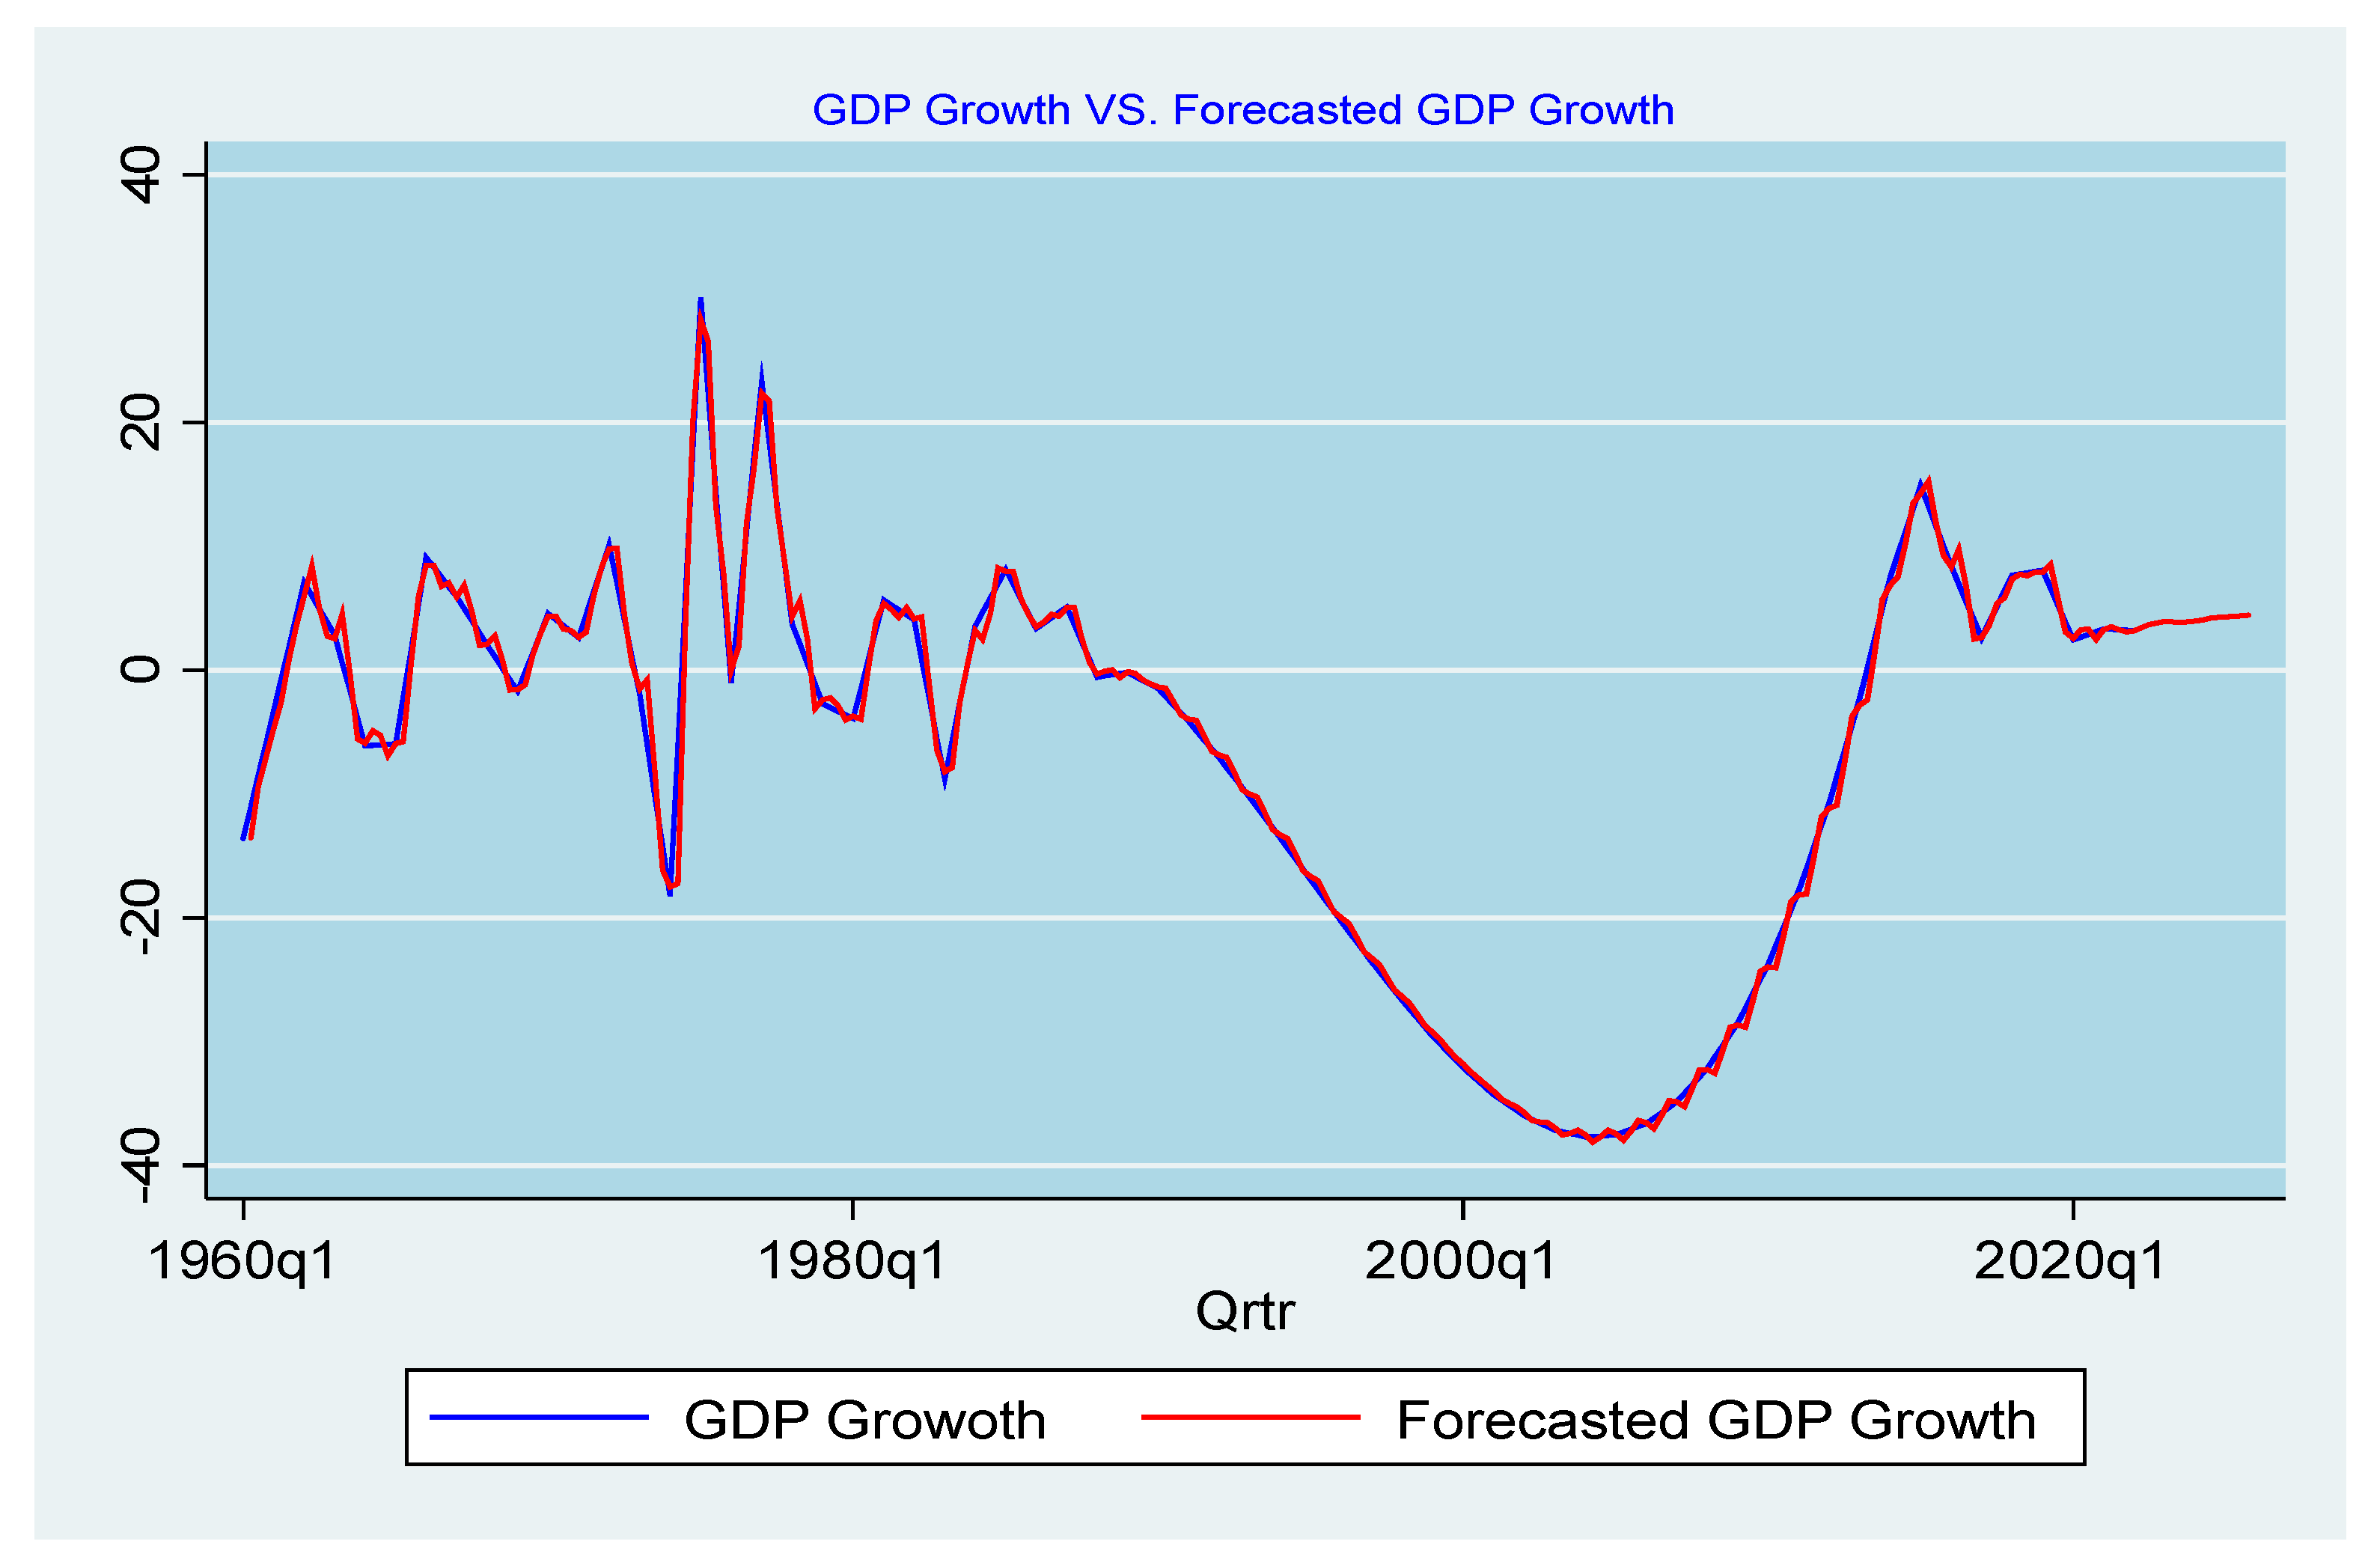
3.3. Model Forecasting

Finally, as the final step of the ARIMA modeling process, this section uses the ARIMA (5,1,2) model selected in Section 3.1 and tested in Section 3.2 to forecast Somalia’s economic growth for fourteen quarters. Figure 7 below presents the out-of-the-sample forecasting results between 2022 quarter three to 2025 quarter four.
Figure 7 presents the major results of the study. Primarily, the results reveal that the trajectory of the upwardly trending economic growth rates will continue for the coming 14 quarters. Specifically, the out-of-the-sample forecast of the Somali GDP growth rate predicts a quarterly average growth rate of about 4 percent for the period between 2022 quarter three to 2025 quarter four, as shown in Table 4 below.

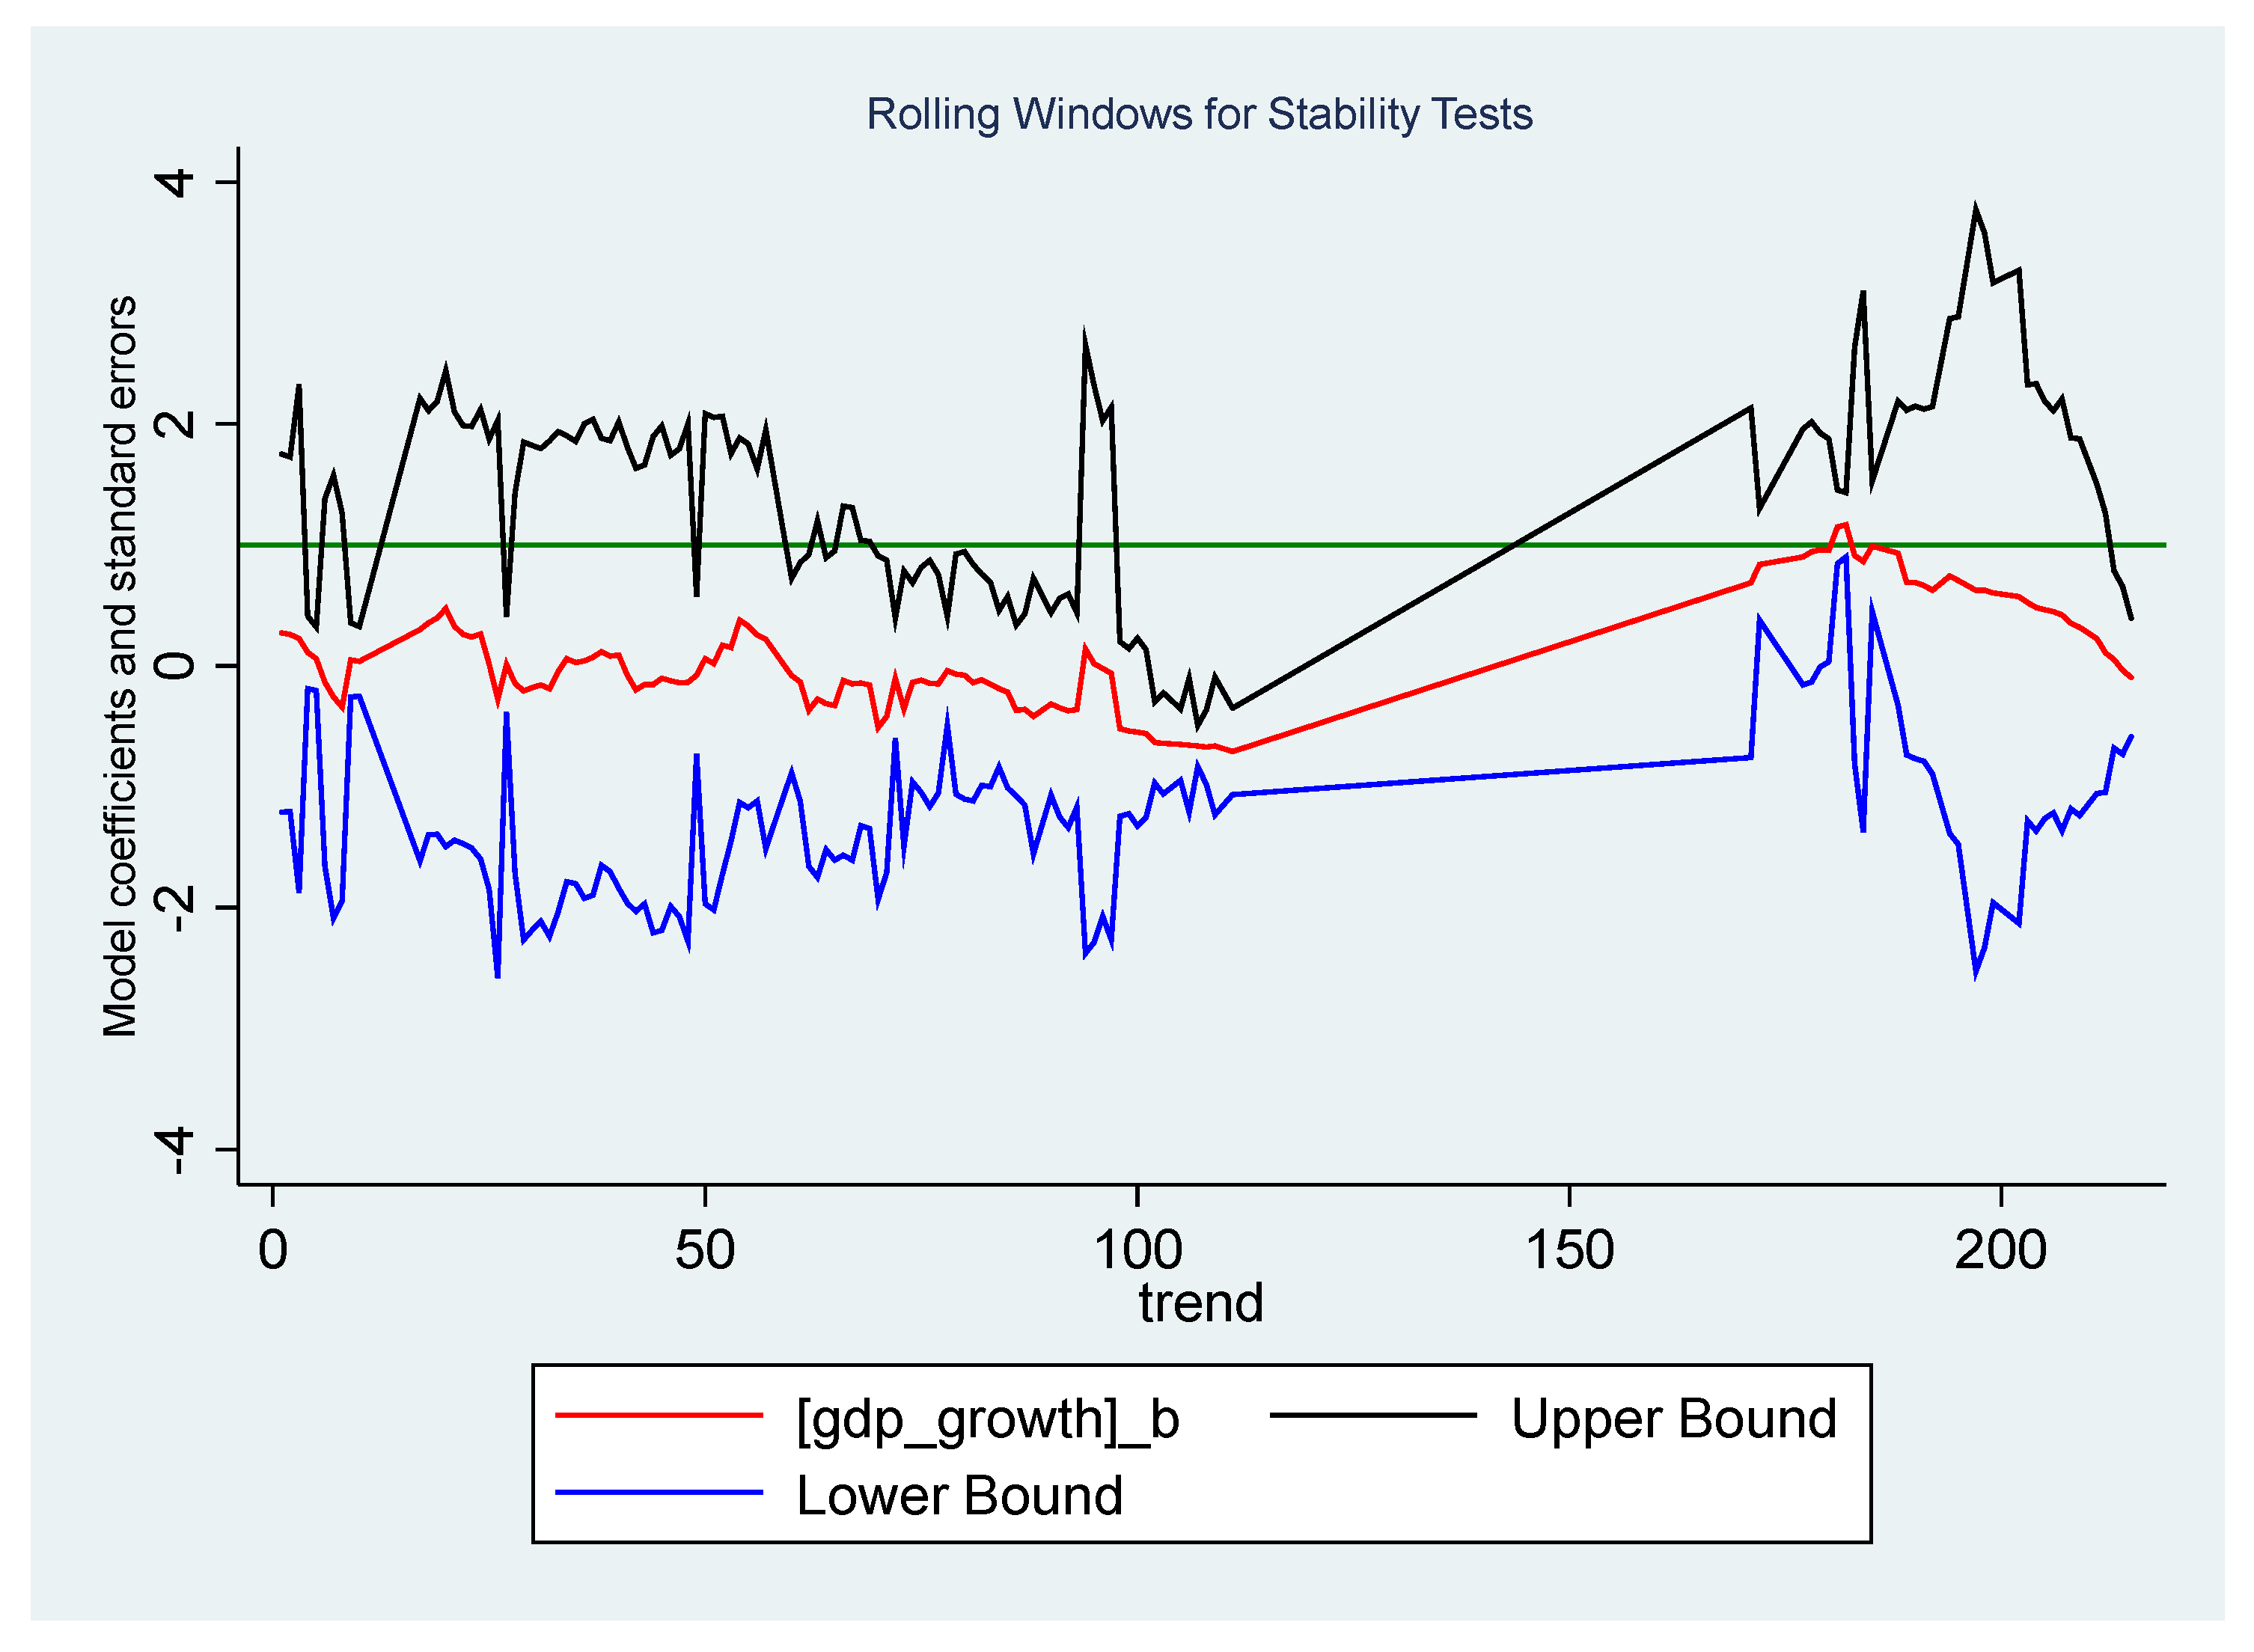
3.4. Robustness Checks

In this subsection, the study tests the stability of the model forecasting results by running a rolling window analysis [31,32,33]. To do this, the research sample is disaggregated into 5 different sub-windows each containing 50 quarters, and the results suggest that the model is stable and suitable for forecasting purposes. As shown in Figure 8 below, the rolling window analysis shows that the model parameters are quite stable within the upper and lower bounds with 95% confidence interval. This implies that we cannot reject the null hypothesis of model stability and hence verifies that the forecasting results are valid.

4. Discussion

The study results have development implications for the current economic policy path followed by Somalia under the guidance of IMF financial disciplines and World Bank donations on targeted project investments. Despite having undergone 1980s Structural Adjustment Program (SAPs) style strict austerity measures of Staff Monitored Programs (SMPs) for the past decade, the results produce good news of future economic growth for the government of Somalia. Hence, the results suggest that the Somali government should remain committed to more SMPs to achieve the conditional long-term debt relief targets. However, the realization of these projections depends on how future economic shocks (both internally and externally) unfold. More specifically, the smooth transition from weak, sporadic growth to more sustainable growth depends on several key factors. First, internal political and security stability is crucial for these predictions to materialize. Second, future developments of droughts, locust infestations, and COVID-19 shocks also matter. Finally, the sustainability of international development partners’ involvement in both short-term budget supports and long-term development investments also plays a significant role in realizing the forecasted growth rates. The study results are in line with Neoclassical and Endogenous growth literature that predict project investments as an indicator of capital accumulation and political stability and policy certainty as an indicator of institutional quality promote economic growth. However, the results contradict the austerity literature and public sector theories that hypothesize effective austerity measures put binding constraints on the nations’ fiscal flexibility and hence diminish future economic growth rates. A reasonable explanation for these results could be that Somalia’s macroeconomy is overly dependent on external support, the government barely provides public services, and the private sector is mostly informal and independent from the state. All these factors combined may justify austerity measures boosting the country’s aid-dependent economic growth.

5. Conclusions and Policy Recommendations

The study aimed at forecasting out-of-the-sample Somalia GDP growth rates for fourteen quarters using an ARIMA (5,1,2) Box–Jenkins model. The results indicate that Somalia’s economy will experience an average growth rate of about 4 percent for the next fourteen quarters. The results imply that, although affected by numerous local insecurity and political instability episodes and painful IMF austerity measures, Somalia’s decades-long economic policy choice was prudent. In addition to expanding ARIMA forecasting literature by adding novel results of a Somalia context, the study results also inform the country’s medium-term economic policy direction. Thus, the study recommends continuing sensible fiscal discipline with optimal public sector employment targets. Moreover, the government should consider exploiting the relatively expanding investments portion of the national budget by wisely devising policy targets like institutional improvements, judicial reforms and expediting resource-sharing laws necessary for the country’s oil and gas explorations. The success of these policy priorities puts Somalia in a better position to appeal to more international attention that can accelerate the pending debt relief initiative in the short run and attract narrowly focused foreign direct investments in the long run. Although the ARIMA model results are robust and suitable for future economic forecasting, caution should be exercised in generalizing the study results due to the linear interpolations and annual data disaggregation conducted to expand the study sample and remedy missing observation limitations. Furthermore, the scope of the study results is limited to GDP growth-forecasting and may not be used to extrapolate for wider development aspects that are currently critical for Somalia, such as poverty reduction and youth employment. Hence, due to these data- and scope-related issues, the paper acknowledges further studies on how the decade-long IMF-advised restrictive austerity measures on Somalia’s economy can still promote inclusive future economic growth without compromising other development targets.

Funding

The Article Processing Charge (APC) of this research was funded by Mogadishu University (MU) under the MU Research Development Grant Initiative (https://mu.edu.so, accessed on 23 November 2022).

Data Availability Statement

The dataset used to produce the estimation and the forecasting results of this study are sourced from the World Bank World Development Indicators (WDI). It can be freely downloaded from the website: https://databank.worldbank.org/source/world-development-indicators. The data were accessed on 25 June 2022.

Acknowledgments

The author would like to sincerely acknowledge the administrative and financial support provided by Mogadishu University; and the technical support offered by Hassan Ali Yusuf and Daud Ali Aser.

Conflicts of Interest

The author declares no conflict of interest.

References

  1. Wang, T. Forecast of Economic Growth by Time Series and Scenario Planning Method—A Case Study of Shenzhen. Mod. Econ. 2016, 07, 212–222. [Google Scholar] [CrossRef] [Green Version]
  2. Sheehey, E.J. The growing gap between rich and poor countries: A proposed explanation. World Dev. 1996, 24, 1379–1384. [Google Scholar] [CrossRef]
  3. Pieterse, J.N. Global inequality: Bringing politics back in. Third World Q. 2002, 23, 1023–1046. [Google Scholar] [CrossRef]
  4. Dabla-Norris, M.E.; Kochhar, M.K.; Suphaphiphat, M.N.; Ricka, M.F.; Tsounta, M.E. Causes and consequences of income inequality: A global perspective. Int. Monet. Fund 2015, 13, 1–39. [Google Scholar] [CrossRef] [Green Version]
  5. Hicks, N.; Streeten, P. Indicators of development: The search for a basic needs yardstick. World Dev. 1979, 7, 567–580. [Google Scholar] [CrossRef]
  6. Van den Berg, H. Economic Growth and Development, 3rd ed.; World Scientific Publishing Company: Singapore, 2016. [Google Scholar]
  7. Nuraini, I.; Hariyani, H.F. Quality Economic Growth as an Indicator of Economic Development. J. Èkon. Pembang. Kaji. Masal. Èkon. Pembang. 2019, 20, 80–86. [Google Scholar] [CrossRef]
  8. Kuznets, S. The American Economic Review; American Economic Association: Nashville, TN, USA, 1955; Volume 1, pp. 3–28. Available online: https://www.jstor.org/stable/1811581 (accessed on 12 March 2022).
  9. Wabomba, M.S.; Mutwiri, M.P.; Fredrick, M. Modeling and Forecasting Kenyan GDP Using Autoregressive Integrated Moving Average (ARIMA) Models. Sci. J. Appl. Math. Stat. 2016, 4, 64. [Google Scholar] [CrossRef] [Green Version]
  10. Dritsaki, C. Forecasting Real GDP Rate through Econometric Models: An Empirical Study from Greece. J. Int. Bus. Econ. 2015, 3, 13–19. [Google Scholar] [CrossRef] [Green Version]
  11. World Bank. Somalia Economic Update: Investing in Health to Anchor Growth; World Bank: Washington, DC, USA, 2021; Available online: https://openknowledge.worldbank.org/handle/10986/36312 (accessed on 3 April 2022).
  12. International Monetary Fund. World Economic Outlook: War Sets Back the Global Recovery. 2022. Available online: https://www.imf.org/en/Publications/WEO/Issues/2022/04/19/world-economic-outlook-april-2022 (accessed on 24 March 2022).
  13. Raddatz, C. Liquidity needs and vulnerability to financial underdevelopment. J. Financ. Econ. 2006, 80, 677–722. [Google Scholar] [CrossRef] [Green Version]
  14. Addison, T. Underdevelopment, transition and reconstruction in sub-Saharan Africa. AgEcon SEARCH 1998, 45, 72. [Google Scholar] [CrossRef]
  15. Korf, B.; Silva, K.T. Poverty, ethnicity and conflict in Sri Lanka. Retrieved Novemb. 2003, 6, 2014. [Google Scholar]
  16. Servén, L. Real-Exchange-Rate Uncertainty and Private Investment in LDCS. Rev. Econ. Stat. 2003, 85, 212–218. [Google Scholar] [CrossRef]
  17. Wang, S.; Lin, X.; Xiao, H.; Bu, N.; Li, Y. Empirical Study on Human Capital, Economic Growth and Sustainable Development: Taking Shandong Province as an Example. Sustainability 2022, 14, 7221. [Google Scholar] [CrossRef]
  18. Umaru, A.; Pate, H.A.; Haruna, A.D. The impact of insecurity and poverty on sustainable economic development in Nigeria. Int. J. Humanit. Soc. Sci. Educ. 2015, 2, 32–48. [Google Scholar]
  19. Sahinoz, S.; Cosar, E.E. Economic policy uncertainty and economic activity in Turkey. Appl. Econ. Lett. 2018, 25, 1517–1520. [Google Scholar] [CrossRef]
  20. Krol, R. Economic Policy Uncertainty and Exchange Rate Volatility. Int. Financ. 2014, 17, 241–256. [Google Scholar] [CrossRef]
  21. Cepni, O.; Guney, I.E.; Swanson, N.R. Forecasting and nowcasting emerging market GDP growth rates: The role of latent global economic policy uncertainty and macroeconomic data surprise factors. J. Forecast. 2019, 39, 18–36. [Google Scholar] [CrossRef]
  22. Segnon, M.; Gupta, R.; Bekiros, S.; Wohar, M.E. Forecasting US GNP growth: The role of uncertainty. J. Forecast. 2018, 37, 541–559. [Google Scholar] [CrossRef] [Green Version]
  23. Pao, H.-T.; Fu, H.-C.; Tseng, C.-L. Forecasting of CO2 emissions, energy consumption and economic growth in China using an improved grey model. Energy 2012, 40, 400–409. [Google Scholar] [CrossRef]
  24. Pao, H.-T.; Tsai, C.-M. Modeling and forecasting the CO2 emissions, energy consumption, and economic growth in Brazil. Energy 2011, 36, 2450–2458. [Google Scholar] [CrossRef]
  25. Mourougane, A.; Roma, M. Can confidence indicators be useful to predict short term real GDP growth? Appl. Econ. Lett. 2003, 10, 519–522. [Google Scholar] [CrossRef] [Green Version]
  26. Chuku, C.; Simpasa, A.; Oduor, J. Intelligent forecasting of economic growth for developing economies. Int. Econ. 2019, 159, 74–93. [Google Scholar] [CrossRef]
  27. Chuku, C.; Oduor, J.; Simpasa, A. Intelligent forecasting of economic growth for African economies: Artificial neural networks versus time series and structural econometric models. Wash. Res. Program Forecast. 2017, 1, 28. [Google Scholar]
  28. Zakai, M. A time series modeling on GDP of Pakistan. J. Contemp. Issues Bus. Res. 2014, 3, 200–210. [Google Scholar]
  29. Abonazel, M.; Abd-Elftah, A.I. Forecasting Egyptian GDP using ARIMA modes. Rep. Econ. Financ. 2019, 5, 35–47. [Google Scholar] [CrossRef]
  30. Box, G.E.P.; Jenkins, G.M. Time Series Analysis: Forecasting and Control; revised edition; Holden Day: San Francisco, CA, USA, 1976. [Google Scholar]
  31. Zolfaghari, M.; Gholami, S. A hybrid approach of adaptive wavelet transform, long short-term memory and ARIMA-GARCH family models for the stock index prediction. Expert Syst. Appl. 2021, 182, 115149. [Google Scholar] [CrossRef]
  32. Girish, G. Spot electricity price forecasting in Indian electricity market using autoregressive-GARCH models. Energy Strat. Rev. 2016, 11–12, 52–57. [Google Scholar] [CrossRef]
  33. Vo, N.; Ślepaczuk, R. Applying Hybrid ARIMA-SGARCH in Algorithmic Investment Strategies on S&P500 Index. Entropy 2022, 24, 158. [Google Scholar] [CrossRef]
Figure 1. Somalia GDP growth rates.
Forecasting 04 00056 g001
Figure 2. Annual budget of the Somali Federal Government.
Forecasting 04 00056 g002
Figure 3. Graphical stationary test with level GDP at (left panel) and first difference GDP at (right panel).
Forecasting 04 00056 g003
Figure 4. ACF and PACF graphs show lag orders of both AR and MA components.
Forecasting 04 00056 g004
Figure 5. White noise test for time series residuals.
Forecasting 04 00056 g005
Figure 6. Covariance stationery test for both AR and MA components.
Forecasting 04 00056 g006
Figure 7. Out of the sample forecasted GDP growth.
Forecasting 04 00056 g007
Figure 8. Rolling window analysis for model stability tests.
Forecasting 04 00056 g008
Table 1. Formal stationary tests using both ADF and PP tests.
Augmented Dickey–Fuller Test (ADF) Phillips-Perron Test (PP)
LevelsMacKinnon p-ValueFrist DiffMacKinnon p-ValueLevelsMacKinnon p-ValueFrist DiffMacKinnon p-Value
L.GDP Growth−0.023580.2038−0.449760.00000.986170.76940.633210.0000
D.GDP Growth0.645930.20380.223530.0000
Trend−0.001460.2038 −0.000710.7694
Constant0.033370.2038−0.039440.00000.060720.7694−0.030980.0000
Table 2. ARIMA results.
(1)(2)(3)(4)(5)(6)(7)(8)(9)(10)
VARIABLESARIMA
(1,1,1)
ARIMA
(1,1,2)
ARIMA
(2,1,1)
ARIMA
(2,1,2)
ARIMA
(3,1,1)
ARIMA
(3,1,2)
ARIMA
(4,1,1)
ARIMA
(4,1,2)
ARIMA
(5,1,1)
ARIMA
(5,1,2)
L.ar0.485 ***0.493 ***1.346 ***0.669 ***0.991 ***0.637 ***0.01400.587 ***0.680 ***0.704 ***
(0.0420)(0.0230)(0.0584)(0.0370)(0.109)(0.0331)(0.297)(0.0383)(0.205)(0.0527)
L.ma0.259 ***0.00546−0.604 ***−0.00705−0.333 ***−0.007111.044 ***0.005400.1790.0109
(0.0803)(0.0406)(0.0822)(0.0433)(0.106)(0.0371)(0.0245)(0.720)(0.256)(0.0480)
L2.ma 1.000 1.000 1.000 1.000 0.936 ***
(0.000) (0.000) (0.000) (271.6) (0.0225)
L2.ar −0.628 ***−0.340 ***−0.192−0.276 ***0.405 ***−0.377 ***0.0757−0.394 ***
(0.0532)(0.0357)(0.131)(0.0349)(0.0276)(0.0491)(0.167)(0.0576)
L3.ar −0.266 ***−0.0942 ***0.01210.164 ***3.71 × 10−50.259 ***
(0.0715)(0.0244)(0.306)(0.0490)(0.0824)(0.0653)
L4.ar −0.587 ***−0.409 ***−0.710 ***−0.597 ***
(0.0273)(0.0498)(0.0553)(0.0652)
L5.ar 0.468 ***0.305 ***
(0.0852)(0.0650)
Constant0.07886140.06752380.05650550.06751670.05876750.06497550.05589760.05525980.07685760.0621376
Observations250250250250250250250250250250
Standard errors in parentheses *** p < 0.01.
Table 3. Model selection criteria.
Model Section Process
ModelsSignificanceSigmaLoglikelihoodAICBICBest Model
ARIMA (1,1,1)2/31.945216−517.19541042.3911056.444
ARIMA (1,1,2)1/41.565433−468.2262944.4523958.5061
ARIMA (2,1,1)3/41.845577−504.29561018.5911036.158
ARIMA (2,1,2)2/51.475717−453.367916.734934.3012
ARIMA (3,1,1)3/51.803765−498.69271009.3851030.466
ARIMA (3,1,2)3/61.468036−452.2701916.5402937.6208
ARIMA (4,1,2)3/61.362904−441.5866897.1732921.7672
ARIMA (4,1,2)4/71.33876−429.9177875.8355903.9429
ARIMA (5,1,1)3/81.422986−440.9773897.9546926.062
ARIMA (5,1,2)6/81.292778−419.1822856.3644887.9852
Model choiceARIMA (5,1,2)ARIMA (5,1,2)ARIMA (5,1,2)ARIMA (5,1,2)ARIMA (5,1,2)ARIMA (5,1,2)
Table 4. Out-of-the sample forecasted GDP growth for fourteen quarters.
QuarterForecasted GDP Growth Rates
2022q33.706963
2022q43.826241
2023q13.933865
2023q23.90751
2023q33.85275
2023q43.901956
2024q13.968435
2024q24.075136
2024q34.206374
2024q44.27282
2025q14.315757
2025q24.355294
2025q34.382552
2025q44.442555
Publisher’s Note: MDPI stays neutral with regard to jurisdictional claims in published maps and institutional affiliations.

