Communication

Survival Times of Transplanted Kidneys Among Different Donor–Recipient Cohorts: The United States Registry Analysis from 1987 to 2018, Part 1: Gender and Ethnicity

by
Nezamoddin N. Kachouie
*,†,
Alain Despeignes
and
Daniel Breininger
Department of Mathematics and Systems Engineering, Florida Institute of Technology, Melbourne, FL 32901, USA
*
Author to whom correspondence should be addressed.
These authors contributed equally to this work.
Submission received: 9 September 2024 / Revised: 17 December 2024 / Accepted: 21 December 2024 / Published: 26 December 2024

Abstract

Over seven thousand people on average die each year in the United States waiting for an organ transplant due to the shortage of donated organs. With this alarming concern, efforts from the health organizations like the United Network Organ Sharing (UNOS) and government officials, by sharing the transplant data, inspire the investigation of the characteristics among donors and recipients that affects the longevity of donated organs. The goal of this study is to investigate the survival time of transplanted kidneys from 1987 to 2018 regarding the donors’ and the recipients’ characteristics. Survival analysis is performed to determine the characteristics associated with survival time of transplanted kidneys. Our results indicate that there is a noticeable correlation between the survival time and the matching ethnicity of donor and recipient. However, the optimal survival time was not necessarily associated with the matching genders of donor and recipient. It was observed that, on average, the male-to-female kidney transplant has a longer survival time. The premise of this study was the use of statistical analysis methods to identify general trends in survival times of transplanted kidneys among different patient cohorts available through the UNOS registry. We must emphasize that the context of this research is bounded within the domain of statistical analysis and within the scope of the methods that were employed in this study. The outcomes of this study are of statistical interest, with potential clinical significance.

1. Introduction

The South-Eastern Organ Procurement Foundation (SEOPF), established in 1977, was the first organization to develop a computerized system to use medical information to match organ donors with transplant candidates. In 1984, they became the United Network for Organ Sharing (UNOS), a private, non-profit organization that manages the nation’s organ transplant system under contract with the federal government. UNOS involvement in the organ transplant network varies across several fields and concentrations, which include but are not limited to, the management of the nation’s waiting list of organ transplants and educating the public and professionals alike about the importance of organ donation and transplant [1].
One of the main challenges faced by UNOS is the allocation of resources caused by overwhelming organ demand [2,3]. Different methods to allocate resources have been used and improvements have been made in trying to bridge the gap between supply of and demand for organs. Nevertheless, the supply does not meet the increasing demand for organs [4] and organ donation programs cannot meet the staggering demand in the United States [3]. One approach that may contribute to increasing the number of donors could be offering potential incentives such as reduced fees when renewing a license or registration to encourage them to register with the NHS organ donor national list. The investment in therapeutic cloning for organs may be another way to improve the organ supply [5]. This process will reduce the waiting time and eliminate the potential organ rejection, which is another existing problem with organ transplantation. Since organ donation is scarce, optimizing the life expectancy of the allocated organs is insightful regarding gender and ethnicity of donors and recipients. This means that determining the characteristics of a donor and the potential recipients may prolong the life of the transplanted organ.
Our previous studies assessed the survival time of transplanted hearts and lungs in reference to donor’s age, gender, history of cancer, history of smoking, and blood type [6]. This paper was also proceeded by our study outlining the impact of donors’ characteristics on the survival time of transplanted kidneys between 1987 and 2010 in the US, and investigated the effect of the Organ Procurement and Transplantation Network (OPTN) plan on the survival time of transplanted kidneys [7]. The effect of the OPTN committee plan set in 2003 was investigated and it was observed that the proportion of failed transplanted kidneys between 2003 and 2010 in comparison with previous time intervals had decreased. This decrease suggests the potential success of the OPTN committee plan in 2003, along with increasing the number of kidney transplants within these same years.
This research is a continuation of our previous work to find the donor–recipient characteristic(s) with a positive impact on the longevity of transplanted kidneys. Three important donor–recipient characteristics, namely, gender, blood type, and ethnicity, were investigated in this study. In this paper, kidney survival times relating to gender and ethnicity of donors and recipients are discussed. The second part (follow-up paper) is focused on kidney survival times relating to blood type and its interaction with gender and ethnicity. We would also like to elaborate that the survival time of a kidney transplant (in days) might be statistically significant, but in the realm of clinical interpretation, this may not be the case. For example, a 45-day difference between the survival times of kidneys received by two recipients may be statistically significant but may not necessarily be significant in terms of clinical evaluation.

2. Methods

2.1. Design, Setting, and Instrument for Data Collection

The OPTN’s secure transplant information database contains all national data on the candidate waiting list, organ donation and matching, and transplantation. This system is critical in helping organ transplant institutions match waiting candidates with donated organs. Institutions also rely on the database to manage time-sensitive, life-critical data of all candidates, before and after their transplants [7]. UNOS developed the online database system UNetSM to collect, store, analyze, and publish all OPTN data that pertain to the patient waiting list, organ matching, and number of transplants performed. The OPTN has tracked every organ donation and transplant event occurring in the U.S. since 1 October 1987. Transplant hospitals, histocompatibility laboratories, and organ procurement organizations enter data into the OPTN database in UNetSM. Pre-transplant information is derived primarily from the waitlist and match runs. Transplant professionals enter some pre-transplant information about both candidates and recipients, and post-transplant information about recipients, on organ-specific OPTN data collection forms. Information used to reconcile donor and recipient data about the transplant is entered on the Donor Organ Disposition record. It must be pointed out that each kidney transplant procedure encompasses a donor–recipient pair. The participants in the procedure, i.e., the donor and the recipient, are independent of each other and, hence, the paired t-test is not a relevant statistic in this study.

2.2. Data Analysis

2.2.1. Kaplan Meier (KM)

Kaplan Meier estimators along with random type I censoring were employed to model the graft failure time for survival analysis [8,9,10,11]. The Kaplan Meier (KM) estimator of the survival time is defined by:
S ^ t = t j t   ( 1 d j r j )
where t j is the time of the observed event(s), d j is the number of events (here, failed grafts) happening at time   t j , and   r j is the number of surviving grafts (did not fail or have been censored) up to time t j .
We used the KM method by utilizing right-censored data for our donor–recipient pair to identify the survival status of the transplanted kidneys. Right censoring takes place when the event of interest has not been observed during the study. In turn, if a transplanted kidney had not failed by the end date of the study, it would have been censored and removed from the list of failed transplants. The survival times (in days) of failed transplants are then recorded for further analysis of transplanted kidneys.

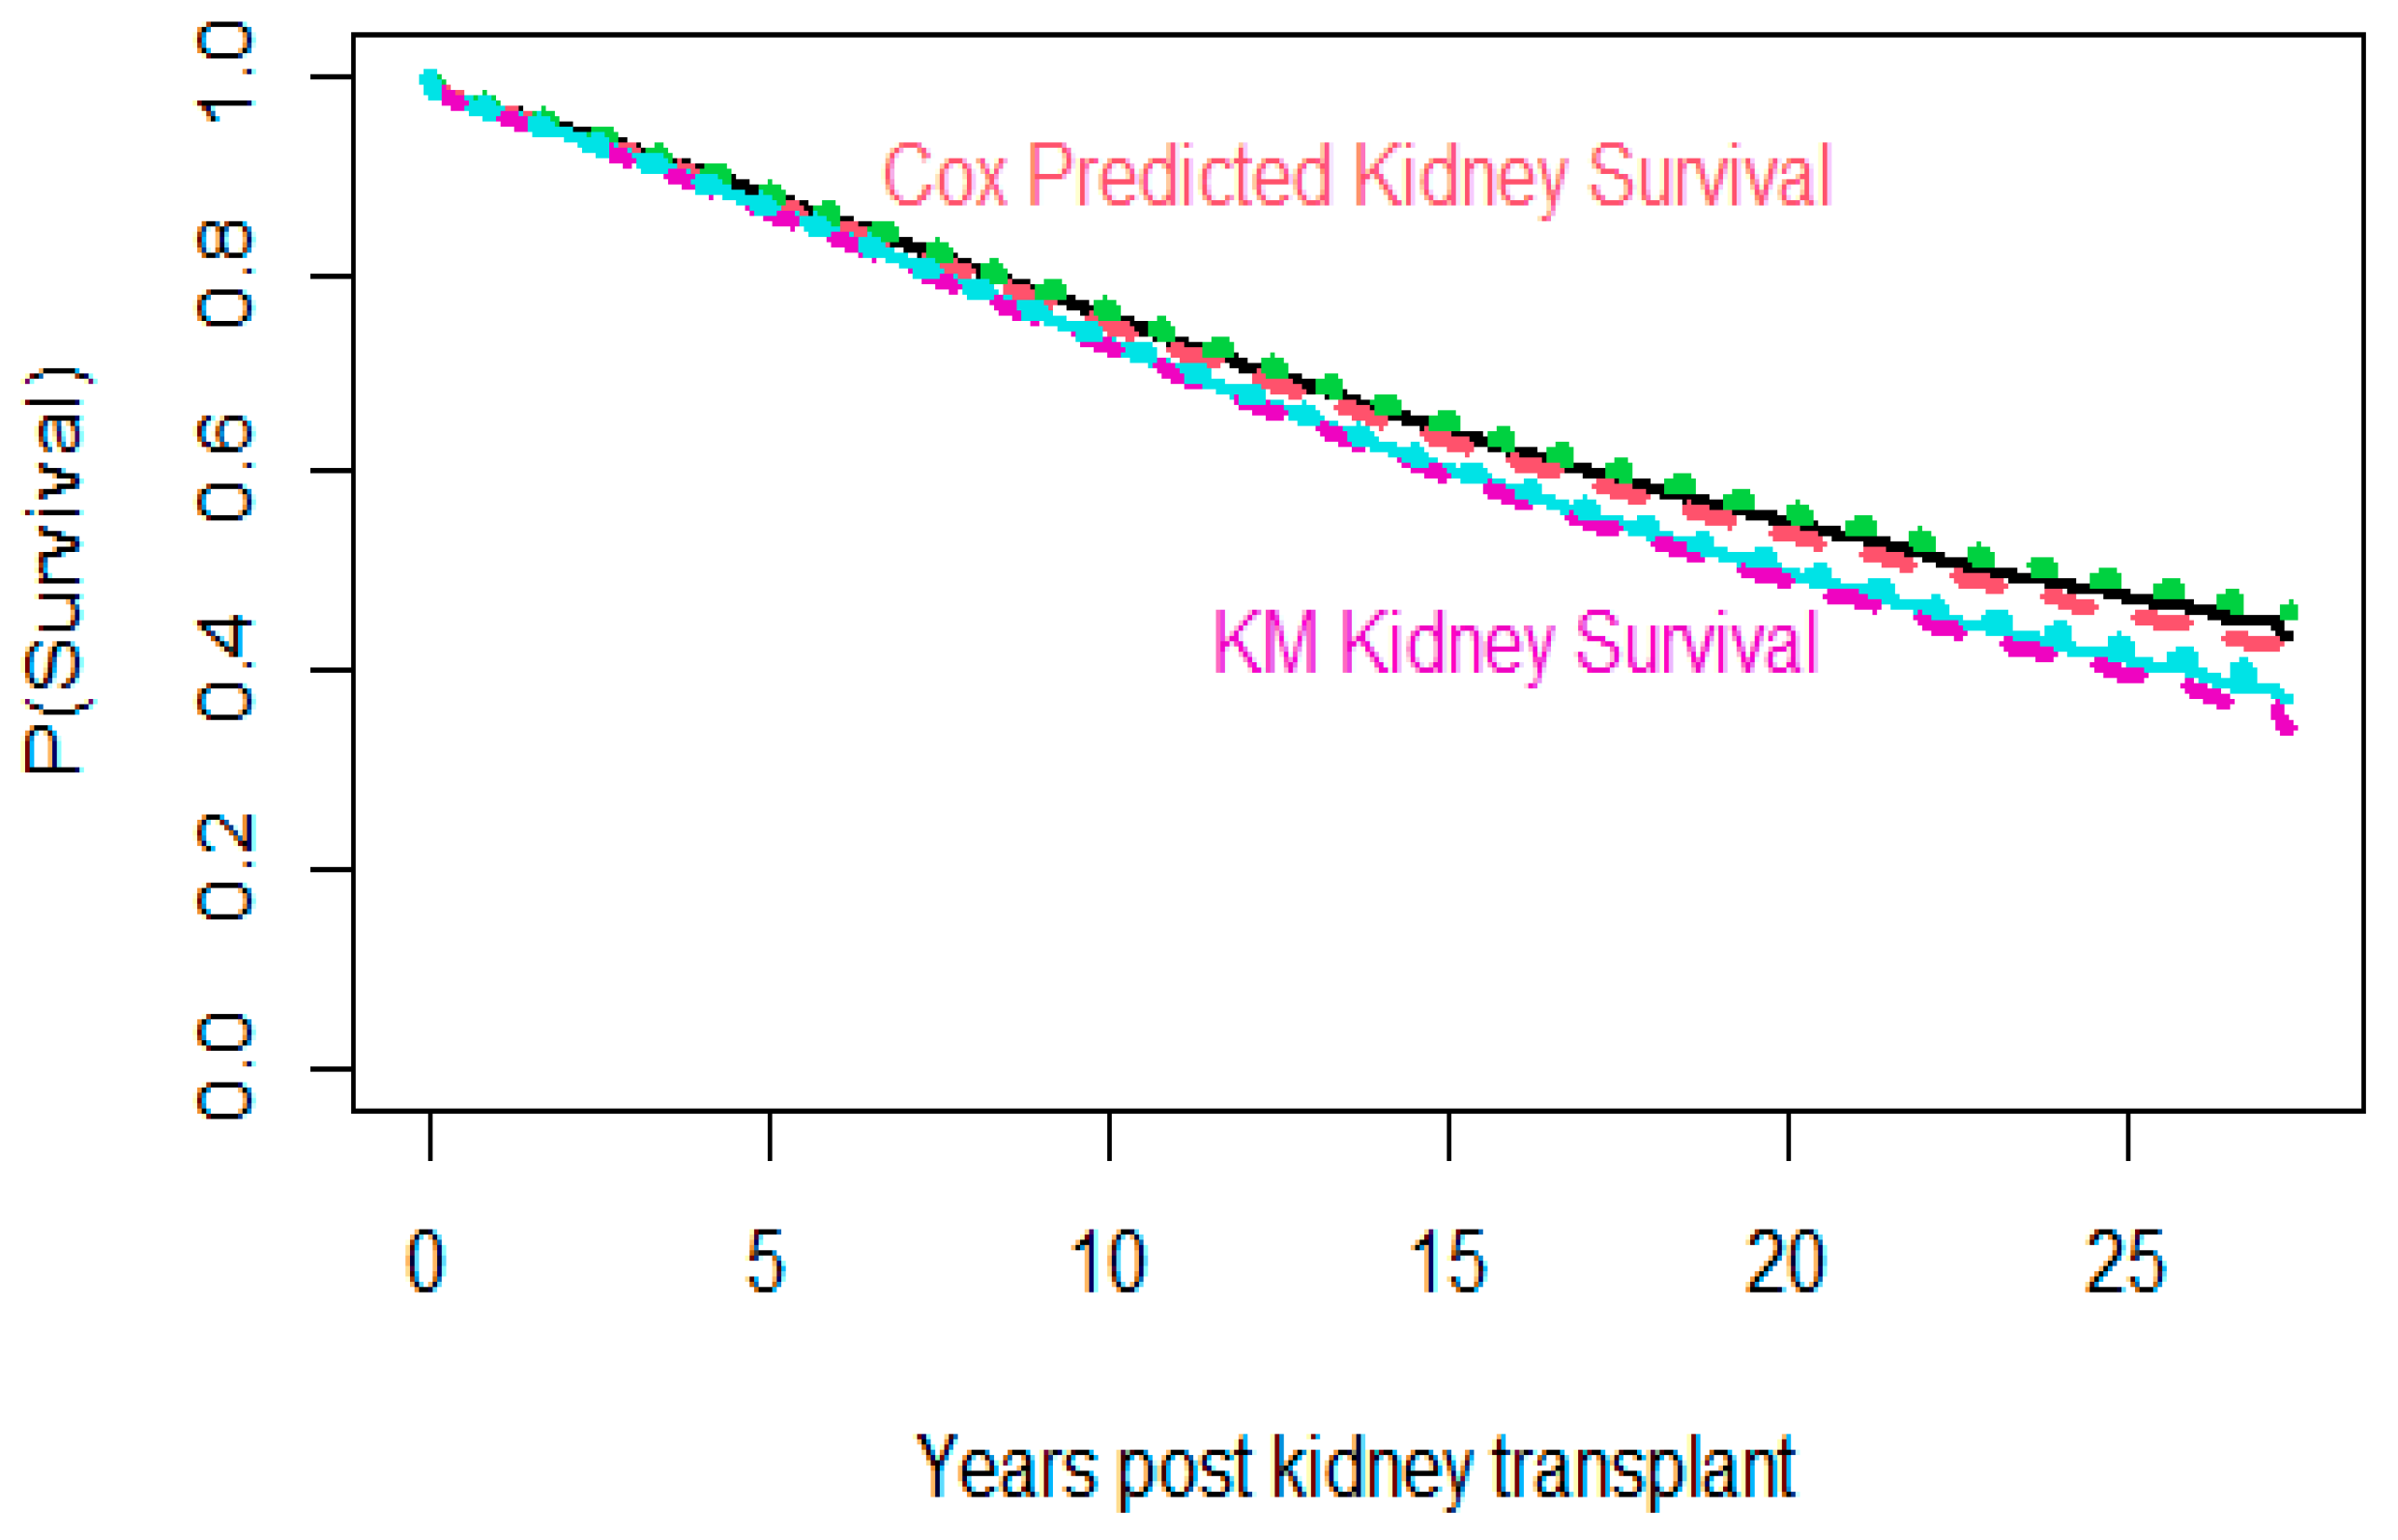
2.2.2. Cox Proportional Hazard (Cox PH)

The Cox proportional hazard provides an expression for the hazard function at time t for an individual with a given set of explanatory variables [12,13,14,15]. The model is generally used in medical research to study the relationship between the survival time of patients and at least one indicator factor. The Cox PH models the hazard by:
h t , x = h 0 t e θ T x
where h 0 t is an arbitrary baseline hazard that is a function of time t , and x is a vector of explanatory variables.

3. Results

The survival time of transplanted kidneys from 1987 to 2018 with regard to the donors’ and the recipients’ characteristics was investigated. Statistical analysis methods were applied to identify general trends in survival times of transplanted kidneys among different patient cohorts. Data were sourced and are available through the UNOS registry.
The mean and standard deviation of survival times were calculated and, along with boxplots, were used to visualize survival among different cohorts [16,17,18]. The Kaplan Meier estimator was utilized to compare the survival of different cohorts. The optimal survival times of transplanted kidneys were identified with regard to the gender and ethnicity of both donors and recipients.

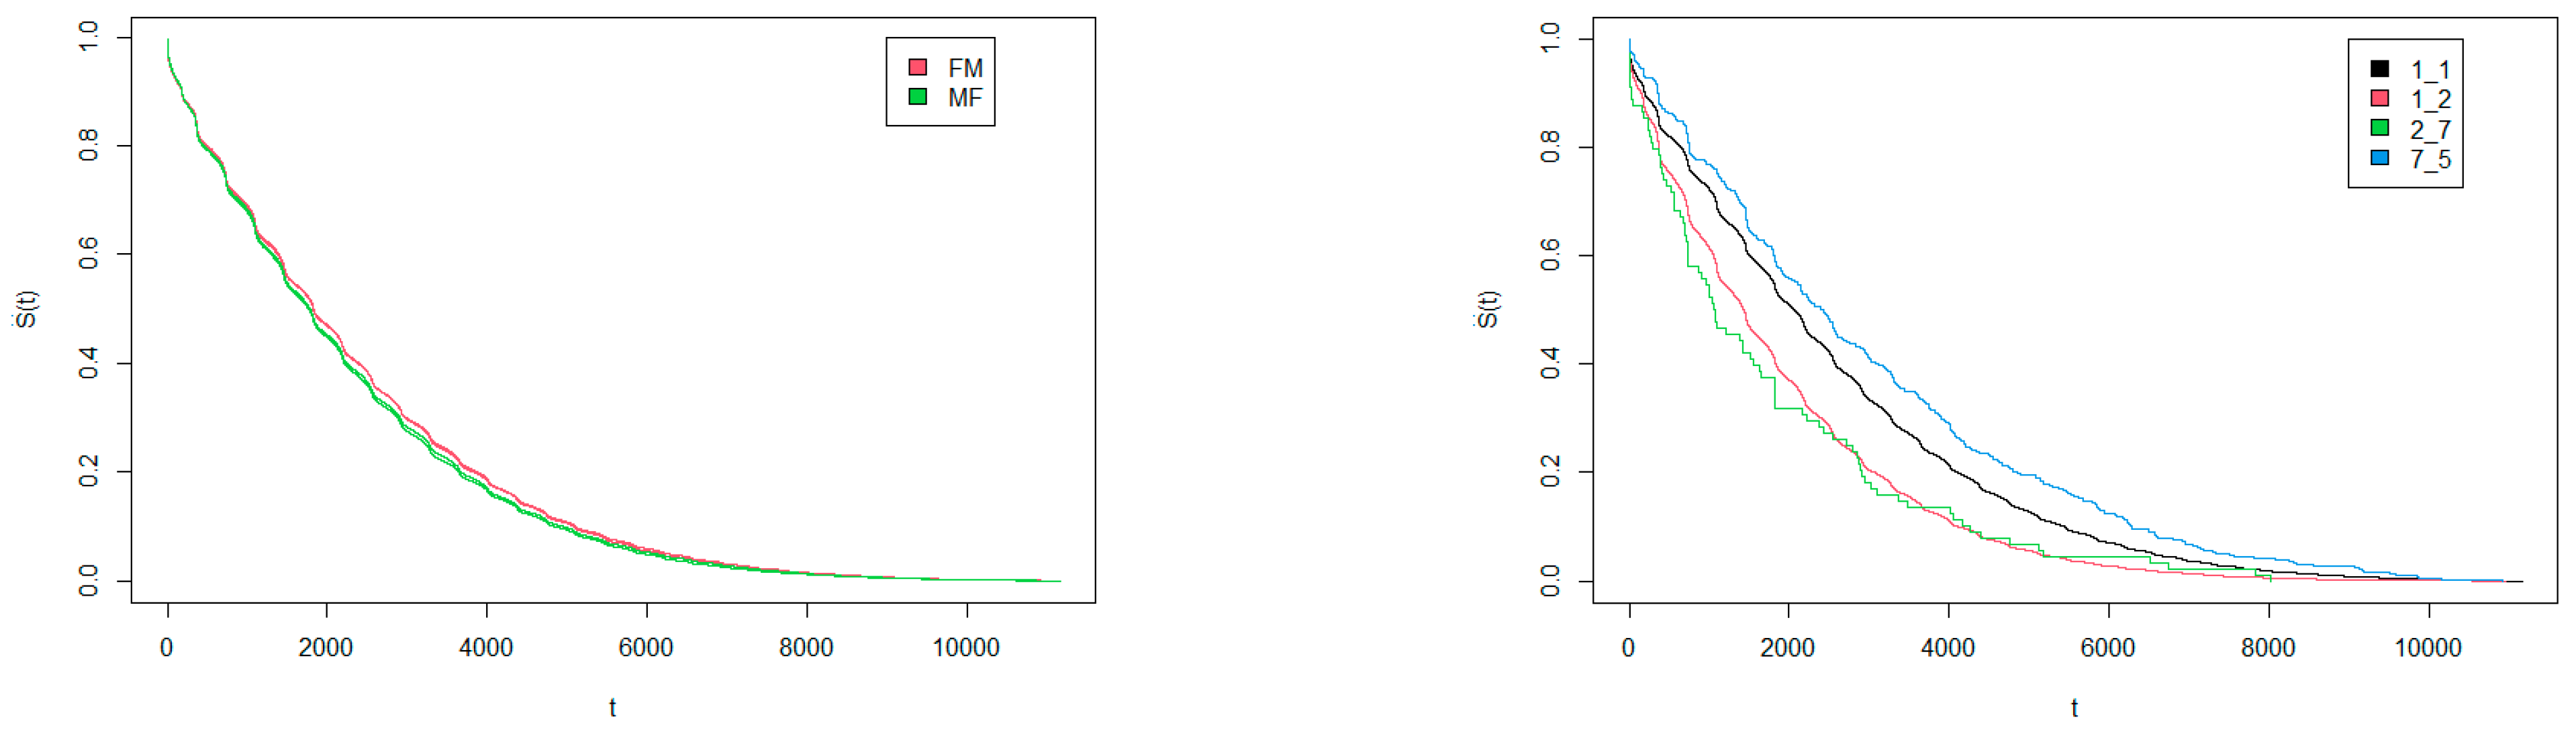
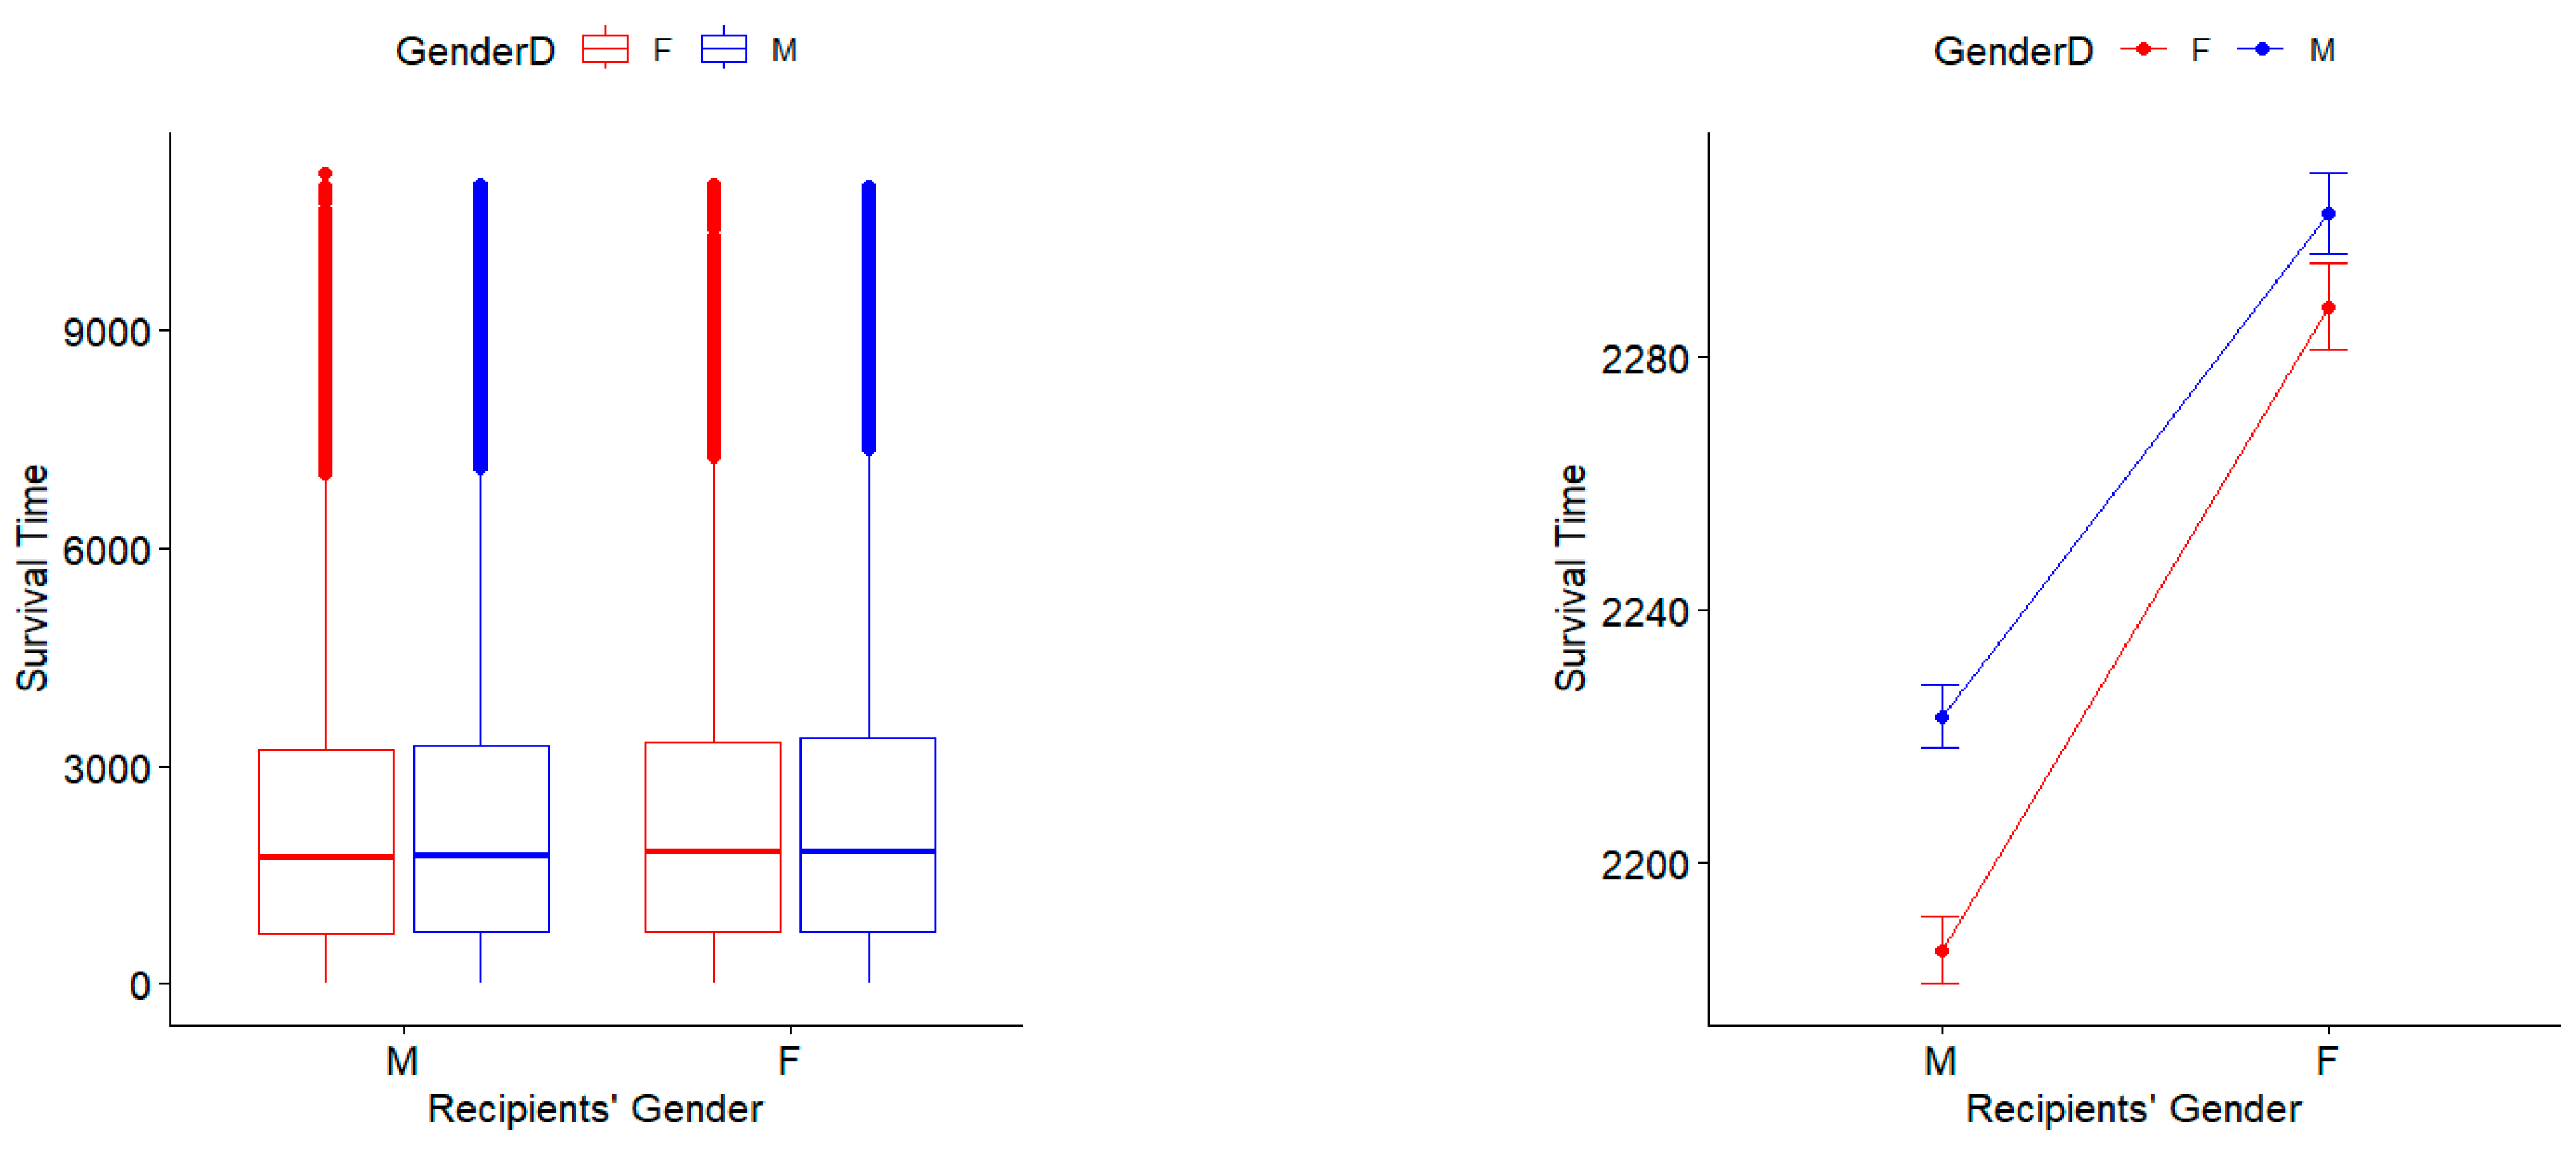
3.1. Survival Times Regarding Gender Match of Donors and Recipients

Donor’s and recipient’s genders are important factors regarding survival times of kidney transplants [19,20,21]. Kidney survival times were analyzed and compared among genders to identify the gender match associated with the optimal survival time. Kaplan Meier survival curves and boxplots for donors and recipients of different genders are depicted in Figure 1. As can be observed in Figure 1 (top left), kidneys survived longer when they were transplanted from male donors to female recipients (MF), but there was no significant statistical difference compared with female-to-female transplants (FF). Conversely, the mean survival time of kidney transplants of male donors to male recipients (MM) was less than that of FF. The number of MM kidney transplants was 149,982, in comparison with 82,430 FF kidney transplants. It shows the number of MM transplants was 55% higher than that of FF transplants. The bean plots in Figure 1 (bottom) depict the distributions, means (blue), and medians (red) of kidney survival times. Figure 1 (bottom left) depicts the survival times of organs from a given donor’s gender, regardless of the recipient’s gender. Both distributions provide similar right-skewed distributions, with male donors having higher mean and median survival times in comparison to female donors. Figure 1 (bottom right) depicts the survival times of organs from a given recipient’s gender, regardless of the donor’s gender. Both distributions were like the right-skewed distributions provided in Figure 1 (bottom left), with female recipients having higher mean and median survival times in comparison with male recipients.

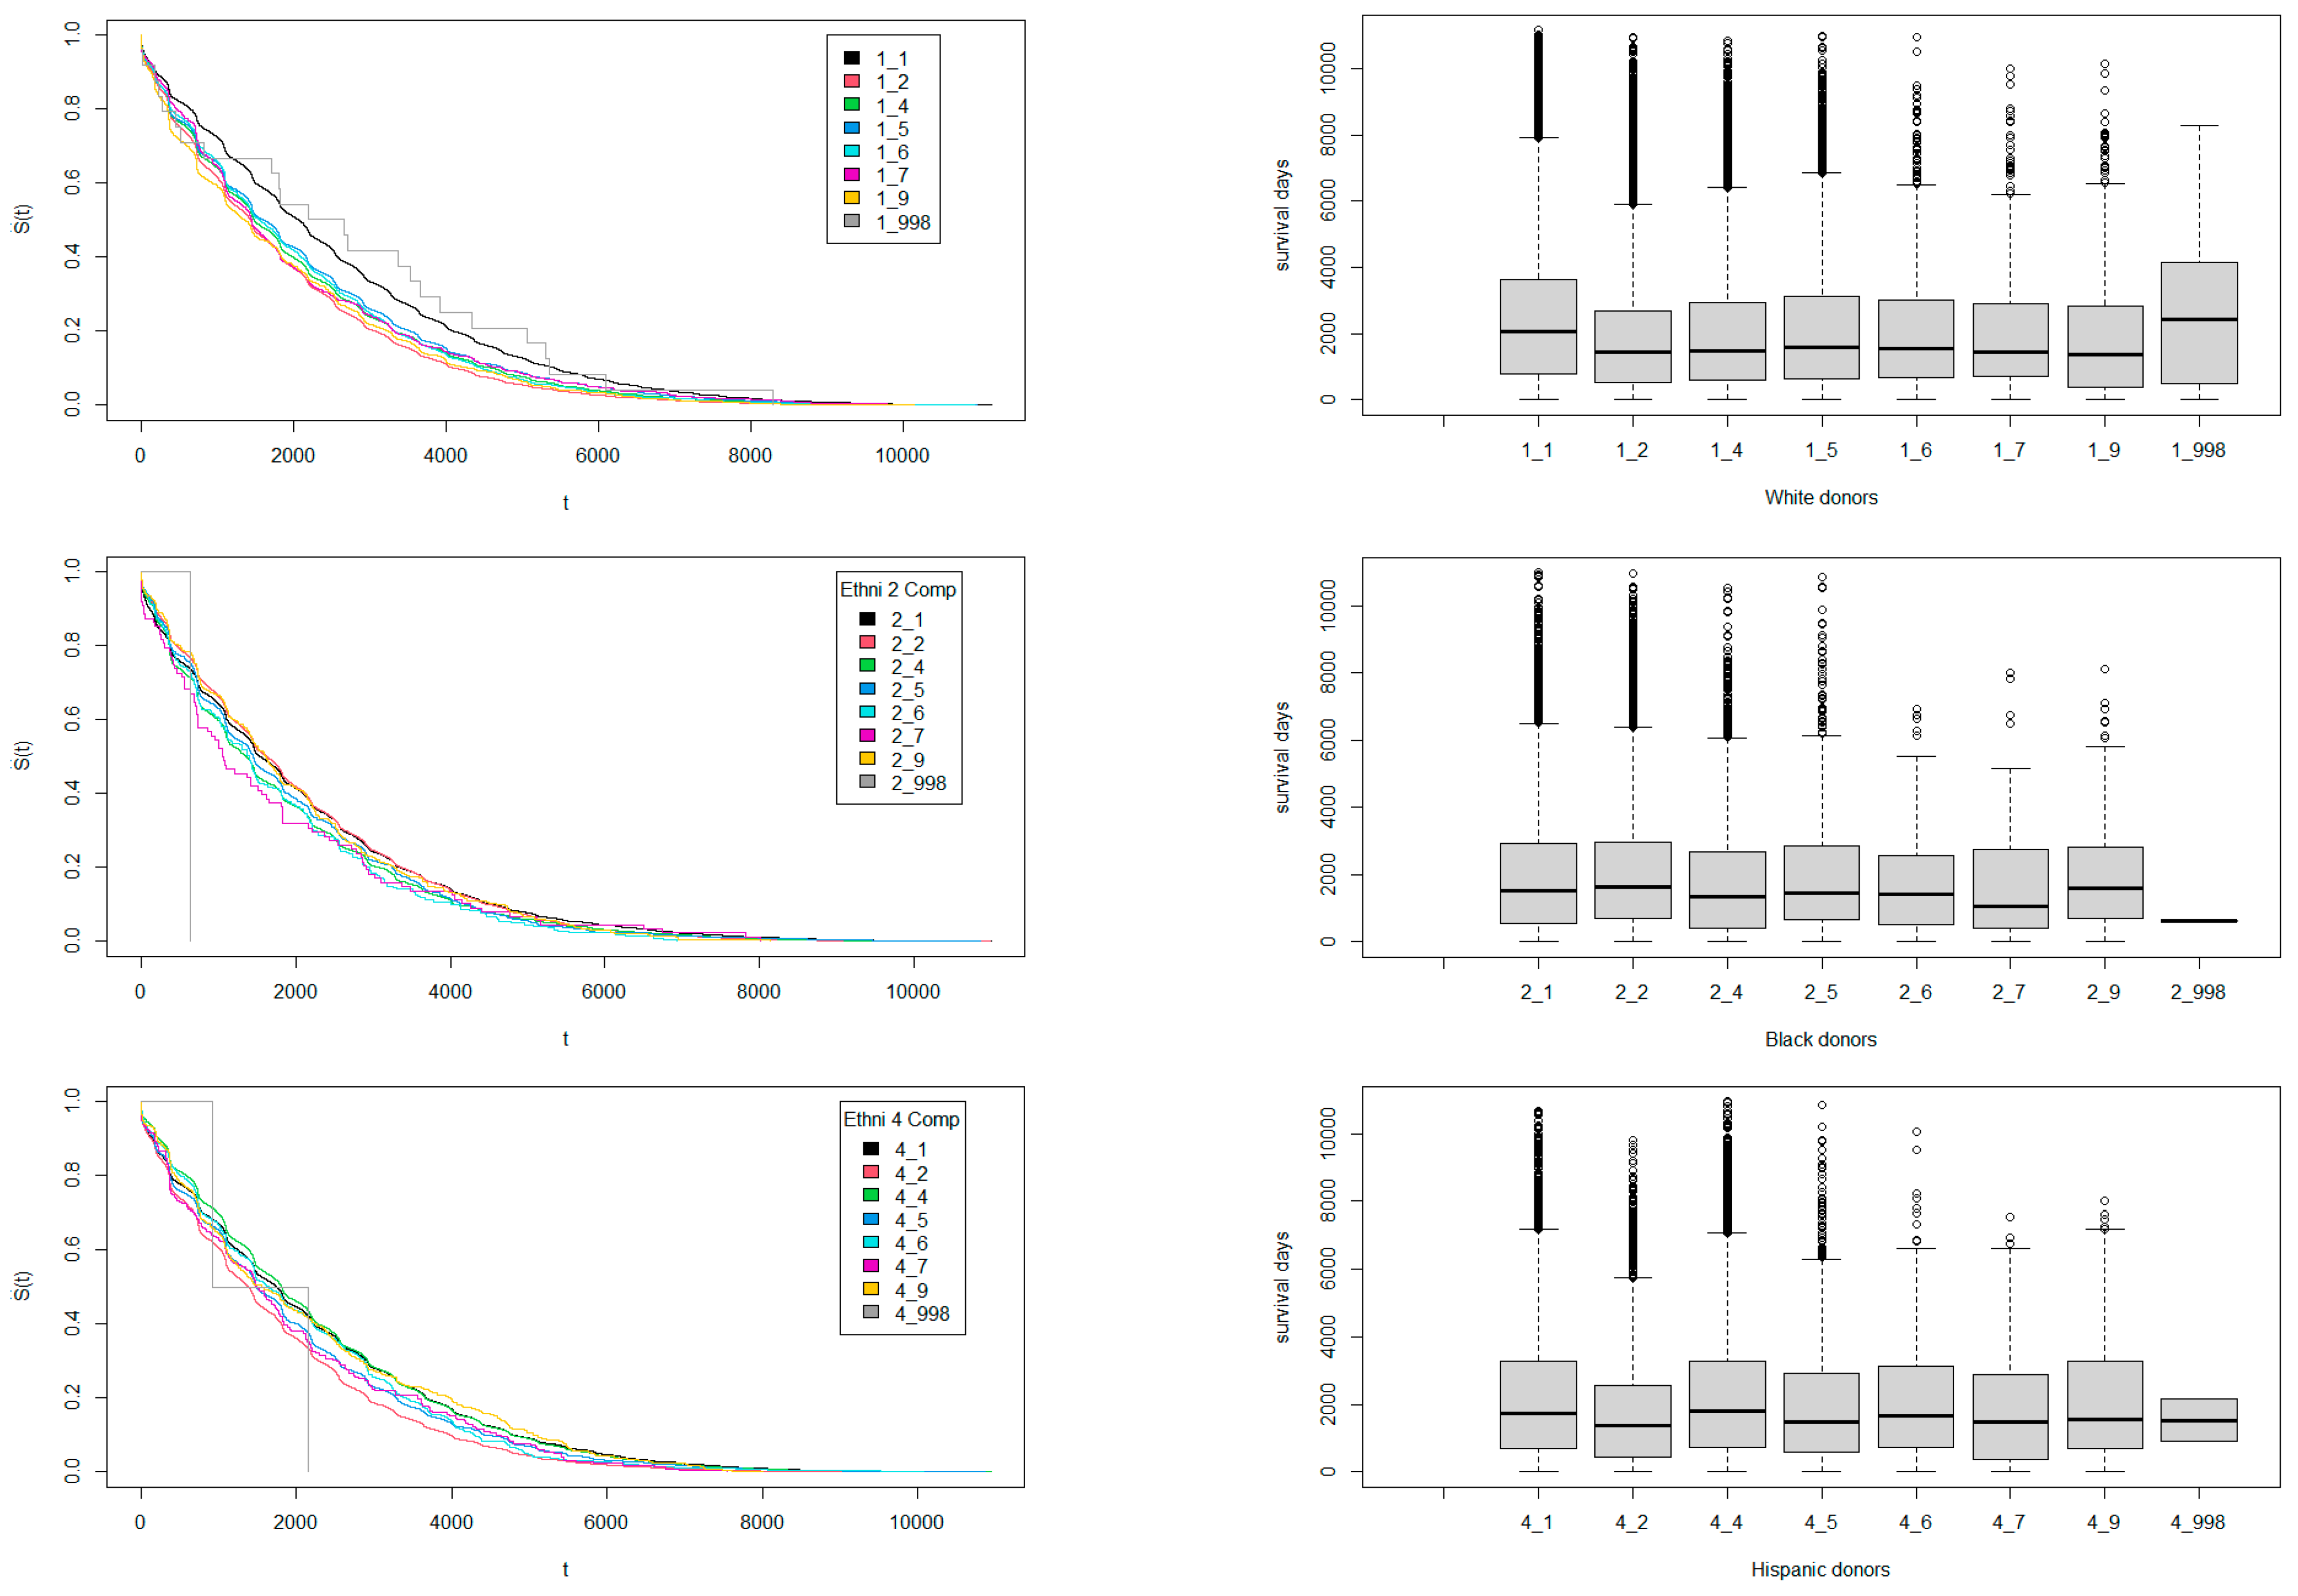
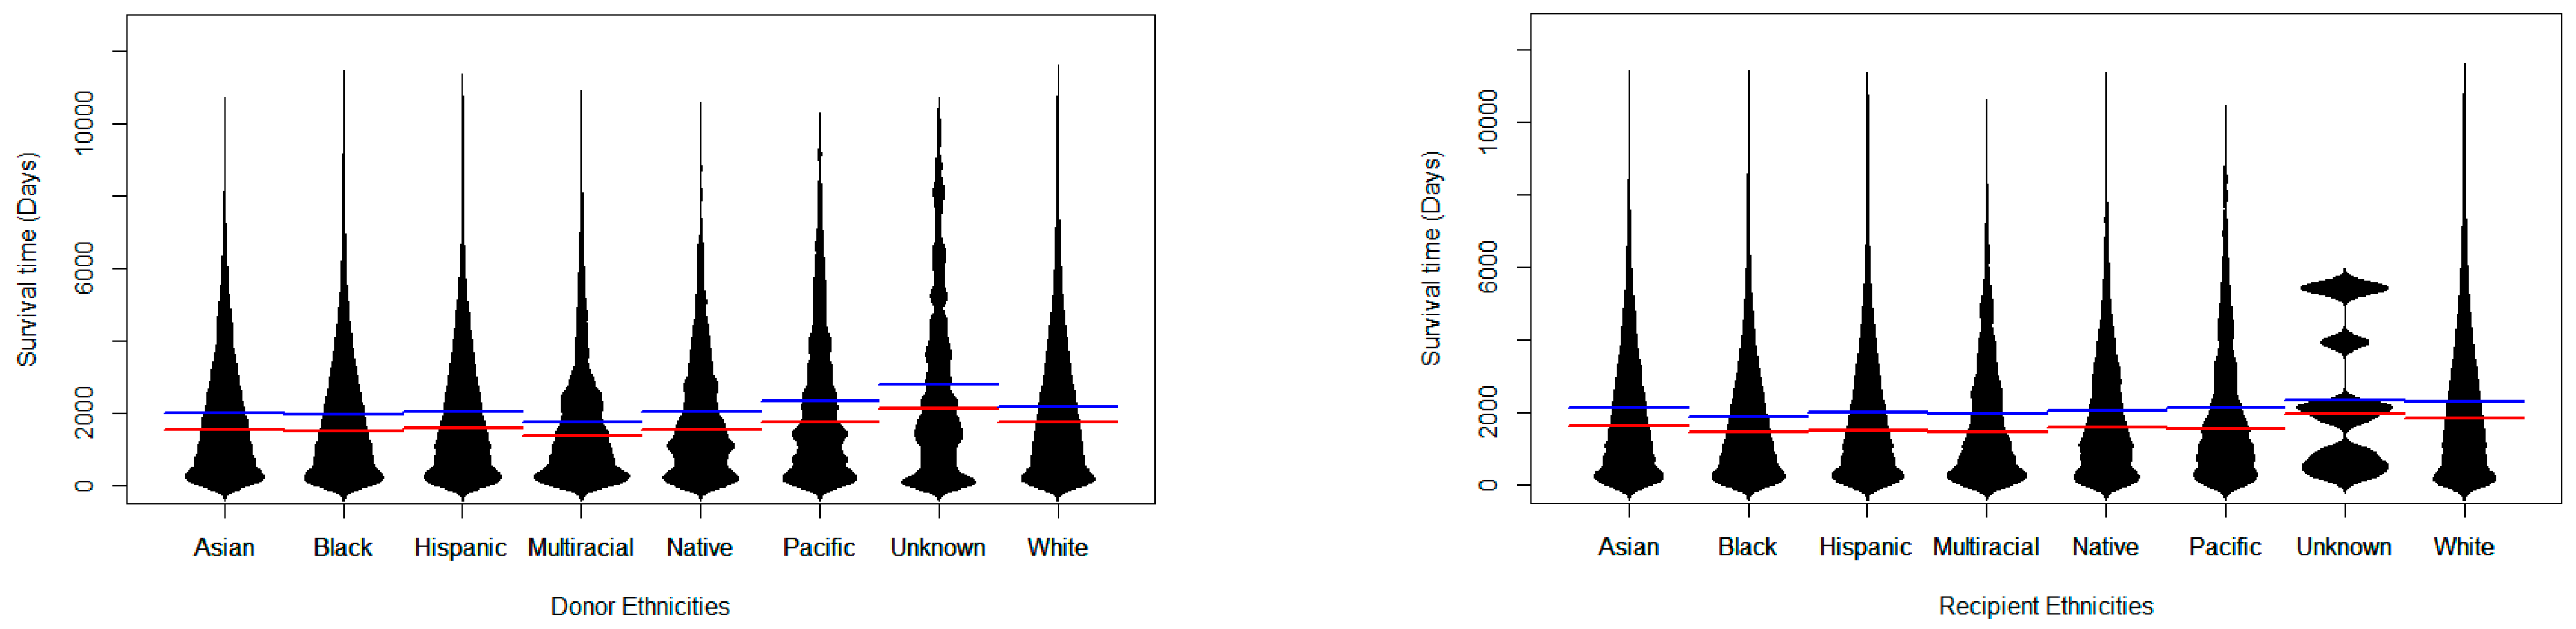
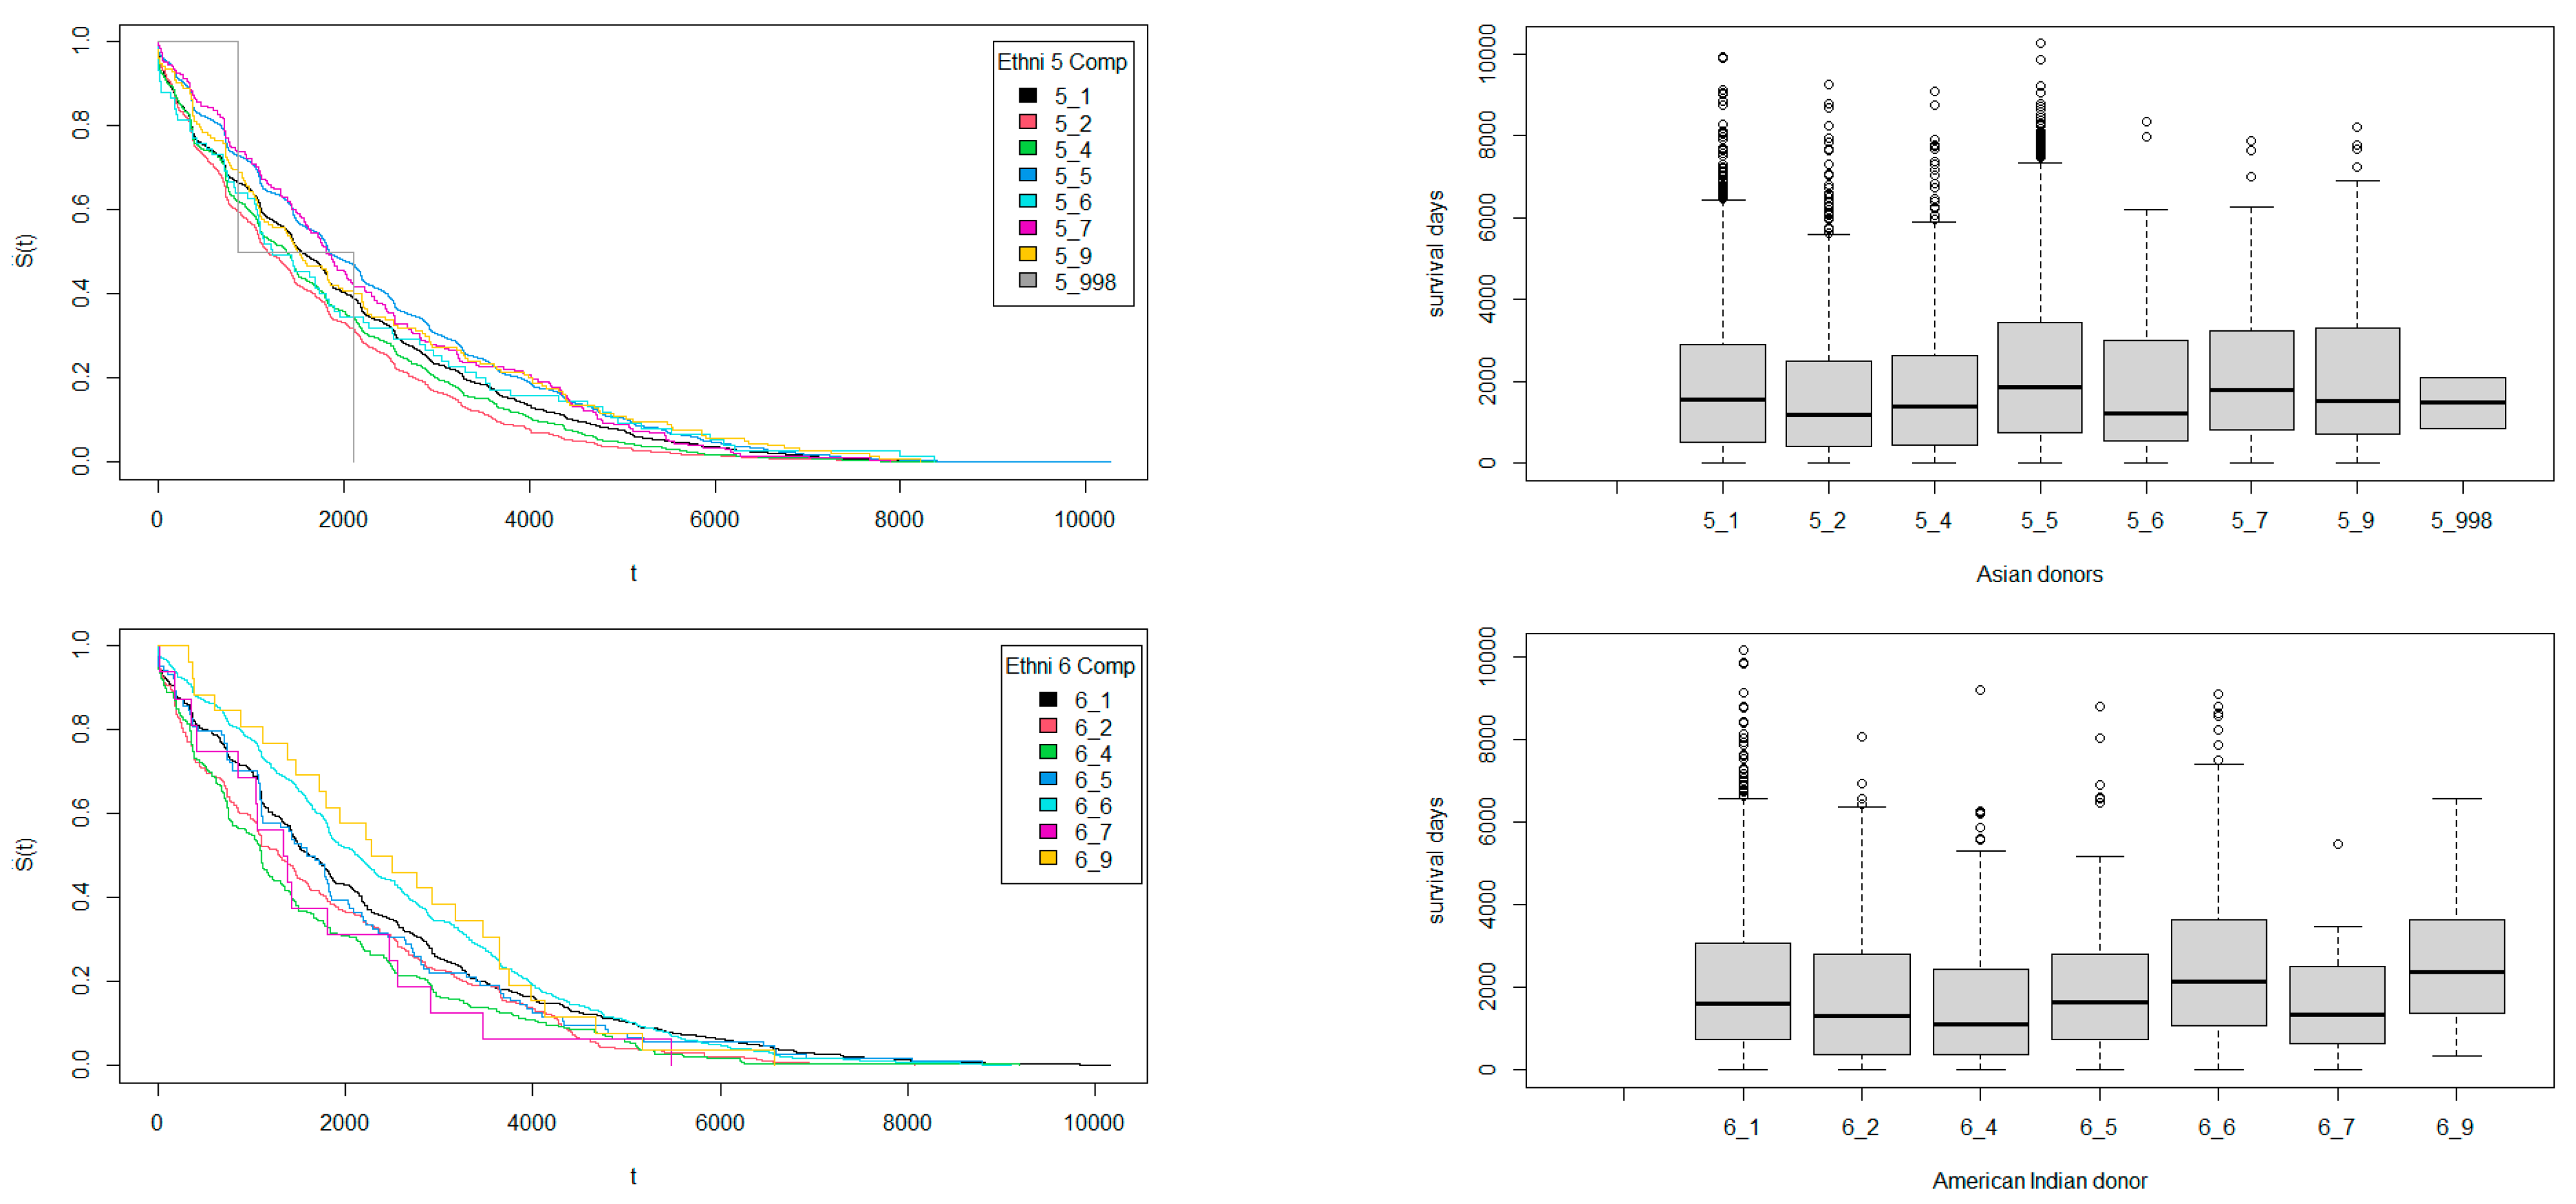
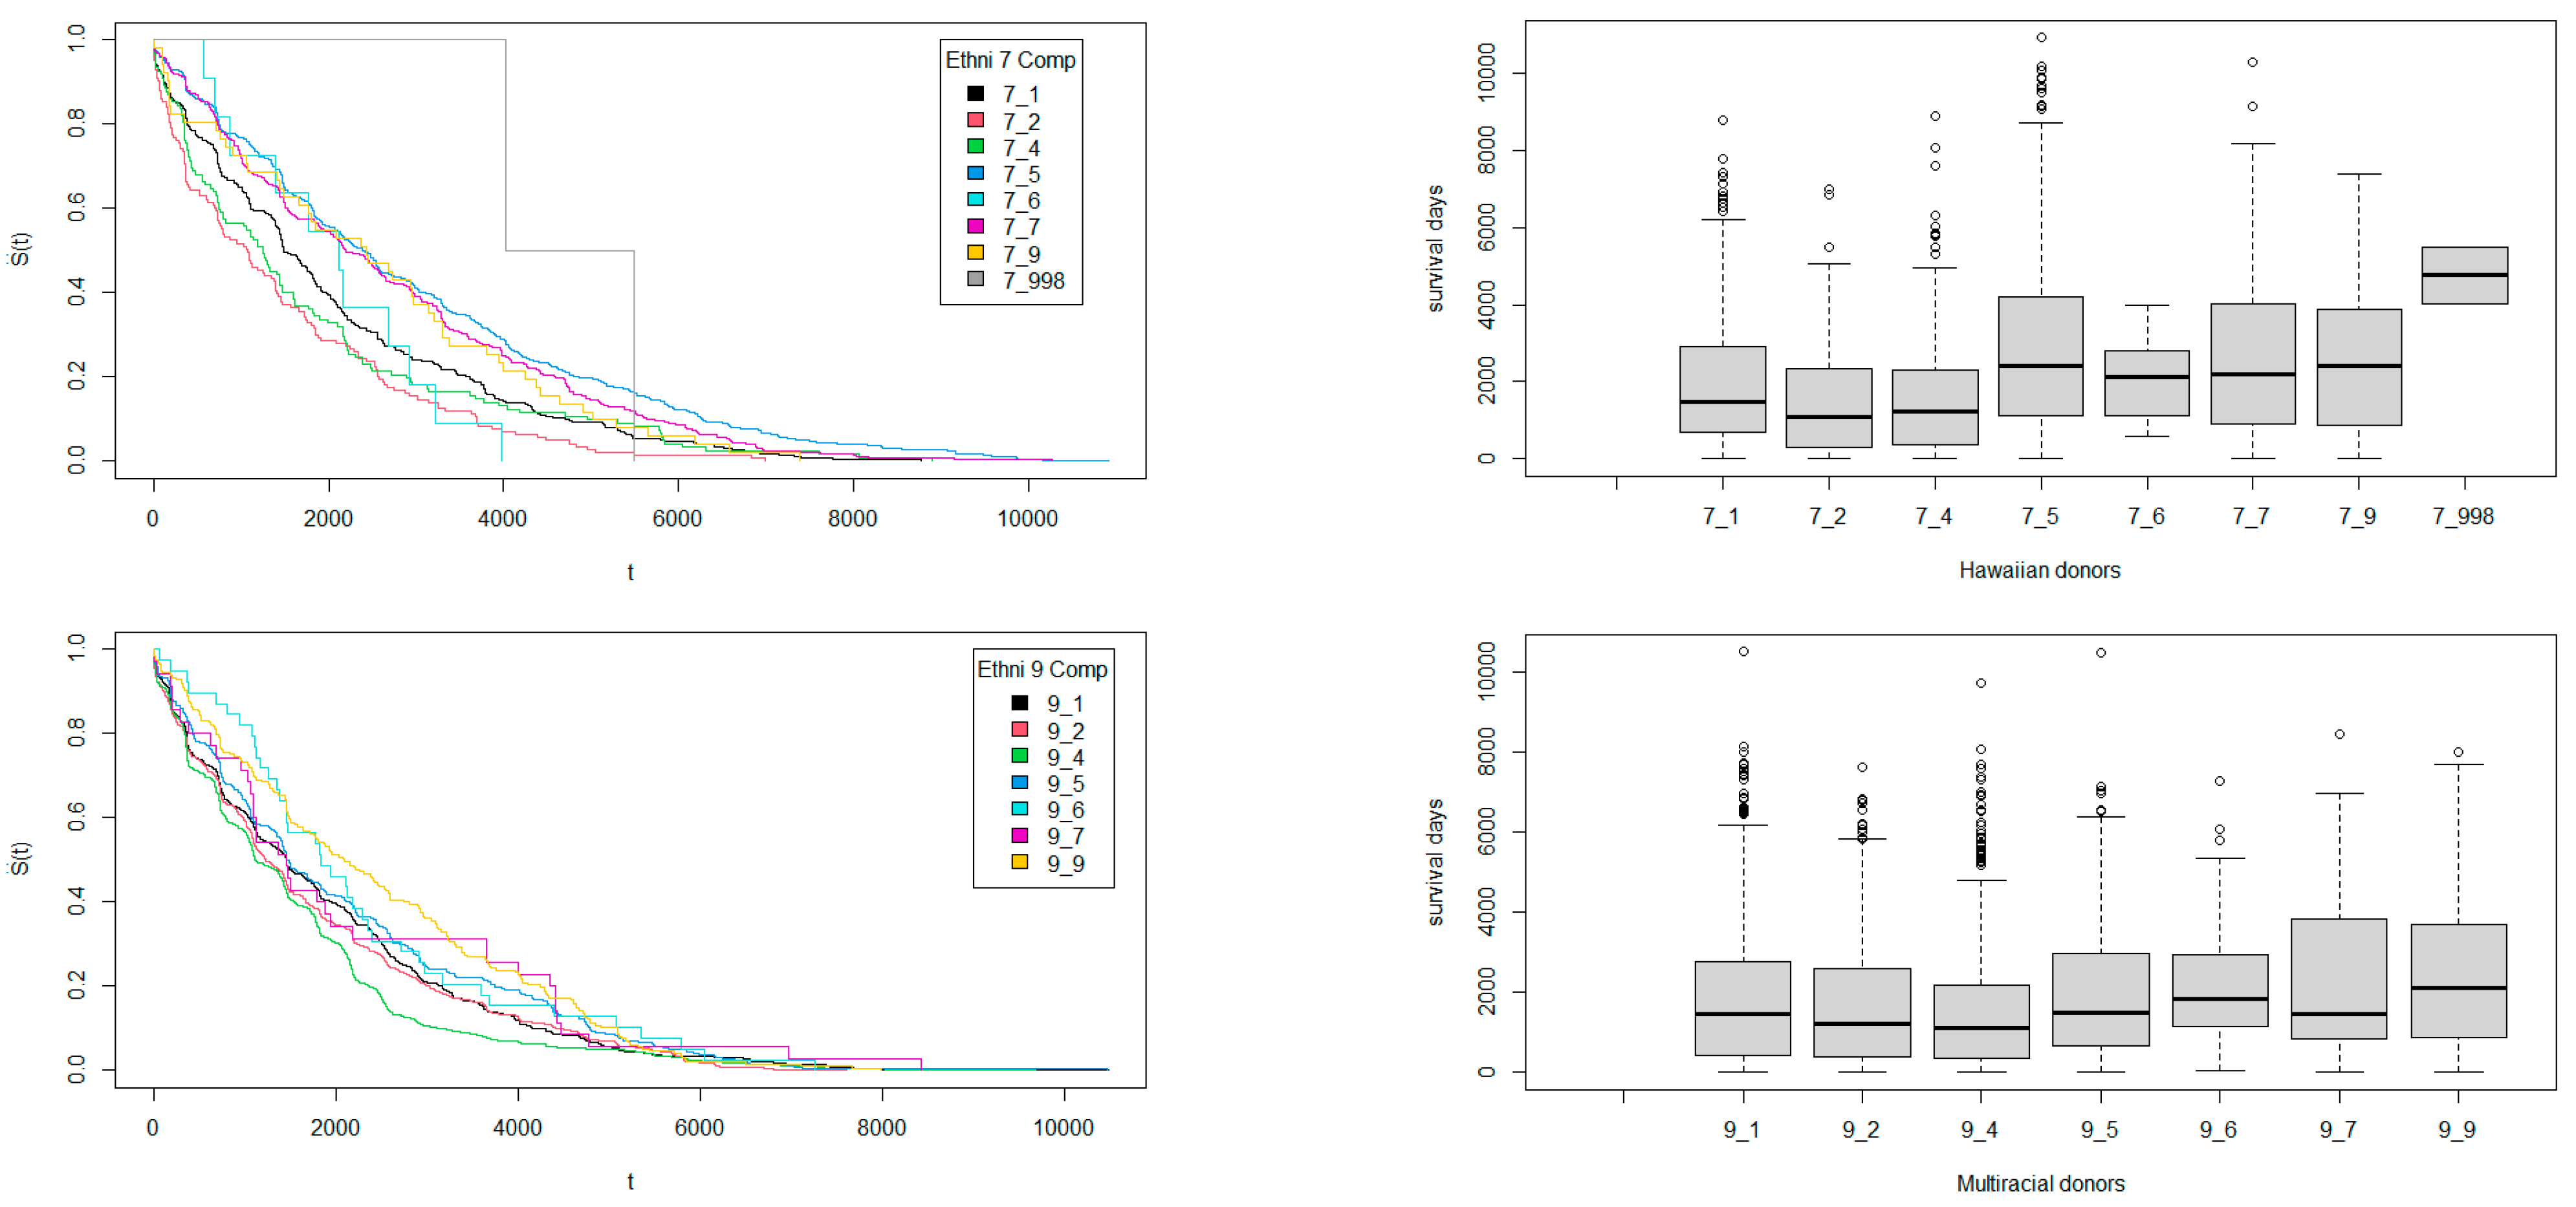
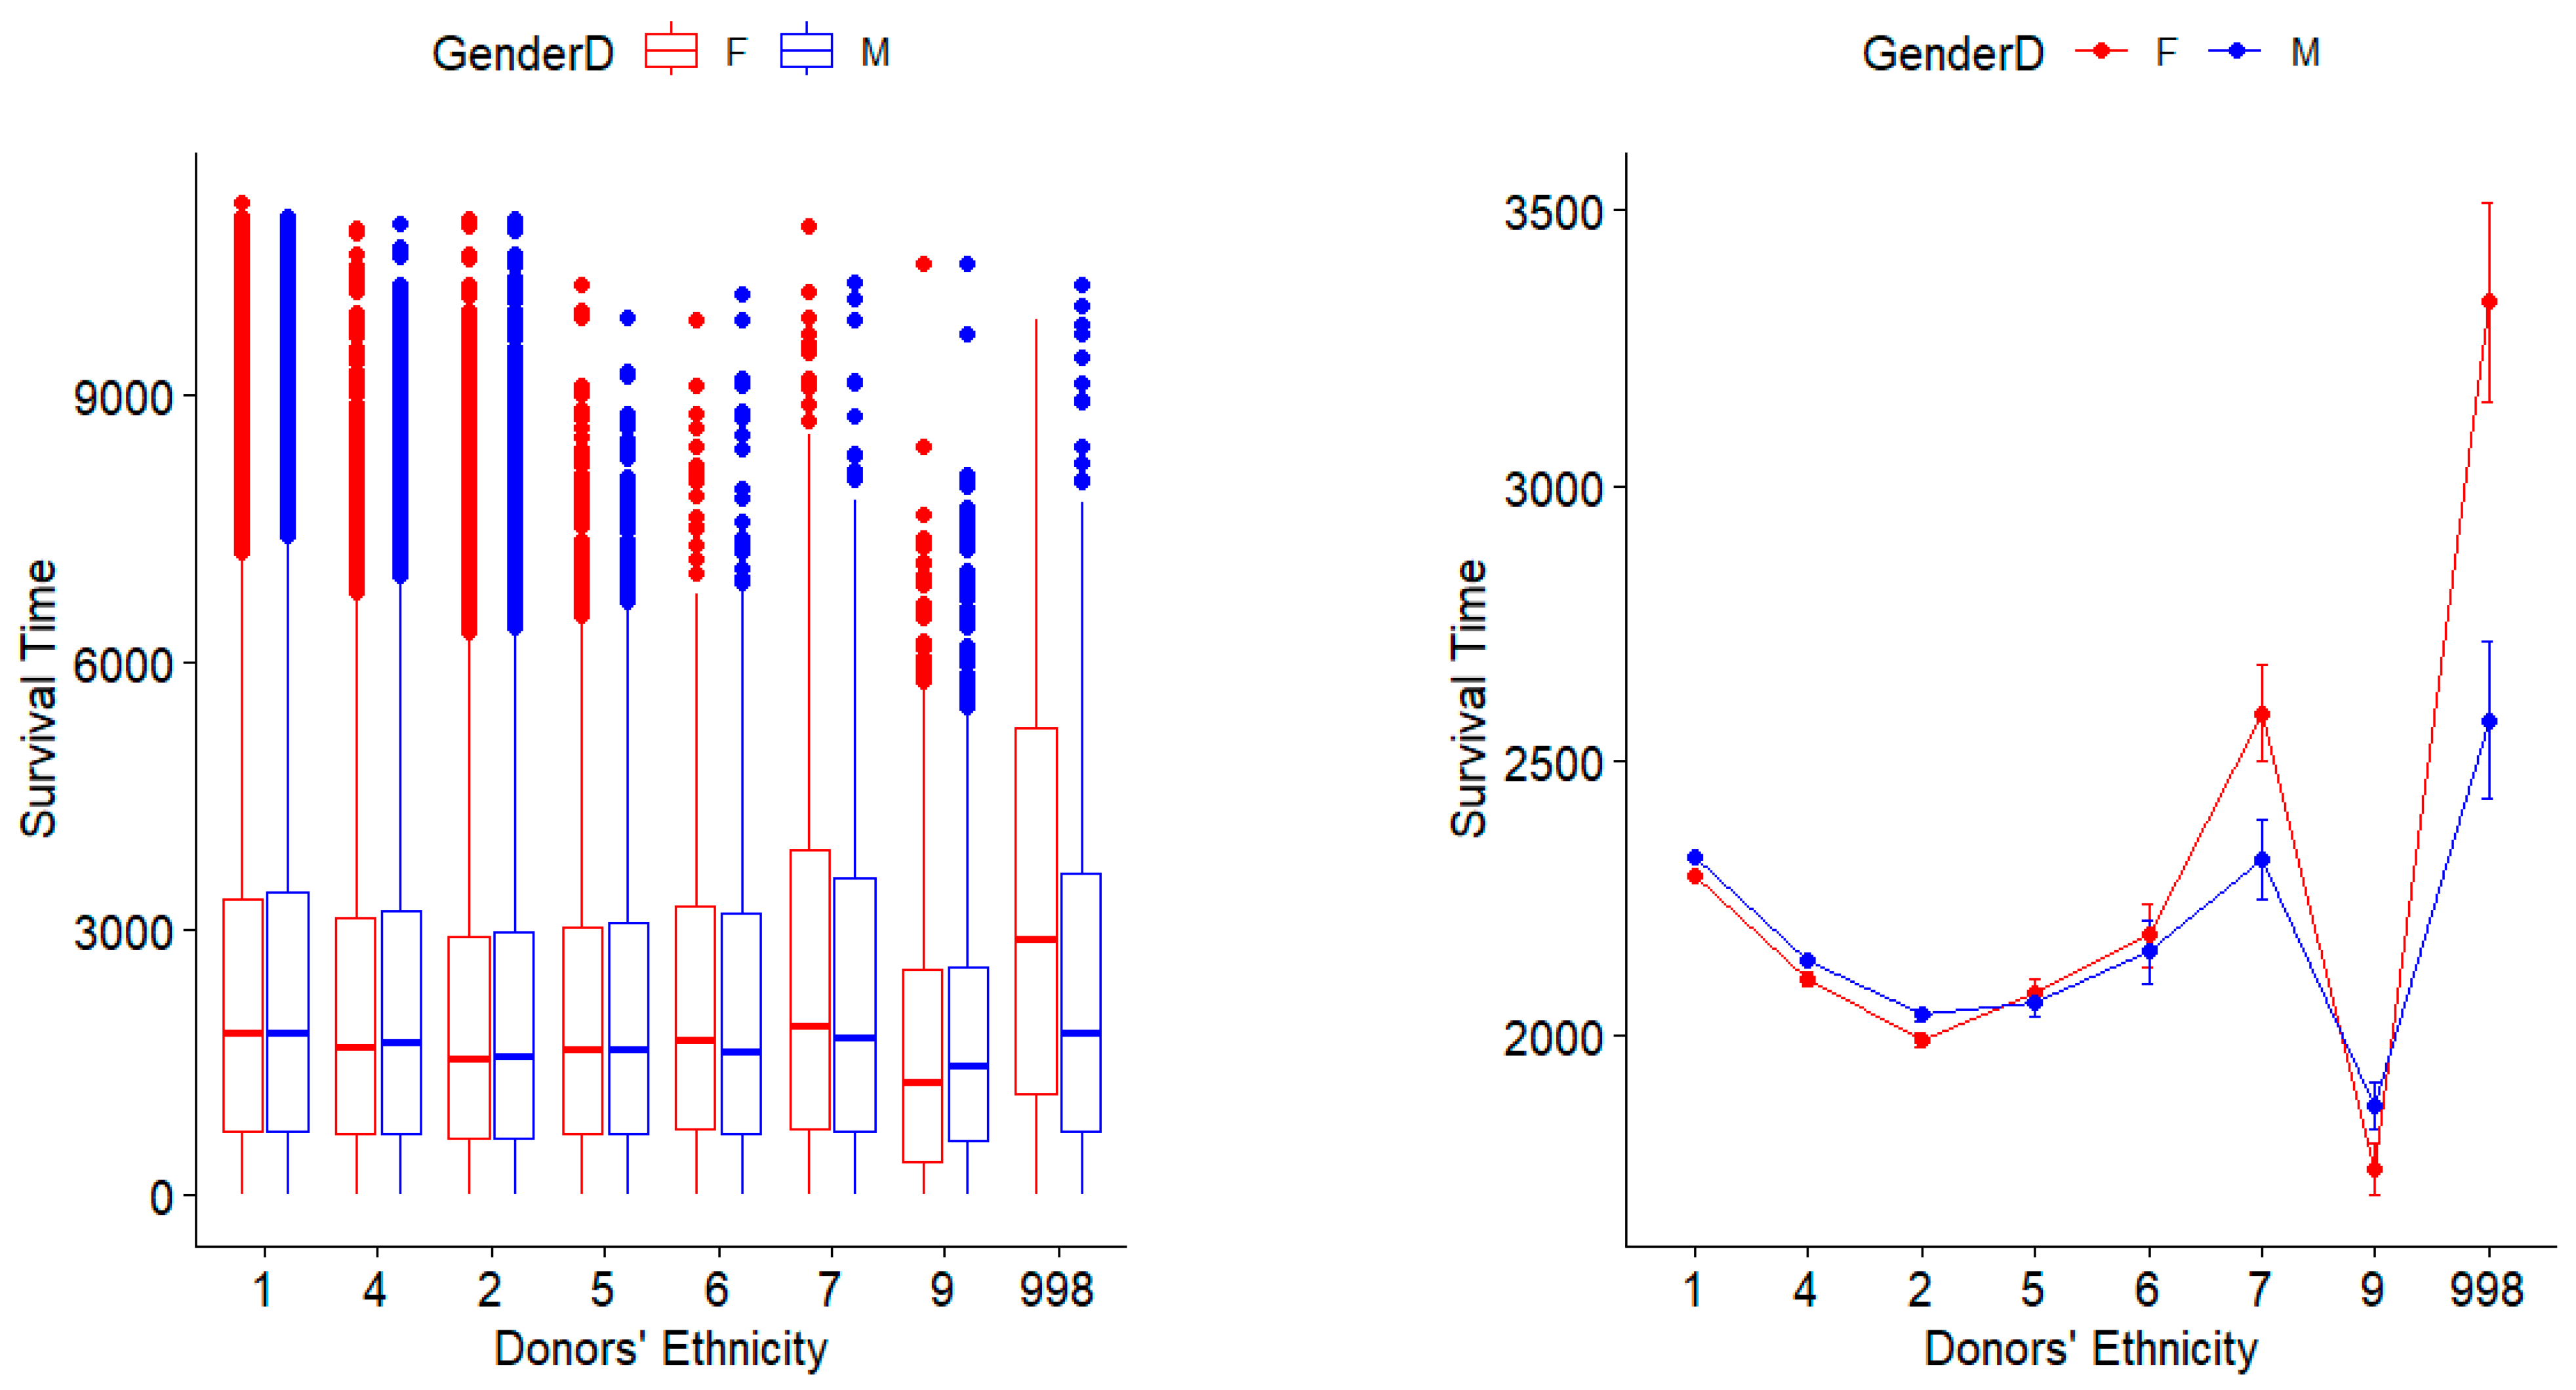
3.2. Survival Times Regarding Ethnicity Match Among Donors and Recipients

Different ethnic groups in the transplant dataset are shown in Table 1. The survival of transplanted kidneys was investigated relating to the ethnicity of the donor and recipient. The ethnicity match that maximized the survival of the transplanted kidneys was identified for each donor ethnicity. Figure 2 (top row) displays the graph and boxplot of kidneys coming from white donors and transplanted to recipients of different ethnic groups. It was noticed that, regardless of the ethnicity of recipients, kidneys coming from white donors resulted in a longer survival time than kidneys coming from other ethnic donors.
There were 224,104 white-to-white kidney transplants, with a maximum average survival time of 2488 days (about 7 years), as well as a maximum median survival time of above 2000 days (about 5 and a half years). The distribution of survival times is right (positively)-skewed and, in turn, median survival is less than mean survival time (Figure 2). As we can see in Figure 2 (right column), the median survival of white-to-other ethnic groups is below 2000 days (about 5 and a half years). The analysis has also revealed that white (donors)-to-black (recipients) transplants, with a mean survival time of 1836 days (about 5 years), have the shortest survival time among the ethnic recipients of white kidneys. Figure 2 (middle row) shows transplants from black donors to the other ethnic recipients. The optimal survival among recipients of kidneys from black donors belongs to black recipients, with an average of 2042 days (about 5 and a half years), which is only about 9 days longer than the average survival of black-to-white transplants. Moreover, black-to-Hawaiian transplants have a short average survival time in comparison with the other ethnic recipients of kidneys from black donors. Figure 2 (bottom row) displays transplants from Hispanic donors to the other ethnic cohorts.
The figure shows that Hispanic-to-Hispanic transplants have the longest average survival time in comparison with the other ethnic recipients of Hispanic kidneys. However, their average survival time is only 45 days (about 1 and a half months) longer than the average survival of Hispanic-to-white transplants (a close second). Hispanic-to-black recipients have the shortest survival time of 1754.5 among all ethnic recipients of Hispanic kidneys.
Figure 3 provides the distributions, means, and medians of the kidney transplant survival distributions given the donors’ or recipients’ ethnicity. Figure 3 (left) provides the survival times given the donor’s ethnicity regardless of the recipient’s ethnicity; each distribution was right-skewed, with Asian, black, Hispanic, and white donors having similar distributions. Donors with unknown ethnicities provided the largest mean and median, although they did not follow a unimodal distribution. Figure 3 (right) provides the survival times given the recipient’s ethnicity regardless of the donor’s ethnicity. The survival distributions given the recipient’s ethnicity follow similar distributions, excluding the rare cases in which the ethnicity was unknown. White recipients had a higher mean and median survival time, while black recipients had a lower mean and median survival time.
Figure 4 (top row) shows transplants from Asian donors to the other ethnic groups. Like previous ethnic cohorts, recipients with an ethnic match as Asian donors have the longest average survival time of 2321 days (about 6 and a half years), with a sample size of 4675. Hawaiian and white recipients are the second and the third regarding average survival time of kidneys from Asians, while white recipients have the shortest average survival time of 1635 days (about 4 and a half years). Survival times of transplanted kidneys from American Indian donors to the other ethnic groups are depicted in Figure 4 (second row). Although multiracial recipients, with an average survival time of close to 4000 days (about 11 years), have the longest survival, its sample size is only 26. The longest survival time with a large sample size belongs to American Indian-to-American Indian transplants (ethnic match), with 2497 days (about 7 years). This observation agrees with the results obtained from previous ethnicity donors, for which an ethnicity match of recipients provided the optimal average survival time. White recipients, with 2187 days (about 6 years), have the second-longest average survival time of kidneys from American Indian donors, while Hispanic recipients have the shortest average survival time, of 1629 days (about 4 and a half years), among ethnic groups of recipients.
Figure 4 (third row) shows transplants from Hawaiian donors to the other ethnic groups. In contrast with the previous ethnic cohorts, recipients with an ethnic match did not have the longest survival. Asian recipients, with 2945 days (about 8 years), had the longest average survival time of the transplanted kidneys from Hawaiian donors. We should point out that the other group of recipients (cohort code 998), with only two patients, was not considered in this analysis. The recipients with an ethnic match (Hawaiian-to-Hawaiian) had the second-longest survival, with an average survival time of 2667 days (about 7 and a half years), which is 278 days (about 9 months) less than the average survival for Asian recipients. The maximum survival of about 11,000 days (about 30 years) belongs to Asian recipients, in comparison with the maximum survival of recipients with an ethnic match (Hawaiian) of about 10,000 days (about 27 and a half years). Moreover, kidneys transplanted to black recipients (from Hawaiian donors) perform very poorly, with average survival of 1480 days (about 4 years). Survival analysis of multiracial donors revealed that an ethnic match with multiracial recipients had the longest average survival of 2432 days (Figure 4 (bottom)). American Indian recipients, with 2312 days (about 6 and a half years) were second, while kidneys transplanted to Hispanic recipients (from multiracial donors) performed poorly, with average survival of 1539 days (about 4 years).
Figure 2, Figure 3 and Figure 4 depict a comparative view of the kidneys’ survival times among recipients of different ethnicities, transplanted from donors of the same ethnicity. Each donor’s ethnicity is compared against all recipients’ ethnicities to determine the optimal survival time of the transplanted grafts. The results of these comparisons would reveal an ethnic match with statistically better survival outcomes.
The summary from KM survival analysis results, with the maximum and minimum survival times among the cohorts, are displayed in Table 2 with respect to donors, recipient, sample size, and proportion along with the standard deviation. Table 2 provides a comprehensive look at maximum and minimum kidney survival times among all cohorts with regard to their sample size, standard deviation, and sample proportion of each cohort in the context of the overall large dataset used in this study.
For example, within the Indian American donor group, the sample size of transplants based on the recipients’ ethnic groups, varies from 16 to 726. A threshold of 400 transplants (about 0.1% of the overall sample of size 455,000 transplants) was considered as a minimum practical sample size to obtain sufficient statistical significance and be able to provide relevant clinical interpretation of expected survival. Expected survival times associated with donor–recipient factors (shown in Table 2) are reviewed below.
Gender: Kidneys that are transplanted via male donors to female recipients were shown to have the maximum expected survival time of 2303 days among different gender cohorts. This group makes up about 21.5% of all transplanted kidneys. Female-to-female transplanted kidneys, accounting for about 18% of the total kidney transplants, displayed a survival time of 2288 days, which is the second-longest kidney survival time based on donor–recipient gender. However, female-to-male transplanted kidneys demonstrate the shortest kidney survival time of 2186 days. This group also makes up about 18% of the transplanted kidneys. The difference between the minimum and maximum kidney survival time based on donor–recipient gender is about 117 days. Although the difference is statistically significant, it may not be of clinical significance.
Ethnicity: Kidneys from Hawaiian donors transplanted to Asian recipients showed the longest survival time of 2945 among different ethnic cohorts. However, regarding the overall sample size, this donor–recipient group, with only 529 transplants, accounts for a small fraction of kidney transplants. Kidney transplants for an American Indian donor–recipient match, with a sample size of 674, had the second-longest expected survival time of 2497 days among different ethnicity cohorts. White–white kidney transplants account for 49% of transplanted kidneys and, with an average survival of 2488 days, had the third-longest average survival time among the ethnic groups. Hawaiian–black transplants, with only 143 transplant cases, had the shortest average survival time, of 1481 days. Multiracial-Hispanic kidney transplants accounted for 887 cases and had the second-shortest survival time of 1539 days. Black–black (donor–recipient match) kidney transplants had the longest average survival time among black donors, while black–Hawaiian transplants, with 88 cases, displayed the shortest average survival time of 1743 days (about 5 years) among black donors.
The association of survival time with donor–recipient factors was investigated using Kaplan Meier analysis to identify cohorts based on gender and ethnicity with the optimal average outcomes. The results are highlighted in Table 3, along with the prevalence as proportion of the overall sample size. Ethnicity was shown to display consistency in longer kidney survival time with matching ethnic pairs. The same was not shown to be true among the other cohorts; therefore, we compared survival distributions based on the recipients’ ethnicity using the Kullback–Leibler divergence (KLD) test, Wilcoxon ranked sum test, and the overlap coefficient in Table 4. The KLD value of close to zero means that the loss of information due to approximating one distribution using another is small. Moreover, the Wilcoxon ranked sum tests the null hypothesis of whether the two distributions are from the same population. The overlap coefficient gives the proportion of the density curves that overlap with each other. As we can see in the highlighted results in Table 4, the KLD values were close to zero for most of the donor–recipient cohorts. The largest KLD values were from black–Multiracial, black–Native Americans, black–Pacific Islanders, Hispanic–multiracial, Hispanic–Pacific Islanders, multiracial–white, and Pacific Islanders–white. The Wilcoxon ranked sum, with small p-values, suggested that most of the donor–recipient cohorts were not from the same populations. However, survival times among some donor–recipient ethnicity groups were not significantly different, suggesting they came from the same population with similar outcomes. Those matches include Asian–Native American, Asian–Pacific Islander, black–multiracial, Hispanic–Native American, Hispanic–Pacific Islander, and Native American–Pacific Islander. Most of the computed overlap coefficients for ethnicity groups were close to one, demonstrating substantial similarities. The compared ethnicities with the least amount of overlap were black with white, multiracial with Native American, and multiracial with Pacific Islander.
Next, the trends of survival times along with minimum and maximum survival times were studied using the KM method. The survival curves for different cohorts based on donor–recipient gender and donor–recipient ethnicity are depicted in Figure 5.
Figure 6 shows survival times of kidney transplants regarding donors’ ethnicity vs. their genders. White, Hispanic, and black donors have a higher kidney survival time with male donors than female ones and showed a smaller standard error among these ethnic groups than the others. However, Hawaiian, multiracial, and others illustrate a longer survival time among female kidney transplants than in male ones, but show larger error bars due to outliers and small sample sizes.
Figure 7 shows survival times of kidney transplants regarding recipients’ ethnicity considering their genders. Female recipients had longer kidney survival time among all ethnic groups. Figure 8 shows survival times of kidney transplants regarding the gender of recipients considering donors’ genders. Although not very apparent in the boxplot, male donors to female recipients demonstrated better outcomes, with longer kidney survival time. Figure 9 depicts survival times of kidney transplants regarding the ethnicity of recipients considering donors’ ethnicities. The figure reinforces that matching ethnicities do better than non-matching ones except for Hawaiian donors (7) to Asian recipients (5). Multiracial donors (998) to all recipients’ ethnicities illustrate long kidney survival time, but their large error bars show uncertainties regarding their significance levels.
Table 5 illustrates the results obtained from donors’ and recipients’ cohorts of gender and ethnicity. All attributes except the highlighted rows have significant p-values, which contribute to the transplanted kidney survival risk via Cox PH. Among the significant results from recipient cohorts are the male gender with increasing risk hazard determined by its coefficient, including blacks, Hispanics, American Indians, Hawaiians, and multiracial; these are all recipients with increasing hazard values when their compared variables stay constant. The cohort with a decreased kidney survival hazard risk according to Cox PH is that of Asian recipients.
In comparison to recipient cohorts on the bases of significance, black is of statistical significance in increasing the hazard risk of kidney survival time, while Hispanic shows a decreasing hazard risk on the kidney survival. Kidneys coming from male donors decrease the hazard risk of survival as well. Estimated coefficients and their confidence intervals are recorded in Table 6. In agreement with their p-values summarized in Table 5, coefficients have narrow confidence intervals, demonstrating the accuracy of mode coefficient estimates. Moreover, results similar to those reported in Table 5 are conveyed by the summarized outcomes in Table 6. That is, the null hypothesis will be rejected for the same attributes with the significant p-values in Table 5. Clearly, the value stated in the null, i.e., e 0 = 1 , was only contained in the confidence intervals of the bottom-four attributes in the table. The survival probabilities predicted by the Cox PH model and the survival probabilities by Kaplan Meier analysis are shown in Figure 10. Remarkably, the probabilities of survival predicted by the Cox model closely follow the trends of the observed survival probabilities using Kaplan Meier analysis depicted in Figure 10. Nevertheless, the probabilities predicted by the Cox model are overestimated in comparison with the reference (observed survival probabilities). Notice that the models are based on censored data and, from 251,250 transplanted kidneys recorded in the dataset, only 42,560 of them had failed.

4. Discussion

Based on the collected results, we observed that a matching gender for the kidney transplant does not necessarily bring forth an optimum outcome. Based on donor-recipient genders, transplanted kidneys from male donors to female recipients had the longest average survival time of 2302 days (6.31 years), while female–male transplants provided the shortest average survival time of 2186 days (about 6 years).
Regarding the donor–recipient ethnicity, it was noted that matching ethnicity was an impactful characteristic on the survival of transplanted kidneys. Throughout our findings, except for the Hawaiian–Asian cohort, matching ethnicity demonstrated the longest survival of transplanted kidneys. An exception to this was the survival of transplanted kidneys from Hawaiian donors to Asian recipients, which had a small sample size. Hawaiian–Asian transplanted kidneys had the longest average survival time (2945 days) among recipients of kidneys from Hawaiian donors. This was followed by American Indian matches [22,23]. White–white kidney transplants, which had a large sample size (49% of kidney transplants), demonstrated an average survival time of 2488 days (third-longest average survival based on donor–recipient ethnicity). Asian–Asian and multiracial–multiracial kidney transplants had an average survival of below 2000 days. The average survival of the kidney transplants from non-black donors to black recipients was poor, with a minimum average of 1481 days coming from multiracial donors, and a maximum average of 1837 coming from white donors, while black–black transplants had an average survival of 2042 days. Multiracial–Hispanic transplants had the lowest average survival time of 1539 days (4.22 years).

5. Conclusions

The main goal of this study was to investigate the survival time of transplanted kidneys in association with donors’ and recipients’ factors. It is worth emphasizing that the context of this research is bounded within the domain of statistical analysis and the methods that were employed. The results demonstrated some statistical significance that could have potential clinical impacts. This demonstrated statistical significance does not suggest its use in making decisions on how organ transplantations, or their allocation, should be performed; rather, it provides insights into the trends of survival times for the transplanted kidneys collected in the dataset that has been used in this study. Due to having large samples in most ethnicity and gender groups, the calculated statistics are fairly accurate and, in turn, even small differences in survival times demonstrated differences that are statistically significant. However, the statistical significance does not warrant a clinically significant outcome; rather, it provides insights regarding the potential availability of donated organs with regard to the gender and ethnicity of the donors and recipients (in the waiting list). In turn, future studies can focus on estimating donor to population ratios among different ethnicity and gender groups, and investigate potential differences that can result in the recommendation of relevant policies to encourage and increase the number of people who may consider being organ donors.
Further analysis of Hawaiian to Asian kidney transplants could be a topic of investigation to have a better understanding of the long average survival time of 2945, which is the highest survival time among the entire ethnic group comparisons, despite the fact that this result came from unmatched (two different) ethnicities [23,24]. All other transplants showed a maximum survival time with matching donor–recipient ethnic cohorts. Our future research is directed towards implementing a more inclusive model to execute temporal analysis. The premise of this study was based on an overall generalization among the cohorts in our registry without confounding factors. Future work will be focused on further investigation of the confounding factors such as blood type [24,25,26,27], age, and smoking history, among different cohorts based on gender and ethnicity, and the impact of these confounding factors on kidney survival time.

Author Contributions

Conceptualization, N.N.K.; Methodology, A.D., D.B. and N.N.K.; Software, A.D., D.B. and N.N.K.; Validation, A.D., D.B. and N.N.K.; Formal analysis, A.D., D.B. and N.N.K.; Investigation, A.D., D.B. and N.N.K.; Resources, N.N.K.; Data curation, A.D.; Writing—original draft, A.D., D.B. and N.N.K.; Writing—review & editing, N.N.K. and A.D.; Visualization, A.D., D.B. and N.N.K.; Supervision, N.N.K.; Project administration, N.N.K. All authors have read and agreed to the published version of the manuscript.

Funding

This research received no external funding.

Data Availability Statement

Data are publicly available through UNOS by request. https://unos.org/data/data-collection/ (accessed on 9 September 2024). Requests must be submitted through https://optn.transplant.hrsa.gov/data/view-data-reports/request-data/ (accessed on 9 September 2024).

Acknowledgments

The data reported herein were supplied by the United Network for Organ Sharing (UNOS) as the contractor for the Organ Procurement and Transplantation Network (OPTN). The interpretation and reporting of these data are the responsibility of the author(s) and in no way should be seen as official policy of or interpretation by the OPTN.

Conflicts of Interest

Authors have no conflicts of interest.

References

  1. Coquillard, C.; Berger, J.; Daily, M.; Shah, M.; Mei, X.; Marti, F.; Gedaly, R. Combined liver–kidney transplantation for polycystic liver and kidney disease: Analysis from the United Network for Organ Sharing dataset. Liver Int. 2016, 36, 1018–1025. [Google Scholar] [CrossRef]
  2. Reese, P.P.; Harhay, M.N.; Abt, P.L.; Levine, M.H.; Halpern, S.D. New Solutions to Reduce Discard of Kidneys Donated for Transplantation. J. Am. Soc. Nephrol. 2016, 27, 973–980. [Google Scholar] [CrossRef]
  3. Padela, A.I.; Rasheed, S.; Warren, G.J.W.; Choi, H.; Mathur, A.K. Factors associated with positive attitudes toward organ donation in Arab Americans. Clin. Transplant. 2011, 25, 800–808. [Google Scholar] [CrossRef] [PubMed]
  4. Messina, M.; Diena, D.; Dellepiane, S.; Guzzo, G.; Sardo, L.L.; Fop, F.; Segoloni, G.P.; Amoroso, A.; Magistroni, P.; Biancone, L. Long-Term Outcomes and Discard Rate of Kidneys by Decade of Extended Criteria Donor Age. Clin. J. Am. Soc. Nephrol. 2017, 12, 323–331. [Google Scholar] [CrossRef]
  5. Kfoury, C. Therapeutic cloning: Promises and issues. McGill J. Med. 2007, 10, 112. [Google Scholar] [CrossRef]
  6. Hamad, F.; Kachouie, N.N. Potential Impact of Donors’ Factors on Survival Times of Transplanted Hearts and Lungs. Transplant. Rep. 2019, 4, 100035. [Google Scholar] [CrossRef]
  7. Kachouie, N.N.; Hamad, F. Potential impact of OPTN plan in association with donors’ factors on survival times of transplanted kidneys. Transplant. Rep. 2020, 5, 100042. [Google Scholar] [CrossRef]
  8. Kishore, J.; Goel, M.; Khanna, P. Understanding survival analysis: Kaplan-Meier estimate. Int. J. Ayurveda Res. 2010, 1, 274. [Google Scholar] [CrossRef] [PubMed]
  9. Lee, E.T.; Wang, J.W. Statistical Methods for Survival Data Analysis; John Wiley & Sons: Hoboken, NJ, USA, 2003; Volume 476. [Google Scholar]
  10. Collett, D. Modelling Survival Data in Medical Research; CRC Press: Boca Raton, FL, USA, 2015. [Google Scholar]
  11. Ziegel, E.R. Survival analysis: A self-learning text. Technometrics 2006, 48, 317. [Google Scholar]
  12. Cox, D.R. Regression models and lifetables. J. R. Stat. Soc. Ser. B (Methodol.) 1972, 34, 187–202. [Google Scholar] [CrossRef]
  13. Cox, D.R.; Lewis, P.A.W. Multivariate point processes. In Proceedings of the Sixth Berkeley Symposium on Mathematical Statistics and Probability; University of California Press: Durham, NC, USA, 1972; Volume 3, pp. 401–448. [Google Scholar]
  14. Collett, D. Modelling Survival Data in Medical Research; Chapman and Hall/CRC: Boca Raton, FL, USA, 2023. [Google Scholar]
  15. Hamad, F.; Kachouie, N.N. A hybrid method to estimate the full parametric hazard model. Commun. Stat. Theory Methods 2019, 48, 5477–5491. [Google Scholar] [CrossRef]
  16. Klein, J.P.; Moeschberger, M.L. Statistics for Biology and Health. Springer: New York, NY, USA, 1997. [Google Scholar]
  17. Bland, J.M.; Altman, D.G. Survival probabilities (the Kaplan-Meier method). BMJ 1998, 317, 1572–1580. [Google Scholar] [CrossRef] [PubMed]
  18. Matloff, N. The Art of R programming: A Tour of Statistical Software Design; No Starch Press: San Francisco, CA, USA, 2011. [Google Scholar]
  19. Puoti, F.; Ricci, A.; Nanni-Costa, A.; Ricciardi, W.; Malorni, W.; Ortona, E. Organ transplantation and gender differences: A paradigmatic example of intertwining between biological and sociocultural determinants. Biol. Sex Differ. 2016, 7, 1–5. [Google Scholar] [CrossRef] [PubMed]
  20. Pillay, P.; Van Thiel, D.H.; Gavaler, J.S.; Starzl, T.E. Effect of race upon organ donation and recipient survival in liver transplantation. Dig. Dis. Sci. 1990, 35, 1391. [Google Scholar] [CrossRef]
  21. Zeier, M.; Döhler, B.; Opelz, G.; Ritz, E. The effect of donor gender on graft survival. J. Am. Soc. Nephrol. 2002, 13, 2570–2576. [Google Scholar] [CrossRef] [PubMed]
  22. Sharp, R.R.; Foster, M.W. Community involvement in the ethical review of genetic research: Lessons from American Indian and Alaska Native populations. Environ. Health Perspect. 2002, 110 (suppl. 2), 145–148. [Google Scholar] [CrossRef]
  23. Sequist, T.D.; Narva, A.S.; Stiles, S.K.; Karp, S.K.; Cass, A.; Ayanian, J.Z. Access to renal transplantation among American Indians and Hispanics. Am. J. Kidney Dis. 2004, 44, 344–352. [Google Scholar] [CrossRef] [PubMed]
  24. Tanabe, T.; Ishida, H.; Horita, S.; Yamaguchi, Y.; Toma, H.; Tanabe, K. Decrease of blood type antigenicity over the long-term after ABO-incompatible kidney transplantation. Transpl. Immunol. 2011, 25, 1–6. [Google Scholar] [CrossRef] [PubMed]
  25. Takahashi, K. A new concept of accommodation in ABO-incompatible kidney transplantation. Clin. Transplant. 2005, 19, 76–85. [Google Scholar] [CrossRef] [PubMed]
  26. Sasaki, H.; Hotta, K.; Mitsuke, A.; Fukasawa, Y.; Tanabe, T.; Higuchi, H.; Takada, Y.; Harada, H. Long-Term Outcome of ABO-Incompatible Kidney Transplantation in Patients Treated With Low-Dose Rituximab Regimen. Transplant. Proc. 2021, 53, 989–994. [Google Scholar] [CrossRef]
  27. Puttarajappa, C.; Shapiro, R.; Tan, H.P. Antibody-Mediated Rejection in Kidney Transplantation: A Review. J. Transplant. 2012, 2012, 193724. [Google Scholar] [CrossRef]
Figure 1. (Top row) Survival times regarding the gender of donor and recipient. (Left) Kaplan Meier; (Right) boxplots. (Bottom row) Bean plots of survival times with mean (blue) and median (red) regarding the donors’ and recipients’ gender. (Left) Donors’ gender; (Right) Recipients’ Gender.
Stats 08 00001 g001
Figure 2. Kaplan Meier curves (left column) and boxplots (right column) of survival times of kidney transplants with regard to the ethnicity of donor and recipient. White donors (top row); black donors (mid row); Hispanic donors (bottom row).
Stats 08 00001 g002
Figure 3. Bean plots of survival times with means (blue) and medians (red) regarding the ethnicity of donor or recipient. (Left) donor ethnicity; (Right) recipient ethnicity.
Stats 08 00001 g003
Figure 4. Kaplan Meier curves (left column) and boxplots (right column) of survival times of kidney transplants with regard to the ethnicity of donor and recipient. Asian donors (top row); American Indian donors (second row); Hawaiian donors (third row); multiracial donors (bottom row).
Stats 08 00001 g004aStats 08 00001 g004b
Figure 5. Comparison of max and min kidney survival times based on gender (left) and ethnicity (right).
Stats 08 00001 g005
Figure 6. Survival times of kidney transplants regarding the ethnicity of donors for different (donors’) genders. (Left) Boxplots. (Right) Line-plots with error bars.
Stats 08 00001 g006
Figure 7. Survival times of kidney transplants regarding the ethnicity of recipients for different (recipients’) genders. (Left) Boxplots. (Right) Line-plots with error bars.
Stats 08 00001 g007
Figure 8. Survival times of kidney transplants regarding the gender of recipients for different donors’ genders. (Left) Boxplots. (Right) Line plots with error bars.
Stats 08 00001 g008
Figure 9. Survival times of kidney transplants regarding the ethnicity of recipients for different donors’ ethnicities. (Left) Boxplots. (Right) Line plots with error bars.
Stats 08 00001 g009
Figure 10. Survival probabilities predicted by multivariate Cox PH model (solid black) with lower and upper bounds of the confidence interval (dashed lines in red and green) using gender and ethnicity of both donors and recipients, and survival probabilities calculated by Kaplan Meier analysis (solid blue), with lower and upper bounds of the confidence interval (dashed lines in purple and blue) using observed survival times.
Stats 08 00001 g010
Table 1. Ethnic cohorts with their related identification number.
EthnicityWhiteBlackHispanicAsianAmerican IndianHawaiianMultiracialOthers
ID1245679998
Table 2. Summary analysis for maximum/minimum kidney survival time among different cohorts.
Donor
Gender
RecipientSize
n
Max TimeSTDSample
Proportion
Donor
Gender
RecipientSize
n
Min TimeSTDSample
Proportion
MF97,8452303199221.5%MM149,9822223193433%
FF82,4302288195718%FM124,6822186189627%
Ethnicity Ethnicity
HawaiianAsian529294523540.1%HawaiianBlack143148114990.03%
American IndianAmerican Indian674249718160.15%American
Indian
Hispanic246162916110.054%
WhiteWhite22,41042488206749%WhiteBlack60,5751837167013.3%
MultiMulti197243217940.043%MultiHispanic887153914980.195%
AsianAsian4673232118621%AsianBlack1586163515010.35%
HispanicHispanic27,504222418356%HispanicBlack8884175515761.95%
BlackBlack34,656204217397.62%BlackHawaiian88174318150.02%
Table 3. Identified donor–recipient matches with maximum/minimum expected survival.
Donor
Gender
RecipientSample
Size
Max Expected Survival TimeKM
STD
Sample ProportionDonor
Gender
RecipientSample
Size
Min Expected Survival TimeKM
STD
Sample Proportionp
Value
MF97,8452303199221.5%FM124,6822186189627%2 × 10⁻¹⁶
Ethnicity Ethnicity
HawaiianAsian529294523540.1%BlackHawaiian88174318150.02%1.1 × 10⁻⁶
WhiteWhite224,1042488206749%WhiteBlack60,5751837167013.3%2 × 10⁻¹⁶
Table 4. Comparison of survival times among different ethnic groups using Kullback–Leibler divergence, Wilcoxon test, and overlap coefficient.
EthnicityComparisonKLDWilcoxon p-ValueOverlap
AsianBlack0.0483638.05398 × 10−450.84
AsianHispanic0.0140042.44724 × 10−70.78
AsianMultiracial0.0478816.11082 × 10−50.88
AsianNative0.0241840.26721660.87
AsianPacific0.0992930.84604930.93
AsianWhite0.0356863.06276 × 10−290.91
BlackHispanic0.0115651.68707 × 10−360.70
BlackMultiracial0.1689410.35566990.95
BlackNative0.1135029.0139 × 10−80.95
BlackPacific0.254744.83449 × 10−50.96
BlackWhite0.02381600.73
HispanicMultiracial0.1029140.027628550.94
HispanicNative0.0626040.17971350.93
HispanicPacific0.1720420.14541210.95
HispanicWhite0.016581.5662 × 10−1550.82
MultiracialNative0.0139710.0090935870.64
MultiracialPacific0.0230050.0089768960.66
MultiracialWhite0.1291242.51715 × 10−160.96
NativePacific0.0485770.64049230.75
NativeWhite0.0960344.15114 × 10−100.96
PacificWhite0.180960.0003903740.97
Table 5. Cox PH hazard results for ethnicity and gender cohorts.
VARIABLESCoef.Exp. (Coef.)SE (Coef.)ZPr. (>|z|)
Rcp.GENDER.M0.0351251.0357490.0099023.5470.000389
Rcp.ETH20.6698651.9539730.01126759.451<2 × 10⁻¹⁶
Rcp.ETH40.113861.1205950.0169466.7191.83 × 10−11
Rcp.ETH5−0.1567690.8549010.027447−5.7121.12 × 10−8
Rcp.ETH60.4089591.5052490.0497938.213<2 × 10⁻¹⁶
Rcp.ETH70.4239551.5279930.0717275.9113.41 × 10−9
Rcp.ETH90.3629561.4375730.061015.9492.70 × 10−9
Don.GENDER.M−0.0429590.9579510.009784−4.3911.13 × 10−5
Don.ETH20.0802281.0835340.014285.6181.93 × 10−8
Don.ETH4−0.0710190.9314440.016565−4.2871.81 × 10−5
Don.ETH50.0155431.0156650.0351090.4430.658
Don.ETH6−0.155370.8560990.081832−1.8990.058
Don.ETH70.0420521.0429490.096360.4360.663
Don.ETH9−0.0835770.919820.066516−1.2560.209
Table 6. Cox-PH model coefficients with confidence intervals.
VARIABLESExp. (Coef.)Exp. (Coef.)Lower 0.95Upper 0.95
Rcp.GENDER.M1.03570.96551.01581.056
Rcp.ETH21.9540.51181.91131.9976
Rcp.ETH41.12060.89241.0841.1584
Rcp.ETH50.85491.16970.81010.9022
Rcp.ETH61.50520.66431.36531.6596
Rcp.ETH71.5280.65451.32761.7586
Rcp.ETH91.43760.69561.27561.6202
Don.GENDER.M0.9581.04390.93980.9765
Don.ETH21.08350.92291.05361.1143
Don.ETH40.93141.07360.90170.9622
Don.ETH51.01570.98460.94811.088
Don.ETH60.85611.16810.72921.005
Don.ETH71.04290.95880.86351.2598
Don.ETH90.91981.08720.80741.0479
Disclaimer/Publisher’s Note: The statements, opinions and data contained in all publications are solely those of the individual author(s) and contributor(s) and not of MDPI and/or the editor(s). MDPI and/or the editor(s) disclaim responsibility for any injury to people or property resulting from any ideas, methods, instructions or products referred to in the content.

