Abstract
This study investigates the prediction of small and medium-sized enterprise (SME) default rates in Republic of Korea by comparing the performance of three prominent time-series forecasting models: ARIMA, SARIMA, and Prophet. The research utilizes a comprehensive dataset provided by the Korea Credit Guarantee Fund (KODIT), which covers regional and monthly default rates from January 2012 to December 2023, spanning 12 years. By focusing on Republic of Korea’s 17 major cities, the study aims to identify regional and seasonal patterns in default rates, highlighting the critical role that regional economic conditions and seasonality play in risk management. The proposed methodology includes an exploratory analysis of default rate trends and seasonal patterns, followed by a comparative evaluation of ARIMA, SARIMA, and Prophet models. ARIMA serves as a baseline model for capturing non-seasonal trends, while SARIMA incorporates seasonal components to handle recurring patterns. Prophet is uniquely suited for dynamic datasets, offering the ability to include external factors such as holidays or economic shocks. This work distinguishes itself from others by combining these three models to provide a comprehensive approach to regional and seasonal default risk forecasting, offering insights specific to Republic of Korea’s economic landscape. Each model is evaluated based on its ability to capture trends, seasonality, and irregularities in the data. The ARIMA model shows strong performance in stable economic environments, while SARIMA proves effective in modeling seasonal patterns. The Prophet model, however, demonstrates superior flexibility in handling irregular trends and external events, making it the most accurate model for predicting default rates across varied economic regions. The study concludes that Prophet’s adaptability to irregularities and external factors positions it as the most suitable model for dynamic economic conditions. These findings emphasize the importance of region-specific and seasonal factors in tailoring risk forecasting models. Future research will validate these predictions by comparing forecasted default rates with actual data from 2024, providing actionable insights into the long-term effectiveness of the proposed methods. This comparison aims to refine the models further, ensuring robust financial stability and enhanced SME support strategies for institutions like KODIT.
1. Introduction
Small and medium-sized enterprises (SMEs) are crucial drivers of economic growth and job creation, particularly in countries like Republic of Korea, where they account for a significant portion of the economy [1]. However, due to limited collateral and financial history, SMEs often face difficulties in accessing the capital necessary for their operations and expansion. To address these challenges, the Korea Credit Guarantee Fund (KODIT) was established with the mission to facilitate the financial accessibility of SMEs by providing credit guarantees. These guarantees allow SMEs to secure loans from financial institutions, thereby promoting continuous growth and economic stability. KODIT plays a vital role in bridging the gap between SMEs and financial institutions, ensuring that businesses with potential can thrive despite financial constraints. As of 2023, KODIT has supported over a million SMEs, contributing significantly to Republic of Korea’s economic resilience and competitiveness. Despite the crucial role of KODIT, the risks associated with guaranteeing SME loans must be effectively managed. If default risks are not adequately addressed, an increase in SME default rates can destabilize the financial system [2,3,4]. Thus, robust and proactive risk management strategies are necessary to mitigate the impact of defaults on both KODIT and the broader financial system.
One key factor influencing default rates is seasonality [5]. Economic activity tends to fluctuate throughout the year due to seasonal factors, affecting SMEs’ ability to service their debts. For instance, post-holiday periods or economic downturns often see increased loan defaults, while other times experience lower default rates due to favorable business conditions. Seasonal effects are particularly pronounced in industries such as retail and manufacturing, which are highly sensitive to demand cycles and supply chain disruptions. Furthermore, these seasonal fluctuations can be magnified or mitigated by regional economic conditions [6,7]. In Republic of Korea, cities with distinct economic structures and industrial compositions exhibit varying default rate patterns, underscoring the need for region-specific risk management strategies [8,9]. For example, Sejong, as a government-centered administrative city, demonstrates unique economic characteristics compared to Gwangju, a region heavily reliant on manufacturing and agriculture. These distinctions highlight the complexity of designing a unified risk management framework. Therefore, a one-size-fits-all approach to managing credit risk is insufficient. Tailored risk management strategies that account for both seasonal and regional characteristics are essential for enhancing KODIT’s effectiveness [10].
To address these challenges, this study aims to analyze the regional and monthly default rate data provided by KODIT, identifying both seasonal patterns and regional differences. The KODIT dataset is uniquely positioned for this analysis, as it captures detailed default rates from Republic of Korea’s 17 major cities over a span of 12 years, allowing for a comprehensive examination of temporal and spatial variations in SME risks. The study employs advanced time-series forecasting models such as ARIMA, SARIMA, and Prophet to predict default rates across the major cities. By comparing the performance of these models, the study seeks to determine the most suitable forecasting technique for managing regional credit risks. Additionally, the analysis will explore the relationship between credit guarantees (including the amount and type of guarantees issued) and default rates, offering deeper insights into how KODIT can fine-tune its credit risk management strategies.
The research proceeds through several key steps. First, regional and monthly default rate data are collected and preprocessed to ensure their suitability for analysis. The Prophet model, known for its capability to handle irregular seasonality and external events such as holidays, will be applied to identify seasonal and trend components in the data. To benchmark its performance, traditional time-series models such as ARIMA and SARIMA will also be employed. The models’ forecasting accuracy will be compared using standard metrics like Root Mean Square Error (RMSE) and Mean Absolute Percentage Error (MAPE). Lastly, correlation analysis will be conducted to assess the impact of various credit guarantee schemes on default rates.
By systematically identifying seasonal and regional characteristics, this study contributes to a more nuanced understanding of SME default risks in Republic of Korea. The findings will enable KODIT to implement more targeted risk management strategies, such as dynamic adjustment of guarantee limits and timing of interventions based on seasonal and regional factors. In doing so, the study aims to reinforce the stability of Republic of Korea’s SME sector, ultimately contributing to the resilience and vitality of the national economy.
2. Related Works
Research on credit risk management for small and medium-sized enterprises (SMEs) has evolved over time, focusing on how credit guarantees, financial forecasting models, and regional economic factors influence SME stability and default rates. This chapter explores the existing literature on these critical aspects to provide a foundation for understanding the research context of the current study.
2.1. SME Credit Risk and the Role of Credit Guarantees
SMEs are recognized as vital contributors to economic growth, especially in countries like Republic of Korea, where they account for a significant share of employment and overall economic output [1,11,12]. However, due to their limited access to collateral and shorter financial histories, SMEs often face challenges in securing financing. To mitigate this issue, institutions like the Korea Credit Guarantee Fund (KODIT) provide credit guarantees, reducing the risk for financial institutions and facilitating SME access to loans. Despite these advantages, credit guarantee schemes also come with inherent risks. Poorly managed credit risks, particularly in times of economic downturn, can lead to increased default rates, posing a systemic risk to the broader financial system. Various studies emphasize the need for robust risk management practices to prevent default contagion within credit guarantee schemes [3,5,13,14,15].
Altman and Sabato [13] highlighted the critical importance of developing SME-specific credit risk models, illustrating that traditional corporate models often fail to account for the unique risk profiles of small and medium-sized enterprises. Their model, which focuses on financial ratios, showed a 30% improvement in prediction accuracy for SME defaults compared to generic models, stressing the need for tailored risk assessment in SMEs. However, while the model’s accuracy was significantly enhanced, the authors pointed out that qualitative variables such as regional economic conditions were not included, which could limit its predictive power in diverse market conditions. This limitation is particularly relevant when assessing systemic risks in times of economic downturn, as regional and industry-specific factors play a crucial role in influencing default rates. The study also links the findings to regulatory frameworks like Basel II, demonstrating how accurate credit risk models can lower bank capital requirements, further emphasizing the importance of robust risk management practices to prevent default contagion.
Following Altman and Sabato’s emphasis on SME-specific credit risk models, Yun and Moon [3] focus on measuring systemic risk in the Korean banking sector using dynamic conditional correlation (DCC) models. Their study introduces two systemic risk measures—Marginal Expected Shortfall (MES) and CoVaR—to capture the time-varying nature of systemic risks. By applying these measures, they reveal how critical factors like a bank’s size, leverage, and value-at-risk (VaR) contribute to the broader financial system’s vulnerability during periods of economic stress. These findings underscore the importance of addressing not only individual firm risks but also the interconnected risks that propagate across financial institutions. The study’s proposal of an aggregate MES as an early warning indicator is particularly valuable for institutions such as KODIT, which must consider both SME-specific risks and the ripple effects across the financial ecosystem. In times of economic downturn, the inability to manage credit risks within one sector can lead to systemic repercussions, demonstrating the need for sophisticated risk measures that track broader financial contagion. Yun and Moon’s analysis complements Altman and Sabato’s work by highlighting how a macro-level approach to risk management, including early detection of systemic threats, is essential for maintaining overall financial stability.
Building on the systemic risk insights from Yun and Moon, Hu et al. [14] take a network-based approach to managing systemic risk, highlighting the complexity and interconnectedness of financial institutions. They propose the use of financial network analytics to better understand how systemic risks propagate through global financial networks, such as interbank payments and cross-holdings of financial assets. The study demonstrates that financial crises, like the 2008 global financial crisis, can cause a cascade of failures when institutions are interconnected through these networks. By analyzing financial networks from both econometric and topological perspectives, Hu et al. argue that network-based models can more accurately predict how systemic risk spreads across institutions. Their work emphasizes the need for institutions like KODIT to adopt similar network-based strategies, as the ripple effects of default contagion within credit guarantee schemes could potentially destabilize entire financial systems. Just as in interbank networks, poor management of interconnected risks within the SME sector can escalate into systemic issues. Hu et al.’s findings thus complement previous studies by reinforcing the importance of comprehensive systemic risk management that considers not only individual risk factors but also their interactions across the broader financial ecosystem.
Ferreira de Araújo Lima et al. [15] conducted a systematic review of Risk Management (RM) in SMEs, exploring how small and medium-sized enterprises face unique challenges in risk management due to their limited resources. The study underscores that while enterprise risk management (ERM) and financial risk management (FRM) are often well-studied in large firms, SMEs tend to adopt less comprehensive and often fragmented RM practices. The review identifies emerging RM streams like project risk management and strategic risk management, which are gaining attention but are still underdeveloped in SMEs. Their findings emphasize the need for a holistic RM approach tailored to SMEs, as current practices often fail to cover all types of risks—financial, operational, strategic, and hazard risks. Importantly, the study stresses that SMEs are particularly vulnerable to risks due to their smaller size and limited access to resources, reinforcing the critical need for effective risk management frameworks that are scalable and applicable to smaller firms. This research complements earlier studies by highlighting the importance of developing RM strategies that can mitigate systemic risks across different industries and firm sizes.
2.2. Risk Forecasting Models in Credit Risk Management
The exploration of systemic risk management and risk mitigation strategies for SMEs emphasizes the need for robust frameworks that account for both internal and external risks. However, managing risks effectively requires the ability to forecast potential financial vulnerabilities before they escalate into defaults or systemic crises. Risk forecasting models play a crucial role in this process, offering tools to predict trends, seasonal variations, and the likelihood of defaults. Building on the need for robust risk management practices, this subsection will explore various forecasting techniques that have been used in financial risk modeling, particularly in predicting SME default rates and understanding broader market trends. Several studies have highlighted the use of time-series models, including ARIMA, SARIMA, and the more recent Prophet model, to accurately forecast financial risks [16,17,18]. These models, by capturing trends and seasonality in financial data, enable institutions like KODIT to better anticipate economic downturns and make informed decisions on risk mitigation strategies.
Kim et al. [17] explore the limitations of classical time series models, such as GARCH, in forecasting financial market meltdowns. They argue that traditional models, which assume normal distribution, fail to capture extreme market events, like the 1987 Black Monday or the 2008 financial crisis. To address this, the authors propose a new framework using ARMA-GARCH models with a-stable and tempered stable distributions. These distributions allow for better modeling of financial returns, which often exhibit fat tails and volatility clustering not well captured by normal distributions. The paper presents empirical evidence showing that the proposed models outperform classical models in backtesting on major market crashes. Specifically, the CTS-ARMA-GARCH model provided more reliable predictions of extreme market downturns by better fitting the tail behavior of financial return distributions. The authors conclude that financial institutions and risk managers should adopt these advanced models to better forecast risks during periods of financial stress and mitigate the likelihood of systemic crises.
El-Qadi et al. [18] extend the discussion of risk forecasting by incorporating machine learning techniques, such as XGBoost, alongside traditional methods like ARMA. While machine learning models offer flexibility and adaptability in dynamic and uncertain financial environments, traditional time-series models remain highly relevant for capturing trends, seasonality, and irregular fluctuations in financial data, particularly when historical data is robust and well-documented.
In this context, time-series models like ARIMA, SARIMA, and Prophet are critical for analyzing SME default risks, especially in regions with established economic cycles. This study focuses on comparing these three models to predict SME default rates across Republic of Korea’s 17 major cities. Time-series analysis plays an indispensable role in financial forecasting by identifying temporal dependencies, making it well-suited for institutions like KODIT to anticipate downturns and mitigate risks. While traditional models such as ARIMA and SARIMA are effective in capturing trends and seasonality, Prophet excels in handling irregular data patterns and external events, such as holidays and economic shocks, making it particularly suited for dynamic and complex economic environments.
In addition to these time-series models, recent advances in default probability forecasting have introduced complementary approaches, including machine learning and hybrid methodologies. These techniques enhance the predictive power of traditional models by incorporating systemic risk factors, firm-specific characteristics, and macroeconomic variables. The following section delves into these advances, highlighting their contributions to understanding and managing credit risks more effectively.
2.3. Advances in Default Probability Forecasting
Forecasting the probability of default for enterprises and organizations has been a critical area of research in financial risk management. Early contributions, such as Altman and Sabato [13], introduced SME-specific credit risk models focusing on financial ratios. Building on this foundation, recent studies have developed advanced methodologies, incorporating both traditional statistical techniques and machine learning approaches.
For instance, Dar et al. [19] compute the probability of default (PD) using market-based data, highlighting its convenience for financial surveillance. Their study also discusses models that analyze credit risks, including PD, migration risk, and loss given default, providing a statistical foundation for risk assessment. Similarly, Traczynski [20] proposed a Bayesian model-averaging approach to account for incomplete knowledge of the true model behind corporate default and bankruptcy filings. The study emphasized that model uncertainty significantly impacts predictive accuracy and showed how Bayesian approaches improve firm-level default predictions.
Kim et al. [21] reviewed advancements in corporate default predictions, categorizing methodologies into statistical and machine learning algorithms. Their research forecasts that financial sector innovations will increasingly rely on machine learning, especially for dynamic credit risk modeling. Additionally, Bazzana et al. [22] compared machine learning classifiers with traditional logistic regression using data from small Italian firms. Their study demonstrated that machine learning techniques, particularly when applied to granular datasets, significantly enhance default prediction accuracy.
Finally, Zheng et al. [23] developed a default risk management framework for micro and small enterprises using explainable machine learning techniques. By employing the Shapley Additive exPlanations (SHAP) method, their study identified the contribution of various indicators to default predictions, improving the transparency and interpretability of predictive models. These advances complement the time-series modeling approaches discussed in the previous section by providing additional tools to forecast defaults. Together, these methods underscore the critical importance of leveraging diverse models and techniques to develop robust risk management strategies tailored to varying economic and organizational contexts.
3. Methodology
The Korea Credit Guarantee Fund (KODIT) plays a pivotal role in enhancing the financial accessibility of small and medium-sized enterprises (SMEs) in Republic of Korea by providing credit guarantees to businesses lacking sufficient collateral. This study analyzes comprehensive data from KODIT, sourced from the public data portal (DATA.GO.KR), which covers regional and monthly default rates from January 2012 to December 2023, spanning 12 years. By employing a rigorous methodological approach, this study aims to provide a detailed analysis of KODIT’s default rate data, facilitating the development of effective risk management strategies that contribute to the sustainable growth of SMEs.
This section outlines the methodological approach used to analyze the default rates, focusing on both exploratory data analysis and predictive modeling. The analysis is divided into several key stages. Firstly, we conduct an exploratory analysis of the data, examining both Monthly and Yearly Average Default Rates. This stage aims to identify significant temporal patterns, including seasonal variations and long-term trends that influence default rates across different regions. Understanding these patterns is crucial for anticipating periods of heightened risk and for developing strategies to mitigate potential spikes in default rates.
To ensure robust evaluation and meaningful comparisons of the forecasting models, this study introduces a benchmark setup that incorporates standard evaluation metrics such as Root Mean Square Error (RMSE), Mean Absolute Error (MAE), Mean Absolute Percentage Error (MAPE), and Symmetric Mean Absolute Percentage Error (sMAPE). These metrics allow for a systematic assessment of each model’s accuracy and robustness in capturing the temporal characteristics of the default rate data. The dataset is not split into training and testing sets, as the primary focus is on analyzing and comparing the interpretative strengths of the models in capturing trends and seasonality. Future work will extend this study to include predictive reliability through in-sample and out-of-sample validations.
Following this, we engage in time series forecasting to predict future default rates. To this end, we employ three different forecasting models: ARIMA, SARIMA, and Prophet. These models differ in their ability to handle trends, seasonality, and external factors, making them uniquely suited for different aspects of the data:
- ARIMA (Autoregressive Integrated Moving Average): This model serves as a baseline for forecasting. ARIMA is designed to capture linear trends and non-seasonal patterns in time series data. It operates by modeling dependencies between observations in a sequence, making it effective for datasets without strong seasonal components. However, it lacks the ability to handle periodic fluctuations explicitly, which limits its application for data with significant seasonality.
- SARIMA (Seasonal ARIMA): SARIMA extends the ARIMA model by incorporating seasonal differencing and seasonal autoregressive and moving average terms. This enhancement enables SARIMA to effectively model periodic patterns, making it particularly suitable for datasets with evident seasonal fluctuations. SARIMA is thus a robust choice for understanding recurring trends over fixed intervals.
- Prophet: Developed by Facebook, Prophet is a more flexible approach to time series forecasting. Unlike ARIMA and SARIMA, Prophet excels at handling irregular data patterns, outliers, and missing values. It also allows for the inclusion of external regressors, such as holidays or policy changes, which can significantly impact default rates. This flexibility makes Prophet particularly useful for dynamic and complex datasets where standard models may struggle.
The primary distinction among these models lies in their handling of seasonality and external influences. ARIMA provides a solid foundation for general trend analysis, SARIMA is specialized for periodic patterns, and Prophet offers robust adaptability to irregular and external factors.
By comparing the performance of these models, we aim to identify the most reliable approach for forecasting default rates across different regions. This comparison will include evaluation metrics such as Root Mean Square Error (RMSE), Mean Absolute Error (MAE), and Symmetric Mean Absolute Percentage Error (sMAPE). The insights gained from this analysis will be crucial for developing data-driven, region-specific risk management strategies that can be implemented by KODIT to enhance the financial stability of SMEs in Republic of Korea. The results of this methodological approach will provide a solid foundation for the development of effective interventions, ultimately contributing to the stability and growth of the SME sector.
3.1. Data Collection and Preprocessing
The data used in this study were obtained from the Korea Asset Management Corporation (KODIT) and are publicly available through the Open Data Portal (DATA.GO.KR). The primary dataset comprises monthly default rates for 17 major regions in Republic of Korea from 2012 to 2023. (Note that data for Sejong City is available from June 2015 onwards, following its establishment as a separate administrative region.) This dataset is well-suited for an in-depth analysis of temporal trends in default rates and regional disparities.
During the preprocessing phase, several key steps were performed to prepare the data for analysis. First, year and month variables were extracted from the ‘Date’ column (originally in date format) to facilitate the analysis of seasonal trends and to support time series analysis. Second, a check for missing and duplicate values was conducted. Crucially, the data provided by KODIT was found to be free of any missing or duplicate entries. This underscores the high quality of the data provided by KODIT.
Prior to commencing the analysis, we assessed the data for potential outliers. Given the focus of this study—analyzing temporal trends and regional variations in monthly default rates—we recognized that statistically outlying values could reflect external economic shocks (e.g., financial crises, sectoral booms or busts) or policy shifts. These values were deemed essential for contextualizing default rate dynamics and were therefore retained. For example, a sharp increase in a region’s default rate might signal localized economic distress; omitting such data could undermine the analytical integrity. Consequently, all observed values were included to provide a comprehensive understanding of default rate fluctuations over time.
A detailed statistical examination of the dataset revealed distinct characteristics across different regions. The average default rates varied significantly, with regions like Gangwon and Sejong showing marked differences. Specifically:
- Gangwon had an average default rate of approximately 3.39% with a standard deviation of 1.76%, ranging from a minimum of 0.03% to a maximum of 11.60%.
- Gyeonggi showed minimal fluctuations over time with an average default rate of 3.59% and a standard deviation of 1.28%, ranging from 1.30% to 10.46%.
- Gwangju displayed an average default rate of 3.52%, with a standard deviation of 1.27% and a range between 1.32% and 8.01%.
- Sejong exhibited the lowest average default rate at 2.42%, but with the highest variability (standard deviation of 3.44%). Its default rate ranged from a minimum of −0.11% to a peak of 28.82%, indicating a significant fluctuation over time.
- Ulsan and Jeonnam also showed notable variations, with Ulsan having a default rate range from −2.18% to 13.26% and Jeonnam from −1.20% to 10.44%.
These variations highlight the diverse economic conditions across regions and emphasize the importance of tailoring risk management strategies to specific regional contexts. The presence of negative minimum values in some regions may indicate data anomalies or unique circumstances that warrant further investigation. The standard deviations across these regions indicate varying levels of volatility, with regions like Sejong and Jeju displaying particularly high fluctuations. These findings underscore the need for careful analysis when developing predictive models and risk management strategies, particularly in regions where default rates are more volatile.
3.2. Analysis of Default Rates
In this subsection, we present a detailed analysis of the default rates across various regions in Republic of Korea, focusing on both monthly and yearly trends. The analysis aims to identify significant patterns in the data that can inform risk management strategies and provide insights into the underlying factors driving regional disparities in default rates.
3.2.1. Monthly Average Default Rates
The first part of our analysis examines the monthly average default rates across the 17 major regions from 2012 to 2023. The graph in Figure 1 below highlights how default rates fluctuate throughout the year, revealing potential seasonal patterns.
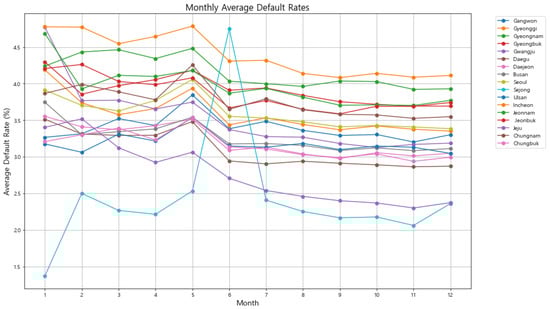
Figure 1.
Monthly Average Default Rates across 17 regions in Republic of Korea (2012–2023). The graph highlights seasonal patterns in default rates, with most regions showing a decrease from May to June, except for Sejong, which exhibits an anomalous increase during this period.
As shown in Figure 1, most regions exhibit a consistent pattern where default rates tend to decrease between May and June. This trend suggests that certain seasonal factors, such as the end of fiscal periods or agricultural cycles, may influence the ability of businesses to meet their financial obligations during these months. However, Sejong distinctly deviates from this trend, standing out as a significant anomaly. While other regions experience a decline in default rates from May to June, Sejong uniquely shows a sharp and unexpected increase during this period. This unusual pattern not only diverges from the general trend observed across Republic of Korea but also raises important questions about the underlying factors specific to Sejong. Such a spike could be attributed to a range of causes, including administrative cycles that are unique to the region, localized economic conditions, or the timing of specific policy implementations that disproportionately affect Sejong.
The stark contrast in Sejong’s default rate behavior highlights the need for a deeper examination of the region’s economic activities and policy environment during this period. It is possible that fiscal measures or economic events in Sejong are aligned differently compared to other regions, resulting in this pronounced spike in default rates. Understanding these unique characteristics is crucial, as they have significant implications for developing targeted risk management strategies that are tailored to the specific needs and conditions of Sejong. Given the distinct nature of Sejong’s default rate pattern, it will be further analyzed in the subsequent sections where time series forecasting models are applied. These models will help assess how well they can capture and predict such anomalies, offering insights into the most effective approaches for forecasting default rates in regions with unique economic conditions.
3.2.2. Yearly Average Default Rates
The second part of our analysis focuses on the yearly average default rates, which provides a broader view of how default rates have evolved over time. This analysis is particularly important for identifying long-term trends and understanding how external factors, such as economic events or policy changes, have impacted default rates across regions. From the yearly average default rates graph in Figure 2, we observe that default rates generally declined across most regions until 2022. This trend could reflect the effectiveness of government support measures, financial interventions, or improving economic conditions that helped businesses manage their debts. However, in 2023, there is a significant reversal of this trend, with default rates sharply increasing in all regions. This surge is particularly pronounced in Sejong, Gwangju, and Jeonnam.
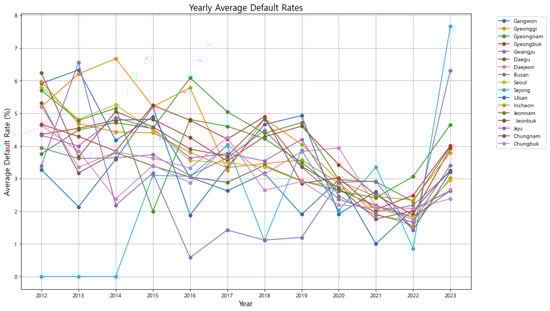
Figure 2.
Yearly Average Default Rates across 17 regions in Republic of Korea (2012–2023). The graph shows a general decline in default rates until 2022, followed by a sharp increase in 2023, particularly in Sejong, Gwangju, and Jeonnam, likely reflecting the delayed economic impacts of the COVID-19 pandemic.
The sharp increase in 2023 suggests that the economic effects of the COVID-19 pandemic may have finally caught up with businesses, particularly as government support measures were phased out or reduced. While the pandemic began in late 2019, its most severe financial impacts on SMEs might have been delayed due to the extensive government interventions that temporarily cushioned the economic blow. As these interventions waned, businesses that had been struggling may have finally succumbed to financial pressures, leading to the observed spike in defaults.
Given the significant increases observed in 2023, particularly in Sejong, Gwangju, and Jeonnam, these regions will be of special focus in the subsequent time series forecasting analysis. By applying models such as SARIMA and Prophet, we will assess how well these models can capture and predict such abrupt changes, providing further insights into the underlying dynamics and potential for targeted risk management interventions. Notably, Sejong, which had the lowest default rate in 2022, experienced one of the most significant increases in 2023. This drastic change indicates that while Sejong may have initially been resilient, perhaps due to its status as a relatively new administrative city with ongoing government investment, the underlying vulnerabilities eventually manifested as the broader economic situation deteriorated. Similarly, Gwangju and Jeonnam also saw significant increases in default rates, pointing to regional economic challenges that may require focused policy responses. The sharp increases observed in regions such as Sejong, Gwangju, and Jeonnam underscore the importance of proactive policy measures and the need for robust forecasting tools. By accurately predicting potential future spikes in default rates, KODIT can implement timely interventions, mitigating the risk of widespread financial instability among SMEs. The subsequent time series analysis will play a crucial role in developing these predictive insights, ultimately guiding more effective policy responses.
The analysis of both monthly and yearly default rates underscores the importance of considering both short-term seasonal patterns and long-term trends in the development of risk management strategies. The distinct patterns observed in regions like Sejong, Gwangju, and Jeonnam highlight the need for tailored approaches that account for the specific economic conditions and challenges faced by each region. By understanding these dynamics, KODIT can better anticipate periods of heightened risk and implement more effective, region-specific interventions to support the financial stability of SMEs across Republic of Korea.
3.2.3. Seasonality Analysis
Understanding the seasonal patterns in default rates is crucial for developing effective forecasting models and risk management strategies. By decomposing the default rates into their trend, seasonal, and residual components, we can gain insights into how seasonal factors influence the overall risk of defaults across different regions. The seasonal decomposition of default rates across 17 regions in Republic of Korea revealed consistent seasonal patterns in most regions, with some notable exceptions that align with our earlier findings from the monthly and yearly average default rates analyses.
In Sejong (Figure 3), the seasonal component exhibits significant fluctuations, especially around the mid-year period. This is consistent with our earlier observation in Section 3.2.1, where Sejong displayed a unique spike in default rates during May and June, contrasting with the general trend observed in other regions. The seasonality in Sejong’s default rates suggests that local factors, possibly related to administrative cycles or region-specific economic activities, play a critical role in influencing default rates during this period. The residual component also shows occasional spikes, indicating that external shocks or non-seasonal events might have a substantial impact on Sejong’s default rates.
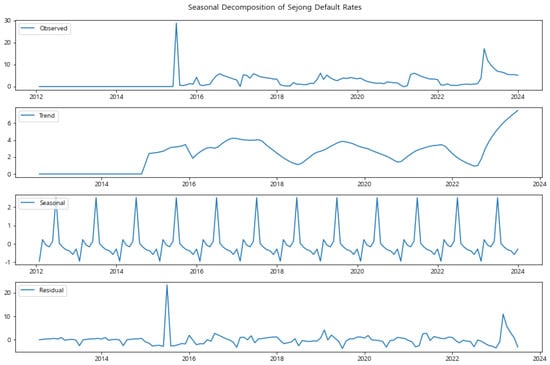
Figure 3.
Seasonal Decomposition of Sejong Default Rates (2015–2023). The graph shows significant seasonal fluctuations, particularly around mid-year, which aligns with the unique spike in default rates observed during May and June.
Similarly, Gwangju and Jeonnam (Figure 4 and Figure 5) also exhibit distinct seasonal patterns. These regions showed a sharp increase in default rates in 2023, as discussed in Section 3.2.2. The seasonal decomposition reveals that while there is a strong seasonal component, the trend component also reflects the upward shift in default rates, particularly in recent years. This indicates that both long-term factors and seasonal influences are contributing to the heightened default risk in these regions.
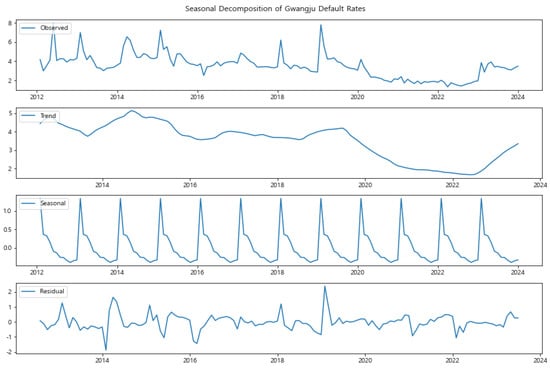
Figure 4.
Seasonal Decomposition of Gwangju Default Rates (2012–2023). The seasonal component is pronounced, with an upward trend in recent years, reflecting the sharp increase in default rates in 2023.
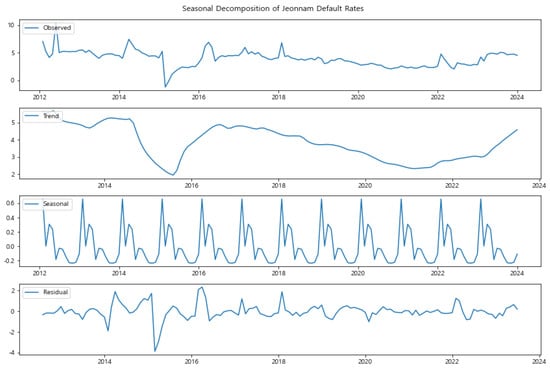
Figure 5.
Seasonal Decomposition of Jeonnam Default Rates (2012–2023). The analysis reveals a strong seasonal influence alongside a significant upward trend in recent years, contributing to the region’s increased default risk.
In contrast, Seoul and Gyeonggi (Figure 6 and Figure 7) present more stable seasonal patterns, with less pronounced fluctuations in the seasonal component. This stability aligns with their role as economically significant regions, where larger and more diverse economic activities might buffer against seasonal shocks. However, even in these regions, there is a noticeable seasonal effect that could be related to broader economic cycles affecting the entire country.
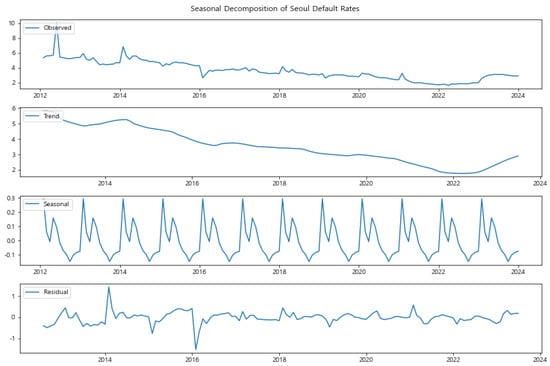
Figure 6.
Seasonal Decomposition of Seoul Default Rates (2012–2023). While the seasonal component is present, the overall stability in trends reflects the region’s robust economic activities.
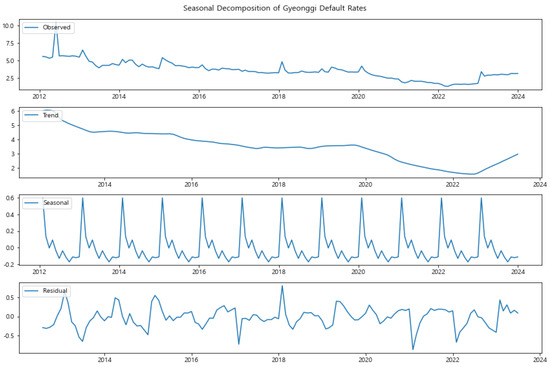
Figure 7.
Seasonal Decomposition of Gyeonggi Default Rates (2012–2023). The graph shows consistent seasonal patterns, with less pronounced fluctuations, indicating relative stability in default rates.
The seasonal decomposition of default rates for regions like Sejong, Gwangju, and Jeonnam reveals distinct patterns that have important implications for KODIT’s risk management strategies. For instance, the analysis for Sejong shows significant fluctuations tied to irregular economic activities, suggesting that default risks in this region are heavily influenced by external factors beyond regular seasonal cycles. This makes it more challenging for KODIT to predict default rates using traditional methods that rely solely on stable seasonal patterns. In contrast, Gwangju and Jeonnam display more consistent seasonal trends, where default rates peak during specific times of the year, indicating a predictable economic cycle that KODIT could proactively manage.
These findings suggest that seasonal patterns are predictable enough to inform risk management interventions, but only in certain regions where regular cycles are evident, such as Gwangju and Jeonnam. In these cases, KODIT could implement seasonal adjustments to its credit guarantee policies, offering more flexible terms or heightened scrutiny during high-risk periods. On the other hand, regions like Sejong, where seasonal patterns are less regular, may require more sophisticated forecasting tools, such as the Prophet model, which accounts for irregular trends and external shocks. This tailored approach would allow KODIT to allocate its resources more effectively, ensuring that interventions are aligned with the unique risk profiles of each region.
3.3. Time Series Forecasting
This subsection focuses on the application of time series forecasting models to predict future default rates across various regions in Republic of Korea. The primary models used in this analysis are ARIMA (Autoregressive Integrated Moving Average), SARIMA (Seasonal ARIMA), and Prophet. These models were selected due to their ability to capture different aspects of the data, including trends, seasonality, and irregular fluctuations, making them well-suited for predicting default rates.
3.3.1. ARIMA Implementation
To effectively forecast the default rates across different regions using the ARIMA model, it is essential to first ensure that the data is stationary. A stationary time series has constant mean and variance over time and does not exhibit trends or seasonal effects, which are crucial conditions for the ARIMA model to provide reliable predictions. The following steps were undertaken to prepare the data and apply the ARIMA model:
- Stationarity Check: To effectively forecast the default rates using the ARIMA model, it is crucial to ensure that the time series data for each region is stationary. A stationary time series has a constant mean and variance over time, and does not exhibit trends or seasonal effects, which are essential conditions for the ARIMA model to provide accurate predictions. The stationarity of the monthly average default rates for each of the 17 regions was assessed using the Augmented Dickey-Fuller (ADF) test. The null hypothesis of the ADF test is that the time series is non-stationary. A p-value less than 0.05 indicates that the series is stationary. The detailed results of the ADF test for the original data are provided in Table A1 in the Appendix A.The ADF test results indicate that several regions exhibit non-stationary time series data, as their p-values exceed the threshold of 0.05. Specifically, the regions of Gangwon, Gyeonggi, Gyeongbuk, Busan, Seoul, Incheon, and Jeonbuk did not reject the null hypothesis of the ADF test, suggesting the presence of a unit root and, therefore, non-stationary behavior in their monthly average default rates. Non-stationarity in time series data can lead to inaccurate model predictions, as it implies that the mean and variance of the series change over time, making it difficult for the ARIMA model to identify consistent patterns. To address this issue, first-order differencing was applied to the data from these regions. Differencing involves subtracting the previous observation from the current observation to remove trends and stabilize the mean, thereby transforming the data into a stationary series. After applying differencing to the identified regions, the ADF test was re-applied to confirm the stationarity of the transformed data. The detailed results of the re-applied ADF test, which confirm that the differenced series are now stationary, are provided in Table A2 in the Appendix A. By ensuring that all regions exhibit stationary time series data after differencing, we can proceed to the next step of model implementation with confidence that the ARIMA model will be able to accurately capture and predict the underlying patterns in the default rates.
- ACF and PACF Analysis: To determine the appropriate parameters for the autoregressive (p) and moving average (q) components of the ARIMA model, we analyzed the Autocorrelation Function (ACF) and Partial Autocorrelation Function (PACF) plots for each region. Given the large number of regions, we present the analysis for several representative regions, including Gangwon, Gyeonggi, Sejong, and Jeju, which illustrate typical and atypical patterns observed across the dataset.In the case of Gangwon, the PACF plot (Figure 8a) shows a significant spike at lag 1, followed by a sharp decline, suggesting an AR(1) model (p = 1). The ACF plot shows a gradual decline, which indicates that an MA component might not be necessary (q = 0). For Gyeonggi, both the ACF and PACF plots (Figure 8b) display significant spikes at the first lag, suggesting that both an AR(1) and MA(1) model (p = 1, q = 1) may be appropriate. This pattern is consistent with other regions that have relatively stable and predictable time series behavior.
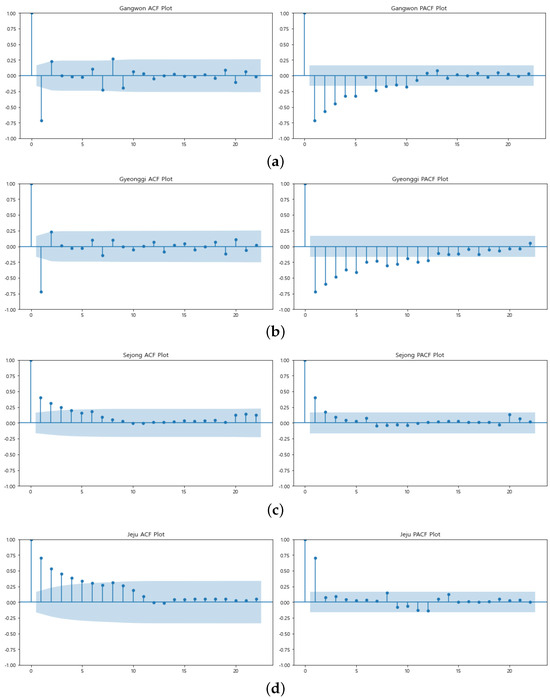 Figure 8. ACF and PACF plots for selected regions: (a) Gangwon, (b) Gyeonggi, (c) Sejong, and (d) Jeju. These plots help determine the ARIMA model parameters p and q for each region.However, the Sejong region (Figure 8c) exhibits an unusual pattern in its ACF and PACF plots. The PACF plot shows significant spikes at multiple lags, and the ACF plot displays a slower decay, indicating that a higher-order AR or MA component may be necessary. This suggests that Sejong’s default rate data may have more complex dynamics, potentially due to its unique economic or policy environment. Similarly, Jeju (Figure 8d) shows a notable pattern where both the ACF and PACF plots indicate potential seasonality or other recurring patterns. The spikes at lags that correspond to seasonal periods suggest that a seasonal ARIMA (SARIMA) model might be more appropriate for capturing the underlying trends in Jeju.These patterns were consistent with other regions, with slight variations depending on local characteristics. Table 1 summarizes the suggested p and q values for a selection of regions based on this analysis.
 Table 1. Summary of Suggested ARIMA Parameters Based on ACF and PACF Analysis.
 - Model Application: The ARIMA model was applied to forecast the monthly default rates for each of the 17 regions in Republic of Korea from January 2024 to December 2024. The resulting forecasts provide insights into the expected default rates over the upcoming year. A common pattern observed across most regions was the relatively stable and flat forecasts, with minimal variation. This suggests that the ARIMA model, which primarily captures linear trends, may not fully account for the more complex dynamics, such as seasonal variations, present in the default rate data. For instance, the model’s forecasts for regions like Gyeongnam, Jeonnam, and Gwangju show almost flat predictions, indicating the model’s tendency to revert to a mean level in the absence of strong linear trends. The detailed forecasts are presented in Figure A1 in the Appendix A.However, the earlier seasonality analysis (Section 3.2.3) revealed significant seasonal patterns in many regions, particularly in regions like Sejong, Jeonnam, and Jeju. These regions demonstrated clear seasonal fluctuations in default rates, especially around mid-year, which ARIMA’s linear nature fails to capture adequately. For instance, the default rate in Sejong has shown marked increases during specific times of the year, likely tied to unique administrative cycles or localized economic conditions. ARIMA’s failure to integrate these seasonal factors into its forecasts results in underestimation of potential fluctuations, leading to conservative and potentially less accurate predictions.In regions such as Sejong and Jeju, where more significant fluctuations were observed in the historical data, the ARIMA model’s predictions do align more closely with recent trends, but they still fall short of capturing the full extent of seasonal and non-linear variations. The general flatness in the ARIMA model’s forecasts across all regions highlights its limitation in addressing the complex, non-linear patterns identified in the seasonal decomposition. Given these limitations, it is evident that ARIMA alone may not be sufficient to accurately predict default rates in regions with strong seasonal components and other non-linear trends. This shortfall underscores the necessity of exploring more advanced time series models, such as SARIMA (Seasonal ARIMA) and Prophet, which are explicitly designed to incorporate seasonal effects and non-linear trends. These models have the potential to provide more accurate and nuanced forecasts by better reflecting the underlying seasonal patterns and economic cycles that influence default rates.To comprehensively evaluate the forecasting performance, we will compare the results from ARIMA with those obtained from SARIMA and Prophet models in Section 3.3.5. This comparison will include key error metrics such as Root Mean Square Error (RMSE), Mean Absolute Error (MAE), Mean Absolute Percentage Error (MAPE), Mean Squared Error (MSE), and Symmetric Mean Absolute Percentage Error (sMAPE) to quantitatively assess the accuracy and reliability of each model’s predictions. By doing so, we aim to identify the most effective forecasting approach for predicting default rates, particularly in regions with complex seasonal and non-linear characteristics.
In summary, while the ARIMA model provides a baseline forecast, its limitations, particularly in capturing seasonal patterns and non-linear trends, suggest that it may not fully capture the underlying complexities of default rates in these regions. Therefore, we will next explore the application of SARIMA and Prophet models to assess whether they offer improved forecasting performance by incorporating these critical factors.
3.3.2. SARIMA Implementation
To improve the forecasting accuracy for regions exhibiting clear seasonal patterns, the SARIMA (Seasonal ARIMA) model was employed. Unlike the standard ARIMA model, SARIMA is particularly suited for time series data that display regular seasonal variations. The model extends ARIMA by incorporating additional seasonal terms, making it more capable of capturing periodic patterns that occur at fixed intervals, such as monthly or yearly cycles. The application of the SARIMA model involved the same steps of stationarity check and ACF/PACF analysis, as performed during the ARIMA model implementation. Since these steps are identical to those outlined in the ARIMA section, detailed results for these processes are not repeated here. Instead, we focus on the additional seasonal components incorporated in the SARIMA model and the subsequent model selection process.
Selecting the appropriate SARIMA model for each region involved a systematic approach to identify the optimal parameters that best fit the data. SARIMA models are defined by seven parameters: (p, d, q) for the non-seasonal part and (P, D, Q, s) for the seasonal part. Here, p, d, and q represent the order of the autoregressive, differencing, and moving average terms, respectively, while P, D, and Q correspond to their seasonal counterparts. The parameter s denotes the length of the seasonal cycle, which, in this case, was set to 12 months to reflect annual seasonality.
The selection of these parameters was guided by the following steps:
- Stationarity Check and Differencing: Initially, the data was checked for stationarity using the Augmented Dickey-Fuller (ADF) test. For non-stationary series, appropriate differencing (d) was applied to achieve stationarity. Seasonal differencing (D) was also considered based on the seasonal patterns observed in the data.
- Autocorrelation and Partial Autocorrelation Analysis: The Autocorrelation Function (ACF) and Partial Autocorrelation Function (PACF) plots were examined to provide insights into the potential values for the autoregressive (p, P) and moving average (q, Q) components. This analysis helped to narrow down the range of plausible parameter values.
- Grid Search with AIC Criterion: A grid search approach was employed to systematically explore combinations of the SARIMA parameters. For each combination, the Akaike Information Criterion (AIC) was computed, with the goal of selecting the model that minimized the AIC value. The AIC provides a measure of the model’s goodness of fit, penalizing for model complexity to avoid overfitting.The parameters and AIC values for the SARIMA model, which were determined through the model selection process, are summarized in Table 2. AIC (Akaike Information Criterion) is a measure used to compare the relative quality of statistical models for a given dataset, with lower AIC values indicating a model that better fits the data while avoiding overfitting. For example, the SARIMA model for Seoul, which had an AIC of 13.380, was selected because it offered the best balance between accuracy and complexity for this region. In contrast, the model for Sejong, with a much higher AIC of 533.612, suggests that capturing the default rate patterns in Sejong is more complex, likely due to the unique and irregular fluctuations observed in this region. These examples illustrate how AIC values guide the selection of the most appropriate model for each region, ensuring that the chosen model provides a balance between fitting the data well and maintaining simplicity to avoid overfitting.
Table 2. Optimal SARIMA Parameters and AIC Values for Each Region.
- Comparison of ARIMA and SARIMA Forecasts: The ARIMA model’s forecasts generally display relatively flat predictions across most regions, reflecting its focus on capturing linear trends. As shown in Figure A1, ARIMA tends to revert to a mean level when no strong linear trend is present in the historical data, leading to stable forecasts with minimal variation. This stability is evident in regions such as Gyeongnam, Jeonnam, and Gwangju, where the predicted default rates remain almost unchanged throughout the forecast period.In contrast, the SARIMA model, which incorporates seasonal components into its forecasts, provides more nuanced predictions that account for the periodic fluctuations observed in the data. As illustrated in Figure A2, SARIMA is more adept at capturing the seasonal patterns that occur at regular intervals, such as monthly or yearly cycles. This results in forecasts that better reflect the expected variations in default rates due to these seasonal effects.A closer examination of specific regions further highlights the differences between the two models. For instance, the Sejong region presents a unique challenge for forecasting due to its distinctive economic and administrative cycles. The ARIMA model’s forecast for Sejong (Figure A1) is notably flat, failing to capture the sharp fluctuations observed in recent historical data. On the other hand, the SARIMA model provides a forecast that better aligns with the region’s historical patterns, albeit still conservative in its predictions. The detailed SARIMA forecasts are presented in Figure A2 in the Appendix A. This suggests that while SARIMA offers an improvement over ARIMA, the region’s complex dynamics may require even more sophisticated modeling techniques.In Gwangju, the ARIMA model predicts a relatively stable default rate, with little variation expected in the forecast period. However, the SARIMA model reveals subtle increases and decreases in the predicted default rates, reflecting the underlying seasonal patterns that ARIMA overlooks. This indicates that SARIMA’s inclusion of seasonal terms allows for a more accurate representation of the expected fluctuations in Gwangju’s default rates. Similarly, Jeonnam’s forecast under the ARIMA model is largely flat, suggesting stability in future default rates. In contrast, the SARIMA model captures more intricate patterns, predicting both seasonal increases and decreases that are consistent with the region’s historical data. This demonstrates SARIMA’s ability to incorporate both short-term and long-term variations, making it a more reliable tool for forecasting in regions with pronounced seasonal effects.The results from both ARIMA and SARIMA highlight the strengths and weaknesses of each approach. ARIMA, while effective in capturing linear trends, falls short in regions where non-linear patterns and seasonality play a significant role. This limitation is particularly evident in regions like Sejong, Gwangju, and Jeonnam, where the forecasted flat lines do not adequately reflect the observed historical volatility. SARIMA, by incorporating seasonal components, addresses some of these limitations, offering more dynamic forecasts that align better with the data’s periodic patterns. However, even SARIMA has its constraints, particularly in regions where non-seasonal shocks or irregular events significantly impact default rates. For example, in Sejong, where the economic environment is influenced by unique administrative cycles, SARIMA provides a more accurate forecast than ARIMA but still may not fully capture the complexities involved.Given the observed limitations of ARIMA and the partial success of SARIMA, it is clear that more advanced models may be required to fully capture the complexities of default rates across different regions. In subsequent sections, we will explore the use of Prophet, a forecasting tool that is designed to handle non-linear trends, outliers, and multiple seasonalities. Prophet’s flexibility makes it particularly well-suited for regions like Sejong, where standard time series models may not be sufficient. Moreover, to quantitatively assess the accuracy and reliability of the forecasts produced by ARIMA, SARIMA, and Prophet, we will compare these models using key error metrics such as Root Mean Square Error (RMSE), Mean Absolute Error (MAE), Mean Absolute Percentage Error (MAPE), Mean Squared Error (MSE), and Symmetric Mean Absolute Percentage Error (sMAPE). This comparison will help in identifying the most effective forecasting approach for predicting default rates, particularly in regions with complex seasonal and non-linear characteristics.
3.3.3. Prophet Implementation
To further enhance the accuracy of forecasting default rates across different regions, especially where non-linear trends and seasonalities are significant, the Prophet model was employed. Prophet, developed by Facebook, is designed to handle time series data with missing values, outliers, and multiple seasonal patterns. Its ability to incorporate holiday effects and other external regressors makes it a robust tool for complex datasets.
- Data Preparation: The data for each region was restructured into a format compatible with the Prophet model. Specifically, the data was transformed into a DataFrame with two columns: ‘ds’ for the date and ‘y’ for the default rates. This restructuring is essential for Prophet, which requires the data to be in this specific format for time series analysis. In this study, the complete dataset (2012–2023) was used without splitting into training and test sets. This approach was chosen to focus on the comparative analysis of the models’ ability to capture trends, seasonality, and irregularities across regions rather than evaluating their predictive performance. For future research, we plan to incorporate a training and testing split to analyze in-sample and out-of-sample predictive reliability in greater detail.
- Model Fitting: After preparing the data, the Prophet model was applied to the complete dataset. The fitting process involved the model learning from the historical data, identifying patterns such as trends and seasonality, and capturing these features to make future predictions. Prophet is particularly adept at handling missing data and outliers, making it well-suited for this analysis where data irregularities might exist. Additionally, the implementation was carried out in two phases:
- Basic Implementation: The initial model fitting was performed without considering specific factors such as weekends or holidays. This phase provided a baseline forecast that captured the general trends and seasonal patterns in the data.
- Enhanced Implementation with Weekends and Holidays: In the second phase, the model was adjusted to account for weekends and public holidays, which can significantly influence business operations and, consequently, default rates. By incorporating these factors, the model aimed to provide a more accurate reflection of the real-world conditions affecting the default rates in each region.
- Forecasting Analysis and Comparison: The initial forecasts, as depicted in Figure A3 in the Appendix A, were generated using the basic configuration. This approach did not account for weekends or public holidays, offering a straightforward application of the Prophet model. The results effectively captured the general trends and seasonality across most regions. For example, in regions like Gangwon, Gyeonggi, and Gyeongnam, the model successfully identified a clear downward trend in default rates over time. These predictions demonstrated the model’s ability to reflect the overall trajectory of default rates, providing an initial understanding of how these rates may evolve in the absence of external temporal factors. However, in regions with more irregular patterns, such as Sejong and Jeju, the basic forecasts displayed greater variability and less alignment with historical data. This discrepancy indicates that the default rates in these regions may be influenced by factors beyond those captured by the basic model, suggesting the need for a more refined forecasting approach.To address these limitations, the second set of forecasts incorporated weekends and public holidays, as shown in Figure A4 in the Appendix A. This enhanced configuration allowed the model to account for variations in economic activities that typically occur during these periods, thereby providing a more nuanced prediction. In regions such as Seoul and Sejong, where default rates are significantly affected by non-working days, the inclusion of these factors led to forecasts that were more closely aligned with the observed data. By capturing the fluctuations associated with weekends and holidays, the enhanced model configuration reduced forecast errors and provided narrower uncertainty intervals. This improvement is particularly evident in regions with distinct economic patterns tied to temporal factors, where the adjustments lead to more accurate forecasts that better reflect real-world conditions.By visually comparing the two sets of forecasts, it is clear that the enhanced model configuration, which includes weekends and holidays, generally offers a more accurate representation of the default rates. The enhanced forecasts demonstrate superior alignment with the actual default rates, especially in regions characterized by high variability or pronounced seasonal patterns. For instance, in Seoul, the enhanced model captures the periodic spikes and dips more accurately than the basic model, indicating a better understanding of the underlying factors affecting default rates. In contrast, the basic configuration tends to underperform in these regions due to its inability to account for the impact of non-working days on economic activities. To gain deeper insights into the model’s performance and the factors influencing the forecasted default rates, we conducted a detailed analysis using both the forecasted default rates and the component analysis for three representative regions: Seoul, Sejong, and Gwangju. This approach allows for a comprehensive understanding of the temporal patterns and external factors that influence default rates in each region.Figure 9, Figure 10 and Figure 11 show the forecasted default rates with uncertainty intervals for Seoul, Sejong, and Gwangju, respectively. In Seoul the forecasted trend shows a general decline in default rates over time, suggesting improvements in economic conditions and credit management. The inclusion of weekends and holidays in the model offers a more accurate reflection of real-world conditions, as evidenced by the narrow uncertainty intervals and the alignment of the forecasted values with observed data.
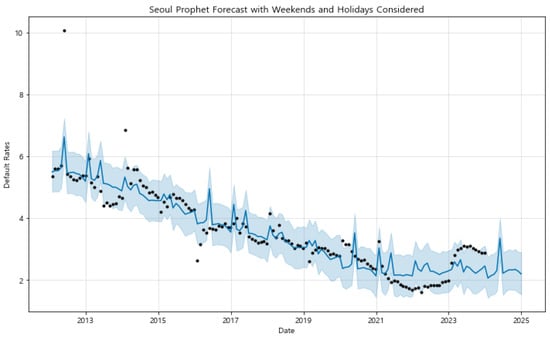 Figure 9. Prophet component analysis for Seoul with weekends and holidays considered. The model effectively captures seasonal patterns and trends, providing insights into the impact of these factors on default rates. (Black dot: actual observed data, blue line: predicted trend, blue shaded area: 95% uncertainty interval).
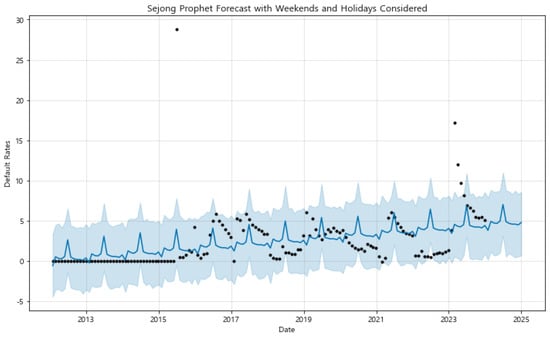 Figure 10. Prophet component analysis for Sejong with weekends and holidays considered. The model captures unique regional patterns, reflecting local economic and administrative cycles that influence default rates. (Black dot: actual observed data, blue line: predicted trend, blue shaded area: 95% uncertainty interval).
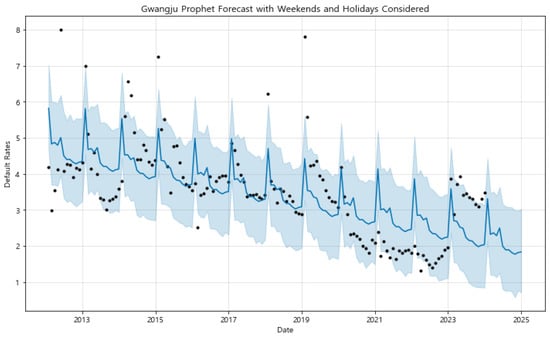 Figure 11. Prophet component analysis for Gwangju with weekends and holidays considered. The model highlights strong seasonal patterns, showcasing its effectiveness in capturing region-specific trends. (Black dot: actual observed data, blue line: predicted trend, blue shaded area: 95% uncertainty interval).Similarly, in Sejong, the forecast captures an upward trend in default rates, which aligns with the region’s dynamic economic environment. The uncertainty intervals are wider in Sejong compared to Seoul, indicating greater uncertainty in the forecasts, which could be due to the region’s unique administrative and economic conditions. The model effectively captures the volatility in Sejong’s default rates, emphasizing the importance of considering region-specific factors in financial forecasting.In Gwangju, the forecasted trend shows a gradual decline with clear seasonal patterns, suggesting a stable economic environment with moderate changes over time. The model’s ability to capture these seasonal variations highlights the significance of incorporating local economic cycles into the forecasts. The forecast closely follows the observed data, demonstrating the model’s effectiveness in regions with strong seasonal influences.To further understand the factors driving these forecasts, we performed a component analysis using the Prophet model, decomposing the time series data into its trend, holiday effects, and yearly seasonal components (Figure 12, Figure 13 and Figure 14). For Seoul, the trend component shows a steady decline in default rates, indicating long-term economic improvement. The holiday effects are minimal, suggesting that holidays do not significantly impact financial behaviors in this region. The yearly seasonality component displays distinct patterns with fluctuations around fiscal year-end periods, likely due to financial settlements and account closures.
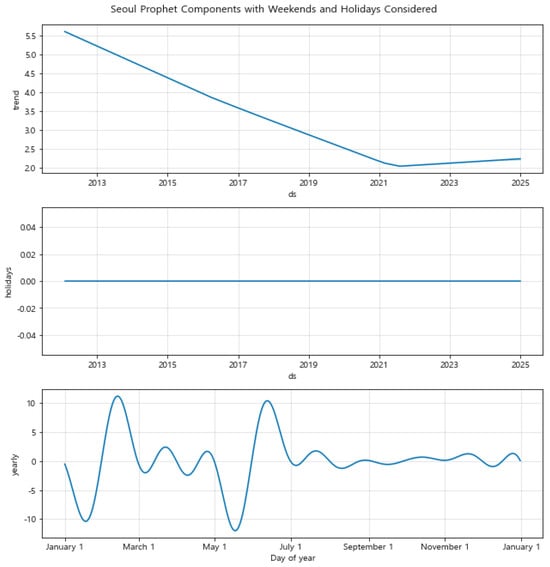 Figure 12. Component Analysis of Prophet Model for Seoul: Trend, Holiday Effects, and Yearly Seasonality.
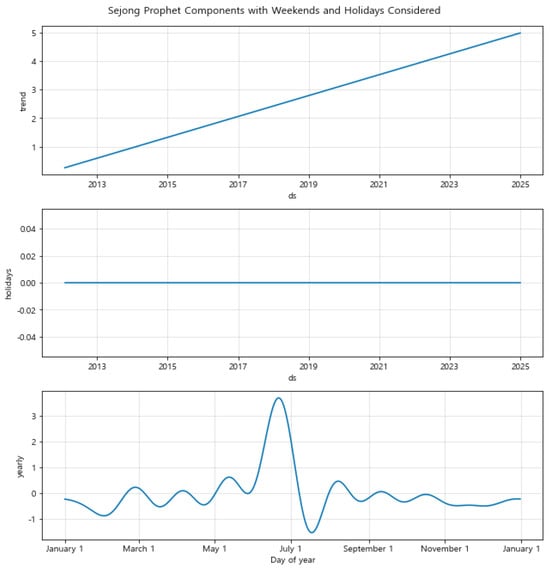 Figure 13. Component Analysis of Prophet Model for Sejong: Trend, Holiday Effects, and Yearly Seasonality.
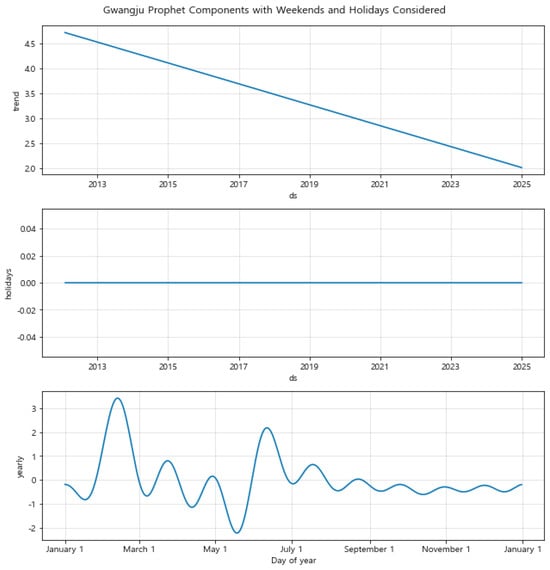 Figure 14. Component Analysis of Prophet Model for Gwangju: Trend, Holiday Effects, and Yearly Seasonality.In Sejong, the trend component reveals a more volatile pattern, reflecting sensitivity to local economic and administrative changes. The minimal impact of holiday effects is consistent with the patterns observed in Seoul. However, the yearly seasonal component in Sejong is characterized by pronounced peaks and troughs, indicating significant fluctuations aligned with local economic or administrative cycles, such as budget cycles or policy changes.Gwangju’s component analysis presents a stable trend with a slight decline, similar to Seoul, and negligible holiday effects. The yearly seasonal component, however, shows strong seasonal variations with peaks around January and July, possibly due to local economic activities or events impacting financial stability. This component analysis underscores the importance of accounting for local economic calendars in financial forecasting.Overall, by combining the forecasted default rates with the component analysis, the Prophet model provides a comprehensive view of how different temporal dynamics and local conditions influence default rates. This combined analysis allows for more accurate predictions and supports better financial planning and policy-making by capturing the underlying patterns and potential risks associated with default rates in each region.
3.3.4. Comparison of SARIMA and Prophet Models
The SARIMA and Prophet models were both utilized to forecast default rates across 17 regions in Republic of Korea, with each model demonstrating unique strengths and limitations. The SARIMA model, known for its reliance on autoregressive integrated moving average processes, generally performed well in capturing historical patterns where default rates followed strong seasonal trends. However, SARIMA forecasts tended to produce smoother predictions with less variability, which can lead to underperformance in regions where sharp or unexpected changes occur. This is because the SARIMA model depends heavily on past patterns, making it less adaptable to sudden shifts in default rates that do not align with historical trends.
In contrast, the Prophet model, especially in its basic configuration without considering holidays or weekends, offered more flexibility due to its additive regression model structure. This flexibility allowed it to capture irregular patterns and adapt to various seasonal and trend components more effectively than SARIMA. The basic Prophet forecasts closely aligned with observed data in many regions, effectively capturing long-term trends and annual seasonal patterns. However, similar to SARIMA, the basic configuration of the Prophet model sometimes missed finer, event-driven fluctuations in default rates that could be crucial for accurate predictions. When the Prophet model was enhanced to account for holidays and weekends, it demonstrated a significant improvement in forecasting accuracy, particularly in regions where default rates are influenced by such events. By incorporating these external factors, the enhanced Prophet model was able to capture spikes or drops in default rates that align with known holidays or non-working days, providing a more accurate reflection of real-world conditions. This enhanced configuration was particularly effective in regions like Seoul, Gyeonggi, and Busan, where the model more accurately predicted periodic increases in default rates around year-end and mid-year holidays.
The performance of the models also varied significantly depending on the region. In regions with regular seasonal patterns, such as Seoul, Gyeonggi, and Busan, the SARIMA and basic Prophet models provided comparable forecasts. However, the enhanced Prophet model outperformed both by more closely aligning with observed data during significant local events or holidays. In regions with irregular patterns or high variability, such as Sejong, Ulsan, and Jeju, the SARIMA model tended to over-smooth forecasts, missing short-term fluctuations. Here, the basic Prophet model offered some improvement by capturing broader trends and seasonality, but the enhanced Prophet model was most effective, incorporating local holidays and weekends to produce forecasts that responded more accurately to sudden changes in default rates.
The error intervals and forecast confidence also differed between the models. The SARIMA model often produced wider error intervals, particularly in regions with high volatility, suggesting lower confidence in its precise forecasts. This model performed better in regions with stable, long-term patterns but struggled in more volatile environments. The basic Prophet model had narrower uncertainty intervals compared to SARIMA, indicating higher confidence in its predictions for more stable regions. The enhanced Prophet model dynamically adjusted these intervals, widening them during periods known for significant economic disruptions due to holidays or non-working days, thus reflecting increased uncertainty during these times and enhancing the reliability of the forecasts.
Overall, while the SARIMA model remains valuable for regions with stable patterns, it may require adjustments or enhancements to match the versatility of the Prophet model in more dynamic settings. The enhanced Prophet model, with its ability to incorporate holidays, weekends, and other potential regressors, provides a more accurate and flexible tool for forecasting default rates across diverse regions. It effectively combines long-term trend analysis with the adaptability needed to account for local events and external factors, making it a superior choice in environments characterized by high variability and complex seasonal patterns. This adaptability, along with its robust performance across various regions, makes the Prophet model, particularly in its enhanced form, a more reliable and practical choice for financial modeling and forecasting in dynamic environments.
3.3.5. Evaluation of the Forecasting Performance
In this analysis, we compare the performance of ARIMA, SARIMA, and Prophet models in forecasting default rates across 17 regions in Republic of Korea. Each model has distinct strengths and weaknesses, which are particularly evident when applied to regions with varying levels of volatility and seasonality. The models were evaluated using key performance metrics such as RMSE (Root Mean Square Error), MAE (Mean Absolute Error), MAPE (Mean Absolute Percentage Error), and sMAPE (Symmetric Mean Absolute Percentage Error). A detailed summary of the evaluation metrics for ARIMA, SARIMA, and Prophet models across the 17 regions is provided in Table A3 in the Appendix A.
The results from comparing ARIMA, SARIMA, and the enhanced Prophet model, which accounts for holidays and weekends, reveal distinct performance characteristics across various regions. In Seoul and Gyeonggi, ARIMA and SARIMA models performed relatively well due to the stable seasonal trends in default rates. However, the enhanced Prophet model outperformed both by capturing periodic fluctuations more effectively, particularly around key events like holidays. Prophet’s ability to adapt to external factors made it the most reliable model for these metropolitan areas.
In Busan, where default rates follow a predictable seasonal pattern, SARIMA and Prophet performed comparably. Prophet, however, had a slight advantage in incorporating sudden shifts and holidays, making it better suited for capturing mid-year and year-end variations. Similarly, in Daejeon, SARIMA was effective due to the region’s strong seasonal trends, but the flexibility of the Prophet model, especially in accounting for holiday effects, made it a more robust model overall. Sejong posed unique challenges due to its data starting only from June 2015, with zeros recorded before that date. ARIMA and SARIMA models accounted for this limitation, while Prophet initially struggled, leading to higher error metrics and overestimated default rates. After adjusting Prophet for Sejong’s data constraints, its performance improved, though it still lagged behind ARIMA and SARIMA, as seen in the elevated RMSE and MAE values.
In regions like Jeju and Ulsan, which exhibited highly volatile and irregular default rate patterns, ARIMA and SARIMA models tended to oversmooth the data, missing critical fluctuations. The enhanced Prophet model, due to its ability to account for holidays and weekends, performed better by capturing irregularities more effectively. However, even Prophet struggled with the extreme variability in these regions, resulting in larger error metrics. Jeonnam and Chungnam presented erratic default rate patterns, and both SARIMA and Prophet performed reasonably well. However, Prophet’s inclusion of external factors such as holidays allowed it to capture unexpected shifts more effectively than ARIMA, which struggled with the irregularity in these regions. Similarly, in Incheon and Dagu, the enhanced Prophet model had a slight advantage over SARIMA, largely due to its better handling of holiday effects. These regions showed moderate seasonal trends, and Prophet’s ability to incorporate external regressors made it more flexible and adaptive compared to ARIMA and SARIMA.
Overall, ARIMA is best suited for regions with stable and predictable default rate trends, as seen in Seoul and Gyeonggi. It is efficient in these contexts but less effective in handling complex seasonal or irregular patterns, which became evident in regions like Sejong and Jeju. SARIMA improves upon ARIMA by modeling seasonality, making it more effective in regions with strong seasonal patterns, such as Busan. However, SARIMA tends to oversmooth short-term fluctuations, limiting its accuracy in dynamic regions like Jeju and Ulsan, where sudden changes outside of seasonal cycles occur.
The Prophet model, enhanced with holiday and weekend effects, emerged as the most versatile and adaptive model. It performed particularly well in regions like Seoul, Gyeonggi, and Busan, where external factors such as holidays have a significant impact on default rates. Prophet consistently outperformed both ARIMA and SARIMA by adapting to sudden disruptions and external influences, making it the most accurate forecasting tool for diverse and dynamic environments.
4. Discussion
This study has explored the seasonal and regional variations in credit default rates across 17 major regions of Republic of Korea, using data provided by the Korea Credit Guarantee Fund (KODIT). The analysis employed three time-series forecasting models: ARIMA, SARIMA, and Prophet. Each model was evaluated based on its ability to capture regional characteristics, seasonal fluctuations, and external factors like holidays and weekends.
The primary motivation for this study arises from the critical role that KODIT plays in maintaining the financial stability of small and medium-sized enterprises (SMEs) in Republic of Korea. By providing credit guarantees, KODIT mitigates the financial constraints faced by SMEs, which constitute a significant portion of the country’s economic framework. However, the systemic risk posed by SME defaults necessitates a deeper understanding of the temporal and regional dynamics that influence default rates. The case background highlights the increasing importance of tailored risk management approaches as economic activities and regional structures evolve.
Our findings demonstrate that all three models have unique strengths depending on the nature of the data they are applied to. ARIMA, known for its ability to model linear trends and non-seasonal data, performed well in regions with relatively stable economic conditions, such as Seoul and Gyeonggi. However, its limitations became apparent in regions like Jeju and Sejong, where more irregular patterns in default rates were present. SARIMA, by incorporating seasonal components, showed improved performance in regions with strong and predictable seasonal trends, such as Busan and Gwangju, but tended to oversmooth short-term fluctuations, making it less effective in highly volatile regions. The Prophet model, particularly when enhanced with external factors like holidays and weekends, emerged as the most flexible and adaptive tool. Prophet was able to capture non-linear trends, missing data points, and irregular spikes in default rates, making it well-suited for regions with complex dynamics like Sejong. The inclusion of holidays and weekends significantly improved the accuracy of Prophet’s predictions, especially in regions where these factors have a marked impact on economic activities. For instance, regions like Seoul, Incheon, and Busan showed better alignment between predicted and observed default rates when these temporal factors were accounted for.
The comparative analysis underscores that while ARIMA and SARIMA are effective in capturing baseline trends and seasonal patterns, Prophet’s flexibility makes it particularly advantageous in regions with irregular or externally driven fluctuations. For instance, in regions like Sejong and Jeju, where policy shifts and administrative changes have influenced economic activity, Prophet demonstrated a significant edge in adaptability. This finding suggests that integrating external information, such as regional fiscal policies or macroeconomic indicators, can further enhance the reliability of forecasts.
The insights drawn from this study provide practical contributions to KODIT’s risk management strategies. By systematically analyzing regional and seasonal variations, we have identified specific periods and regions where default risk is heightened. This enables KODIT to tailor its risk management approaches, allocating resources more effectively during high-risk periods and regions with higher volatility. The results also suggest that forecasting models like Prophet, which can adapt to local economic and temporal factors, should be prioritized for regions experiencing irregular patterns or administrative shifts, such as Sejong and Jeju. Moreover, the study underscores the importance of integrating external regressors, such as holidays and fiscal cycles, into the forecasting models. These factors have a direct influence on default rates, and accounting for them allows for more precise predictions. This is particularly important for credit guarantee funds, as accurate default rate forecasts enable more proactive risk management measures, ensuring the financial stability of SMEs.
One limitation of this study is the absence of a formal training and testing split to evaluate in-sample versus out-of-sample prediction accuracy. While this study emphasizes comparative analysis of model interpretability and applicability, future research will include such evaluations to ensure robustness in predictive reliability. Additionally, the scope of external regressors was limited to holidays and weekends. Expanding this scope to include macroeconomic factors, such as interest rates or unemployment levels, may yield even more accurate forecasts.
As part of our future work, we plan to evaluate the accuracy of the 2024 predictions by comparing the forecasted values with the actual default rates once they are released. The performance of ARIMA, SARIMA, and Prophet models will be reassessed based on the actual data for 2024, which will allow for a more robust evaluation of their forecasting capabilities. Key performance metrics, such as Root Mean Square Error (RMSE), Mean Absolute Error (MAE), Mean Absolute Percentage Error (MAPE), and Symmetric Mean Absolute Percentage Error (sMAPE), will be used to quantitatively assess how well each model predicted the trends, seasonal patterns, and unexpected fluctuations.
This evaluation will help refine the models further, ensuring that KODIT adopts the most accurate and reliable forecasting approach moving forward. Specifically, we aim to determine whether Prophet’s flexibility in handling external factors consistently outperforms traditional models like ARIMA and SARIMA, especially in regions with irregular patterns. Additionally, any discrepancies between the forecasted and actual default rates will be analyzed to identify areas for improvement, such as incorporating additional external regressors like macroeconomic indicators or policy changes that may have influenced default rates in 2024.
5. Conclusions
This research contributes significantly to the field of credit risk management by demonstrating how advanced time-series forecasting models can be applied to public financial institutions like KODIT. Through the integration of regional analysis and seasonality, this study provides a comprehensive understanding of the diverse economic environments and administrative policies that shape SME default rates. By comparing the performance of ARIMA, SARIMA, and Prophet models, the study underscores the importance of adopting flexible and robust forecasting tools. Among the three models, Prophet emerged as the most adaptable, effectively capturing irregular trends, external factors, and seasonality, thus offering enhanced predictive accuracy in regions with complex economic dynamics.
The findings highlight critical implications for KODIT’s risk management strategies. The ability to anticipate periods of heightened default risk based on regional and seasonal characteristics allows for proactive intervention and resource allocation. This approach is particularly valuable in regions like Sejong and Jeju, where irregular patterns are more pronounced. By incorporating external factors such as holidays, fiscal cycles, and broader economic indicators into forecasting models, financial institutions can develop more nuanced strategies that mitigate risks while fostering the financial stability of SMEs.
Looking forward, future research could expand this analysis to include data from other countries’ credit guarantee funds or financial institutions. Such comparative studies would provide insights into the universal and region-specific factors influencing SME default rates. Additionally, exploring the integration of macroeconomic trends, such as inflation, interest rates, and global economic shocks, would add depth to the understanding of default dynamics. Employing machine learning techniques, such as gradient boosting, neural networks, or ensemble models, could further enhance predictive performance, particularly in regions where traditional time-series methods encounter limitations.
Moreover, the study paves the way for developing hybrid forecasting frameworks that combine the strengths of time-series models with advanced machine learning algorithms. These frameworks could adapt to rapidly changing economic conditions and provide actionable insights for financial institutions. The inclusion of real-time data streams, such as economic policy announcements or market sentiment indicators, could also be explored to improve responsiveness and accuracy in default risk forecasting.
In conclusion, this study underscores the critical role of advanced forecasting models in strengthening KODIT’s risk management system. By leveraging these models, KODIT can enhance its ability to anticipate risks, optimize resource allocation, and support the sustainable growth of SMEs across Republic of Korea. As these models are further refined and validated, they have the potential to transform the credit guarantee sector, enabling data-driven decision-making and contributing to broader economic resilience.
Author Contributions
Conceptualization, J.P. and K.K.; methodology, K.K. and J.P.; software, J.P.; validation, K.K.; formal analysis, J.P.; investigation, K.K. and J.P.; resources, J.P.; data curation, J.P.; writing—original draft preparation, J.P.; writing—review and editing, J.P. and K.K.; visualization, J.P.; supervision, J.P.; project administration, J.P. All authors have read and agreed to the published version of the manuscript.
Funding
This research received no external funding.
Institutional Review Board Statement
Not applicable.
Informed Consent Statement
Not applicable.
Data Availability Statement
The original data presented in the study are openly available on the Data.go.kr platform at [https://www.data.go.kr].
Conflicts of Interest
The authors declare no conflict of interest.
Appendix A
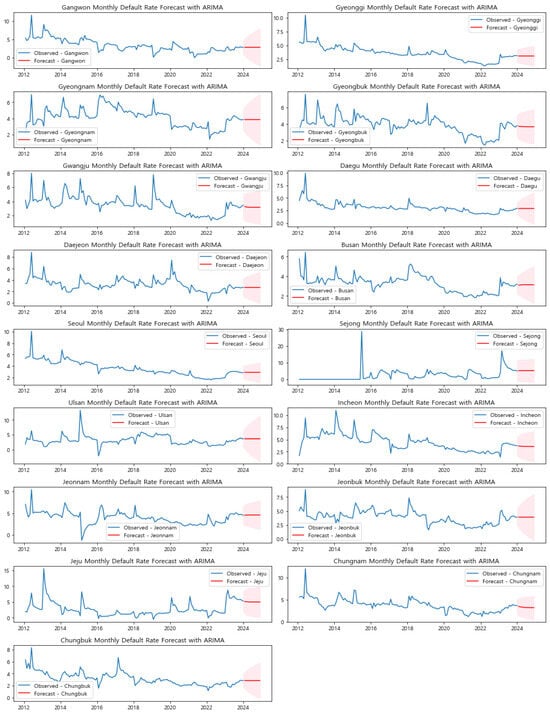
Figure A1.
ARIMA Model Forecasts for Monthly Default Rates in Selected Regions (January 2024–December 2024). The forecasts for most regions show stable, flat predictions with minimal variation, indicating the ARIMA model’s tendency to revert to a mean level in the absence of strong linear trends.
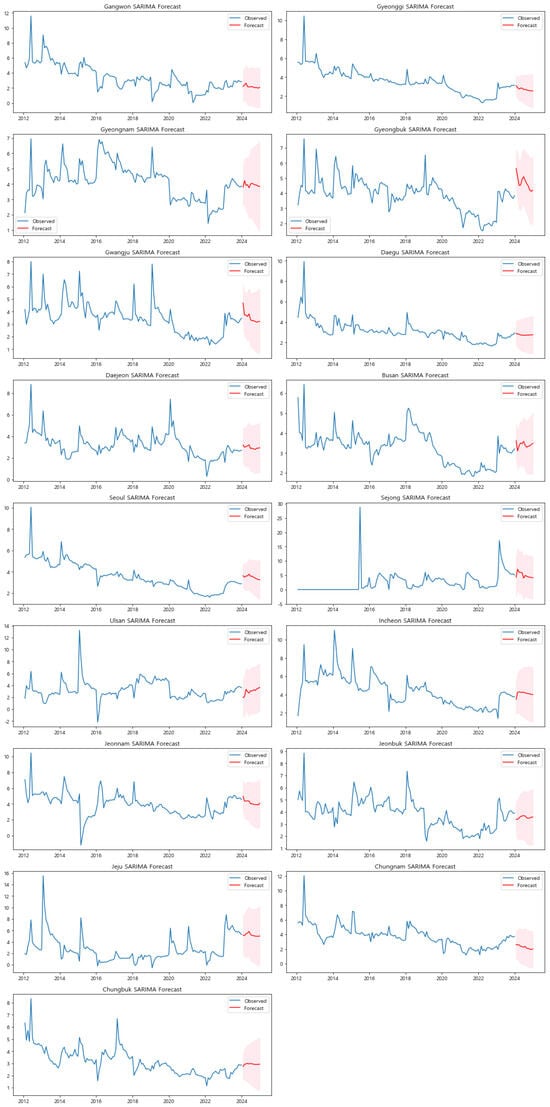
Figure A2.
SARIMA Model Forecasts for Monthly Default Rates in Selected Regions (January 2024–December 2024). The forecasts incorporate seasonal components, providing more dynamic predictions that reflect the periodic patterns observed in the historical data.
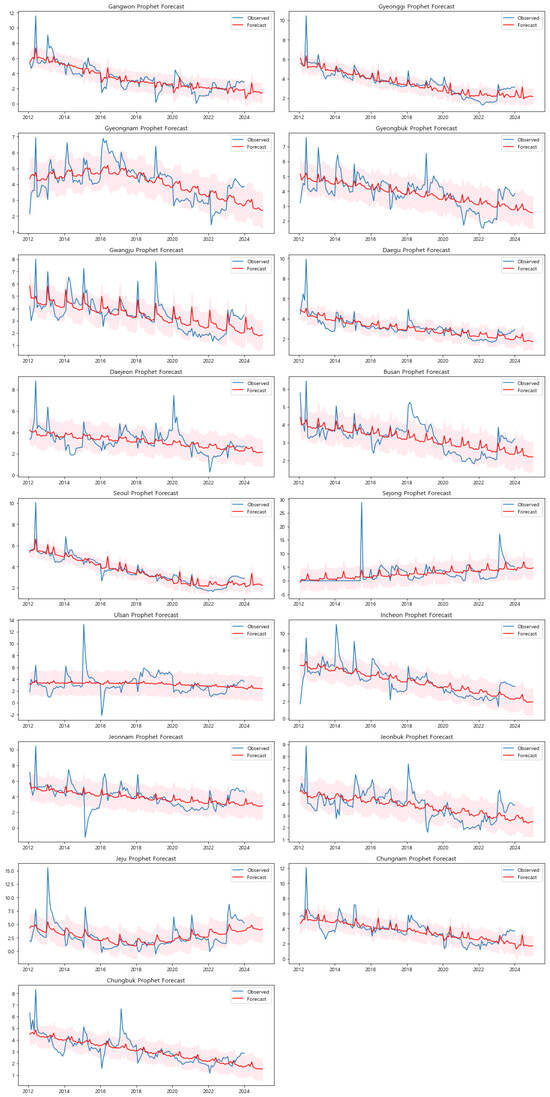
Figure A3.
Prophet model forecasts without considering weekends and holidays for 17 regions in Republic of Korea. The model captures general trends and seasonality but shows limitations in regions with irregular patterns such as Sejong and Jeju.
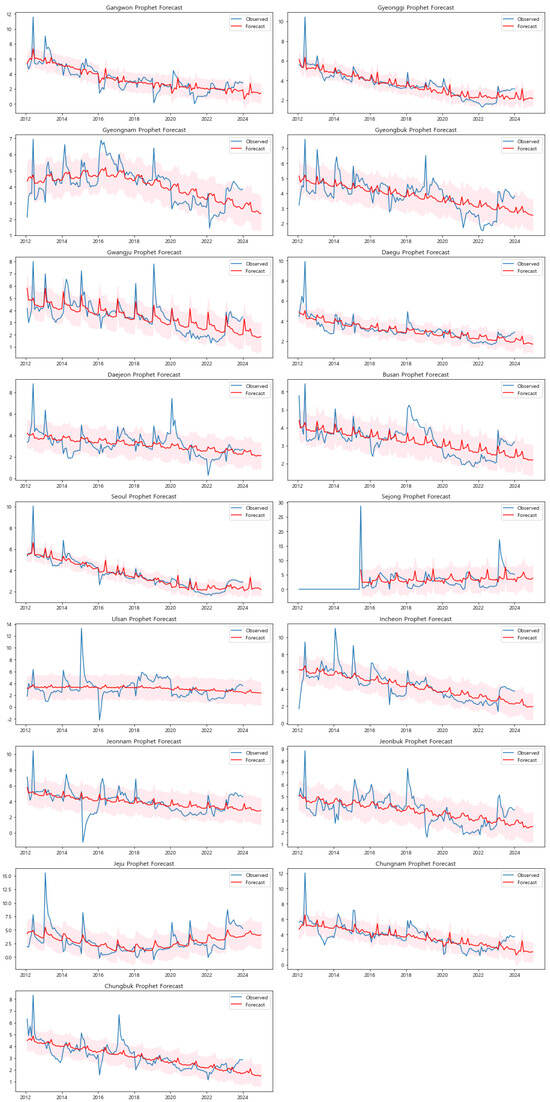
Figure A4.
Prophet model forecasts with weekends and holidays considered for 17 regions in Republic of Korea. The inclusion of weekends and holidays improves forecast accuracy, especially in regions like Seoul and Sejong, where these factors significantly impact default rates.
Table A1.
ADF Test Results for Original Monthly Average Default Rates. A p-value less than 0.05 indicates that the series is stationary.
Table A1.
ADF Test Results for Original Monthly Average Default Rates. A p-value less than 0.05 indicates that the series is stationary.
| City | ADF Statistic | p-Value |
|---|---|---|
| Gangwon | −2.673915 | 0.078662 |
| Gyeonggi | −1.985126 | 0.293133 |
| Gyeongnam | −4.042001 | 0.001206 |
| Gyeongbuk | −2.766383 | 0.063239 |
| Gwangju | −3.599751 | 0.005766 |
| Daegu | −3.267879 | 0.016377 |
| Daejeon | −3.396312 | 0.011085 |
| Busan | −2.402960 | 0.140903 |
| Seoul | −1.869299 | 0.346639 |
| Sejong | −5.340778 | 0.000005 |
| Ulsan | −5.376200 | 0.000004 |
| Incheon | −2.529853 | 0.108379 |
| Jeonnam | −5.163758 | 0.000010 |
| Jeonbuk | −2.817899 | 0.055762 |
| Jeju | −4.859820 | 0.000042 |
| Chungnam | −4.279603 | 0.000482 |
| Chungbuk | −4.306400 | 0.000433 |
ADF Statistic: Augmented Dickey-Fuller test statistic.
Table A2.
ADF Test Results After Differencing. The p-values indicate that the differenced series for these regions are now stationary.
Table A2.
ADF Test Results After Differencing. The p-values indicate that the differenced series for these regions are now stationary.
| City | ADF Statistic | p-Value |
|---|---|---|
| Gangwon | −16.469088 | 2.292074 |
| Gyeonggi | −13.062584 | 2.032944 |
| Gyeongbuk | −11.760801 | 1.149262 |
| Busan | −12.258644 | 9.186350 |
| Seoul | −13.062230 | 2.036199 |
| Incheon | −10.713476 | 3.286378 |
| Jeonbuk | −8.957047 | 8.419058 |
ADF Statistic: Augmented Dickey-Fuller test statistic.
Table A3.
Evaluation Metrics for ARIMA (A), SARIMA (S), and Prophet (P) Models Across Regions.
Table A3.
Evaluation Metrics for ARIMA (A), SARIMA (S), and Prophet (P) Models Across Regions.
| City | RMSE | MAE | MAPE | sMAPE | ||||||||
|---|---|---|---|---|---|---|---|---|---|---|---|---|
| A | S | P | A | S | P | A | S | P | A | S | P | |
| Gangwon | 1.053 | 1.372 | 0.970 | 0.560 | 0.739 | 0.709 | 64.69 | 69.15 | 84.65 | 19.26 | 23.89 | 25.99 |
| Gyeonggi | 0.750 | 0.751 | 0.622 | 0.344 | 0.353 | 0.450 | 8.62 | 9.08 | 15.13 | 9.38 | 9.73 | 14.33 |
| Gyeongnam | 0.681 | 0.674 | 0.850 | 0.389 | 0.390 | 0.692 | 9.91 | 9.90 | 19.12 | 10.37 | 10.36 | 17.78 |
| Gyeongbuk | 0.723 | 0.857 | 0.836 | 0.424 | 0.523 | 0.679 | 10.89 | 13.28 | 20.33 | 11.48 | 13.52 | 18.63 |
| Gwangju | 0.921 | 1.039 | 0.916 | 0.525 | 0.606 | 0.709 | 13.91 | 16.66 | 23.22 | 14.57 | 16.59 | 21.39 |
| Daegu | 0.731 | 0.718 | 0.659 | 0.337 | 0.358 | 0.434 | 9.16 | 10.01 | 14.07 | 9.79 | 10.59 | 13.75 |
| Daejeon | 0.819 | 1.653 | 0.984 | 0.498 | 0.906 | 0.713 | 18.01 | 32.02 | 30.18 | 15.98 | 33.12 | 22.65 |
| Busan | 0.676 | 0.675 | 0.656 | 0.319 | 0.331 | 0.515 | 8.71 | 9.18 | 16.88 | 9.36 | 9.77 | 16.31 |
| Seoul | 0.707 | 0.934 | 0.515 | 0.313 | 0.422 | 0.350 | 7.97 | 10.55 | 11.12 | 8.58 | 10.93 | 10.78 |
| Sejong | 3.648 | 5.047 | 3.422 | 1.626 | 2.593 | 2.202 | NaN | NaN | NaN | 54.06 | 74.27 | 70.38 |
| Ulsan | 1.326 | 2.391 | 1.578 | 0.618 | 1.331 | 1.107 | 20.79 | 54.68 | 45.21 | 20.42 | 50.64 | 35.10 |
| Incheon | 0.933 | 0.921 | 1.173 | 0.516 | 0.517 | 0.866 | 11.99 | 12.36 | 23.00 | 12.65 | 12.84 | 20.83 |
| Jeonnam | 1.165 | 2.039 | 1.269 | 0.573 | 1.113 | 0.873 | 21.48 | 33.29 | 51.22 | 15.05 | 34.64 | 23.68 |
| Jeonbuk | 0.872 | 0.841 | 0.965 | 0.481 | 0.470 | 0.751 | 12.31 | 12.07 | 22.30 | 12.58 | 12.31 | 20.42 |
| Jeju | 1.640 | 2.272 | 1.828 | 0.794 | 1.155 | 1.270 | 70.20 | 98.44 | 133.02 | 33.43 | 46.24 | 47.26 |
| Chungnam | 0.992 | 1.371 | 1.022 | 0.535 | 0.738 | 0.731 | 14.60 | 20.11 | 22.60 | 14.49 | 19.34 | 20.53 |
| Chungbuk | 0.788 | 0.780 | 0.726 | 0.392 | 0.401 | 0.517 | 11.46 | 11.89 | 17.32 | 11.76 | 12.09 | 16.61 |
Note: A = ARIMA, S = SARIMA, P = Prophet.
References
- Status of Korean SMEs. Available online: https://www.mss.go.kr/site/eng/02/20202000000002019110610.jsp (accessed on 12 June 2024).
- Lee, J.H.; Ryu, J.; Tsomocos, D.P. Measures of systemic risk and financial fragility in Korea. Ann. Financ. 2013, 9, 757–786. [Google Scholar] [CrossRef]
- Yun, J.; Moon, H. Measuring systemic risk in the Korean banking sector via dynamic conditional correlation models. Pac.-Basin Financ. J. 2014, 27, 94–114. [Google Scholar] [CrossRef]
- Syrová, L.; Špička, J. Exploring the indirect links between enterprise risk management and the financial performance of SMEs. Risk Manag. 2023, 25, 1. [Google Scholar] [CrossRef]
- Gaudêncio, J.; Mazany, A.; Schwarz, C. The Impact of Lending Standards on Default Rates of Residential Real Estate Loans (19 March 2019). ECB Occasional Paper No. 220 (2019); ISBN 978-92-899-3685-9. Available online: https://ssrn.com/abstract=3356407 (accessed on 18 March 2024).
- Mueller, G.R.; Ziering, B. Real Estate Portfolio Diversification Using Economic Diversification. J. Real Estate Res. 1992, 7, 375–386. [Google Scholar] [CrossRef]
- Clauretie, T. Regional Economic Diversification and Residential Mortgage Default Risk. J. Real Estate Res. 1988, 3, 87–97. [Google Scholar] [CrossRef]
- Kim, D.; Kim, S.; Lee, J.S. The rise and fall of industrial clusters: Experience from the resilient transformation in South Korea. Ann. Reg. Sci. 2023, 71, 391–413. [Google Scholar] [CrossRef] [PubMed]
- Lee, S.; Ishiro, T. Regional economic analysis of major areas in South Korea: Using 2005–2010–2015 multi-regional input–output tables. Econ. Struct. 2023, 12, 12. [Google Scholar] [CrossRef]
- Grant Thornton. How to Tailor Integrated Risk Management Strategies. 2021. Available online: https://www.grantthornton.com (accessed on 9 October 2023).
- Doh, S.; Kim, B. Government support for SME innovations in the regional industries: The case of government financial support program in South Korea. Res. Policy 2014, 43, 1557–1569. [Google Scholar] [CrossRef]
- Park, S.; Jeong, S.; Kim, E. Government Support for Human Resource Development and Internationalization of Small- and Medium-Sized Enterprises (SMEs) in South Korea. In Human Resource Development in South Korea; Lim, D.H., Yoon, S.W., Cho, D., Eds.; Palgrave Macmillan: Cham, Switzerland, 2020. [Google Scholar] [CrossRef]
- Altman, E.I.; Sabato, G. Modelling Credit Risk for SMEs: Evidence from the U.S. Market. Abacus 2007, 43, 332–357. [Google Scholar] [CrossRef]
- Hu, D.; Schwabe, G.; Li, X. Systemic risk management and investment analysis with financial network analytics: Research opportunities and challenges. Financ. Innov. 2015, 1, 2. [Google Scholar] [CrossRef]
- Priscila Ferreira de Araújo, L.; Crema, M.; Verbano, C. Risk management in SMEs: A systematic literature review and future directions. Eur. Manag. J. 2020, 38, 78–94. [Google Scholar] [CrossRef]
- Taylor, S.J. Modelling Financial Time Series, 2nd ed.; World Scienctific: Hackensack, NJ, USA, 2008. [Google Scholar]
- Kim, Y.S.; Rachev, S.T.; Bianchi, M.L.; Mitov, I.; Fabozzi, F.J. Time Series Analysis for Financial Market Meltdowns. J. Bank. Financ. 2011, 35, 1879–1891. [Google Scholar] [CrossRef]
- El-Qadi, A.; Trocan, M.; Frossard, T.; Díaz-Rodríguez, N. Credit Risk Scoring Forecasting Using a Time Series Approach. Phys. Sci. Forum 2022, 5, 16. [Google Scholar] [CrossRef]
- Dar, A.A.; Anuradha, N.; Qadir, S. Estimating Probabilities of Default of Different Firms and the Statistical Tests. J. Glob. Entrepr. Res. 2019, 9, 27. [Google Scholar] [CrossRef]
- Traczynski, J. Firm Default Prediction: A Bayesian Model-Averaging Approach. J. Financ. Quant. Anal. 2017, 52, 1211–1245. [Google Scholar] [CrossRef]
- Kim, H.; Cho, H.; Ryu, D. Corporate Default Predictions Using Machine Learning: Literature Review. Sustainability 2020, 12, 6325. [Google Scholar] [CrossRef]
- Bazzana, F.; Bee, M.; Hussin Adam Khatir, A.A. Machine Learning Techniques for Default Prediction: An Application to Small Italian Companies. Risk Manag. 2024, 26, 1. [Google Scholar] [CrossRef]
- Zheng, C.; Weng, F.; Luo, Y.; Yang, C. Micro and Small Enterprises Default Risk Portrait: Evidence from Explainable Machine Learning Method. J. Ambient Intell. Humaniz. Comput. 2024, 15, 661–671. [Google Scholar] [CrossRef]
Disclaimer/Publisher’s Note: The statements, opinions and data contained in all publications are solely those of the individual author(s) and contributor(s) and not of MDPI and/or the editor(s). MDPI and/or the editor(s) disclaim responsibility for any injury to people or property resulting from any ideas, methods, instructions or products referred to in the content. |
© 2024 by the authors. Licensee MDPI, Basel, Switzerland. This article is an open access article distributed under the terms and conditions of the Creative Commons Attribution (CC BY) license (https://creativecommons.org/licenses/by/4.0/).