Integrating Proteomic Analysis and Machine Learning to Predict Prostate Cancer Aggressiveness
Abstract
1. Introduction
2. Materials and Methods
2.1. Tumor Microarrays (TMAs)
2.2. Immunohistochemistry (IHC)
2.3. Statistical Analysis
2.3.1. Logistic Regression
2.3.2. Classification Tree
2.3.3. Regression Tree
3. Results
3.1. Phospho-Rb S249 as Biomarker for the Identification of Aggressive PCa
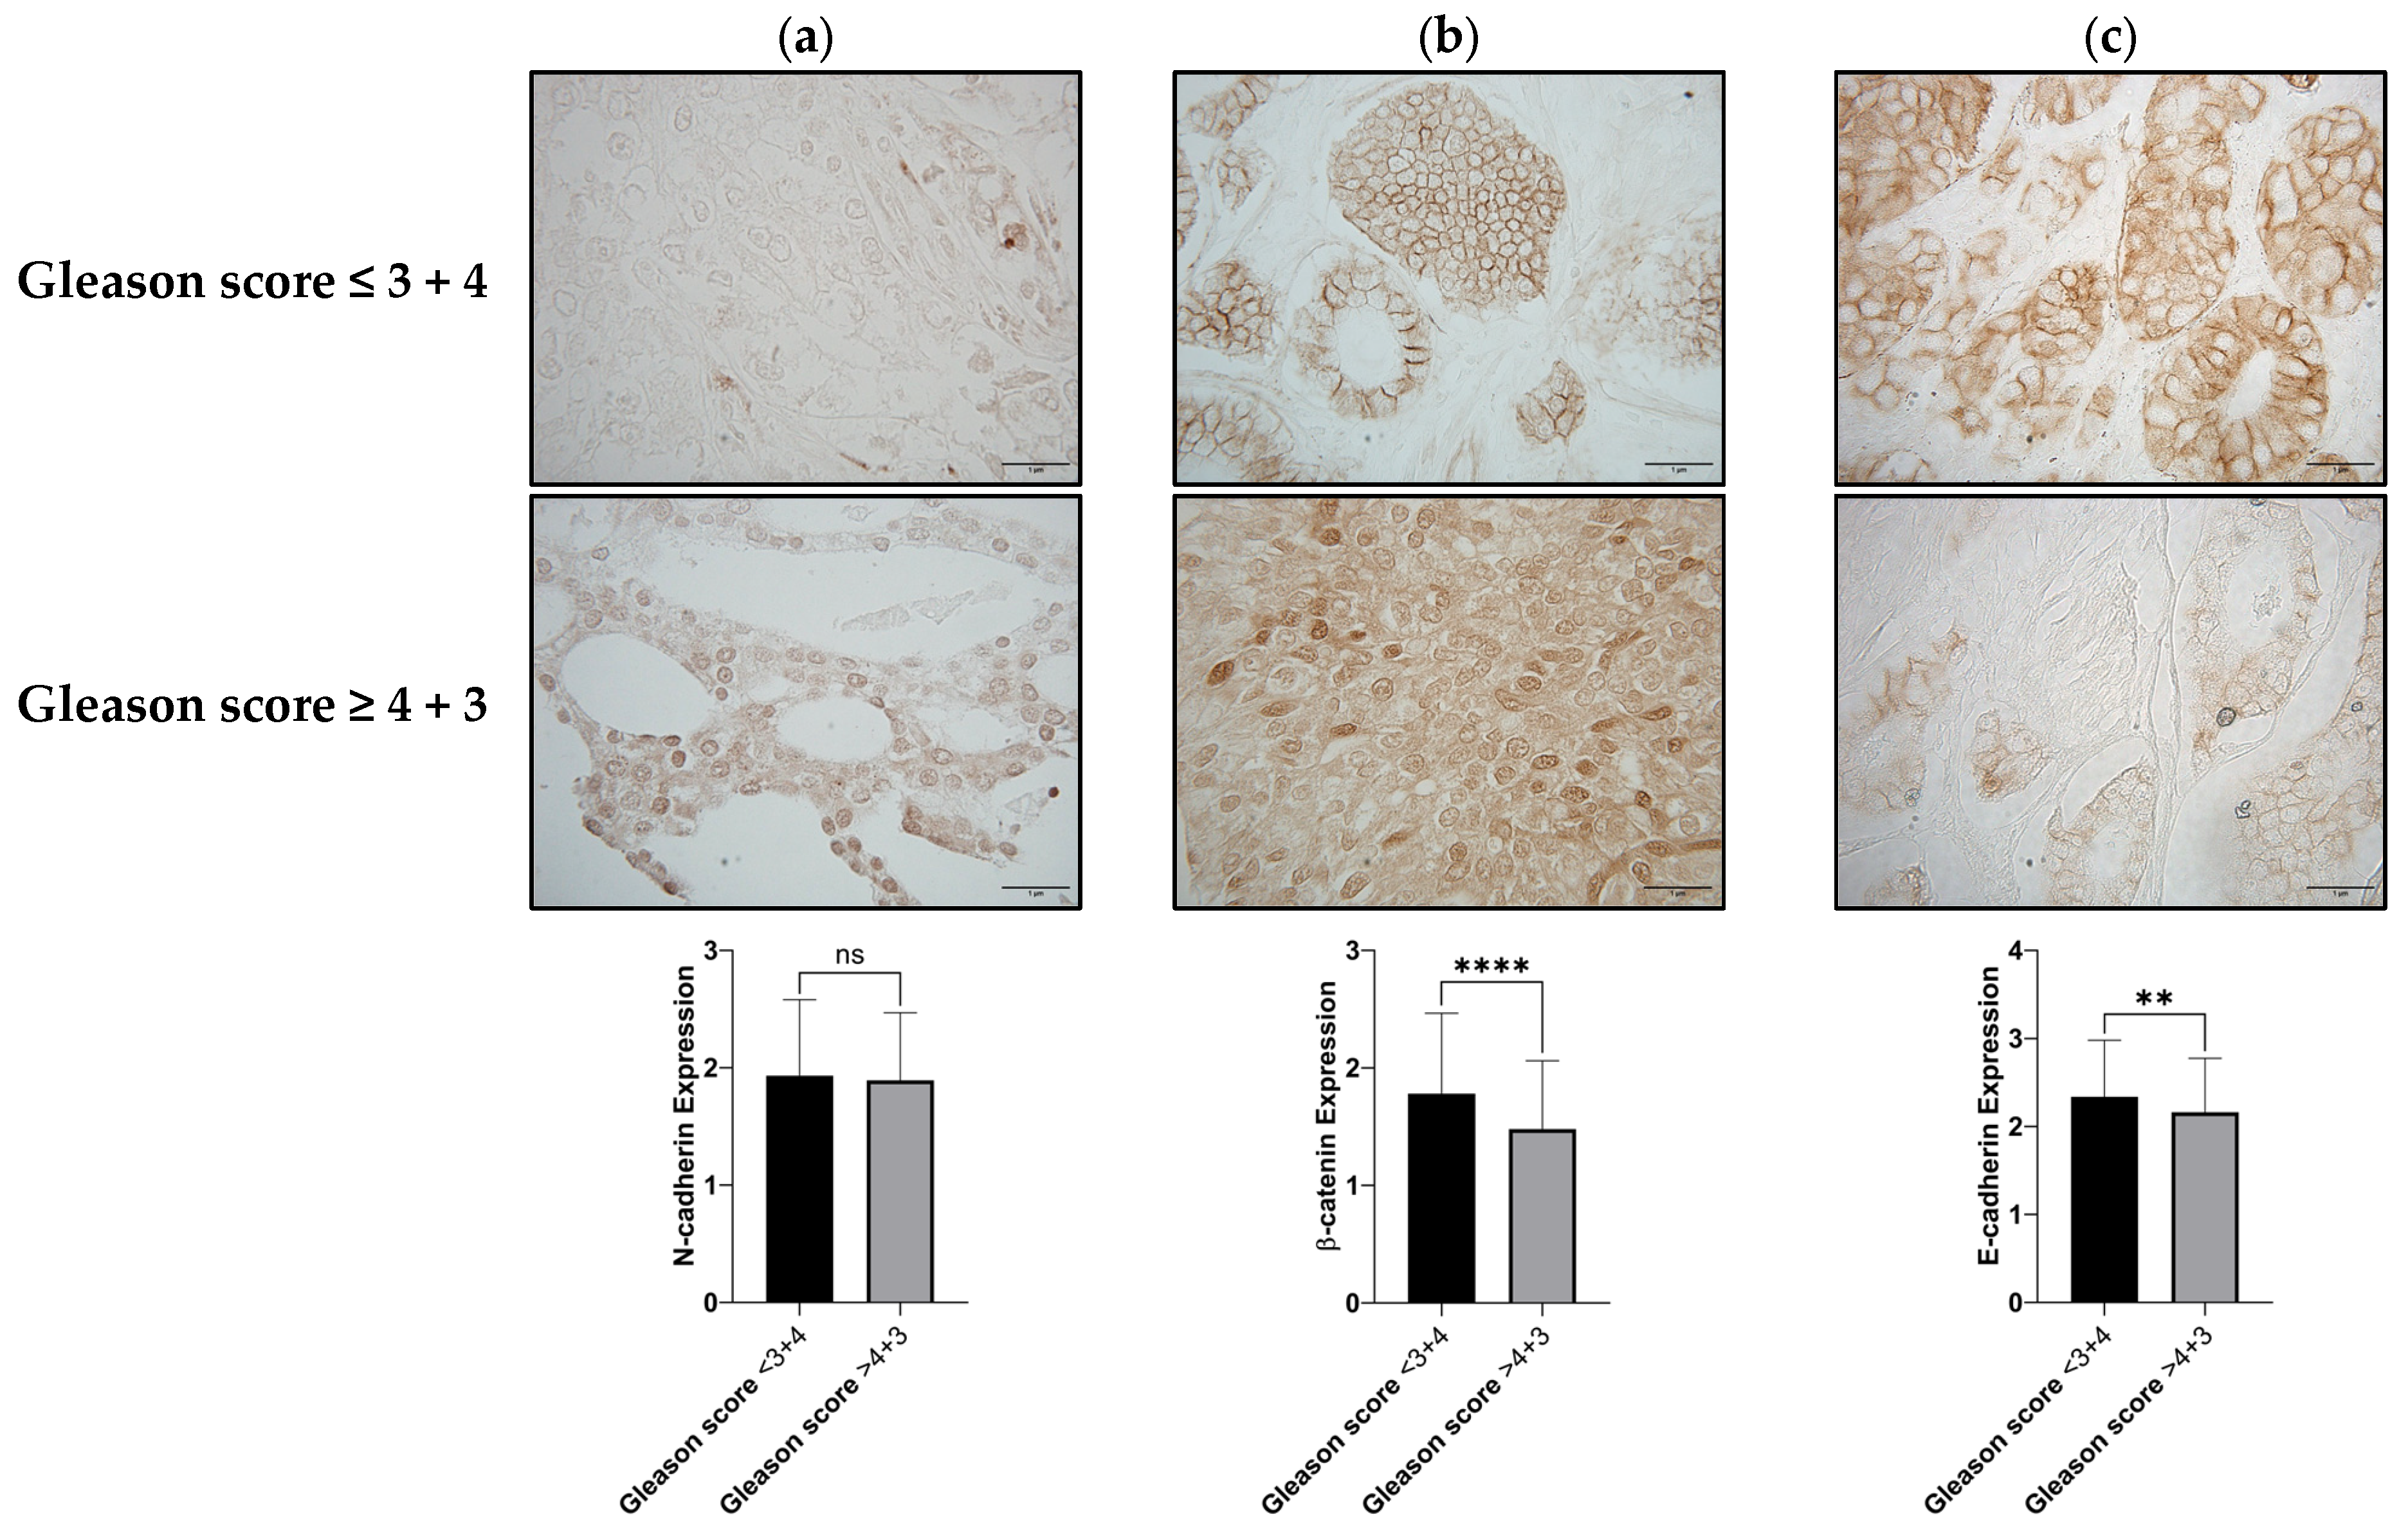
3.2. N-Cadherin, β-Catenin, and E-Cadherin as Biomarkers for the Identification of Aggressive PCa
3.3. Models for the Detection of Patients with Gleason Scores ≥ 4 + 3
3.3.1. Logistic Regression
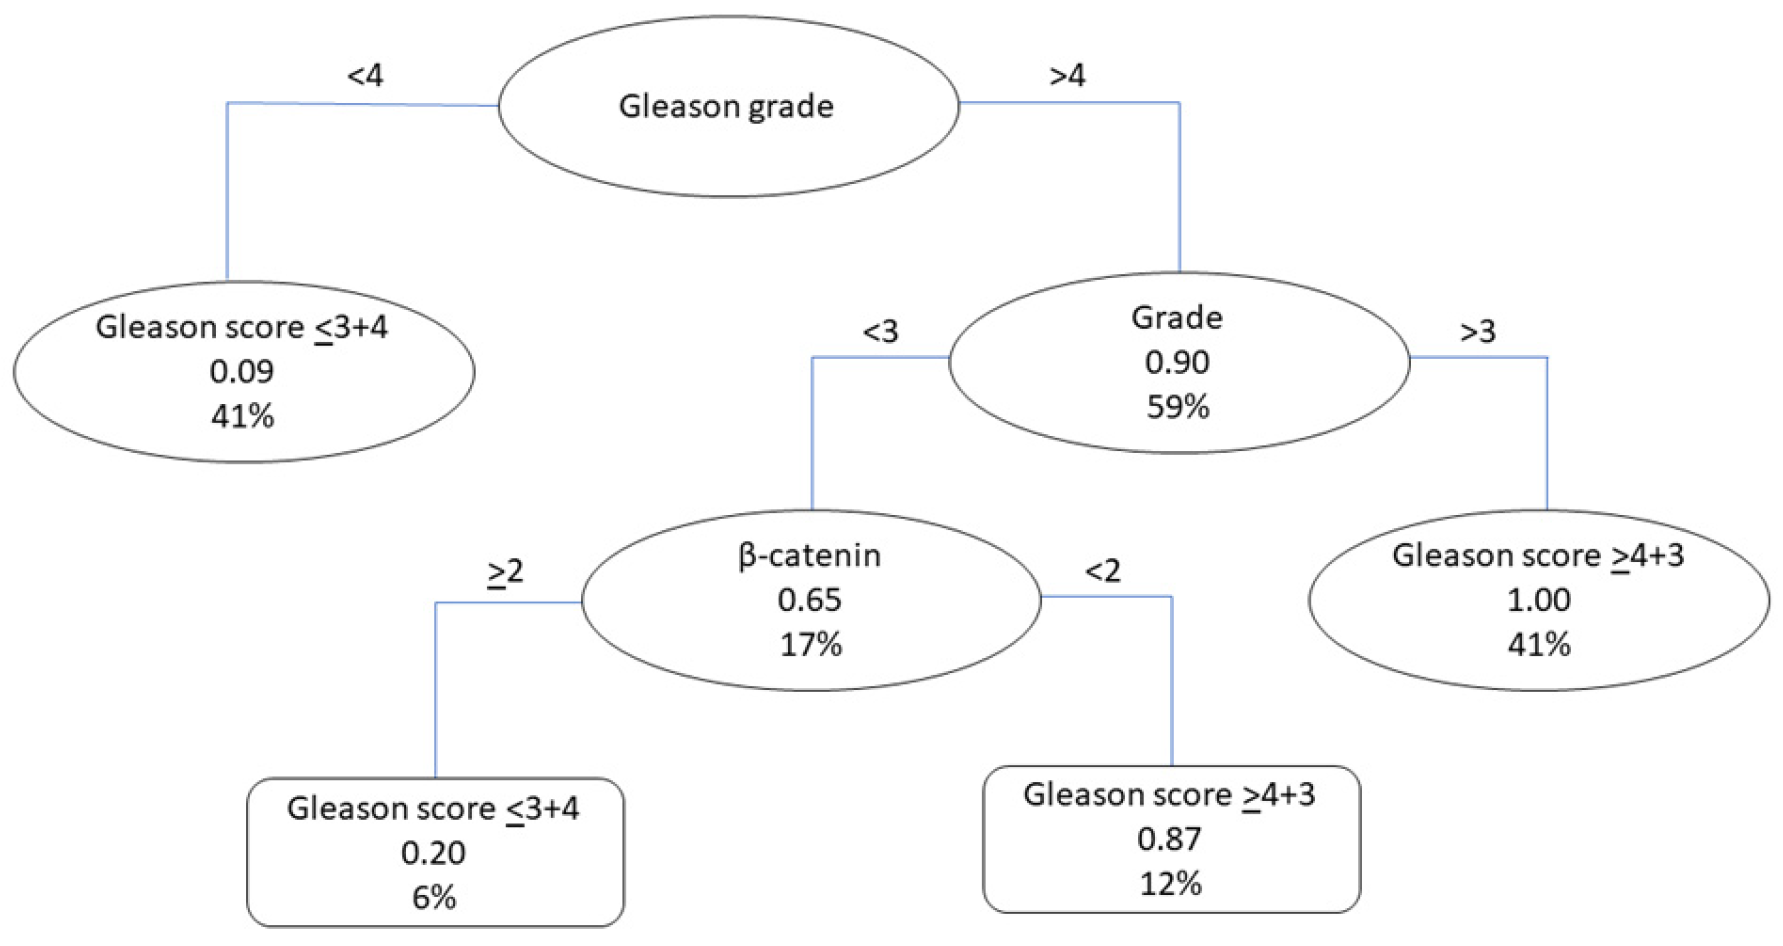
3.3.2. Classification Tree
3.3.3. Regression Tree
3.4. Models for the Detection of Patients with Aberrant E-Cadherin Staining Patterns
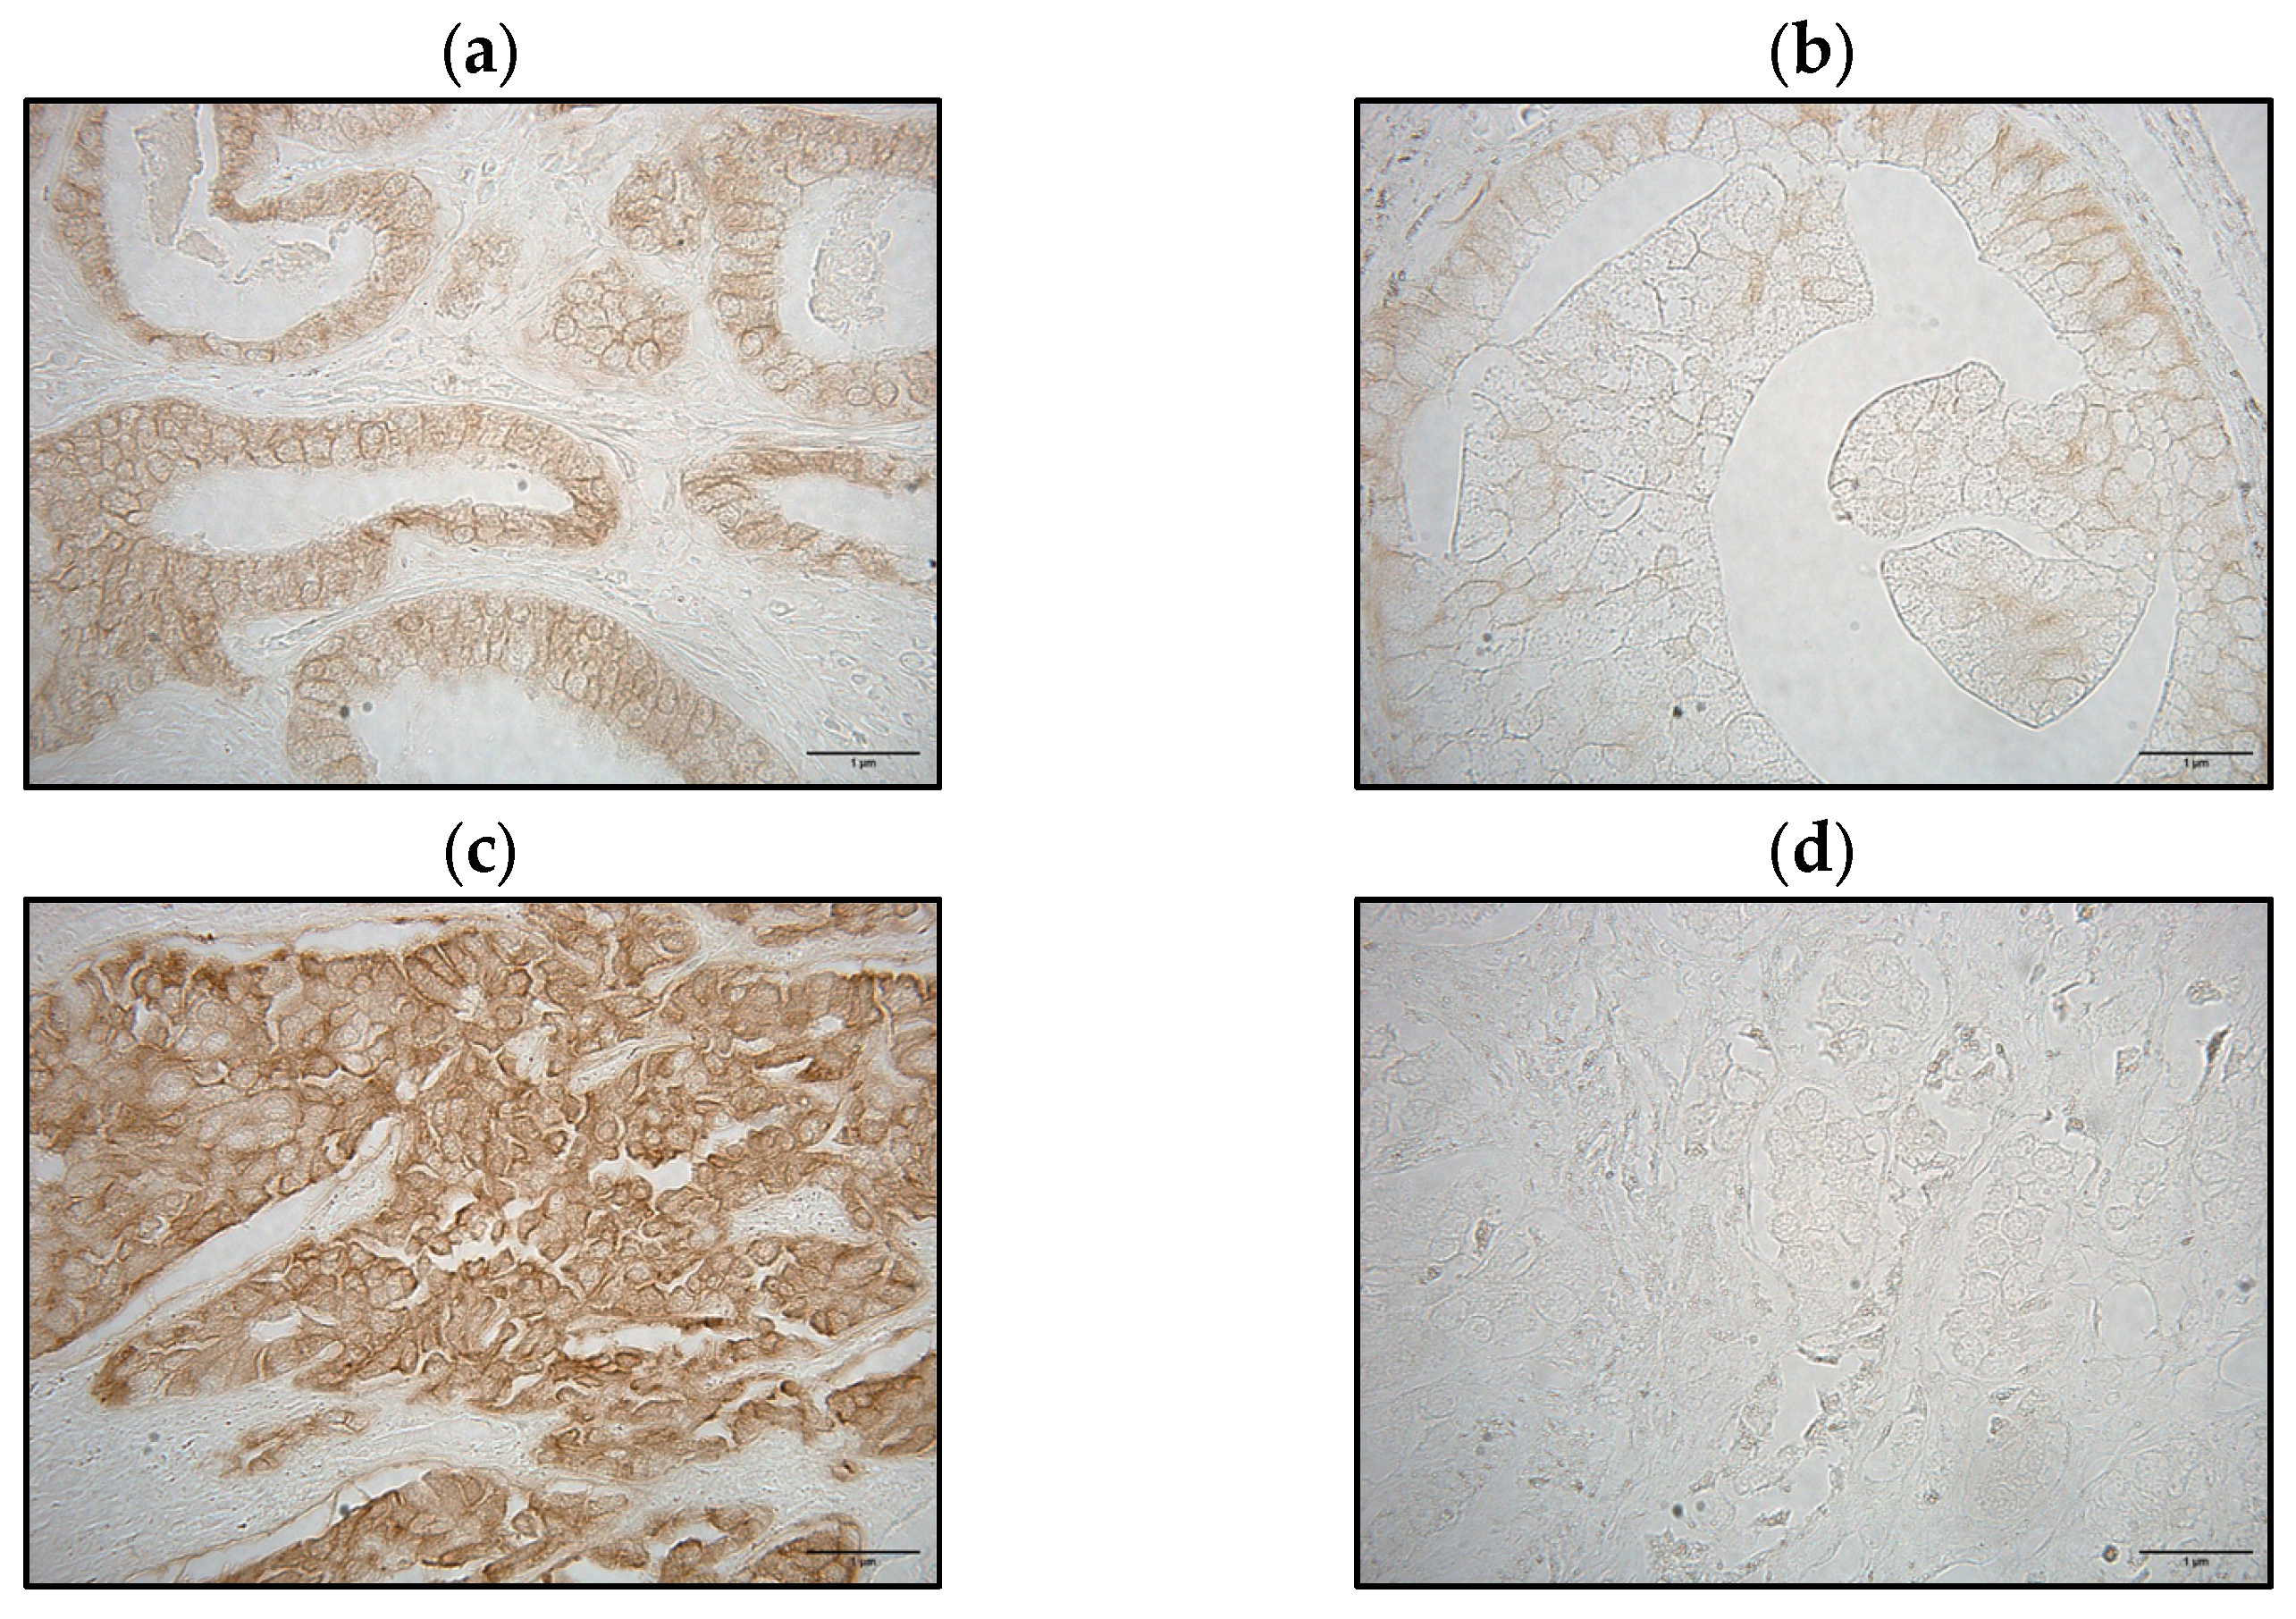
3.4.1. E-Cadherin Staining Patterns
3.4.2. Logistic Regression
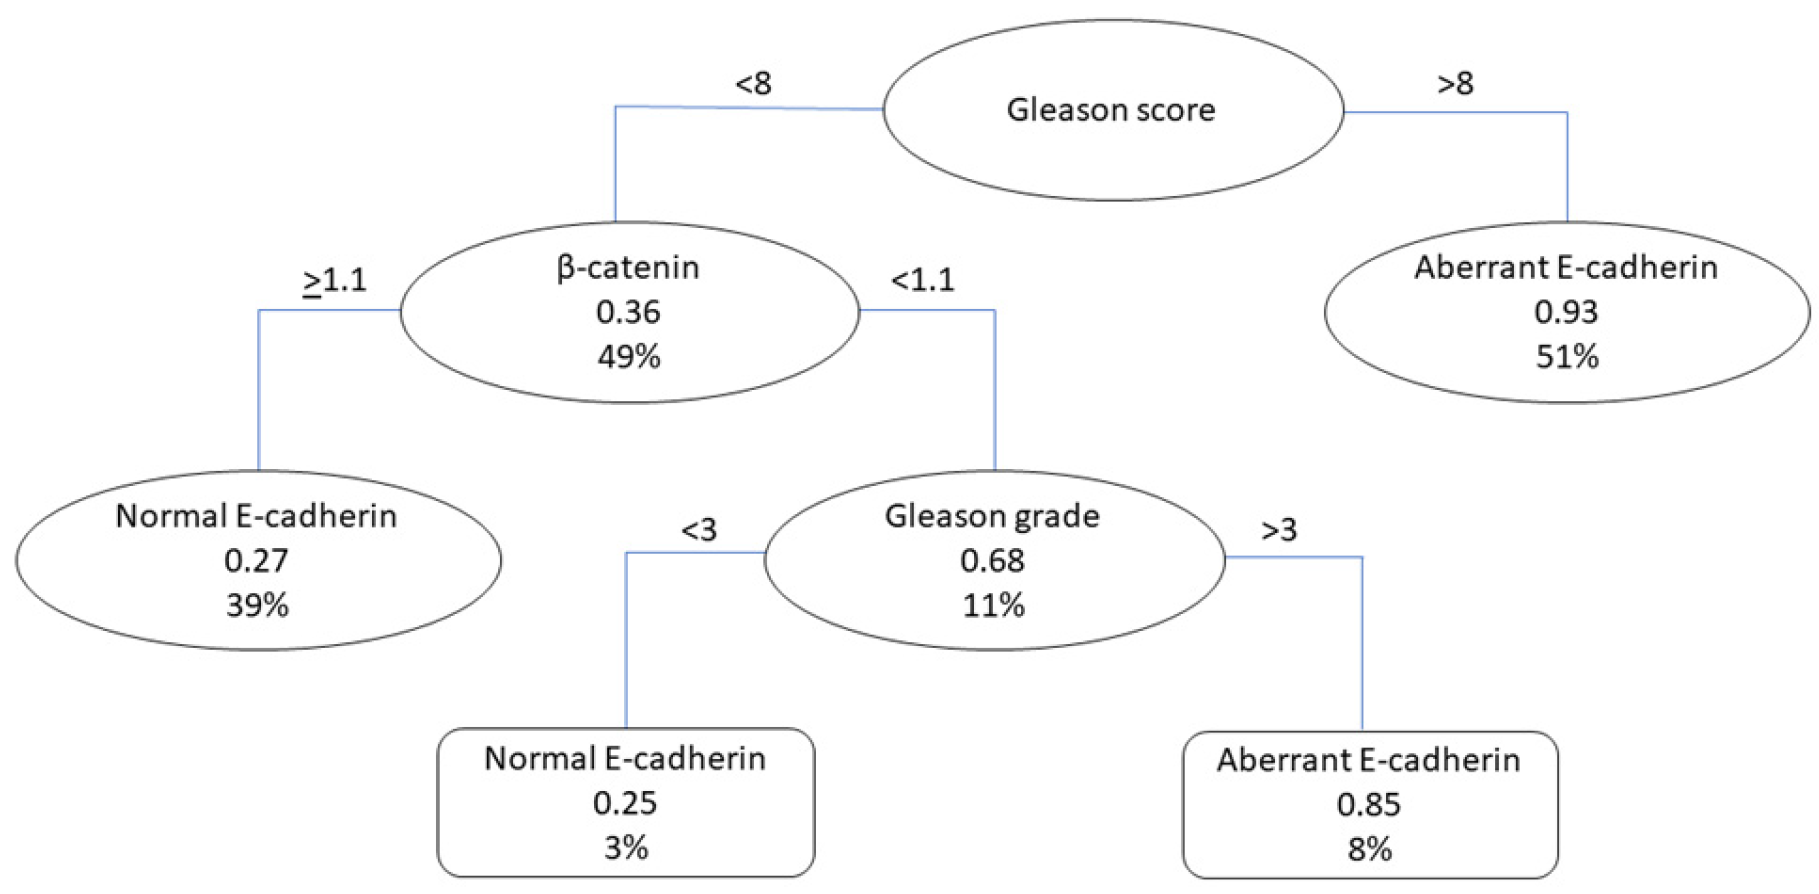
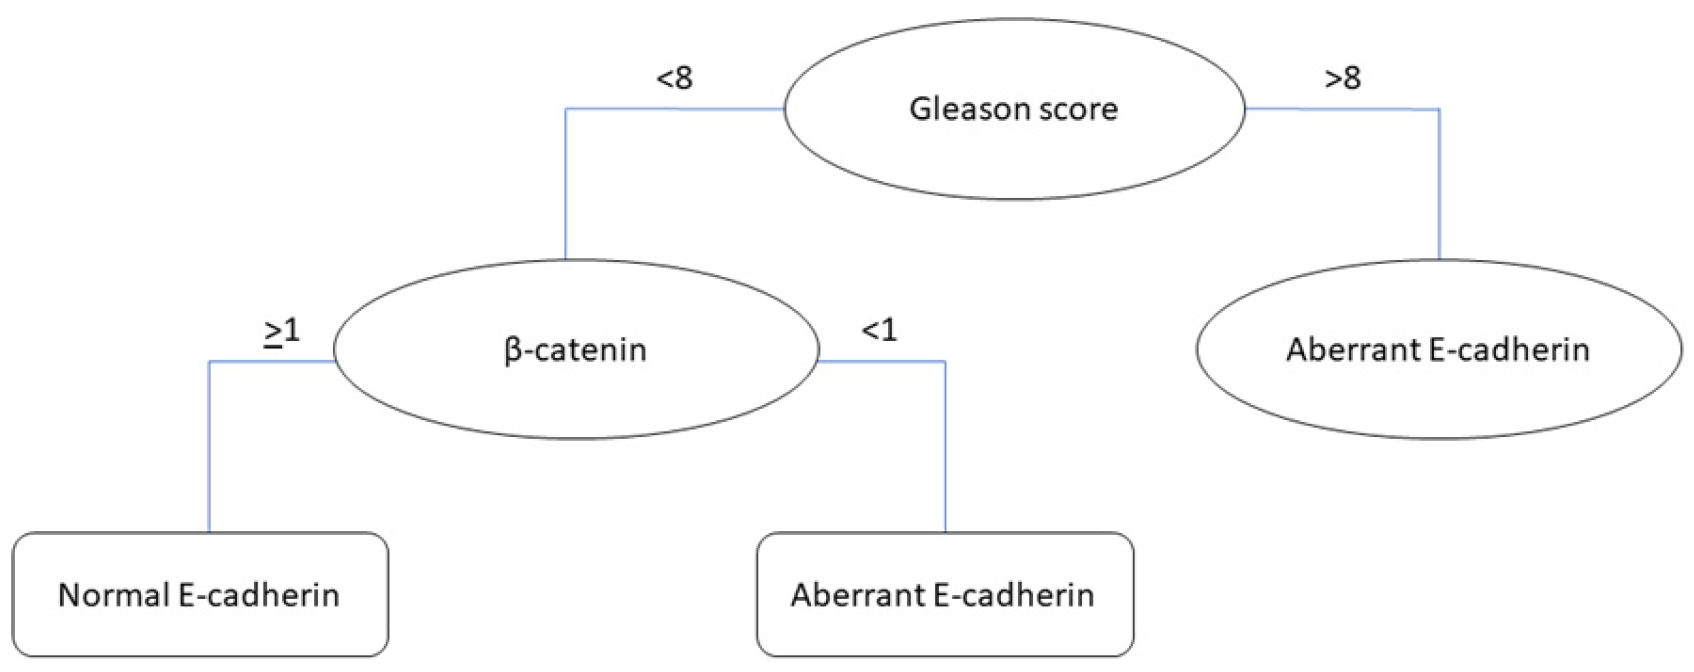
3.4.3. Classification Tree
3.4.4. Regression Tree
4. Discussion
5. Conclusions
Supplementary Materials
Author Contributions
Funding
Institutional Review Board Statement
Informed Consent Statement
Data Availability Statement
Acknowledgments
Conflicts of Interest
References
- Siegel, R.L.; Giaquinto, A.N.; Jemal, A. Cancer statistics. CA Cancer J. Clin. 2024, 74, 12–49. [Google Scholar] [CrossRef] [PubMed]
- Schatten, H. Brief Overview of Prostate Cancer Statistics, Grading, Diagnosis and Treatment Strategies. Cell Mol. Biol. Prostate Cancer 2018, 2018, 1–14. [Google Scholar] [CrossRef]
- National Cancer Institute [NCI]. SEER Cancer Stat Facts: Prostate Cancer. 2024. Available online: https://seer.cancer.gov/statfacts/html/prost.html (accessed on 19 February 2024).
- Thompson, I.M. Overdiagnosis and overtreatment of prostate cancer. American Society of Clinical Oncology Educational Book. Am. Soc. Clin. Oncol. 2012, 32, 35–39. [Google Scholar] [CrossRef]
- Catalona, W.J. Prostate Cancer Screening. Med. Clin. N. Am. 2018, 102, 199–214. [Google Scholar] [CrossRef] [PubMed]
- Grozescu, T.; Popa, F. Prostate cancer between prognosis and adequate/proper therapy. J. Med. Life 2017, 10, 5–12. [Google Scholar] [PubMed]
- Porzycki, P.; Ciszkowicz, E. Modern biomarkers in prostate cancer diagnosis. Cent. Eur. J. Urol. 2020, 73, 300–306. [Google Scholar] [CrossRef]
- Boehm, B.E.; York, M.E.; Petrovics, G.; Kohaar, I.; Chesnut, G.T. Biomarkers of Aggressive Prostate Cancer at Diagnosis. Int. J. Mol. Sci. 2023, 24, 2185. [Google Scholar] [CrossRef] [PubMed]
- Covas Moschovas, M.; Chew, C.; Bhat, S.; Sandri, M.; Rogers, T.; Dell’Oglio, P.; Patel, V. Association between Oncotype DX Genomic Prostate Score and Adverse Tumor Pathology After Radical Prostatectomy. Eur. Urol. Focus 2021, 8, 418–424. [Google Scholar] [CrossRef] [PubMed]
- Ebell, M.H. Prolaris Test for Prostate Cancer Risk Assessment. Am. Fam. Physician 2019, 100, 311–312. [Google Scholar]
- Health Quality Ontario. Prolaris Cell Cycle Progression Test for Localized Prostate Cancer: A Health Technology Assessment. Ont. Health Technol. Assess. Ser. 2017, 17, 1–75. [Google Scholar]
- Zhuang, L.; Johnson, M.T. How Precisely Can Prostate Cancer Be Managed? Int. Neurourol. J. 2016, 20 (Suppl. 2), S120–S130. [Google Scholar] [CrossRef]
- Kumar, S.; Gota, V. Logistic regression in cancer research: A narrative review of the concept, analysis, and interpretation. Cancer Res. Stat. Treat. 2023, 6, 573–578. [Google Scholar] [CrossRef]
- Abdullah, A. Using machine learning for healthcare challenges and opportunities. Inform. Med. Unlocked 2022, 30, 100924. [Google Scholar] [CrossRef]
- Gumbiner, B.M. Regulation of cadherin-mediated adhesion in morphogenesis. Nat. Rev. Mol. Cell Biol. 2005, 6, 622–634. [Google Scholar] [CrossRef]
- Lamouille, S.; Xu, J.; Derynck, R. Molecular mechanisms of epithelial mesenchymal transition. Nat. Rev. Mol. Cell Biol. 2014, 15, 178–196. [Google Scholar] [CrossRef] [PubMed]
- Isaacs, W.B.; Bova, G.S.; Morton, R.A.; Bussemakers, M.J.; Brooks, J.D.; Ewing, C.M. Genetic alterations in prostate cancer. Cold Spring Harb. Symp. Quant. Biol. 1994, 59, 653–659. [Google Scholar] [CrossRef]
- Yang, J.; Weinberg, R.A. Epithelial-mesenchymal transition: At the crossroads of development and tumor metastasis. Dev. Cell 2008, 14, 818–829. [Google Scholar] [CrossRef] [PubMed]
- Mrozik, K.M.; Blaschuk, O.W.; Cheong, C.M.; Zannettino, A.C.W.; Vandyke, K. N-cadherin in cancer metastasis, its emerging role in haematological malignancies and potential as a therapeutic target in cancer. BMC Cancer 2018, 18, 939. [Google Scholar] [CrossRef]
- Cao, Z.-Q.; Wang, Z.; Leng, P. Aberrant N-cadherin expression in cancer. Biomed. Pharmacother. 2019, 118, 109320. [Google Scholar] [CrossRef]
- Loh, C.Y.; Chai, J.Y.; Tang, T.F.; Wong, W.F.; Sethi, G.; Shanmugam, M.K.; Chong, P.P.; Looi, C.Y. The E-Cadherin and N-Cadherin Switch in Epithelial-to-Mesenchymal Transition: Signaling, Therapeutic Implications, and Challenges. Cells 2019, 8, 1118. [Google Scholar] [CrossRef]
- Baranwal, S.; Alahari, S.K. Molecular mechanisms controlling E-cadherin expression in breast cancer. Biochem. Biophys. Res. Commun. 2009, 384, 6–11. [Google Scholar] [CrossRef] [PubMed]
- Dick, F.A.; Rubin, S.M. Molecular mechanisms underlying RB protein function. Nat. Rev. Mol. Cell Biol. 2013, 14, 297–306. [Google Scholar] [CrossRef] [PubMed]
- Sanidas, I.; Morris, R.; Fella, K.A.; Rumde, P.H.; Boukhali, M.; Tai, E.C.; Ting, D.T.; Lawrence, M.S.; Haas, W.; Dyson, N.J. A Code of Mono-phosphorylation Modulates the Function of RB. Mol. Cell 2019, 73, 985–1000. [Google Scholar] [CrossRef] [PubMed]
- Pérez-Morales, J.; Mejías-Morales, D.; Rivera-Rivera, S.; González-Flores, J.; González Loperena, M.; Cordero-Báez, F.Y.; Pedreira-García, W.M.; Chardón-Colón, C.; Cabán Rivera, J.; Cress, W.D. Hyper-phosphorylation of Rb S249 together with CDK5R2/p39 overexpression are associated with impaired cell adhesion and epithelial-to-mesenchymal transition: Implications as a potential lung cancer grading and staging biomarker. PLoS ONE 2018, 13, e0207483. [Google Scholar] [CrossRef] [PubMed]
- Pérez-Morales, J.; Núñez-Marrero, A.; Santiago-Cardona, P.G. Immunohistochemical Detection of Retinoblastoma Protein Phosphorylation in Human Tumor Samples. Methods Mol. Biol. 2018, 1726, 77–84. [Google Scholar] [CrossRef] [PubMed]
- Gleason, D.F.; Mellinger, G.T. Prediction of prognosis for prostatic adenocarcinoma by combined histological grading and clinical staging. J. Urol. 1974, 111, 58–64. [Google Scholar] [CrossRef] [PubMed]
- Stark, J.R.; Perner, S.; Stampfer, M.J.; Sinnott, J.A.; Finn, S.; Eisenstein, A.S.; Ma, J.; Fiorentino, M.; Kurth, T.; Loda, M. Gleason score and lethal prostate cancer: Does 3 + 4 = 4 + 3? J. Clin. Oncol. 2009, 27, 3459–3464. [Google Scholar] [CrossRef]
- Mattijssen, V.; Peters, H.M.; Schalkwijk, L.; Manni, J.J.; van’t Hof-Grootenboer, B.; de Mulder, P.H.; Ruiter, D.J. E-cadherin expression in head and neck squamous-cell carcinoma is associated with clinical outcome. Int. J. Cancer 1993, 55, 580–585. [Google Scholar] [CrossRef] [PubMed]
- Umbas, R.; Isaacs, W.B.; Bringuier, P.P.; Schaafsma, H.E.; Karthaus, H.F.; Oosterhof, G.O.; Debruyne, F.M.; Schalken, J.A. Decreased E-cadherin expression is associated with poor prognosis in patients with prostate cancer. Cancer Res. 1994, 54, 3929–3933. [Google Scholar]
- Egger, J.V.; Lane, M.V.; Antonucci, L.A.; Dedi, B.; Krucher, N.A. Dephosphorylation of the Retinoblastoma protein (Rb) inhibits cancer cell EMT via Zeb. Cancer Biol. Ther. 2016, 17, 1197–1205. [Google Scholar] [CrossRef]
- Derycke, L.D.; Bracke, M.E. N-cadherin in the spotlight of cell-cell adhesion, differentiation, embryogenesis, invasion and signalling. Int. J. Dev. Biol. 2004, 48, 463–476. [Google Scholar] [CrossRef] [PubMed]
- Sun, L.; Xing, J.; Zhou, X.; Song, X.; Gao, S. Wnt/β-catenin signalling, epithelial-mesenchymal transition and crosslink signalling in colorectal cancer cells. Biomed. Pharmacother. Biomed. Pharmacother. 2024, 175, 116685. [Google Scholar] [CrossRef] [PubMed]
- Chaffer, C.; Weinberg, R. A Perspective on Cancer Cell Metastasis. Science 2011, 331, 1559–1564. [Google Scholar] [CrossRef] [PubMed]
- White, B.D.; Chien, A.J.; Dawson, D.W. Dysregulation of Wnt/beta-catenin signaling in gastrointestinal cancers. Gastroenterology 2012, 142, 219–232. [Google Scholar] [CrossRef] [PubMed]
- Stanczak, A.; Stec, R.; Bodnar, L.; Olszewski, W.; Cichowicz, M.; Kozlowski, W.; Lamparska-Przybysz, M. Prognostic significance of Wnt-1, beta-catenin and E-cadherin expression in advanced colorectal carcinoma. Pathol. Oncol. Res. 2011, 17, 955–963. [Google Scholar] [CrossRef]


| Variables | p-Value | r |
|---|---|---|
| Tumor size | <0.0001 | 0.4711 |
| Lymph node invasion | 0.3902 | 0.06407 |
| Metastasis | 0.5106 | 0.04907 |
| Grade | 0.0910 | 0.1320 |
| Stage | <0.0001 | 0.4405 |
| Gleason grade | 0.3703 | 0.06874 |
| Gleason score | 0.3982 | 0.06463 |
| N-Cadherin | p-Value | r |
|---|---|---|
| Tumor size | <0.0001 | 0.3782 |
| Lymph nodes invasion | 0.2540 | 0.08498 |
| Metastasis | 0.0663 | 0.1364 |
| Grade | 0.3585 | 0.07193 |
| Stage | <0.0001 | 0.3522 |
| Gleason grade | 0.0313 | 0.1643 |
| Gleason score | 0.1016 | 0.1245 |
| β-catenin | p-value | r |
| Tumor size | 0.0119 | −0.1861 |
| Lymph node invasion | 0.6122 | −0.03782 |
| Metastasis | 0.3912 | 0.06394 |
| Grade | 0.0004 | −0.2716 |
| Stage | 0.0051 | −0.2069 |
| Gleason grade | 0.0010 | −0.2495 |
| Gleason score | 0.0002 | −0.2810 |
| E-cadherin | p-value | r |
| Tumor size | 0.0002 | −0.2746 |
| Lymph node invasion | 0.4974 | −0.05061 |
| Metastasis | 0.9504 | 0.004647 |
| Grade | <0.0001 | −0.2984 |
| Stage | <0.0001 | −0.3567 |
| Gleason grade | 0.0020 | −0.2338 |
| Gleason score | 0.0008 | −0.2530 |
| Variables | Overall (N = 396) | Gleason Score ≤ 3 + 4 (N = 195) | Gleason Score ≥ 4 + 3 (N = 201) | p-Value |
|---|---|---|---|---|
| Tumor size (N = 396) | 0.0002 | |||
| 1 | 4 (1.01) | 4 (2.05) | 0 | |
| 2 | 233 (58.84) | 129 (66.15) | 104 (51.74) | |
| 3 | 136 (34.34) | 55 (28.21) | 81 (40.30) | |
| 4 | 23 (5.81) | 7 (3.59) | 16 (7.96) | |
| Lymph node invasion (N = 396) | 0.1428 | |||
| 0 | 366 (92.42) | 176 (90.26) | 190 (94.53) | |
| 1 | 28 (7.07) | 18 (9.23) | 10 (4.98) | |
| 2 | 2 (0.51) | 1 (0.51) | 1 (0.50) | |
| Stage (N = 396) | 0.0018 | |||
| 1 | 27 (6.82) | 24 (12.30) | 3 (1.49) | |
| 2 | 214 (54.04) | 107 (54.87) | 107 (54.87) | |
| 3 | 110 (27.78) | 43 (22.05) | 67 (33.33) | |
| 4 | 45(11.36) | 21 (10.77) | 24 (11.94) | |
| Metastasis (N = 396) | 0.0089 | |||
| No | 386 (97.47) | 186 (95.38) | 200 (99.50) | |
| Yes | 10 (2.53) | 9 (4.62) | 1 (0.50) | |
| Grade (N = 394) | 0.0000 | |||
| 1 | 33 (8.38) | 33 (16.92) | 0 | |
| 2 | 194 (49.24) | 147 (75.38) | 47 (23.38) | |
| 3 | 167 (42.39) | 10 (5.13) | 157 (78.11) | |
| Gleason grade (N = 396) | 0.0000 | |||
| 1 | 18 (4.55) | 18 (9.23) | 0 | |
| 2 | 48 (12.12) | 48 (24.62) | 0 | |
| 3 | 84 (21.21) | 81 (41.54) | 3 (1.49) | |
| 4 | 131 (33.08) | 48 (24.62) | 83 (41.29) | |
| 5 | 115 (29.04) | 0 | 115 (57.21) | |
| Gleason score (N = 396) | - | |||
| 1 | 0 | 0 | 0 | |
| 2 | 3 (0.75) | 3 (1.54) | 0 | |
| 3 | 8 (2.02) | 8 (4.10) | 0 | |
| 4 | 12 (3.03) | 12 (6.15) | 0 | |
| 5 | 23 (5.80) | 23 (11.79) | 0 | |
| 6 | 46 (11.62) | 46 (23.59) | 0 | |
| 7 | 103 (26.01) | 103 (52.82) | 0 | |
| 8 | 67 (16.92) | 0 | 67 (33.33) | |
| 9 | 66 (16.67) | 0 | 66 (32.84) | |
| 10 | 68 (188.89) | 0 | 68 (33.83) |
| Variables | Overall (N = 396) | Gleason Score ≤ 3 + 4 (N = 195) | Gleason Score ≥ 4 + 3 (N = 201) | p-Value |
|---|---|---|---|---|
| Age | ||||
| Mean (sd) | 69.00 (8.79) | 68.36 (6.88) | 69.63 (10.29) | 0.1532 |
| Median (p25, p75) | 70 (64, 75) | 69 (64, 73) | 70 (64, 76) | |
| Phospho-Rb S249 | ||||
| Mean (sd) | 2.72 (0.70) | 2.79 (0.69) | 2.64 (0.71) | 0.0304 |
| Median (p25, p75) | 2.84 (2.33, 3.21) | 2.93 (2.33, 3.31) | 2.79 (2.33, 3.12) | |
| N-Cadherin | ||||
| Mean (sd) | 1.85 (0.58) | 1.90 (0.61) | 1.81 (0.55) | 0.1094 |
| Median (p25, p75) | 1.88(1.29, 2.31) | 1.92 (1.29, 2.38) | 1.88 (1.33, 2.21) | |
| β-Catenin | ||||
| Mean (sd) | 1.59 (0.62) | 1.70 (0.64) | 1.48 (0.57) | 0.0003 |
| Median (p25, p75) | 1.38 (1, 2) | 1.92 (1.13, 2.25) | 1.21 (1, 1.83) | |
| E-Cadherin | ||||
| Mean (sd) | 2.20 (0.64) | 2.26 (0.62) | 2.15 (0.66) | 0.0826 |
| Median (p25, p75) | 2.33 (1.67, 2.72) | 2.38 (1.75,2.75) | 2.21 (1.58, 2.71) |
| Variable | OR (CI) |
|---|---|
| β-catenin | 0.55 (0.39–0.77) |
| Variables | Gleason Score Classification | E-Cadherin Staining Pattern Classification |
|---|---|---|
| Training AUC | 0.9572 | 0.8499 |
| Testing AUC | 0.9621 | 0.8538 |
| Pseudo-R2 training | 0.7401 | 0.291 |
| Pseudo-R2 testing | 0.6294 | 0.2192 |
| Sensitivity | 0.9655 | 0.8617 |
| Specificity | 0.9133 | 0.8246 |
| PPV | 0.896 | 0.7297 |
| NPV | 0.9716 | 0.9156 |
| Prevalence | 0.4361 | 0.3547 |
| Detection rate | 0.4211 | 0.3057 |
| Detection prevalence | 0.4699 | 0.4189 |
| Balanced accuracy | 0.9394 | 0.8431 |
| Variable | Gleason Score Classification | E-Cadherin Staining Pattern Classification |
|---|---|---|
| R2 | 0.6961 | 0.3844 |
| RMSE | 1.0247 | 1.1013 |
| Variables | Membrane (N = 143) | Aberrant (N = 303) | p-Value |
|---|---|---|---|
| Stage (N = 407) | N = 139 | N = 268 | <0.001 |
| 1 | 22 | 6 | |
| 2 | 79 | 138 | |
| 3 | 24 | 88 | |
| 4 | 12 | 34 | |
| Median | 2 | 2 | |
| Grade (N = 392) | N = 134 | N = 258 | <0.001 |
| 1 | 29 | 4 | |
| 2 | 91 | 103 | |
| 3 | 12 | 148 | |
| 4 | 0 | 0 | |
| 5 | 0 | 0 | |
| Median | 2 | 3 | |
| Gleason score (N = 439) | N = 141 | N = 298 | <0.001 |
| 1 | 0 | 0 | |
| 2 | 3 | 0 | |
| 3 | 8 | 0 | |
| 4 | 9 | 3 | |
| 5 | 20 | 3 | |
| 6 | 33 | 17 | |
| 7 | 53 | 53 | |
| 8 | 5 | 80 | |
| 9 | 4 | 71 | |
| 10 | 6 | 71 | |
| Median | 6 | 8 | |
| Tumor size (T) (N = 403) | N = 137 | N = 266 | <0.001 |
| 0 | 0 | 0 | |
| 1 | 2 | 2 | |
| 2 | 98 | 139 | |
| 3 | 33 | 106 | |
| 4 | 4 | 19 | |
| Median | 2 | 2 | |
| Lymph node invasion (N) (N = 403) | N = 137 | N = 266 | 0.580 |
| 0 | 128 | 245 | |
| 1 | 9 | 19 | |
| 2 | 0 | 2 | |
| Median | 0 | 0 | |
| Metastasis (M) (N = 403) | N = 137 | N = 266 | 0.279 |
| No | 132 | 261 | |
| Yes | 5 | 5 | |
| 2 | 0 | 0 | |
| Median | 0 | 0 |
| Variable | Overall (N = 403) | Membrane (N = 137) | Aberrant (N = 266) | p-Value |
|---|---|---|---|---|
| Phospho-Rb S249 | ||||
| Mean (sd) | 2.72 (0.70) | 2.75 (0.71) | 2.71 (0.70) | 0.500 |
| Median (p25, p75) | 2.79 (2.33,3.21) | 2.88 (2.33, 3.25) | 2.75 (2.38, 3.17) | |
| N-Cadherin | ||||
| Mean (sd) | 185 (0.58) | 1.92 (0.62) | 1.81 (0.56) | 0.062 |
| Median (p25, p75) | 1.83 (1.29, 2.29) | 1.92 (1.29, 2.38) | 1.74 (1.29, 2.21) | |
| E-Cadherin | - | |||
| Mean (sd) | 2.19 (0.64) | 2.41(0.52) | 2.08 (0.67) | |
| Median (p25, p75) | 2.21 (1.67, 2.71) | 2.42 (2.08, 2.79) | 2.04 (1.50, 2.67) | |
| β-Catenin | <0.001 1 | |||
| Mean (sd) | 1.59 (0.61) | 1.87 (0.67) | 1.44 (0.53) | |
| Median (p25, p75) | 1.38 (1, 2) | 1.71 (1.29, 2.46) | 1.23 (1.00, 1.71) |
| Variables | OR (CI) |
|---|---|
| -catenin | 0.21 (0.12–0.38) |
| N-cadherin | 1.27 (0.73–2.22) |
| years) | 6.98 (1.23–39.60) |
| Grade | |
| 1 | - |
| 2 | 4.25 (1.27–14.19) |
| 3 | 12.86 (2.73–60.61) |
| Stage | |
| 1 | - |
| 2 | 4.13 (0.82–20.79) |
| 3 | 5.72 (1.05–31.22) |
| 4 | 10.57 (1.69–66.00) |
| Gleason score (≥4 + 3) | 7.66 (2.80–20.94) |
Disclaimer/Publisher’s Note: The statements, opinions and data contained in all publications are solely those of the individual author(s) and contributor(s) and not of MDPI and/or the editor(s). MDPI and/or the editor(s) disclaim responsibility for any injury to people or property resulting from any ideas, methods, instructions or products referred to in the content. |
© 2024 by the authors. Licensee MDPI, Basel, Switzerland. This article is an open access article distributed under the terms and conditions of the Creative Commons Attribution (CC BY) license (https://creativecommons.org/licenses/by/4.0/).
Share and Cite
Valle Cortés, S.M.; Pérez Morales, J.; Nieves Plaza, M.; Maldonado, D.; Tevenal Baez, S.M.; Negrón Blas, M.A.; Lazcano Etchebarne, C.; Feliciano, J.; Ruiz Deyá, G.; Santa Rosario, J.C.; et al. Integrating Proteomic Analysis and Machine Learning to Predict Prostate Cancer Aggressiveness. Stats 2024, 7, 875-893. https://doi.org/10.3390/stats7030053
Valle Cortés SM, Pérez Morales J, Nieves Plaza M, Maldonado D, Tevenal Baez SM, Negrón Blas MA, Lazcano Etchebarne C, Feliciano J, Ruiz Deyá G, Santa Rosario JC, et al. Integrating Proteomic Analysis and Machine Learning to Predict Prostate Cancer Aggressiveness. Stats. 2024; 7(3):875-893. https://doi.org/10.3390/stats7030053
Chicago/Turabian StyleValle Cortés, Sheila M., Jaileene Pérez Morales, Mariely Nieves Plaza, Darielys Maldonado, Swizel M. Tevenal Baez, Marc A. Negrón Blas, Cayetana Lazcano Etchebarne, José Feliciano, Gilberto Ruiz Deyá, Juan C. Santa Rosario, and et al. 2024. "Integrating Proteomic Analysis and Machine Learning to Predict Prostate Cancer Aggressiveness" Stats 7, no. 3: 875-893. https://doi.org/10.3390/stats7030053
APA StyleValle Cortés, S. M., Pérez Morales, J., Nieves Plaza, M., Maldonado, D., Tevenal Baez, S. M., Negrón Blas, M. A., Lazcano Etchebarne, C., Feliciano, J., Ruiz Deyá, G., Santa Rosario, J. C., & Santiago Cardona, P. (2024). Integrating Proteomic Analysis and Machine Learning to Predict Prostate Cancer Aggressiveness. Stats, 7(3), 875-893. https://doi.org/10.3390/stats7030053


