Abstract
In testing for main effects, the use of orthogonal contrasts for balanced designs with the factor levels not ordered is well known. Here, we consider two-factor fixed-effects ANOVA with the levels of one factor ordered and one not ordered. The objective is to extend the idea of decomposing the main effect to decomposing the interaction. This is achieved by defining level–degree coefficients and testing if they are zero using permutation testing. These tests give clear insights into what may be causing a significant interaction, even for the unbalanced model.
Keywords:
balanced and unbalanced designs; exploratory data analysis tool; orthogonal contrasts; orthogonal polynomials; pairwise comparisons AMS Subject Classification Codes:
62G; 62F
1. Introduction
In undergraduate courses and texts for users of statistics, contrasts are often met as a means to better understand a significant main effect by making comparisons between the treatment level means. Such texts include Box, Hunter and Hunter [1], Draper and Smith [2], (for example, p. 477) and Snedecor and Cochran [3], (see Section 12.8); a more extensive account is given in Kuehl [4], (Section 3.2). Although occasionally ordered levels are mentioned, most accounts focus on when the levels of the factor are unordered. See, for example, https://en.wikipedia.org/wiki/Contrast_(statistics), url accessed on 14 May 2024.
Most sources focus on orthogonal contrasts. However, we have found in the literature that it is unusual to consider unbalanced designs where there are different numbers of observations in the levels of the treatments, and it is rare to give any detail when the treatment levels are ordered, or to discuss contrasts for interactions.
The idea of orthogonal contrasts is to decompose a statistic, such as an ANOVA sum of squares, into components and hence test for different subsets of the parameter space. The orthogonality ensures that the test statistics are independent, and thus that the parameter subsets are disjoint.
In a sequence of papers, the authors have endeavoured to provide data analysts with better tools for examining data sets from multifactor ANOVA models. We began with orthogonal contrasts but have moved beyond these to enable more informative, useful and objective analyses.
Thus, Rayner and Livingston Jr [5] give a construction that recovers the Kruskal–Wallis, Friedman and Durbin test statistics and their orthogonal contrasts, but which applies to more general designs. In particular, the construction applies to unbalanced designs.
Competitors for these statistics, including orthogonal contrasts, are explored in Rayner and Livingston Jr [6]. In certain ANOVAs, statistics having F distributions are constructed to analyse both main effects and two-factor interactions. So, for example, in the completely randomised design, the ANOVA F test statistic on the ranks is equivalent to the Kruskal–Wallis statistic, and in the randomised block design, the ANOVA F test statistic on the ranks is equivalent to the Friedman test statistic. However, the ANOVA F tests may have more accurate null distributions. Here, it is shown that if the levels of the two factors of interest are ordered, then the interaction sum of squares can be decomposed into orthogonal contrasts that may be interpreted as generalised correlations. Then, for example, it may be found that for one factor the cell mean levels decrease, while for the other they increase then decrease.
Work in progress in Livingston Jr and Rayner [7] continues the investigation of Rayner and Livingston Jr [5], focusing on balanced or equally replicated two-factor fixed- effects ANOVAs with the levels of at least one factor not ordered. For such factors, if there are natural comparisons between the levels, then the analysis is well known. However, dealing with scenarios in which there are no natural comparisons may be problematic. In this article, we show how to construct nonorthogonal contrasts that give pairwise comparisons for both main effects and interactions.
In the present contribution, initially we are again looking at two-factor fixed-effects balanced ANOVAs, with the levels of one factor being ordered and those of the other factor not ordered. The principal interest is in gaining more information about the interaction. We move away from contrasts and instead identify coefficients that examine, for each level of the factor without ordered levels, the contributions to linear, quadratic and other polynomial effects. Moreover, such coefficients are also well defined in unbalanced models. In all models, we test the null hypothesis of no interaction effects by testing if all the coefficients are zero against the alternative that at least one of them is nonzero.
We have also found that instead of the usual cell means plots, it may be better to view plots of the aligned cell means, so that the main effects do not obscure the interaction effects.
A caveat on these explorations is that we generally are not interested in three-way interactions. We view the processes we propose as exploratory data analysis, with each component providing an input. Too many inputs would typically be too difficult to incorporate into the overall picture. Indeed, since these inputs come as multiple p-values, at the 0.05 level, 5% of them will appear to be significant when in fact they are not, on average. So, the information gleaned needs to be carefully considered.
In the next section, we show how what we call level–degree effects arise in the balanced two-factor fixed-effects ANOVAs. However, they are also well defined in the unbalanced two-factor fixed-effects ANOVA and, motivated by their application in balanced models, we also apply them in unbalanced models. Three examples follow; these demonstrate how testing for these effects enables a deeper understanding of the data. The level–degree statistics do not decompose statistics such as the interaction sum of squares and are not mutually independent. However, as applied here, they are nonparametric, informative and objective.
2. Construction of Interaction Effects for the Fixed-Effects Balanced ANOVA
The model here is assumed to be a multifactor fixed-effects ANOVA, but we focus only on two factors, A and B say; the model assumes that there is an AB interaction. Suppose Yijk is the kth of nij observations of the ith of r levels of factor A and the jth of c levels of factor B. All observations are mutually independent and normally distributed with constant variance σ2.
We assume nij = s > 1 for all i and j: the balanced or equally replicated design. There are thus n = rcs observations in all. This design is orthogonal so there is no issue with sum of squares types. The error degrees of freedom are edf = rc (s − 1).
Write for the mean of the observations for level i of factor A and level j of factor B, for the mean of the observations for level i of factor A, for the mean of the observations for level j of factor B, and for the mean of all of the observations. As, for example, in Kuehl [4] (p. 185), the interaction sum of squares is
It will be useful to note that this is a scalar multiple of the sum of the squared aligned cell means, . Alignment is a tool sometimes used to strip main effects from the observations. Rayner and Livingston Jr [8], (Section 9.4) discuss alignment; some additional discussion is given in Appendix A. Without loss of generality, assume the observations have zero means so that the are mutually independent and N(0, ) distributed. Put
Livingston Jr and Rayner [7] show that
in which m1, …, m(r−1)(c−1) are the eigenvectors corresponding to the eigenvalues 1 of an idempotent matrix with rank (r − 1)(c − 1). The eigenvectors mt are not uniquely defined; it is only required that they are mutually orthonormal and orthogonal to 1rc. We now take advantage of this flexibility. Suppose D is any r × r idempotent matrix of rank r − 1 and E is any c × c idempotent matrix of rank c − 1. Then, D has r − 1 eigenvalues one and one zero, and E has c − 1 eigenvalues one and one zero. It follows that D ⨂ E is idempotent and has (r − 1)(c − 1) eigenvalues one and r + c − 1 eigenvalues zero. In particular, suppose the eigenvectors of D corresponding to the eigenvalue one are d1, …, dr–1 and the eigenvectors of E corresponding to the eigenvalue one are e1, …, ec–1. The du ⨂ ev, u = 1, …, r − 1 and v = 1, …, c − 1 are an appropriate choice for the eigenvectors of D ⨂ E corresponding to the eigenvalue 1 and are mutually orthonormal.
As in Rayner and Livingston Jr [6], we now choose {ev} based on the orthonormal polynomials with weight function (n.1/n, …, n.r/n)T. In Livingston Jr and Rayner [7], the {du} are chosen to give contrasts, but there will be no need to specify them here.
For i = 1, …, r put = (Zi1, …, Zic). Then, Z = (| … |)T. The degree (u, v) orthonormal contrast requires mt = du ⨂ ev, with du being r × 1 and ev being c × 1. Thus, mt = (du1 , …, dur )T and
Now, the give information on the ith unordered level and the polynomial effect of degree v, and combines these for all the unordered levels. Pairwise comparisons are considered in Livingston Jr and Rayner [7]. Here, we focus on the {}. Obviously, if all are zero, then so are all the and SSAB. They may therefore be thought of as analogues of the generalised correlations whose sum of squares is the interaction sum of squares in the two-way ANOVA in which the levels of both factors are ordered. Hence, we call the {} level–degree interaction coefficients.
We note that since
the may be interpreted as the projection of the ith unordered level into what we might call degree v space. To verify this, multiply both sides of the highlighted equation by each of e1, …, ec in turn. It now follows that are the contributions to linearity from levels 1, 2, …, r, respectively, of the unordered factor. If there is no significant linear effect, these contributions will be relatively small. However, if there is such an effect, then the magnitude of the will indicate the relative contributions of the levels to this effect. The same applies to higher degree effects.
It may be useful to note that . This follows because
using the fact that the Zij are aligned cell means and, by their definition, sum to zero over the entire table.
We make no claims about the distribution of the . We are interested in testing, for each (i, v), Hvi: = 0 against Kvi: . We do this by permutation testing so our process is completely nonparametric. The null hypothesis is that all = 0 and hence that there is no interaction effect.
The permutation test involves permuting the aligned values of the response variable. These values are aligned again to remove any minor effects present based on the two factors and then the cell means calculated in order to determine a permuted value of , which is subsequently used to calculate the permuted statistics. This is then repeated as many times as one needs to determine p-values that are sufficiently accurate. Throughout this article, we use 100,000 permutations. The p-value is the proportion of times the observed statistics are more extreme than the permuted statistics. Examples are given in the sections following.
3. Fabric Shrinkage Example
The data in Table 1 are the percent shrinkage of two replicate fabric pieces at each of four temperatures. The data come from Kuehl [4] (Chapter 6, exercise 3). Routine ANOVA analysis in R gives the output in Table 2. The Shapiro–Wilk test on the normality of the residuals returns a p-value of 0.0433. Given the well-known robustness of ANOVA in general, this is not a serious violation of the ANOVA model’s assumptions.

Table 1.
Shrinkage in four fabrics at four temperatures.

Table 2.
Analysis of variance table for the fabric shrinkage data.
A plot of the data in Figure 1 shows increasing shrinkage, and perhaps increasing variability, with increasing temperature; shrinkage for fabric 3 that is uniformly above average, while that for fabric 1 that is uniformly below average.
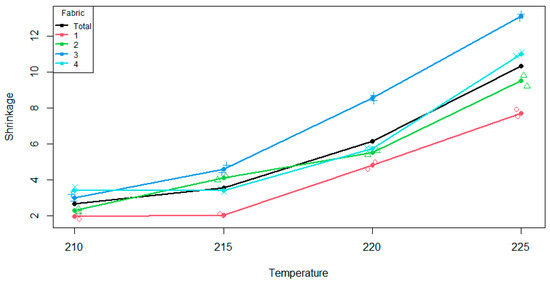
Figure 1.
Cell sum plot of shrinkage against temperature for each fabric and on average.
Treating the levels of temperature as ordered, the temperature contrasts may be found as in Rayner and Livingston Jr [6]. Those of degrees one, two and three have p-values 0.0000, 0.0000 and 0.6273, respectively. Thus, both linear and quadratic effects are very strong, and there is no evidence of a cubic effect. These effects are apparent in Figure 1.
Livingston Jr and Rayner [7] investigate interaction effects and show that every pairwise contrast may be decomposed into linear, quadratic and cubic effects. For these data, every such contrast has at least one p-value less than 0.0001. Thus, as the temperature increases, the differences in fabric pairs are nonconstant.
We now investigate fabric–temperature effects, through the . For all (v, i), we test Hv,i: = 0 against Kv,i: using permutation testing under the null hypothesis of zero interaction. P-values are given in Table 3 in which p-values less than 0.05 are bolded.

Table 3.
Permutation test p-values of Hv,i against Kv,i.
For a particular level i of the factor whose levels are not ordered, we interpret the rejection of Hv,i as that level having a significant effect of degree v compared to the overall main effect for the ordered variable. In Figure 1, if the curves for each fabric were parallel, (i.e., no interaction effect), they would also be parallel to the main effect. The differences between each fabric and the overall effect are what is being assessed. We can visualise this by plotting the aligned cell means, shown in Figure 2.
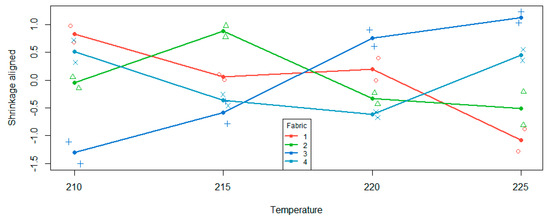
Figure 2.
Aligned cell mean plot of shrinkage against temperature for each fabric.
If we focus on the fourth fabric in Figure 1, we can see that as we progress through the temperatures, the cell mean is higher than the main effect mean, then slightly below for two levels, then is greater for the last level of the ordered variable. Therefore, the shape of the fabric four curve relative to the overall main effect is a quadratic shape. This is also what we see in Figure 2 for fabric four. This quadratic effect is statistically significant as per Table 3.
The other significant effects as per Table 3 are linear effects for fabrics one and three. Looking at Figure 2, fabric 1 has a negative relationship, relative to the overall main effect, whereas fabric three has a positive relationship relative to the overall main effect. There are hints of a cubic pattern in both curves, but with only two observations in each cell, there is not enough power to formally detect such a relationship.
4. Acetylene Reduction Example
Four crops were inoculated with Rhizobium bacteria and growth noted for three rates of nitrogen application. Acetylene reduction reflects the amount of nitrogen fixed by the bacteria. There were four replications for each treatment combination. These data, given in Table 4, are from Kuehl [4] (Chapter 6, exercise 4). Routine ANOVA analysis in R gives the output in Table 5. Crop, nitrogen and their interaction are all significant at the 0.05 level. However, the Shapiro–Wilk test for normality of the residuals returns a p-value of 0.0000; the ANOVA p-values are not reliable.

Table 4.
Growth of four crops for four rates of nitrogen application.

Table 5.
Analysis of variance table for the acetylene reduction data.
The levels of nitrogen are ordered, while those of crop are not. The scenario gives no suggestion as to any ordering the crops might have. A plot of the data in Figure 3 shows that for each crop, the growth decreases as the level of nitrogen application increases. As in Rayner and Livingston Jr [6], we find that the nitrogen contrast of degrees one and two have p-values of 0.0000 and 0.0005, respectively. Both linear and quadratic main effects are apparent in Figure 3.
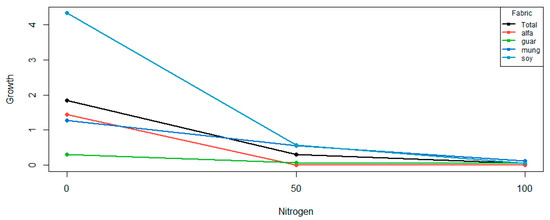
Figure 3.
Cell sum plot of growth against level of nitrogen application for each crop and on average.
The levels of crop are not ordered. The significant difference in crop levels is reflected by the crop means: 0.4833, 0.1417, 0.6500 and 1.6500 for crops alfalfa, guar, mungbean and soybean, respectively. It appears that soybean has considerably greater growth than the other crops.
Next, we reflect on interaction effects, by using permutation tests of, for all (v, i), Hv,i: = 0 against Kv,i: . p-values are given in Table 6, and a plot of the aligned cell means is given in Figure 4. The crops that contribute to the interaction effect are guar and soybean. The latter has a significant linear effect, which indicates that relative to the overall main effect of nitrogen, guar contributes linearly to the interaction effect. For soybean, we are able to identify both a linear and quadratic effect, relative to the overall main effect of nitrogen.

Table 6.
Permutation test p-values of Hv,i against Kv,i.
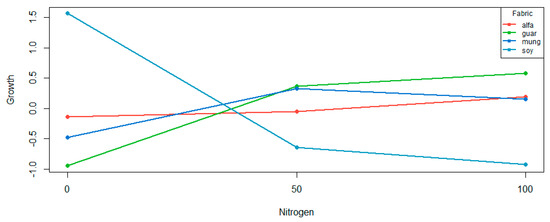
Figure 4.
Aligned cell mean plot of shrinkage against temperature for each fabric and overall: the line-aligned shrinkage = 0.
The aligned cell means are plotted in Figure 4. The alfalfa and mungbean crops are not significantly different from a flat line given the p-values reported in Table 6. The curve for soybean supports both the significant linear and quadratic effect. The curve for guar supports the significant linear effect, and there is an indication of a quadratic effect. Compared to the curve for soybean (where the quadratic effect was only just significant, p = 0.0303), the quadratic effect is not as pronounced.
5. Steroid Production Example
For two-way fixed-effects ANOVAs without equal replication, we no longer have a convenient expression for the interaction sum of squares, and hence, our approach needs to be modified. We wish to construct statistics related to the level–degree coefficients in the balanced model and to use these statistics in permutation tests to give insights into how the levels of the factor with unordered levels vary across levels of the factor with ordered levels.
The aligned cell means, , are still relevant as the alignment has removed the main effects from the cell means. Although we do not, we could instead use, for example, the aligned cell sums. Subsequently, we retain the previous definitions of Z and the Zi.
Given an orthonormal system {ev}, the {} are the projections of the Zi into the spaces corresponding to the ev. In the equal replication scenario, the use of orthonormal polynomials allowed comparisons of linear, quadratic and other polynomial effects for the different levels of the factor with unordered levels. The choice of orthonormal system will depend on the scenario and the relevance and interpretability of the inference. In the following example, we continue to use the orthonormal polynomials on the discrete uniform distribution so as to identify polynomial effects.
For two-way fixed-effects unbalanced ANOVAs, we continue to call the {} level–degree coefficients.
Kuehl [4] (p. 224, exercise 10) gives the data in Table 7, in which the response is steroid production per 100 mg of gland per hour for each of two treatments. The glands are taken from rats at four different stages of growth. We assume the growth stages are ordered, but the treatments are not. Because alignment is required in analysing these data, and alignment in unbalanced models may not be well understood by some readers, we provide some description in Appendix A.

Table 7.
Kuehl [4] data.
The design is not balanced and therefore not orthogonal. Preliminary analysis suggests that the main effects are not significant at the 0.05 level, whereas the interaction is. It is therefore appropriate to investigate objectively why that may be so. The Shapiro–Wilk test for normality of the residuals had a p-value of 0.6287. We need to explore the interaction more.
The usual cell mean plot, given in Figure 5, plots the cell means against the levels of the factor stage. It appears that initially treatment 1 is roughly constant, then increases at stage 4. Treatment 2 initially decreases, then increases at stage 4. The interaction manifests itself in that the two treatments are behaving differently.
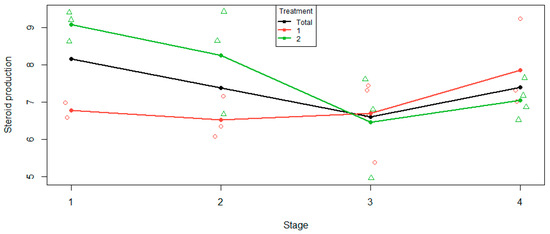
Figure 5.
Cell mean plot for two treatments and their mean.
The aligned cell means provide a better idea of interaction effects because they are not contaminated by the main effects. The aligned cell mean plot in Figure 6 shows that as we progress through the stages, treatment 1 stripped of its main effects increases, and treatment 2 stripped of its main effects decreases. The most obvious observation is that the treatment curves intersect: the treatments are behaving quite differently.
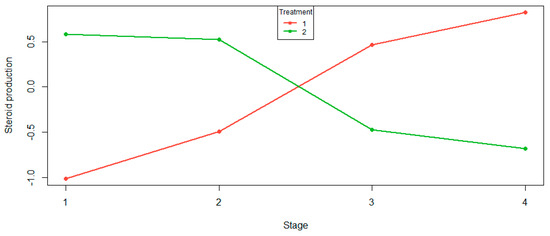
Figure 6.
Aligned cell mean plot for two treatments and their mean.
To better understand the Figure 6 plot in Table 8, we give the permutation test p-values of the various level–degree effects under the null hypothesis of no interaction effect. Both treatments have very strong linear and no other effects. The subjective conclusion from the aligned cell mean plot is confirmed objectively.

Table 8.
Permutation test p-values of Hv,i against Kv,i.
6. Conclusions
Orthogonal contrasts have been used for some time to decompose an omnibus test statistic into focused components. This approach enables a significant effect to be better understood and, occasionally, finds a significant effect that has been masked by a nonsignificant one. In the ANOVA, contrasts are usually met for balanced fixed-effects models in which the levels of the factor of interest are not ordered. To construct appropriate contrasts requires knowledge of which levels are most usefully compared with which. Usually, contrasts are considered for main effects; interactions seem to have been rarely considered.
For two-factor interactions in which the levels of both factors are ordered, Rayner and Livingston [6] found orthogonal contrasts that can be used to test for focused interaction effects. When the levels of at least one factor are not ordered, Livingston Jr and Rayner [7] address the issue of not knowing which levels should be compared with which by considering pairwise contrasts that compare every level with every other level.
Here, we have considered two-factor fixed-effects ANOVAs with the levels of one factor ordered and one not ordered. Level–degree coefficients have been defined and are such that if all such coefficients are zero, then so is the interaction. Testing for such coefficients to be zero using permutation tests gives nonparametric focused tests. While these coefficients are not contrasts, they do enable a significant interaction effect to be better understood, and they may find significant effects that have been masked by nonsignificant ones.
Author Contributions
Conceptualization, J.C.W.R.; methodology, J.C.W.R. and G.C.L.J.; software, G.C.L.J.; validation, J.C.W.R. and G.C.L.J.; formal analysis, J.C.W.R. and G.C.L.J.; investigation, J.C.W.R. and G.C.L.J.; resources, J.C.W.R. and G.C.L.J.; data curation, G.C.L.J.; writing—original draft preparation, J.C.W.R.; writing—review and editing, J.C.W.R. and G.C.L.J.; visualization, J.C.W.R. and G.C.L.J.; supervision, J.C.W.R.; project administration, J.C.W.R. All authors have read and agreed to the published version of the manuscript.
Funding
This research received no external funding.
Institutional Review Board Statement
Not applicable.
Informed Consent Statement
Not applicable.
Data Availability Statement
The data presented in this study are openly available in Kuehl [4]. R code is available upon application to the second author.
Conflicts of Interest
The authors declare no conflicts of interest.
Appendix A. Alignment in Two-Way Tables with Unequal Cell Counts
A very readable introduction to alignment is given in Higgins [9], (Section 9.2). Suppose we have a two-way table with multiple counts in each cell. The observations are xijk, in which i = 1, …, r, j = 1, …, c and k = 1, …, nij. To align the cell means we form, with dot meaning summation,
Note that : a row mean is a weighted mean of the cell means in that row, similarly for the column means. This is the same form as for tables with equal cell counts.
Now, consider . First, . Next, . Similarly, . Finally, = So, = 0. In the balanced case, nij = d say, a constant, so that = 0: the sum of the aligned cell means over the whole table is zero. Here, is the aligned cell count, so we have that even for unequal cell counts the sum of the aligned cell counts is zero.
Next, consider . First, does not appear to simplify. Next, . Then, and, finally, = Thus,
So, this sum is a weighted sum of cell means minus, for each, the corresponding column mean. This is not generally zero. It is, if, for example, . Also for the balanced case, again nij = d, a constant, giving = cd and , so that
Thus, in the balanced case, and similarly , but such results do not carry over to when cell counts are not equal.
Alignment seems to have been frequently suggested in ANOVA studies to remove row and column effects prior to ranking. However, if in seeking a more robust analysis such effects may be estimated using row and column medians, and possibly trimmed means, then even for a balanced design, expecting row, column or total aligned cell sums to be zero cannot be expected. However, expecting them to be smaller than in non-aligned data seems reasonable.
References
- Box, G.E.; Hunter, W.G.; Hunter, J.S. Statistics for Experimenters: Design, Innovation, and Discovery, 2nd ed.; Wiley: New York, NY, USA, 2005. [Google Scholar]
- Draper, N.R.; Smith, H. Applied Regression Analysis, 3rd ed.; Wiley: New York, NY, USA, 1998. [Google Scholar] [CrossRef]
- Snedecor, G.W.; Cochran, W.G. Statistical Methods, 8th ed.; Iowa State University Press: Ames, IA, USA, 1989. [Google Scholar]
- Kuehl, R. Design of Experiments: Statistical Principals of Research Design and Analysis; Duxbury Press: Belmont, CA, USA, 2000. [Google Scholar]
- Rayner, J.C.W.; Livingston, G.C., Jr. Orthogonal contrasts for both balanced and unbalanced designs and both ordered and unordered treatments. Stat. Neerl. 2023, 78, 68–78. [Google Scholar] [CrossRef]
- Rayner, J.C.W.; Livingston, G.C., Jr. ANOVA F orthonormal contrasts for ordered treatments in two-factor fixed effects ANOVAs. Stats 2023, 6, 920–930. [Google Scholar] [CrossRef]
- Livingston, G.C., Jr.; Rayner, J.C.W. F contrasts in two-factor balanced fixed effects ANOVAS. 2024; work in progress. [Google Scholar]
- Rayner, J.C.W.; Livingston, G.C., Jr. An Introduction to Cochran–Mantel–Haenszel Testing and Nonparametric ANOVA; Wiley: Chichester, UK, 2023. [Google Scholar]
- Higgins, J.J. An Introduction to Modern Nonparametric Statistics; Duxbury Press: Belmont, CA, USA, 2004. [Google Scholar]
Disclaimer/Publisher’s Note: The statements, opinions and data contained in all publications are solely those of the individual author(s) and contributor(s) and not of MDPI and/or the editor(s). MDPI and/or the editor(s) disclaim responsibility for any injury to people or property resulting from any ideas, methods, instructions or products referred to in the content. |
© 2024 by the authors. Licensee MDPI, Basel, Switzerland. This article is an open access article distributed under the terms and conditions of the Creative Commons Attribution (CC BY) license (https://creativecommons.org/licenses/by/4.0/).