Abstract
Global scenarios of organizations show investments wasted in projects with poor performances in more than 11 percent of cases, according to the Project Management Institute. This research aims to guide organizations in assertively investing in the right pertinent factors to improve project success rates and speed up project management maturity at a higher accuracy level using statistical predictions. Challenging existing drivers for project management maturity models and expanding their current practical view will be the result of a quantitative methodology based on a survey supported by data collection targeting the project management community in Brazil. The originality and value of this research are in contributing to the development of new project maturity models statistically supported by the increasing rate of maturity accuracy, which can be continually improved by confident data input into the model. The results show a high correlation between the performance measurement system and the project success rate associated with project management maturity. In addition, this research contemplates the relationship between organizational culture, business type, and project management office and project management maturity.
1. Introduction
With the radical changes in the global scenario for organizations driven by new technologies and professional skills, investments wasted on poor project performance have corresponded to an average of 11.4 percent, based on recent surveys. The beginning of a new decade is ushering in a world full of complex issues that require organizational leaders to reimagine not just the nature of work, but how it is completed [1]. According to the Project Management Institute (PMI), executive leaders have identified the most important factors for achieving project success in the future, including organizational agility (35%), choosing the right technologies to invest in (32%), and securing relevant skills (31%).
Global economic scenarios and competitive challenges are forcing organizations to accomplish projects with higher success rates as a result of process effectiveness, technologies, policies, standards, educational programs, knowledge management, and more predictable environments. Although the theory of project management (PM) offers resources for this target, concepts and definitions of project success vary greatly and are usually beyond known boundaries within the literature while evidencing a wide diversity of opinions and approaches [2,3].
Since 2013, the PMI has intensified the research to improve the definition of success and the impact factors compatible with the complex business world. In 2018, the PMI performed a global survey with 5702 respondents: 4455 PM practitioners, 447 senior executives, and 800 PM officers. The industries included construction, energy, government, healthcare, information technology (IT), manufacturing, and telecommunications. The respondents spanned North America, Asia Pacific, Europe, Middle East and Africa, Latin America, and the Caribbean. The survey revealed the three main top drivers for project success that should be considered by organizations: investing in actively engaged executive sponsors; avoiding scope creep or uncontrollable changes to a project’s scope; and maturing value delivery capabilities, all of which focus on organizational agility. Furthermore, 26% of all respondents reported that inadequate sponsor support is the primary cause of failed projects [4]. This factor had not been considered as the main dimension in the project management maturity models (PMMMs) reported in the literature. The other factors have been covered indirectly or with different denominations [5]. Another survey carried out in 2017 by the PMI showed that organizations wasted an average of BRL 97 million out of every BRL 1 billion invested due to poor project performance, representing a 20-percent decline compared to 2016. This annual survey of PM practitioners and leaders, compounded with the global feedback of 3234 professionals of different levels within organizations from a variety of industries, strives to advance the conversation around the value of PM, and the findings’ links with lessons learned and the improvement benefit from PMM in the proven project, program, or portfolio management practices [6].
The concept of project success has different approaches and understandings in the literature. Sometimes, it is difficult to tell it from project failure. It can be seen as a multidimensional construct: management, business objective achievements, and strategic oriented, or simply defined as what the project should deliver. Furthermore, a project’s success within organizations depends intensively on the availability of high-performing individuals [3,7,8].
Maturity in PM is an organizational condition associated with successful projects: it allows for success to be repeated [9,10,11]. The PMM of organizations attains favorable conditions that will help projects succeed by using models. PMMMs have been developed since the 1980s to provide appropriate approaches to continuous improvement, similar to total quality management [12]. The first PMMM was the Capability Maturity Model Integration (CMMI) developed at Carnegie Mellon University, from 1986 to 1993. The majority of concepts was based on questionnaires and several dimensions under analysis to perform assessments. A survey performed by 86 project professionals from various service and manufacturing organizations revealed that performance measurement systems (PMSs) and project management maturity (PMM) are significantly correlated with business performance and project success. With all relevant facts confirmed in the literature and surveys, this research focuses on the direct relationship that PMM and PM have to project success concepts [13].
This paper arose from the evidence of PMM’s poor benchmark statistics of 60% in immaturity experienced by several companies [4,5]. Another strong motivation for this study is the correlation between PMM and PMS [11,13].
Figure 1 presents the most frequent dimensions considered by PMMM.
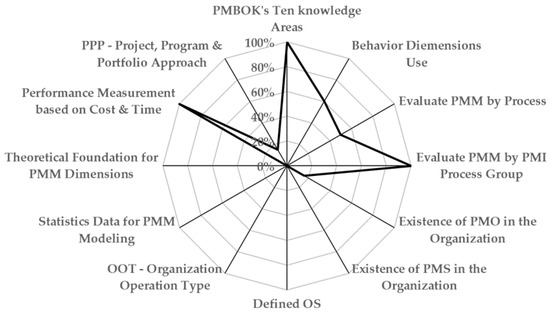
Figure 1.
Dimension of project management maturity models.
This paper also describes the behavior of PMM and project success in manufacturing and service organizations, represented by the organization operation type (OOT) variable, in terms of the existence of a project management office (PMO) and a defined organizational structure (OS), which bring additional scientific contributions to rigorous statistical criteria.
This paper contemplates analysis based on PMI annual surveys but adds new surveys in the 2020s. The paper is organized as follows: The Introduction is presented in Section 1, also including the motivation of this study. The Background is presented in Section 2, the Methodology in Section 3, the Results and Discussions in Section 4, and the Conclusion and Recommendations in Section 5.
2. Background
This section presents a literature review covering concepts and theoretical foundations of project management maturity models.
2.1. Project Management Maturity
Organizations have been challenged by growing competition to innovate processes, products, and services, as well as reach faster responses to the market and customers. They have responded to these challenges with management flexibility and strategic choices for their projects [14]. PM and PMM are properly inserted in this present scenario when the effects of a company’s project management system and management’s ability to execute successful projects are recognized in practice and the concept of “maturity” in PM might vary from one author to another [10].
In general, PMM is an organizational condition that facilitates the success of projects and is measured by using models based on PM areas of knowledge and several distinct organizational dimensions. A PMM assessment should enable an organization to identify key opportunities for PM improvements, thereby increasing its number of successful projects [15,16].
2.2. Project Management Maturity Models
The concepts of PMM assessment models originated from the fundamentals of total quality due to their direct relation to continuous improvement culture and the involvement of senior management [12,17]. Since the 1990s, several maturity models have been developed, and one of the first on the market was the Capability Maturity Model for software project application, developed at Carnegie Mellon University. This model has been continuously improved upon and updated and is now referred to as Capability Maturity Model Integration (CMMI). Similar to the majority of PMMM, CMMI consists of five levels, sequentially nominated as Initial, Repeatable, Defined, Managed, and Optimizing [18].
The Berkeley Model is based on the Project Management Body of Knowledge (PMBOK), the PMI’s best practices guide, and considers five levels of maturity: Ad Hoc, Defined, Managed, Integrated, and Sustained. An assessment based on this model focuses on financial and organizational effectiveness, project performance, commitment to continuous improvement, and evaluating maturity by processes and project phases [19].
The Organizational Project Management Maturity Model (OPM3) from PMI became a globally recognized model and the best-practice standard for assessing and developing capabilities in portfolio management, program management, and project management. The OPM3 helps organizations develop a road map to improve performance and covers the domains of organizational PM, the systematic management of projects, programs, and portfolios aligned with the achievement of strategic goals. This model offers the key to organizational project management with three interlocking elements: Knowledge, Assessment, and Improvement, and it has four levels of maturity: Standardize, Measure, Control, and Continuously Improve [20].
PMI’s former president, Kent Crawford founded PM Solutions, a PM consultant company, in late 1996. PM Solutions Maturity Model considers five levels of maturity: Initial Process, Structured Process and Standard, Organizational Standard and Institutionalized Process, Managed Process, and Optimizing Process [21].
Projects in Controlled Environments (PRINCE2) is a structured method for PM [22]. The PRINCE2 Maturity Model (P2MM) is another framework in which organizations can create improvement plans oriented by measurable outcomes and the industry’s best practices. The P2MM is evolving into the Portfolio, Program, and Project Management Maturity Model (P3M3), both standards owned by the United Kingdom’s Office of Government Commerce. The P2MM has five maturity levels: Awareness of the Process, Repeatable Process, Defined Process, Managed Process, and Optimized Process [22].
The Kerzner Project Management Maturity Model (KPMMM) is also based on the PMBOK’s knowledge areas and the five phases of a project’s life cycle, which contemplates five levels of maturity: Embryonic, Executive Management Acceptance, Line Management Acceptance, Growth, and Maturity [10,11].
From the literature researched, most of the PMMM contemplates the concepts of PMBOK’s knowledge areas, project life cycle phases, and behavioral dimensions. One common weak point of the models is the fact that there is no solid statistical basis to sustain the concept of the model and the accuracy throughout its use.
Table 1 summarizes the PMMM presented in this section.

Table 1.
Project management maturity models.
Most PMMMs are five-level models, except for the four-level OPM3. The models have slight differences in conceptualization, such as the delineation of the PMM framework, the definition of maturity, the coverage of PM knowledge areas, and their scope. In addition, only 20% of the PMMM considers a performance measurement system (PMS), the existence of a project management office (PMO), and the organization operation type (OOT) as drivers for project success, and it is only improved upon when organizations perceive the driving forces [5,21,23,24].
2.3. Example of Project Management Maturity Model Application
Maturity models (MMs) are applied in different sectors. However, the experience from practical applications of MMs are scarcely described [25]. MMs enable organizations to elevate and benchmark performance across a range of critical business capabilities, including product development, service excellence, supplier management, and cybersecurity.
Table 2 presents data for two companies assessed by CMMI and certified as levels 1 and 2 and level 5 of PMM [26].

Table 2.
PMM assessment regarding CMMI [26].
The process starts with defining a team composed of one sponsor, one appraisal leader, and internal stakeholders to be interviewed or to answer questionnaires. Initially, the CMMI model is explained to the team and made clear that it contains a view specifically for services and offers new features, including an online model viewer for accelerated adoption. The next step is to gauge the organization by using an appraisal, which is an activity to identify strengths and weaknesses of the organization’s processes and to examine how closely the processes relate to CMMI best practices. The final result will reveal the maturity level and the process gaps compared with the CMMI’s model. An action plan is developed by the organization to improve the process and reach an upper maturity level.
In the case of IBM, level 5 of PMM means that the organization has reached the benchmarking level where continuous improvement is the current practice to keep this level and improve more and more. At this level, a common language is achieved within the organization, a process is in place and documented for following, a PM methodology is institutionalized and consistent for the entire organization, and a continuous improvement and benchmark cycle is underway. The main benefits of this effort are to gain customer loyalty, develop resiliency, increase time to market, improve quality, and reduce costs.
In the case of McKinsey, levels 1 and 2 mean the company is still investing to have a common language and process in place, but a single PM methodology is not available within the organization. Another interesting CMMI case is the company Cognizant, a leading provider of information technology (IT), which is also at level 5 maturity and has been showing lots of strengths. Cognizant has decided to focus its strategy on cost reduction, operational efficiencies, IT alignment to the business, and business transformation and innovation. The company monitors its performance based on the following practices: proactively measuring performance against goals on an ongoing basis; using prediction models to ensure proactive achievement of business objectives; conducting audits to enable business assurance and disseminating best practices; implementing a structured framework/platform support to inculcate a culture of best-practice adoption across the organization; and applying process automation tools and training. Sustaining a CMMI maturity rating of level 5 has strengthened employee confidence. Specifically, the best practices that have been built within the organization through a robust process and platform capabilities have helped employees consistently exceed meeting customer demands.
Depending on the PMMM, the number of levels may vary from 4 to 5, and each level has a specific description of the organization’s condition to characterize it. The following sections explain the main PMMMs available and show how the evaluation of maturity level is obtained. Most of them are not statistically based and originate from practical experience and observations. This article brings the necessary statistical basis from consistent assessments.
2.4. Kerzner Project Management Maturity Model
KPMMM was selected for this research due to its reputation, consolidation, and practical application. This model consists of five levels, sequentially nominated and represented by a staircase, where each step represents a level of the PMM. Most of the PMM models use questionnaires for assessments. KPMMM has a total of 181 questions to measure the PMM. KPMMM’s common statement for all questions is: “Does my company recognize the need for project management?” and the respondent must choose an answer according to the following scale: −3 for “strongly disagree”, −2 for “disagree”, −1 for “slightly disagree”, 0 for “no opinion”, +1 for “slightly agree”, +2 for “agree”, and +3 for “strongly agree”. Considering the −3 to +3 scores for each of the questions of the correspondent level, the maximum score per level of PMM can reach +12. The level requirements are completed when at least a +6 score is reached per level [11,27].
The reason KPMMM’s original scale is from −3 to +3 is not explained, unlike the conventional and consolidated scales, such as the Likert scale or the Saaty scale [28]. It is also subjective to consider all requirements accomplished for the maturity level when the obtained result for the level is greater than or equal to +6. KPMMM’s users report overlaps between maturity levels, which may cause a lack of accuracy in defining the level completed by the organization. To mitigate this model’s issue and bring a more scientific contribution to the PM community, fuzzy logic was applied to PMM-level decisions to augment the accuracy of this model [29].
Example of KPMMM in Practice
KPMMM’s questionnaire has twenty questions, with four questions assigned to each of the five maturity levels [11]. Since the original scale of KPMMM ranges from −3 to +3, the maximum score for a single level is equal to 12. Table 3 presents an example of a real application of KPMMM.

Table 3.
Example of KPMMM application.
In the example presented in Table 3, the three first levels of KPMMM are satisfied with scores greater than +6. The organization is on the road to achieving level 4. Level 3 is the higher level with a score equal to or greater than +6, and the application of KPMMM results in the identification of “Line Management” as the maturity level for this organization. According to KPMMM theory, the company may need up to two more years to increase its maturity level [10].
2.5. Organization Performance Measurement
Organization performance measurement is a continuous process of defining baselines, targets, sets of indicators, and dashboards that can rapidly diagnose the organization and allow for fast actions. Table 4 presents different definitions for PMS, in chronological order.

Table 4.
Definitions for performance measurement systems.
The purpose of a PMS is to measure improvements and failures, analyze human behavior for training needs, validate rewards, and career development. The PMS is considered the heart of any organizational performance management and is a main variable to be researched in this study due to its impact on project success [29]. A survey with 86 PM professionals from various North American service and manufacturing organizations revealed that project success and PMM are significantly related to business performance [13]. This information concerns multiple dimensions of performance for distinct users at a hierarchical level, which allows managers to evaluate their teams’ performance, activities, and organizational processes. The definition of PMS also varies in the literature and its usual characteristics can be grouped into four categories: purpose of the system, performance measures, activities, and structural characteristics.
OOT, OS, and PMO are three influential factors in project success. However, they are not the main focus of this study since PMS brings a contribution with more impact on the PM community.
PMO is an organizational entity responsible for coordinating and centralizing PM activities. It is also responsible for generally supporting PM methodologies and leveraging the PM culture across the organization, and is always supported by the top management [37]. Unfortunately, little research has been conducted on the relationship between PMO and an organization’s PMS, or their influence on PMM, a fact that brings more value to this research. Despite the time necessary to move from one maturity level to another, PMM models associated with the business cycle model have practical and useful constructs to help the PMO stay aligned with business needs and, as a consequence, accelerate the organization’s PMM [38].
OS is an environmental factor in organizations and affects the culture, resource availability, and project team development. OS can be classified as “functional”, “matrix”, or “project-based” [37]. It is widely recognized that organizational culture has an impact on organizational and project performance [39]. OS also influences PMO deployments and consolidation in PMM as a consequence [14,40,41].
Organizations can be divided into two broad categories: manufacturing and services, posing unique challenges for the operation’s function. OOT is a variable that represents these categories, consisting of a hypothesis of its correlation with PMM and project success, and is yet to be tested. The literature reveals that it is rarely explored. The services sector is expanding very rapidly, and the challenges for effective management differ from the challenges manufacturing faces. The usual tools and techniques in manufacturing organizations are suggested to be applied to those that are in the service sector [41].
2.6. Figueiredo Performance Measurement Model
The Figueiredo Performance Measurement Model (FPMM) was developed based on 11 desired attributes (DAs) and 63 observed variables (OVs) [34]. The FPMM was chosen by the contemporaneous concepts contemplated in the model structure. Table 5 presents FPMM’s DAs, OVs, and some concepts according to the PM’s literature. These attributes are all measurable in practice and can be statistically treated.

Table 5.
Figueiredo Performance Measurement Model.
This article brings an approach and a novel for future PMMM development once these dimensions can be added and analyzed, enhancing the model and avoiding observations or personal feelings of the influencing factors.
3. Materials and Method
An exploratory and descriptive web-based survey was performed in two phases to assure a higher response rate and to raise the credibility of the data [49]. Additionally, leveraging the influence of the PMI Sao Paulo Chapter, in Brazil, a relevant number of complimentary messages to the PM community was also sent. The first phase of the survey was carried out using KPMMM for PMM measurement, and the second phase used FPMM for PMS. For additional investigation, specific questions about PMO, OS, and OOT were also included. Figure 2 presents the methodological workflow.
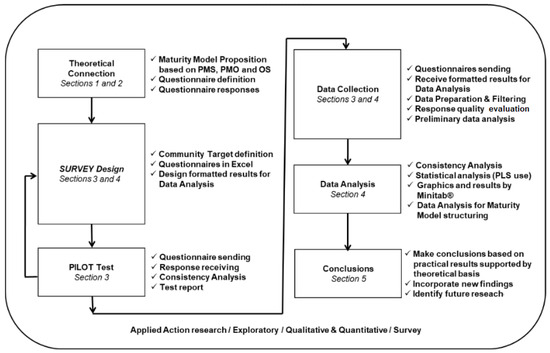
Figure 2.
Methodological workflow.
A total of 101 valid responses were obtained out of more than 250; thus, this sample size may be considered acceptable, according to the theory of Multivariate Analysis [50]. This survey was performed in 2010, but the results from later surveys were also used in this paper to ensure the consistency of the statistical data while providing a baseline for new and future PMM model proposals.
Partial least squares (PLS) is the statistical method used for regression and dimensionality reduction chosen to be applied in this research. It is often compared to other similar statistical tools such as Principal Component Analysis (PCA) and multiple linear regression (MLR). Principal Component Analysis (PCA) is primarily used for dimensionality reduction and data exploration, which identifies linear combinations of variables (principal components) that capture the maximum variance in the data. PCA is an unsupervised method and does not consider the relationship between predictor variables and the response variable, but it is useful for reducing multicollinearity, identifying important variables, and visualizing high-dimensional data. On the other hand, MLR is a widely used method for predicting a continuous response variable based on multiple predictor variables and assumes a linear relationship between the predictors and the response. MLR estimates the coefficients of the predictor variables to minimize the sum of squared differences between the observed and predicted responses. It is a supervised method and requires a clear distinction between predictor and response variables. PLS combines elements of both PCA and MLR. It is useful when dealing with high-dimensional datasets, multicollinearity, and situations where the number of predictors is larger than the number of observations. PLS also identifies a set of latent variables (components) that capture the maximum covariance between the predictor variables and response. Unlike PCA, PLS considers the relationship between the predictors and responses, making it suitable for both regression and classification tasks. In addition, PLS can handle situations with collinear predictors and works well when predictors have complex interactions. In summary, PLS can handle multicollinearity, identify important predictors, and model the relationship between the predictors and responses, making it a versatile tool in various statistical analyses [51].
Predictive accuracy is a measure used to evaluate the performance of a predictive model in estimating or forecasting outcomes. It assesses how well the model predicts the values of the response variable for new, unseen data. There are several commonly used metrics to measure predictive accuracy, as shown in Table 6.

Table 6.
Predictive accuracy metrics.
It is important to note that the choice of the appropriate predictive accuracy metric depends on the specific context, the type of problem (regression or classification), and the evaluation criteria that are most relevant to the application. Evaluating predictive accuracy using multiple metrics can provide a more comprehensive understanding of the model’s performance. Additionally, it is crucial to consider other factors such as the nature of the data, the specific objectives of the analysis, and the limitations of the chosen model [50,51]. As this paper will be the basis of the novel in terms of the project maturity model, one of these prediction metrics will be used to bring robustness to the future model and paper. For this paper, only comparisons with the PMM results from consolidated models in the literature, like the Kerzner model, were considered.
Version 17 of Software Minitab [52] was used for all statistical data handling, processing, and the final results obtained. The survey was web-based with data treatment conducted using electronic spreadsheets.
4. Results and Discussion
Based on the survey results, a quantitative analysis was performed. This analysis is on 101 Brazilian companies and includes correlations, regressions, and predictions.
4.1. Respondents Profile
Figure 3 presents the organization operation type (OOT) and the demographics of the respondents. Most respondents are from Brazilian services companies with 100 or more employees.

Figure 3.
Organization operation type and demographics of survey’s respondents.
Figure 4 presents the line of business of the respondents. Information technology and telecommunications are the leading lines, with almost 50%.
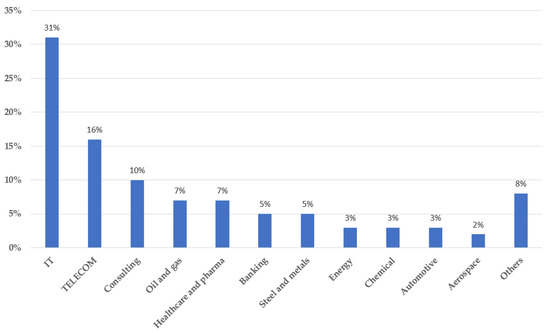
Figure 4.
Line of business of survey’s respondents.
Most of the respondents had one to five years of experience in PM: 56%. Additionally, 24% of respondents had 6 to 10 years of experience, 15% had 11 to 20 years of experience, and only 5% had more than 20 years of experience. The survey also investigated the number of companies with existing and operating PMO, resulting in 52% positive, despite 92% of them being incipient, with less than five years of implementation. In terms of the OS, the survey revealed 46% as functional; 23% in the weak matrix (without PMO); 21% in the strong matrix (with PMO); and only 10% were project-based. Of the respondents’ occupations, 51% were project or functional managers, 21% were project coordinators or leaders, 7% were operation directors, and there were 21% in other occupations.
4.2. Results of the Project Management Maturity Assessment
The survey based on KPMMM resulted that the PMM of 53% of the companies were Embryonic (Level 1), 7% were in Line Management Acceptance (Level 2), 10% in Executive Management Acceptance (Level 3), 8% in Growth (Level 4), and 22% had Maturity (Level 5). This reflects that 60% of the organizations had no single language, no single process, and no singular PM methodology in place in 2010. The PM maturity percentage obtained in Brazil was considered high in 2010 and was explained by the profile of respondents, and the survey was focused on the PM community [5]. Furthermore, recent assessments performed by the PMI in 2019 showed that only 13% of the companies were evaluated highly in the maturity level at a global level [53].
Agility is a relevant driver for PMM [22] and also for organizational performance [32,34]. The strength of Multivariate Analysis is a way of ordering a large number of alternatives and finding those that have statistical significance, being essential for considering practical interpretations [50].
The PLS regression, basic statistical tools, and computer programs are used in this paper to perform a Residual Analysis and verify whether the data on Maturity and PMS are within the acceptable limits from the set of responses obtained. This analysis is the basis for structuring an innovative model and must be based on the lowest number of questions for the evaluation questionnaire without missing meaning and a practical sense of relevance. The results are within the allowable limits, as presented in Figure 5 using four principal components.
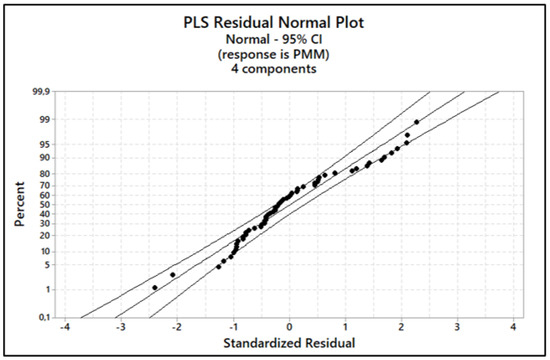
Figure 5.
Data Residual Analysis (Software Minitab Version 17).
Principal Component Analysis (PCA) was also performed, resulting in an explanation rate of 82% and an eigenvalue equal to 0.88. With all this conducted, PLS was applied to the database obtained from the survey, and the results are presented in Figure 6.
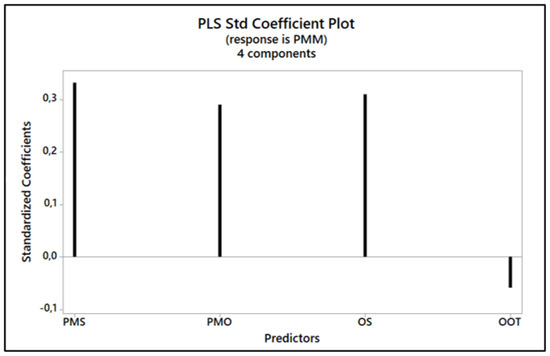
Figure 6.
Key predictors (Software Minitab Version 17).
The standardized coefficients represent the standardized effect of each predictor variable in this regression model. They allow for comparing the magnitude of the effects of different predictors, as they are expressed in terms of standard deviations. These coefficients were derived based on the three principal components, which ensure an explanation rate of 82% and an eigenvalue of 0.88. Principal components aim to reduce the dimensionality of the dataset. An explanation rate of 82% suggests that the three principal components explain 82% of the total variance in the data. An eigenvalue of 0.88 is associated with one of the principal components and indicates the amount of conflict explained by that component. A higher eigenvalue suggests a more significant contribution to the overall conflict [54].
The resulting plot shown in Figure 6 visually represents the PLS coefficients for each predictor variable, allowing for a quick comparison of their magnitudes. It can be further customized by adjusting the labeling and colors or adding additional visual elements based on the requirements. The standard coefficients correspond to the intensity and influence of the respective predictor on PMM and project success. It can be observed that the predictor OOT is negative and appears to be negligible and could be eliminated when measuring PMM.
To achieve more robustness for OOT predictor elimination, the authors decided do use dendrograms. They are hierarchical-tree-like structures commonly used in data analysis and visualization to show the clustering relationships among objects or variables. They have practical applications in various fields, as shown in Table 7.

Table 7.
Dendrogram best practices.
Dendrograms are powerful tools for exploring and visualizing clustering relationships in data. They assist in understanding the hierarchical structure, identifying groups or clusters, and guiding further analysis and interpretation in various domains. Figure 7 shows the dendrogram for PMM’s predictors.
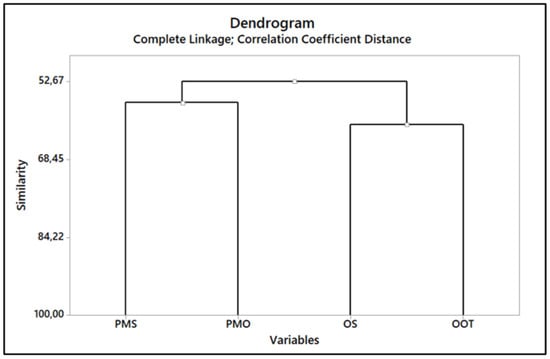
Figure 7.
Dendrogram for PMS, PMO, OS, and OOT Similarity Analysis (Software Minitab Version 17).
In a dendrogram, the clustering and proximity of two similar variables can provide insights into their relationship and similarity. When two similar variables are grouped together in a dendrogram, this indicates that they have similar patterns or characteristics based on the chosen distance or similarity measure [55].
The OS of manufacturing and services companies can have some similarities, as both aim to efficiently manage resources, coordinate activities, and achieve organizational goals, for instance, Functional Departments, Hierarchical Levels, Production or Service Delivery Units, Cross-Functional Teams, Support Functions, Communication and Reporting Channels, and Decision-Making Authority. It is important to note that each organization may have its unique structure based on its specific industry, size, culture, and strategic objectives. The organizational structure should align with the company’s goals and operational needs, and the external environment it operates [56].
Clustering is a popular unsupervised learning technique used to group similar data points into clusters based on their characteristics or similarities. Various clustering methods are available, each with strengths, weaknesses, and suitable use cases. Table 8 shows common clustering methods and makes a comparison between them to justify the currently chosen one.

Table 8.
Clustering methods.
If the number of clusters is known and the data have well-separated clusters, K-Means is efficient and can be a good choice. If there is no prior knowledge of the number of clusters and one wants to visualize the clustering process, hierarchical clustering might be suitable. DBSCAN is useful when dealing with noisy data and clusters with arbitrary shapes, but parameter tuning can be challenging. GMM is helpful when the data can be modeled as a mixture of Gaussian distributions and soft clustering is desired. Mean shift is useful when the number of clusters is not known beforehand and the data have irregular shapes. Ultimately, the choice of the clustering method depends on the nature of your data, the number of clusters you want to identify, and the specific requirements of your problem. It is often a good idea to try multiple methods and compare their results to find the best fit for your particular use case [57].
Aggregation and hierarchical clustering are two distinct approaches in data analysis and pattern recognition. Aggregation involves combining individual data points based on specific rules or criteria to create a simplified representation of the data. It is commonly used in data mining, machine learning, and statistical analysis to reveal overall patterns or trends. Aggregated data are useful for gaining insights into general trends. On the other hand, hierarchical clustering builds a tree-like representation (dendrogram) of data points based on their similarity. It creates a hierarchical structure of clusters, combining smaller clusters into larger ones until all data points form a single cluster. The dendrogram allows users to determine the appropriate number of clusters by cutting the tree at a specific level, providing a more detailed understanding of the data’s hierarchical structure.
In summary, aggregation summarizes data points into a simplified representation, while hierarchical clustering groups data points into nested clusters, revealing a more detailed structure. The choice between these methods depends on the specific goals of the analysis and the level of detail required to understand the underlying patterns in the data [58].
The results of the negative magnitude of PLS predictor OOT standard coefficients shown in Figure 6, the similarity with the predictor OS shown in Figure 7, and the practical contextualization of OOT in PMM allow us to arrive at a conclusion to safely eliminate the predictor OOT without any damage to the structure of any future PMM model.
With this decision, a new Residual Analysis was carried out to certify that the results remained within acceptable limits, as presented in Figure 8.
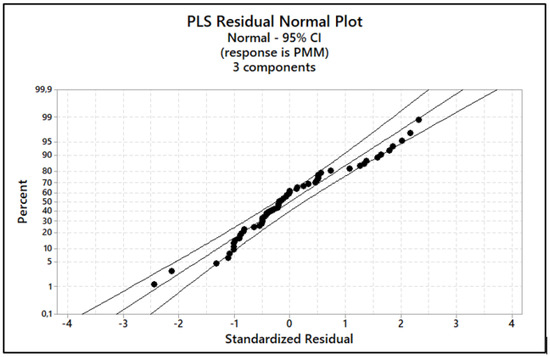
Figure 8.
Residual Data Analysis after OOT removal (Software Minitab Version 17).
Obtaining a p-value of 0.001 ensures a statistical significance level or confidence level of 95%, while a Pearson’s coefficient of 0.412 indicates a positive correlation, maintaining an explanation rate of 82%.
Figure 9 presents the Standard Coefficient Plot obtained with Software Minitab regarding the three principal components and the elimination of the predictor OOT.
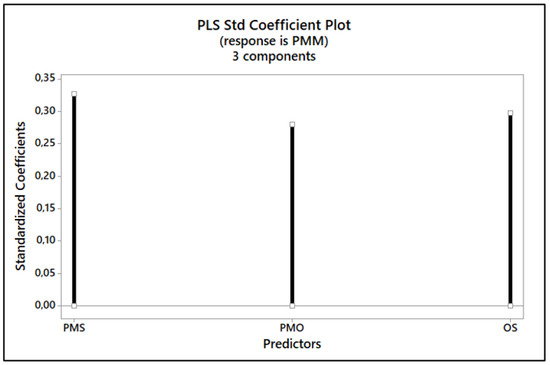
Figure 9.
Key predictors after OOT elimination (Software Minitab Version 17).
PMS, PMO, and OS significantly impact PMM and project success. The dendrogram, as shown in Figure 7, assures the predictor OOT can be eliminated due to the 61.40% similarity with OS, which will correspond to a simpler questionnaire to measure PMM. A component analysis working with three principal components provides an explanation rate of 72%, an eigenvalue equal to 0.95, and a p-value of 0.001, ensuring a statistical significance level of 95% and a positive correlation with a Pearson’s coefficient equal to 0.412. This represents a positive contribution and an accelerated impact on the PMM process evolution leveraged by PMS, PMO, and OS.
The results confirm that PMS is still predominant with a high correlation between PMM and project success. The other factors (PMO and OS) are also important but are not the target of this research, even though this statistically proven finding can contribute to future research as a consideration for PMM drivers and project success.
5. Conclusions and Recommendations
The recent PMI surveys show that the PM environment will change drastically and rapidly over the next five years, guided by technology, change management, agile methodologies, design thinking, DevOps, and hybrid PM, which connect the importance of PMS in project success [1]. In addition, the PMI 2021 survey describes the significant changes in the business ecosystem over the past 12 months compared to the 12 months prior in certain areas that have a direct impact on project success, as presented in Figure 10 [59].
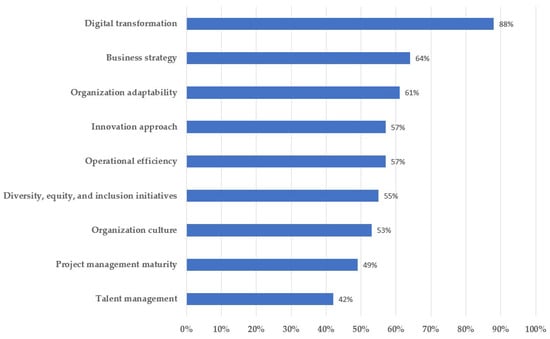
Figure 10.
Significant changes in the new organizational ecosystem.
Despite the pandemic, this survey reveals an advance in PMM from 41% to 57% in companies that combine traditional and new approaches to working by proposing all possible methods to solve current problems, including methods that were effective in the past, recently called gymnastic enterprise. Furthermore, despite the capital project cuts during this adverse period, the original goals and business intentions were accomplished due to the increase in project success rates. The drivers researched by PMI have shown that companies are empowering their people to work smarter by mastering different ways of working, such as agile, predictive, or hybrid approaches, or using a range of technologies. The consequence is an increase in employee skills, which requires more investments in leadership, communication, and business acumen competencies to sustain PMM and project success rates.
It is statistically proven by the survey’s results that organizations from the services and manufacturing sectors must invest in PMS to improve PMM and project success rates not only in engineering projects but all kinds of projects.
The greater an organization’s PMM, the greater the positive impact on the project’s overall performance and success [60]. This is positive, but this is not compatible with the current and existing models in the literature. This suggests that models must change to suit the reality of PM. For this purpose, it is strongly recommended that PMS be definitively included as a dimension in PMM models [61].
PMS can still be divided into eleven dimensions and sixty-three observed variables, allowing for another survey to be composed and to determine the individual influence of each factor in PMM and project success, as well as defining new drivers for a future revolutionary PMM model, carrying along with it a strong scientific contribution to the PM community and the literature [34]. Agility is the watchword all over the world at the moment, and it is one relevant dimension of the Figueiredo model. The question that will soon come up is how can organizations progress in PMM or project success without an active PMS in place? The present reality brings agility and high performance as key drivers to propel project success in organizations, despite the fact that PMO and OS have also been considered relevant factors to speed up PMM and project success.
PMMM reveals a lot of distinct conceptual bases, and most of them have no statistical foundation. With new upcoming innovation fronts and enterprise ecosystems, PMMM is being overlapped and rapidly discontinued unless the way of structuring them changes immediately. In the literature, hybrid methodologies can be seen emerging soon, crossing agile and waterfall approaches, which creates a real revolution in the project management scenario. The authors’ survey results demonstrated a positive correlation with a p-value range from 0.001 to 0.05 and correspondent high-intensity influence among Performance Measurement Systems (PMSs), Project Management Offices (PMOs), and Organizational Structures (OSs) as predictors for PMM and project success. As OOT was statistically eliminated in this study, it adds a valuable piece of additional knowledge to the literature and project management practices. The benefit of this point is the reduction in the number of questions for future PMM models.
The PM world is changing so fast, and many different approaches are to come as artificial intelligence influences PM control and actions. Hybrid methodologies and several lean initiatives are what leverage companies. The impact of technologies like artificial intelligence will be high and in many ways, organizations will make changes to PM concerning the variety of titles, executed through a variety of approaches, and unwaveringly focused on delivering financial and societal value. This is the future, nominated “The Project Economy”.
This research is limited to Brazilian companies and cannot be generalized for PM programs and portfolio management. For future research related to PMM, it is recommended to apply the Multi-Criteria Decision Analysis methodology to define the best model for improving project success [28]. Finally, as suggested by one of the anonymous reviewers, the authors began a new survey on PMM. Nevertheless, this will be the subject of future work.
Author Contributions
Conceptualization, H.J.C.d.S.; methodology, H.J.C.d.S., V.A.P.S. and C.E.S.d.S.; software, H.J.C.d.S.; validation, H.J.C.d.S., V.A.P.S. and C.E.S.d.S.; formal analysis, H.J.C.d.S., V.A.P.S. and C.E.S.d.S.; investigation, H.J.C.d.S.; resources, H.J.C.d.S., V.A.P.S. and C.E.S.d.S.; data curation, H.J.C.d.S., V.A.P.S. and C.E.S.d.S.; writing—original draft preparation, H.J.C.d.S. and V.A.P.S.; writing—review and editing, H.J.C.d.S., V.A.P.S. and C.E.S.d.S.; visualization, H.J.C.d.S., V.A.P.S. and C.E.S.d.S.; supervision, V.A.P.S. and C.E.S.d.S.; project administration, H.J.C.d.S., V.A.P.S. and C.E.S.d.S.; funding acquisition, not applicable. All authors have read and agreed to the published version of this manuscript.
Funding
This research received no external funding.
Institutional Review Board Statement
Not applicable.
Informed Consent Statement
Not applicable.
Data Availability Statement
Original data may be provided by the corresponding author upon request.
Acknowledgments
We gratefully acknowledge PMI Chapter Sao Paulo and PMI, and the anonymous reviewers for their valuable comments and suggestions.
Conflicts of Interest
The authors declare no conflict of interest.
Abbreviations
The following abbreviations are used in this manuscript:
| CMMI | Capability Maturity Model Integration |
| DA | Desirable Attribute |
| DBSCAN | Density-Based Spatial Clustering of Applications with Noise |
| FPMM | Figueiredo Performance Measurement Model |
| GMM | Gaussian Mixture Model |
| IT | Information Technology |
| KPMMM | Kerzner Project Management Maturity Model |
| MSE | Mean Square Error |
| OLS | Ordinary Least Squares |
| OOT | Organization Operation Type |
| OPM3 | Organizational Project Management Maturity Model |
| OS | Organizational Structure |
| OV | Observed Variable |
| P2MM | PRINCE2 Maturity Model |
| P3M3 | Portfolio, Program, and Project Management Maturity Model |
| PCR | Principal Component Regression |
| PLS | Partial Least Squares |
| PM | Project Management |
| PMBOK | Project Management Body of Knowledge |
| PMI | Project Management Institute |
| PMM | Project Management Maturity |
| PMMM | Project Management Maturity Model |
| PMO | Project Management Office |
| PMS | Performance Management System |
| PRINCE2 | Projects in Controlled Environments |
| RR | Ridge Regression |
References
- Future-Focused Culture. 2020. Available online: https://www.pmi.org/learning/thought-leadership/pulse/pulse-of-the-profession-2020# (accessed on 5 February 2023).
- McLeod, L.; Doolin, B.; MacDonnell, S.G. Perspective-based understanding of project success. Proj. Manag. J. 2012, 43, 68–86. [Google Scholar] [CrossRef]
- Ika, L.A. Project success as a topic in project management journals. Proj. Manag. J. 2011, 40, 16–19. [Google Scholar] [CrossRef]
- PMI’s Pulse of the Profession. 2018. Available online: https://www.pmi.org/-/media/pmi/documents/public/pdf/learning/thought-leadership/pulse/pulse-of-the-profession-2018.pdf (accessed on 5 February 2023).
- Celani de Souza, H.J. Sistema de avaliação de Maturidade em Gerenciamento de Projetos Fundamentado em Pesquisa Quantitativa. Ph.D. Thesis, Universidade Estadual Paulista, Guaratingueta, Brazil, 2011. Available online: http://hdl.handle.net/11449/103058 (accessed on 5 February 2023).
- PMI’s Pulse of the Profession. 2017. Available online: https://www.pmi.org/-/media/pmi/documents/public/pdf/learning/thought-leadership/pulse/pulse-of-the-profession-2017.pdf (accessed on 5 February 2023).
- Shao, J.M.R.; Turner, J.R. Measuring program success. Proj. Manag. J. 2012, 43, 37–49. [Google Scholar] [CrossRef]
- Shenhar, A.J.; Dvir, D.; Levy, O.; Maltz, A.C. Project success: A multidimensional strategic concept. Long Range Plann. 2001, 34, 699–725. [Google Scholar] [CrossRef]
- Andersen, E.S.; Jessen, S.A. Project maturity in organisations. Int. J. Proj. Manag. 2003, 21, 457–461. [Google Scholar] [CrossRef]
- Kerzner, H. Project Management Best Practices, 4th ed.; Wiley: Hoboken, NJ, USA, 2018. [Google Scholar]
- Kerzner, H. Project Management: A System Approach to Planning, Scheduling and Controlling, 13th ed.; Wiley: Hoboken, NJ, USA, 2022. [Google Scholar]
- Cooke-Davies, T.J.; Arzymanow, A. The maturity of project management in different industries: An investigation into variations between project management models. Int. J. Proj. Manag. 2003, 21, 471–478. [Google Scholar] [CrossRef]
- Yazici, H.J. The role of project management maturity and organizational culture in perceived performance. Proj. Manag. J. 2011, 40, 14–33. [Google Scholar] [CrossRef]
- Aubry, M.; Hobbs, B.; Thuillier, D. The contribution of the project management office to organisational performance. Int. J. Manag. Proj. Bus. 2009, 2, 141–148. [Google Scholar] [CrossRef]
- Ibbs, C.W.; Kwak, Y.H. Assessing project management maturity. Proj. Manag. J. 2000, 31, 32–43. [Google Scholar] [CrossRef]
- Jiang, J.J.; Gary Klein, G.; Hwang, H.; Huang, J.; Hung, S. Assessing project management maturity. Inf. Manag. 2004, 41, 279–288. [Google Scholar] [CrossRef]
- Pasian, B.; Sankaran, S.; Boydell, S. Project management maturity: A critical analysis of existing and emergent factors. Int. J. Manag. Proj. Bus. 2012, 5, 146–157. [Google Scholar] [CrossRef]
- Paulk, M.C. A history of the capability maturity model for software. Softw. Qual. Prof. 2009, 12, 5–19. [Google Scholar]
- Kwak, Y.H.; Ibbs, C.W. Project management process maturity (PM)2 model. J. Manag. Eng. 2002, 18, 150–155. [Google Scholar] [CrossRef]
- The Pathway to OPM3. 2004. Available online: https://www.pmi.org/learning/library/pathway-organizational-project-management-maturity-8221 (accessed on 5 February 2023).
- Crawford, J.K. Project Management Maturity Model, 4th ed.; CRC: Boca Raton, FL, USA, 2021. [Google Scholar]
- P3M3 | Portfolio, Programme, and Project Management Maturity Model | Axelos. 2004. Available online: https://www.axelos.com/for-organizations/p3m3 (accessed on 5 February 2023).
- Brookes, N.; Clark, R. Using maturity models to improve project management practice. In Proceedings of the 20th Annual Conference of the Production and Operations Management Society, Orlando, FL, USA, 1–4 May 2009; Available online: https://www.pomsmeetings.org/ConfProceedings/011/FullPapers/011-0288.pdf (accessed on 5 February 2023).
- Celani de Souza, H.J.; Salomon, V.A.P.; Sanches da Silva, C.E.; Aguiar, D.C. Project management maturity: An analysis with fuzzy expert systems. Braz. J. Prod. Oper. Manag. 2012, 9, 29–41. [Google Scholar] [CrossRef]
- Burmann, A.; Meister, S. Practical application of maturity models in healthcare: Findings from multiple digitalization case studies. In Proceedings of the 14th International Joint Conference on Biomedical Engineering Systems and Technologies, Online, 11–13 February 2021; Available online: https://www.scitepress.org/PublishedPapers/2021/102286/pdf/index.html (accessed on 5 February 2023).
- CMMI Institute. Available online: https://cmmiinstitute.com/pars (accessed on 28 March 2023).
- Kerzner, H. Using the Project Management Maturity Model: Strategic Planning for Project Management, 3rd ed.; Wiley: Hoboken, NJ, USA, 2019. [Google Scholar]
- Ortiz-Barrios, M.; Miranda-De la Hoz, C.; López-Meza, P.; Petrillo, A.; De Felice, F. A case of food supply chain management with AHP, DEMATEL, and TOPSIS. J. Multi-Criteria Decis. Anal. 2019, 27, 104–128. [Google Scholar] [CrossRef]
- Kumar, P.; Nirmala, R.; Mekoth, N. Relationship between performance management and organizational performance. Acme Intellects Int. J. Res. Manag. Soc. Sci. Technol. 2015, 9, 1–13. [Google Scholar]
- Schermerhorn, J.J.R.; Bachrach, D.G. Management, 14th ed.; Wiley: Hoboken, NJ, USA, 2020. [Google Scholar]
- Kaplan, R.S.; Norton, D.P. The balanced scorecard–Measures that drive performance. Harv. Bus. Rev. 1992, 70, 71–79. Available online: https://hbr.org/1992/01/the-balanced-scorecard-measures-that-drive-performance-2 (accessed on 5 February 2023).
- Ghalayini, A.M.; Noble, J.S.; Crowe, T.J. An integrated dynamic performance measurement system for improving manufacturing competitiveness. Int. J. Prod. Econ. 1997, 48, 207–225. [Google Scholar] [CrossRef]
- Nelly, A.; Richards, H.; Mills, J.; Platts, K.; Bourne, M. Designing performance measures: A structured approach. Int. J. Oper. Prod. Man. 1997, 17, 1131–1152. [Google Scholar] [CrossRef]
- Figueiredo, M.A.D.; Macedo-Soares, T.D.L.A.; Fuks, S.; Figueiredo, L.C. Definição de atributos desejáveis para auxiliar a auto-avaliação dos novos sistemas de medição de desempenho organizacional. Gest. Prod. 2005, 12, 305–315. [Google Scholar] [CrossRef]
- Zhang, Y.; Li, S. High performance work practices and firm performance: Evidence from the pharmaceutical industry in China. Int. J. Hum. Resour. Man. 2009, 11, 2331–2348. [Google Scholar] [CrossRef]
- Ricci, L. The Impact of Performance Management System Characteristics on Perceived Effectiveness of the System and Engagement. Master’s Thesis, San Jose State University, San Jose, CA, USA, 2016. [Google Scholar] [CrossRef]
- Project Management Institute, Inc. A Guide to the Project Management Body of Knowledge (PMBOK® Guide), 7th ed.; PMI: Newton Township, PA, USA, 2021. [Google Scholar]
- Kim, H.; Choi, I.; Lim, J.; Sung, S. Business Process-Organizational Structure (BP-OS) Performance measurement model and problem-solving guidelines for efficient organizational management in an ontact work environment. Sustainability 2022, 14, 14574. [Google Scholar] [CrossRef]
- Brown, C.J. A comprehensive organizational model for the effective management of project management. S. Afr. J. Bus. Manag. 2008, 39, 1–10. [Google Scholar] [CrossRef]
- Perry, M.P. Business Driven PMO Setup; J. Ross Publishing: Fort Lauderdale, FL, USA, 2009. [Google Scholar]
- Gupta, D.A.K. Growth and challenges in service sector: Literature review, classification and directions for future research. Int. J. Manag. Bus. Stud. 2012, 2, 55–58. Available online: http://www.ijmbs.com/22/akgupta.pdf (accessed on 5 February 2023).
- Garvin, D.A. Building a learning organization. Harv. Bus. Rev. 1993, 71, 78–91. Available online: https://hbr.org/1993/07/building-a-learning-organization (accessed on 5 February 2023). [PubMed]
- Bititci, U.S.; Turner, U.; Begemann, C. Dynamics of performance measurement systems. Int. J. Oper. Prod. Man. 2000, 20, 692–704. [Google Scholar] [CrossRef]
- Neely, A.; Mills, J.; Platts, K.; Richards, H. Performance measurement system design: Developing and testing a process-based approach. Int. J. Oper. Prod. Man. 2000, 20, 1119–1145. [Google Scholar] [CrossRef]
- Neely, A.; Adams, C.; Kennerley, M. The Performance Prism: The Scorecard for Measuring and Managing Business Success; Prentice Hall: London, UK, 2002. [Google Scholar]
- Dixon, J.R.; Nanni, J.A.J.; Vollmann, T.E. The New Performance Challenge: Measuring Operations for World-Class Competition; Dow Jones–Irwin: Homewood, IL, USA, 1990. [Google Scholar]
- Christopher, W.F.; Thor, C.G. Handbook for Productivity Measurement and Improvement; Productivity: Cambridge, MA, USA, 1993. [Google Scholar]
- Thor, C.G. Ten rules for building a measurement system. Qual. Product. Manag. 1993, 9, 7–10. [Google Scholar]
- Forza, C. Survey research in operations management: A process-based perspective. Int. J. Oper. Prod. Man. 2002, 22, 152–194. [Google Scholar] [CrossRef]
- Hair, J.J.F.; Black, W.C.; Babin, B.J.; Anderson, R.E. Multivariate Data Analysis, 8th ed.; Cengage: Andover, UK, 2019. [Google Scholar]
- Yeniay, O.; Goktas, A. A comparison of partial least squares regression with other prediction methods. Hacet. J. Math. Stat. 2002, 31, 99–111. [Google Scholar]
- Data Analysis, Statistical & Process Improvement Tools. 2023. Available online: https://www.minitab.com/en-us/ (accessed on 5 February 2023).
- The Future of Work. 2019. Available online: https://www.pmi.org/-/media/pmi/documents/public/pdf/learning/thought-leadership/pulse/pulse-of-the-profession-2019.pdf (accessed on 5 February 2023).
- Miao, J.; Forget, B.; Smith, K. Analysis of correlations and their impact on convergence rates in Monte Carlo eigenvalue simulations. Ann. Nucl. Energy 2016, 92, 81–95. [Google Scholar] [CrossRef]
- Everitt, B.S.; Dunn, G. Applied Multivariate Data Analysis; Wiley: New York, NY, USA, 1991. [Google Scholar]
- Ulaga, W.; Reinartz, W.J. Hybrid offerings: How manufacturing firms combine goods and services successfully. J. Market. 2011, 75, 5–23. [Google Scholar] [CrossRef]
- Dudoit, S.; Fridlyand, J. Bagging to improve the accuracy of a clustering procedure. Bioinformatics 2003, 19, 1090–1099. [Google Scholar] [CrossRef]
- Gelbard, R.; Goldman, O.; Israel Spiegler, I. Investigating diversity of clustering methods: An empirical comparison. Data Knowl. Eng. 2007, 63, 155–166. [Google Scholar] [CrossRef]
- Beyond Agility. 2021. Available online: https://www.pmi.org/learning/thought-leadership/pulse/pulse-of-the-profession-2021 (accessed on 5 February 2023).
- Berssaneti, F.T.; Carvalho, M.M. Identification of variables that impact project success in Brazilian companies. Int. J. Proj. Manag. 2015, 33, 638–649. [Google Scholar] [CrossRef]
- Success in Disruptive Times. 2021. Available online: https://www.pmi.org/-/media/pmi/documents/public/pdf/learning/thought-leadership/pulse/pulse-of-the-profession-2018.pdf (accessed on 5 February 2023).
Disclaimer/Publisher’s Note: The statements, opinions and data contained in all publications are solely those of the individual author(s) and contributor(s) and not of MDPI and/or the editor(s). MDPI and/or the editor(s) disclaim responsibility for any injury to people or property resulting from any ideas, methods, instructions or products referred to in the content. |
© 2023 by the authors. Licensee MDPI, Basel, Switzerland. This article is an open access article distributed under the terms and conditions of the Creative Commons Attribution (CC BY) license (https://creativecommons.org/licenses/by/4.0/).