
Using Small Area Estimation to Produce Official Statistics


Abstract
:1. Introduction
2. Survey Programs with Small Area Estimates
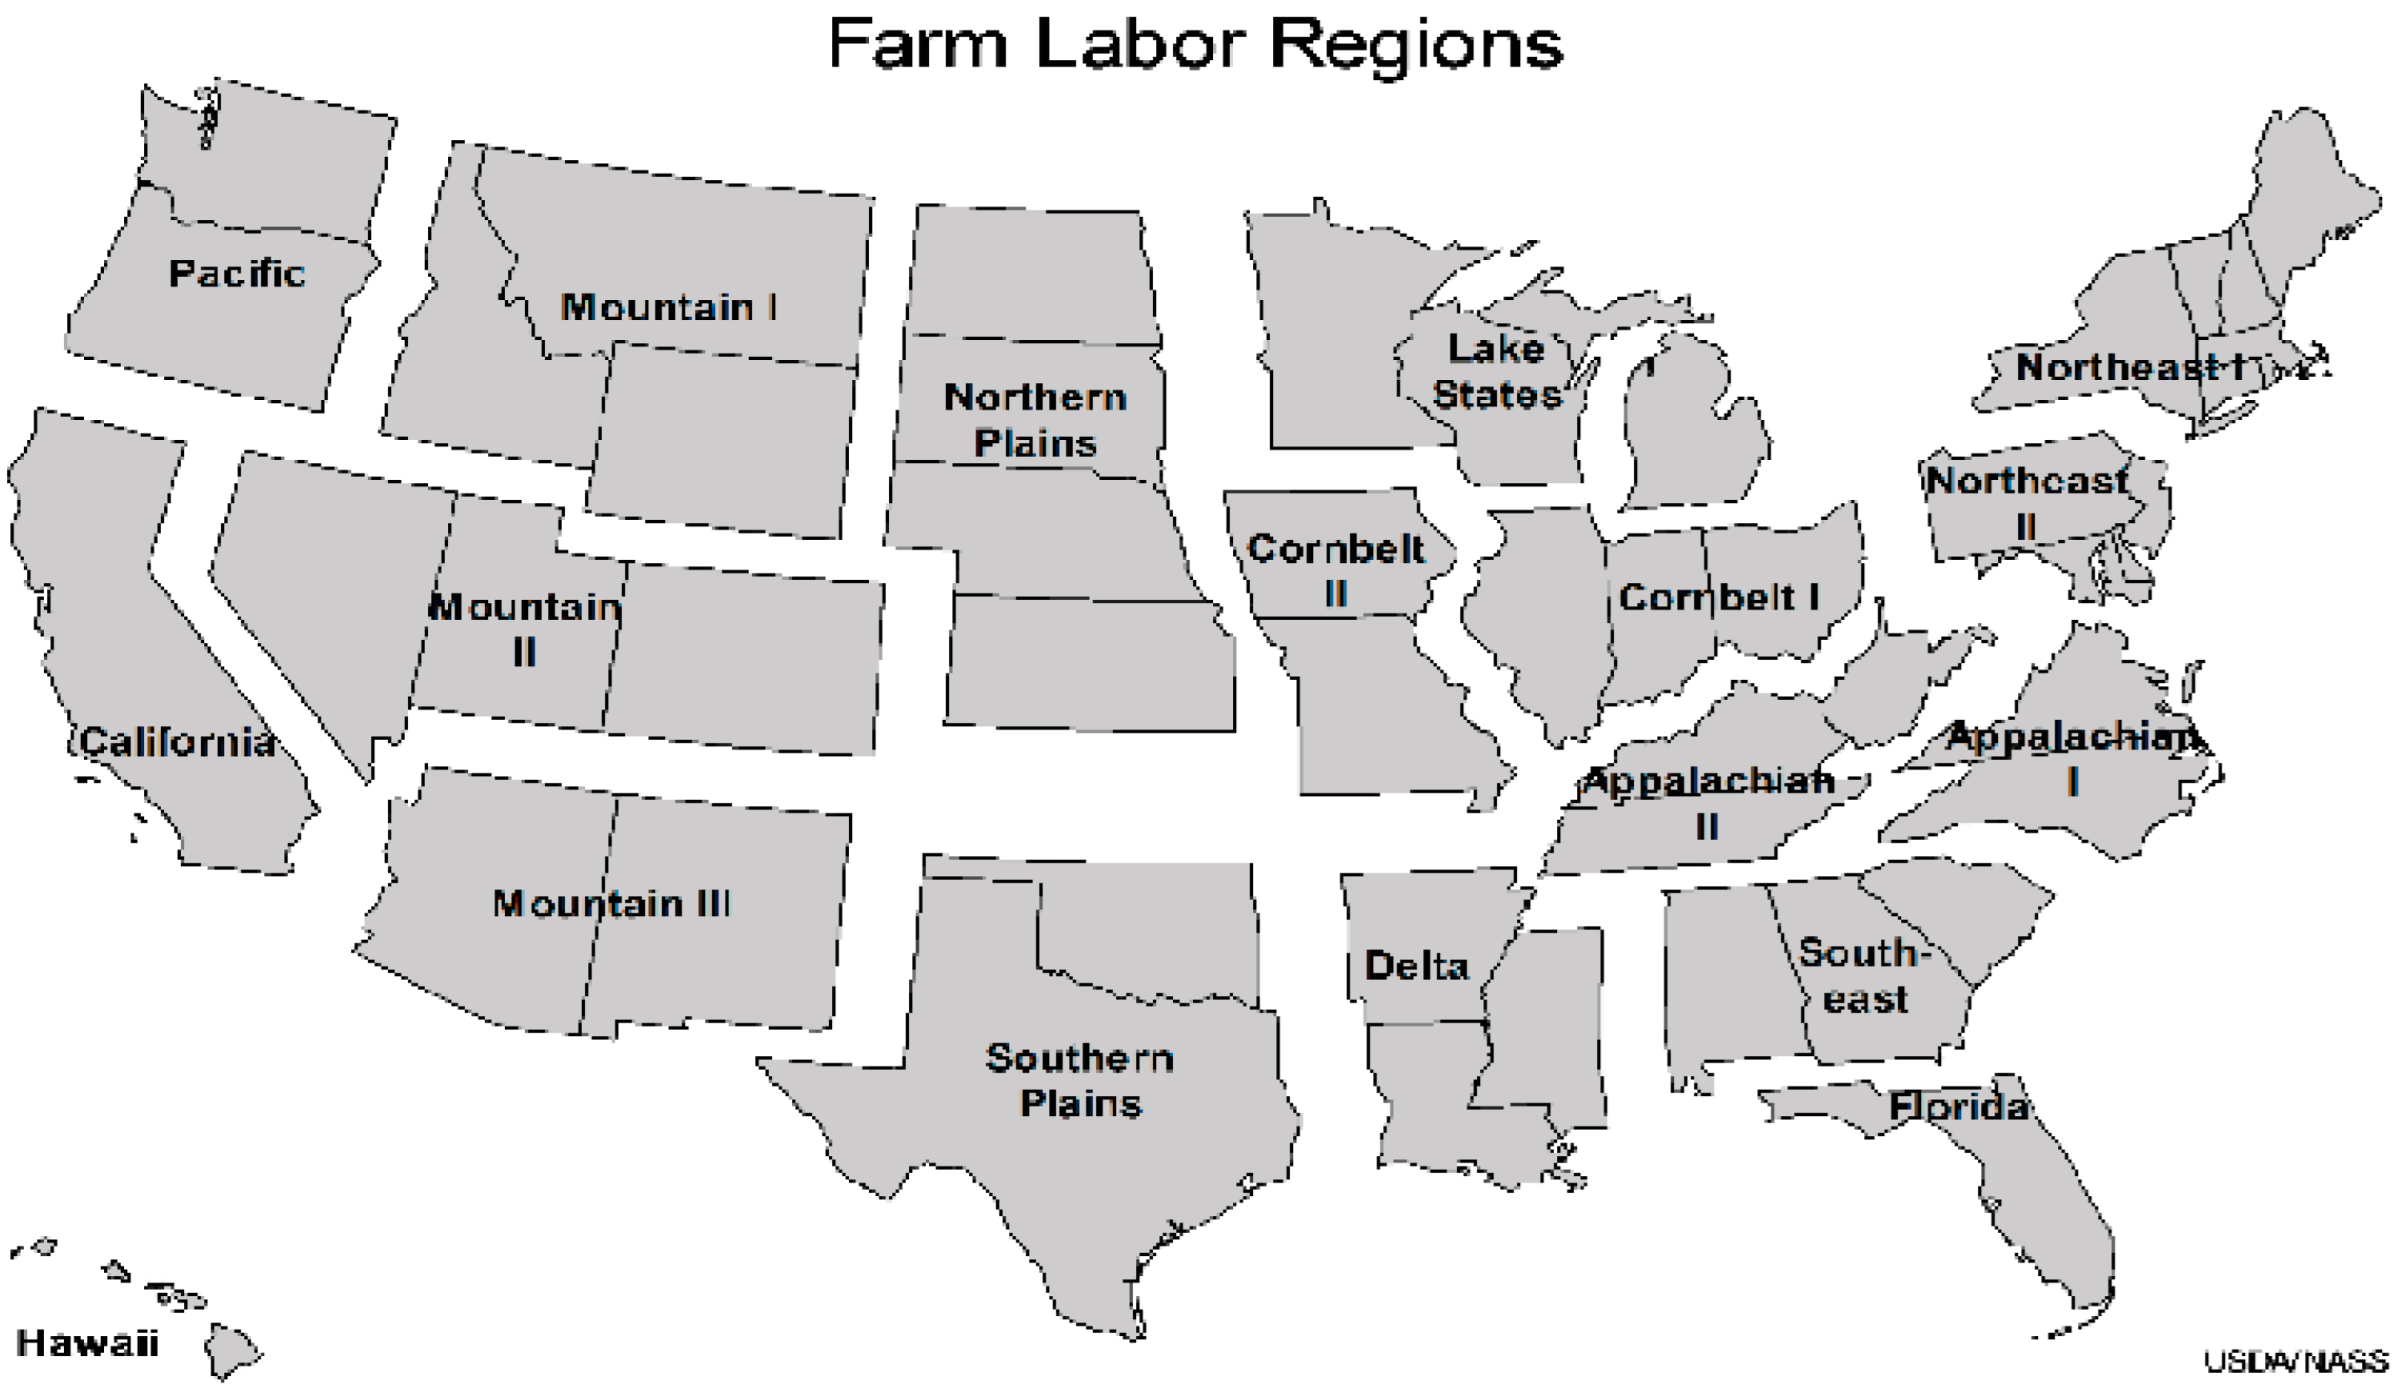
2.1. Farm Labor Program
2.2. Crop County Estimates Program
2.3. Cash Rent Program
3. Small Area Models
3.1. Small Area Models for Farm Labor Estimates
3.2. Small Area Models for Crop County Estimates
3.3. Small Area Models for Cash Rent County Estimates
3.4. Computations
4. Moving the Models into Production
5. Discussion
Author Contributions
Funding
Institutional Review Board Statement
Informed Consent Statement
Data Availability Statement
Acknowledgments
Conflicts of Interest
Appendix A. List of the Covariates

| Model | Name | Description |
|---|---|---|
| LNN model | Log (previous year official estimated number of workers) | Log state-level official estimates of number of workers by types |
| Type | The categorical data of the work types | |
| State | The categorical data of state | |
| Usable number of reports | The survey usable reports in each domain | |
| NN model | Previous year official estimated average wage rates or average hours per week | State-level official estimates of average wage rates or average hours per week by worker types |
| Type | the categorical data of the work types | |
| State | The categorical data of state | |
| Usable number of reports | The survey usable reports in each domain |
| Model | Name | Description |
|---|---|---|
| Total acreage model | Max (FSA, RMA) | The maximum value between county-level FSA planted acres and RMA planted acres for the corresponding crop commodity |
| Max (FSA failed acres, RMA failed acres) | The maximum value between county-level FSA failed acres and RMA failed acres for the corresponding crop commodity | |
| Yield model | NCCPI | The county-level National Commodity Crop Productivity Index (NCCPI) |
| Model | Name | Description |
|---|---|---|
| Cash Rental Rate Model | Previous year’s survey estimates and sampling variances | County-level survey’s direct estimates and sampling variances from previous year by land types |
| Previous year’s official estimated | County-level previous year’s official estimates by land types | |
| NCCPI | The county-level National Commodity Crop Productivity Index (NCCPI) | |
| Usable number of reports | The county-level survey usable reports in each domain |
References
- National Academies of Sciences, Engineering, and Medicine. In Improving Crop Estimates by Integrating Multiple Data Sources; The National Academies Press: Washington, DC, USA, 2017. [CrossRef]
- Pfeffermann, D. New Important Developments in Small Area Estimation. Stat. Sci. 2013, 28, 40–68. [Google Scholar] [CrossRef]
- Rao, J.N.K.; Molina, I. Small Area Estimation; John Wiley & Sons, Inc.: New York, NY, USA, 2015. [Google Scholar] [CrossRef]
- Fay, R.E.; Herriot, R.A. Estimates of income for small places: An application of James-Stein procedures to census data. JASA 1979, 74, 269–277. [Google Scholar] [CrossRef]
- Battese, G.E.; Harter, R.M.; Fuller, W.A. An error-components model for prediction of county crop areas using survey and satellite data. JASA 1988, 83, 28–36. [Google Scholar]
- Torabi, M.; Rao, J.N.K. On small area estimation under a subarea level model. J. Multivar. Anal. 2014, 127, 36–55. [Google Scholar] [CrossRef]
- Fuller, W.A.; Goyeneche, J.J. Estimation of The State Variance Component. 1998; unpublished manuscript. [Google Scholar]
- Erciulescu, A.L.; Cruze, N.B.; Nandram, B. Model-based county-level crop estimates incorporating auxiliary sources of information. J. R. Stat. Soc. Ser. A 2019, 182, 283–303. [Google Scholar] [CrossRef]
- USDA National Agricultural Statistics Service. Farm Labor; Farm Labor 25 May 2022. Available online: https://downloads.usda.library.cornell.edu/usda-esmis/files/x920fw89s/mp48tj815/0c484p887/fmla0522.pdf (accessed on 2 September 2022).
- USDA National Agricultural Statistics Service. Crop Production Historical Track Records. 2019. Available online: https://downloads.usda.library.cornell.edu/usda-esmis/files/c534fn92g/x059ch00p/f4752r51h/croptr19.pdf (accessed on 2 September 2022).
- Iwig, W.C. The National Agricultural Statistics Service County Estimates Program. In Indirect Estimators in U.S. Federal Programs; Schaible, W., Ed.; Springer: New York, NY, USA, 1996; (accessed on 2 September 2022). [Google Scholar] [CrossRef]
- Kott, P.S.; Bailey, J.T. The theory and practice of Maximal Brewer Selection with Poisson PRN sampling. In Proceedings of the 2000 International Conference on Establishment Surveys in Buffalo, New York, NY, USA, 17–21 June 2000; Available online: https://ww2.amstat.org/meetings/ices/2000/proceedings/S04.pdf (accessed on 2 September 2022).
- Kott, P.S. Assessing linearization variance estimators. In Proceedings of the American Statistical Association, Survey Research Methods Section; American Statistical Association: Alexandria, VA, USA, 1989; Available online: https://www.asasrms.org/Proceedings/papers/1989_030.pdf (accessed on 2 September 2022).
- USDA NASS. 2021—Rent, Cash, Cropland, Non-Irrigated—Expense—Measured in $/Acre. Available online: https://www.nass.usda.gov/Data_Visualization/Commodity/index.php (accessed on 2 September 2022).
- Chen, L.; Cruze, N.B.; Young, L.J. Model-Based Estimates for Farm Labor Quantities. Stats 2022, 5, 738–754. [Google Scholar] [CrossRef]
- Gelman, A. Prior distributions for variance parameters in hierarchical models (comment on article by Browne and Draper). Bayesian Anal. 2006, 1, 515–534. [Google Scholar] [CrossRef]
- Browne, W.J.; Draper, D. A comparison of Bayesian and likelihood-based methods for fitting multilevel models. Bayesian Anal. 2016, 1, 473–514. [Google Scholar] [CrossRef]
- Nandram, B.; Sayit, H. A Bayesian analysis of small area probabilities under a constraint. Surv. Methodol. 2011, 37, 137–152. [Google Scholar]
- Erciulescu, A.L.; Cruze, N.B.; Nandram, B. Benchmarking A Triplet of Official Estimates. Environ. Ecol. Stat. 2018, 25, 523–547. [Google Scholar] [CrossRef]
- Nandram, B.; Cruze, N.B.; Erciulescu, A.L.; Chen, L. Bayesian Small Area Models under Inequality Constraints with Benchmarking and Double Shrinkage; Research Report RDD-22-02; National Agricultural Statistics Service, USDA: Washington, DC, USA, 2022. Available online: https://www.nass.usda.gov/Education_and_Outreach/Reports,_Presentations_and_Conferences/reports/ResearchReport_constraintmodel.pdf (accessed on 2 September 2022).
- Chen, L.; Nandram, B.; Cruze, N.B. Hierarchical Bayesian Model with Inequality Constraints for US County Estimates. J. Off. Stat. 2022, accepted. [Google Scholar]
- Erciulescu, A.L.; Cruze, N.B.; Nandram, B. Statistical challenges in combining survey and auxiliary data to produce official statistics. J. Off. Stat. 2020, 36, 63–88. [Google Scholar] [CrossRef]
- Bejleri, V.; Cruze, N.; Erciulescu, A.L.; Benecha, H.; Nandram, B. Mitigating Standard Errors of County-Level Survey Estimates When Data are Sparse. In JSM Proceedings, Survey Research Methods Section; American Statistical Association: Vancouver, CA, USA, 2018. [Google Scholar]
- Berg, E.; Cecere, W.; Ghosh, M. Small area estimation for county-level farmland cash rental rates. J. Surv. Stat. Methodol. 2014, 2, 1–37. [Google Scholar] [CrossRef]
- Ghosh, M.; Steorts, R.C. Two-stage benchmarking as applied to small area estimation. Test 2013, 22, 670–687. [Google Scholar] [CrossRef]
- Erciulescu, E.; Berg, E.; Cecere, W.; Ghosh, M. Bivariate hierarchical Bayesian model for estimating cropland cash rental rates at the county level. Surv. Methodol. 2019, 45, 199–216. [Google Scholar]
- Ibrahim, J.G.; Chen, M.-H.; Gwon, Y.; Chen, F. The Power Prior: Theory and Applications. Stat. Med. 2015, 34, 3724–3749. [Google Scholar] [CrossRef]
- Ibrahim, J.G.; Chen, M.-H. Power prior distributions for regression models. Stat. Sci. 2000, 15, 46–60. Available online: https://www.jstor.org/stable/2676676 (accessed on 19 July 2022).
- Chakraborty, A.; Datta, G.S.; Mandal, A. Robust hierarchical bayes small area estimation for the nested error linear regression model. Int. Stat. Rev. 2019, 87, S158–S176. [Google Scholar] [CrossRef]
- Goyal, S.; Datta, G.S.; Mandal, A. A hierarchical Bayes unit-level small area estimation model for normal mixture populations. Sankhya B 2021, 83, 215–241. [Google Scholar] [CrossRef]
- Plummer, M. JAGS: A Program for Analysis of Bayesian Graphical Models Using Gibbs Sampling. In Proceedings of the 3rd International Workshop on Distributed Statistical Computing (DSC 2003), Vienna, Austria, 20–22 March 2003; Available online: https://www.r-project.org/conferences/DSC-2003/Proceedings/Plummer.pdf (accessed on 19 July 2022).
- Geweke, J. Evaluating the Accuracy of Sampling-Based Approaches to the Calculation of Posterior Moments. Bayesian Stat. 1992, 4, 169–193. [Google Scholar] [CrossRef]
- Gelman, A.; Rubin, D.B. Inference from Iterative Simulation Using Multiple Sequences. Stat. Sci. 1992, 7, 457–472. [Google Scholar] [CrossRef]
- Sartore, L.; Toppin, K.; Spiegelman, C. Introducing a New Integer Calibration Procedure. USDA NASS Research Report RDD-a6-STS. 2016. Washington DC. Available online: https://www.nass.usda.gov/Education_and_Outreach/Reports,_Presentations_and_Conferences/reports/New_Integer_Calibration_%20Procedure_2016.pdf (accessed on 6 September 2022).


Publisher’s Note: MDPI stays neutral with regard to jurisdictional claims in published maps and institutional affiliations. |
© 2022 by the authors. Licensee MDPI, Basel, Switzerland. This article is an open access article distributed under the terms and conditions of the Creative Commons Attribution (CC BY) license (https://creativecommons.org/licenses/by/4.0/).
Share and Cite
Young, L.J.; Chen, L. Using Small Area Estimation to Produce Official Statistics. Stats 2022, 5, 881-897. https://doi.org/10.3390/stats5030051
Young LJ, Chen L. Using Small Area Estimation to Produce Official Statistics. Stats. 2022; 5(3):881-897. https://doi.org/10.3390/stats5030051
Chicago/Turabian StyleYoung, Linda J., and Lu Chen. 2022. "Using Small Area Estimation to Produce Official Statistics" Stats 5, no. 3: 881-897. https://doi.org/10.3390/stats5030051
APA StyleYoung, L. J., & Chen, L. (2022). Using Small Area Estimation to Produce Official Statistics. Stats, 5(3), 881-897. https://doi.org/10.3390/stats5030051