Nonparametric Limits of Agreement for Small to Moderate Sample Sizes: A Simulation Study


Abstract
:1. Introduction
2. Methods
2.1. Sample Quantile Estimators
2.2. Subsampling Quantile Estimators
2.3. Kernel Quantile Estimators
2.4. Other Quantile Estimators
2.5. Simulation Setup
3. Results
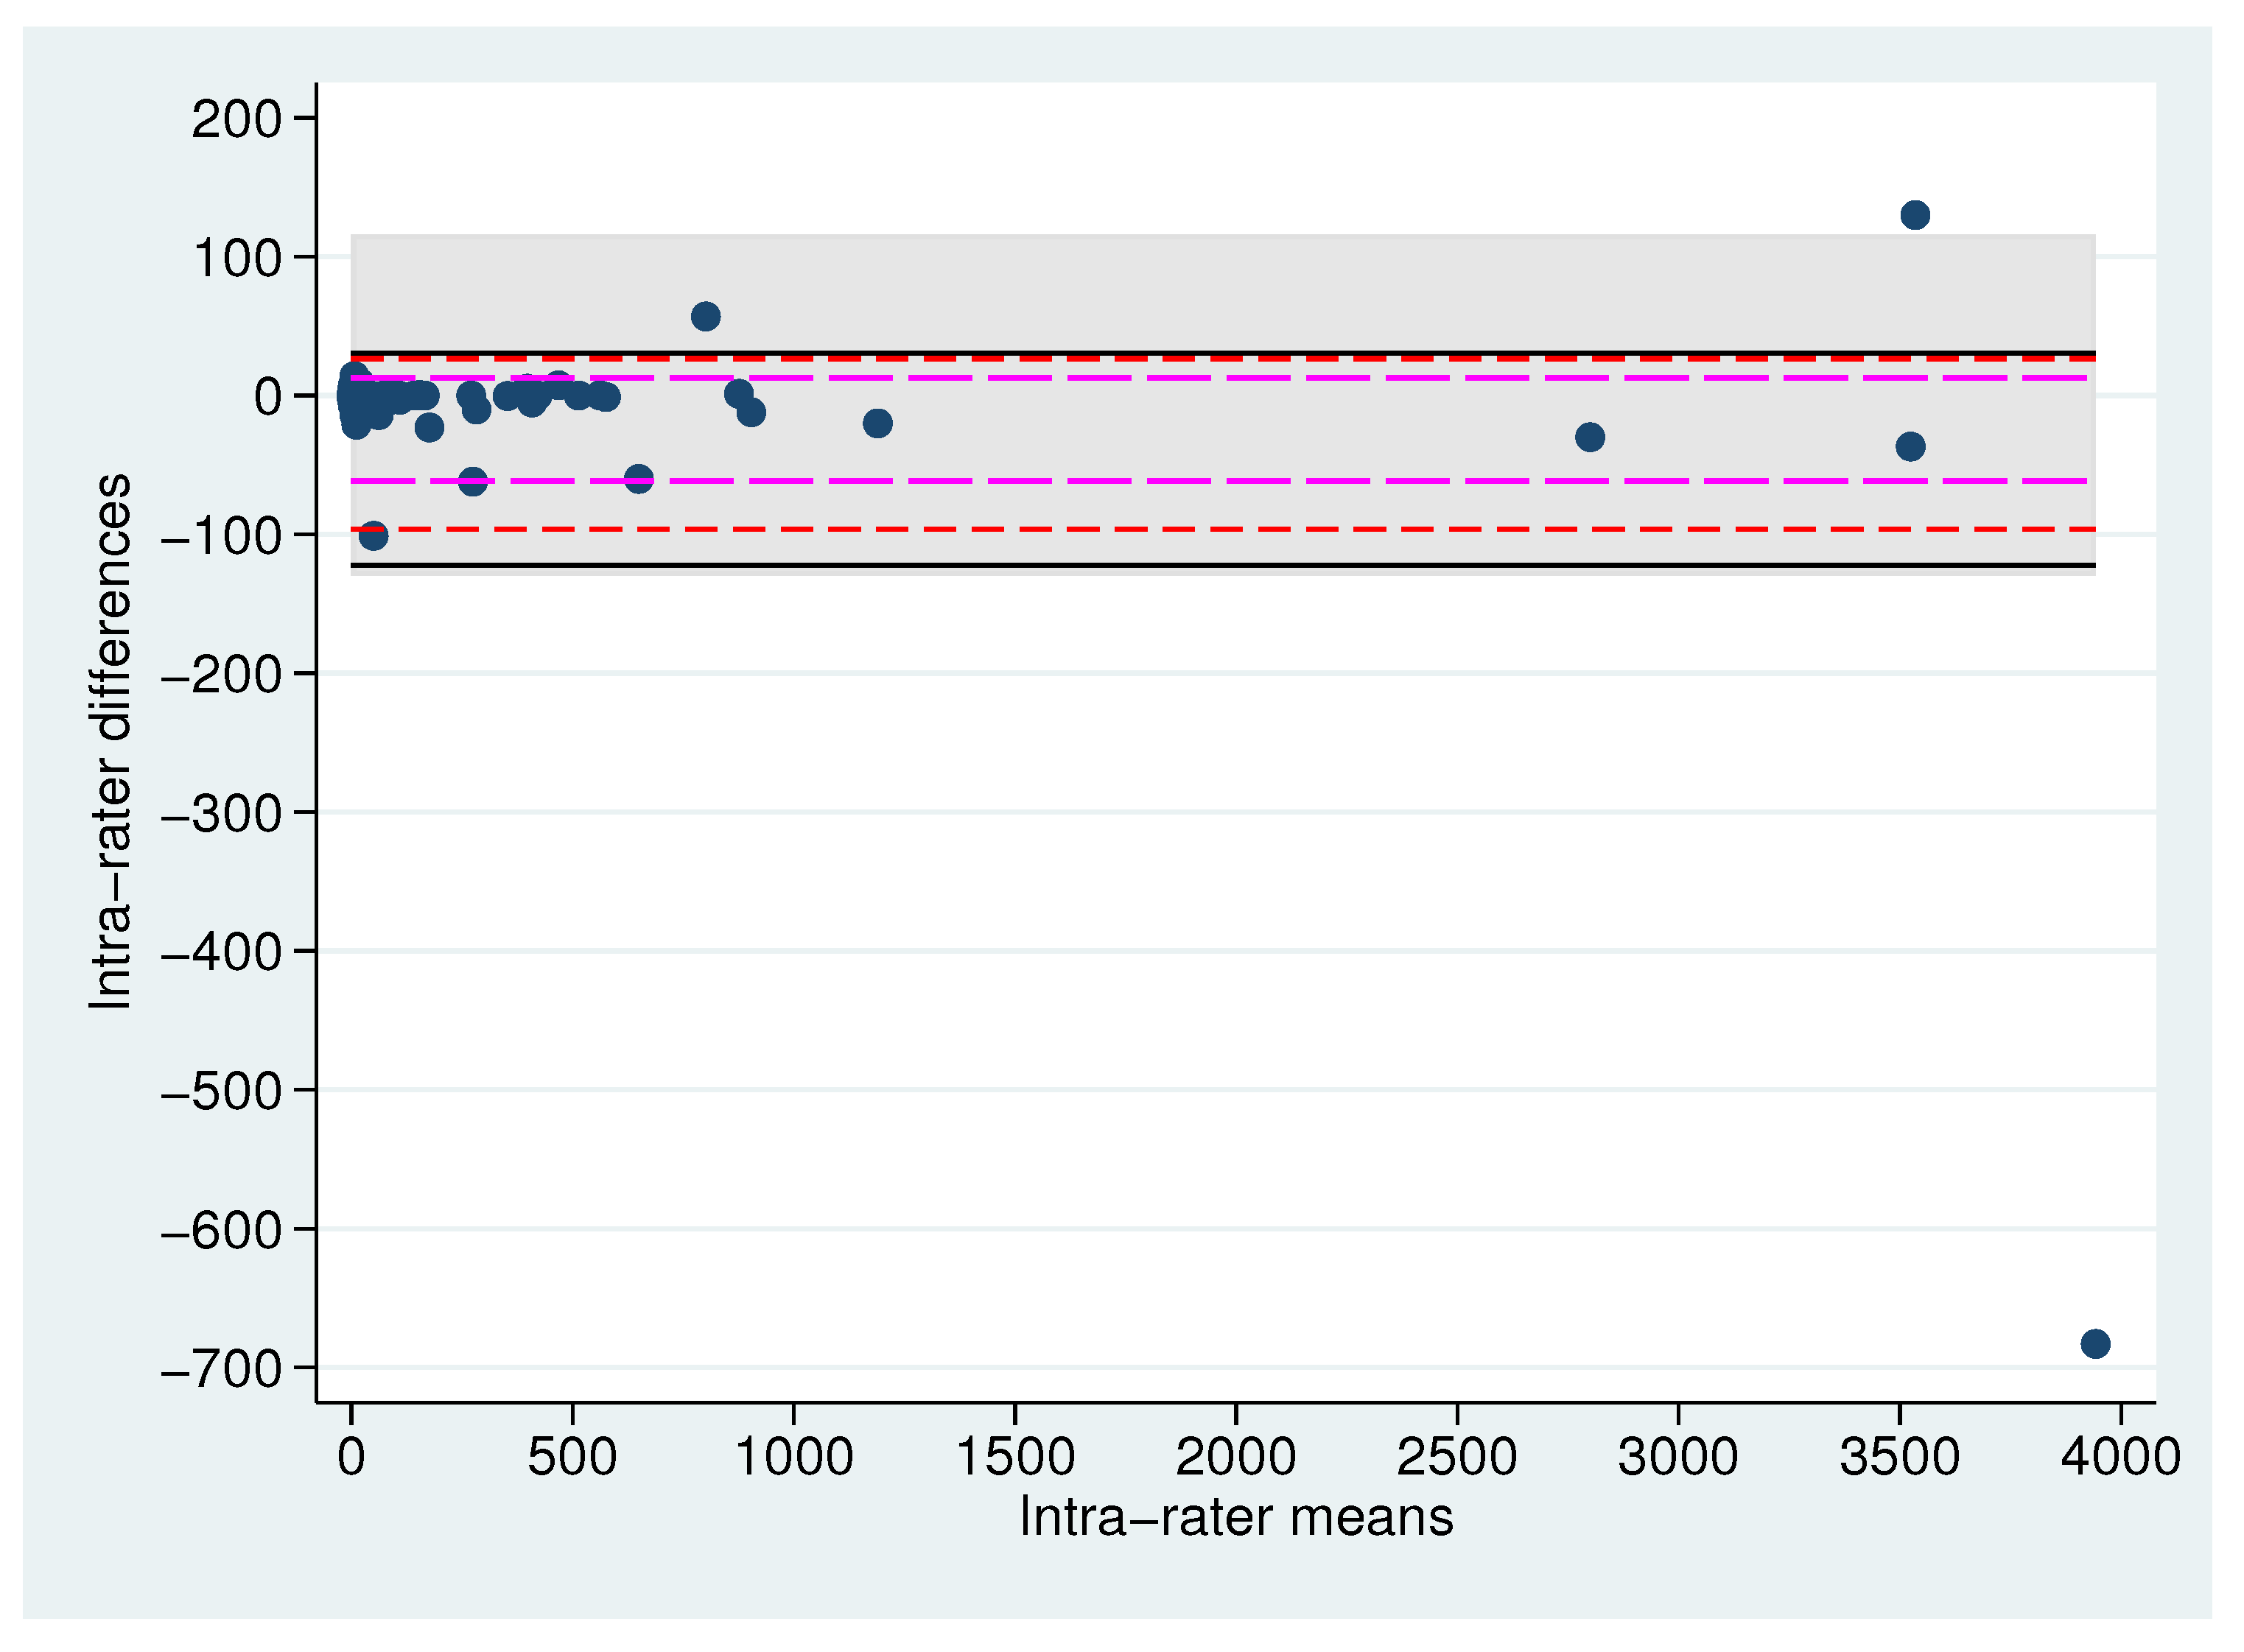
4. Example
5. Discussion
5.1. Statement of Principal Findings
5.2. Strengths and Limitations of The Study
5.3. Strengths and Limitations in Relation to other Studies
5.4. Meaning of the Findings: Possible Mechanisms and Implications
5.5. Unanswered Questions and Future Research
Supplementary Materials
Author Contributions
Funding
Acknowledgments
Conflicts of Interest
References
- Bland, J.M.; Altman, D.G. Statistical methods for assessing agreement between two methods of clinical measurement. Lancet 1986, 1, 307–310. [Google Scholar] [CrossRef]
- Bland, J.M.; Altman, D.G. Measuring agreement in method comparison studies. Stat. Methods Med. Res. 1999, 8, 135–160. [Google Scholar] [CrossRef] [PubMed]
- Rosner, B. Fundamentals of Biostatistics, 8th ed.; Cengage Learning: Boston, MA, USA, 2015. [Google Scholar]
- Schmitz, S.; Krummenauer, F.; Henn, S.; Dick, H.B. Comparison of three different technologies for pupil diameter measurement. Graefe’s Arch. Clin. Exp. Ophthalmol. 2003, 241, 472–477. [Google Scholar] [CrossRef] [PubMed]
- Twomey, P.J. How to use difference plots in quantitative method comparison. Ann. Clin. Biochem. 2006, 43, 124–129. [Google Scholar] [CrossRef]
- Diederichsen, A.C.; Sand, N.P.; Nørgaard, B.; Lambrechtsen, J.; Jensen, J.M.; Munkholm, H.; Aziz, A.; Gerke, O.; Egstrup, K.; Larsen, M.L.; et al. Discrepancy between coronary artery calcium score and HeartScore in middle-aged Danes: The DanRisk study. Eur. J. Prev. Cardiol. 2012, 19, 558–564. [Google Scholar] [CrossRef]
- Cheng, C. On Estimation of Quantiles and Quantile Density Functions. Ph.D. Thesis, Texas A & M University, College Station, TX, USA, 1993. [Google Scholar]
- Parzen, E. Nonparametric statistical data modeling. J. Am. Stat. Assoc. 1979, 74, 105–121. [Google Scholar] [CrossRef]
- Dielman, T.; Lowry, C.; Pfaffenberger, R. A comparision of quantile estimators. Commun. Stat. Simul. Comput. 1994, 23, 355–371. [Google Scholar] [CrossRef]
- Steinberg, S.M. Confidence Intervals for Functions of Quantiles Using Linear Combinations of Order Statistics. Ph.D. Thesis, University of North Carolina at Chapel Hill, Chapel Hill, NC, USA, 1983. [Google Scholar]
- Parrish, R.S. Comparision of quantile estimators in normal sampling. Biometrics 1990, 46, 247–257. [Google Scholar] [CrossRef]
- Hyndman, R.J.; Fan, Y. Sample quantiles in statistical packages. Am. Stat. 1996, 50, 361–365. [Google Scholar] [CrossRef]
- Serfling, R.J. Approximation Theorems of Mathematical Statistics; John Wiley & Sons: Hoboken, NJ, USA, 1980. [Google Scholar]
- Harrell, F.E.; Davis, C.E. A new distribution-free quantile estimator. Biometrika 1982, 69, 635–640. [Google Scholar] [CrossRef]
- Steinberg, S.M.; Davis, C.E. Comparison of nonparametric point estimators for interquantile differences in moderate sized samples. Commun. Stat. Theory Methods 1987, 16, 1607–1616. [Google Scholar] [CrossRef]
- Kaigh, W.D.; Lachenbruch, P.A. A generalized quantile estimator. Commun. Stat. Theory Methods 1982, 11, 2217–2238. [Google Scholar] [CrossRef]
- Kaigh, W.D. Quantile interval estimation. Commun. Stat. Theory Methods 1983, 12, 2427–2443. [Google Scholar] [CrossRef]
- Kaigh, W.D.; Cheng, C. Subsampling quantile estimators and uniformity criteria. Commun. Stat. Theory Methods 1991, 20, 539–560. [Google Scholar] [CrossRef]
- Cheng, C. The Bernstein polynomial estimator of a smooth quantile function. Stat. Probab. Lett. 1995, 24, 321–330. [Google Scholar] [CrossRef]
- Delampady, M.; Ghosh, J.K.; Samanta, T. An Introduction to Bayesian Analysis Theory and Methods; Springer: New York, NY, USA, 2006. [Google Scholar]
- Yang, S.S. A smooth nonparametric estimator of a quantile function. J. Am. Stat. Assoc. 1985, 80, 1004–1111. [Google Scholar] [CrossRef]
- Sheather, S.J.; Marron, J.S. Kernel quantile estimators. J. Am. Stat. Assoc. 1990, 85, 410–416. [Google Scholar] [CrossRef]
- Zelterman, D. Smooth nonparametric estimation of the quantile function. J. Stat. Plan. Inference 1990, 26, 339–352. [Google Scholar] [CrossRef]
- Nadaraya, E.A. Smooth regression analysis. Sankhyā Indian J. Stat. 1964, 26, 359–372. [Google Scholar]
- Watson, G.S. On estimating regression. Theory Probab. Appl. 1964, 9, 141–142. [Google Scholar]
- Huang, M.L.; Brill, P. A level crossing quantile estimation method. Stat. Probab. Lett. 1999, 45, 111–119. [Google Scholar] [CrossRef]
- Huang, M.L. On a distribution-free quantile estimator. Comput. Stat. Data Anal. 2001, 37, 477–486. [Google Scholar] [CrossRef]
- Sfakianakis, M.E.; Verginis, D.G. A new family of nonparametric quantile estimators. Commun. Stat. Simul. Comput. 2008, 37, 337–345. [Google Scholar] [CrossRef]
- Navruz, G.; Özdemir, A.F. A new quantile estimator with weights based on a subsampling approach. Br. J. Math. Stat. Psychol. 2020, 73. [Google Scholar] [CrossRef]
- Vock, M. Intervals for the assessment of measurement agreement: Similarities, differences, and consequences of incorrect interpretations. Biom. J. 2016, 58, 489–501. [Google Scholar] [CrossRef]
- Carkeet, A. Exact parametric confidence intervals for Bland-Altman limits of agreement. Optom. Vis. Sci. 2015, 92, e71–e80. [Google Scholar] [CrossRef] [Green Version]
- Carkeet, A.; Goh, Y.T. Confidence and coverage for Bland-Altman limits of agreement and their approximate confidence intervals. Stat. Methods Med. Res. 2018, 27, 1559–1574. [Google Scholar] [CrossRef]
- Chu, J.T. Some uses of quasi-ranges. Ann. Math. Stat. 1957, 28, 173–180. [Google Scholar] [CrossRef]
- Campbell, M.J.; Gardner, M.J. Calculating confidence intervals for some non-parametric analyses. Br. Med. J. 1988, 296, 1454–1456. [Google Scholar] [CrossRef] [Green Version]
- Beran, R.; Hall, P. Interpolated nonparametric prediction intervals and confidence intervals. J. R. Stat. Soc. Ser. B 1993, 55, 643–652. [Google Scholar] [CrossRef]
- Hutson, A.D. Calculating nonparametric confidence intervals for quantiles using fractional order statistics. J. Appl. Stat. 1999, 26, 343–353. [Google Scholar] [CrossRef]
- Hutson, A.D. ‘Exact’ bootstrap confidence bands for the quantile function via Steck’s determinant. J. Comput. Graph. Stat. 2002, 11, 471–482. [Google Scholar] [CrossRef]
- Zielinski, R.; Zielinski, W. Best exact nonparametric confidence intervals for quantiles. Statistics 2005, 39, 67–71. [Google Scholar] [CrossRef]
- Balakrishnan, N.; Li, T. Confidence intervals for quantiles and tolerance intervals based on ordered ranked set samples. Ann. Inst. Stat. Math. 2006, 58, 757–777. [Google Scholar] [CrossRef]
- Cornbleet, P.J.; Gochman, N. Incorrect least-squares regression coefficients in method-comparison analysis. Clin. Chem. 1979, 25, 432–438. [Google Scholar] [CrossRef] [PubMed]
- Passing, H.; Bablok, W. A new biometrical method for testing the equality of measurements from two different analytical methods. Clin. Chem. Lab. Med. 1983, 21, 709–720. [Google Scholar] [CrossRef]
- Passing, H.; Bablok, W. Comparison of several regression procedures for method comparison studies and determination of sample size. Clin. Chem. Lab. Med. 1984, 22, 431–445. [Google Scholar] [CrossRef] [Green Version]
- Payne, R.B. Method comparison: Evaluation of least squares, Deming and Passing/Bablok regression procedures using computer simulation. Ann. Clin. Biochem. 1997, 34, 319–320. [Google Scholar] [CrossRef]
- Rousseeuw, P.J. Least median of squares regression. J. Am. Stat. Assoc. 1984, 79, 871–880. [Google Scholar] [CrossRef]
- Yohai, V.J.; Zamar, R. High breakdown-point estimates of regression by means of the minimization of an efficient scale. J. Am. Stat. Assoc. 1988, 83, 406–413. [Google Scholar] [CrossRef]
- Riani, M.; Cerioli, A.; Atkinson, A.C.; Perrotta, D. Monitoring robust regression. Electron. J. Stat. 2014, 8, 646–677. [Google Scholar] [CrossRef]
- Rousseeuw, P.; Perrotta, D.; Riani, M.; Hubert, M. Robust monitoring of time series with application to fraud detection. Econom. Stat. 2019, 9, 108–121. [Google Scholar] [CrossRef]
- Riani, M.; Atkinson, A.C.; Corbellini, A.; Perrotta, D. Robust regression with density power divergence: Theory, comparisons, and data analysis. Entropy 2020, 22, 399. [Google Scholar] [CrossRef] [Green Version]

| Estimator | ND | ND 1% | ND 2% | ND 5% | ED | LND |
|---|---|---|---|---|---|---|
| 0.937 | 0.938 | 0.937 | 0.937 | 0.934 | 0.937 | |
| - | - | - | - | - | - | |
| 0.926 | 0.927 | 0.927 | 0.928 | 0.921 | 0.926 | |
| 0.911 | 0.923 | 0.923 | 0.924 | 0.916 | 0.920 | |
| - | - | - | - | - | - | |
| 0.900 | 0.890 | 0.877 | 0.851 | 0.885 | 0.880 | |
| 0.905 | 0.908 | 0.908 | 0.909 | 0.897 | 0.904 | |
| 0.904 | 0.882 | 0.865 | 0.832 | 0.936 | 0.922 | |
| 0.912 | 0.893 | 0.880 | 0.857 | 0.916 | 0.906 | |
| 0.915 | 0.893 | 0.874 | 0.838 | 0.923 | 0.919 | |
| 0.916 | 0.917 | 0.917 | 0.919 | 0.910 | 0.915 | |
| 0.924 | 0.925 | 0.925 | 0.926 | 0.920 | 0.924 | |
| 0.925 | 0.927 | 0.926 | 0.927 | 0.914 | 0.919 | |
| 0.925 | 0.926 | 0.925 | 0.926 | 0.923 | 0.929 | |
| 0.813 | 0.814 | 0.817 | 0.821 | 0.808 | 0.834 |
| Estimator | ND | ND 1% | ND 2% | ND 5% | ED | LND |
|---|---|---|---|---|---|---|
| 0.919 | 0.918 | 0.920 | 0.919 | 0.919 | 0.919 | |
| 0.951 | 0.952 | 0.953 | 0.955 | 0.951 | 0.951 | |
| 0.934 | 0.935 | 0.937 | 0.938 | 0.931 | 0.934 | |
| 0.939 | 0.940 | 0.942 | 0.945 | 0.935 | 0.938 | |
| 0.938 | 0.932 | 0.930 | 0.917 | 0.937 | 0.929 | |
| 0.924 | 0.906 | 0.898 | 0.879 | 0.915 | 0.912 | |
| 0.922 | 0.925 | 0.927 | 0.931 | 0.919 | 0.922 | |
| 0.919 | 0.902 | 0.896 | 0.861 | 0.931 | 0.933 | |
| 0.924 | 0.909 | 0.900 | 0.881 | 0.924 | 0.916 | |
| 0.924 | 0.912 | 0.901 | 0.867 | 0.944 | 0.930 | |
| 0.933 | 0.935 | 0.936 | 0.940 | 0.928 | 0.931 | |
| 0.940 | 0.941 | 0.942 | 0.945 | 0.935 | 0.939 | |
| 0.937 | 0.939 | 0.939 | 0.943 | 0.933 | 0.934 | |
| 0.938 | 0.941 | 0.942 | 0.944 | 0.938 | 0.941 | |
| 0.839 | 0.843 | 0.845 | 0.855 | 0.845 | 0.870 |
| Estimator | ND | ND 1% | ND 2% | ND 5% | ED | LND |
|---|---|---|---|---|---|---|
| 0.939 | 0.939 | 0.940 | 0.938 | 0.934 | 0.939 | |
| 0.950 | 0.951 | 0.951 | 0.949 | 0.945 | 0.950 | |
| 0.941 | 0.941 | 0.942 | 0.941 | 0.935 | 0.941 | |
| 0.950 | 0.952 | 0.954 | 0.955 | 0.940 | 0.949 | |
| 0.943 | 0.939 | 0.935 | 0.933 | 0.938 | 0.939 | |
| 0.936 | 0.923 | 0.916 | 0.895 | 0.925 | 0.929 | |
| 0.937 | 0.939 | 0.941 | 0.942 | 0.929 | 0.937 | |
| 0.934 | 0.926 | 0.921 | 0.887 | 0.934 | 0.940 | |
| 0.936 | 0.925 | 0.917 | 0.897 | 0.930 | 0.931 | |
| 0.933 | 0.928 | 0.922 | 0.890 | 0.942 | 0.939 | |
| 0.943 | 0.945 | 0.947 | 0.948 | 0.934 | 0.943 | |
| 0.951 | 0.952 | 0.954 | 0.955 | 0.940 | 0.949 | |
| 0.950 | 0.951 | 0.953 | 0.953 | 0.940 | 0.948 | |
| 0.949 | 0.951 | 0.952 | 0.954 | 0.940 | 0.950 | |
| 0.888 | 0.893 | 0.896 | 0.901 | 0.891 | 0.910 |
| Estimator | ND | ND 1% | ND 2% | ND 5% | ED | LND |
|---|---|---|---|---|---|---|
| 0.941 | 0.941 | 0.941 | 0.942 | 0.941 | 0.941 | |
| 0.952 | 0.952 | 0.952 | 0.954 | 0.953 | 0.952 | |
| 0.941 | 0.941 | 0.941 | 0.942 | 0.941 | 0.941 | |
| 0.950 | 0.951 | 0.953 | 0.957 | 0.948 | 0.950 | |
| 0.947 | 0.941 | 0.939 | 0.938 | 0.946 | 0.941 | |
| 0.940 | 0.929 | 0.920 | 0.902 | 0.935 | 0.935 | |
| 0.940 | 0.942 | 0.944 | 0.948 | 0.937 | 0.940 | |
| 0.937 | 0.935 | 0.921 | 0.896 | 0.942 | 0.943 | |
| 0.939 | 0.930 | 0.920 | 0.903 | 0.940 | 0.935 | |
| 0.938 | 0.935 | 0.932 | 0.905 | 0.940 | 0.941 | |
| 0.944 | 0.946 | 0.948 | 0.951 | 0.942 | 0.944 | |
| 0.950 | 0.952 | 0.954 | 0.959 | 0.948 | 0.950 | |
| 0.950 | 0.952 | 0.953 | 0.957 | 0.948 | 0.949 | |
| 0.950 | 0.951 | 0.953 | 0.959 | 0.947 | 0.950 | |
| 0.911 | 0.914 | 0.917 | 0.924 | 0.913 | 0.924 |
| Estimator | ND | ND 1% | ND 2% | ND 5% | ED | LND |
|---|---|---|---|---|---|---|
| 0.945 | 0.945 | 0.944 | 0.946 | 0.946 | 0.945 | |
| 0.949 | 0.949 | 0.948 | 0.951 | 0.950 | 0.949 | |
| 0.942 | 0.942 | 0.941 | 0.943 | 0.944 | 0.942 | |
| 0.948 | 0.949 | 0.950 | 0.954 | 0.948 | 0.948 | |
| 0.945 | 0.941 | 0.939 | 0.936 | 0.947 | 0.945 | |
| 0.941 | 0.934 | 0.930 | 0.906 | 0.939 | 0.940 | |
| 0.942 | 0.944 | 0.943 | 0.947 | 0.941 | 0.942 | |
| 0.940 | 0.936 | 0.928 | 0.903 | 0.943 | 0.943 | |
| 0.940 | 0.932 | 0.923 | 0.908 | 0.941 | 0.937 | |
| 0.939 | 0.935 | 0.928 | 0.904 | 0.941 | 0.943 | |
| 0.944 | 0.946 | 0.945 | 0.949 | 0.944 | 0.944 | |
| 0.949 | 0.951 | 0.952 | 0.957 | 0.949 | 0.949 | |
| 0.949 | 0.952 | 0.952 | 0.956 | 0.948 | 0.950 | |
| 0.949 | 0.950 | 0.951 | 0.954 | 0.947 | 0.949 | |
| 0.934 | 0.937 | 0.937 | 0.943 | 0.936 | 0.940 |
© 2020 by the authors. Licensee MDPI, Basel, Switzerland. This article is an open access article distributed under the terms and conditions of the Creative Commons Attribution (CC BY) license (http://creativecommons.org/licenses/by/4.0/).
Share and Cite
Frey, M.E.; Petersen, H.C.; Gerke, O. Nonparametric Limits of Agreement for Small to Moderate Sample Sizes: A Simulation Study. Stats 2020, 3, 343-355. https://doi.org/10.3390/stats3030022
Frey ME, Petersen HC, Gerke O. Nonparametric Limits of Agreement for Small to Moderate Sample Sizes: A Simulation Study. Stats. 2020; 3(3):343-355. https://doi.org/10.3390/stats3030022
Chicago/Turabian StyleFrey, Maria E., Hans C. Petersen, and Oke Gerke. 2020. "Nonparametric Limits of Agreement for Small to Moderate Sample Sizes: A Simulation Study" Stats 3, no. 3: 343-355. https://doi.org/10.3390/stats3030022
APA StyleFrey, M. E., Petersen, H. C., & Gerke, O. (2020). Nonparametric Limits of Agreement for Small to Moderate Sample Sizes: A Simulation Study. Stats, 3(3), 343-355. https://doi.org/10.3390/stats3030022