Article

Physicochemical and Bacteriological Quality of Public Swimming Pools in the Tamale Metropolis, Ghana

by
Umar Farouk Mustapha
1,2,
Seth Mensah Abobi
2,3,4,* and
Gerard Quarcoo
5,6
1
Guangdong Research Center on Reproductive Control and Breeding Technology of Indigenous Valuable Fish Species, Key Laboratory of Marine Ecology and Aquaculture Environment of Zhanjiang, Key Laboratory of Aquaculture in South China Sea for Aquatic Economic Animal of Guangdong Higher Education Institutes, Fisheries College, Guangdong Ocean University, Zhanjiang 524088, China
2
Department of Fisheries and Aquatic Resources Management, University for Development Studies, Tamale P.O. Box TL 1882, Ghana
3
Fachbereich 02 Biologie/Chemie, Universität Bremen, Leobener Str., 28359 Bremen, Germany
4
Leibniz Centre for Tropical Marine Research (ZMT), Fahrenheitstraße 6, 28359 Bremen, Germany
5
Council for Scientific and Industrial Research-Water Research Institute, Microbiology Division, Tamale P.O. Box TL 695, Ghana
6
Department of Theoretical and Applied Biology, Kwame Nkrumah University of Science and Technology, PMB, UPO, Kumasi 00233, Ghana
*
Author to whom correspondence should be addressed.
J 2020, 3(2), 236-249; https://doi.org/10.3390/j3020018
Submission received: 28 April 2020 / Revised: 20 May 2020 / Accepted: 27 May 2020 / Published: 31 May 2020

Abstract

:
The study focused on the physicochemical and bacteriological quality of public swimming pools in the Tamale Metropolis. Physicochemical properties such as pH, temperature, and conductivity, and bacteria counts—including total coliform, faecal coliform, Escherichia coli (E. coli), Staphylococcus aureus, and total heterotrophic bacteria—were analyzed for their conformity with required health standards. The results obtained were analyzed using Student t test and compared with World Health Organization (WHO) and Environmental Protection Agency (EPA) standards for safe recreational and drinking water. The highest and the lowest temperatures were recorded in April (32.53 °C) and February (28.16 °C), respectively. The lowest and the highest mean pH values were 4.04 and 6.13, which were below acceptable standards. The conductivity level varied from 469.1563 µS cm−1 to 928.1563 µS cm−1. While the pH did not conform to acceptable standards, temperature and conductivity were within the EPA and/or the WHO acceptable limits. The total coliform (TC) expressed in colony-forming units per 100 mL ranged from 0 to 397 (cfu/100 mL), faecal coliform (FC) 0 to196 cfu/100 mL, E. coli 0 to 52 cfu/100 mL, Staphylococcus aureus (S. aureus) 8 to 27 cfu/100 mL, and Total Heterotrophic Bacteria (THB) 44 to 197 (cfu/mL). TC, FC, E. coli, S. aureus, and THB counts in most of the samples complied with the bacteriological standards. However, the bacterial loads increased and exceeded the WHO and/or EPA standards as the number of bathers increased. Besides, there were positive correlations between physicochemical parameters such as temperature, pH, and bacterial loads. Most parameters studied met the acceptable standards of recreational water stipulated by the WHO and EPA. However, the presence of pathogenic organisms in the recreational waters at any point in time should be treated as a public health concern, and hence a call for routine monitoring and inspection of public swimming pools in the Tamale Metropolis.

1. Introduction

Water is one of the essential needs of man, both for food and recreation. Life originated in water, making it a basic necessity to life. No other substance serves man in so many ways as less crucial for society as a whole than for the well-being of each individual [1,2,3]. Swimming is an important recreational activity. Learning to swim prevents drowning, promotes good physical, mental, cardiovascular health, and derives pleasure [4]. Most swimmers have reasons for swimming, including; sports, rehabilitative treatment, and recreational purposes. Therefore, swimming pools must be controlled and be free from any disease-causing organism such as bacteria and other pathogenic microorganisms. Swimming pool water should meet potable water standards by being transparent, odorless, tasteless, and having a freezing point of 0 °C and boiling point of 100 °C [5].
The physicochemical properties of water such as pH, salinity, temperature, dissolved oxygen, conductivity, and alkalinity provide useful information on water quality or the potential of water to support bacteria growth [6]. The findings of Masoud et al. [7] indicated that most swimming pools in Alexandria recorded a pH level of <7.2 or >7.8, with few being within 7.2–7.8. If pH is above 7.6, there is the possibility of reduction of chlorine disinfection efficiency, increased chlorine requirement, eye discomfort, drying of the skin, cloudy water, and scale formation [8]. Levels of pH in pools should be maintained between 7.2 and 7.8 for chlorine disinfectants and between 7.2 and 8.0 for bromine-based and other nonchlorine processes. It was suggested that, for public pools, the pH value should be measured continuously and adjusted. For other semipublic pools and public and semipublic hot tubs, it is suggested that monitoring be conducted several times a day, during operating hours; for domestic pools, it is advisable to measure before pool use [4]. Temperature also affects water balance, mainly because calcium salts become less soluble at higher temperatures. Hence high-temperature pools are often subject to scaling as the calcium salts deposit on equipment and pipes. Where spa pools are heated, the temperature should not exceed 38 °C. On entering a heated pool, the skin blood vessels dilate to help lose heat and keep the body cool, causing the heart to pump faster and increasing the heart rate. If there is insufficient blood in the brain, there is a lack of oxygen and dizziness and fainting may result. Deaths have resulted when alcohol has been consumed and the body was subjected to heat stress [9].
Microorganisms come in many forms and are sourced from land, humans, and water bodies. Humans are the only recognized reservoir of Staphylococcal aureus, and it is found on the anterior nasal mucosa and skin as well as in the faeces of a substantial portion of healthy individuals. A variety of microorganisms can be found in swimming pools and similar recreational waters. The risk of infection has, in many cases, been linked to faecal and non faecal contamination. Faecally derived contamination may come from swimmers, contaminated water sources or, in outdoor pools, may be the result of direct animal contamination (e.g., from birds and rodents) [4,10,11]. Non faecally derived contamination such as human shedding (e.g., from vomit, mucus, saliva, or skin) in the swimming pool is a potential source of pathogenic organisms. Infected users can directly contaminate pool water and the surfaces of objects or materials at a facility with pathogens (notably viruses or fungi), which may lead to skin infections in other patrons who come in contact with the contaminated water or surfaces. Opportunistic pathogens (notably bacteria) can also be shed from users and transmitted via surfaces and contaminated water [2,5,12,13,14].
Bacteria can cause skin rashes, irritation of the body, eye problems, and diseases such as cholera, diarrhoea, Vibro illness, Typhoid fever, Salmonellosis, Ottis Externa (associated with swimmer’s ear), Leptospiriosis, Legionellosis, Dysentery, Mycobacterium marinum infection, Escherichia coli infection, Campylobacteriosis, Botulism, and a whole lot more. E. coli is an indicator of faecal contamination and should be measured in all public and semipublic pools, hot tubs, and natural spas. Operational levels should be less than 1/100 mL [4]. An outbreak of E. coli infections was epidemiologically and clinically linked to swimming pools [15,16,17]. Another important water quality indicator is the presence of coliform bacteria. Even rainwater samples did not comply with the requirements for drinking water [18]. However, Itah et al. [5] noted that no water sample from a pool should contain any coliform organism in 100 mL of water, and in 75% of samples, the viable plate count at 37 °C should not exceed 100 orgs/mL. S. aureus has been attributed to be one of the major bacteria contaminants in swimming pools and other recreational waters. S. aureus in swimming pools increases with an increasing number of swimmers and could also be found on surface films [10,19].
The Tamale Metropolis is expanding, with more investors and tourists coming into the city, causing leisure and sporting activities to increase. Swimming in public pools has become common among children and adults in the metropolis. However, waterborne disease outbreaks associated with swimming pools are a significant problem worldwide. Some national assessments showed that, in many countries, a relatively small proportion of pool facilities meet national regulations for water microbiological quality [7,20]. As people leave the comfort of their homes, intending to go swimming to have fun with little or no idea of the quality of water they swim in, the probability of ingesting an infective dose of a disease-causing microorganism is very high [21].

2. Materials and Methods

2.1. Study Area

The study was conducted on two active swimming pools from the Tamale Metropolis at the time of the study. Tamale is the capital city of the northern region of Ghana, with geographical coordinates of 9°24′27″ North, 0°51′12″ West, covering an area of 750 km2 inhabiting about 537,986 people. The mean annual rainfall is 1100 mm within 95 days of rainfall. Most rainfall (rainy season) is seen in May, July, August, and September. The mean annual temperature of Tamale is 27.9 degrees Celsius (82.3 degrees Fahrenheit), but on average, the temperatures are always high, and total annual precipitation averages 1090 mm (42.9 in), and annual sunshine averages 2723 h. Tamale has dry periods in January, February, November, and December, but January is the driest month. On average, the warmest, coolest, and the wettest months are, respectively, February, August, and September.
The inhabitants of the Tamale Metropolis are mostly the Mole-Dagomba linguistic group. It is a nodal city that serves as a convergence zone as well as the commercial capital of the six northern regions (Upper East, Upper West, North East, Savannah, Oti, and Northern regions). The study area is shown in Figure 1.

2.2. Sampling

Purposive sampling targeting swimming pools in the Tamale Metropolis was carried out. Two out of eight (8) commercial swimming pools were being used at the time of the study. The two rectangular concrete outdoor swimming pools (swimming pools A and B) were located in hotel premises.
Water samples were collected at the time of swimming directly in pre-sterilized 750 mL bottles in duplicate each month at a selected sampling point for three consecutive months, and one (1) sample was taken just after the water was treated for swimming in the fourth month. Sampling was done at the first and the last week of February till May 2014. At the pools, bottles were opened and held at their bases and submerged to a depth of about 20 cm with the mouth facing upwards, and water samples were taken by filling the bottles from the top to exclude air. The samples were taken to the laboratory in an ice chest/icebox containing ice cubes not more than three (3) hours after collection. The experiment was done with permission from the management of the hotels.

2.3. In Situ Measurement

In situ measurement of physicochemical properties was carried out. Water temperature, pH, and conductivity were measured in situ using a portable probe. At the sampling point, the measuring probes were lowered into the water and allowed to settle for 1–2 min before the readings were taken. Electrical conductivity was measured using a conductivity probe and expressed in micro Siemens per centimeter (µS cm−1), and temperature in degrees Celsius (°C). The photograph below shows how in situ measurements were taken.

2.4. Laboratory Test (Membrane Filtration Technique)

A standard method (APHA) was used in the laboratory for the enumeration of indicator organisms—total coliform (APHA 9222A), faecal coliform (APHA 9222D), S. aureus (APHA 9221B), and E. coli (APHA 9222D) from swimming pool water samples. Sterilized distilled water (SDW), 0.45 micrometer cellulose membrane filters, pour plate of media: Hicrome, mFC, and Mannitol Salt agar, forceps, and microbiological funnels were used. Before filtration, samples were agitated and 100 mL were filtered through a 0.45 micrometer membrane filter with the aid of a manifold. The membrane filter was placed on selected media (plate) for the enumeration of target pathogenic bacteria using the forceps. The procedure was carried out in a safety cabinet / inoculation chamber.
Plates for the determination of pathogenic organisms other than faecal coliform were transferred into a 37 °C incubator, and that of faecal coliform transferred into a 44 °C incubator for 18 to 22 h. After 22 h, the developed red and blue colonies on the media indicated total coliform (TC). However, blue colonies indicated E. coli. With faecal coliform determination, the developed blue colonies imply faecal counts.

2.5. Laboratory Test (Pour Plate Technique)

A standard method of pour plate technique (APHA 9215B) was applied in the determination of total heterotrophic bacteria. Using a 1 mL pipette, an aliquot of 1 mL was transferred onto a petri dish containing nutrient agar (yeast extract agar) and swirled clockwise and anticlockwise to ensure a homogeneous mixture. The petri dish was then transferred inverted into a 37 °C incubator for 48 h. A colony counter and a magnifying lens were used to count the colony-forming unit (CFU) via grid boxes on the colony counter.

2.6. Data Analysis

The Student t test of Statistica 8.1 for two independent samples was used to assess whether there were differences in the magnitude of physicochemical and bacteria counts in the samples. Data on the various physicochemical and bacteria counts were summarized in tables and charts. Descriptive statistics, comprising of average, range, mean, and standard deviation, were used to measure variations in the parameters.

3. Results

3.1. Physicochemical Parameters

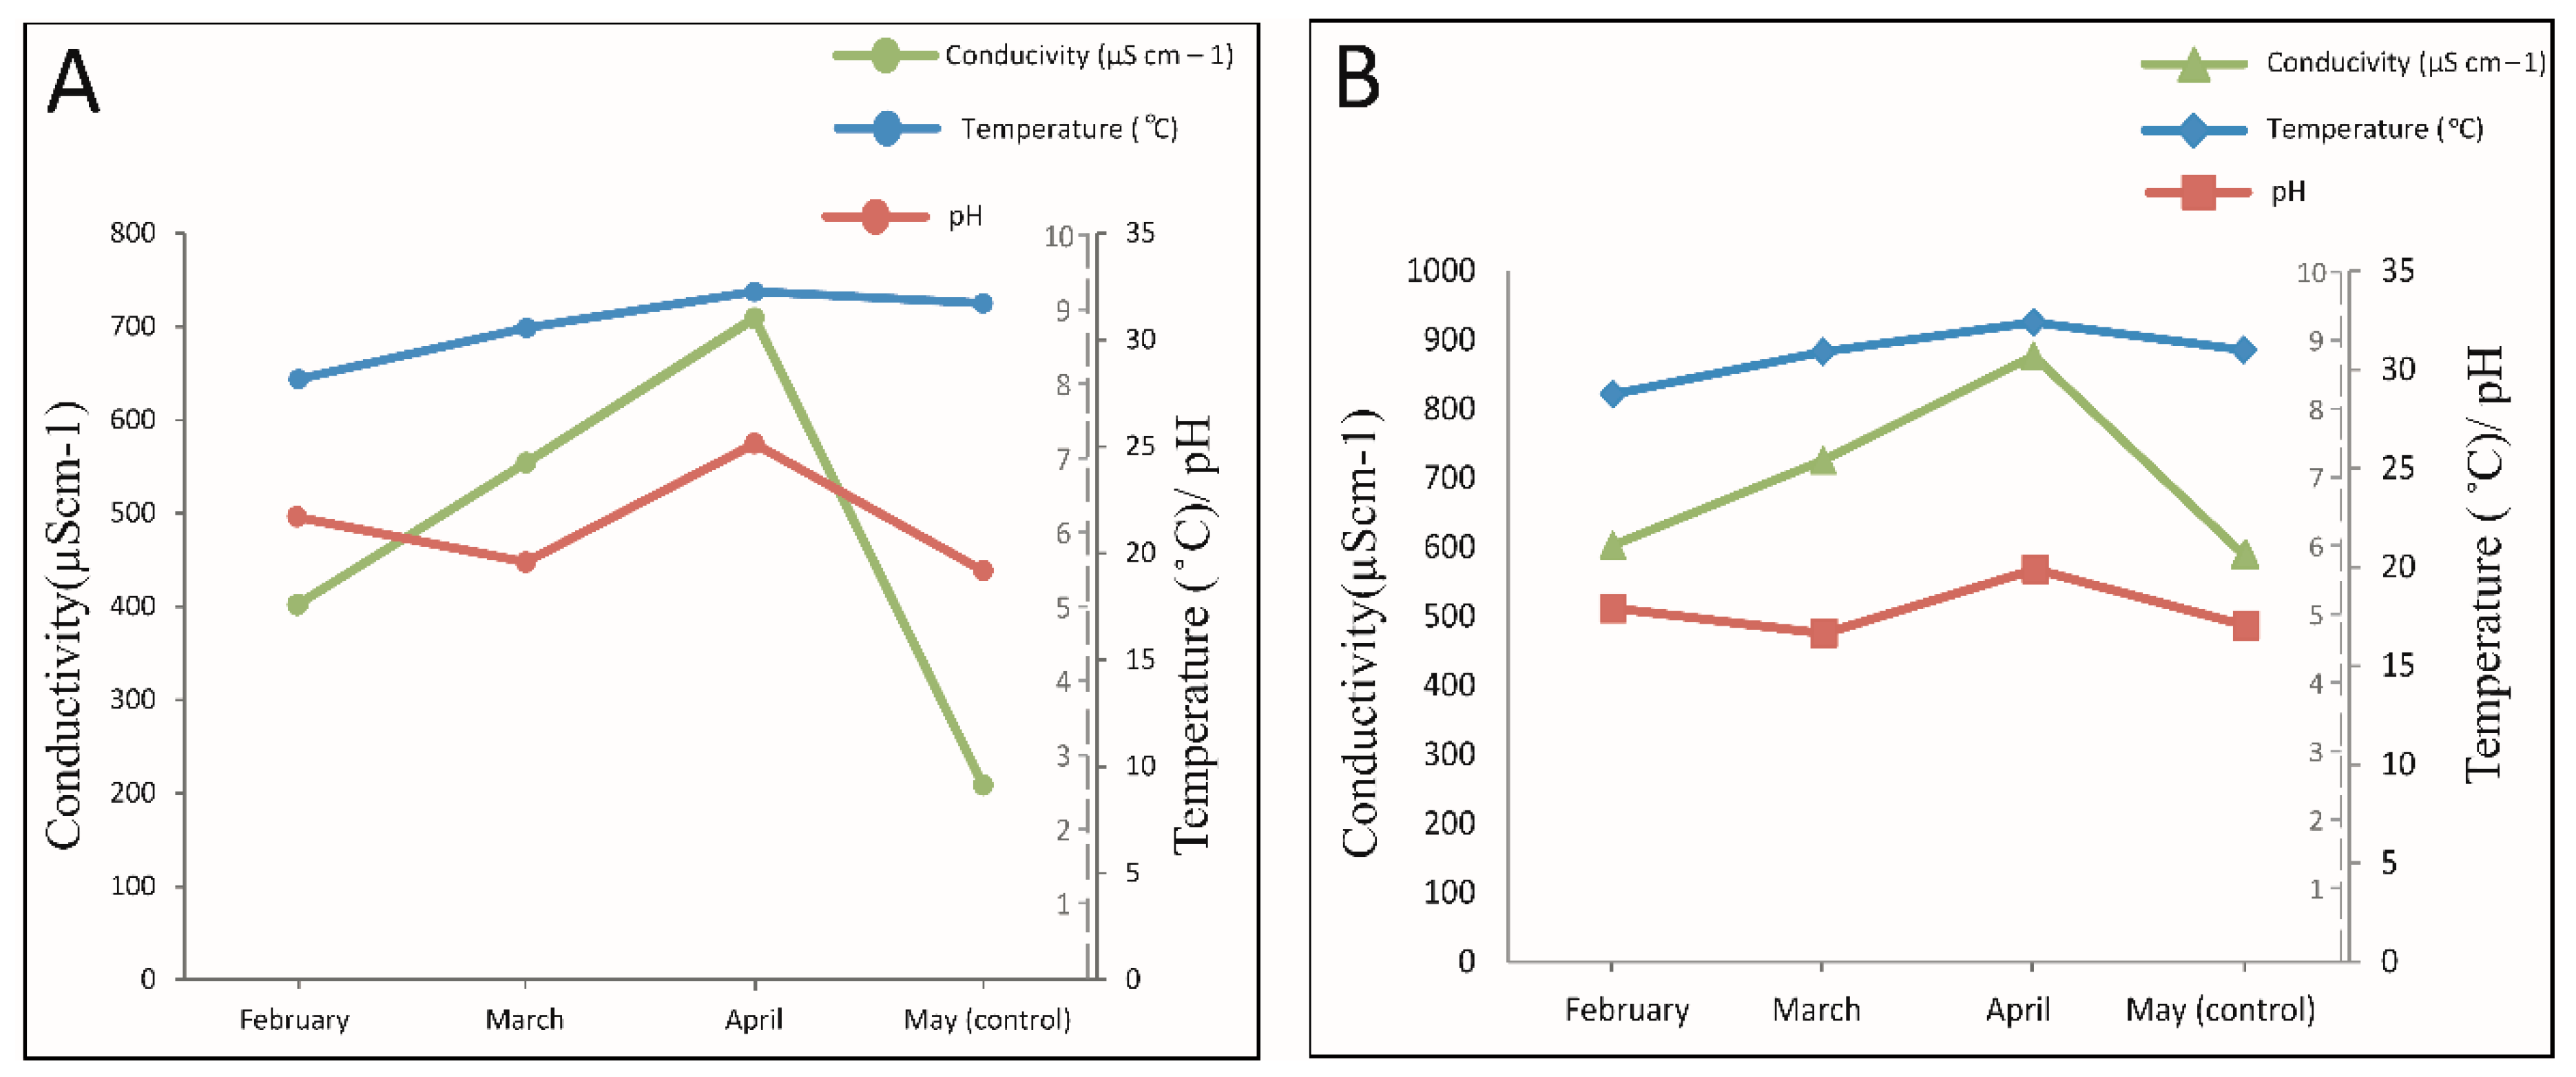
The temperature of the swimming pool waters ranged from 26.5 °C to 32.7 °C, with the highest and the lowest mean values observed in April and February, respectively. The average physicochemical parameters are summarized in Tables S1 and S2. There was no significant difference (p = 0.8888) in temperature between the two swimming pools (Table 1).
The measure of acidity or alkalinity (pH) of the swimming pool water samples ranged from 3.86 ± 0.52 to 7.20 ± 0.62. There was a significant difference (p = 0.0019) in pH between the sample sites (Table 2). While pool ‘B’ shows much higher monthly pH readings, pool ‘A’ showed relatively lower readings (Table 2).
Conductivity ranged from 209 ± 20 to 1044 ± 97 µS cm−1. The minimum mean conductivity level of 469 ± 41 µS cm−1 was observed in pool ‘B.’ Pool ‘A’ had the highest mean level of 928 ± 86 µS cm−1. The difference in conductivity levels in the swimming pools was statistically significant (p = 0.0083) (Table 3).

3.2. Relationship between Temperature (°C), pH, and Conductivity (µS cm−1)

The swimming pool temperatures increased gradually from February and peaked in April, with a decline in May. A similar trend was observed for pH and conductivity throughout the study period. The results show a positive correlation between temperature, pH, and conductivity (Figure 2).

3.3. Isolated Indicator of Microorganism in the Swimming Pool Waters

In swimming pool ‘A,’ water samples taken in April recorded the highest growth in cfu/100 mL of TC (776 cfu/100 mL), FC (388 cfu/100 mL), E. coli (104 cfu/100 mL), S. aureus (17 cfu/100 mL) and THB (330 cfu/mL). The highest level of these bacteria in April was probably due to the highest number of swimmers at a time (>40 people). There was a higher growth of TC, FC, E. coli, and S. aureus at the levels of 18, 8, 3, 7 (cfu/100 mL), respectively, and THB of 63 cfu/mL), respectively in the samples taken when bathers were more than 30 in a pool. Samples taken when swimmers were less than fifteen (15) revealed no growth of TC, FC, or E. coli. All the samples showed the growth of THB, and the growth of S. aureus was observed in most of the samples (Tables S3 and S4). The results revealed the following percentage frequencies for the microorganisms: TC (42.86%), FC (42.86%), E. coli (42.86%), S. aureus (57.14%), and THB (100%).
In swimming pool ‘B,’ the highest TC, FC, and E.coli growth were observed in April (where about 45+ adults and children were in the pool) with respective growth of 485, 291, and 97 (cfu/100 mL). There was no growth of TC, FC, or E. coli in all samples where children were not in the pool and there were a few swimmers (<30 adults). All samples taken when children were in the pool revealed growth of TC, FC, E. coli, and S. aureus in (cfu/100 mL) and THB in (cfu/mL) (Table S4). The results revealed the following percentage frequencies for the microorganisms: TC (28.57%), FC (28.57%), E. coli (28.57%), S. aureus (42.86%), and THB (100%).

3.4. Levels of Indicator Microorganism in the Swimming Pool Waters

Total coliform expressed in colony-forming units per 100 mL of swimming pool water ranged averagely from 0 to 397 (cfu/100 mL). Maximum mean TC (99 ± 199) was observed in swimming pool ‘A’ and the minimum (71 ± 126) observed in pool ‘B’ with no significant difference between them (p = 0.8179). The minimum of 71 ± 126 and maximum of 99 ± 199 mean TC growth were enumerated in pools ‘B’ and ‘A,’ respectively (Table 4).
Faecal coliform (FC) in the swimming pool waters sampled ranged from zero (0) to 196 cfu/100 mL in pool ‘A’ and zero (0) to 26 in pool ‘B’ (Table 5). There was no significant difference of FC in both swimming pool waters as revealed by simple Student t test. The mean FC levels were 50 ± 99 in pool ‘A’ and 7 ± 12 in pool ‘B’ (Table 4).
E. coli count observed in the swimming pool water sources ranged from zero (0) to 54 in pool ‘A’ and from zero (0) to 52 in pool ’B.’ The maximum mean counts observed in ‘A’ and ‘B’ were 14 ± 27 and 13 ± 26, respectively. Water samples from the two swimming pools showed no significant difference in E. coli count in cfu/100 mL (p = 1.00000) (Table 5).
The count in (cfu/100 mL) of S. aureus observed in the swimming pool water sources ranged from zero (0) to 13 (cfu/100 mL) and from zero (0) to 65 in pool ’A’ and ‘B,’ respectively. The minimum (8 ± 6) for mean count of S. aureus was observed in pool ‘A,’ and the maximum (27 ± 27) was observed in pool ‘B.’ Based on Student t test, the difference in S. aureus counts in both swimming pool waters was insignificant (p = 0.2051) (Table 5).
Total Heterotrophic Bacteria (THB) expressed in cfu/mL enumerated from the two swimming pool water sources ranged from 44 to 197 (cfu/100 mL) in pool ‘A’ and 92 to 330 in pool ‘B.’ The highest mean THB level was recorded in pool ‘B’ (163 ± 112), while the lowest (163 ± 112) was recorded in pool ‘A.’ A simple Student t test revealed no statistical difference in THB between the two swimming pool water sources (p = 0.3645).
Samples taken as control (after treatment) observed zero (0) growth of all microorganisms except THB, which was 65 and 126 (cfu/mL) in pool ‘A’ and pool ‘B,’ respectively. The highest growth of bacteria was observed in April, except for S. aureus (Table 5). The percentage frequencies for bacteria calculated in both swimming pool water sources were TC (35.71%), FC (35.71%), E. coli (35.71%), S. aureus (64.29%), and THB (100%). In pool ‘B,’ TC, FC, E. coli, S. aureus, and THB were in the range of (0–397), (0–198), (0–53.5), (0–12), and (44–197), respectively. TC, FC, E. coli, S. aureus, and THB ranged, respectively, at levels of (0–259), (0–150), (0–52), (0–65), and (92–330). Generally, the total bacteria counts in the swimming pools increased with an increasing number of swimmers, especially children (Tables S3 and S4).

3.5. Relationship between Physicochemical Parameters and Bacteria Counts

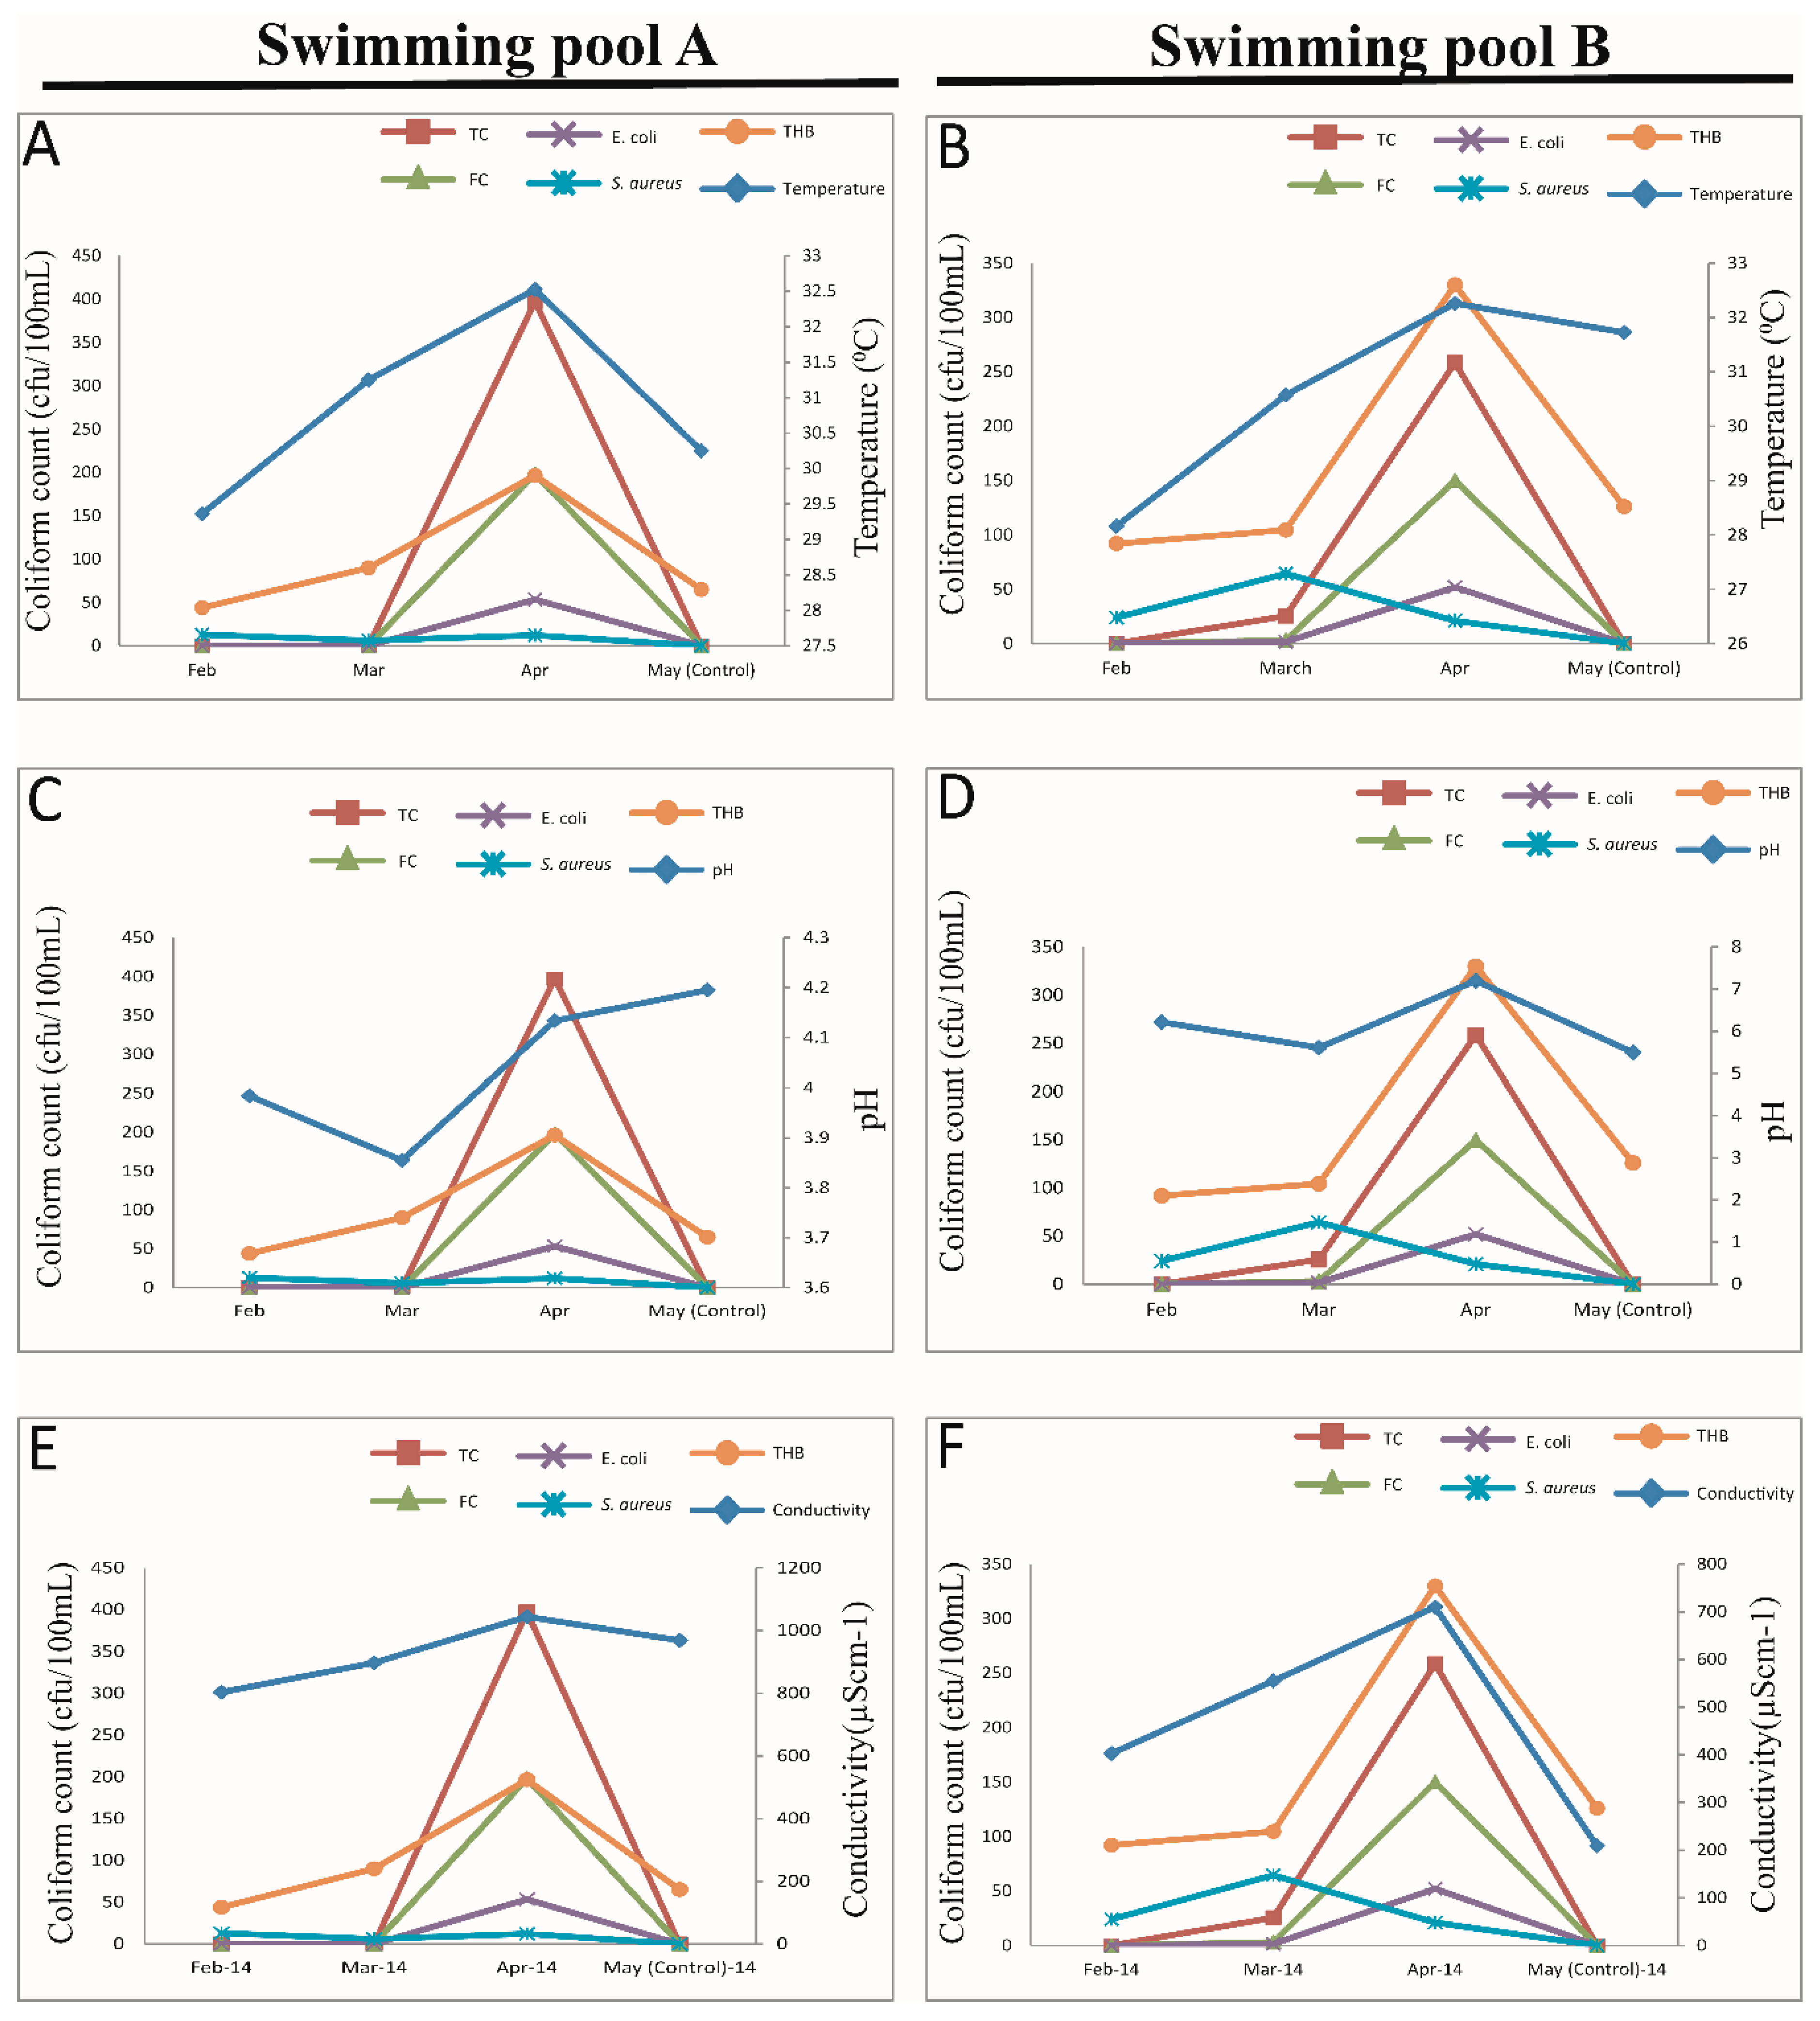
The results show a relationship between temperature and TC, FC, E. coli, and THB in the swimming pools. However, S. aureus had a different trend regardless of the changes in temperature. In April, when the temperature was at its peak, the growth of the types of bacteria enumerated except S. aureus were high (Figure 3A,B). The pH fluctuated with increased and decreased levels of all bacteria enumerated, revealing no steady trend (Figure 3C,D). Conductivity, on the other hand, showed a positive correlation with TC, FC, E. coli, and THB (Figure 3E,F).

4. Discussion

The designing and operation of swimming pools must take into account preventive measures to avoid the spread of disease and to ensure user comfort. During swimming pool operation, disinfection and filtration of the pool water are necessary to destroy microorganisms and to remove pollutants, respectively. Many swimming pools apply chlorine or bromine-based disinfectants to prevent microbial growth. However, chlorination is widely used [22]. Chlorination is, therefore, important in ensuring that our swimming pools are free from microorganisms and safe for swimmers. Therefore, testing for free chlorine and maintaining the proper chlorine levels in swimming pools are important. In this study, chlorine disinfectant was used by the swimming pool operators. Even though we were not able to test for free chlorine during the study due to difficulties in obtaining test kits, studies indicate that water samples with noncomplying free chlorine levels and pH of more than 7.8 were bacteriologically unacceptable [7].

4.1. Physicochemical

The pH of swimming pool water should be controlled to ensure efficient disinfection and coagulation, to avoid damage to the pool fabric, and to ensure user comfort [23]. The pH should be maintained between 7.2 and 7.8 for chlorine disinfectants and between 7.2 and 8.0 for bromine-based and other nonchlorine processes [23]. Mean pH levels in all the swimming pool waters sampled did not conform to this standard. However, 57% of the individual water samples from pool ’A’ were within the acceptable range of 6.5–8.5 [4,10,11,12,24]. Health Protection, New South Wales Government [9], and the Government of South Australia [8] indicated that, if pH is below 7.2, there is the possibility of eye discomfort due to accelerated formation of chloramines, the rapid loss of chlorine, etching of exposed cement, and corrosion of metals. If pH is above 7.6, there is the possibility of reduction of chlorine disinfection efficiency, increased chlorine requirement, eye discomfort, drying of the skin, cloudy water, and scale formation. However, the pH levels of all samples taken in this study were below 7.2 except for one of the samples taken in April in pool ‘A,’ which had a pH level of 7.8. Deficient pH levels or very high values may contribute to irritation of the skin and eyes [12]. Masoud et al. [7] observed that most swimming pools do not comply with the acceptable pH standard. In this study, higher pH corresponded to a higher level of microorganism similar to the findings of [7].
At a lower temperature, water can absorb more calcium, which could cause etching of pool surfaces. Where spa pools are heated, the temperature must never exceed 38 °C. Overheating of the body can cause heat illness [9]. The mean temperature observed did not conform to the findings of [5,6], who reported an average temperature of approximately 26.66 °C. This research showed mean temperatures of 30.87 ± 0.91 °C and 30.68 ± 0.84 °C in Swimming pool ‘A’ and Swimming pool ‘B,’ respectively. The conductivity of the samples varied from 209 ± 20.12 to 1044.38 ± 96.99µS cm−1. Conductivity range of 32 to 7455µS cm−1 has been reported [24]. Temperature and conductivity in this study were observed to influence the bacteriological quality of swimming pool waters. This confirms the findings of Jeophita [6], who stated that physicochemical properties of water such as pH, salinity, temperature, dissolved oxygen, conductivity, and alkalinity provide useful information on water quality and/or the potential of water to support bacteria growth. Conductivity is affected by temperature, as depicted in this study. At a warmer temperature, conductivity increases. This phenomenon is in line with [25], who reported that the warmer the water, the higher the conductivity.

4.2. Microorganismsms

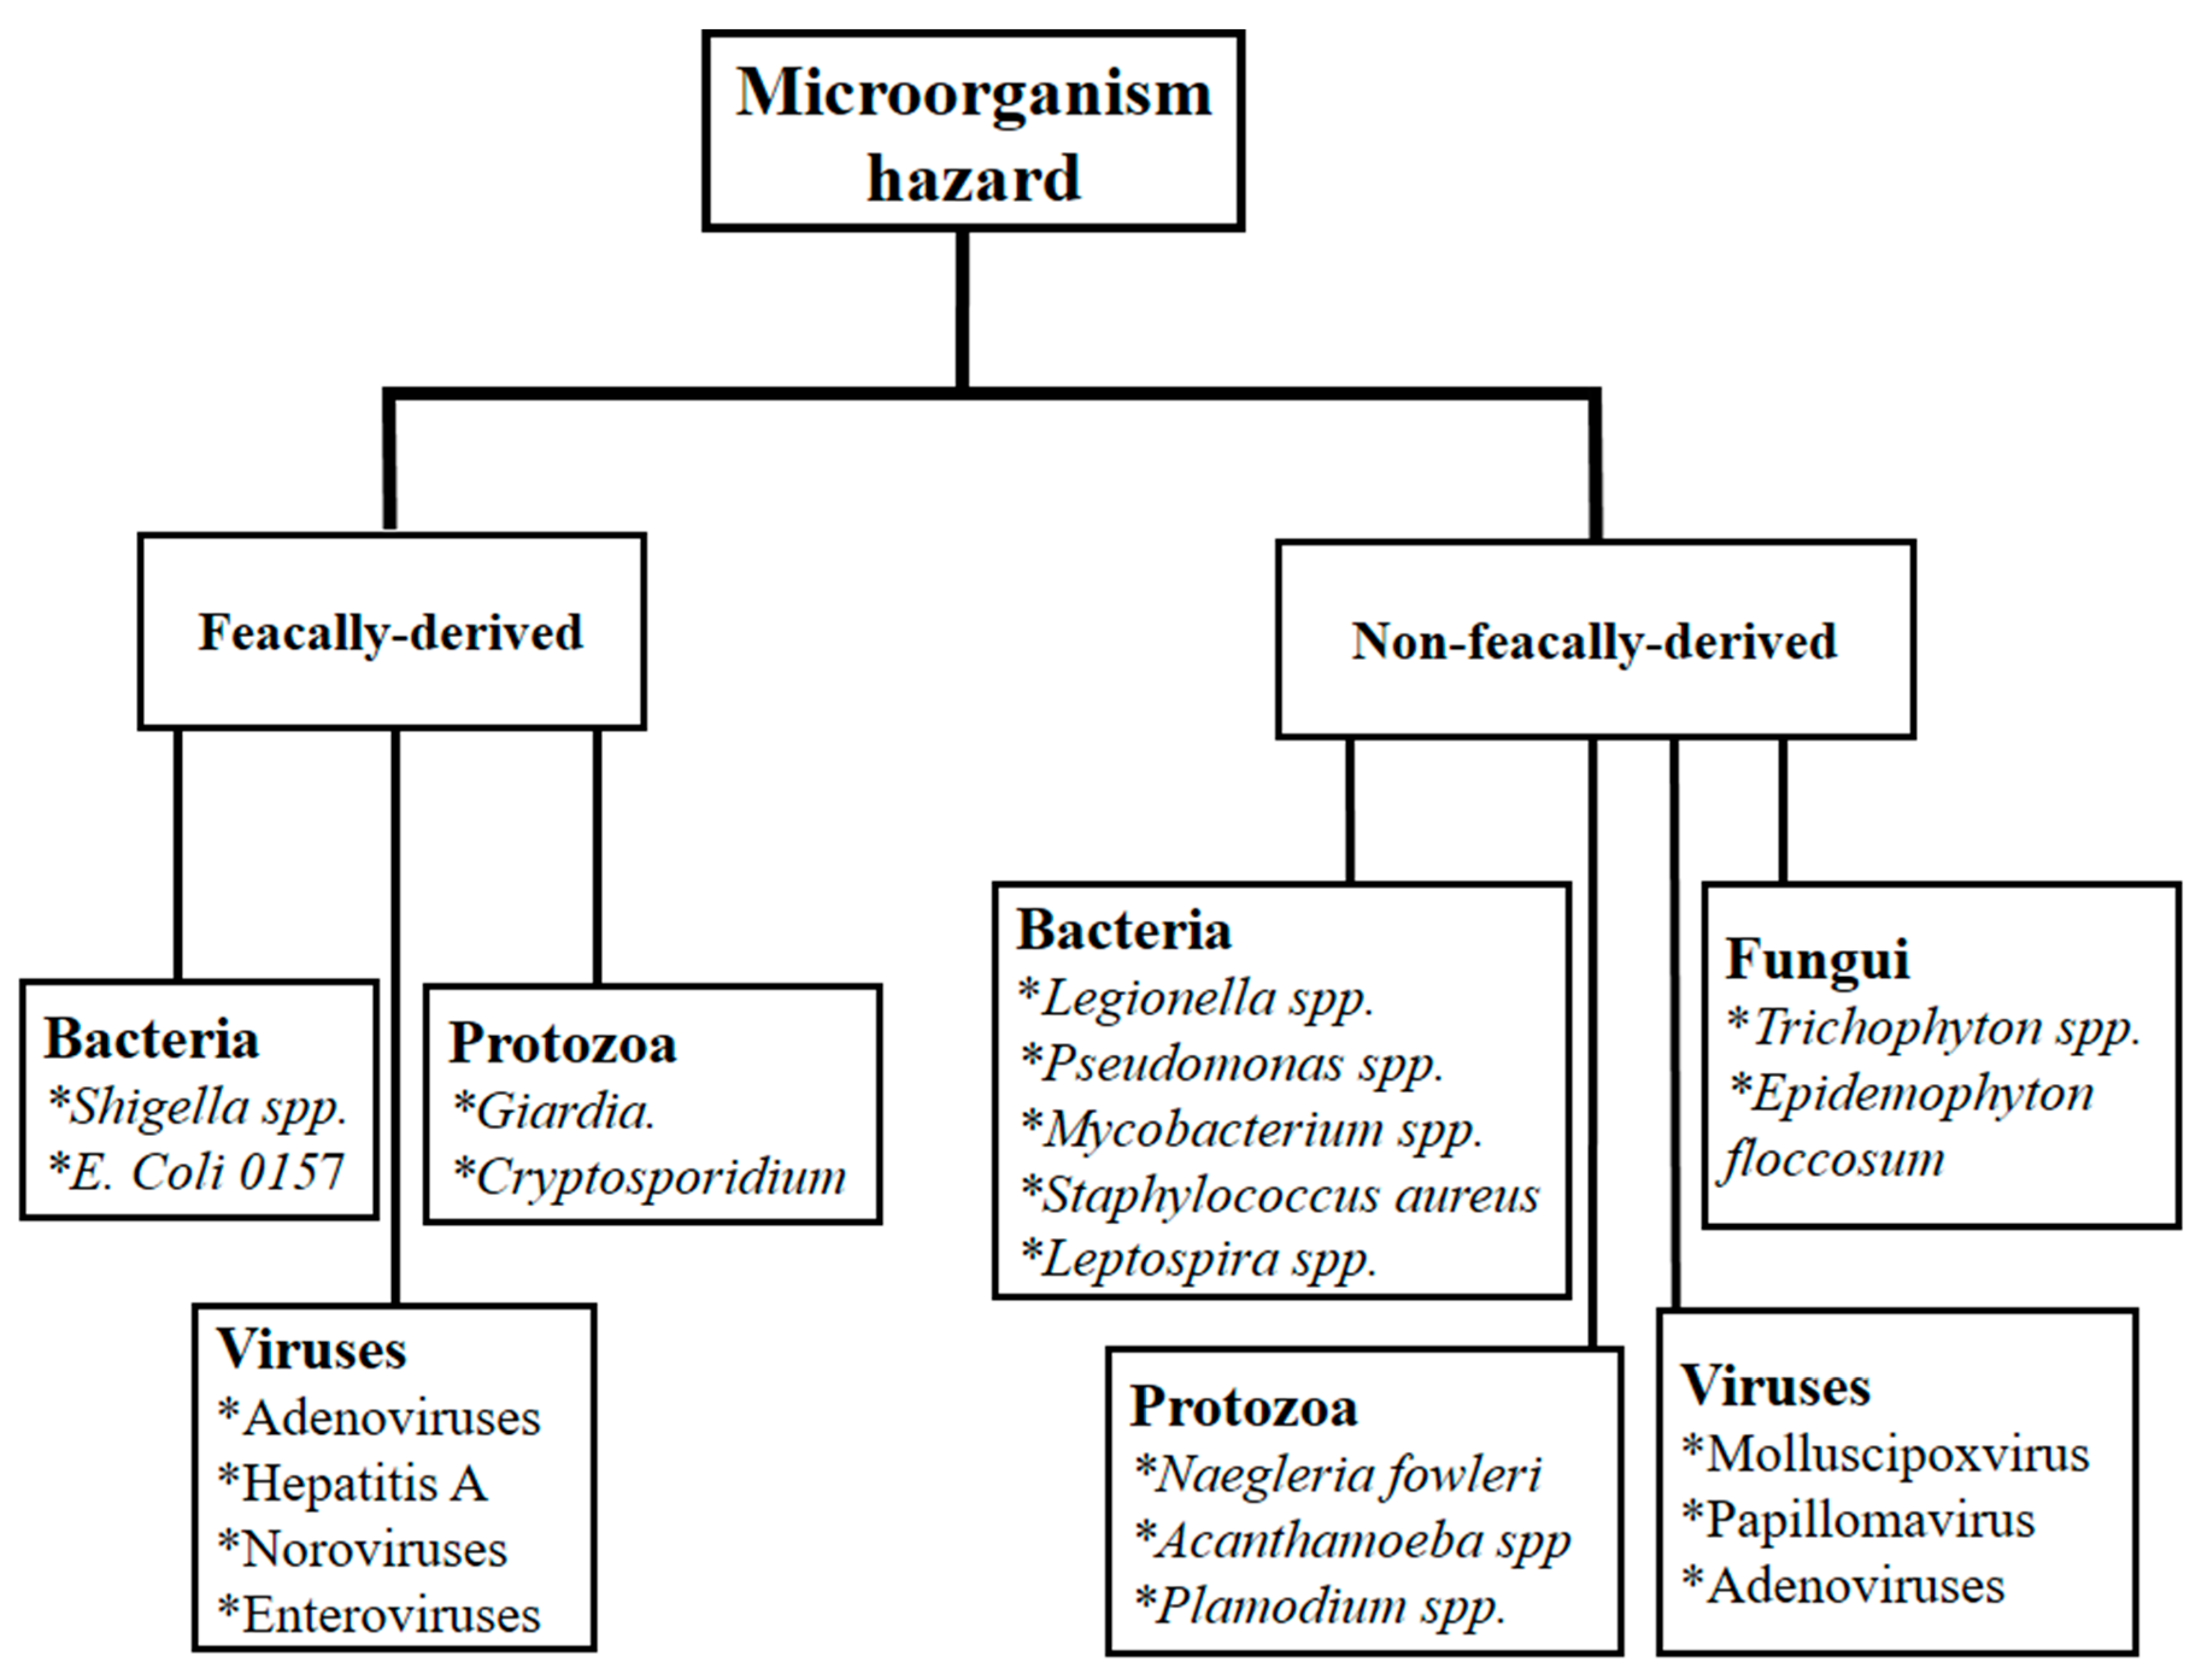
The primary concern for public health associated with bathing in contaminated water comes from microorganisms that are primarily derived from faecal contaminations. Many potential microbial hazards can be present in the environment and can reach water, whether it is fresh or seawater [26,27] (Figure 4). A number of both pathogenic and indicator bacteria were enumerated in this study. All samples taken as control when no human had entered the pool after treatment showed no growth of all the organisms studied except THB. This implies that the source of THB is not mainly humans [5,25]. On the other hand, THB count is an indication of organic and dissolved salt in the water and partly represents all bacteria naturally present in water. In this study, there was a positive relationship between THB and ion concentration (conductivity) [21]. The THB counts of 71% of swimming pool water sampled from pool ‘A’ and 43% from pool ‘B’ were within the limits of 1.0 × 10² cfu/mL, which is the standard limit of heterotrophic count for drinking water [21,25]. One hundred percent of THB enumerated from both pools were within the acceptable operational limit of 200 cfu/mL of recreational water, while 86% of THB observed in pool ‘B’ was above this limit [4,11,12]. The U.S. EPA indicated that a lower concentration of THB in water is linked to better treatment [25].
THB counts increased with an increasing number of bathers, although there was a count of THB in the control when water was treated before bathing. The primary sources of these bacteria in the water are animal and human wastes [25]. These sources of bacterial contamination include surface runoff, pasture, and other land areas where animal wastes are deposited. Additional sources include seepage or discharge from septic tanks, sewage treatment facilities, and natural soil/plant bacteria. The swimming pools studied are outdoor pools, and other sources of bacteria could have come from birds, rodents, and wind action. The THB counts recorded the highest amongst all the microorganisms enumerated, which conforms to the findings of [21].
Total and faecal coliforms enumerated were within the acceptable limit of zero (0) per 100 mL [5,25,28] of drinking water for all the control samples. Approximately 86% of the samples were within the acceptable limits of 100 organisms in 100 mL for both total and faecal coliforms [10,12]. The results indicated that, as the number of swimmers increases, the counts of TC and FC also increase. Total coliform counts were exceedingly high when there were only children, children and adults, and a lot of adults in the pool (17 cfu/100 mL). The high coliform count obtained in the samples may be an indication that the water sources are faecally contaminated. The mucus of users and children not cleaning their private parts well after visiting nature’s call could also be sources of pathogenic organisms. The count of TC in all swimming pool water sources was within the acceptable limit of 500/100 mL [26,28].
E. coli is a good indicator of faecal contamination, provides conclusive evidence of recent faecal pollution, and should not be present in drinking water [29]. The study showed that 71% and 57% of swimming pool water samples from pool ‘A’ and ‘B,’ respectively, were within the acceptable standard of operational levels of less than 1 org/100 mL [12]. Also, E. coli count increases with an increasing number of swimmers. Investigations indicated a strong association between swimming in a pool and infection with E. coli. This indicated that bathers contribute significantly to the number of TC, FC, and E. coli in swimming pools [5,16,17,19].
Bathers usually contribute to S. aureus and Lactobacillus species in pools [5]. Sixty-seven percent of the samples taken when bathing was in progress revealed the growth of S. aureus in pool ‘A’ and 83% was recorded for pool ‘B,’ which agrees with the findings of Robinton and Mood [19], which reported that bathers shed S. aureus under all conditions of swimming. [7] suggested that recreational waters with a high density of bathers present a risk of staphylococcal infection. In this study, samples taken when there were higher numbers of swimmers recorded an S. aureus count of 1 cfu/100 mL, and the highest of 128 cfu/100 mL was recorded when there were fewer swimmers. In the case of this study, the contradiction could be related to a condition where a swimming pool with the highest S. aureus could have actively engaged a high number of swimmers before the sampling day, leading to the accumulation of S. aureus. In some cases, staphylococcus is used as an indicator of potable drinking and high swimming pool water quality [30,31]. An overview of pool and spa regulations in Mediterranean countries with a focus on the tourist industry by Mavridou et al. listed a number of key areas needing urgent attention including, but not limited to, spa regulations, indoor air quality, staff training, tropical diseases, occupational health, and ethical matters [32].

5. Conclusions

Temperature and conductivity showed a positive trend with the growths of TC, FC, E. coli, and THB in all cases, while pH positively correlated with microorganisms. The pH was below the acceptable standard for potable and recreational water set by WHO. However, all the swimming pools studied met the WHO standard of not more than 2000 µS cm−1 of conductivity. Most samples complied with the acceptable level of THB, while TC, FC, E. coli, and S. aureus enumerated from samples taken as control complied with WHO and EPA acceptable standards of drinking and safe recreational water. The probability of bathers ingesting infective doses of bacteria is low, especially when children are not in the pool or when there are fewer swimmers. The only means to practically protect the health of the public from contaminants in swimming pools is to establish standards based on the acceptable risk of health effects. Henceforth, EPA-Ghana, the Ghana tourist board, and Non-Governmental Organizations (NGOs) should embark on research to establish standards for recreational water and also routinely check compliance by swimming pool managers. It will also be prudent for swimming pool operators to regularly check the swimming pool water quality with the support of the Water Research Institute (WRI) of the Council for Scientific and Industrial Research (CSIR) or other recognized institutions.

Supplementary Materials

The following are available online at https://www.mdpi.com/2571-8800/3/2/18/s1, Table S1: Average physicochemical parameters of swimming pool water and time of record in pool ‘A’. Table S2: Average physicochemical parameters of swimming pool water and time of record in pool ‘B’. Table S3: Bacteria enumerated in swimming pool ‘A’. Table S4: Bacteria enumerated in swimming pool ‘B’.

Author Contributions

Conceptualization, S.M.A.; methodology, U.F.M., and S.M.A.; software, U.F.M.; validation, S.M.A. and U.F.M.; formal analysis, U.F.M.; investigation, U.F.M.; resources, G.Q.; data curation, U.F.M.; writing—original draft preparation, U.F.M.; writing—review and editing, U.F.M., S.M.A. and G.Q.; visualization, S.M.A.; supervision, S.M.A.; project administration, G.Q. All authors have read and agreed to the published version of the manuscript.

Funding

This research received no external funding.

Acknowledgments

The authors are extremely grateful to Haruna Mustapha, Khadijatu Adams, and Fauziatu Mustapha for their warm support and funds that made this piece of work a reality. We thank the Department of Fisheries and Aquatic Resources Management, University for Development Studies (UDS) and WRI of CSIR for the facilities provided.

Conflicts of Interest

The authors declare no conflict of interest.

References

  1. Cabelli, V.J. Swimming-Associated Illness and Recreational Water Quality Criteria. Water Sci. Technol. 1989, 21, 13–21. [Google Scholar] [CrossRef]
  2. Alico, R.K.; Dragonjac, M.F. Evaluation of culture media for recovery of Staphylococcus aureus from swimming pools. Appl. Environ. Microbiol. 1986, 51, 699–702. [Google Scholar] [CrossRef] [PubMed] [Green Version]
  3. Lee, S.L.J.; Horsfield, J.; Black, M.A.; Rutherford, K.M.; Fisher, A.; Gemmell, N.J. Histological and transcriptomic effects of 17α-methyltestosterone on zebrafish gonad development. BMC Genom. 2017, 18, 557. [Google Scholar] [CrossRef] [PubMed]
  4. World Health Organization. Guidelines for Safe Recreational Water Environments: Swimming Pools and Similar Environments; World Health Organization: Geneva, Switzerland, 2006; Volume 2, p. 146. [Google Scholar]
  5. Itah, A.Y.; Ekpombok, M.-U.M. Pollution status of swimming pools in south-south zone of south-eastern Nigeria using microbiological and physicochemical indices. Southeast Asian J. Trop. Med. Public Health 2004, 35, 488–493. [Google Scholar]
  6. Mwajuma, J.J. Physicochemical and Bacteriological Quality of Water, and Antimicrobial Susceptibility of Pathogenic Isolates from Selected Water Sources in Samburu South; School of Pure and Applied Sciences, Kenyatta University: Nairobi City, Kenya, 2010; Unpublished work. [Google Scholar]
  7. Masoud, G.; Abbass, A.; Abaza, A.; Hazzah, W. Bacteriological quality of some swimming pools in Alexandria with special reference to Staphylococcus aureus. Environ. Monit. Assess. 2016, 188, 412. [Google Scholar] [CrossRef]
  8. South Australia Health Commission. Standard for the Operation of Swimming Pools and Spa Pools: Supplement C; South Australia Health Commission: Adelaide, South Australia, 2013.
  9. Health Protection NSW. Public Swimming Pool and Spa Pool Advisory Document—Environmental Health; NSW Health: Sydney, Australia, 2013.
  10. Amala, S.E.; Aleru, C.P. Bacteriological Quality of Swimming Pools Water in Port Harcourt Metropolis. Nat. Sci. 2016, 8, 79–84. [Google Scholar] [CrossRef] [Green Version]
  11. WHO. WHO Guidelines for Safe Recreational Water Environments; World Health Organization: Geneva, Switzerland, 2016. [Google Scholar]
  12. WHO. Faecal Pollution and Water Quality; World Health Organization: Geneva, Switzerland, 2003. [Google Scholar]
  13. Sato, M.; Sanchez, P.; Alves, M.; Stoppe, N.; Martins, M. Evaluation of culture media for Candida albicans and Staphylococcus aureus recovery in swimming pools. Water Res. 1995, 29, 2412–2416. [Google Scholar] [CrossRef]
  14. Sabath, N.; Itescu, Y.; Feldman, A.; Meiri, S.; Mayrose, I.; Valenzuela, N. Sex determination, longevity, and the birth and death of reptilian species. Ecol. Evol. 2016, 6, 5207–5220. [Google Scholar] [CrossRef] [Green Version]
  15. Brewster, D.H.; Brown, M.I.; Robertson, D.; Houghton, G.L.; Bimson, J.; Sharp, J.C.M. An outbreak of Escherichia coliO157 associated with a children’s paddling pool. Epidemiol. Infect. 1994, 112, 441–447. [Google Scholar] [CrossRef] [Green Version]
  16. Hildebrand, J.M.; Maguire, H.C.; Holliman, R.E.; Kangesu, E. An outbreak of Escherichia coli O157 infection linked to paddling pools. Commun. Dis. Rep. CDR Rev. 1996, 6, 33–36. [Google Scholar]
  17. Friedman, M.S.; Roels, T.; Koehler, J.E.; Feldman, L.; Bibb, W.F.; Blake, P. Escherichia coli O157:H7 Outbreak Associated with an Improperly Chlorinated Swimming Pool. Clin. Infect. Dis. 1999, 29, 298–303. [Google Scholar] [CrossRef] [PubMed] [Green Version]
  18. Lee, J.Y.; Yang, J.-S.; Han, M.; Choi, J.-Y. Comparison of the microbiological and chemical characterization of harvested rainwater and reservoir water as alternative water resources. Sci. Total Environ. 2010, 408, 896–905. [Google Scholar] [CrossRef] [PubMed]
  19. Robinton, E.D.; Mood, E.W. A quantitative and qualitative appraisal of microbial pollution of water by swimmers: A preliminary report. Epidemiol. Infect. 1966, 64, 489–499. [Google Scholar] [CrossRef] [PubMed] [Green Version]
  20. Indabawa, I.I.; Ali, S.; Mukhtar, M.D. Assessment of Microbiological and Physico-Chemical Quality of Some Swimming Pools within Kano Metropolis, Kano Nigeria. In Proceedings of the 3rd International Conference on Biological, Chemical and Environmental Sciences, Kuala Lumpur, Malaysia, 21–22 September 2015. [Google Scholar]
  21. Shittu, O.; Olaitan, J.; Amusa, T. Physico-chemical and bacteriological analyses of water used for drinking and swimming purposes in abeokuta, nigeria. Afr. J. Biomed. Res. 2010, 11, 285–290. [Google Scholar] [CrossRef] [Green Version]
  22. Chowdhury, S.; Alhooshani, K.; Karanfil, T. Disinfection byproducts in swimming pool: Occurrences, implications and future needs. Water Res. 2014, 53, 68–109. [Google Scholar] [CrossRef] [PubMed]
  23. Chango, G.; Palacio, E.; Cerdà, V. Potentiometric chip-based multipumping flow system for the simultaneous determination of fluoride, chloride, pH, and redox potential in water samples. Talanta 2018, 186, 554–560. [Google Scholar] [CrossRef]
  24. Sila, O.N.; Nzung’A, S.O. Physico-chemical and bacteriological quality of water sources in rural settings, a case study of Kenya, Africa. Sci. Afr. 2019, 2, 2. [Google Scholar] [CrossRef]
  25. U.S EPA. Safe Drinking Water Act (SDWA); U.S EPA: Washington, DC, USA, 2003.
  26. Kay, D.; Fawell, J. Standards for Recreational Water Quality; Foundation for Water Research: Buckinghamshire, UK, 2007. [Google Scholar]
  27. Blostein, J. Shigellosis from swimming in a park pond in Michigan. Public Health Rep. 1991, 106, 317–322. [Google Scholar]
  28. Wade, T.J.; Pai, N.; Eisenberg, J.N.S.; Colford, J.M. Do U.S. Environmental Protection Agency water quality guidelines for recreational waters prevent gastrointestinal illness? A systematic review and meta-analysis. Environ. Health Perspect. 2003, 111, 1102–1109. [Google Scholar] [CrossRef]
  29. Sueiro, R.A.; Araujo, M.; Santos, C.J.; Gómes, M.J.; Garrido, M.J. Evaluation of Coli-ID and MUG Plus media for recovering Escherichia coli and other coliform bacteria from groundwater samples. Water Sci. Technol. 2001, 43, 213–216. [Google Scholar] [CrossRef]
  30. Favero, M.S.; Drake, C.H.; Randall, G.B. Use of Staphylococci as Indicators of Swimming Pool Pollution. Public Health Rep. 1964, 79, 61. [Google Scholar] [CrossRef]
  31. Lechevallier, M.W.; Seidler, R.J. Staphylococcus aureus in rural drinking water. Appl. Environ. Microbiol. 1980, 39, 739–742. [Google Scholar] [CrossRef] [PubMed] [Green Version]
  32. Mavridou, A.; Pappa, O.; Papatzitze, O.; Blougoura, A.; Drossos, P. An overview of pool and spa regulations in Mediterranean countries with a focus on the tourist industry. J. Water Health 2014, 12, 359–371. [Google Scholar] [CrossRef] [PubMed]
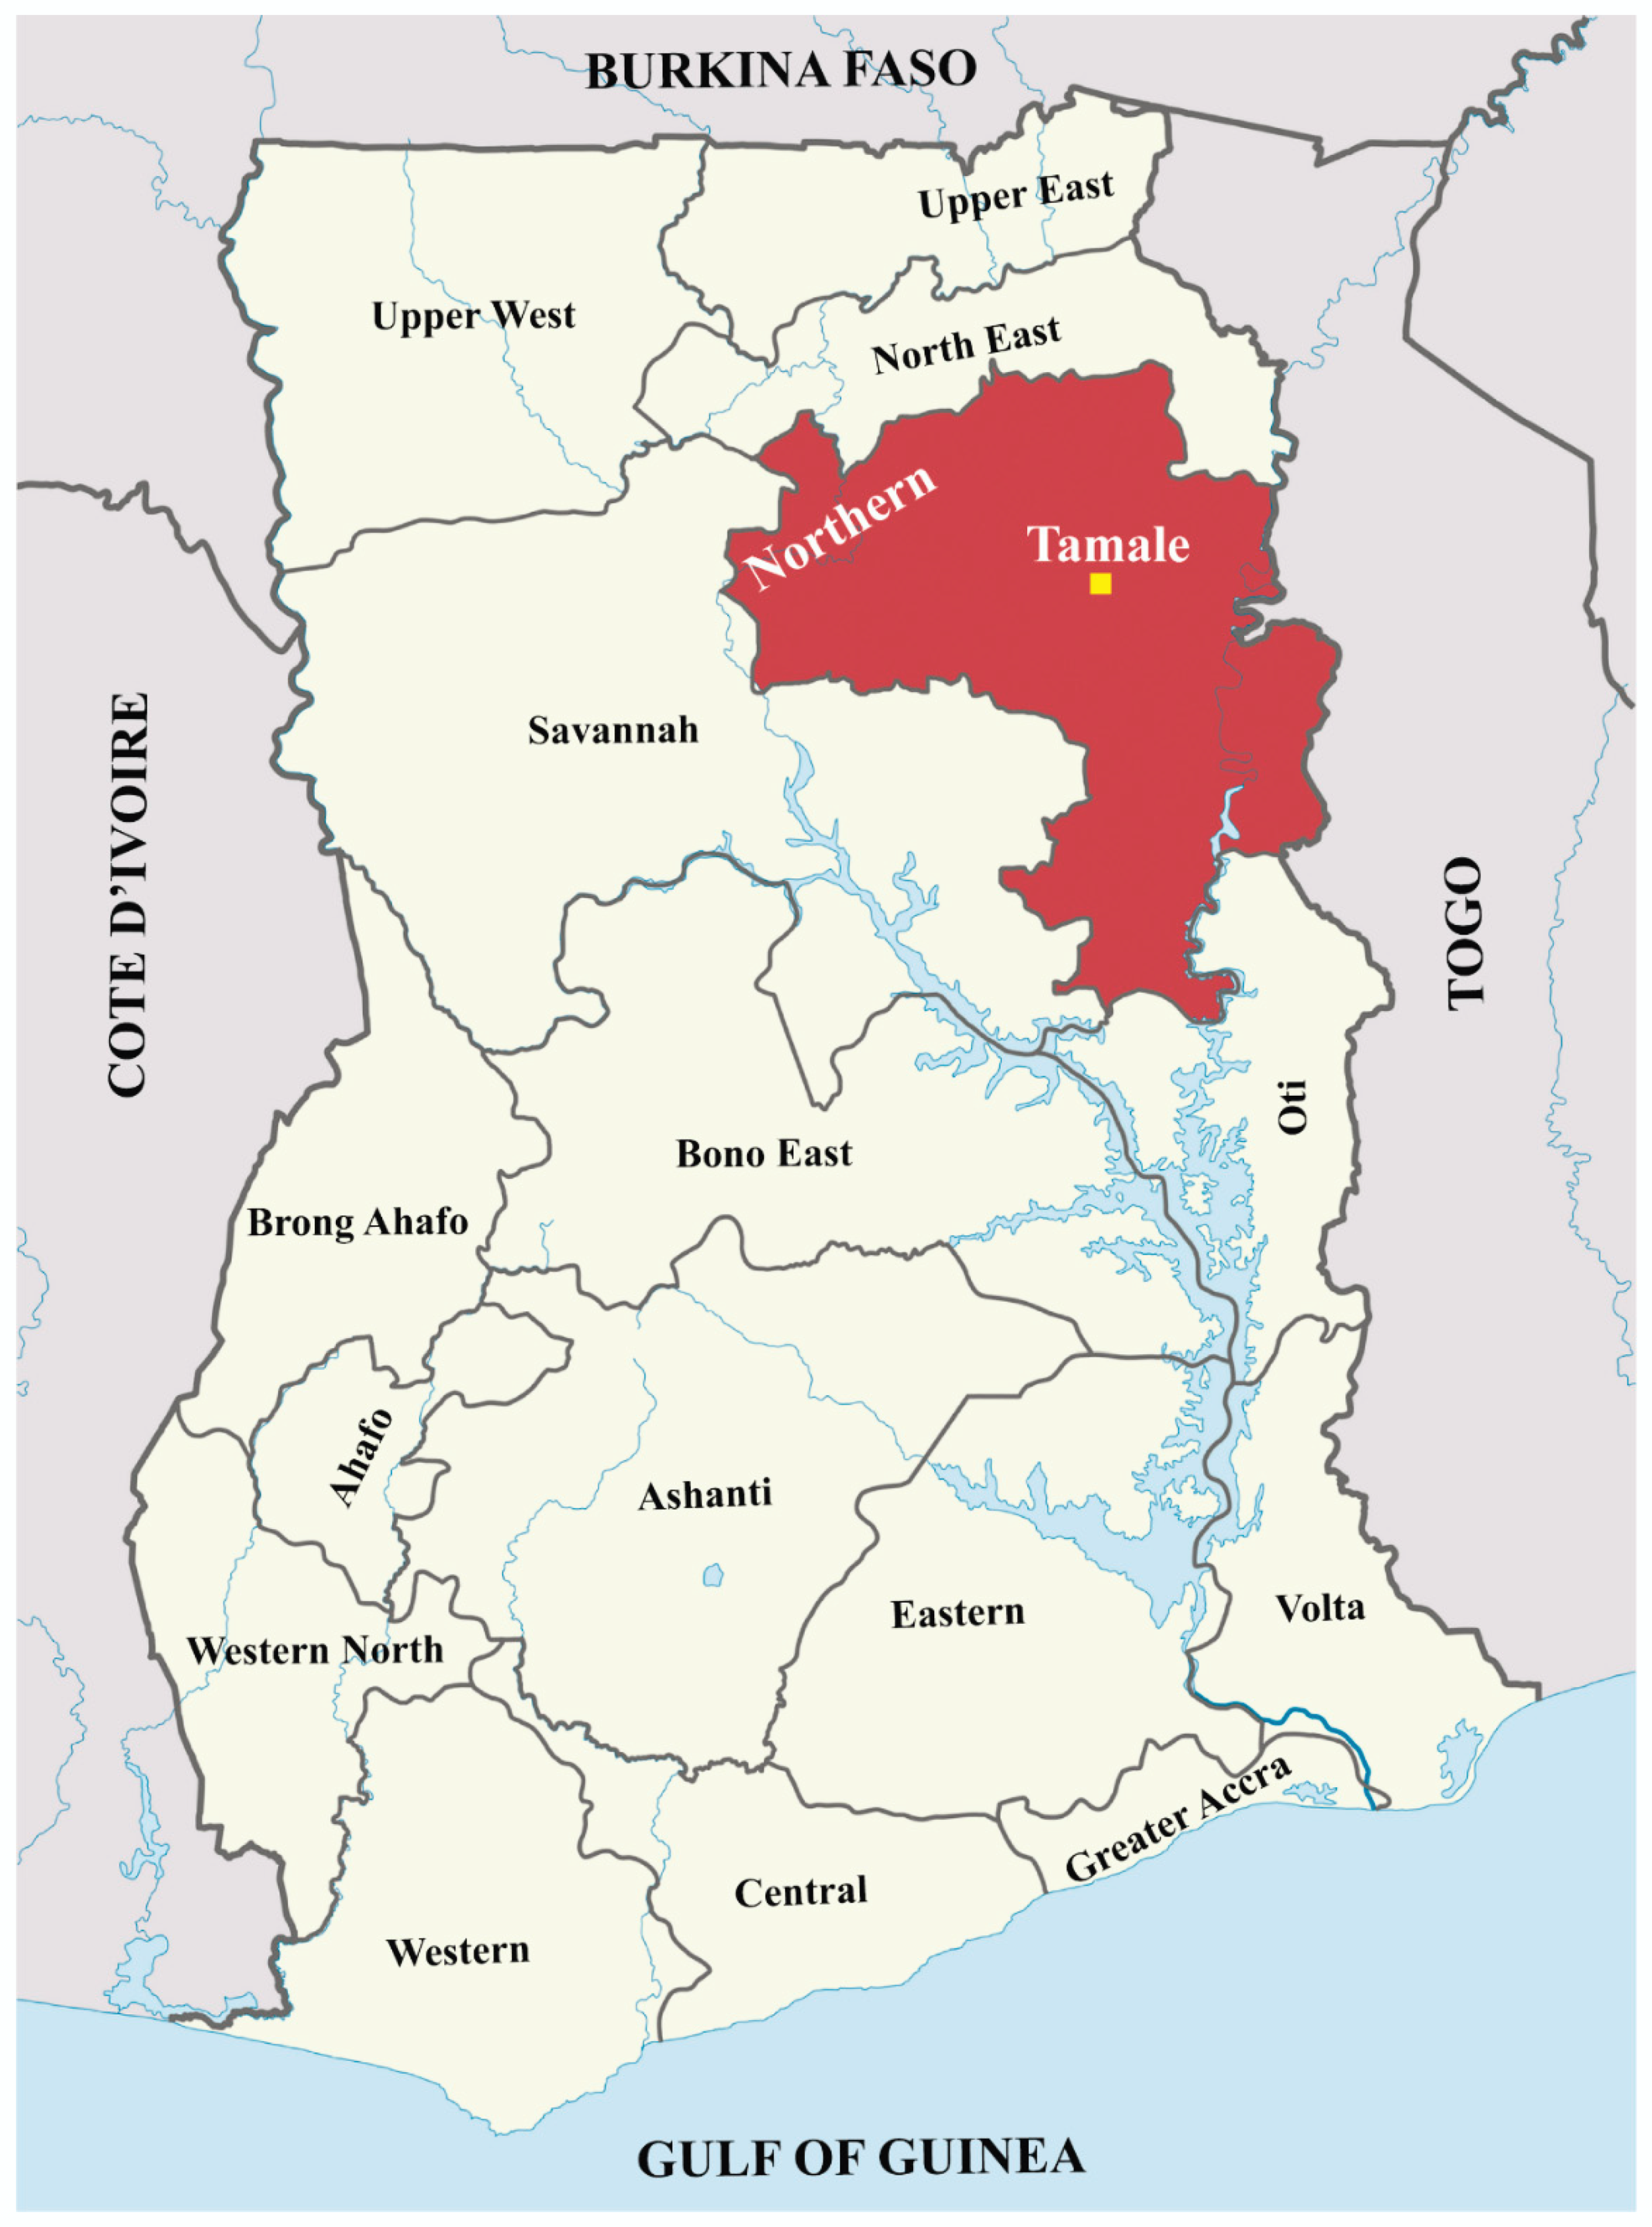
Figure 1. Map of Ghana showing the study area, Tamale Metropolis. (Adapted and modified from https://commons.wikimedia.org/w/index.php?curid=75391034).
J 03 00018 g001
Figure 2. Relationship between temperature, pH and conductivity observed in two swimming pools (‘A’ and ‘B’) in the Tamale Metropolis. The broken y-axes indicate pH, while the continuous line indicates temperature.
J 03 00018 g002
Figure 3. A graph of bacteria counts against temperature (A,B), pH (C,D), and conductivity (E,F) observed in the swimming pools. It should be noted that THB was measured in cfu/mL.
J 03 00018 g003
Figure 4. Potential microbial hazards in pools and similar environments. Modified from [4].
J 03 00018 g004
Table 1. Mean and p-values of swimming pool water temperatures in the Tamale Metropolis.
MonthSwimming Pool ‘A’Swimming Pool ‘B’
Feb – 1429.4 ± 2.428.2 ± 1.7
Mar – 1431.3 ± 1.430.6 ± 1.0
Apr – 1432.5 ± 0.032.3 ± 0.2
May (Control) – 1430.3 ± 1.031.7 ± 0.5
Mean30.8 ± 0.930.7 ±0.8
p-value (t-test)0.8889
Table 2. Mean and p-values of pH of swimming pool waters in the Tamale Metropolis.
MonthSwimming Pool ‘A’Swimming Pool ‘B’
Feb.3.98 ± 0.516.21 ± 0.36
Mar.3.86 ± 0.525.60 ± 1.28
Apr.4.13 ± 0.027.20 ± 0.62
May (Control)4.19 ± 0.285.49 ± 0.01
Mean4.04 ± 0.266.13 ± 0.57
p-value (t-test)0.0019
Table 3. Mean and p-values of conductivity levels in the swimming pools in the Tamale Metropolis.
MonthSwimming Pool ‘A’Swimming Pool ‘B’
Feb. – 14803 ± 151403 ± 32
Mar. – 14897 ± 38555 ± 71
Apr. – 141044 ± 97710 ± 61
May (Control) – 14968 ± 57209 ± 20
Mean928 ± 86469 ± 41
p-value (t-test)0.0083
Table 4. Mean counts of bacteria observed in swimming pools ‘A’ and ‘B’ in the Tamale Metropolis from February 2014 to May 2014.
SourceTotal Coliform (TC)Faecal Coliform (FC)Escherichia coliStaphylococcus aureusTotal Heterotrophic Bacteria (THB) (cfu/mL)
Pool ‘A’99 ± 19950 ± 9914 ± 278 ± 6 99 ± 68
Pool ‘B’71 ± 1267 ± 12 13 ± 2627 ± 27163 ± 112
All values are in cfu/100 mL unless specified.
Table 5. Bacteria counts isolated from the two studied swimming pools with their significant values (p-values). ‘A’ and ‘B’ represent the two different swimming pools.
TC FCE. coliS. aureusTHB (cfu/mL)
MonthNo. of Samples‘A’‘B’‘A’‘B’‘A’‘B’‘A’‘B’‘A’‘B’
Feb.200000013244492
Mar.2026030266590105
Apr.23972591982654521221197330
May (Control)10000000065126
p-Value0.81790.42821.00000.20510.3645
All values are in cfu/100 mL unless specified.