Article

Lignin Purification from Mild Alkaline Sugarcane Extract via Membrane Filtration

by
Nga Thi-Thanh Pham
1,*,
Nicolas Beaufils
1,2,
Jérôme Peydecastaing
1,
Philippe Behra
1 and
Pierre-Yves Pontalier
1,*
1
Laboratoire de Chimie Agro-Industrielle, Université de Toulouse, INRAE, Toulouse INP, 31030 Toulouse, cedex 4, France
2
École d’Ingénieurs de Purpan, Toulouse INP, BP 57611, 31076 Toulouse, France
*
Authors to whom correspondence should be addressed.
Clean Technol. 2024, 6(2), 750-766; https://doi.org/10.3390/cleantechnol6020038
Submission received: 12 March 2024 / Revised: 12 May 2024 / Accepted: 27 May 2024 / Published: 12 June 2024

Abstract

:
In this study, the separation of lignin from a mild alkaline sugarcane bagasse extract was studied, and the impacts of different parameters on the filtration performance were evaluated. The tested parameters included transmembrane pressure (0.5–3.0 bar), shear rates (2831–22,696 s−1), temperature (20 and 40 °C), membrane molecular weight cut-off (5 and 10 kDa), and membrane material (polyethersulfone and polysulfone). During the filtration process, the permeate flux and all the main components of the extract were analyzed, including lignins (acid insoluble lignin and acid soluble lignin), sugars (xylose, arabinose, glucose, and galactose), total phenolic compounds, and phenolic acids (p-coumaric acid, ferulic acid, vanillin, and 4-hydroxybenzaldehyde). It was proved that the tested conditions had a great impact on the permeate flux and molecule retention rate. Increasing the temperature from 20 to 40 °C resulted in a much higher permeate flux for the 5 kDa PES membrane, and the impact of shear rate was greater at 40 °C for this membrane. Although the 5 kDa PES membrane could retain slightly more large molecules, i.e., acid-insoluble lignin and xylose, the 10 kDa membrane afforded greater phenolic acid removal capacity, leading to higher purity. For the 10 kDa PS membrane, the polarization layer began to form at TMP below 0.5 bar. This membrane had a lower retention rate for all molecules than the 10 kDa PES membrane.

1. Introduction

Lignin is a class of phenolic compounds found as a cell wall constituent of all vascular plants. It is estimated that more than 3 × 10¹¹ tons are available, representing about 30% of all non-fossil carbon on Earth. The lignin content depends on plant type, for example, soft-wood contains 29–34% lignin, meanwhile hard-wood contains 24–26% lignin [1]. In the past decades, lignin has received considerable attention for different industrial applications like the production of foam and an adsorbent for water treatment [2]. However, it was reported that only 2% of lignin was used in industrial applications because of the large complexity of the produced fractions [3]. Therefore, lignin recovery is an important task for producing valuable chemical products. Sugarcane bagasse (SCB) is one of the most produced lignocellulosic biomasses for second-generation biorefineries. The recovery of cellulose from SCB has been extensively researched and implemented, but the purification and recovery of lignin from SCB extract is still poorly studied.
There are several lignin extraction methods, resulting in different structures and chemical properties of the extracted fraction, which has an impact on subsequent applications. In general, the extraction methods of lignin are classified into two main categories, chemical (mainly sulfur and sulfur-free processes) and mechanical (mainly refining and grinding). Chemical processes are commonly used in the paper industry and are based on the cleavage of ester and ether bonds [4]. However, these processes require a high cost of chemicals and energy, as well as expensive equipment to deal with corrosion. In the last decade, mild alkaline fractionation has received more attention in the frame of cellulosic ethanol biorefineries. The introduction of a mild alkaline solution breaks down the cell wall, disrupting the macromolecule components, solubilizing hemicelluloses and lignins while cellulose remains in the solids [5]. During the reaction, phenolic monomers such as p-coumaric acid and ferulic acid, which function as lignin–carbohydrate bridges, are also solubilized and recovered in the extract. Oriez et al. (2019) performed the mild alkaline extraction of sugarcane bagasse and produced extracts with 1.3 g L−1 of phenolic monomers (mainly p-coumaric acid) [6].
In order to recover isolated lignin from the other extracted molecules, three main methods have been applied including sequential organic solvent extraction, selective precipitation, and membrane ultrafiltration [7,8,9]. The major drawback of the first two methods comes from the addition of chemicals to the process stream, as opposed to membrane filtration. This process has excellent fractioning capacity, low chemical consumption, and a low energy requirement. Additionally, lignin can be purified directly without adjusting pH and temperature; the molar mass of lignin fractions could be controlled by the molecular weight cut-off (MWCO) of the membrane. According to Toledano et al. (2010), lignin fractions obtained via ultrafiltration are less contaminated by lignin–carbohydrate complexes than precipitated lignins [10]. However, ultrafiltration efficiency is limited by a high degree of fouling which may reduce the permeate flux; and the separation between lignin and hemicellulose is difficult [11].
During the filtration process, the membrane properties (i.e., MWCO and material) and operating conditions (i.e., transmembrane pressure, temperature, and shear rate) could have significant impact on the permeate flux and retention rate of molecules. Several researchers have studied the separation of lignin and hemicelluloses by varying different operating parameters [12,13,14,15]. Persson et Jonsson (2010) found that the average molecular mass of hemicellulose is between 5 and 10 kDa, whereas the molecular mass distribution of lignin is about 1 kDa. The study suggested that the ultrafiltration membrane with a MWCO between 1 and 10 kDa could be used to retain hemicelluloses and allow a part of lignin to pass through [14]. It is difficult to prevent the flux decline due to the wide molecular weight distribution of lignin molecules and other components in the solution during the purification of the extracts [16]. But under the critical flux, it was proved that the retention rate of molecules reduced with the increase in permeate flux but rose when a gel layer formed on the membrane surface. However, above the critical flux, gel formation can act as an additional permeation barrier and can increase the molecule retention rate. The properties of this additional barrier depend on the transmembrane pressure, the crossflow velocity used, and the molecular mass of the molecules [14]. Increasing the temperature reduces the permeate viscosity and results in higher back-diffusion rates for the retained molecules on the membrane surface. In addition, the surface roughness of the membrane was found to have significant influence on the fouling characteristics, in which membranes with a rough surface have higher fouling than smooth ones [17]. In general, hydrophobic membranes are more prone to fouling than hydrophilic ones, and they have larger contact angles.
Therefore, the objective of this study was to purify lignin from a mild alkaline extract from sugarcane bagasse. The impact of different parameters was tested such as transmembrane pressure, shear rates, temperature, membrane molecular weight cut-off, and membrane material. Besides the retention rate of lignin, other indicators were also considered such as permeate flux, retention rate of hemicelluloses, total phenolic compounds, and the removal of small molecules such as phenolic acids.

2. Materials and Methods

2.1. Sugarcane Bagasse Extract

Sugarcane bagasse (SCB) was provided by eRcane which is located in La Réunion, France. The material contains around 38.8% glucose, 19.5% xylose, 1.5% arabinose, 0.3% galactose, 21.3% acid-insoluble lignin, and 6.03% acid-soluble lignin (Table 1). In order to homogenize the raw SCB and increase the extraction yields at the following chemical fraction steps, the SCB was ground to a size between 0.25 and 0.8 mm. A mixture of 2.5 kg of SCB and 50 L of 0.5 M NaOH was stirred in a stainless steel-lined vessel (De Dietrich, Zinswiller, France) for 3 h at 65 °C. The solid residue was removed with a top-discharge vertical basket centrifuge (RC 50 PX R, Rousselet, France) equipped with a 5 μm polypropylene bag. Then, this residue was rinsed with distilled water, dried at 50 °C for 48 h, and ground with a microfine grinder (IKA MF 10 basic) on a 1 mm sieve before analysis. The filtered extract was analyzed and used as the feed of the membrane filtration experiments.
In the extract, there were four sugars detected including glucose, xylose, arabinose, and galactose; all these sugars were under oligomeric form. Among them, xylose was the dominant sugar with a concentration of 1.98 g L−1, followed by arabinose (0.5 g L−1), galactose (0.1 g L−1), and glucose (0.06 g L−1). Four phenolic monomers were presented in detectable amounts such as p-coumaric acid, ferulic acid, vanillin, and 4-hydroxybenzaldehyde, accounting for 1.22 g L−1, 0.13 g L−1, 0.03 g L−1, and 0.02 g L−1, respectively.
All of the used chemicals were purchased from Sigma Aldrich company (St. Louis, MO, USA).

2.2. Membrane Filtration Process

The membrane filtration experiments were carried out by recycling both permeate and retentate to the feed tank in order to reach steady states (Figure 1). The solution was stored in a 5 L feed tank and circulated to the membrane with a gear pump (Johnson Pump, model 10/0005, Delavan, WI, USA). The transmembrane pressure (TMP) was determined via two manometers (Tecsis, Offenbach, Germany). The feed flowrate was determined with a flowmeter (Rosemount, Mexicali, Mexico). The temperature of the solution was controlled with a hot plate (Heidolph, Schwbach, Germany) at the bottom of the feed tank and a heat exchanger system on the retentate stream for cooling.
The transmembrane pressure (TMP) is calculated with Equation (1):
TMP = P inlet + P outlet 2   P permeate
where Ppermeate is equal to atmospheric pressure and Pinlet and Poutlet are relative pressures.
The shear rate ɣ (s−1) is provided with Equation (2):
ɣ = 4 Q π r 3
where Q is the volumetric flow rate through a fiber (m3 s−1) and r is the fiber radius (m).
The Reynolds number is defined in Equation (3):
Re = ρ u d µ
where ρ and µ are the density (kg m3) and viscosity (kg m1 s1) of the fluid, u is the flow speed (m s1), and d is the hydraulic diameter of the membrane module (m).
The permeability of water ( J p ) and the hydraulic resistance R m of the membrane are calculated based on Darcy’s law, as in Equation (4):
J p = T M P µ R m
where TMP is the transmembrane pressure and µ is the solution viscosity.
When filtering a solution, several forms of transfer limitations can lead to a reduction in the permeability of the membrane. Darcy’s law is thus modified by considering these limitations, and calculated as in Equation (5):
J p = T M P π µ R t
where π is the osmotic pressure (bar or Pa or kg m−1 s−2) and R t is the total resistance (m−1).
Osmotic pressure could reduce the effectiveness of TMP. However, since the extract is mainly composed of macromolecules, it can be assumed that the osmotic pressure involved in the transfer is low and therefore negligible. The total hydraulic resistance ( R t ) is the sum of a series of resistances:
R t = R m   +   R a + R p l + R p b + R d
where R m is the resistance of the membrane, R a is the resistance due to the adsorption, R p l is the resistance due to the polarization layer, R p b is the resistance due to the pore blocking and R d is the resistance due to the deposit (i.e., cake formation or gel layer).

Impact of Different Parameters

Three hollow-fiber membranes were used to filter the SCB alkaline extract, including two PES hollow fiber membranes and one PS hollow fiber membrane. The characteristics of these membranes are described in Table 2.
Firstly, the impact of temperature (20 and 40 °C) was tested on the 5 kDa PES membrane. At both temperatures, four different shear rates were applied including 2831, 5662, 11,323, 16,985, and 22,647 s−1, and the transmembrane pressure varied from 0.5 to 3.0 bar (Table 3). The permeates were collected in all conditions and analyzed to choose the condition with the best filtration performance. Then, a 10 kDa PES membrane was used with the optimal temperature to evaluate the impact of the membrane molecular weight cut-off. Finally, the influence of the membrane’s nature was performed between the 10 kDa PES and PS membranes. These membrane materials have different properties of surface charge and degree of hydrophobicity that could impact the filtration performance and fouling phenomenon to some extent [18,19,20,21].
The retention rate of molecules via the membrane was calculated with Equation (7):
Retention   rate   ( % ) = 1     C permeate C feed × 100
The removal capacity for phenolic acids was calculated with Equation (8) below:
Removal   capacity   ( % ) = C permeate C feed × 100

2.3. Analytical Methods

The dry solid (DS) content was estimated gravimetrically after heating the sample at 103 °C for 12 h, and the ash content was determined after heating for 12 h at 500 °C.
Carbohydrates and lignin were analyzed according to the procedure of the National Renewable Energy Laboratory (NREL) [22,23]. Carbohydrates were detected by a high-performance ion exchange liquid chromatography (HPILC) system performed using a Dionex ICS-3000 type ion chromatography system which contained a pumping device, an auto-injector, an electrochemical detector with a gold electrode, and an Ag/AgCl reference electrode. A precolumn (4 × 50 mm, Dionex) connected to a Carbopac PA1 column (4 × 250 nm, Dionex) was used as a stationary phase in the presence of a solution of hydroxide 1 mM sodium as the eluent. Chromeleon software version 6.8 (Dionex Corp., Sunnyvale, CA, USA) was used to analyze and process the data. Acid-insoluble lignin was quantified via gravimetric measurement after filtration, while acid-soluble lignin was determined with UV spectrophotometry at the wavelength of 240 nm.
The total phenolic compounds in the extracts were determined with the Folin–Ciocalteu method (colorimetric method) which consists of reacting the Folin reagent consisting of a mixture of phosphotungstic acid and phosphomolybdic acid. This reagent is reduced during oxidation of phenols to a mixture of blue oxides of tungsten and molybdenum. The intensity of the color evaluated at 700 nm is proportional to the rate of oxidized phenolic compounds [24].
Phenolic monomeric compounds were quantified with high-performance liquid-UV chromatography on a column Lichrospher RP 18 (5 µm) (40 × 4 mm) equipped with a precolumn. Solvents: (A): water/formic acid (98:2 vol) and (B): methanol/water/formic acid (70:28:2 vol). The gradient was 0% B isocratic for 3 min, 0 to 40% B in 22 min, 40% B to 60% B in 18 min, 60% B in isocratic for 12 min, 60 to 80% B in 5 min, 80% B isocratic for 5 min. Data acquisition was performed using Chromeleon 6.80 software, Chromatography Data System (Dionex).
The filtration experiments were performed only one time, and all compounds analysis were duplicated.

3. Results and Discussion

Influence of the operating conditions on membrane performance has been studied at a steady state for two PES membrane with a MWCO of 5 kDa and 10 kDa.

3.1. Impact of Operating Conditions

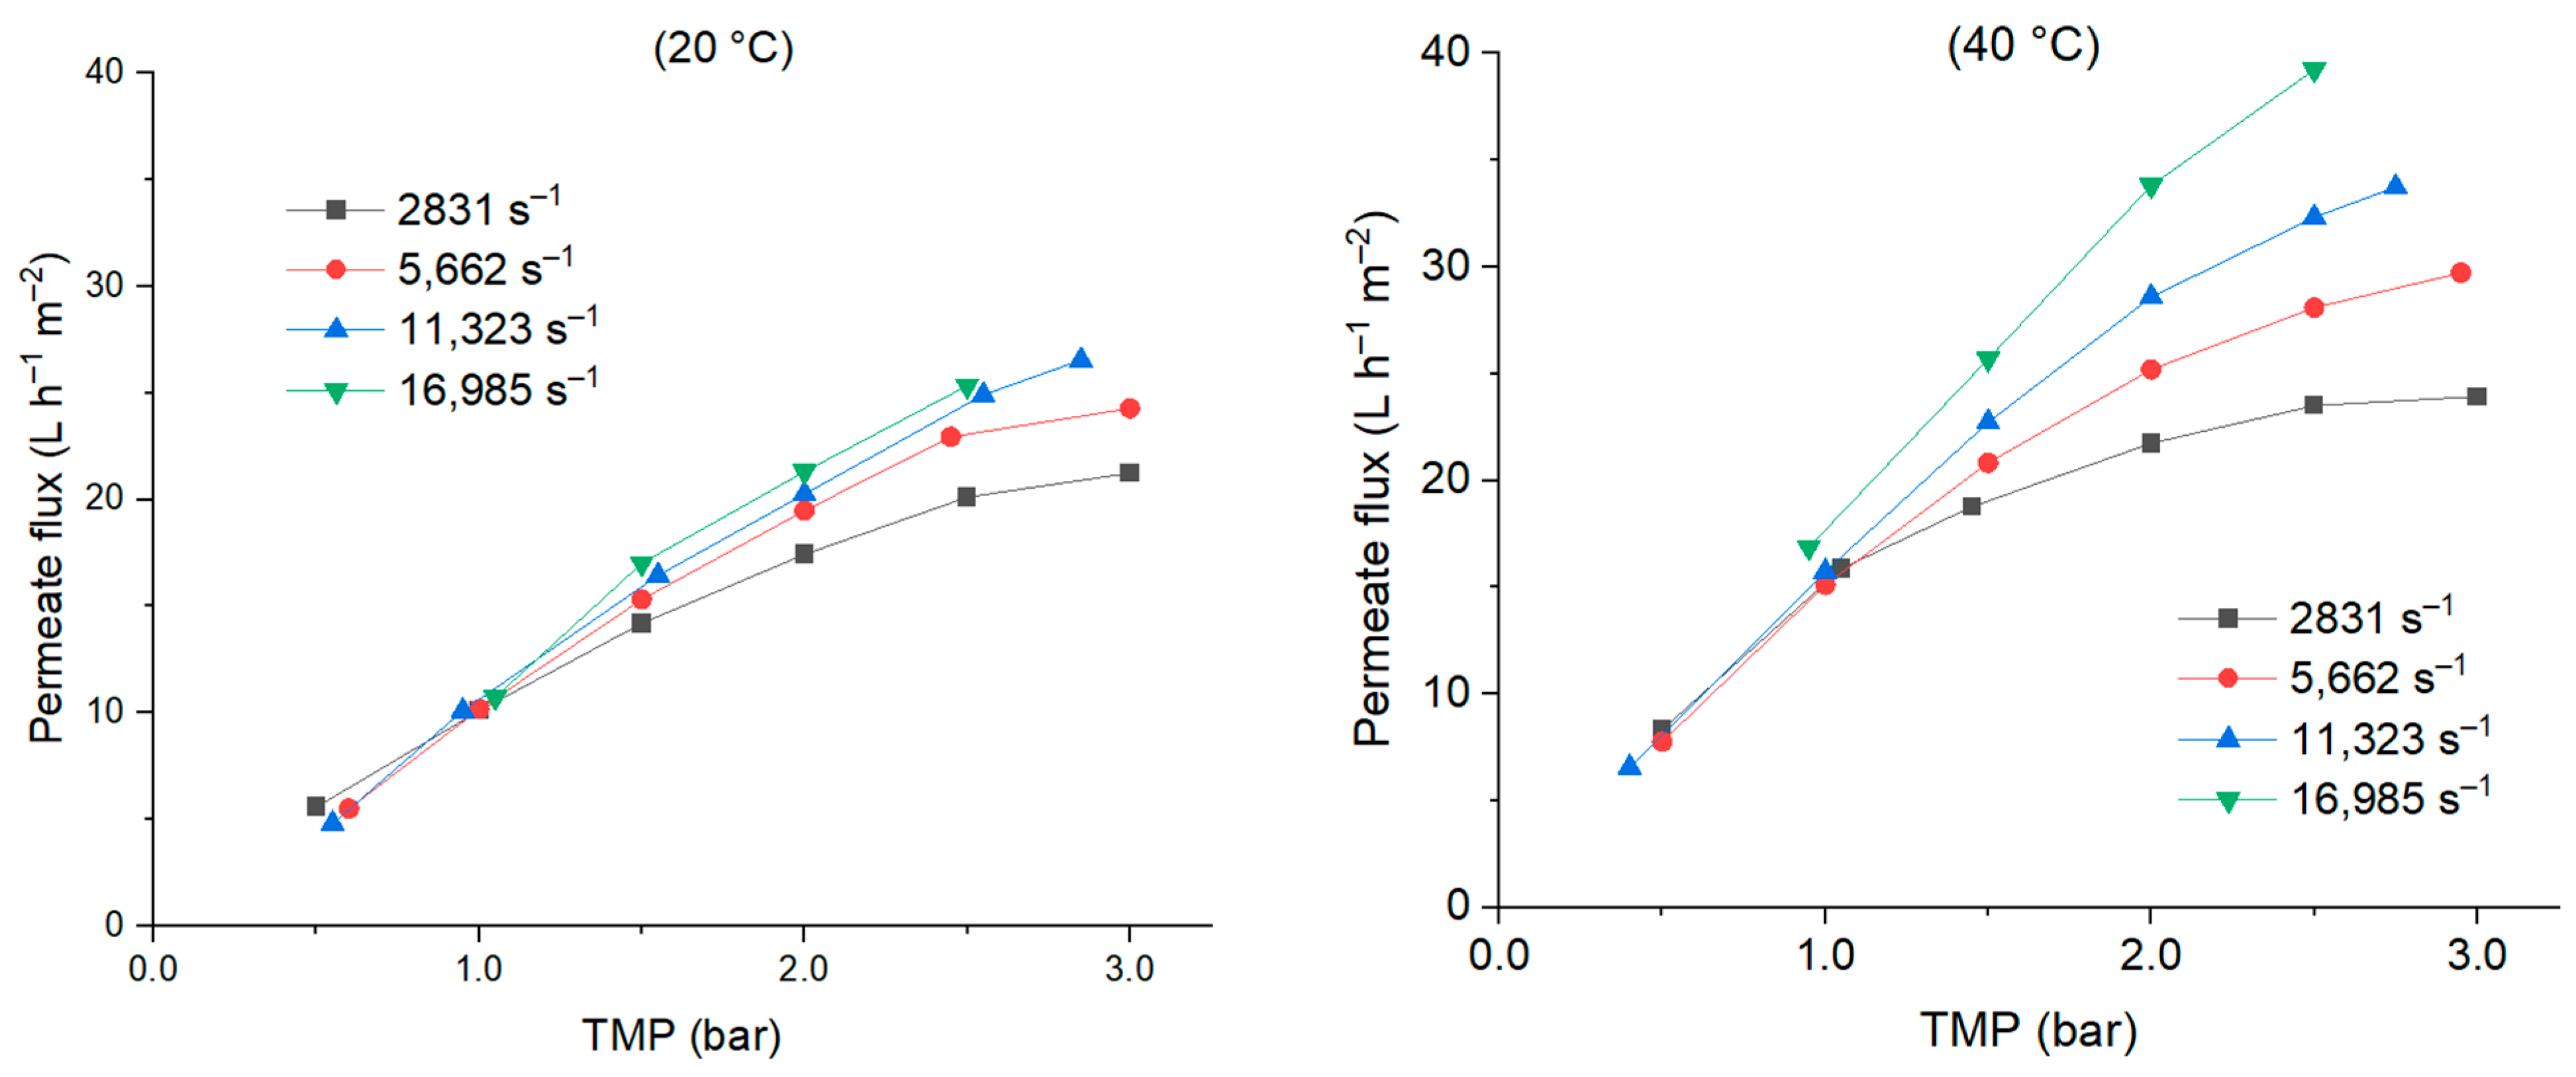
Two temperatures were tested, 20 °C and 40 °C, with the 5 kDa PES membrane. Four shear rates were applied, 2831, 5562, 11,323, 16,985 s−1, corresponding to the feed flowrates of 50, 100, 200, 300 L h−1, respectively. For both temperatures, the permeate flux increased with the transmembrane pressure (TMP), almost linearly for the highest shear rate and with a curve form from 1.0 bar, the limit pressure, for the lowest shear rate (Figure 2). Until 1.0 bar, the fluxes were similar for all shear rates at both temperatures. When the TMP increased, shear rate influence increased, and it was more obvious at 40 °C. The highest flux was from 21 to 27 L h−1 m−2 at 20 °C and from 24 to more than 39 L h−1 m−2 at 40 °C, according to the shear rate.
At pressures below 1 bar, the permeate flux is higher at 40 °C than at 20 °C. As it is in the linear part of the flux evolution, it could be assumed that the difference comes from the difference of the viscosity (Figure 3a). Viscosity analyses were performed, but as the extract is a complex solution, the viscosity was measured at different shear rates for the two temperatures (Figure 3b). From Figure 3a, it was observed that the increase in shear rate from 3 to 100 s−1 reduced the viscosity from 16 to 0.9 mPa s at 20 °C, and from 5.8 to 0.6 mPa s at 40 °C, and above this value of shear rate, there was almost no change in viscosity with a 30% reduction at 40 °C compared to 20 °C. Figure 3b shows the linear relation between shear stress and shear rate, which indicates that the SCB extract was almost a Newtonian solution. The viscosity evaluation confirms that the difference between the two temperatures is linked to viscosity change, when the applied pressure is below 1 bar.
High viscosity of the feed solution increases the pressure drops along the membrane and explains why, for the highest shear rate, it was impossible to work at a pressure below 1 bar. But high viscosity can also reduce the mass transfer coefficients at the membrane surface [25]. This could explain why, for the pressure condition above 1 bar, the permeate flux was not increasing linearly for the smallest shear rate. It requires stronger force to remove the layer deposited at the membrane surface. In addition, at a high shear rate, the difference of flux at 20 °C and 40 °C increased, indicating that the fouling phenomena could be reduced to a greater degree when increasing at the same time the temperature and shear rate. Furthermore, Krawczyk et al. (2011) found that the temperature and shear rate had a significant impact on the viscosity [26]. The increase in temperature from 50 to 80 °C resulted in around 10 mPa s lower viscosity, meanwhile the increase in shear rate from 1 to 100 s−1 led to a decrease in viscosity from 30 to 10 mPa s at 50 °C. Moreover, Dahdouh et al. (2018) also proved that higher shear rates could improve the permeate flux and reduce irreversible fouling [27].
In this study, the measured permeability of water at 20 °C was around 33.8 L h−1 m−2 bar−1. From Equation (4), we calculated the membrane resistance ( R m ), which stood at 8.28 × 10⁵ m−1. The total resistance (Rt) linked to the membrane fouling was calculated (Figure 4) and was higher than the membrane resistance (Rm) in all cases, indicating that the additional hydraulic resistances also impacted the permeate flux. But this resistance increases when pressure becomes higher than 1 bar, showing a modification of the fouling that reduced the increase in permeate flux.
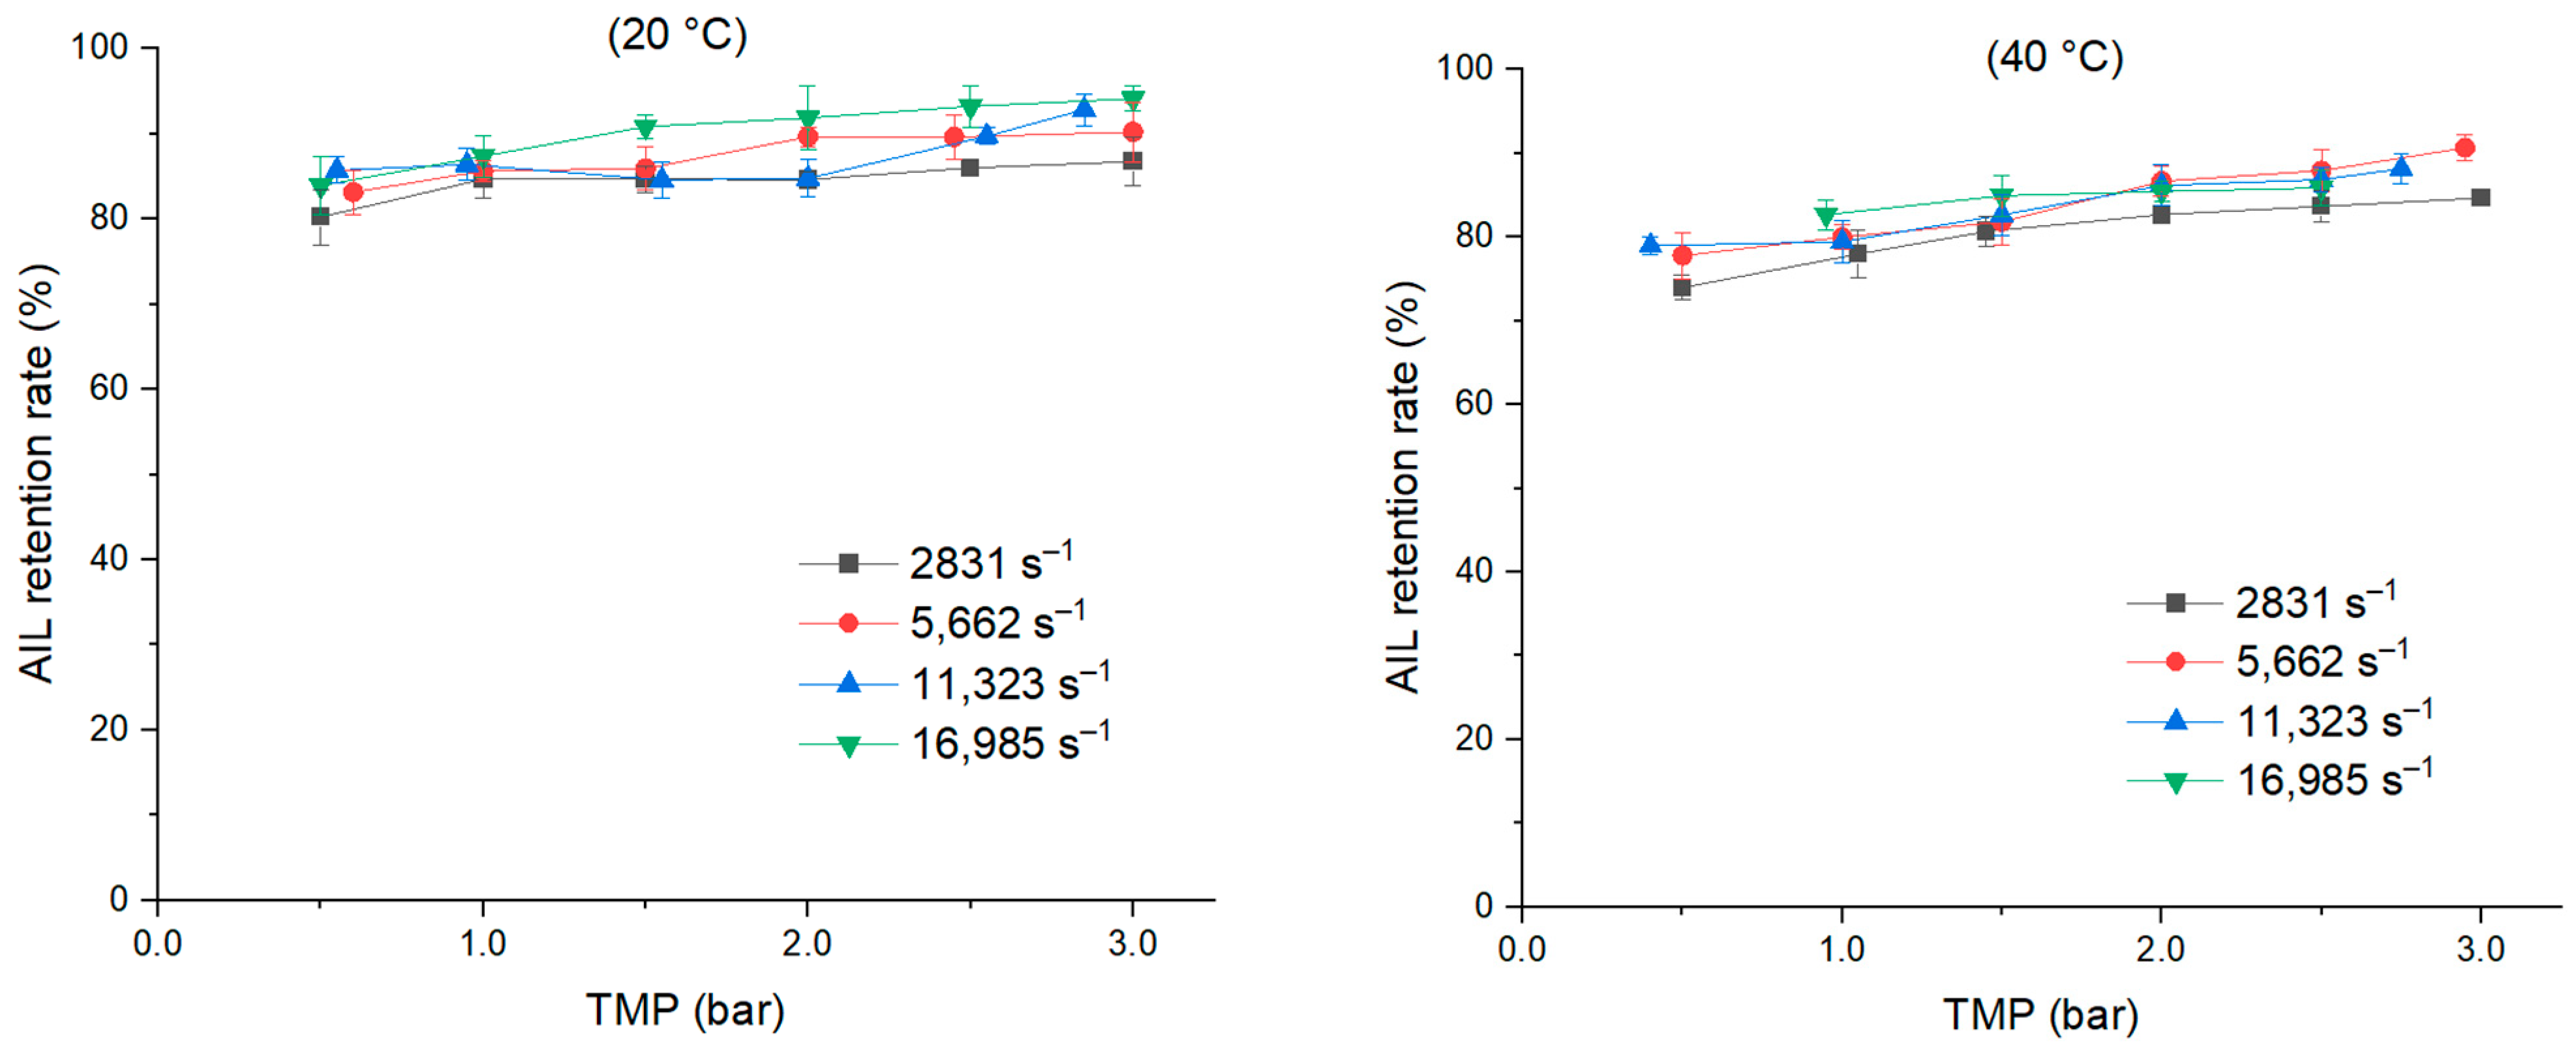
AIL is the mass of solid recovered via filtration after acid hydrolysis of the samples. It is mainly composed of oligomers from lignin hydrolysis and lignin–carbohydrate complexes. The size of these oligomers is generally evaluated at a few kilodaltons. ASL is mainly composed of small lignin oligomers or monomers and is the fraction obtained after filtration for AIL determination. The AIL rejection rate slightly increased with pressure, from 80% to 90% at 20 °C and from 70% to 90% at 40 °C (Figure 5). The maximum retention rate was obtained at the TMP of 3.0 bar with approximately 90% for both temperatures. At low TMP, from 0.5 to 1.5 bar, the retention rate at 40 °C was lower compared to that at 20 °C, but it appears that temperature and shear rate had almost no influence on the rejection rate.
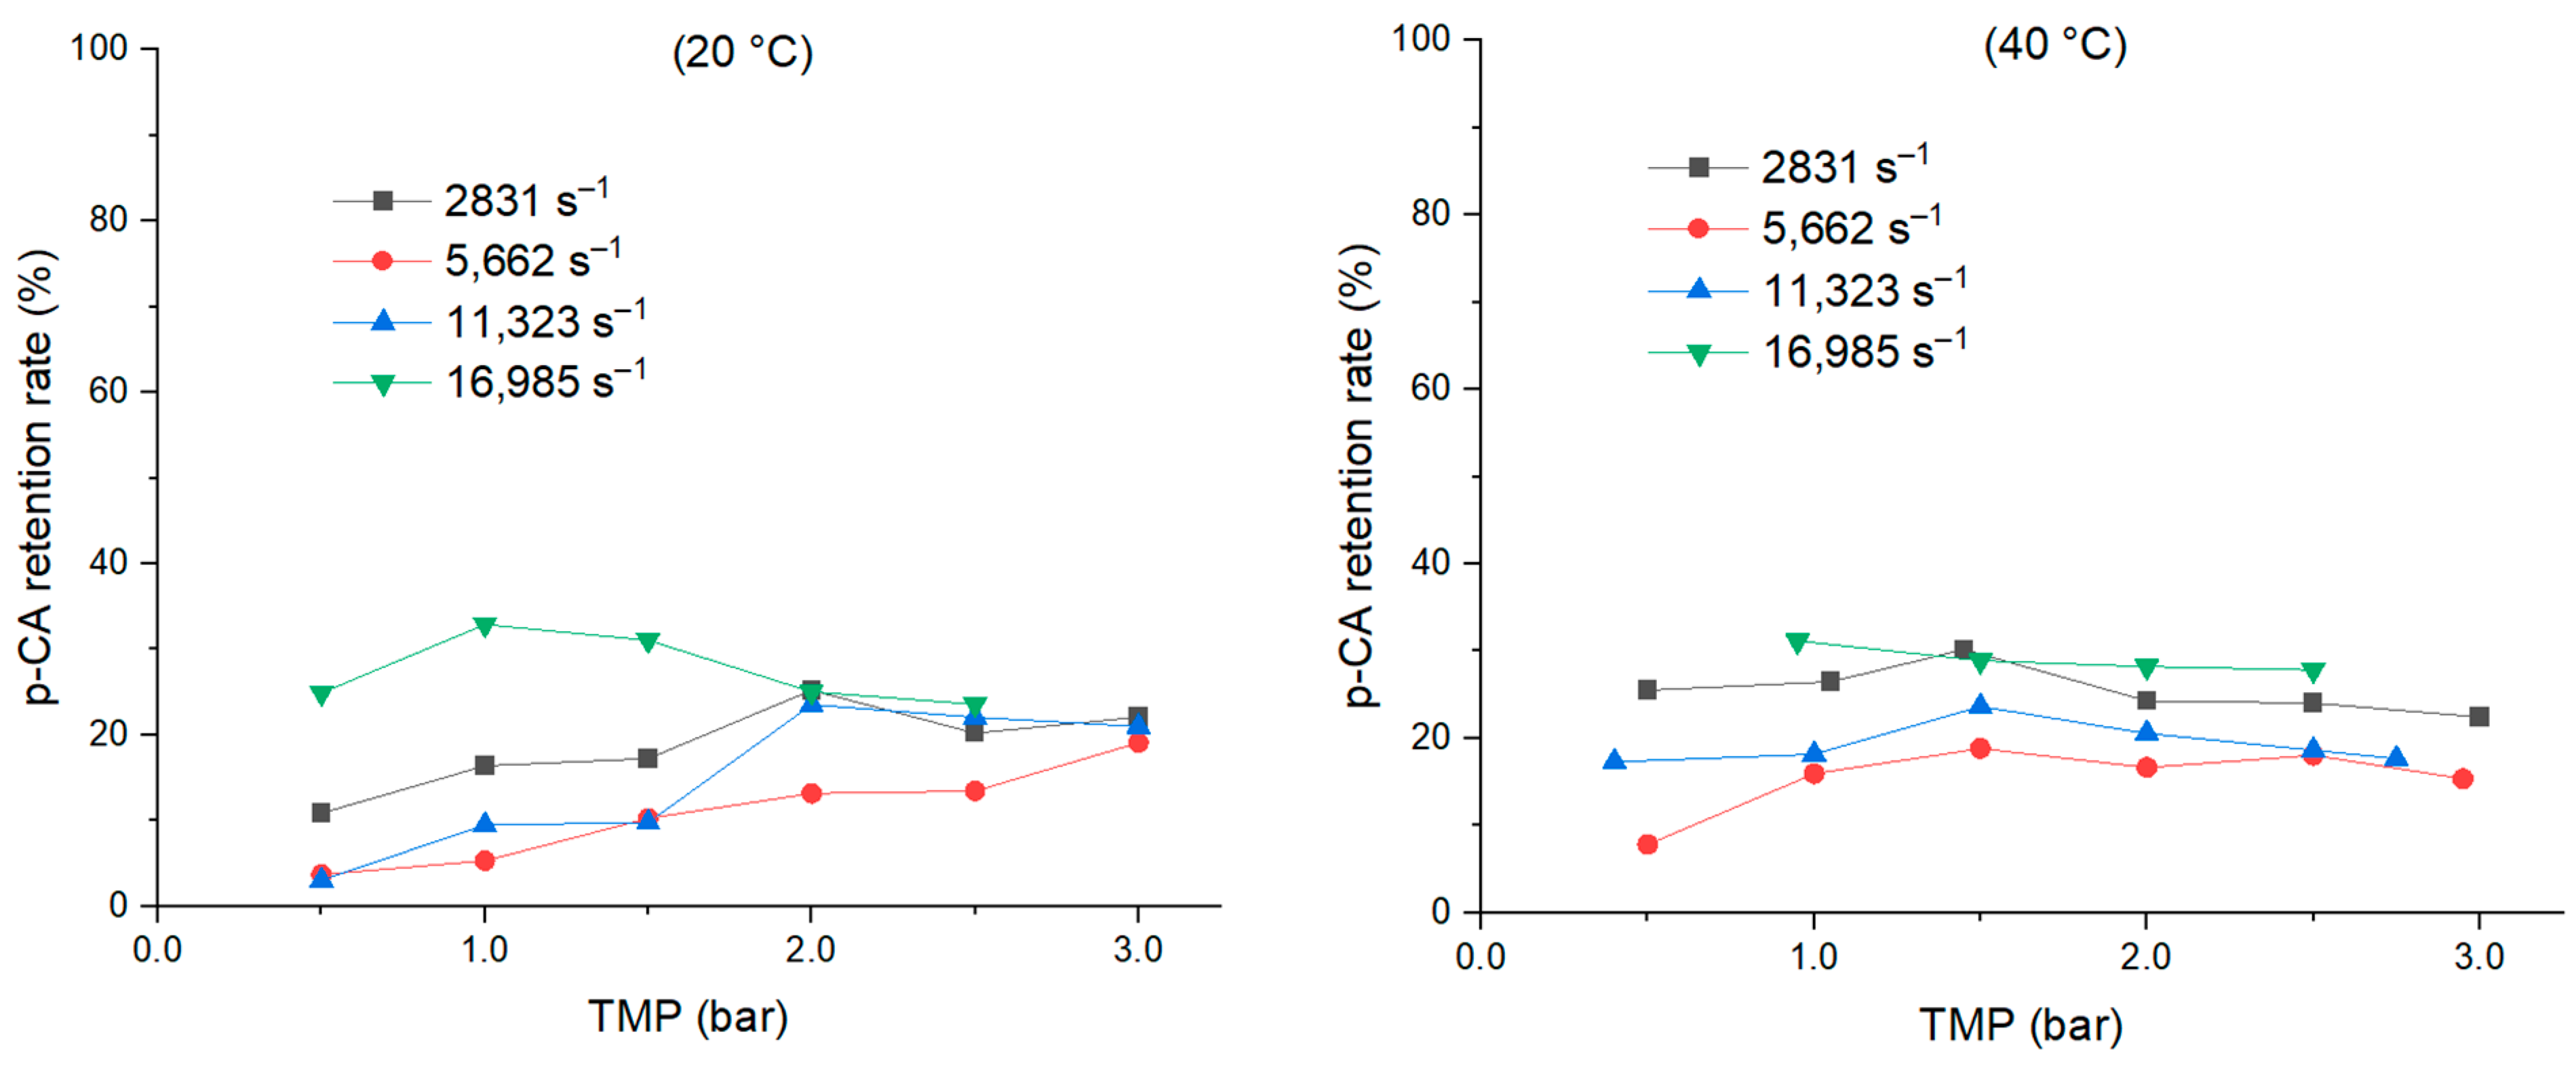
The extract also contained monomeric phenolic acids, mostly p-coumaric acid. Its retention ranged from 3.0 to 32.9% depending on the TMP (Figure 6). This value was high since the molecular weight of coumaric acid is low (164 g mol−1). The retention is not linked to its size, but either due to precipitation at the membrane surface, these molecules present a low water solubility, and/or the adsorption on the membrane surface. At 20 °C, except at the highest shear rate, the retention rate increased with the TMP increase. At a TMP of 3.0 bar, all shear rates resulted in the same retention rate of about 20%. At 40 °C, there was no clear influence of the hydrodynamic conditions on the rejection rate. Similar results were obtained with ferulic acid; the higher retention rate was obtained in the higher TMP, which ranged from 5.2 to 33.7%. In general, there was an insignificant impact of temperature on the retention rate of p-coumaric and ferulic acid. Due to the low concentration of 4 HBAD and vanillin in the feed solution, the variation in their retention rate was insignificant.
All the sugars obtained in the extract (arabinose, galactose, glucose, and xylose) were under the oligomer form. Most are coming from hemicelluloses’ solubilization and degradation. Hemicelluloses are mostly constituted by a xylose backbone with branched composed either of galactose, arabinose and glucose. The obtained polymers can be linear xylans or branch polymers, and in some cases are mainly composed of glucose coming from β-glucan.
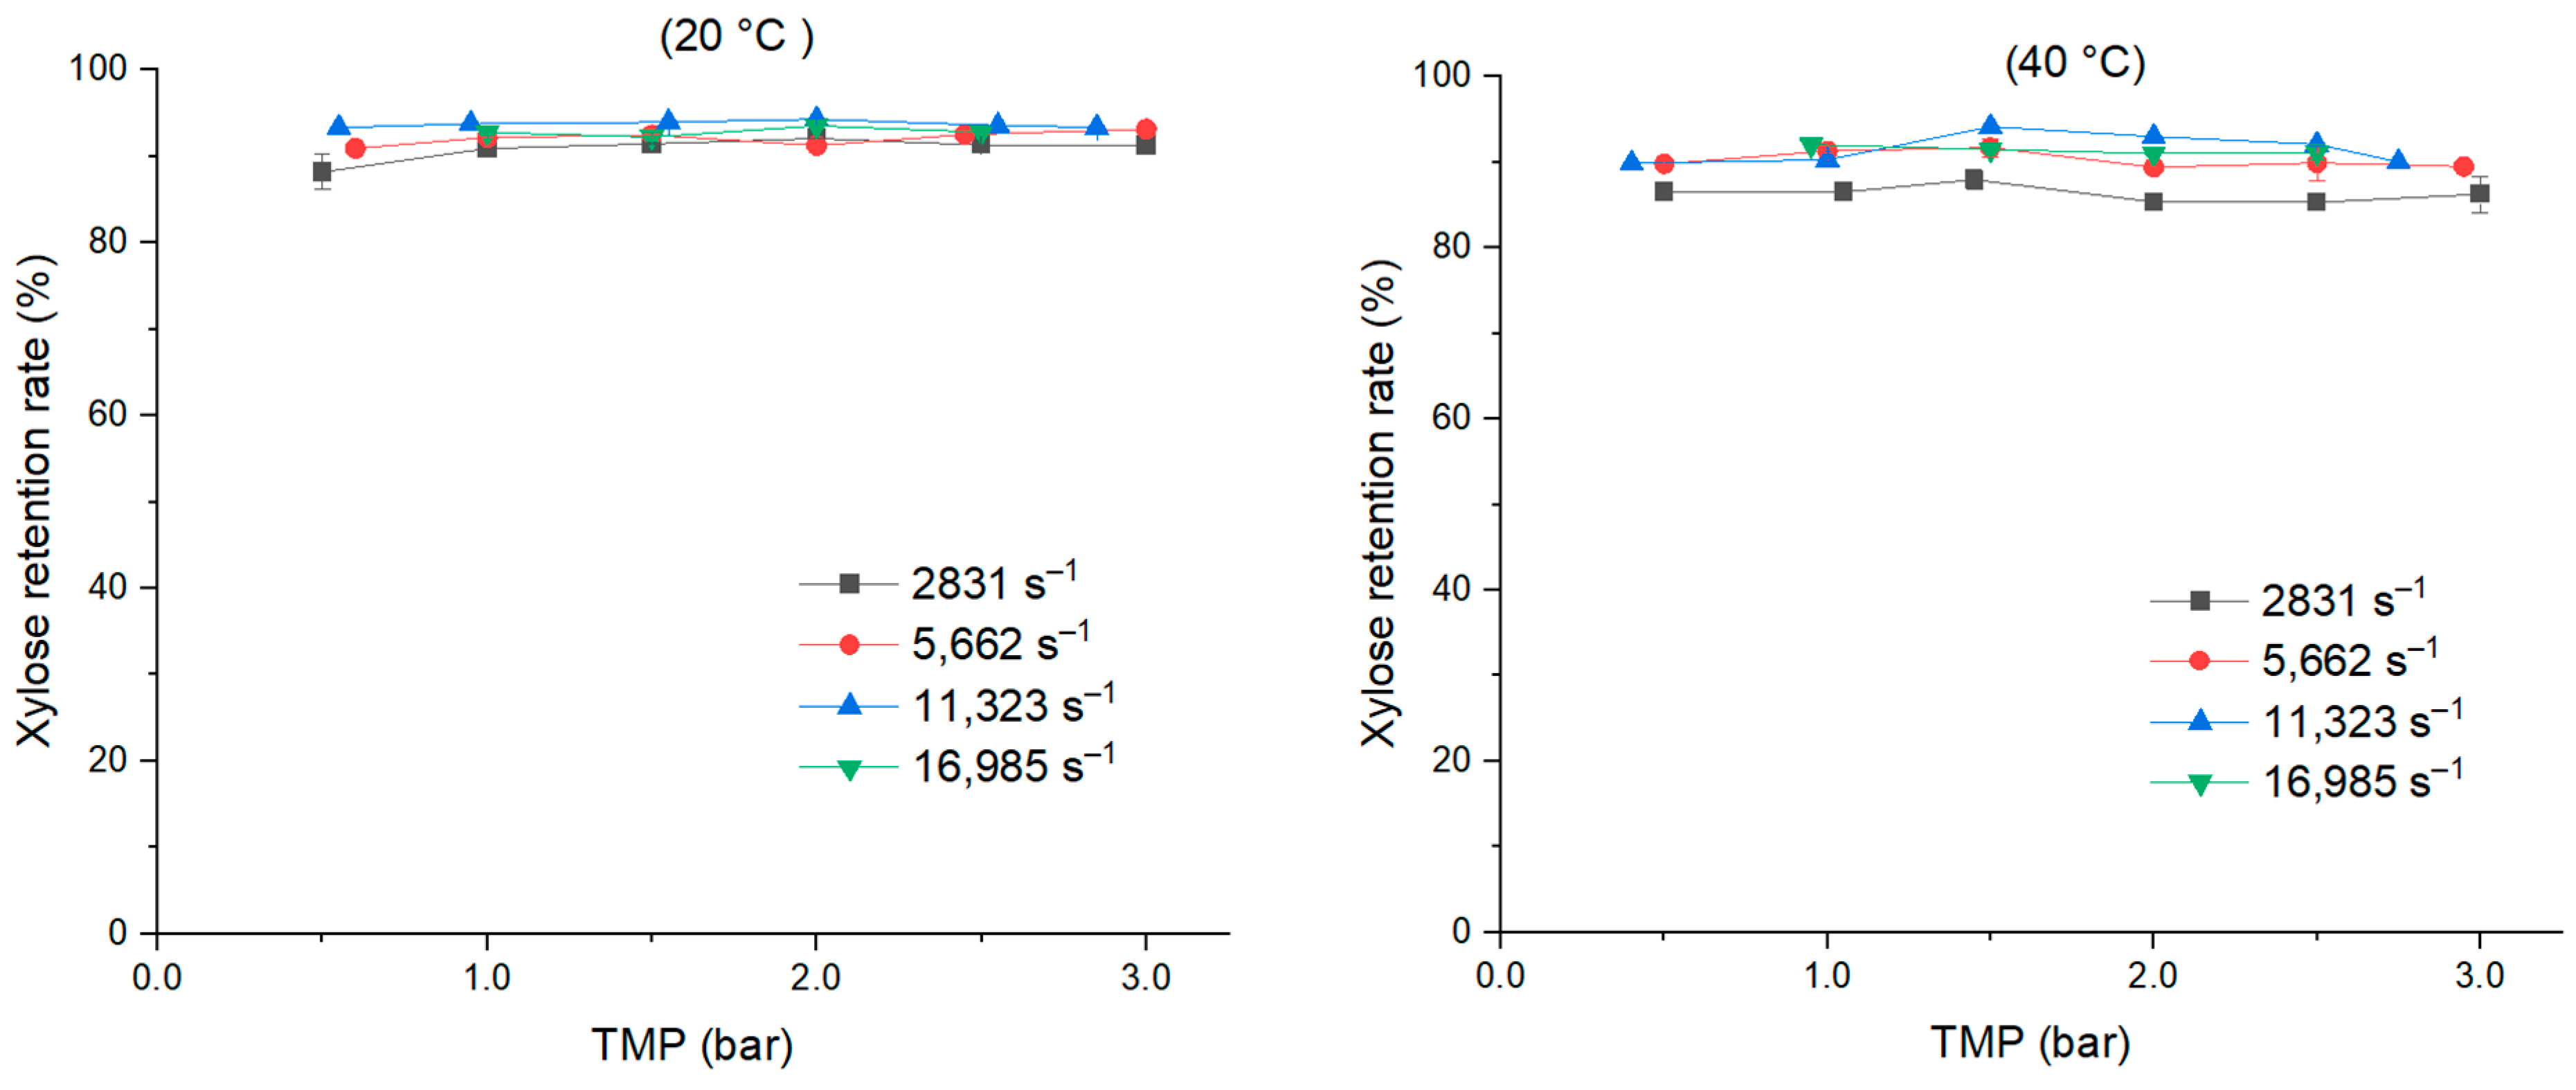
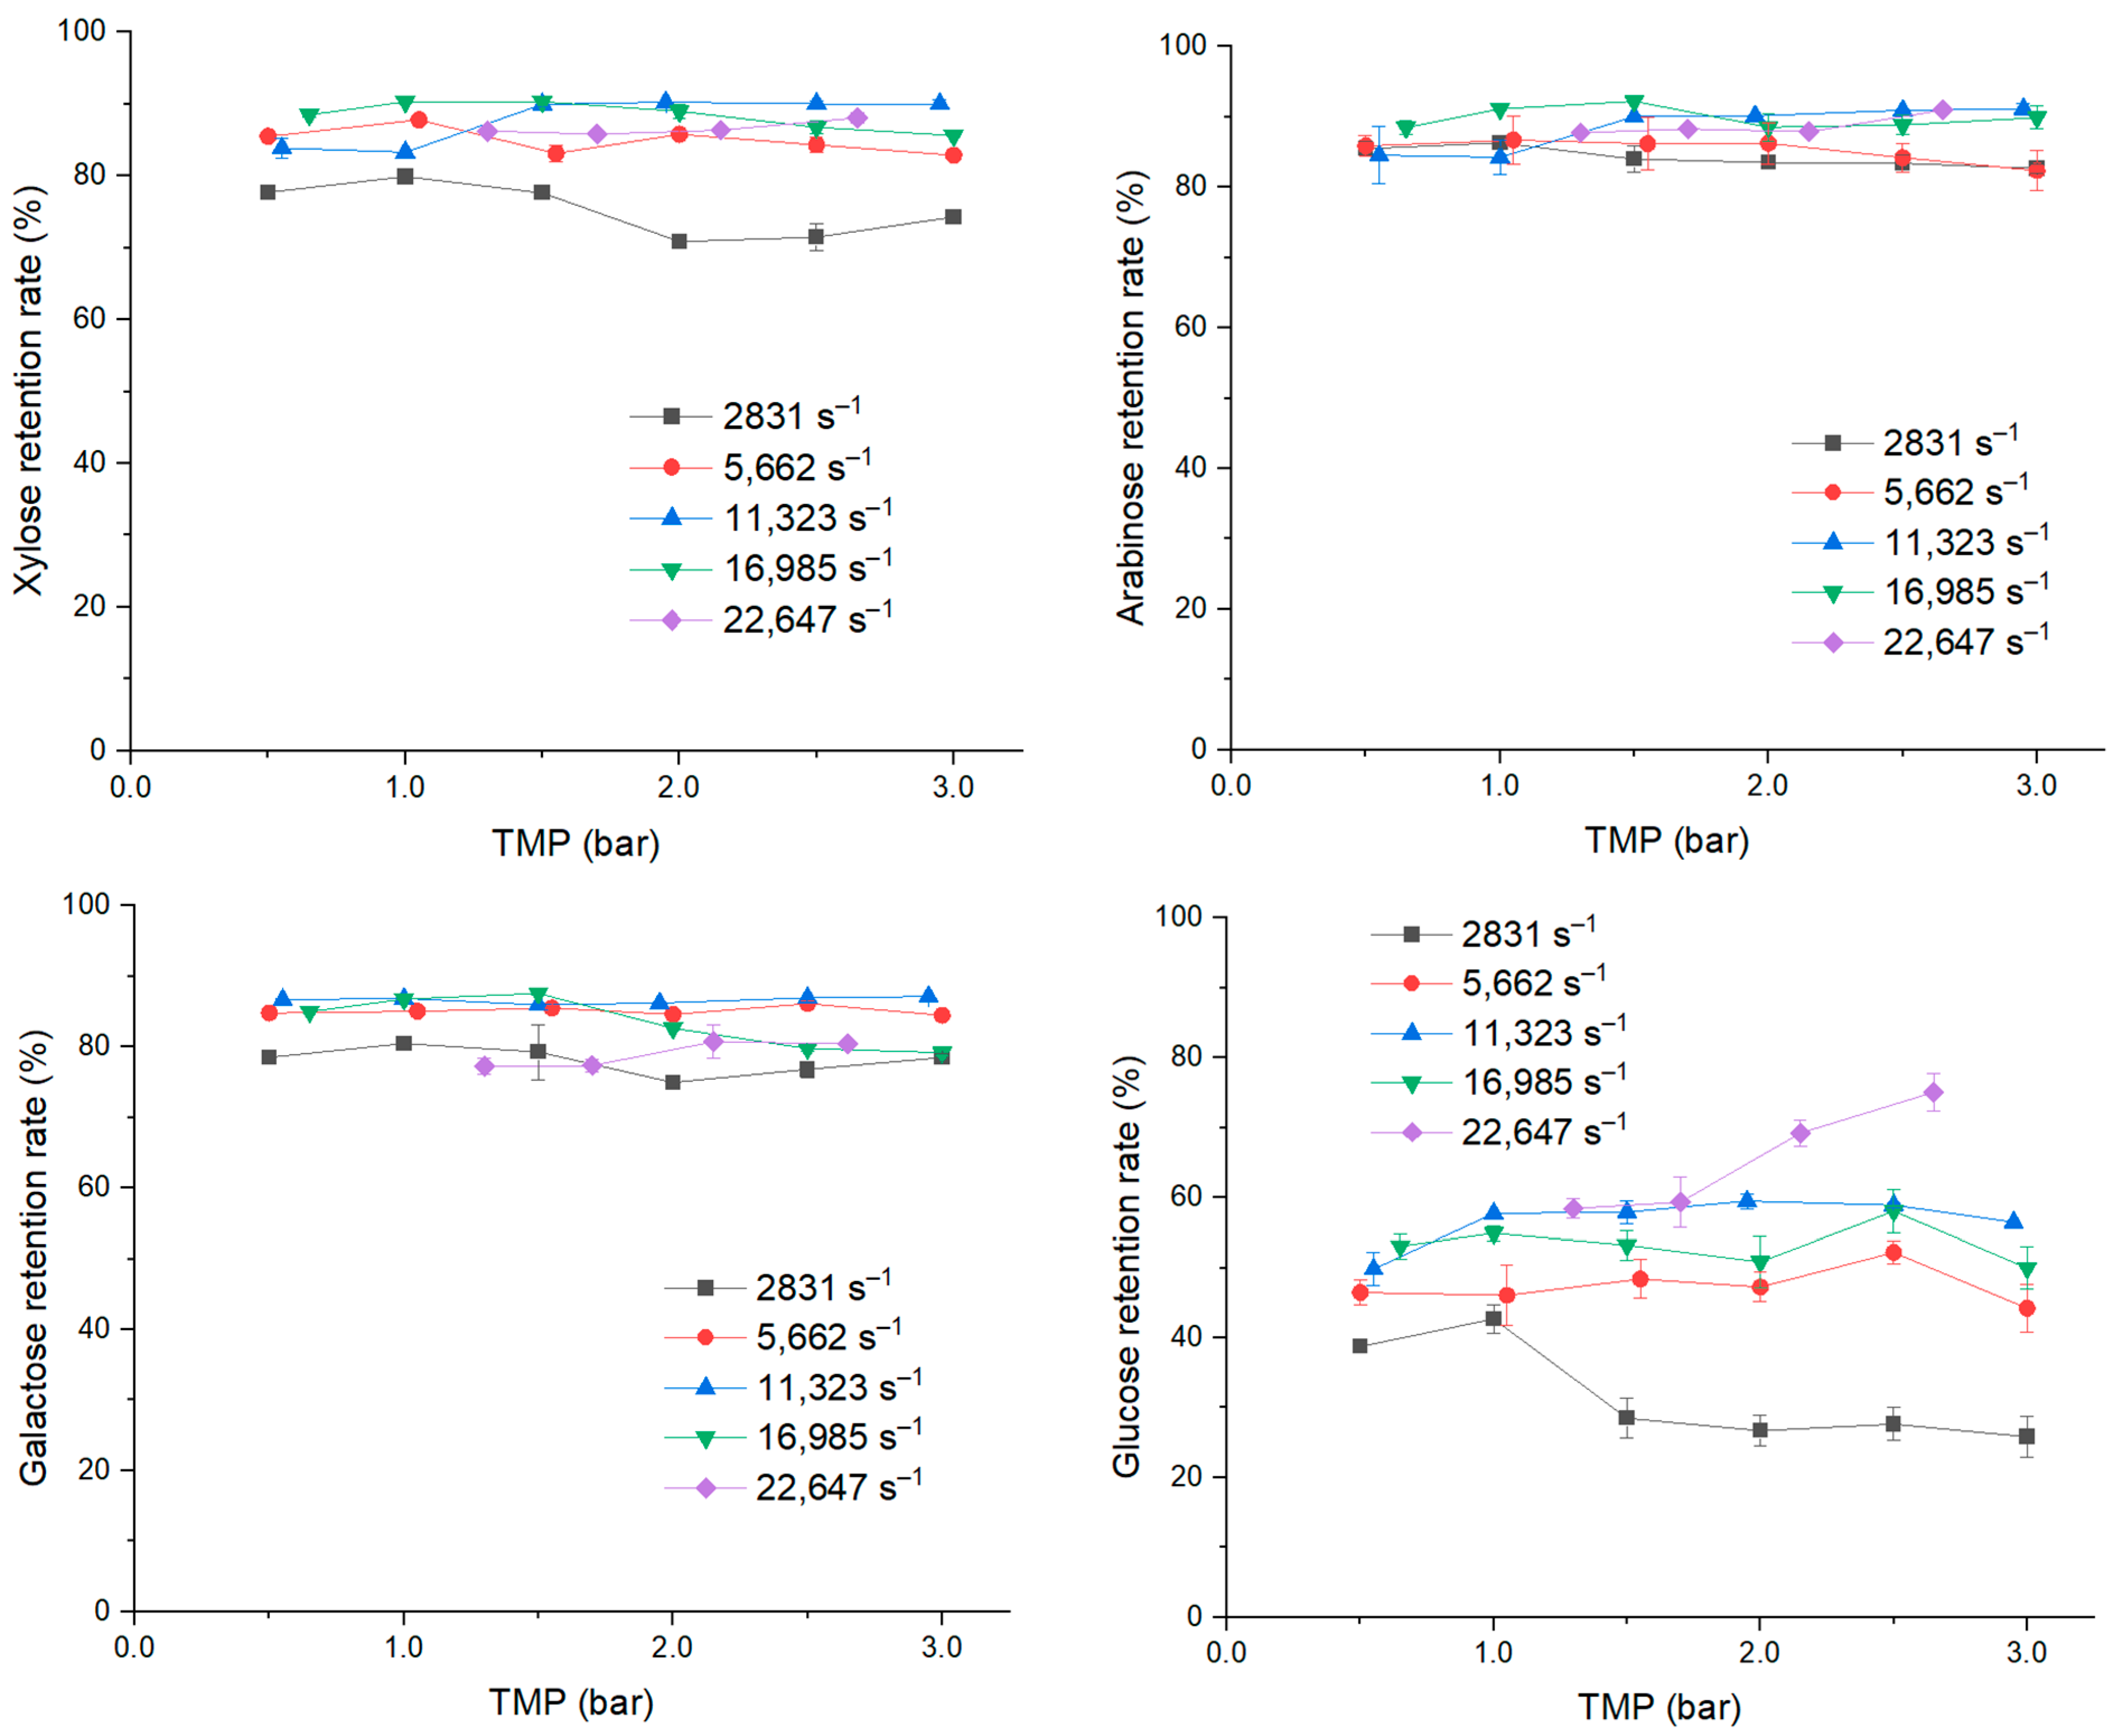
The retention rate of xylose ranged from 80% to 91% at 20 °C, and from 73% to 91% at 40 °C, depending on the shear rate (Figure 7), while the arabinose retention rate ranged from 85.2 to 95% (Figure 8). The retention rate of these two sugars were not impacted by the TMP for both temperatures, but the influence of shear rate was more obvious at 40 °C.
In the case of glucose, the increase in TMP led to an increase in glucose retention rate, varying from 13 to 51% at 20 °C and from 21 to 42% at 40 °C. At the shear rate of 2831 s−1, the glucose retention rate was almost the same, ranging from 13 to 28% at 20 °C and from 19 to 35% at 40 °C. However, at higher shear rates and a TMP ranging from 1.0 to 3.0 bar, the retention rate of glucose at 40 °C was much higher than that at 20 °C. For example, at TMP 2.5, from low to high shear rate, the retention rate was 28, 30, 37, and 51% at 20 °C, and it was 28, 71, 65, and 74% at 40 °C (Figure 9).
These results could confirm that some of the oligomers which contain glucose are smaller than hemicelluloses, like the β-glucans, and their retention depends on the hydrodynamic conditions. They could be retained by the fouling layer whose structure evolves with the hydrodynamic conditions. But the glucose could be linked to hemicelluloses, and in this case, it presents a high rejection rate. The rejection rate is therefore the mean value of these different rejection rates.
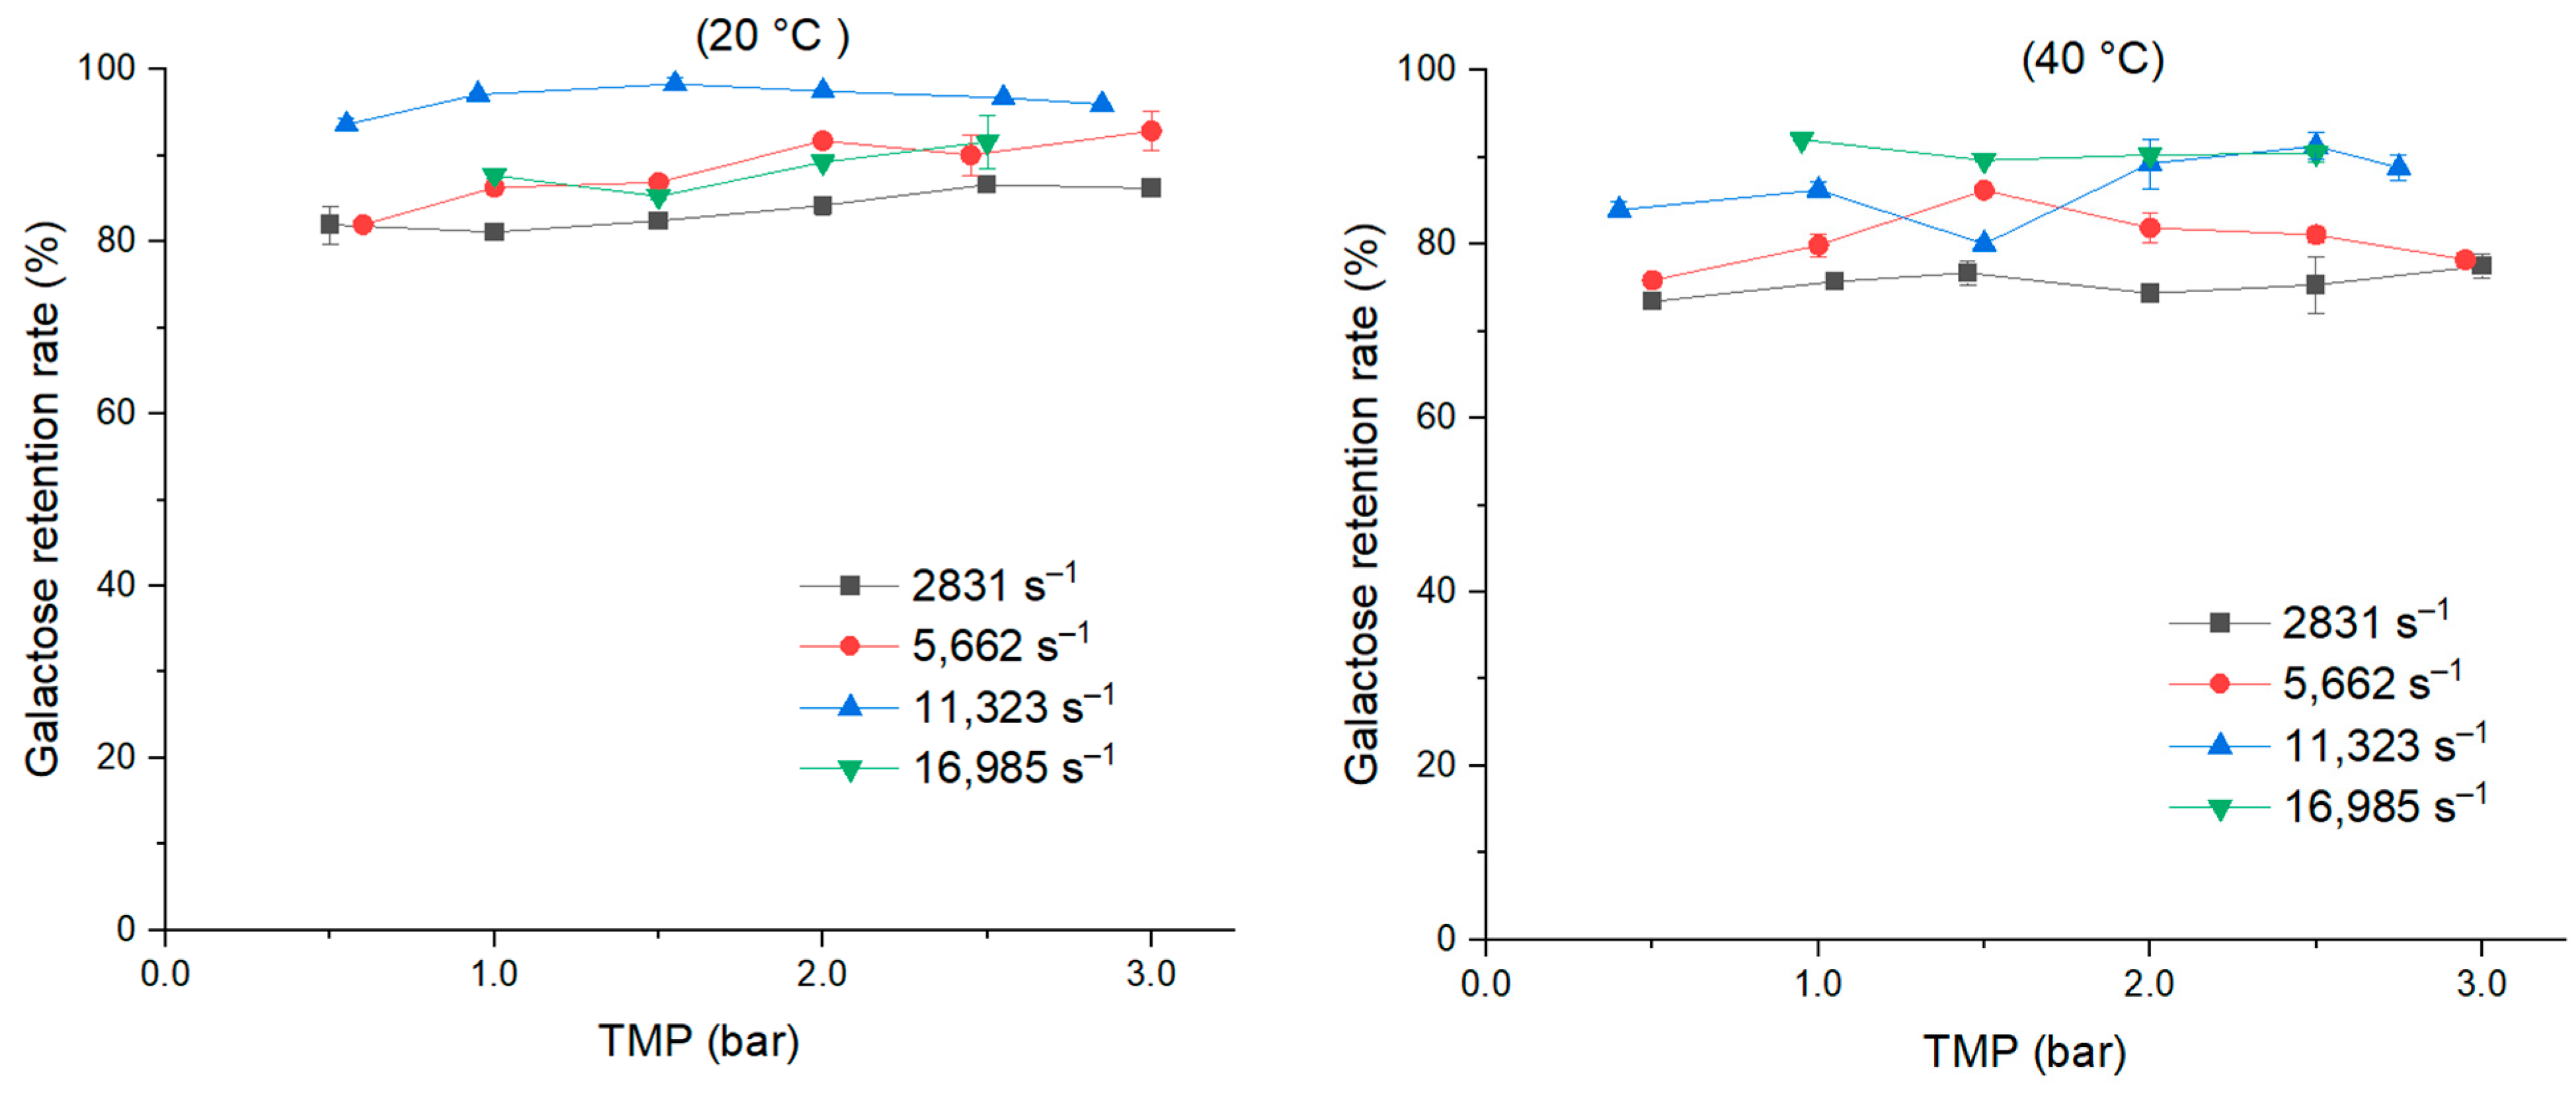
As shown in Figure 10, the TMP did not impact the retention rate of galactose for both temperatures. At 0.5 bar, the increase in shear rate from 2831 to 5662 s−1 did improve the retention rate, which stood at 81 and 77% at 20 °C and 40 °C, respectively. With the shear rates of 2831, 5662, and 11,323 s−1, the lower temperature could retain more galactose, especially with the shear rate of 11,323 s−1, but not in the case of the shear rate 16,985 s−1.
Overall, the retention rate of big molecules such as lignin and carbohydrates were slightly higher at 20 °C; meanwhile, there was no difference in the retention rates of phenolic acids. Nevertheless, a higher temperature resulted in a much higher permeate flux and avoided fouling at high shear rates. Therefore, 40 °C was chosen for the next experiments to evaluate the impact of membrane properties.

3.2. Impact of Membrane Molecular Weight Cut-Off (MWCO)

The two tested membranes, with a MWCO of 5 and 10 kDa, had a similar hydraulic permeability, and the results were also similar with the extract solution for pressures below 1.5 bar (Figure 11). Permeate fluxes for the 10 kDa membrane increased with increasing TMP in a more linear trend than for the 5 kDa membrane. Consequently, higher permeate fluxes were obtained for the highest pressures. For the highest shear rate of 22,647 s−1, the flux was linear for the whole range of tested TMP for the 10 kDa membrane. The higher the shear rate, the greater the linearity, indicating that the polarization concentration layer has been eliminated. Nevertheless, the permeability obtained is lower than the permeability of water, indicating the extent of fouling.
Acid-insoluble lignin (AIL) retention ranged from 76 to 85% for the 10 kDa PES membrane, while it was 74 to 93% for the 5 kDa membrane. The impact of TMP on the AIL retention rate is larger for the 5 kDa membrane than for the 10 kDa membrane, but the ASL retention rate is the same for both membranes, ranging from around 20% to 40%. The increase in shear rate to 22,647 s−1 did not modify significantly the retention rate for the 10 kDa membrane (Figure 11).
The retention rates for arabinose, galactose, and xylose with the 10 kDa PES membrane were high, more than 82%, 75%, and 75%, respectively (Figure 12). These rates were slightly lower than with the 5 kDa membrane, especially at the lower shear rates. Shear rate had an influence on the xylose rejection rate for the 10 kDa membrane, since it increased from an average value of 76% to 90% in the studied range. On the contrary, the retention rate of glucose was higher for the 10 kDa membrane; ranging from 26 to 75% for the 10 kDa PES membrane and from 13 to 51% for the 5 kDa membrane. The shear rate had a very large influence on the retention rate of glucose, increasing from an average of 30% at 2831 s−1 to an average of 60% at 22,647 s−1.
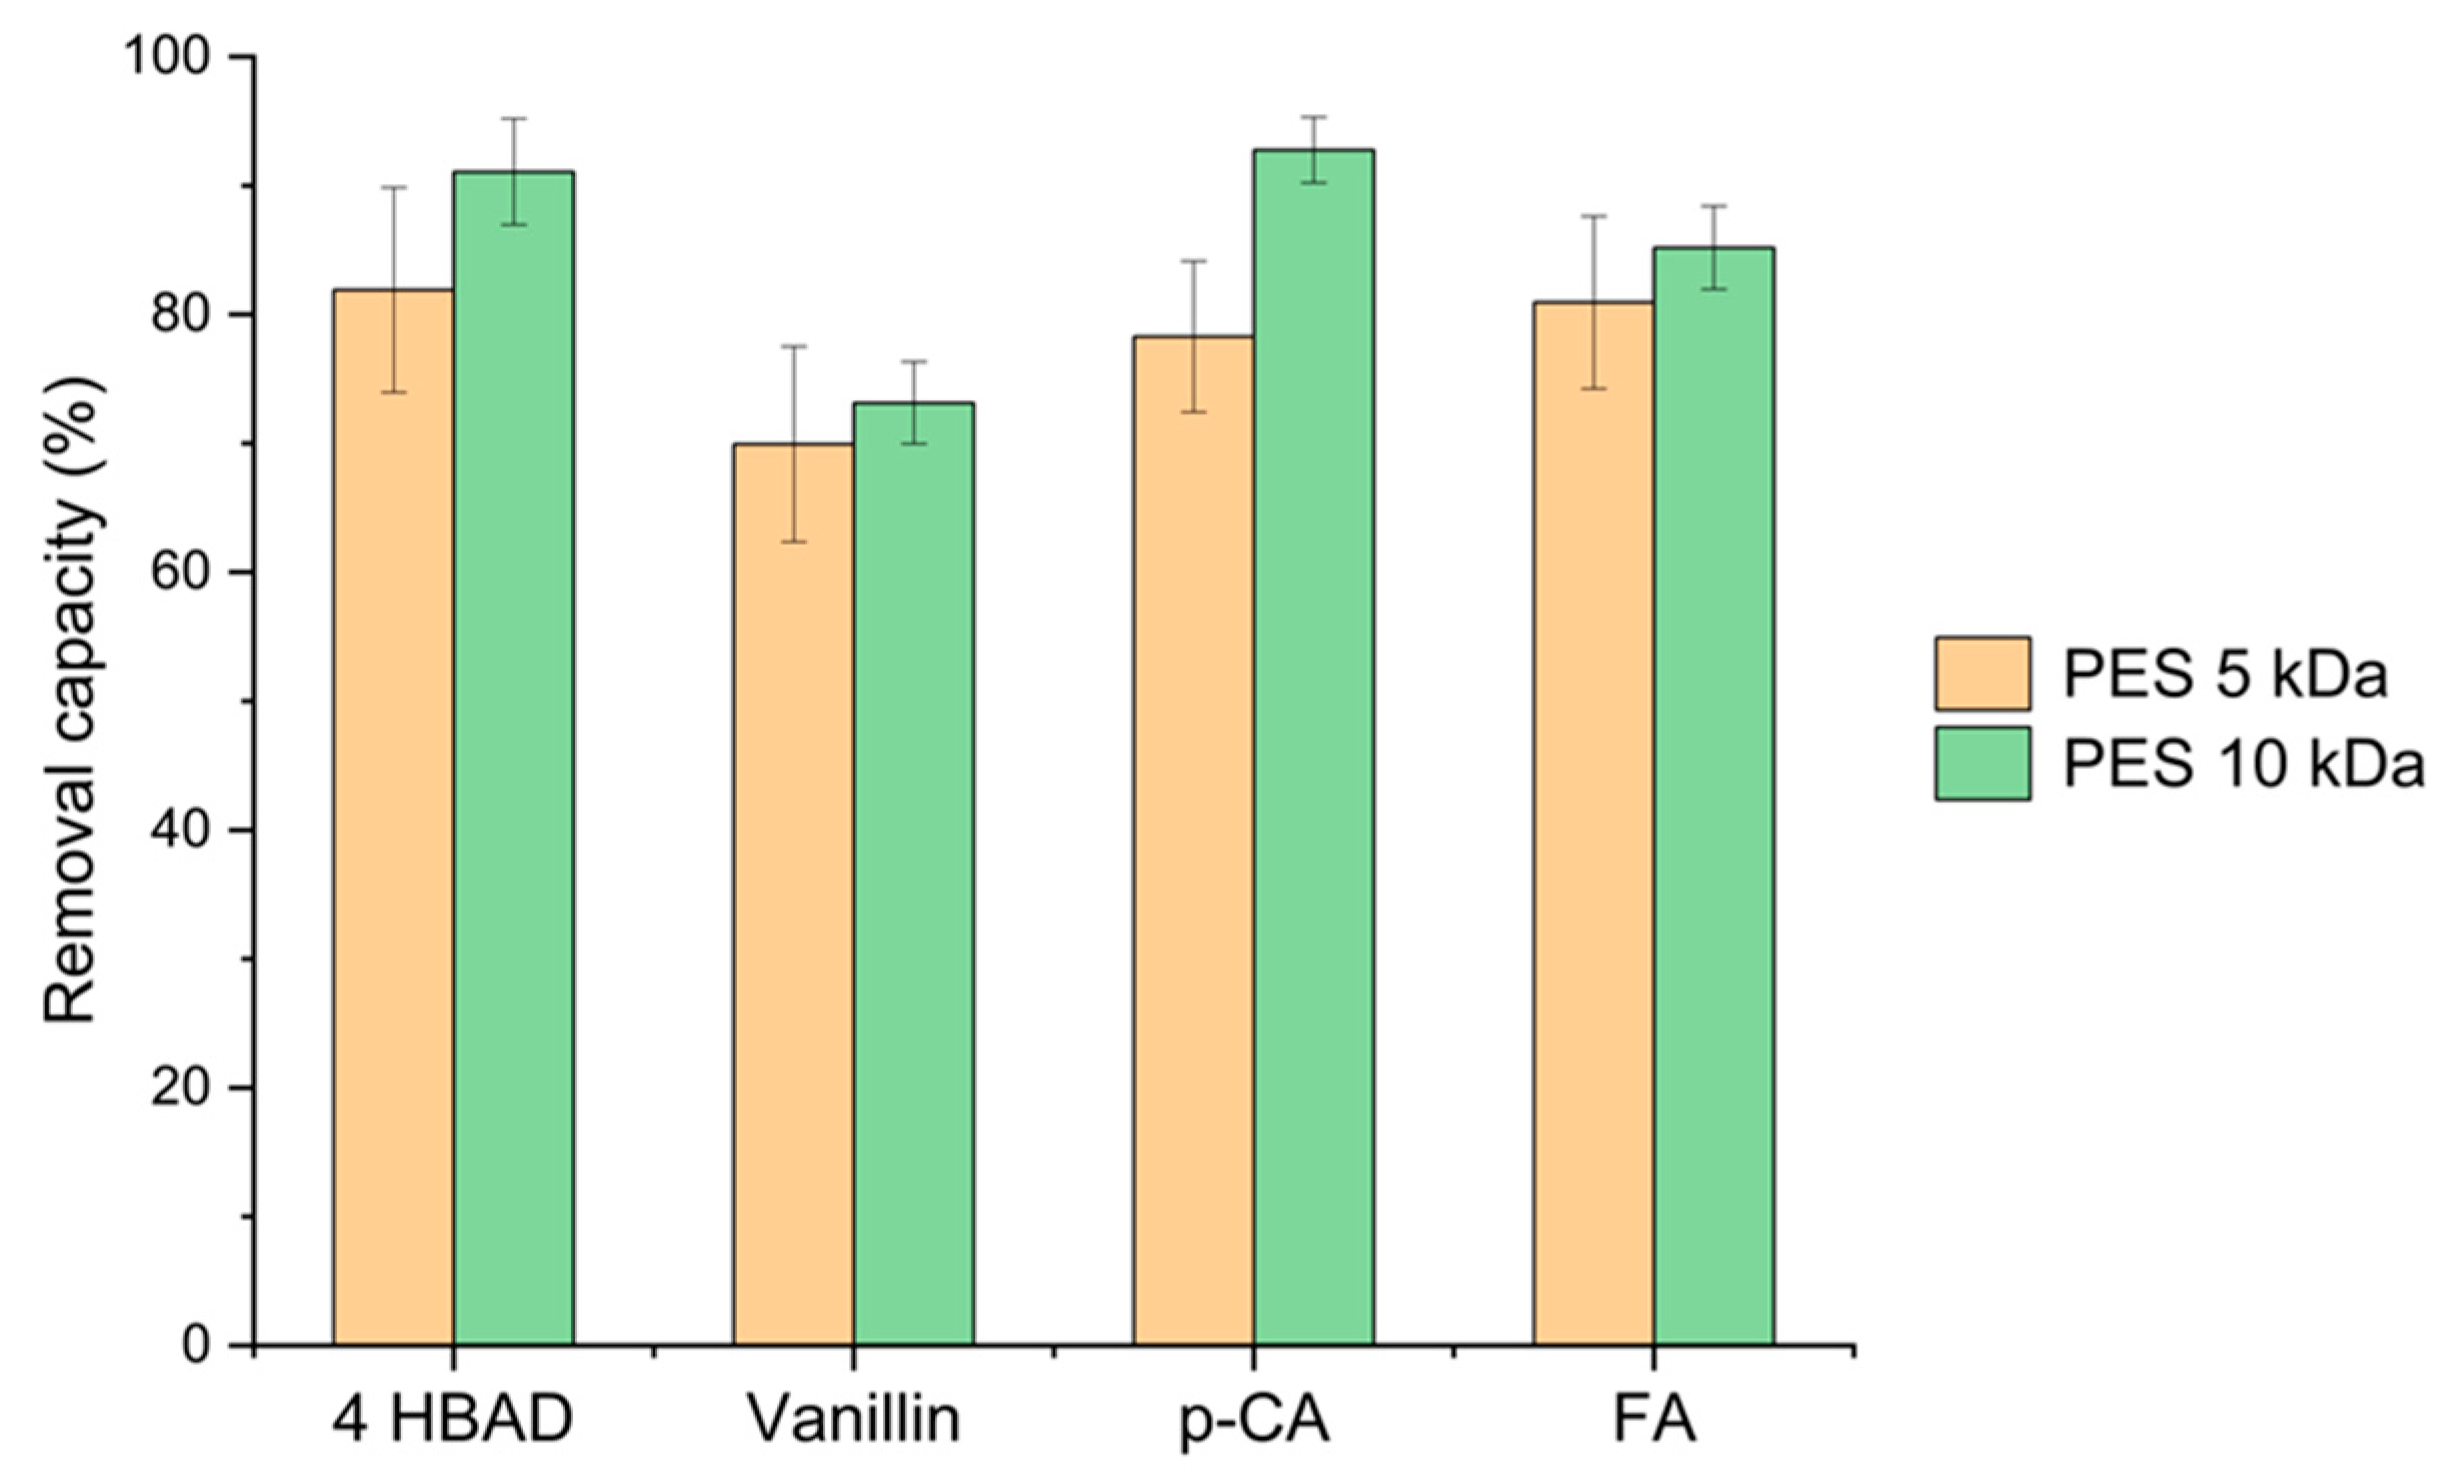
Around 74% of all the monomeric compounds (acid and neutral) were removed with the 10 kDa PES membrane (Figure 13). The removal capacity of the 10 kDa membrane was greater than that of the 5 kDa PES membrane, improving the purity of the larger molecules retained via the membrane.
In all cases, the retention rate of monomeric phenolic compounds was lower with the 10 kDa membrane than with the 5 kDa membrane. These results indicated that the MWCO played a role in the retention rate of these molecules, but other mechanisms could explain the phenomenon that such small molecules are retained with such large pores. Thus, the MWCO of 10 kDa was chosen to test the influence of the membrane material on the filtration performance in order to define if the membrane/solute interactions could explain the obtained phenomena.

3.3. Impact of Membrane Material

In this section, two different materials of membrane were compared including PS and PES, with the same MWCO of 10 kDa and the same operating conditions. Despite the fact that they had a similar MWCO, the water permeability of the PS membrane was almost twice that of the PES membrane (Table 2). This latter membrane had a low water permeability, only slightly higher than the 5 kDa PES membrane.
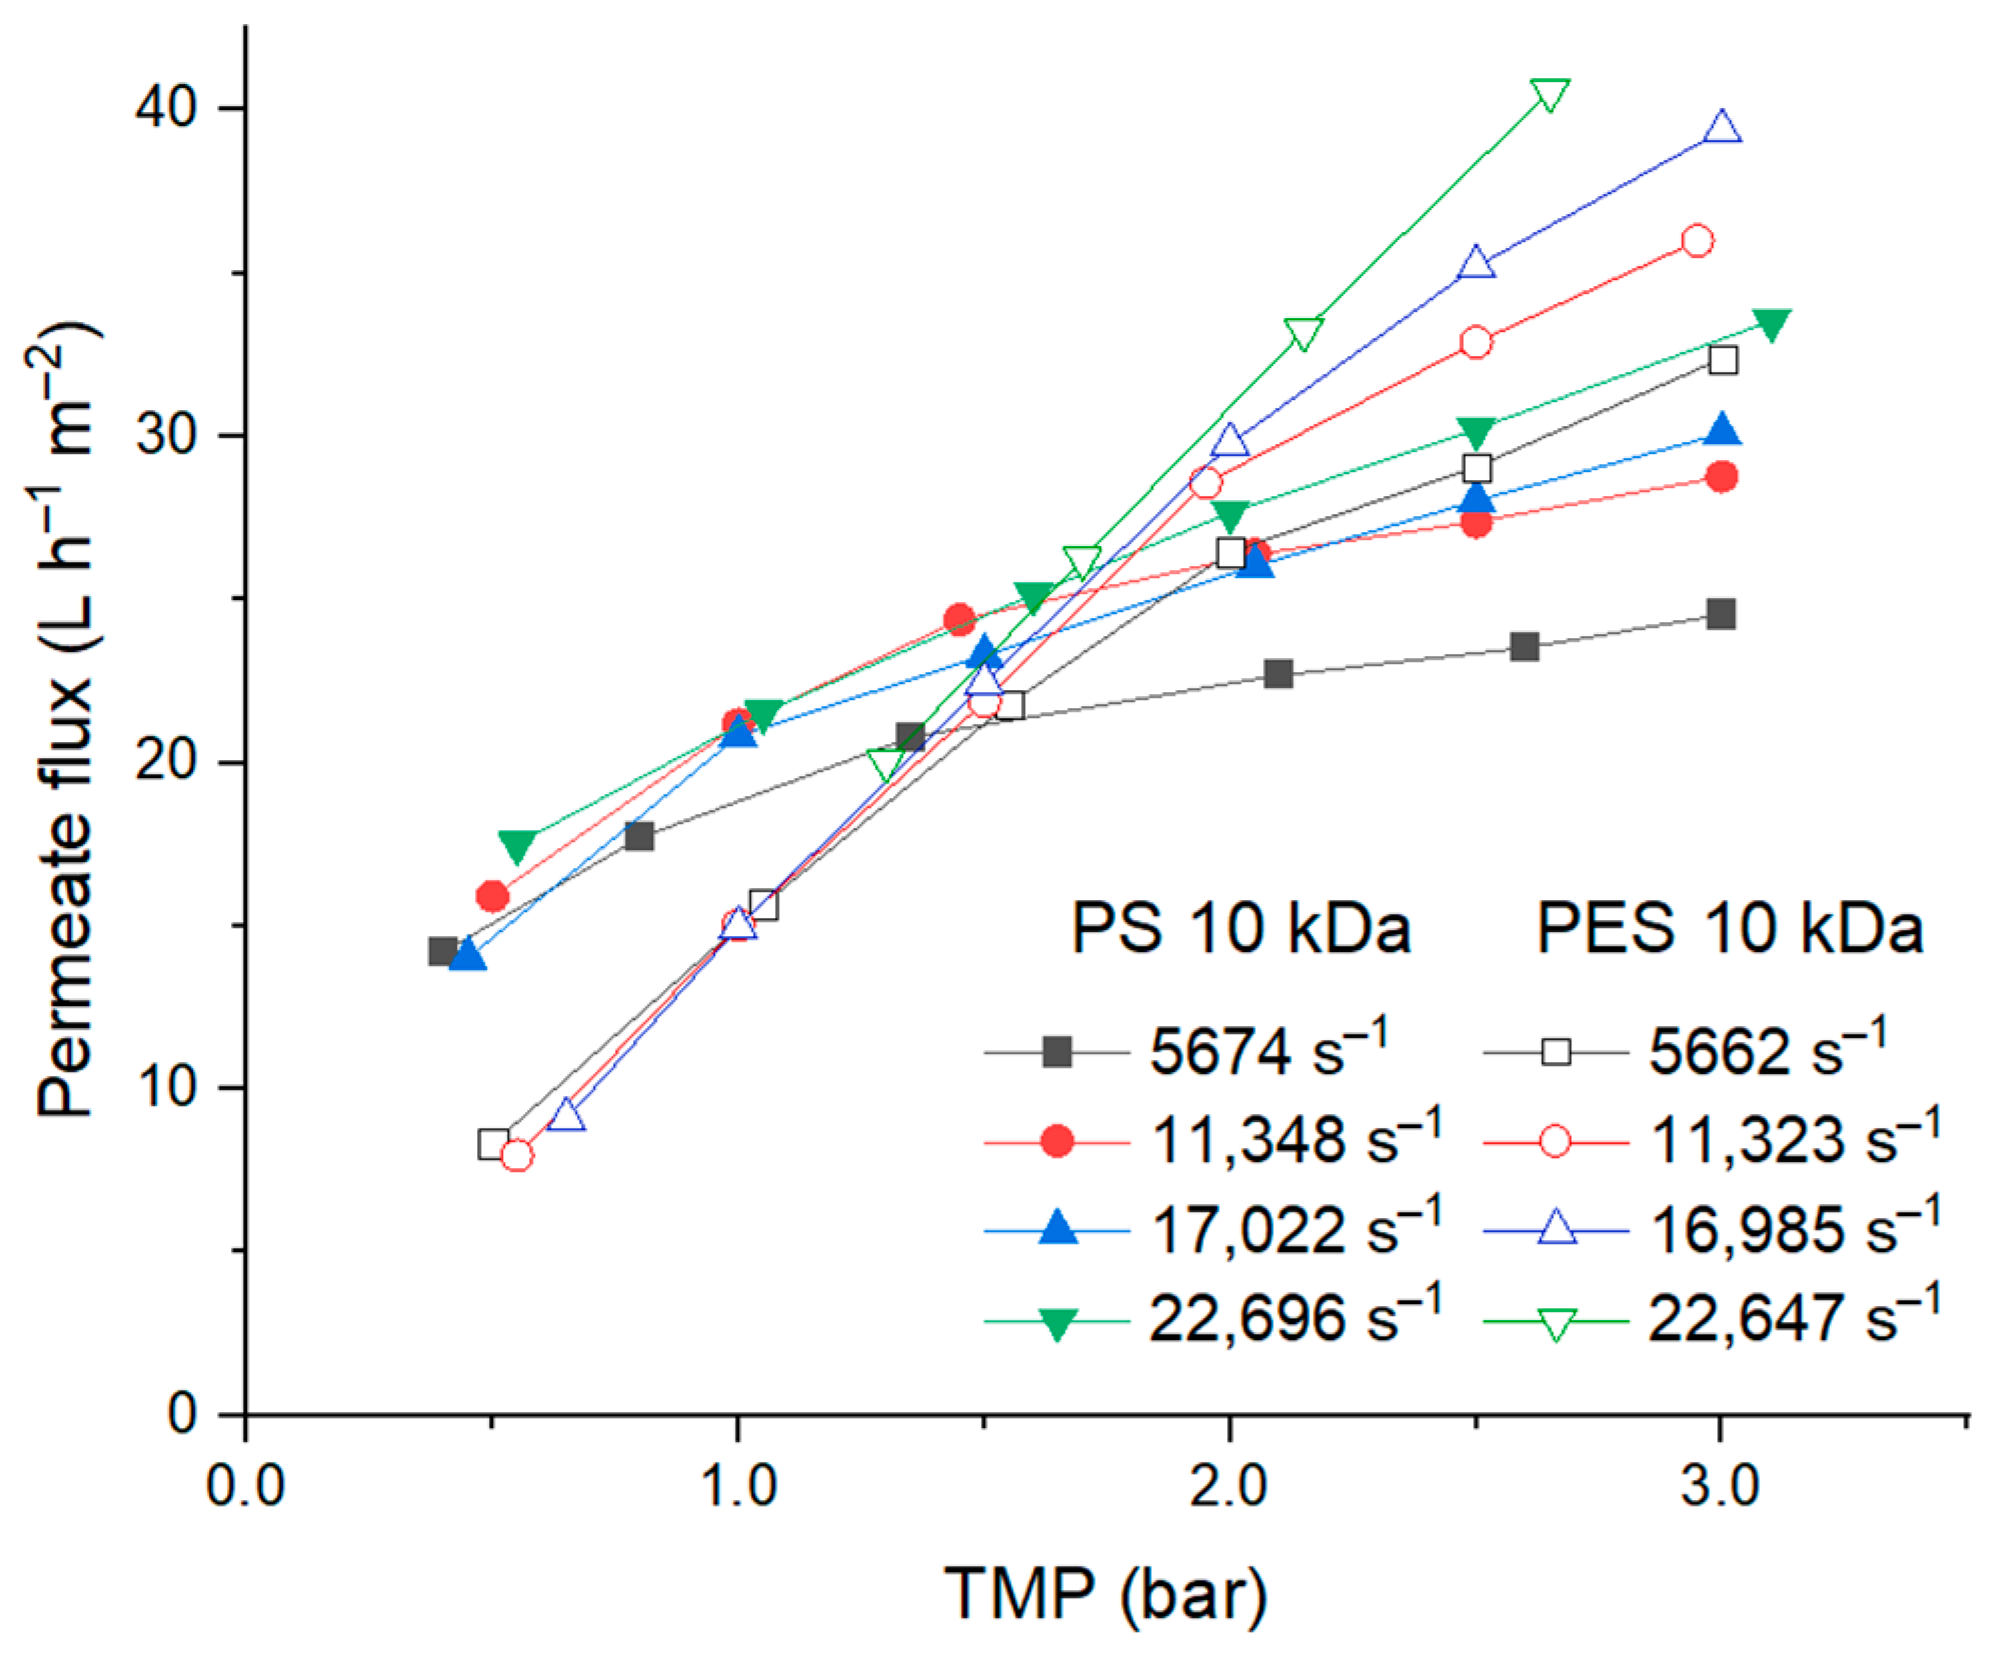
For the PS membrane, the flux increased with TMP but with an asymptotic form indicating the apparition of a polarization layer (Figure 14). The influence of this layer was stronger than with the PES membrane. The critical flux was obtained at low pressure, below 0.5 bar for all shear rates; meanwhile, it was at 1.5 bar for the PES membrane.
The shear rate had a small influence on the permeate fluxes at low pressure but was larger at high pressure. Hence, at 3 bars, the flux shifted from 24 to 32 L h−1 m−2 when shifting the shear rate from 5674 to 22,696 s−1.
The permeate flux of the PS membrane was higher than the PES membrane at the lower TMP, from 0.5 to 1.5 bar, as opposed to the higher TMP (Figure 14). From this figure, it appears that the PS membrane supported a higher polarization concentration layer effect than the PES membrane, and that this layer cannot be removed a high shear rate, contrasting the behavior of the PES membrane.
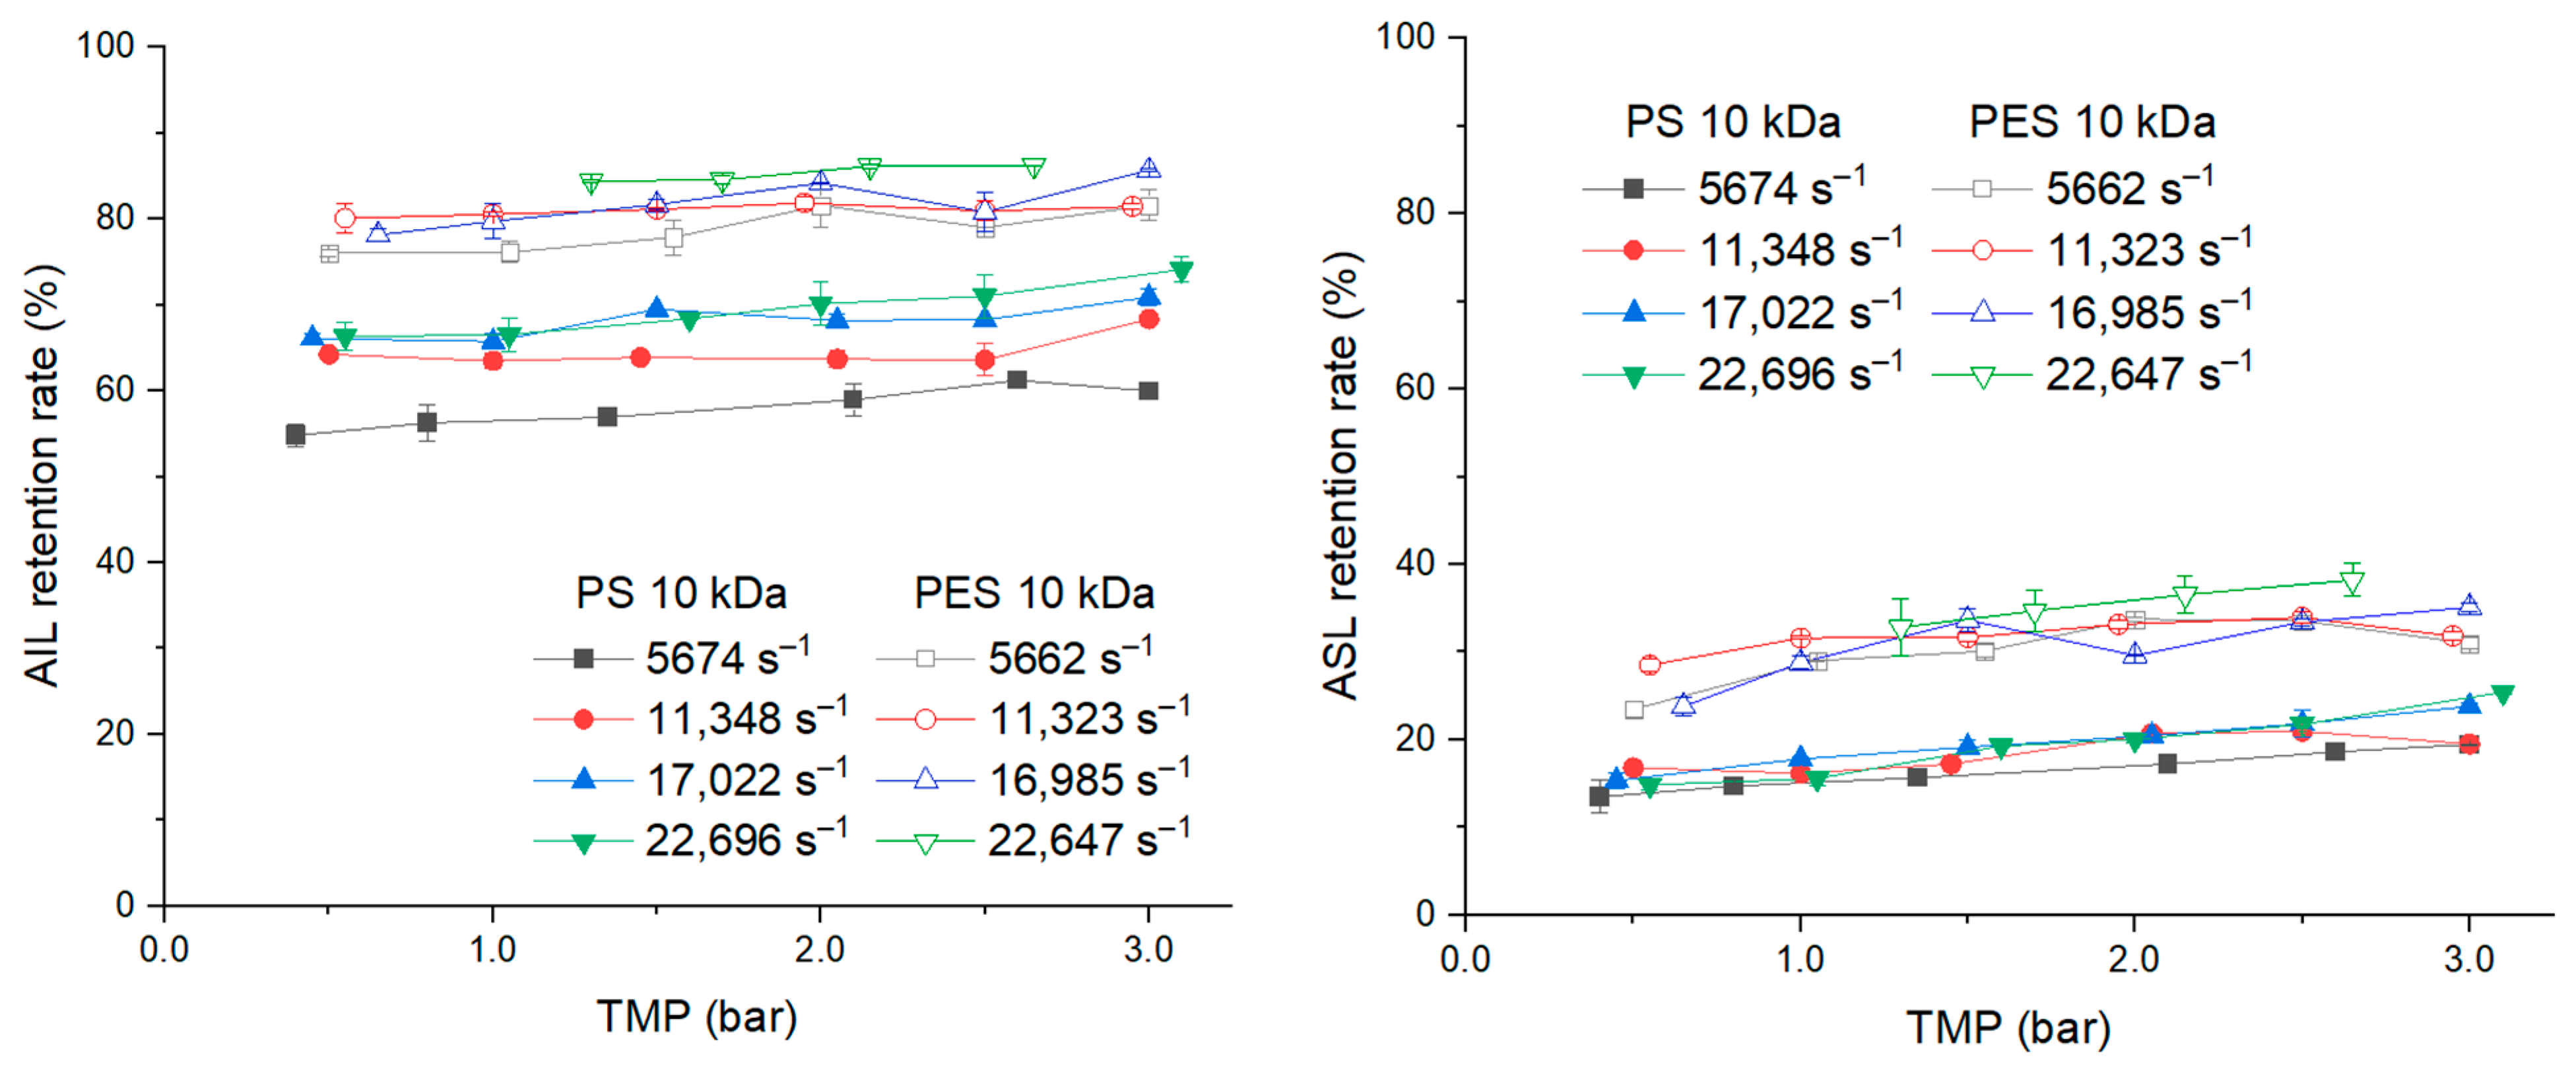
The PS membrane presented a retention rate for AIL and ASL, respectively, that were about 60% and 20% lower than the PES membrane which, respectively, exhibited rates of 80% and 30% (Figure 15). The retention rate of both AIL and ASL for the two membranes slightly increased when the TMP increased. For AIL, there was a greater impact of shear rate on the retention rate of the PS membrane than for the PES membrane. For example, with the PS membrane, the shear rate of 5674 s−1 afforded a much lower AIL retention rate compared to other shear rates.
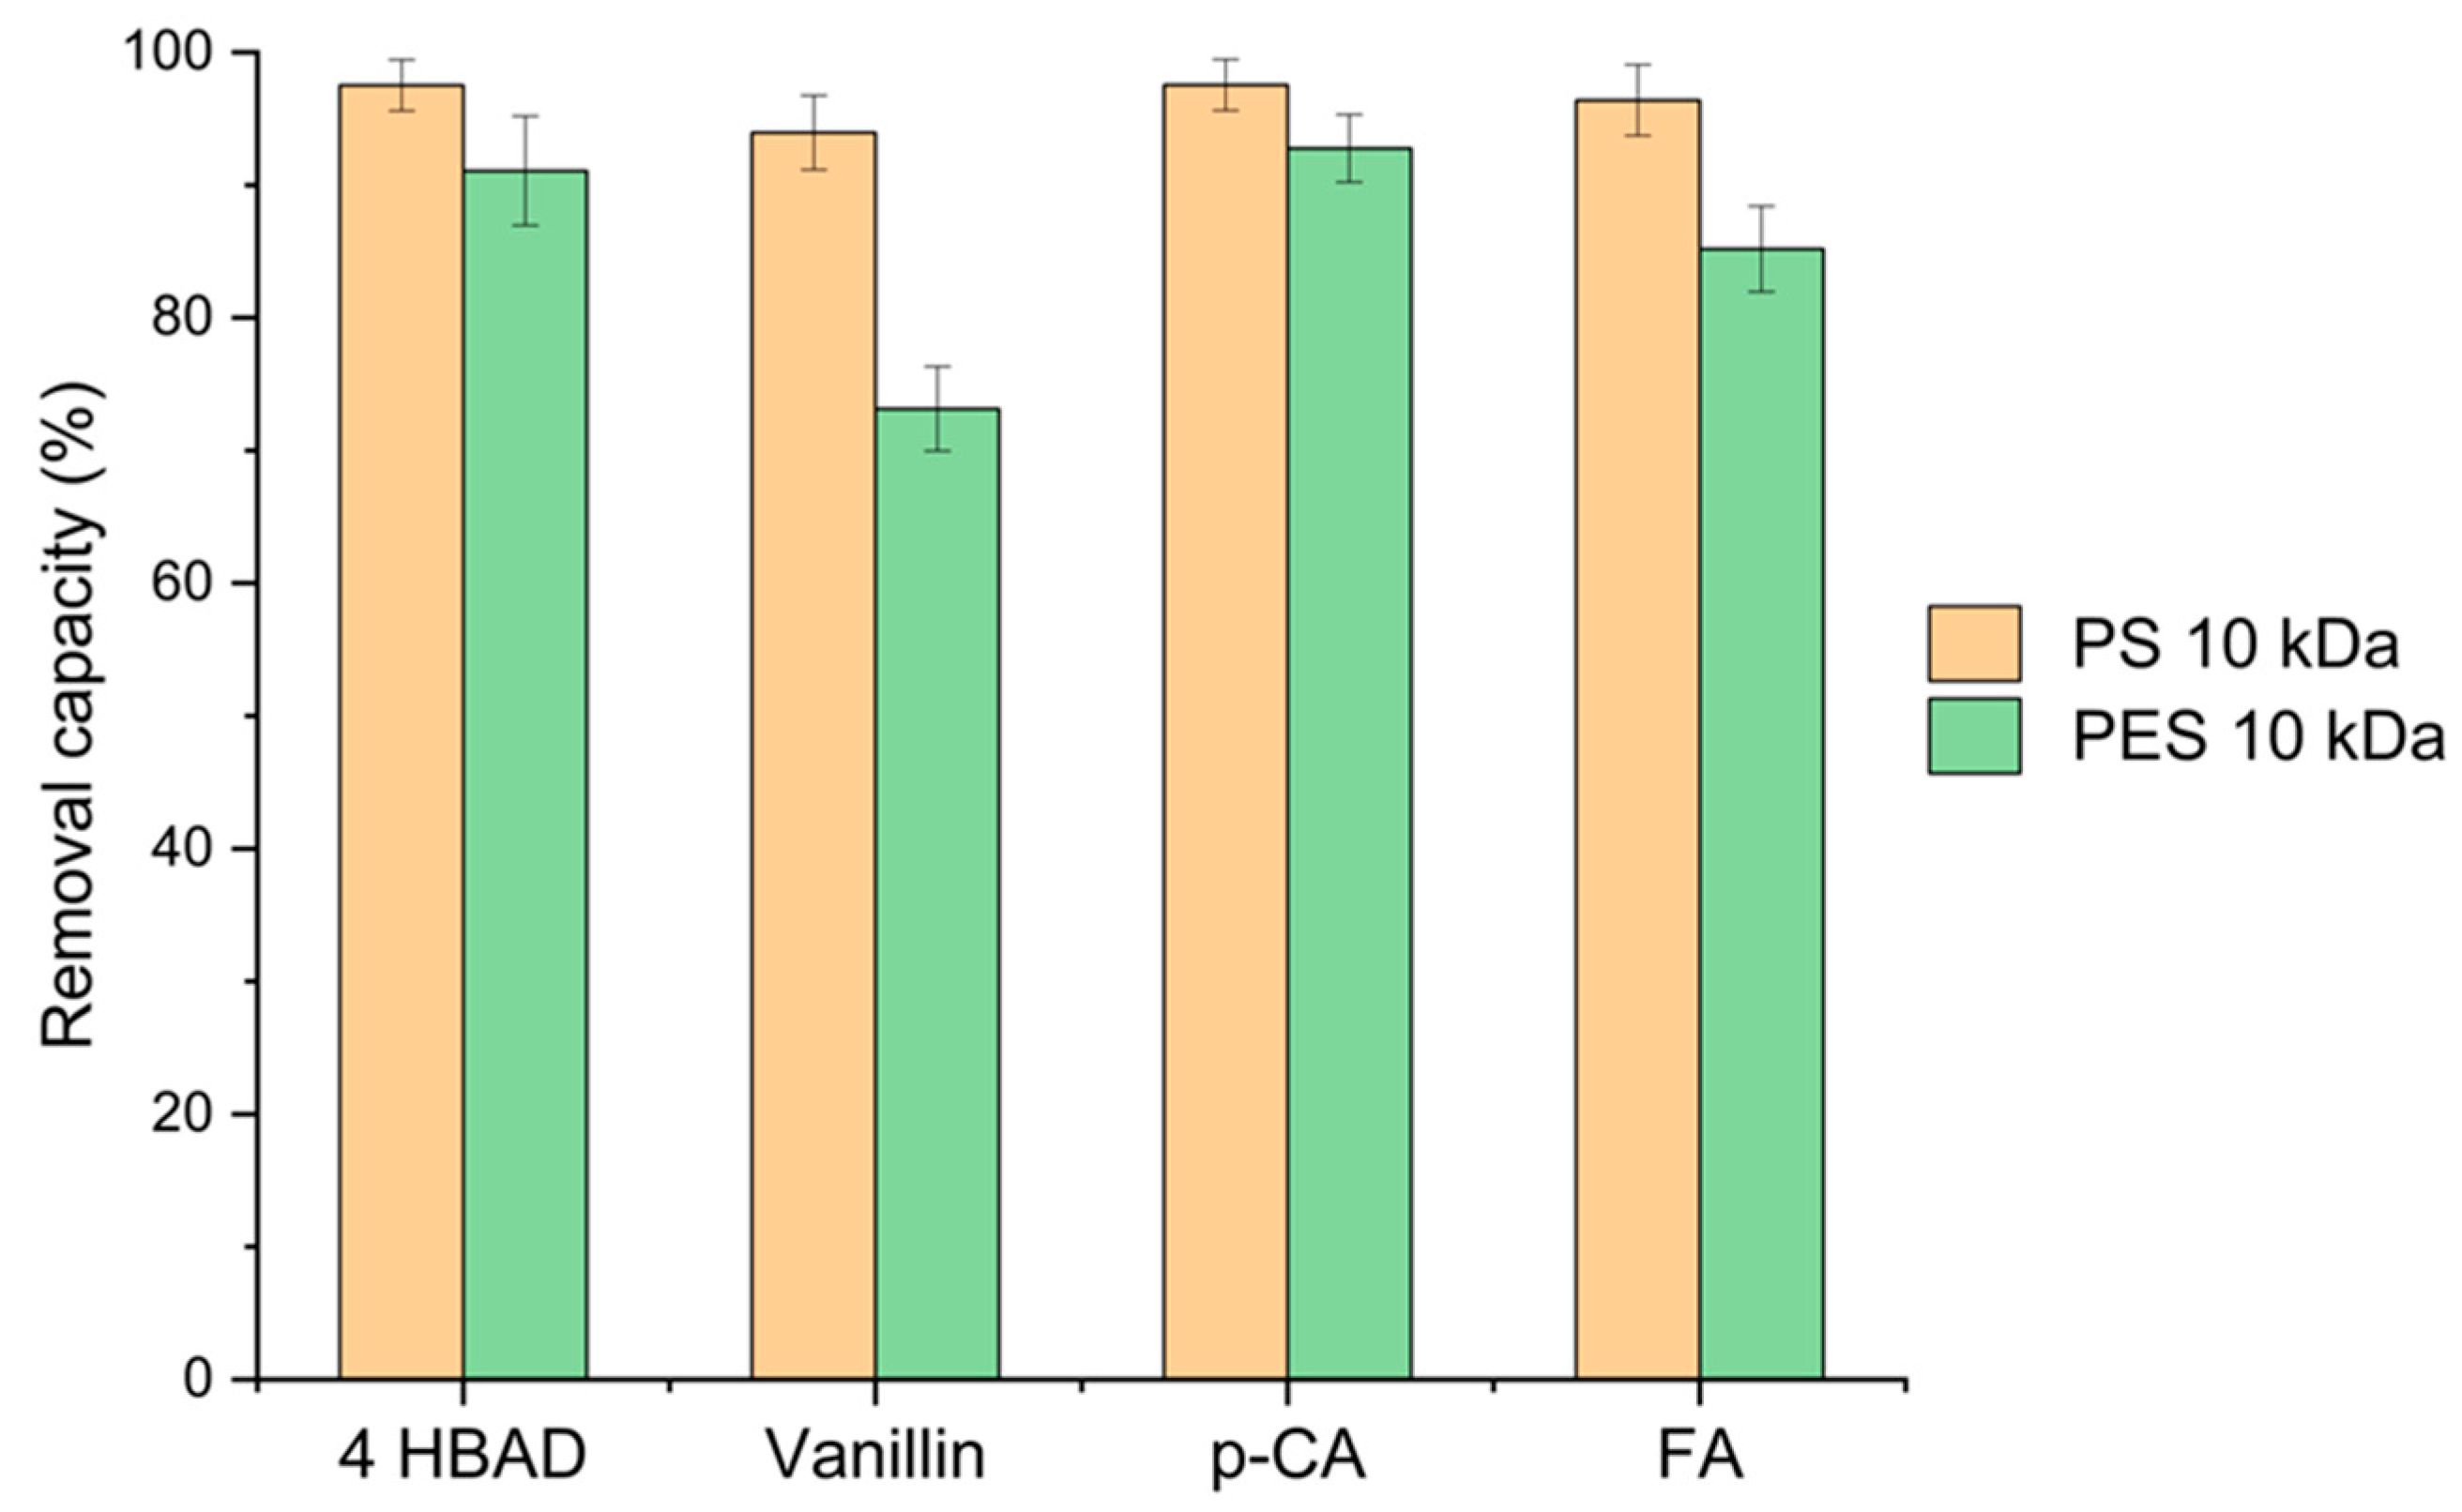
The retention rate for total phenolic compounds did not change with pressure and shear rate, ranging from 20 to 30% TMP and shear rate had insignificant impacts on the retention rates. The removal rates of 4-hydroxybenzaldehyde (4 HBAD), vanillin, p-coumaric, and ferulic acids were 97.5 ± 1.9%, 93.9 ± 2.8%, 97.5 ± 1.9%, and 96.4 ± 2.7%, respectively (Figure 16). Similar to acid-soluble lignin, the PS membrane had greater capacity to remove the four phenolic acids compared to that of the PES membrane.
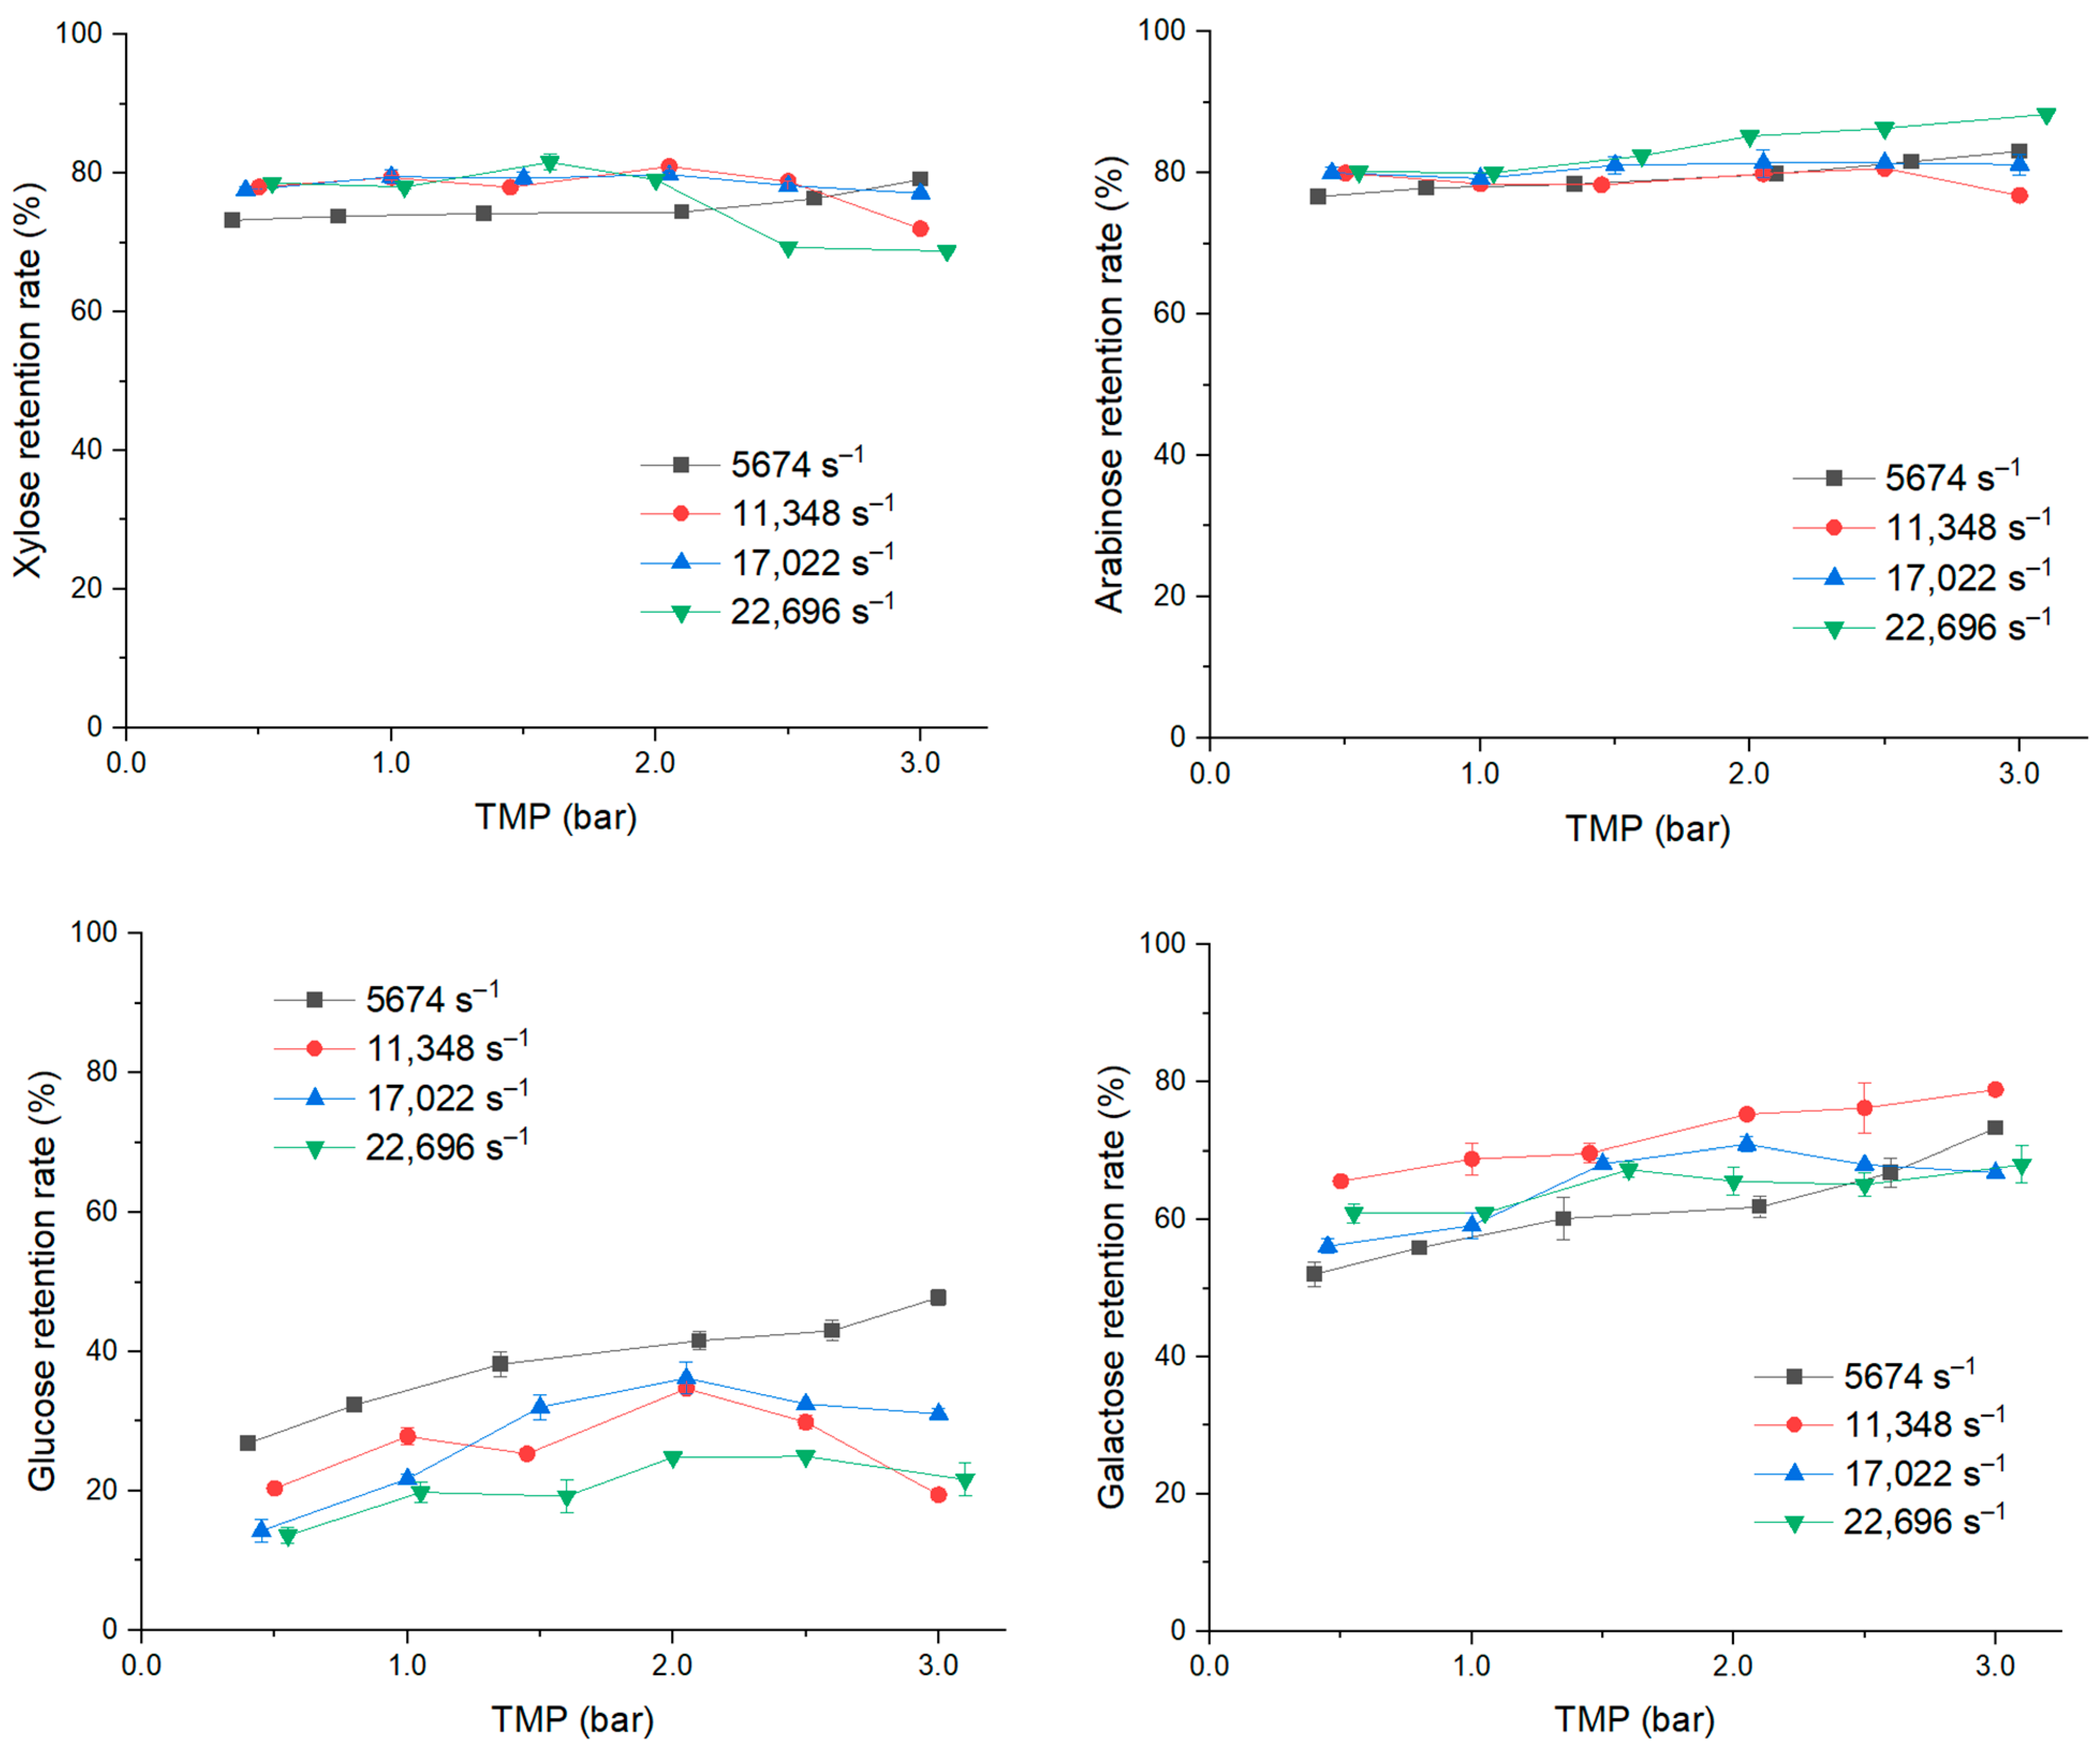
The retention rates for arabinose and xylose varied from 77 to 88% and 69 to 82%, respectively, and almost did not change with TMP (Figure 17). These sugars seem to be associated with large polymers, arabinoxylan more than xylan, and are larger than the membrane pore size. Polymers containing galactose and glucose presented lower rejection rates, respectively, of 56 to 79% and 14 to 48%. These polymers appear to be smaller and retention could be associated to fouling. This would explain why the impact of TMP and shear rate were more obvious for galactose and glucose retention rates. Hence, the retention rate of glucose was much higher for the lowest shear rate of 5674 s−1, and it increased greatly as a function of TMP from 26.6 to 47.8%. In the comparison of the two membrane materials, PS had much lower retention rates for all sugars.

4. Conclusions

In this study, membrane filtration has been studied for lignin purification. The results indicated that it was possible to remove small molecules like phenolic acids and β-glucans, but there was almost no separation with hemicelluloses. All tested parameters had significant impact on the permeate flux and retention rate of small molecules. In particular, the increase in temperature from 20 to 40 °C could increase permeate flux from 21–27 L h−1 m−2 to 24–39 L h−1 m−2. The PES 5 kDa membrane seems to be the most suitable to concentrate lignin and carbohydrates and remove phenolic acids. Nevertheless, as the PS membrane showed different separation performances, it would be interesting to extend the study to another material like polyamide and cellulose acetate. Furthermore, other separation technology like precipitation should be studied in order to propose a complete fractionation scheme.

Author Contributions

Conceptualizing, reviewing and editing: all authors; performing experiments, writing original draft: N.T.-T.P., N.B., J.P., P.B. and P.-Y.P. All authors have read and agreed to the published version of the manuscript.

Funding

The Ph.D. of Nga Thi-Thanh Pham was funded by the France Excellence scholarship from the French Embassy in Vietnam. All experiments and analyses were performed in the Laboratoire de Chimie Agro-industrielle (LCA), Toulouse INP. This work has also benefited from a state grant managed by the National Research Agency under the “Investissements d’Avenir” programme with the reference ANR-18-EURE-0021.

Data Availability Statement

Data are available upon request.

Conflicts of Interest

The authors declare no conflicts of interest.

References

  1. Zhang, L.; Larsson, A.; Moldin, A.; Edlund, U. Comparison of lignin distribution, structure, and morphology in wheat straw and wood. Ind. Crops Prod. 2022, 187, 115432. [Google Scholar] [CrossRef]
  2. Thakur, V.K.; Thakur, M.; Raghavan, P.; Kessler, M. Progress in Green Polymer Composites from Lignin for Multifunctional Applications: A Review. ACS Sustain. Chem. Eng. 2014, 2, 1072–1092. [Google Scholar] [CrossRef]
  3. Lobato-Peralta, D.R.; Duque-Brito, E.; Villafán-Vidales, H.I.; Longoria, A.; Sebastian, P.J.; Cuentas-Gallegos, A.K.; Arancibia-Bulnes, C.A.; Okoye, P.U. A review on trends in lignin extraction and valorization of lignocellulosic biomass for energy applications. J. Clean. Prod. 2021, 293, 126123. [Google Scholar] [CrossRef]
  4. Bajpai, P. Carbon Fibre from Lignin; Springer: Berlin/Heidelberg, Germany, 2017. [Google Scholar]
  5. Weil, J.; Westgate, P.; Kohlmann, K.; Ladisch, M.R. Cellulose pretreatments of lignocellulosic substrates. Enzym. Microb Technol. 1994, 16, 1002–1004. [Google Scholar] [CrossRef] [PubMed]
  6. Oriez, V.; Peydecastaing, J.; Pontalier, P.-Y. Separation of sugarcane bagasse mild alkaline extract components by ultrafiltration—Membrane screening and effect of filtration parameters. Process Biochem. 2019, 78, 91–99. [Google Scholar] [CrossRef]
  7. Jönsson, A.-S. 5—Membranes for lignin and hemicellulose recovery in pulp mills. In Membrane Technologies for Biorefining; Elsevier: Amsterdam, The Netherlands, 2016; pp. 105–133. [Google Scholar]
  8. Ropponen, J.; Räsänen, L.; Rovio, S.; Ohra-aho, T.; Liitiä, T.; Mikkonen, H.; van de Pas, D.; Tamminen, T. Solvent extraction as a means of preparing homogeneous lignin fractions: 11th EWLP, Hamburg, Germany, 16–19 August 2010. Holzforschung 2011, 65, 543–549. [Google Scholar] [CrossRef]
  9. Hidayati, S.; Satyajaya, W.; Fudholi, A. Lignin isolation from black liquor from oil palm empty fruit bunch using acid. J. Mater. Res. Technol. 2020, 9, 11382–11391. [Google Scholar] [CrossRef]
  10. Toledano, A.; Serrano, L.; Garcia, A.; Mondragon, I.; Labidi, J. Comparative study of lignin fractionation by ultrafiltration and selective precipitation. Chem. Eng. J. 2010, 157, 93–99. [Google Scholar] [CrossRef]
  11. Arkell, A.; Olsson, J.; Wallberg, O. Process performance in lignin separation from softwood black liquor by membrane filtration. Chem. Eng. Res. Des. 2014, 92, 1792–1800. [Google Scholar] [CrossRef]
  12. Shao, L.; Zhang, X.; Chen, F.; Xu, F. Fast pyrolysis of Kraft lignins fractionated by ultrafiltration. J. Anal. Appl. Pyrolysis 2017, 128, 27–34. [Google Scholar] [CrossRef]
  13. Willför, S.; Sundberg, A.; Hemming, J.; Holmbom, B. Polysaccharides in some industrially important softwood species. Wood Sci. Technol. 2005, 39, 245–257. [Google Scholar] [CrossRef]
  14. Persson, T.; Jönsson, A.-S. Isolation of hemicelluloses by ultrafiltration of thermomechanical pulp mill process water—Influence of operating conditions. Chem. Eng. Res. Des. 2010, 88, 1548–1554. [Google Scholar] [CrossRef]
  15. Jönsson, A.-S.; Nordin, A.-K.; Wallberg, O. Concentration and purification of lignin in hardwood kraft pulping liquor by ultrafiltration and nanofiltration. Chem. Eng. Res. Des. 2008, 86, 1271–1280. [Google Scholar] [CrossRef]
  16. Tolbert, A.; Akinosho, H.; Khunsupat, R.; Naskar, A.; Ragauskas, A. Characterization and analysis of the molecular weight of lignin for biorefining studies. Biofuels Bioprod. Biorefining 2014, 8, 836–856. [Google Scholar] [CrossRef]
  17. Boussu, K.; Van der Bruggen, B.; Volodin, A.; Snauwaert, J.; Van Haesendonck, C.; Vandecasteele, C. Roughness and hydrophobicity studies of nanofiltration membranes using different modes of AFM. J. Colloid Interface Sci. 2005, 286, 632–638. [Google Scholar] [CrossRef]
  18. Tobias, P.; Ann-Sofi, J. Fouling of Ultrafiltration Membranes during Isolation of Hemicelluloses in the Forest Industry. Sch. Res. Exch. 2009, 11, 624012. [Google Scholar] [CrossRef]
  19. Maartens, A.; Jacobs, E.P.; Swart, P. UF of pulp and paper effluent: Membrane fouling-prevention and cleaning. J. Membr. Sci. 2002, 209, 81–92. [Google Scholar] [CrossRef]
  20. Puro, L.; Tanninen, J.; Nyström, M. Analyses of organic foulants in membranes fouled by pulp and paper mill effluent using solid-liquid extraction. Desalination 2002, 143, 1–9. [Google Scholar] [CrossRef]
  21. Li, J.; Sanderson, R.D.; Hallbauer, D.K.; Hallbauer-Zadorozhnaya, V.Y. Measurement and modelling of organic fouling deposition in ultrafiltration by ultrasonic transfer signals and reflections. Desalination 2002, 146, 177–185. [Google Scholar] [CrossRef]
  22. Sluiter, A.D.; Hames, B.; Ruiz, R.; Scarlata, C.; Sluiter, J.; Templeton, D. Determination of Sugars, Byproducts, and Degradation Products in Liquid Fraction Process Samples; Laboratory Analytical Procedure (LAP), National Renewable Energy Laboratory: Golden, CO, USA, 2006. [Google Scholar]
  23. Sluiter, A.; Hames, B.; Ruiz, R.; Scarlata, C.; Sluiter, J.; Templeton, D.; Crocker, D. Determination of Structural Carbohydrates and Lignin in Biomass; Laboratory Analytical Procedure (LAP), National Renewable Energy Laboratory: Golden, CO, USA, 2008. [Google Scholar]
  24. Singleton, V.L.; Rossi, J.A. Colorimetry of Total Phenolics with Phosphomolybdic-Phosphotungstic Acid Reagents. Am. J. Enol. Vitic. 1965, 16, 144–158. [Google Scholar] [CrossRef]
  25. Blatt, W.F.; Dravid, A.; Michaels, A.S.; Nelsen, L. Solute Polarization and Cake Formation in Membrane Ultrafiltration: Causes, Consequences, and Control Techniques. In Membrane Science and Technology: Industrial, Biological, and Waste Treatment Processes; Springer: Boston, MA, USA, 1970; pp. 47–97. [Google Scholar]
  26. Krawczyk, H.; Arkell, A.; Jönsson, A.-S. Membrane performance during ultrafiltration of a high-viscosity solution containing hemicelluloses from wheat bran. Sep. Purif. Technol. 2011, 83, 144–150. [Google Scholar] [CrossRef]
  27. Dahdouh, L.; Delalonde, M.; Ricci, J.; Ruiz, E.; Wisnewski, C. Influence of high shear rate on particles size, rheological behavior and fouling propensity of fruit juices during crossflow microfiltration: Case of orange juice. Innov. Food Sci. Emerg. Technol. 2018, 48, 304–312. [Google Scholar] [CrossRef]
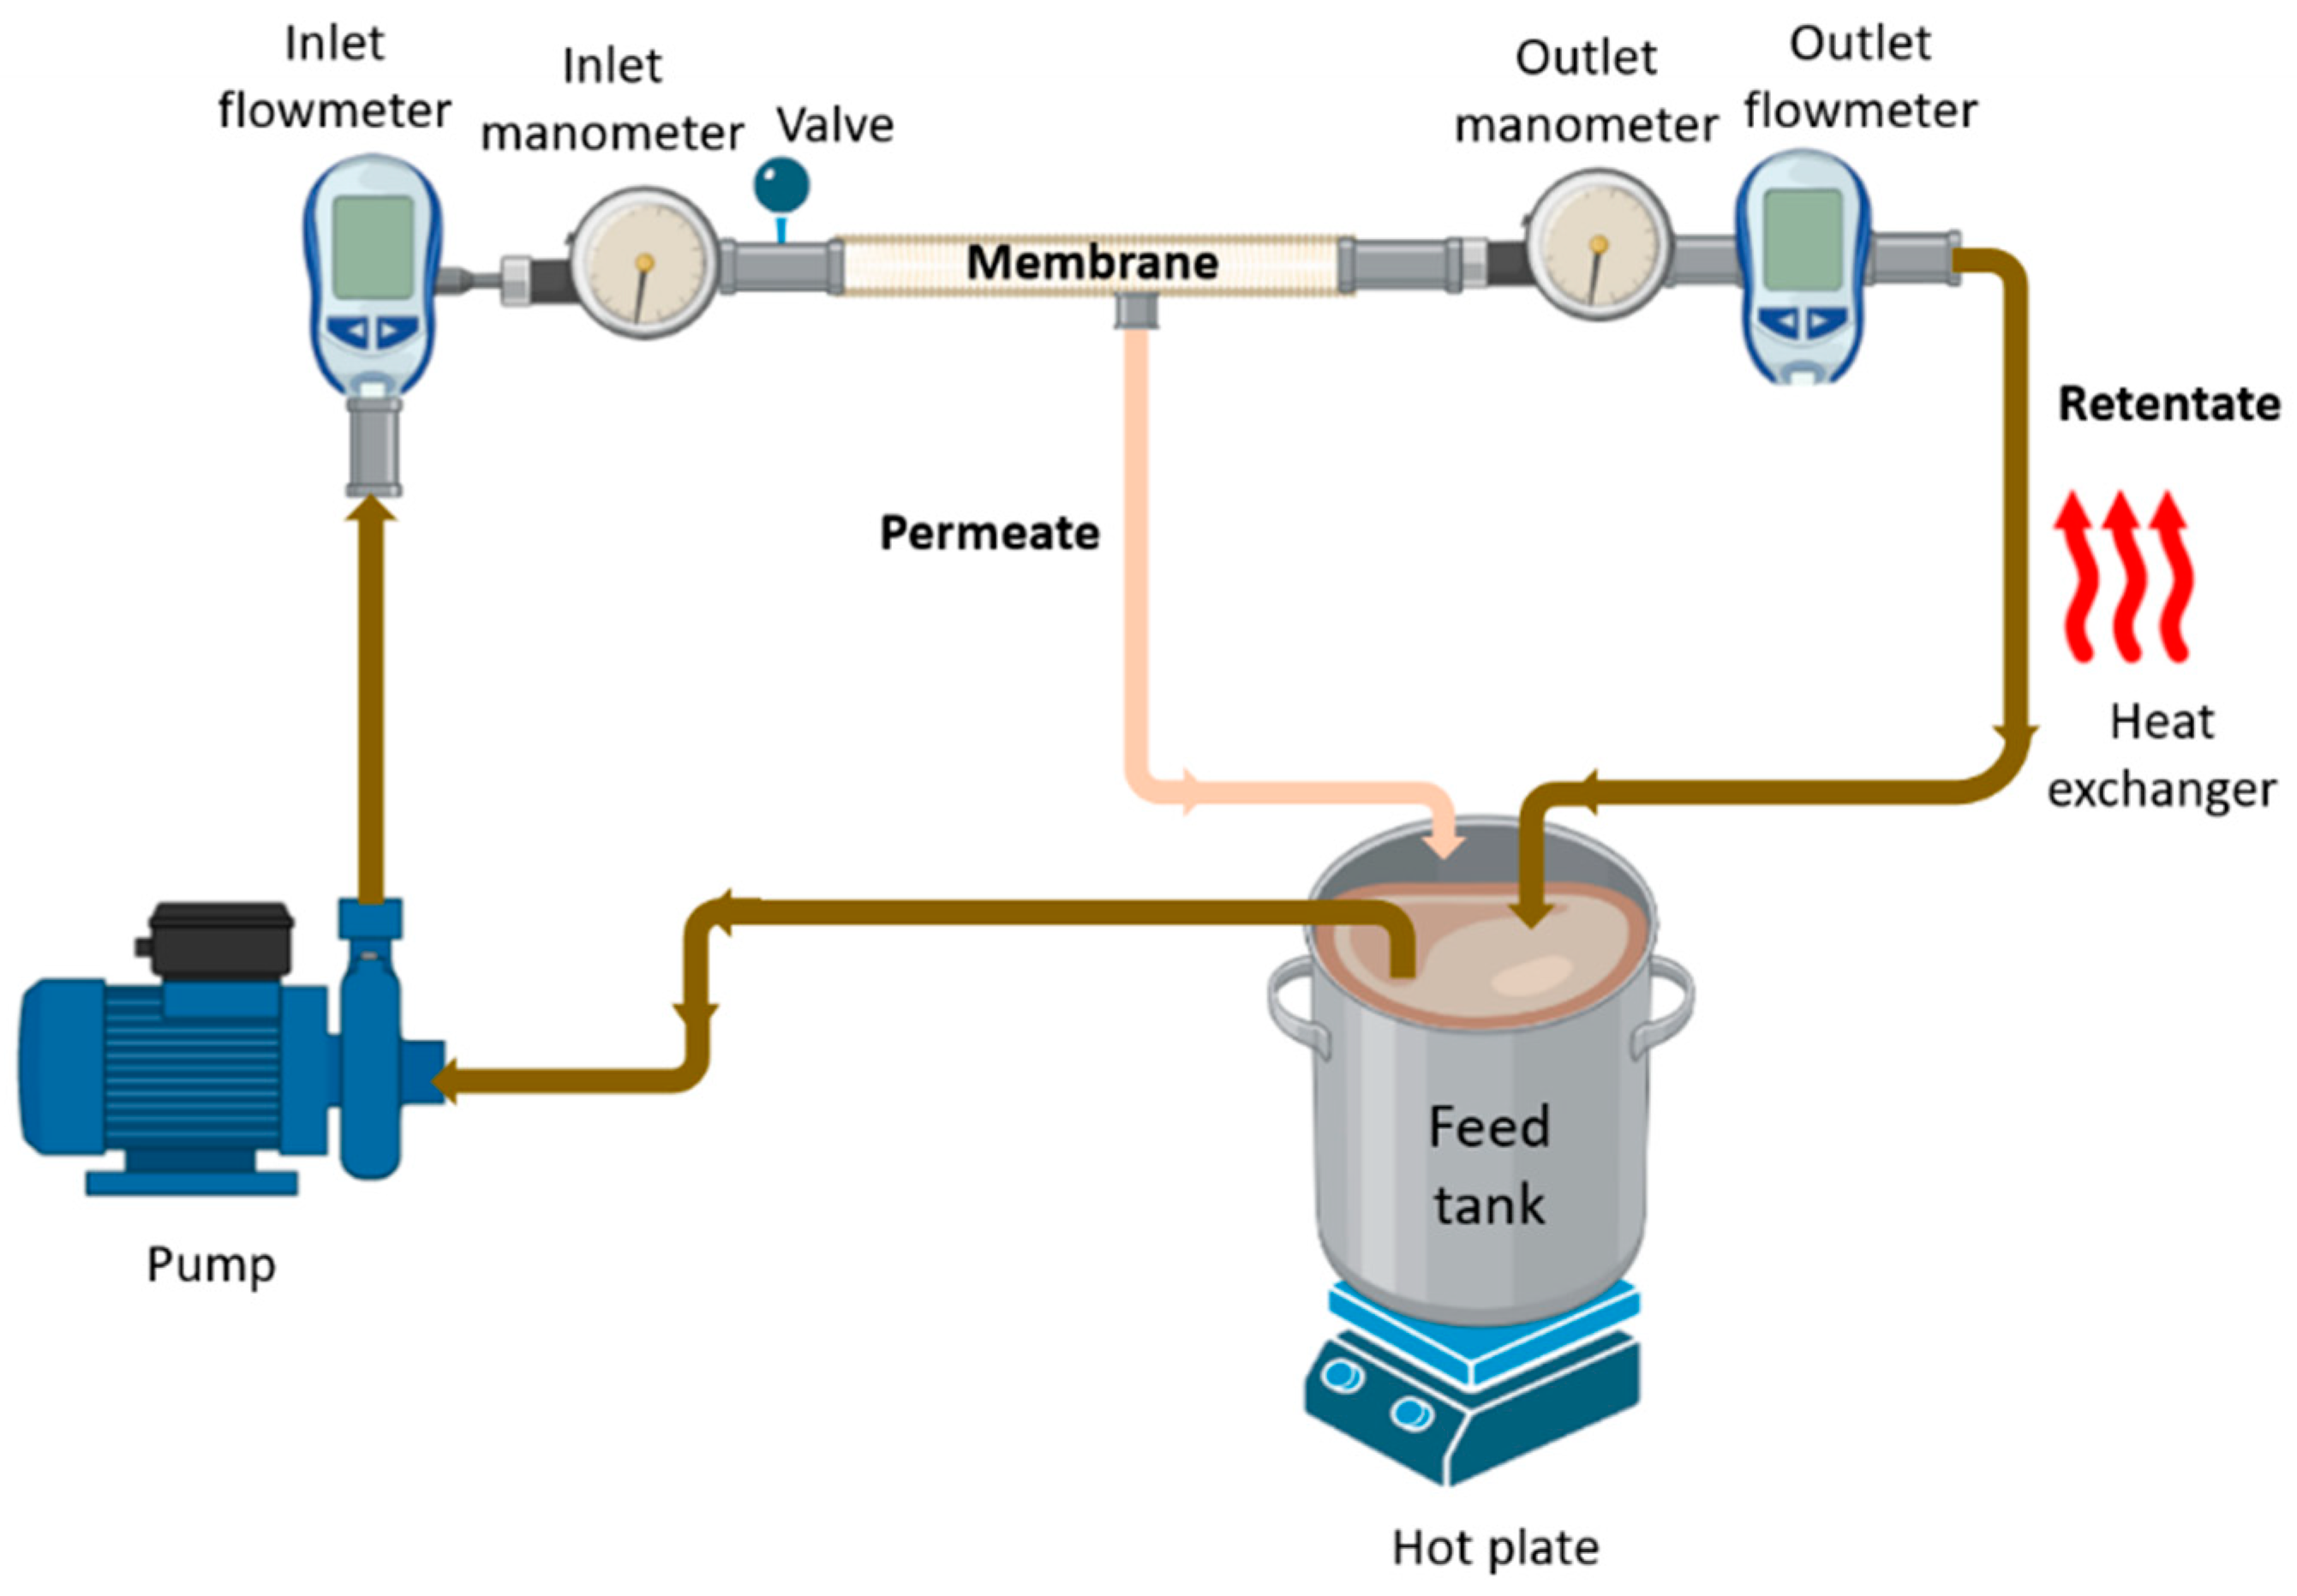
Figure 1. Setup of filtration process in recycling mode.
Cleantechnol 06 00038 g001
Figure 2. Influence of temperature on the permeate flux of the PES 5 kDa membrane at different TMP and shear rates.
Cleantechnol 06 00038 g002
Figure 3. (a) Influence of temperature (20 °C and 40 °C) on SCB extract viscosity at different shear rates and (b) relationship between shear stress and shear rate.
Cleantechnol 06 00038 g003
Figure 4. Total hydraulic resistance (RS) as a function of TMP, at 20 °C and 40 °C, with different shear rates.
Cleantechnol 06 00038 g004
Figure 5. Influence of temperature on the acid-insoluble lignin (AIL) retention rates of the PES 5 kDa membrane at different TMP and shear rates.
Cleantechnol 06 00038 g005
Figure 6. Influence of temperature on the p-coumaric acid (p-CA) retention rates of the PES 5 kDa membrane at different TMP and shear rates.
Cleantechnol 06 00038 g006
Figure 7. Influence of temperature (20 °C and 40 °C) on the xylose retention rates of the 5 kDa PES membrane as a function of TMP at different shear rates.
Cleantechnol 06 00038 g007
Figure 8. Influence of temperature (20 °C and 40 °C) on the arabinose retention rates of the 5 kDa PES membrane as a function of TMP at different shear rates.
Cleantechnol 06 00038 g008
Figure 9. Influence of temperature (20 °C and 40 °C) on the glucose retention rates for the 5 kDa PES membrane as a function of TMP at different shear rates.
Cleantechnol 06 00038 g009
Figure 10. Influence of temperature (20 °C and 40 °C) on the galactose retention rates of the 5 kDa PES membrane as a function of TMP at different shear rates.
Cleantechnol 06 00038 g010
Figure 11. Permeate flux and acid-insoluble lignin (AIL) retention rate of the membrane PES 10 kDa at different TMP and shear rates, at 40 °C.
Cleantechnol 06 00038 g011
Figure 12. Influence of molecular weight cut-off on the retention rate of sugars at different TMP and shear rates, at 40 °C.
Cleantechnol 06 00038 g012
Figure 13. Removal capacity of phenolic acids with the PES 5 and 10 kDa membranes.
Cleantechnol 06 00038 g013
Figure 14. Permeate flux for the PS and PES 10 kDa membranes at different TMP and shear rates.
Cleantechnol 06 00038 g014
Figure 15. Retention rate for acid-insoluble lignin (AIL) and acid-soluble lignin (ASL) for PS and PES 10 kDa membranes at different TMP and shear rates.
Cleantechnol 06 00038 g015
Figure 16. Removal capacity for phenolic acids via the PS and PES 10 kDa membranes.
Cleantechnol 06 00038 g016
Figure 17. Retention rate of sugars on the 10 kDa PS membrane at different TMP and shear rates.
Cleantechnol 06 00038 g017
Table 1. Average composition of raw SCB and concentration of SCB extract.
ComponentsSCBExtract
Composition (%)Concentration (g L−1)
Dry solid91.8
Ash5.0
Glucose38.80.06
Xylose19.51.98
Arabinose1.50.50
Galactose0.30.10
Acid-insoluble lignin (AIL)21.36.95
Acid-soluble lignin (ASL)6.02.91
p-coumaric acid (p-CA) 1.22
Ferulic acid 0.13
4-hydroxybenzaldehyde (4HDBA) 0.02
Vanillin 0.03
Total phenolic compounds (TPC) 2.75
The composition was calculated based on the initial SCB mass.
Table 2. Characteristics of the membranes used.
MaterialPolyethersulfone (PES)Polysulfone (PS)
Molecular weight cut-off (kDa)51010
Area (cm2)8508502300
Number of fibers5050430
Channel inner diameter (mm)111.4
Initial water flux (L h−1 m−2 bar−1) at 20 °C40.747.592.7
Table 3. Shear rates ( ɣ −1) and Reynolds (Re) numbers from filtration experiments on three different membranes.
PES 5 kDaPES 10 kDaPS 10 kDa
ɣ −1Re ɣ −1Re ɣ −1Re
2831294.02831294.0
5662588.15662588.156741155.1
11,3231176.111,3231176.111,3482310.3
16,9851764.216,9851764.217,0223456.4
22,6472352.322,6964620.5
Disclaimer/Publisher’s Note: The statements, opinions and data contained in all publications are solely those of the individual author(s) and contributor(s) and not of MDPI and/or the editor(s). MDPI and/or the editor(s) disclaim responsibility for any injury to people or property resulting from any ideas, methods, instructions or products referred to in the content.