
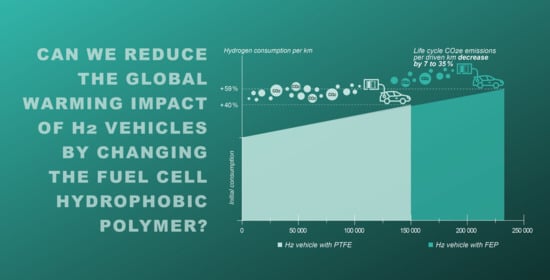
Greenhouse Gas Implications of Extending the Service Life of PEM Fuel Cells for Automotive Applications: A Life Cycle Assessment

 ,
, 
 ,
,  and
and 
Abstract
:
1. Introduction
2. Materials and Methods
2.1. Literature Review
2.2. GDMs’ Preparation
2.3. PEMFCs’ Performance Losses
2.4. From Lab Results to Real-World Performance
2.5. Global Warming Potential
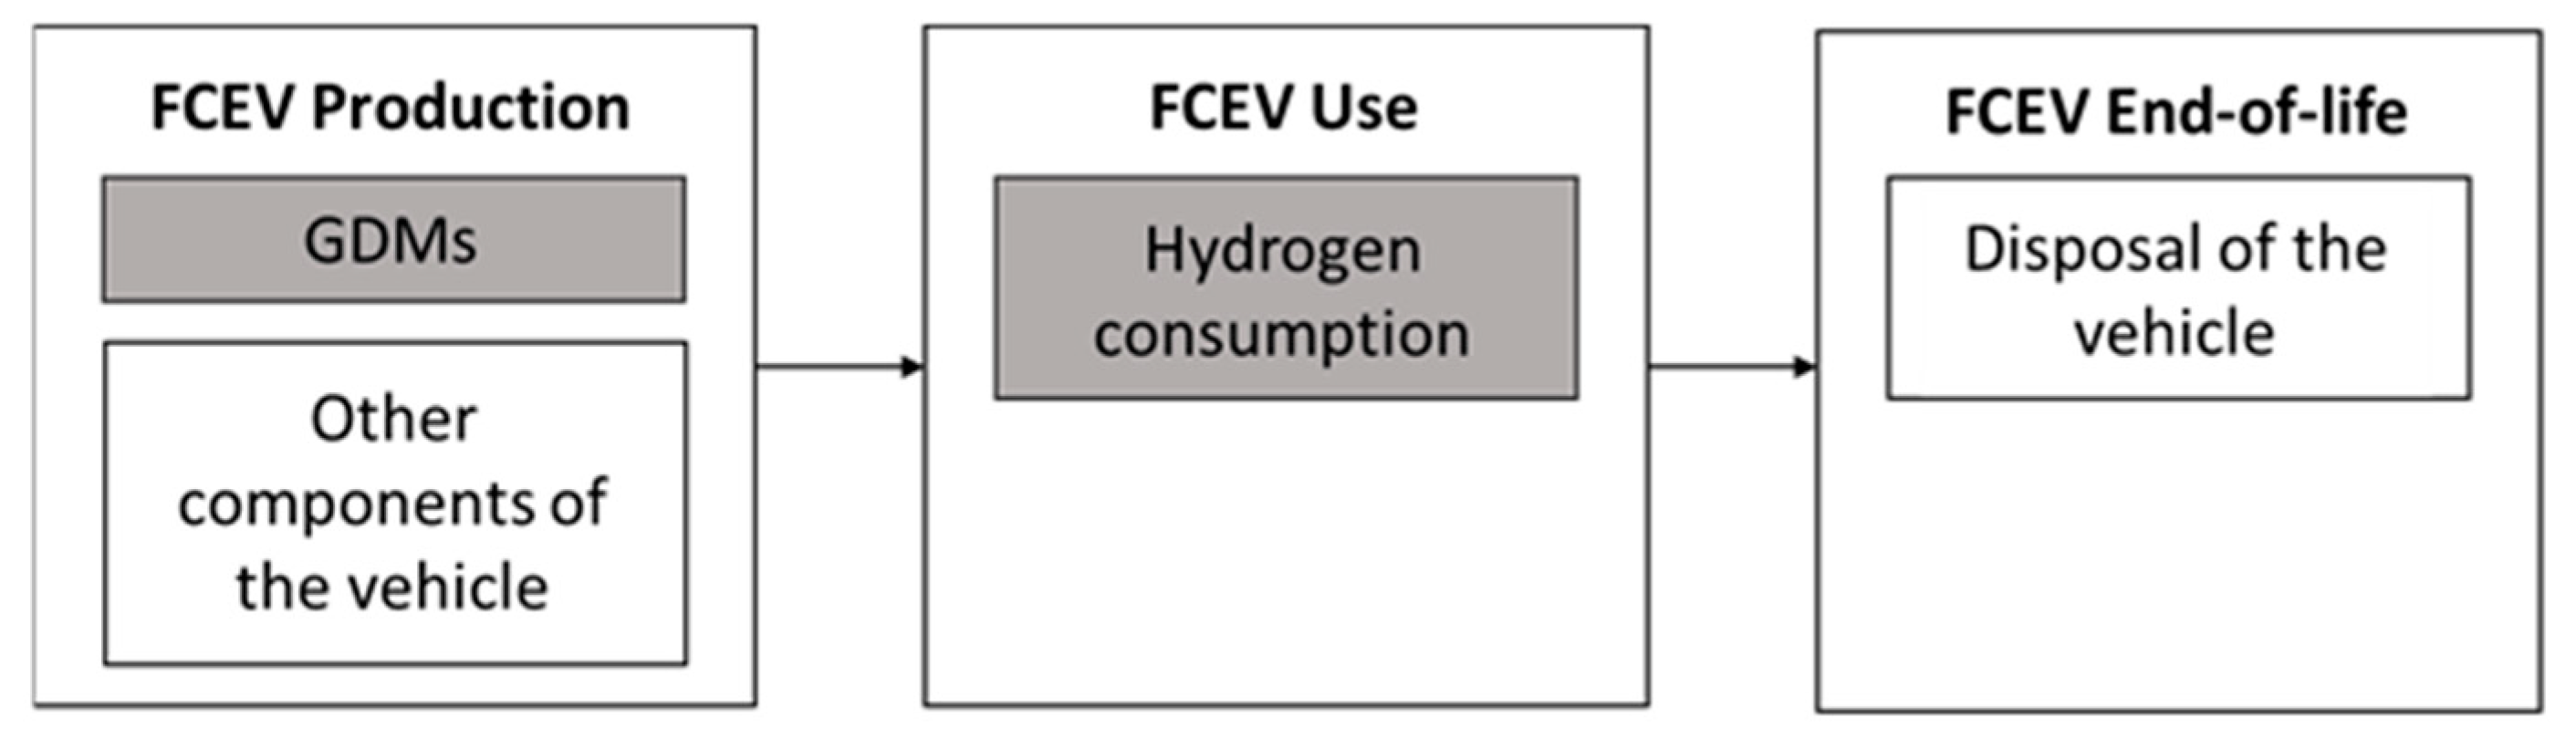
2.5.1. Goal and Scope
2.5.2. Life-Cycle Inventory: Vehicle Product System
Gas Diffusion Medium
Vehicle Manufacture and End of Life
2.5.3. Life-Cycle Inventory: Use Phase
3. Results and Discussion
3.1. Literature Review

| Reference | Year | EV Lifetime | FC Lifetime | GDL | FC Losses | Replacement | Fuel Economy |
|---|---|---|---|---|---|---|---|
| [km] | [kgH2/100 km] | ||||||
| Ahmadi and Kjeang [11] | 2015 | 180,000 | N/A | N/A | N/A | N/A | 0.78 |
| Ahmadi et al. [10] | 2020 | 120,000 | 12,000 h | N/A | 2.65 × 10⁻⁵ Vh−1 | No | 1.10 |
| Bekel and Pauliuk [35] | 2019 | 150,000 | N/A | N/A | N/A | No | 0.94 |
| Benitez et al. [24] | 2021 | 150,000 | N/A | PTFE | N/A | No | 0.76 |
| Burkhardt et al. [47] | 2016 | N/A | N/A | N/A | N/A | N/A | 0.97 |
| Candelaresi et al. [40] | 2021 | 190,000 | 190,000 km | N/A | N/A | No | 0.76 |
| Evangelisti et al. [23] | 2017 | 150,000 | N/A | PTFE | N/A | No | 0.85 |
| Frank et al. [26] | 2021 | N/A | N/A | N/A | N/A | N/A | 1.15 |
| Hill et al. [9] | 2020 | 225,000 | 5000 h | N/A | N/A | No | 1.06 ** |
| Huss et al. [25] | 2020 | N/A | N/A | N/A | N/A | N/A | 0.58 |
| Kannangara et al. [43] | 2021 | 150,000 | 150,000 km | N/A | N/A | No | 0.94 |
| Lombardi et al. [48] * | 2017 | 200,000 | N/A | N/A | N/A | N/A | 0.72 |
| Notter et al. [27] | 2015 | 150,000 | N/A | PTFE | N/A | No | 0.85 |
| Ren et al. [49] | 2020 | N/A | N/A | N/A | N/A | N/A | 0.94 |
| Sinha and Brophy [50] | 2021 | 150,000 | N/A | N/A | N/A | No | 1.00 |
| Simons and Bauer [32] | 2015 | 150,000 | 150,000 km | PTFE | N/A | No | 1.03 |
| Usai et al. [45] | 2021 | N/A | N/A | PTFE | N/A | N/A | 1.00 |
| Velandia, Vargas, and Seabra [51] | 2021 | 150,000 | N/A | N/A | N/A | No | 1.05 |
| Yang et al. [44] | 2020 | 150,000 | N/A | N/A | N/A | N/A | 1.05 |
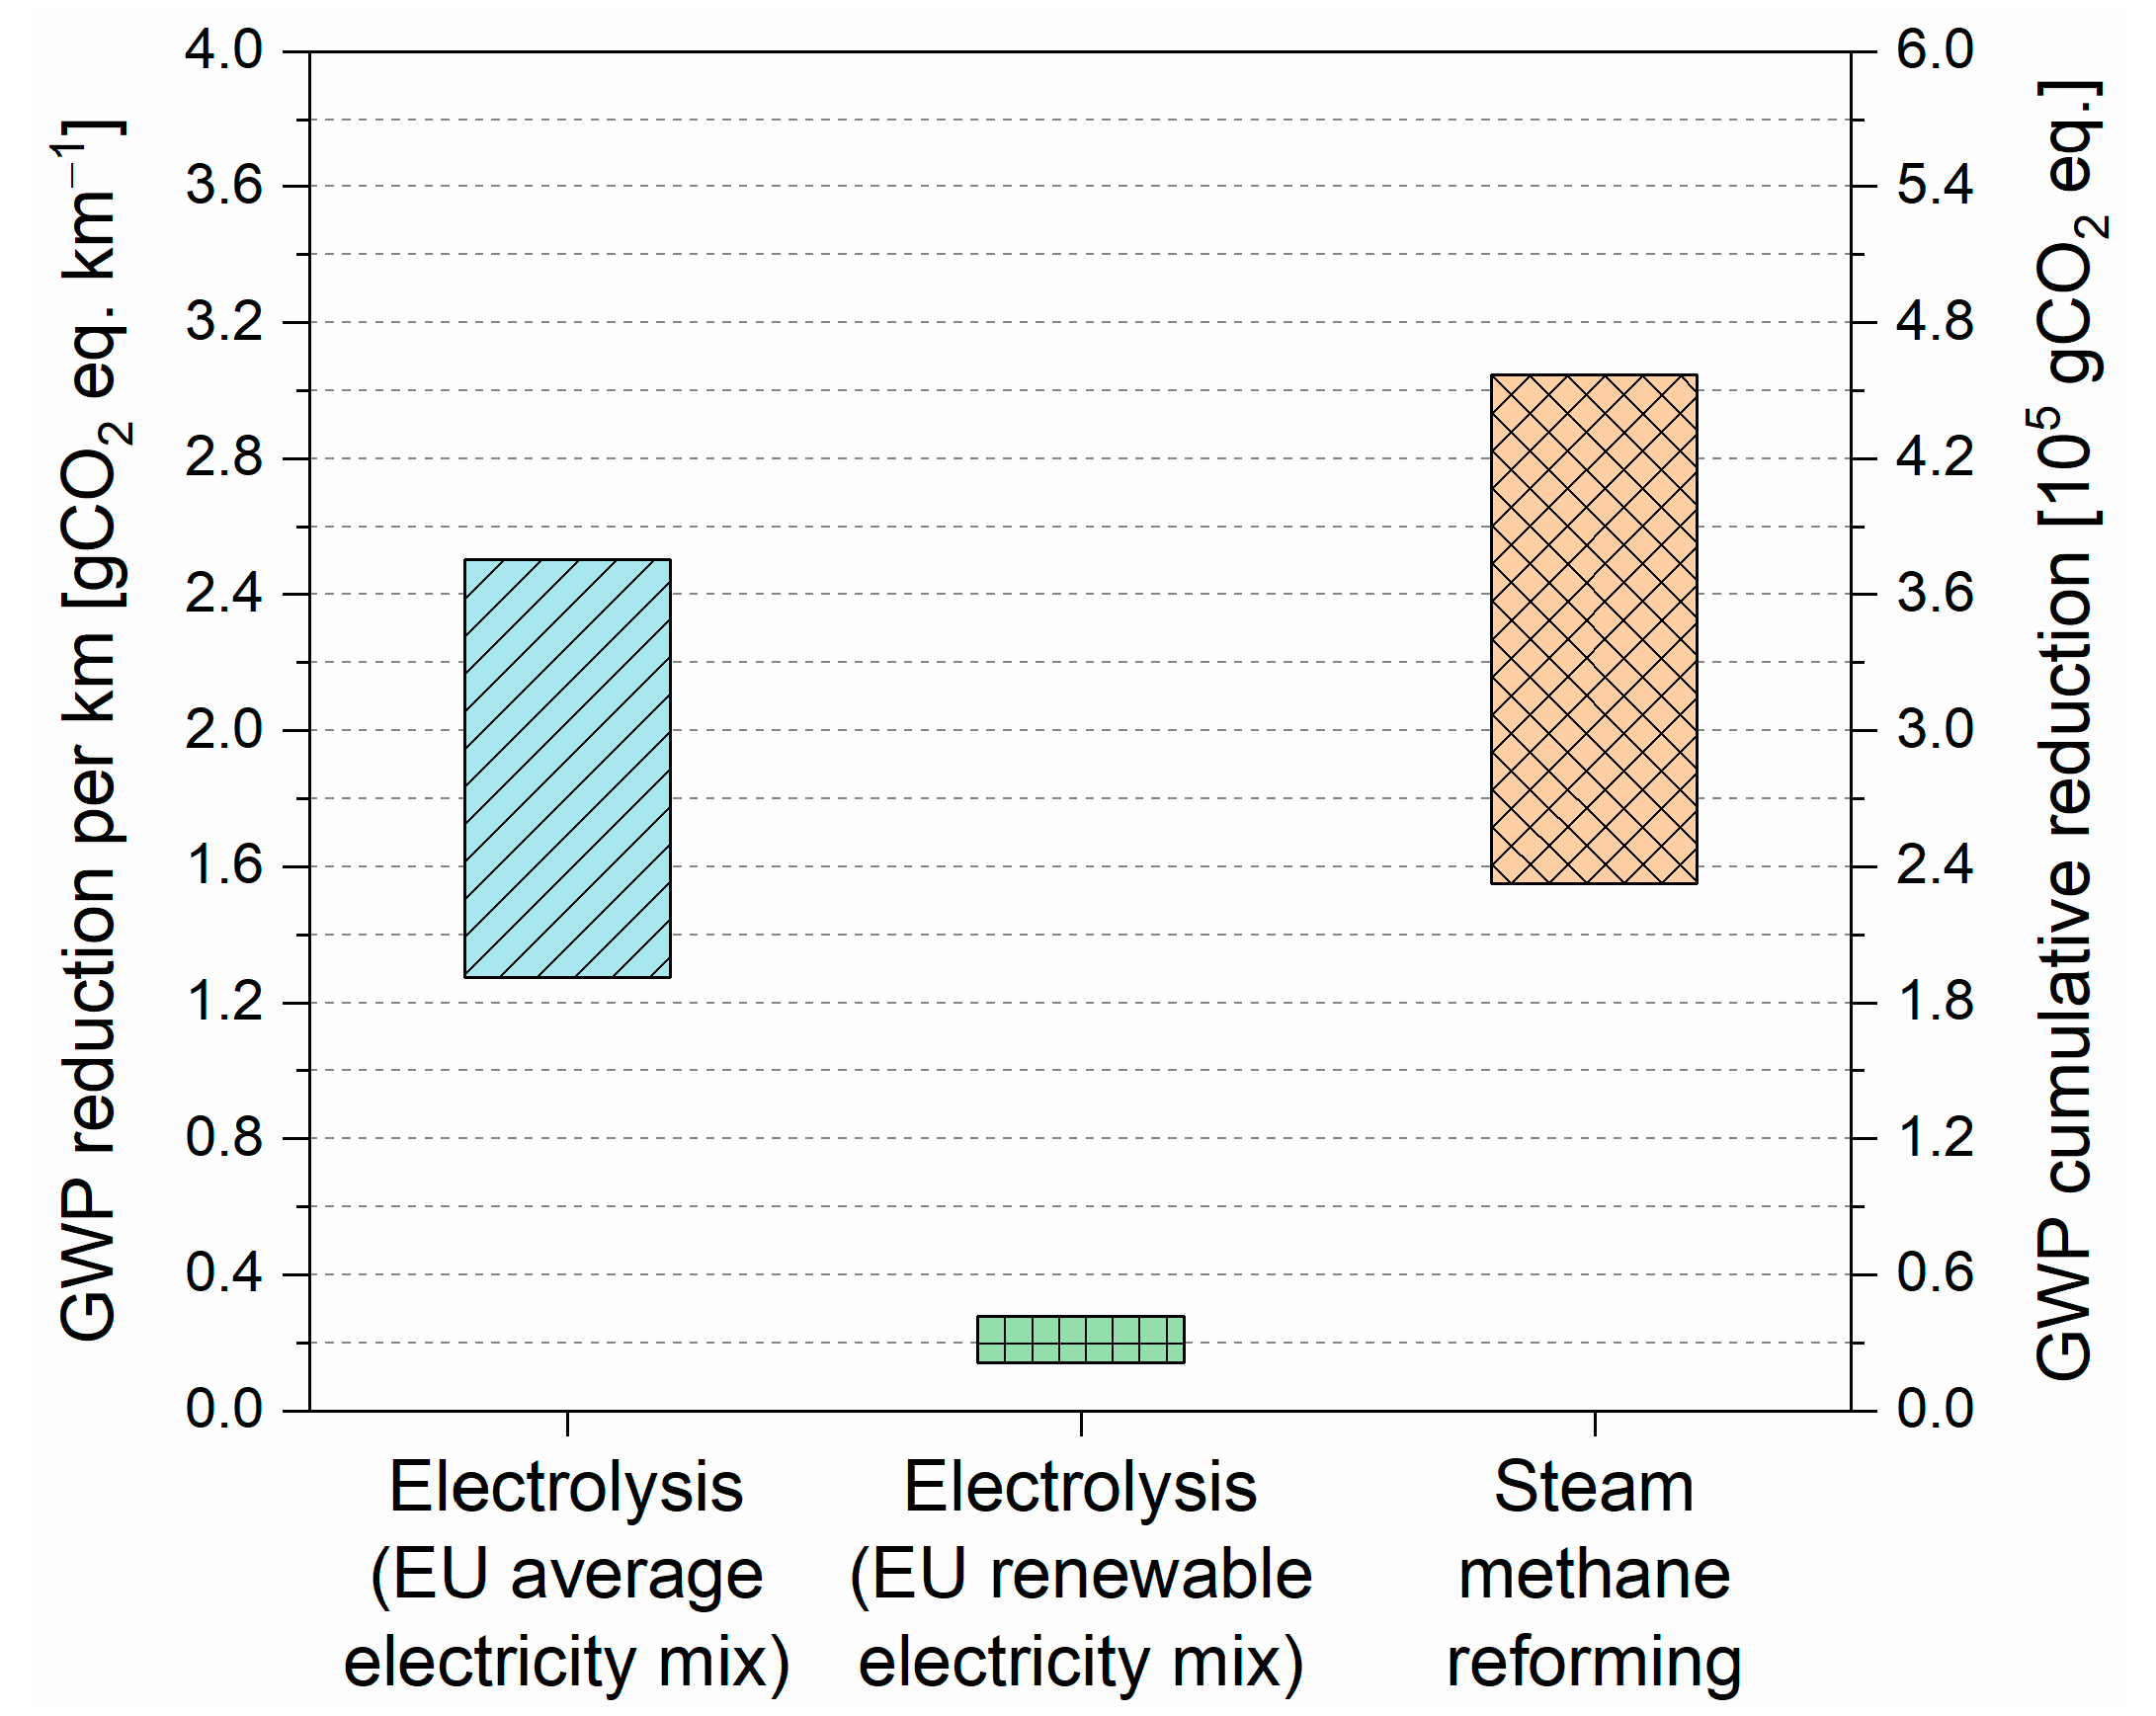
3.2. LCA
3.2.1. Scenario A
3.2.2. Scenario B
4. Conclusions
Supplementary Materials
Author Contributions
Funding
Institutional Review Board Statement
Informed Consent Statement
Data Availability Statement
Acknowledgments
Conflicts of Interest
Abbreviations
| AST | accelerated stress test |
| CNT | carbon nanotubes |
| DR | degradation rate |
| EV | electric vehicle |
| FC | fuel cell |
| FCEV | fuel cell electric vehicle |
| FEP | fluorinated ethylene propylene |
| GDL | gas diffusion layer |
| GDM | gas diffusion medium |
| GHG | greenhouse gas |
| GWP | global warming potential |
| GWP100 | global warming potential over a time horizon of 100 years |
| HFC-23 | trifluoromethane |
| HFP | hexafluoropropylene |
| ICEV | internal combustion engine vehicle |
| LCA | life-cycle assessment |
| MEA | membrane electrode assembly |
| MPL | microporous layer |
| PEMFC | proton exchange membrane FC |
| PTFE | polytetrafluoroethylene |
| TFE | tetrafluoroethylene |
References
- European Commission COM(2021) 557 Final. Proposal for a Directive of the European Parliament and of the Council Amending Directive (EU) 2018/2001 of the European Parliament and of the Council, Regulation (EU) 2018/1999 of the European Parliament and of the Council and Direct; European Parliament and of the Council: Brussel, Belgium, 2021. [Google Scholar]
- Reuters. BMW, Audi among German Automakers still Betting on Fuel Cell Cars. Available online: https://europe.autonews.com/automakers/bmw-audi-among-german-automakers-still-betting-fuel-cell-cars (accessed on 10 December 2021).
- Seemungal, L.; Arrigoni, A.; Davies, J.; Weidner, E.; Hodson, P. Decarbonisation of Heavy Duty Vehicle Transport: Zero Emission Heavy Goods Vehicles; No. JRC125149; Joint Reaserch Centre: Petten, The Netherlands, 2021. [Google Scholar] [CrossRef]
- European Commission COM(2003)302. Communication from the Commission to the Council and the European Parliament. Integrated Product Policy—Building on Environmental Life-Cycle Thinking; European Parliament and of the Council: Brussel, Belgium, 2004. [Google Scholar]
- Wang, C.; Wang, S.; Peng, L.; Zhang, J.; Shao, Z.; Huang, J.; Sun, C.; Ouyang, M.; He, X. Recent Progress on the Key Materials and Components for Proton Exchange Membrane Fuel Cells in Vehicle Applications. Energies 2016, 9, 603. [Google Scholar] [CrossRef] [Green Version]
- Kätzel, J.; Markötter, H.; Arlt, T.; Klages, M.; Haußmann, J.; Messerschmidt, M.; Kardjilov, N.; Scholta, J.; Banhart, J.; Manke, I. Effect of ageing of gas diffusion layers on the water distribution in flow field channels of polymer electrolyte membrane fuel cells. J. Power Sources 2016, 301, 386–391. [Google Scholar] [CrossRef]
- Hwang, J.J.; Kuo, J.K.; Wu, W.; Chang, W.R.; Lin, C.H.; Wang, S.E. Lifecycle performance assessment of fuel cell/battery electric vehicles. Int. J. Hydrogen Energy 2013, 38, 3433–3446. [Google Scholar] [CrossRef]
- Prussi, M.; Yugo, M.; De Prada, L.; Padella, M.; Edwards, M. JEC Well-To-Wheels Report v5; No. JRC121213; Joint Reaserch Centre: Petten, The Netherlands, 2020. [Google Scholar] [CrossRef]
- Hill, N.; Amaral, S.; Morgan-Price, S.; Nokes, T.; Bates, J.; Helms, H.; Fehrenbach, H.; Biemann, K.; Abdalla, N.; Jöhrens, J.; et al. Determining the Environmental Impacts of Conventional and Alternatively Fuelled Vehicles Through LCA; Final Report for the European Commission, DG Climate Action; European Commision: Brussel, Belgium, 2020. [Google Scholar]
- Ahmadi, P.; Torabi, S.H.; Afsaneh, H.; Sadegheih, Y.; Ganjehsarabi, H.; Ashjaee, M. The effects of driving patterns and PEM fuel cell degradation on the lifecycle assessment of hydrogen fuel cell vehicles. Int. J. Hydrogen Energy 2020, 45, 3595–3608. [Google Scholar] [CrossRef]
- Ahmadi, P.; Kjeang, E. Realistic simulation of fuel economy and life cycle metrics for hydrogen fuel cell vehicles. Int. J. Energy Res. 2017, 41, 714–727. [Google Scholar] [CrossRef]
- Kaya, K.; Hames, Y. Two new control strategies: For hydrogen fuel saving and extend the life cycle in the hydrogen fuel cell vehicles. Int. J. Hydrogen Energy 2019, 44, 18967–18980. [Google Scholar] [CrossRef]
- Latorrata, S.; Gallo Stampino, P.; Cristiani, C.; Dotelli, G. Development of an optimal gas diffusion medium for polymer electrolyte membrane fuel cells and assessment of its degradation mechanisms. Int. J. Hydrogen Energy 2015, 40, 14596–14608. [Google Scholar] [CrossRef]
- Zhao, J.; Li, X. A review of polymer electrolyte membrane fuel cell durability for vehicular applications: Degradation modes and experimental techniques. Energy Convers. Manag. 2019, 199, 112022. [Google Scholar] [CrossRef]
- Zhang, T.; Wang, P.; Chen, H.; Pei, P. A review of automotive proton exchange membrane fuel cell degradation under start-stop operating condition. Appl. Energy 2018, 223, 249–262. [Google Scholar] [CrossRef]
- Wu, J.; Yuan, X.Z.; Martin, J.J.; Wang, H.; Zhang, J.; Shen, J.; Wu, S.; Merida, W. A review of PEM fuel cell durability: Degradation mechanisms and mitigation strategies. J. Power Sources 2008, 184, 104–119. [Google Scholar] [CrossRef]
- Chun, J.H.; Jo, D.H.; Kim, S.G.; Park, S.H.; Lee, C.H.; Kim, S.H. Improvement of the mechanical durability of micro porous layer in a proton exchange membrane fuel cell by elimination of surface cracks. Renew. Energy 2012, 48, 35–41. [Google Scholar] [CrossRef]
- Park, S.; Lee, J.-W.; Popov, B.N. A review of gas diffusion layer in PEM fuel cells: Materials and designs. Int. J. Hydrogen Energy 2012, 37, 5850–5865. [Google Scholar] [CrossRef]
- Latorrata, S.; Stampino, P.G.; Cristiani, C.; Dotelli, G. Performance evaluation and durability enhancement of FEP-based gas diffusion media for PEM fuel cells. Energies 2017, 10, 2063. [Google Scholar] [CrossRef] [Green Version]
- Latorrata, S.; Gallo Stampino, P.; Cristiani, C.; Dotelli, G. Novel superhydrophobic microporous layers for enhanced performance and efficient water management in PEM fuel cells. Int. J. Hydrogen Energy 2014, 39, 5350–5357. [Google Scholar] [CrossRef]
- Latorrata, S.; Balzarotti, R.; Gallo Stampino, P.; Cristiani, C.; Dotelli, G.; Guilizzoni, M. Design of properties and performances of innovative gas diffusion media for polymer electrolyte membrane fuel cells. Proc. Prog. Org. Coat. 2015, 78, 517–525. [Google Scholar] [CrossRef]
- Chen, H.; Pei, P.; Song, M. Lifetime prediction and the economic lifetime of proton exchange membrane fuel cells. Appl. Energy 2015, 142, 154–163. [Google Scholar] [CrossRef]
- Evangelisti, S.; Tagliaferri, C.; Brett, D.J.L.; Lettieri, P. Life cycle assessment of a polymer electrolyte membrane fuel cell system for passenger vehicles. J. Clean. Prod. 2017, 142, 4339–4355. [Google Scholar] [CrossRef]
- Benitez, A.; Wulf, C.; de Palmenaer, A.; Lengersdorf, M.; Röding, T.; Grube, T.; Robinius, M.; Stolten, D.; Kuckshinrichs, W. Ecological assessment of fuel cell electric vehicles with special focus on type IV carbon fiber hydrogen tank. J. Clean. Prod. 2021, 278, 123277. [Google Scholar] [CrossRef]
- Huss, A.; Weingerl, P.; Mass, H.; Herudek, C.; Wind, J.; Hollweck, B.; De Prada, L.; Deix, S.; Lahaussois, D.; Faucon, R.; et al. JEC Tank-To-Wheels Report v5: Passenger Cars; Publications Office of the European Union: Luxembourg, 2020. [CrossRef]
- Frank, E.D.; Elgowainy, A.; Reddi, K.; Bafana, A. Life-cycle analysis of greenhouse gas emissions from hydrogen delivery: A cost-guided analysis. Int. J. Hydrogen Energy 2021, 46, 22670–22683. [Google Scholar] [CrossRef]
- Notter, D.A.; Kouravelou, K.; Karachalios, T.; Daletou, M.K.; Haberland, N.T. Life cycle assessment of PEM FC applications: Electric mobility and μ-CHP. Energy Environ. Sci. 2015, 8, 1969–1985. [Google Scholar] [CrossRef]
- ISO ISO 14040. 2006 Environmental Management—Life Cycle Assessment—Principles and Framework; International Organization for Standardization (ISO): Geneva, Switzerland, 2006. [Google Scholar]
- ISO ISO 14044. 2006 Environmental Management—Life Cycle Assessment—Requirements and Guidelines; International Organization for Standardization (ISO): Geneva, Switzerland, 2006. [Google Scholar]
- IPCC. IPCC Fifth Assessment Report (AR5)—The Physical Science Basis; Cambridge University Press: Cambrigde, UK, 2013. [Google Scholar] [CrossRef]
- Miotti, M.; Hofer, J.; Bauer, C. Integrated environmental and economic assessment of current and future fuel cell vehicles. Int. J. Life Cycle Assess. 2017, 22, 94–110. [Google Scholar] [CrossRef] [Green Version]
- Simons, A.; Bauer, C. A life-cycle perspective on automotive fuel cells. Appl. Energy 2015, 157, 884–896. [Google Scholar] [CrossRef]
- Rodriguez, M.A.; Van Dril, T.; Gamboa Palacios, S. Decarbonisation Options for the Dordrecht Chemical Cluster; The National Institute for Strategic Policy Analysis in the Fields of the Environment, Nature and Spatial Planning: Hague, The Netherlands, 2021. [Google Scholar]
- Moon, D.J.; Kim, H.G.; Ahn, B.S.; Chung, M.J. Preparation of Hexafluoropropylene from the Pyrolysis of Trifluoromethane and Tetrafluoroethylene. U.S. Patent 6403848B1, 30 March 2001. [Google Scholar]
- Bekel, K.; Pauliuk, S. Prospective cost and environmental impact assessment of battery and fuel cell electric vehicles in Germany. Int. J. Life Cycle Assess. 2019, 24, 2220–2237. [Google Scholar] [CrossRef]
- Bieker, G. A Global Comparison of the Life-Cycle Greenhouse Gas Emissions of Combustion Engine and Electric Passenger Cars; The International Council on Clean Transportation: Washington, DC, USA, 2021. [Google Scholar]
- International Energy Agency. World Energy Outlook 2020; International Energy Agency: Paris, France, 2020. [Google Scholar]
- Argonne National Laboratory. The Greenhouse Gases, Regulated Emissions, and Energy Use in Technologies (GREET®) Model; Argonne National Laboratory: Argonne, IL, USA, 2021.
- Speers, P. Well to Wheels Report For H2ME Vehicles; Publications Office of the European Union: Luxembourg, 2020. [Google Scholar]
- Candelaresi, D.; Valente, A.; Iribarren, D.; Dufour, J.; Spazzafumo, G. Comparative life cycle assessment of hydrogen-fuelled passenger cars. Int. J. Hydrogen Energy 2021, 46, 35961–35973. [Google Scholar] [CrossRef]
- Valente, A.; Iribarren, D.; Candelaresi, D.; Spazzafumo, G.; Dufour, J. Using harmonised life-cycle indicators to explore the role of hydrogen in the environmental performance of fuel cell electric vehicles. Int. J. Hydrogen Energy 2020, 45, 25758–25765. [Google Scholar] [CrossRef]
- US Department of Energy. FY 2017 Budget at-a-Glance; US Department of Energy: Washington, DC, USA, 2016.
- Kannangara, M.; Bensebaa, F.; Vasudev, M. An adaptable life cycle greenhouse gas emissions assessment framework for electric, hybrid, fuel cell and conventional vehicles: Effect of electricity mix, mileage, battery capacity and battery chemistry in the context of Canada. J. Clean. Prod. 2021, 317, 128394. [Google Scholar] [CrossRef]
- Yang, Z.; Wang, B.; Jiao, K. Life cycle assessment of fuel cell, electric and internal combustion engine vehicles under different fuel scenarios and driving mileages in China. Energy 2020, 198, 117365. [Google Scholar] [CrossRef]
- Usai, L.; Hung, C.R.; Vásquez, F.; Windsheimer, M.; Burheim, O.S.; Strømman, A.H. Life cycle assessment of fuel cell systems for light duty vehicles, current state-of-the-art and future impacts. J. Clean. Prod. 2021, 280, 125086. [Google Scholar] [CrossRef]
- Hill, N.; McGraw Hill, New York, NY, USA. Personal Communication, 2021.
- Burkhardt, J.; Patyk, A.; Tanguy, P.; Retzke, C. Hydrogen mobility from wind energy—A life cycle assessment focusing on the fuel supply. Appl. Energy 2016, 181, 54–64. [Google Scholar] [CrossRef]
- Lombardi, L.; Tribioli, L.; Cozzolino, R.; Bella, G. Comparative environmental assessment of conventional, electric, hybrid, and fuel cell powertrains based on LCA. Int. J. Life Cycle Assess. 2017, 22, 1989–2006. [Google Scholar] [CrossRef]
- Ren, L.; Zhou, S.; Ou, X. Life-cycle energy consumption and greenhouse-gas emissions of hydrogen supply chains for fuel-cell vehicles in China. Energy 2020, 209, 118482. [Google Scholar] [CrossRef]
- Sinha, P.; Brophy, B. Life cycle assessment of renewable hydrogen for fuel cell passenger vehicles in California. Sustain. Energy Technol. Assess. 2021, 45, 101188. [Google Scholar] [CrossRef]
- Velandia Vargas, J.E.; Seabra, J.E.A. Fuel-cell technologies for private vehicles in Brazil: Environmental mirage or prospective romance? A comparative life cycle assessment of PEMFC and SOFC light-duty vehicles. Sci. Total Environ. 2021, 798, 149265. [Google Scholar] [CrossRef] [PubMed]
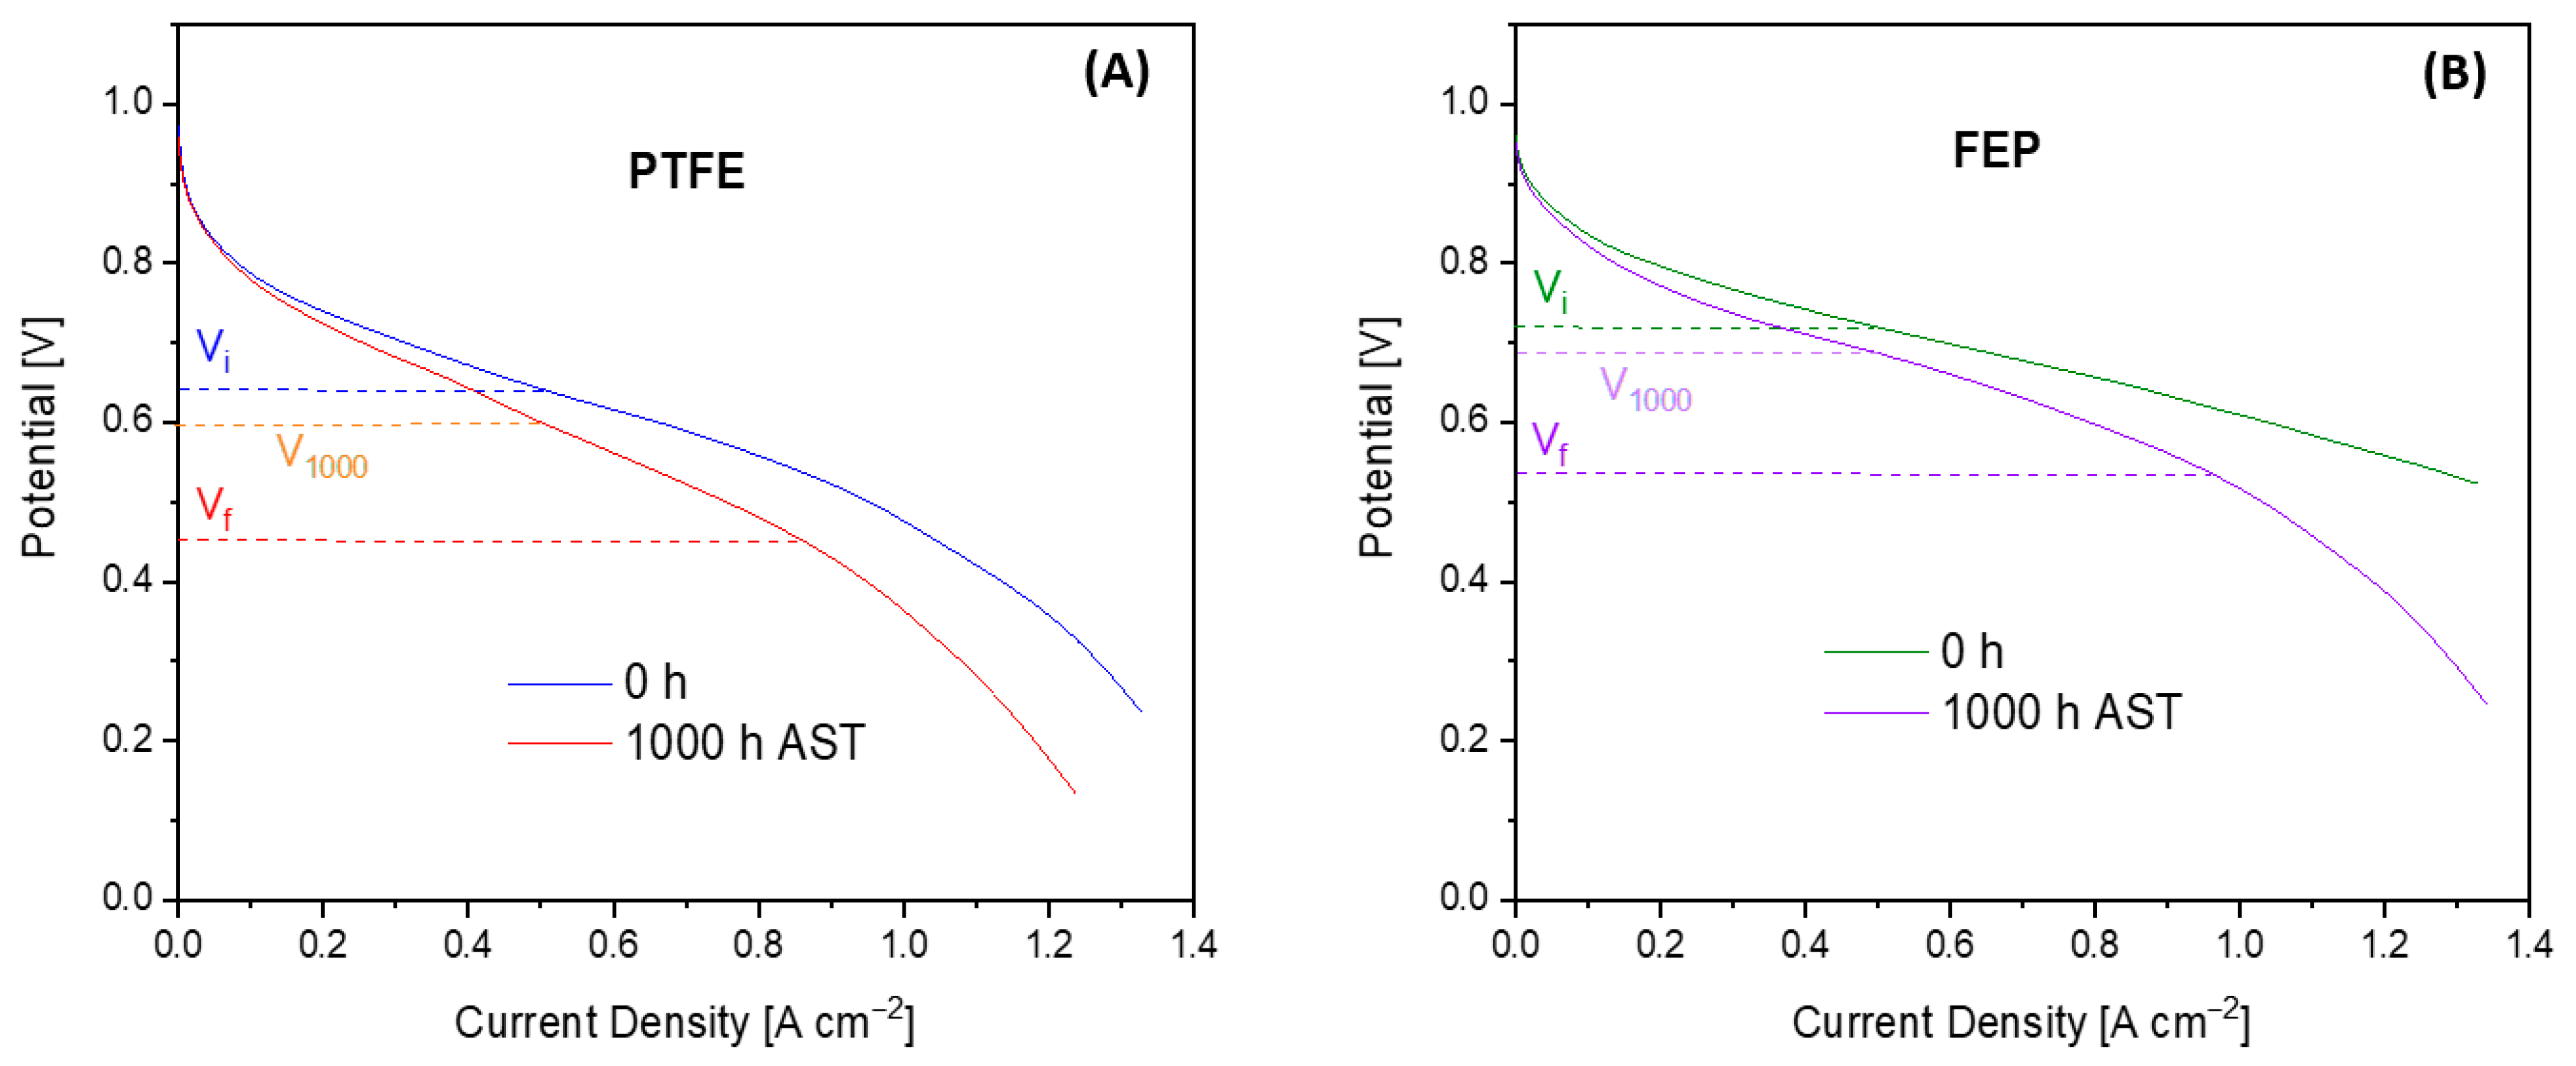

| GDM | Vi | V1000 | DR | P | i | H2 | Lifetime |
|---|---|---|---|---|---|---|---|
| [V] | [V] | [µV h−1] | [W cm−2] | [A cm−2] | [NL min−1] | [h] | |
| PTFE | 0.639 | 0.593 | 46 | 0.320 | 0.71 | 0.124 | 4109 |
| FEP | 0.718 | 0.687 | 31 | 0.359 | 0.69 | 0.120 | 6387 |
| Case | Power Density | Ncell | Atot,GDL | Fuel Consumption | ||||
|---|---|---|---|---|---|---|---|---|
| Initial | Final PTFE | Final FEP | Cumulative PTFE | Cumulative FEP | ||||
| [W cm−2] | [m2] | [kgH2/100 km] | [kgH2, tot] | |||||
| Low consumption | 0.64 a/0.91 b | 57/40 | 1.14/0.8 | 0.58 c | 0.824 | 0.801 (0.924) | 1053 | 1036 (1753) |
| High consumption | 0.64 a/0.91 b | 112/79 | 2.24/1.58 | 1.15 d | 1.63 | 1.59 (1.83) | 2087 | 2053 (3476) |
Publisher’s Note: MDPI stays neutral with regard to jurisdictional claims in published maps and institutional affiliations. |
© 2022 by the authors. Licensee MDPI, Basel, Switzerland. This article is an open access article distributed under the terms and conditions of the Creative Commons Attribution (CC BY) license (https://creativecommons.org/licenses/by/4.0/).
Share and Cite
Arrigoni, A.; Arosio, V.; Basso Peressut, A.; Latorrata, S.; Dotelli, G. Greenhouse Gas Implications of Extending the Service Life of PEM Fuel Cells for Automotive Applications: A Life Cycle Assessment. Clean Technol. 2022, 4, 132-148. https://doi.org/10.3390/cleantechnol4010009
Arrigoni A, Arosio V, Basso Peressut A, Latorrata S, Dotelli G. Greenhouse Gas Implications of Extending the Service Life of PEM Fuel Cells for Automotive Applications: A Life Cycle Assessment. Clean Technologies. 2022; 4(1):132-148. https://doi.org/10.3390/cleantechnol4010009
Chicago/Turabian StyleArrigoni, Alessandro, Valeria Arosio, Andrea Basso Peressut, Saverio Latorrata, and Giovanni Dotelli. 2022. "Greenhouse Gas Implications of Extending the Service Life of PEM Fuel Cells for Automotive Applications: A Life Cycle Assessment" Clean Technologies 4, no. 1: 132-148. https://doi.org/10.3390/cleantechnol4010009
APA StyleArrigoni, A., Arosio, V., Basso Peressut, A., Latorrata, S., & Dotelli, G. (2022). Greenhouse Gas Implications of Extending the Service Life of PEM Fuel Cells for Automotive Applications: A Life Cycle Assessment. Clean Technologies, 4(1), 132-148. https://doi.org/10.3390/cleantechnol4010009