Article

Stimulating Nitrogen Biokinetics with the Addition of Hydrogen Peroxide to Secondary Effluent Biofiltration

1
The Water Research Center, School of Earth Sciences, Faculty of Exact Sciences, Tel Aviv University, Tel Aviv 69978, Israel
2
School of Mechanical Engineering, Faculty of Engineering, Tel Aviv University, Tel Aviv 69978, Israel
3
Department of Earth and Environmental Engineering, Columbia University, New York, NY 4711, USA
4
Department of Water Quality Control, Technical University of Berlin, 10623 Berlin, Germany
5
Environmental Services, consultant, Bat-Yam 59555, Israel
6
Urban Water Systems Engineering, Technical University of Munich, 85748 Garching, Germany
7
Weizmann Institute of Science, Molecular cell biology, Rehovot 76100, Israel
8
US Environmental Protection Agency; National Risk Management Research Laboratory, Cincinnati, OH 45268, USA
*
Author to whom correspondence should be addressed.
Clean Technol. 2020, 2(1), 53-73; https://doi.org/10.3390/cleantechnol2010005
Submission received: 22 December 2019 / Revised: 19 January 2020 / Accepted: 20 January 2020 / Published: 1 February 2020
(This article belongs to the Special Issue Water and Wastewater Treatment)

Abstract

:
Tertiary wastewater treatment could provide a reliable source of water for reuse. Amongst these types of wastewater treatment, deep-bed filtration of secondary effluents can effectively remove particles and organic matter; however, NH4+ and NO2 are not easily removed. This study examined the feasibility of stimulating microbial activity using hydrogen peroxide (H2O2) as a bio-specific and clean oxygen source that leaves no residuals in the water and is advantageous upon aeration due to the solubility limitations of the oxygen. The performance of a pilot bio-filtration system at a filtration velocity of 5–6 m/h, was enhanced by the addition of H2O2 for particle, organic matter, NH4+, and NO2 removal. Hydrogen peroxide provided the oxygen demand for full nitrification. As a result, influent concentrations of 4.2 ± 2.5 mg/L N-NH4+ and 0.65 ± 0.4 mg/L N-NO2 were removed during the short hydraulic residence time (HRT). In comparison, filtration without H2O2 addition only removed up to 0.6 mg/L N-NH4+ and almost no N-NO2. A DNA metagenome analysis of the functional genes of the media biomass reflected a significant potential for simultaneous nitrification and denitrification activity. It is hypothesized that the low biodegradability of the organic carbon and H2O2 addition stimulated oxygen utilization in favor of nitrification, followed by the enhancement of anoxic activity.

Graphical Abstract

1. Introduction

The tertiary and advanced treatment of wastewater improves water quality, enabling us to meet environmental concerns but also find a potential source of water for reuse [1,2]. The filtration of coagulated–flocculated effluent via high-rate deep-bed filters (velocities between 5 and 20 m/h) is widely used for tertiary wastewater treatment [3]. The removal mostly combines particles and some dissolved organic matter (15%–20%) [4]. A hybrid process of filtration and bioactivity, termed biofiltration, allows significant nutrient and organic matter removal in addition to particle filtration [5,6,7].
Molecular methods provide better insight into the processes that are essential for optimal system design. Recent research on the treatment of secondary effluent or groundwater, as sand-filtration and AOP processes, such as UV/H2O2, made use of advanced methods as metagenomics, metaproteomics or metatranscriptomics, to analyze the structure of the community attached to the media and determine the related metabolism [8,9,10,11,12].
In biological wastewater systems, dissolved oxygen (DO) is a key parameter in system performance and plays an important role in biotransformation pathways and rates [13,14]. The competition for oxygen among ammonia-oxidizing bacteria (AOB), nitrite-oxidizing bacteria (NOB), and ordinary heterotrophic organisms (OHO) results in oxygen depletion; this, in turn, increases the potential for anoxic (carbon oxidation through reduction of NO2 or NO3) pathways, such as full or partial denitrification, depending on substrate availability and biodegradability [15,16,17,18]. Compared to suspended growth systems, nitrification activity can increase significantly in attached biomass systems when oxygen is more available [19]. DO concentration in the attached biomass is limited by the temperature of the solute (~8 mg/L at 25 °C) and decreases along the biofilm depth, resulting in increased denitrification rates [20,21]. To overcome these limitations, a few studies have examined the use of 100% pure oxygen or hydrogen peroxide (hereafter H2O2) degradation (Equation (1)) in attached-biomass systems [22,23,24,25].
1 H 2 O 2 C a t a l a s e   0.53 H 2 O   +   0.47 O 2   ( K c a t = 10 7 sec 1 )
H2O2 degradation by the enzyme catalase. Stochiometry is by weight (g); Kcat—catalytic reaction rate [26].
Catalase is a significant component of the cell defense mechanism against oxidative stress, it scavenges two molecules of H2O2 into water and molecular oxygen in one of the highest documented enzyme reaction rates [27,28].
H2O2 has advantages as a supplemental oxygen source, namely, high solubility in aqueous solution and an improved mass transfer of dissolved H2O2 (liquid–liquid) into the permeable biofilm compared to oxygen that depends also on the oxygen–water transfer into the liquid phase. In addition, rapid H2O2 degradation is bacterium-specific and leaves no persistent residual traces in the water. The disinfection characteristics of H2O2 could limit microbial-based reactors, which depend on concentration and time (C × t). Significantly tolerant degradation rates and oxygen utilization have been observed in biofilms, in comparison to suspended bacteria, in addition to changes in microbial community structure [29,30,31,32,33]. However, the application of H2O2 as a supplemental oxygen source via high-rate media filtration for NH4+ removal at a short hydraulic residence time (HRT) has never been examined. In this study, we demonstrate the impact of adding H2O2 as a supplemental oxygen source on the operational efficiency of a secondary effluent filtration system with biologically active media. The setup design was aimed at combining the removal of particles, NH4+, and, especially, NO2 to reduce ozone demand for a subsequent ozonation treatment (detailed in Zucker et al., [34]). In short, the biofilter was part of a multistep pretreatment unit prior to ozonation to allow better soil aquifer treatment (SAT) performance by reducing particle clogging and minimizing oxygen demand during infiltration in the upper-layer SAT. The specific goals of this study were to examine whether significant biotransformation can be achieved with high-rate (relative to standard biofiltration) filtration conditions and H2O2 addition.

2. Experiments

2.1. Pretreatment System Setup

The biofilter system was operated in direct-filtration at the pilot site of the Shafdan wastewater treatment plant (WWTP), operated by Mekorot. The biofilter system, detailed in Figure 1, was part of the multistage setup specified herein:
-
Feed flow was 6 m3/h (144 m3/day) of the secondary effluent from the WWTP (Figure 1a) following a 500-µm wire-mesh filtration (Figure 1b) to remove coarse particles.
-
Coagulation/flocculation was carried out by injecting polyaluminum chloride (PACl, 18% Al2O3) by peristaltic pump (Figure 1c) to achieve a final concentration of ~2.7–3.6 mg/L as PACl. Flocculation was performed in a modified flocculator, which consisted of a pressure filter (Figure 1d) with ~15 min hydraulic retention time (HRT). PACl was chosen for this study as it has been shown to be preferable for flocculation and is widely used [35,36].
-
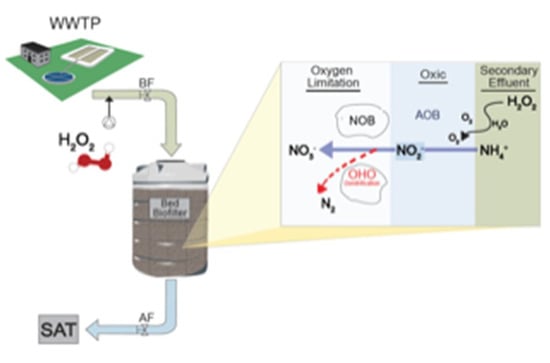
Following flocculation, H2O2 was added (10%) to the inlet of the high-rate biofilter (Figure 1f) using a peristaltic pump (Figure 1e). The final concentration of 27 mg/L was achieved to provide a surplus of DO for full nitrification of 3.5 mg/L-N NH4+ and 0.5 mg/L-N NO2. The biofilter tank had a surface area of 1.13 m2, 1.2 m diameter, 1.1 m3 media volume, and 36% free headspace (additional characteristics are specified in Zucker et al., [34]).
During the adjustment period with stepwise H2O2 addition, an average measured concentration of 4.29 ± 0.56 mg/L DO at the outlet of the filter was obtained with the addition of ~27 mg/L H2O2. The theoretical calculation of oxygen mass balance is provided in Appendix A.1. During the research period, the loads of NH4+ in the secondary effluent increased due to changes in the process of the plant, which enabled investigating the system performance for NH4+ oxidation and N removal under higher NH4+ loads and O2 limitation.

2.2. System Specification and Operational Parameters

The biofiltration was operated with a modified active media filter, operated in downflow mode, with a filtration velocity of 5–6 m/h (~5 min hydraulic residence time (HRT, the low range of high-rate filtration) and a backwash cycle every 12 h. The filtered effluent water was stored in a 10-m3 tank (Figure 1g) and was used for backwash. Adjustments were performed to avoid the clogging of the filter while maintaining a steady and active biomass to avoid the detachment of biofilm from the media (Appendix A.2). The microbial community of the biomass was indigenous and developed over time by feeding the biofilter with the secondary effluent. It was assumed that the accumulation and growth of viable bacteria in the filter, most of which were fixed to the media, was the basis for the bacterial activity [6,37,38,39].

2.3. Solute Sampling and Analyses

After two months of system operation without H2O2 addition, samples were further taken over for a period of four months with stable performance. Stabilization after H2O2 addition took also about two months and then a sampling campaign was conducted every 2–4 weeks for over two years. At every sampling campaign, samples were collected 6–7 h after the start of the morning filtration cycle (middle of the cycle) from sampling faucet located past the mesh filter, named the secondary effluent (SE), before the biofilter (BF) and after the biofilter (AF). An analysis of water characteristics was conducted at the Shafdan WWTP laboratory specified in the Appendix A.3.

2.4. Particle Sampling and Analysis

Effluent particles and aggregates were analyzed by Micro Flow Imaging (MFI) technology (DPA 4100, Protein Simple Inc., Ottawa, ON, Canada). This apparatus employs a digital camera with an illumination and magnification system to capture in-situ images of suspended particles in a flowing sample. A detailed description of this analysis is published elsewhere [32,36]. An analysis was conducted on particles of between ~2 and 400 µm.

2.5. Media Sampling and Metagenome Analysis

A metagenome analysis was conducted to investigate the functional potential of the microbial community in the media. In the middle of the operation cycle (6 h), the biofilter was emptied and a sample of 50 g anthracite media was taken from a 40-cm depth, thoroughly mixed for homogenization, and immediately stored in dry ice. Sampling was conducted a few days after the sampling campaign designated in star in Figure A1 in the Appendix A. DNA from the media was extracted using an Exgene Soil DNA Kit. The whole-genome (shotgun) libraries were prepared using the TruSeq DNA PCR-Free HT Library Preparation Kit (Illumina, San Diego, CA, USA) and were sequenced using an Illumina MiSeq benchtop sequencer with a target fragment length of 250 bp. After the removal of adapters and low-quality reads, ~8.2 M reads were left with an average length of 225 base pairs. (Appendix A Figure A2). High-quality reads were mapped to N-cycle related genes using BWA [40]. The potential for dominant biotransformation of the microbial community was deduced from the relative abundance of specific functional genes. The genes for nitrification (amoA, nxrB, cyt c), denitrification (narG, nirK, nirS, norB, nosZ), and other various metabolic pathways, such as methane (pmoA), hydrogen sulfide (drsEFH), and hydrogen (HiFe) oxidation were analyzed and compared on a log scale [9]. The gene catalog was extracted from NCBI’s nucleotide database. Genes aligning to the reads were sorted according to their respective identified organisms, which varied between 6%–19% among all the reads related to each gene (Figure A2 in the Appendix A).

3. Results

The goal of this study was to design a biofilter with short HRT to support nitrification activity, by surplus oxygen, for the removal of NO2 and NH4+. The system showed a significant removal of NO2 and NH4+ when H2O2 was added in comparison to the control. The biofilter was optimized in the matter of H2O2 addition and evaluated as a single step in an integrated treatment with the ultimate goal to produce a streamwith lower oxygen demand for following SAT or non-potable reuse purposes.

3.1. Particle Distribution

To determine biofilter performance in removing particles as a function of equivalent circular diameter (ECD), and the particles’ size and the size distribution in the secondary effluent, a dynamic image analysis was made. The particle-size distribution (PSD) of secondary effluents based on 13 campaigns is presented in Figure A1 in the Appendix A, taken at the SE sampling point. In general, the PSD was similar in comparison to the high variation in total particle number. Almost all (99%) of the particles were analyzed (<50 µm), with the highest variation in the fraction with ECD = 2–3 µm. The total particle removal performance was found to be highly efficient (95 ± 2%) for all sampling campaigns. No difference was observed in particle removal without H2O2. A typical PSD analysis of the secondary effluent after 500 µm, post flocculation and after the biofilter, is presented in Figure A1 in the Appendix A. Flocculation before biofiltration increased particle counts due to the flocculation of the macromolecules and colloid particles (<2 µm), which were not analyzed. As expected, particle concentration decreased dramatically after biofiltration for all ECDs.

3.2. H2O2 Decomposition

The concentration of DO before filtration varied between 3–5 mg/L. No H2O2 was detected at the inlet or outlet during an operation without H2O2 addition, while the DO values at the outlet were <1 mg/L, which clearly indicated maximum oxygen utilization and reflected anoxic conditions [20]. The preliminary lab-bench experiments revealed no decomposition of H2O2 when mixed with effluents within the interval of the HRT (20 min), as also documented by Lakretz et al. [32]. When H2O2 was added, the measured H2O2 concentration at the inlet was 27 ± 2 mg/L, and <1 mg/L at the outlet, which affirms full H2O2 degradation. Furthermore, DO values after filtration were similar or slightly higher than before filtration. Thus, we conclude that H2O2 decomposition in the system occurs almost solely via bacterial activity and functions as a source of available oxygen.

3.3. Reference Measurements—No Addition of H2O2

Sampling campaigns were conducted without the addition of H2O2 as a reference: DO values at the outlet were <1 mg/L, which reflects maximum oxygen utilization and anaerobic conditions inside the reactor [20]. The dissolved organic carbon (DOC)- and chemical oxygen demand (COD)-removal rates were similar (13% ± 0.3%, and 11% ± 2%, respectively) and were mainly caused by flocculation/filtration. Data were insufficient for the ultra violet absorption (UVA) measurements. The average NH4+, NO2 and NO3 concentrations at the BF sampling point were 3.1 ± 0.60 mg/L-N, 0.37 ± 0.07 mg/L-N, and 0.34 ± 0.05 mg/L-N, respectively. While NH4+ removal was constant at 0.6 ± 0.08 mg/L-N, NO2, removal was not constant, and in some samples no removal of NO2 was observed. The average increase in NO3 concentration was 0.73 ± 0.21 mg/L-N. The calculated nitrogen loss was fairly low and did not exceed 4 ± 1%, which suggests removal by filtration rather than via denitrification.

3.4. Organic Carbon Removal with H2O2 Addition

The biofilter removal rates of DOC and UVA were stable at 22% ± 5% and 20% ± 3%, respectively, regardless of the variation in DOC (10.4 ± 1.4 mg/L) and UVA (217 ± 13 m−1) at the inlet. Without H2O2, the ΔDOC, ΔUVA254 and ΔCOD was 1.6 ± 0.4 mg/L, 7 ± 1 m−1 and 3.3 ± 1 mg/L, respectively. With addition of H2O2, the ΔDOC, ΔUVA254 and ΔCOD increased to 2.3 ± 0.7 mg/L, 44 ± 7 1/m and 14.6 ± 4 mg/L, respectively, indicating additional organic carbon utilization by bacteria (Appendix A Figure A5: concentrations and the removal of DOC and UVA254 over sampling campaigns before the biofilter and after the biofilter). The oxygen utilization, in favor of nitrification rather than carbon oxidation, reflects the low biodegradability of organic matter, which is typical for effluent post-secondary treatment with flocculation–filtration removal [41,42,43,44]. This is also supported by no removal of most trace organic compounds in the biofilter, besides Acesulfame and Iopromide that were removed by 60% and 30%, respectively [34]. These results show that the biofilter was efficient and robust at removing particles, DOC, and UVA.

3.5. NH4+ and NO3 Transformation, Variation, and Nitrogen Mass Balance

To better illustrate the potential nitrogen tranformations in the biofilter due to H2O2 addition, and especially the NH4+ removal (mg/L-N) ability of the system, the parameters at all the figures were sorted by NH4+ concentrations at the inlet (BF) sampling point, as illustrated in Figure 2. It can be clearly observed that the concentration of NO3 that increased at the outlet of the biofilter is in parallel to the decrease in NH4+ concentration (Figure 2). Full NH4+ removal with H2O2 addition was obtained when the BF concentration was lower than 4 mg/L-N, whereas above 4 mg/L-N residual NH4+ was detected at the AF sampling point. The average NO2 concentration of 0.64 ± 0.4 mg/L-N was fully removed after the biofilter (AF) for all samples (Supporting data Figure A6: removal of NO2), indicating rapid NO2 oxidation to NO3 (nitratation). Thus, H2O2 addition enabled a significantly higher nitrification rate. Given that the nitrification rate in the biofilter was stable and was solely dependent on H2O2 addition, regardless of particle numbers and removal, it is suggested that most of the microbial activity occurred in the biomass attached to the media, perhaps independent of the filtration cake and its size. The ammonium oxidation rate (AOR) (the ratio of formed NO3 to the transformed NH4+ and NO2), is calculated according to Equation (2) and shown for all sampling points
AOR = Δ [ NO 3 N ]   { Δ [ NH 4 + N ] + Δ [ NO 2 N ] }
ONT = Ammonification, organic nitrogen transformed to NH4+
Nit = Nitrification
NX = Anoxic/AMX (anaerobic ammonia oxidation) nitrogen transformation to dinitrogen
Inorganic nitrogen balance rate to indicate dominant pathway:
  • When AOR > 100%, ONT + Nit >> NX
  • When AOR < 100%, significant NX
  • When AOR ≈ 100%, Nit >> ONT, NX
In most samples, AOR revealed values of less than 100% (Figure 2, green dashed line), indicating the loss of ammoniacal nitrogen as dinitrogen, which will be further detailed.
Moreover, the calculated AOR was less than ~70% when NH4+ values at the BF sampling point were higher than 4 mg/L-N. Values over 100% can be explained by the contribution of NH4+ via a higher rate of organic nitrogen (amino acids) decomposition than nitritation. The relatively low removal rates of organic compounds by the biofilter when H2O2 was added, in comparison to NH4+ and NO2, suggests that the level of organic carbon degradability was a limiting factor in favoring oxygen utilization for nitrification on the one hand and carbon utilization for denitrification on the other.

3.6. Mass Balance

Calculations of the total nitrogen mass balance are presented in Figure 3, considering organic nitrogen values, revealed an average nitrogen loss of 2.24 ± 1 mg-N/L with H2O2 and 0.25 ± 0.06 mg-N/L at the control. In addition, a higher nitrogen loss was calculated in parallel to the increase in NH4+ concentration at the inlet. Calculations to evaluate the nitrogen loss in favor of assimilation with H2O2 addition revealed that the assimilation rate was around 50% from all nitrogen removed (Table A1). This indicates that significant nitrogen loss was due to anoxic activity in the biofilter, which occurred simultaneously with nitrification. In addition, denitrification credit, the calculated oxygen that was credited due to utilization of NO3 as electron acceptor, was significant and varied between 1–7 mg/L of COD and also increased in parallel to the increase in NH4+ concentrations at the inlet. To explain the higher nitrogen loss under aerobic conditions that was enhanced by the oxygen surpluss as H2O2, we hypothesized that H2O2, due to a lack of solubility limitations, better penetrates into the depth of the biofilm, decomposes, and stimulates activity.

3.7. Functional Potential of the Biomass

The Metagenomics preformed on the sample yielded 8.2 M high-quality reads, out of which, 3.6 M were aligned to ~1250 organisms, when >98% are bacteria, both in the abundance and number of strains. The resulting outcome indicated a highly diverse bacterial community, with a calculated Shannon diversity index value of 5.6 as opposed to the theoretical value of 7.13 for a sample with equal diversity. The relative abundance of functional genes in the biofilter biomass is presented in Figure 4. The relative abundance of genes involved in nitrification (AmoA and NxrB) was higher, by 3 to 4 orders of magnitude, than the genes involved in other electron donor pathways (as drsEFH or aprA). In addition, the log relative abundance of the genes involved in denitrification and oxygen utilization (cyt c oxidases) was also significantly higher in comparison to the other various metabolic pathways examined.
Considering that cyt c is harbored by AOB (nitritation) [45], as well as denitrifying organisms (denitrification) [46], the relative high abundance of this gene is consistent with the experimental results of simultaneous nitrification and denitrification activity (Figure 2). The higher relative abundance obtained for the gene of NO2 oxidation (nxrB) over NH4+ oxidation, might suggest the possible occurrence of a “ping pong” mechanism of cyclic NO2 oxidation and reduction, resulting in a higher NO2 oxidation rate than NH4+ [47]. In parallel, the composition of identified genera of each of the N related genes (Figure 4b) revealed a variety of heterotrophs capable of conducting denitrification, when the genera belonging to the family Comamondaceae was the most dominant one. Interestingly, the identified genus related to NH4+ oxidation was related to AOB and NOB, while the identified genus related to NO2 oxidation was of heterotrophs. This might suggest that the involvement of commamox and heterotrophs in nitrification [48,49,50].
The comparison of the functional potential of the microbial community reflects clear dominance for N biotransformation by simultaneous nitrification and denitrification. The significant anoxic potential reflected from the relative abundance of functional genes can be explained by the denitrifying community capable of being active at the presence of oxygen (low half-saturation rate of oxygen inhibition, KOI = 0.1–0.2 mg/L) [43].
Moreover, favoring oxygen utilization for nitrification, with a C/N ratio similar to wastewater, can be explained by the selection of organisms that are more competitive and characterized with a low substrate half-saturation rate coefficient (KONitrospira = 0.1–0.2 mg/L, KOAOB = 0.26–0.15 mg/L), which is more typical to nitrifiers in comparison to heterotrophs [51,52]. Jiang et al. (2013) also observed that the increase in oxygen availability in the upflow biofilter resulted in utilization by nitrifiers rather than heterotrophic biomass [19].
We suggest that the typical low biodegradability of the organic carbon at the secondary effluent, which was also reflected in the low removal rate of the COD, BOD, and UVA254, mentioned earlier (Section 3.4, Figure A5a,b in the Appendix A) was a key parameter on the rates of heterotrophic activity [44].
The environmental conditions of a low degradability rate of the organic matter and the addition of oxygen via H2O2, could be a possible explanation for favoring NH4+ rather than organic material oxidation. Such conditions, may promote simultaneous nitrification/nitrogen-removal activity. The significant relative abundance of genes with the potential for NO2 oxidation on one hand and NO2 reduction on the other hand strongly suggest that competition for NO2 is a key in the dynamics of the community structure and function.
To address the paradox of excess oxygen availability in the reactor, due to H2O2 addition and degradation, while the relative abundance of genes related to anoxic activity reflects conditions of limited oxygen, we hypothesize that this community structure reflects inner localization in the biofilm: Whereas AOB and NOB are localized at the outer layer of the biofilm, degrade the H2O2, and utilize the supplemental oxygen for nitrification, in parallel with the depletion of oxygen along the depth of the biofilm, NO2 and NO3 are reduced. It is also possible that the nitrifiers are located in the pockets inside the biofilm and the better mass transfer of H2O2 enables utilization in a deeper location. We also suggest that the bacterial community that was investigated in this study indicates maximized thermodynamic utilization of electron acceptors and donors, with significant rates of anoxic activity.
The limitation of the process performance under increasing loads of NH4+ might be due to a lack of oxygen, limited HRT, or reactor volume and should be further investigated. As mentioned in previous research [34] the biofilter system succeeded in decreasing the oxygen demand and the drop in the ORP in following SAT. We suggest that the design presented in this study could be beneficial for treating secondary effluents containing residual levels of NH4+ (few mg/L-N), which is required to be removed under discharge or reuse restrictions.

4. Discussion

We suggest a model to describe the biokinetics of tertiary wastewater biofiltration systems with the addition of H2O2. The model focuses on the soluble (not particulate) content, carbon content similar to the secondary effluent (low biodegradability, nitrogen content), and the significance of metabolism over assimilation (Appendix A.1 and Table A1). Generally, although some full reduction of NO3 to NH4+ may occur simultaneously, it is neglected in the model.
The model suggest that the addition of H2O2 (Figure 5) promoted the rates of the following pathways: (i) nitritation and (ii) nitratation, which occurs at high rates, and (iii) biodegradable COD oxidation, which occurs at minor rates. In parallel, (v) NO2 and (vi) NO3 reduction via denitrification and (vii) are also stimulated.

5. Conclusions

-
The addition of H2O2 to stimulate aerobic activity within a bed filtration process, practiced under the low range of the high rate bed filtration (5–6 m/h), enabled a combined effect of particle filtration and nitrification.The H2O2 was fully degraded, limiting the nitrification rate.
-
The trends in the concentration of NH4+, NO2, and NO3 with addition of H2O2 demonstrated significant nitirification activity at the bed filter.
-
Metagenome analysis results were in line with the performance obtained and reflected significant potential for the simultanious nitrification denitrification activity of the attached biomass.
-
The process presented herin may have a techno-economical potential, especially with the development of new and novel methods for the direct production of H2O2 [53,54] and the efficient application of the high-rate filtration.
-
In cases of residual NH4+ concentration (<5 mg N-NH4+/L) in secondary WWTP effluents, the presented technology shows potential for either managing ammonia concentration in the effluent or for reducing oxygen demand in following processes, such as SAT or direct reuse, under local regulation.

Author Contributions

Conceptualization, D.A., H.M., M.J. and H.C.; methodology, U.H. and H.C., with design and building.; K.C. and J.S.-D., DNA sequencing, S.D. and M.E.; microbial sequencing analysis L.F. Conducting experiments writing—original draft preparation, writing—review, visualization and editing; All authors have read and agreed to the published version of the manuscript.

Funding

This research was funded by the BMBF-MOST (WT 1004) program and is a joint cooperation with TU Berlin, Mekorot, CU New York and TAU.

Acknowledgments

We thank Mekorot and Shafdan engineers Tomer Kraitzer and Avi Aharoni, for their contribution for successful R&D cooperation. Thanks to field engineer Eran Levi for dedicated and accurate work. We would also like to thank V. Cohen-Yaniv for her exact and clean work with the DNA extraction, Elk and his team from Cincinnati Children’s Hospital for the DNA sequencing, S. Dagan for his work in the metagenome analysis.

Conflicts of Interest

The authors declare no conflict of interest.

Appendix A

Appendix A.1. Theoretical Calculation of and Oxygen Nitrogen Mass Balance

Nitrogen mass balance was calculated by making the following assumptions: (1) ammonia was the only nitrogen source for assimilation for biomass growth, (2) full aerobic utilization of oxygen originated from H2O2, (3) full nitrification to nitrate as the only electron acceptor for denitrification and (4) all nitrogen loss originated in anoxic denitrification activity. Two values for yields of 0.6 mg COD biomass/mg substrate COD (aerobic) as the upper limit and 0.4 mg COD biomass/mg substrate COD (anoxic) [43] as the lowest limit were used in the calculations as heterotroph activity was probably both aerobic and anoxic.
N loss = BF Inlet [mg/L TKN-N + mg/L NO2N + mg/L NO3N] − AF Outlet [mg/L TKN-N + mg/L NO2N + mg/L NO3N].
OHO Nitrogen assimilated mg/L = ΔCOD × YOHO × 14 (N gr/mole)/113 (Biomass gr/mole)
Nloss denitrification = ∑Δ Nloss − Nitrogen assimilated mg/L
Denitrification credit = Nloss denitrification × 2.8 mg COD/mg NO3-N [43] = ΔCOD denitrification
The data presents the delta between the inlet and outlet: ΔNH4+, ΔNO2, ΔNO3, ΔCOD, Δ∑N including Organic nitrogen (TKN).
Oxygen mass balance was calculated by making the following assumptions:
(1) All oxygen transformations were biological.
(2) All the degradation of H2O2 was biologically with oxygen and water as the only by products (based on previous lab calibrations).
(3) Excess oxygen, over the dissolved oxygen, in the inlet water was originated from H2O2 degradation.
Degradation of 27 mg/L H2O2 = 12.7 mg O2 (1/0.47)
O2 demand for full nitrification = 4.57 mg O2/mg-N
O2 mass balance Δ O2= (DOinlet+27 mg/L H2O2 × 0.47) − DOoutlet
Potential oxygen consumed for nitrification = Δ O2 − O2 demand for nitrification (ΔNH4 × 4.57)
The theoretical demand of H2O2/mg-N NH4 for full nitrification was calculated as follows:
C H2O2 × 0.47 (mg O2/mg H2O2) × 4.57 (mg O2/mg-N) = 9.72 mg of H2O2/mg-N NH4
Table A1. Nitrogen mass balance of the biofilter system with and without H2O2.
OHO Yield = 0.6# CampaignN Loss (mg-N/L)OHO Assimilation (mg-N/L)N Loss for Denitrification
(mg-N/L)
Denitrification Credit (COD mg/L Utilized for Denitrification)
01.521.040.481.3
61.320.820.501.4
151.431.040.391.1
171.971.260.712.0
203.711.642.075.8
213.471.122.366.6
Average H2O22.241.151.093.0
STD dev. H2O20.980.250.812.27
280.320.300.020.1
290.250.150.100.3
300.180.300.000.0
Average Control0.250.250.040.1
STD dev Control0.060.070.040.12
OHO Yield = 0.4# CampaignN Loss (mg-N/L)OHO Assimilation (mg-N/L)N Loss for Deni
(mg-N/L)
Denitrification Credit (COD mg/L Utilized for Deni)
01.520.690.832.3
61.320.740.581.6
151.430.690.742.1
171.970.841.133.2
203.711.092.627.3
213.470.742.737.6
Average H2O22.240.801.444.0
STD H2O20.980.140.892.50
280.320.200.120.3
290.250.100.150.4
300.180.200.000.0
Average Control0.250.170.090.3
STD dev. Control0.060.050.070.18
Notes: denitrification refers to denitrification.
A significant difference was obtained between the calculated concentrations of nitrogen assimilated with or without H2O2, in both estimates (0.8–1.15 mg/L-N vs 0.17–0.25 mg/L-N). Non-assimilative N loss (denitrification) was also significant with H2O2 (3–4 mg/L-N) while the calculated values of the control were within an error of measurement. This indicated significant enhancement of microbial growth and anoxic activity by H2O2 addition.
Table A2. Oxygen mass Balance of the biofilter system with and without H2O2.
# Campaign O2 Inlet (mg-/L)O2 Outlet (mg-/L)O2 from H2O2O2 Balance (Consumed)Delta NH4Potential Oxygen Consumed for Nitrification
13.795.112.711.390.986.92
2 12.712.701.356.53
35.534.8312.713.401.546.37
454.7212.712.981.854.53
53.873.6212.712.952.551.30
63.84.1212.712.402.630.37
73.433.1812.712.952.750.38
86.305.1712.713.832.771.16
95.384.4212.713.663.05−0.28
10 12.712.703.00−1.01
114.693.9212.713.473.30−1.61
123.923.7512.712.873.55−3.35
135.835.212.713.323.56−2.93
144.14.4912.712.264.08−6.39
156.154.2712.714.584.35−5.30
165.133.5312.714.303.60−2.15
174.504.4112.712.794.32−6.94
183.834.1612.712.374.46−8.00
195.674.1012.714.273.90−3.55
205.484.2812.713.904.12−4.94
Considering the difference between the ammonia removed (theoretically oxidized to the oxygen balance it can be clearly seen that more NH4+ was consumed than oxygen was available along the increase in NH4+ concentration (negative values of mass balance).

Appendix A.2. The Backwash Cycle

Periodic backwashing included combining air/water followed by water backwashing (Figure 1). The backwash cycle consisted of a short backwash to release filter-bed clogging by the air–water backwash, and another 10 min of water backwash and downflow wash to the sewer before restarting the filter. Backwashing volume was ~1.3% of the total volume filtered. The bottom plate nozzles were removed to improve the mixing efficiency and a side stream was also recirculated to the bottom part thus forming a sludge blanket which improved flocculation (verified by PSD analysis). The head loss was limited by online control to 0.5 bar/cycle and in the case of higher head loss, a second automatic backwash was performed. The quality of filtration was observed by the stable performance with low outlet turbidity (0.4–0.8 NTU).

Appendix A.3. Water Parameters Methodology

The water quality of the samples was conducted in the SHAFDAN lab using selective electrode 4500-NH3 for ammonium, 4500-NO2-B colorimetric method for nitrite, 4110B ion chromatography for nitrate with chemical suppression of eluent conductivity, 5910B ultraviolet absorption method for UV absorbance at 254 nm (UVA), 5310B high-temperature combustion method for dissolved organic carbon (DOC), 4500-O C azide modification for DO, 5220B open reflux method for chemical oxygen demand (COD) and NOVA 60 kit for H2O2.

Appendix A.4. H2O2 Decomposition

Generally, the reaction occurs in two distinct stages in the catalytic reaction pathway. First, oxidation of the enzyme by one molecule of H2O2, while the oxygen–oxygen bond in peroxide is cleaved. At the second stage, another molecule of H2O2 reacts with the bond oxygen ion and forms molecular oxygen and water [28].

Appendix A.5. Secondary Effluent Particle Analysis

Effluent particles and aggregates were analyzed by Micro Flow Imaging. In brief, a fluid sample is drawn through a flow cell, illuminated with a light-emitting diode at 470 nm, and the magnified image is captured by digital camera. This image is then automatically analyzed to determine the particles’ equivalent circular diameter (ECD) which represents the diameter of a sphere that occupies the same two-dimensional surface area as the particle. Analysis was conducted on particles of between ~2 and 400 µm.

Appendix A.6. Particles Distribution

A typical PSD analysis of the secondary effluent after 500 µm, post flocculation and after the biofilter is presented in Figure A1.
Figure A1. Particle distribution analysis over sampling campaigns. The Particle size is represented as an equivalent circular diameter (ECD). Total particle concentration (#/mL) is plotted as a red line. The results presented at Figure 2 refer to the campaign marked with a star. No HP is related to control runs without the addition of H2O2.
Cleantechnol 02 00005 g0a1

Appendix A.7. Media Sampling and Metagenome Analysis

The metagenome analysis was conducted to investigate the functional potential of the microbial media community. At the middle of the operation cycle (6 h) the biofilter was emptied and a sample of 50 g anthracite media was taken from a depth of 40 cm from the top of the media, thoroughly mixed for homogenization and immediately stored in dry ice. DNA from the media was extracted using Exgene Soil DNA Mini Kit. Whole-genome (shotgun) libraries were prepared using the TruSeq DNA PCR-Free HT Library Preparation Kit (Illumina, San Diego, CA, USA) and sequenced using an Illumina MiSeq benchtop sequencer with a target fragment length of 250 bp.
The final outputs of the metagenomics sequencing were modified using Cutadapt [55] to remove adapters and low-quality reads, and contigs were created using IDBA-UD [56]. A total of 8.9 M reads, was produced. The construction of a non-redundant gene catalog and the quantification of reference gene abundance (Gene calling) on the assembled scaftigs was performed using Prodigal [57]. Predicted genes were clustered using UCLUST [58]. High-quality reads were mapped to the reference gene catalog using BWA [59]. Mapped reads were used to form an abundance vector of the number of reads mapped to each gene. This was normalized based on data set size and gene length. Annotation was done using USEARCH [58] against the NCBI database (best hit with Eo1e-5, Bitscore >60 and sequence similarity >30%). Genus annotation was done using BWA aligner against the entire NCBI genome database (~80,000 genomes) and using PathoScope 2.0 [60] to quantify proportions of contigs from individual strains.
Figure A2. Metagenomics quality and length distribution: (A,B) before applying Cutadapt (Martin 2017): length distribution (A) and box plot distribution of quality score (Phred) (B). (C,D)—length and Phred distribution after applying Cutadapt.
Cleantechnol 02 00005 g0a2

Appendix A.8. Functional Molecular Analysis of the Biomass

The diversity of species within the sample indicating low diversity of the community in the sample. The number of reads that were aligned to nitrogen-related species were 43% of the total aligned reads, reflecting significant functional potential for the nitrogen cycle in the sampled bacterial community. Gene catalog was extracted from NCBI’s nucleotide database. Mapped reads were subsequently filtered by removing those with a poor alignment (−q30). The remaining mapped reads were used to form an abundance matrix of the number of reads mapped to each gene in every sample. The abundance matrix was normalized based on data set.
Genes aligning to the reads were sorted according to their respective identified organisms which varied between 6%–19% among all the reads related to each gene (Figure A3).
Figure A3. Percentage of classified (white) and unclassified (black) reads out of all the reads of each gene (a) and the composition of the identified genus of each gene (b).
Cleantechnol 02 00005 g0a3

Appendix A.9. Biofilter Performance—Particle Analysis

Figure A4. Particle-size distribution (PSD) analysis of a representative sampling campaign with H2O2. A comparison between sampling points after 500µm filtration (1) at the inlet of the biofilter after coagulation and flocculation (2) and at the outlet of the biofilter (3).
Cleantechnol 02 00005 g0a4
Flocculation before biofiltration increased particle counts, due to flocculation of the macromolecules and colloid particles (<2 µm) which were not analyzed. As expected, particle concentration decreased dramatically after biofiltration for all ECDs.

Appendix A.10. Organic Carbon Performance

Figure A5. Concentrations and the removal of DOC (a) and UVA (UV254) (b) over sampling campaigns before the biofilter (BF) and after the biofilter (AF), which was also sorted by feed values of ammonium during experiments with H2O2 addition. Reference campaigns of no H2O2 are circled in orange.
Cleantechnol 02 00005 g0a5aCleantechnol 02 00005 g0a5b

Appendix A.11. Nitrite Removal and Concentration

Figure A6. Concentrations and removal of nitrite (mg/L-N) over sampling campaigns, before the biofilter (BF) and after the biofilter (AF) with H2O2 addition, also sorted by feed values of ammonium. No H2O2 campaigns are circled in orange.
Cleantechnol 02 00005 g0a6

References

  1. Bixio, D.; De Hayder, B.; Cikurel, H.; Muston, M.; Miska, V.; Joksimovic, D.; Schäfer, A.I.; Ravazzini, A.; Aharoni, A.; Savic, D.; et al. Municipal wastewater reclamation: Where do we stand? An overview of treatment technology and management practice. Water Sci. Technol. Water Supply 2005, 5, 77–86. [Google Scholar] [CrossRef]
  2. Siegel, S.M. Let There Be Water: Israel’s Solution for a Water-Starved World; Thomas Dunne Books/St. Martin’s Press: New York, NY, USA, 2015; ISBN 978-1-250-07395-2. [Google Scholar]
  3. Emerging Technologies for Wastewater Treatment and In-Plant Wet Weather Management; U.S Environmental Protection Agency (EPA): Washington DC, USA, 2013; Volume 832.
  4. Tchobanoglous, F.B.G. Wastewater Engineering and Reuse, 4th ed.; McGraw-Hill: New York, NY, USA, 2003; ISBN 978-1-259-01079-8. [Google Scholar]
  5. Van Den Akker, B.; Holmes, M.; Cromar, N.; Fallowfield, H. Application of high rate nitrifying trickling filters for potable water treatment. Water Res. 2008, 42, 4514–4524. [Google Scholar] [CrossRef]
  6. Miska-Markusch, V. Effluent Filtration for more than Particle Removal; Leibniz Universität Hannover: Hannover, Germany, 2009. [Google Scholar]
  7. Müller, J.; Drewes, J.E.; Hübner, U. Sequential biofiltration—A novel approach for enhanced biological removal of trace organic chemicals from wastewater treatment plant effluent. Water Res. 2017, 127, 127–138. [Google Scholar] [CrossRef]
  8. Alidina, M.; Li, D.; Drewes, J.E. Investigating the role for adaptation of the microbial community to transform trace organic chemicals during managed aquifer recharge. Water Res. 2014, 56, 172–180. [Google Scholar] [CrossRef]
  9. Palomo, A.; Fowler, S.J.; Gülay, A.; Rasmussen, S.; Sicheritz-Ponten, T.; Smets, B.F. Metagenomic analysis of rapid gravity sand filter microbial communities suggests novel physiology of Nitrospira spp. ISME J. 2016, 10, 2569–2581. [Google Scholar] [CrossRef] [Green Version]
  10. Pinto, A.J.; Marcus, D.N.; Ijaz, Z.; Bautista-de los Santos, Q.M.; Dick, G.J.; Raskin, L. Metagenomic Evidence for the Presence of Comammox Nitrospira-Like Bacteria in a Drinking Water System. mSphere 2015, 1, e00054-15. [Google Scholar] [CrossRef] [Green Version]
  11. Salerno, C.; Berardi, G.; Laera, G.; Pollice, A. Functional Response of MBR Microbial Consortia to Substrate Stress as Revealed by Metaproteomics. Microb. Ecol. 2019, 78, 873–884. [Google Scholar] [CrossRef]
  12. Salerno, C.; Benndorf, D.; Kluge, S.; Palese, L.L. Metaproteomics Applied to Activated Sludge for Industrial Wastewater Treatment Revealed a Dominant Methylotrophic Metabolism of Hyphomicrobium zavarzinii. Microb. Ecol. 2016, 72, 9–13. [Google Scholar] [CrossRef]
  13. Mendoza-Espinoza, L.; Stephenson, T. A Review of Biological Aerated Filters (BAFs) for Wastewater Treatment. Environ. Eng. Sci. 1999, 16, 201–216. [Google Scholar] [CrossRef]
  14. Rassamee, V.; Sattayatewa, C.; Pagilla, K.; Chandran, K. Effect of oxic and anoxic conditions on nitrous oxide emissions from nitrification and denitrification processes. Biotechnol. Bioeng. 2011, 108, 2036–2045. [Google Scholar] [CrossRef]
  15. Yoo, H.; Ahn, K.; Lee, H.J.; Lee, K.; Kwak, Y.; Song, K. Nitrogen removal from synthetic wastewater by simultaneous nitrification and denitrification (SND) via nitrite in an intermittently-aerated reactor. Water Res. 1999, 33, 145–154. [Google Scholar] [CrossRef]
  16. Bassin, J.P.; Abbas, B.; Vilela, C.L.S.; Kleerebezem, R.; Muyzer, G.; Rosado, A.S.; van Loosdrecht, M.C.M.; Dezotti, M. Tracking the dynamics of heterotrophs and nitrifiers in moving-bed biofilm reactors operated at different COD/N ratios. Bioresour. Technol. 2015, 192, 131–141. [Google Scholar] [CrossRef]
  17. de Vet, W.W.J.M.; Kleerebezem, R.; van der Wielen, P.W.J.J.; Rietveld, L.C.; van Loosdrecht, M.C.M. Assessment of nitrification in groundwater filters for drinking water production by qPCR and activity measurement. Water Res. 2011, 45, 4008–4018. [Google Scholar] [CrossRef]
  18. Yu, X.; Qi, Z.; Zhang, X.; Yu, P.; Liu, B.; Zhang, L.; Fu, L. Nitrogen loss and oxygen paradox in full-scale biofiltration for drinking water treatment. Water Res. 2007, 41, 1455–1464. [Google Scholar] [CrossRef]
  19. Jiang, B.; Hu, W.; Pei, H.; Chen, P.; Liu, Q. The influence of aeration on nitrification and the nitrifier distribution in an upflow biological aerated filter for tertiary treatment of municipal sewage. Desalin. Water Treat. 2010, 24, 308–320. [Google Scholar] [CrossRef] [Green Version]
  20. Albuquerque, A.; Makinia, J.; Pagilla, K. Impact of aeration conditions on the removal of low concentrations of nitrogen in a tertiary partially aerated biological filter. Ecol. Eng. 2012, 44, 44–52. [Google Scholar] [CrossRef]
  21. Matsumoto, S.; Terada, A.; Tsuneda, S. Modeling of membrane-aerated biofilm: Effects of C/N ratio, biofilm thickness and surface loading of oxygen on feasibility of simultaneous nitrification and denitrification. Biochem. Eng. J. 2007, 37, 98–107. [Google Scholar] [CrossRef]
  22. Brindle, K.; Stephenson, T.; Semmens, M.J. Nitrification and oxygen utilisation in a membrane aeration bioreactor. J. Memb. Sci. 1998, 144, 197–209. [Google Scholar] [CrossRef]
  23. Pellicer-Nàcher, C.; Smets, B.F. Structure, composition, and strength of nitrifying membrane-aerated biofilms. Water Res. 2014, 57, 151–161. [Google Scholar] [CrossRef]
  24. Fiorenza, S.; Ward, C.H. Microbial adaptation to hydrogen peroxide and biodegradation of aromatic hydrocarbons. J. Ind. Microbiol. Biotechnol. 1997, 18, 140–151. [Google Scholar] [CrossRef]
  25. Zappi, M.; White, K.; Hwang, H.-M.; Bajpai, R.; Qasim, M. The Fate of Hydrogen Peroxide as an Oxygen Source for Bioremediation Activities within Saturated Aquifer Systems. J. Air Waste Manag. Assoc. 2000, 50, 1818–1830. [Google Scholar] [CrossRef] [Green Version]
  26. Chance, B.; Herbert, D. The enzyme-substrate compounds of bacterial catalase and peroxides. Biochem. J. 1950, 46, 402–414. [Google Scholar] [CrossRef] [Green Version]
  27. Northrop, J.H. Experimental Conditions and General Results. Effect of Varying the Concentration of Catalase. J. Gen. Physiology 1924, 5, 373–387. [Google Scholar]
  28. Sooch, B.S.; Kauldhar, B.S.; Puri, M. Recent insights into microbial catalases: Isolation, production and purification. Biotechnol. Adv. 2014, 32, 1429–1447. [Google Scholar] [CrossRef]
  29. Flores, M.J.; Brandi, R.J.; Cassano, A.E.; Labas, M.D. Chemical disinfection with H2O2—The proposal of a reaction kinetic model. Chem. Eng. J. 2012, 198–199, 388–396. [Google Scholar] [CrossRef]
  30. Lakretz, A.; Ron, E.Z.; Mamane, H. Biofilm control in water by a UV-based advanced oxidation process. Biofouling 2011, 27, 295–307. [Google Scholar] [CrossRef]
  31. Tusseau-Vuillemin, M.H.; Lagarde, F.; Chauviere, C.; Heduit, A. Hydrogen peroxide (H2O2) as a source of dissolved oxygen in COD-degradation respirometric experiments. Water Res. 2002, 36, 793–798. [Google Scholar] [CrossRef]
  32. Lakretz, A.; Ron, E.Z.; Harif, T.; Mamane, H. Biofilm control in water by advanced oxidation process (AOP) pre-treatment: Effect of natural organic matter (NOM). Water Sci. Technol. 2011, 64, 1876–1884. [Google Scholar] [CrossRef]
  33. Yang, Y.; Cheng, D.; Li, Y.; Yu, L.; Gin, K.Y.H.; Chen, J.P.; Reinhard, M. Effects of monochloramine and hydrogen peroxide on the bacterial community shifts in biologically treated wastewater. Chemosphere 2017, 189, 399–406. [Google Scholar] [CrossRef]
  34. Zucker, I.; Mamane, H.; Cikurel, H.; Jekel, M.; Hubner, U.; Avisar, D. A hybrid process of biofiltration of secondary effluent followed by ozonation and short soil aquifer treatment for water reuse. Water Res. 2015, 84, 315–322. [Google Scholar] [CrossRef]
  35. Cikurel, H.; Rebhun, M.; Amirtharajah, A.; Adin, A. Wastewater effluent reuse by in-line flocculation filtration process. Water Sci. Technol. 1996, 33, 203–211. [Google Scholar] [CrossRef]
  36. Mamane, H.; Kohn, C.; Adin, A. Characterizing Shape of Effluent Particles by Image Analysis. Sep. Sci. Technol. 2008, 43, 1737–1753. [Google Scholar] [CrossRef]
  37. Li, D.; Sharp, J.O.; Saikaly, P.E.; Ali, S.; Alidina, M.; Alarawi, M.S.; Keller, S.; Hoppe-Jones, C.; Drewes, J.E. Dissolved organic carbon influences microbial community composition and diversity in managed aquifer recharge systems. Appl. Environ. Microbiol. 2012, 78, 6819–6828. [Google Scholar] [CrossRef] [PubMed] [Green Version]
  38. Lauderdale, C.; Chadik, P.; Kirisits, M.J.; Brown, A.J. Engineered biofiltration: Enhanced biofilter performance through nutrient and peroxide addition. J. Am. Water Work. Assoc. 2012, 104, E298–E309. [Google Scholar] [CrossRef] [Green Version]
  39. Lakretz, A.; Elifantz, H.; Kviatkovski, I.; Eshel, G.; Mamane, H. Automatic microfiber filtration (AMF) of surface water: Impact on water quality and biofouling evolution. Water Res. 2014, 48, 592–604. [Google Scholar] [CrossRef]
  40. Li, H.; Durbin, R. Fast and accurate short read alignment with Burrows-Wheeler transform. Bioinformatics 2009, 25, 1754–1760. [Google Scholar] [CrossRef] [Green Version]
  41. Shon, H.K.; Vigneswaran, S.; Snyder, S.A. Effluent Organic Matter (EfOM) in Wastewater: Constituents, Effects, and Treatment. Crit. Rev. Environ. Sci. Technol. 2006, 36, 327–374. [Google Scholar] [CrossRef]
  42. Petala, M.; Tsiridis, V.; Samaras, P.; Zouboulis, A.; Sakellaropoulos, G.P. Wastewater reclamation by advanced treatment of secondary effluents. Desalination 2006, 195, 109–118. [Google Scholar] [CrossRef]
  43. Grady, C.P.L.; Daigger, G.T.; Love, N.G.; Filipe, C.D.M. Biological Wastewater Treatment; IWA Publishing—Co-Publication: London, UK, 2011; ISBN 9781843393429. [Google Scholar]
  44. Friedman, L.; Mamane, H.; Avisar, D.; Chandran, K. The role of influent organic carbon-to-nitrogen (COD/N) ratio in removal rates and shaping microbial ecology in soil aquifer treatment (SAT). Water Res. 2018, 146, 197–205. [Google Scholar] [CrossRef]
  45. Cua, L.S.; Stein, L.Y. Effects of nitrite on ammonia-oxidizing activity and gene regulation in three ammonia-oxidizing bacteria. FEMS Microbiol. Lett. 2011, 319, 169–175. [Google Scholar] [CrossRef] [Green Version]
  46. Chen, J.; Strous, M. Denitrification and aerobic respiration, hybrid electron transport chains and co-evolution. Biochim. Biophys. Acta Bioenerg. 2013, 1827, 136–144. [Google Scholar] [CrossRef] [PubMed] [Green Version]
  47. Daims, H.; Lücker, S.; Wagner, M. A New Perspective on Microbes Formerly Known as Nitrite-Oxidizing Bacteria. Trends Microbiol. 2016, 24, 699–712. [Google Scholar] [CrossRef] [PubMed]
  48. Kits, K.D.; Sedlacek, C.J.; Lebedeva, E.V.; Han, P.; Bulaev, A.; Pjevac, P.; Daebeler, A.; Romano, S.; Albertsen, M.; Stein, L.Y.; et al. Kinetic analysis of a complete nitrifier reveals an oligotrophic lifestyle. Nature 2017, 549, 269–272. [Google Scholar] [CrossRef] [PubMed] [Green Version]
  49. Jetten, M.S.M. New pathways for ammonia conversion in soil and aquatic systems. Plant Soil 2001, 230, 9–19. [Google Scholar] [CrossRef]
  50. Stein, L.Y. Heterotrophic nitrification and nitrifier denitrification. In Nitrification; American Society of Microbiology: Washington, DC, USA, 2011. [Google Scholar]
  51. Ge, S.; Wang, S.; Yang, X.; Qiu, S.; Li, B.; Peng, Y. Detection of nitrifiers and evaluation of partial nitrification for wastewater treatment: A review. Chemosphere 2015, 140, 85–98. [Google Scholar] [CrossRef] [PubMed]
  52. Park, M.R.; Park, H.; Chandran, K. Molecular and kinetic characterization of planktonic Nitrospira spp. selectively enriched from activated sludge. Environ. Sci. Technol. 2017, 51, 2720–2728. [Google Scholar] [CrossRef] [PubMed]
  53. Siahrostami, S.; Verdaguer-Casadevall, A.; Karamad, M.; Deiana, D.; Malacrida, P.; Wickman, B.; Escudero-Escribano, M.; Paoli, E.A.; Frydendal, R.; Hansen, T.W.; et al. Enabling direct H2O2 production through rational electrocatalyst design. Nat. Mater. 2013, 12, 1137–1143. [Google Scholar] [CrossRef] [Green Version]
  54. Yang, S.; Verdaguer-casadevall, A.; Arnarson, L.; Silvioli, L.; Viktor, C.; Frydendal, R.; Rossmeisl, J.; Chorkendor, I.; Stephens, I.E.L. Toward the Decentralized Electrochemical Production of H2O2: A Focus on the Catalysis. ACS Catal. 2018, 8, 4064–4081. [Google Scholar] [CrossRef] [Green Version]
  55. Martin, M. Cutadapt removes adapter sequences from high-throughput sequencing reads. EMBnet. J. 2011, 17, 10–12. [Google Scholar] [CrossRef]
  56. Peng, Y.; Leung, H.C.M.; Yiu, S.M.; Chin, F.Y.L. IDBA-UD: A de novo assembler for single-cell and metagenomic sequencing data with highly uneven depth. Bioinformatics 2012, 28, 1420–1428. [Google Scholar] [CrossRef] [Green Version]
  57. Hyatt, D.; Chen, G.-L.; LoCascio, P.F.; Land, M.L.; Larimer, F.W.; Hauser, L.J. Prodigal: Prokaryotic gene recognition and translation initiation site identification. BMC Bioinform. 2010, 11, 119. [Google Scholar] [CrossRef] [PubMed] [Green Version]
  58. Edgar, R.C. Search and clustering orders of magnitude faster than BLAST. Bioinformatics 2010, 26, 2460–2461. [Google Scholar] [CrossRef] [Green Version]
  59. Li, H.; Durbin, R. Fast and accurate long-read alignment with Burrows-Wheeler transform. Bioinformatics 2010, 26, 589–595. [Google Scholar] [CrossRef] [PubMed] [Green Version]
  60. Hong, C.; Manimaran, S.; Shen, Y.; Perez-Rogers, J.F.; Byrd, A.L.; Castro-Nallar, E.; Crandall, K.A.; Johnson, W.E. PathoScope 2.0: A complete computational framework for strain identification in environmental or clinical sequencing samples. Microbiome 2014, 2, 33. [Google Scholar] [CrossRef] [PubMed]
Figure 1. Diagram of biofiltration setup. (a) Secondary effluent from the Shafdan wastewater Table 500 m, (b) wire filter, (c) the addition of polyaluminum chloride (PACl) from a tank, (d) the coagulator–flocculator tank, (e) the addition of H2O2, (f) the bed biofilter, (g) the storage tank, and (h) the backwash pump. Sampling points were located (1) right after the wire-mesh filter, termed the secondary effluent (SE), (2) after flocculation–coagulation and H2O2 addition, but before the biofilter (BF) and (3) after the biofilter (AF).
Cleantechnol 02 00005 g001
Figure 2. Concentrations of NH4+ before and after the filter, NO3 after the filter, and the delta of NH4+ and NO3 (mg/L-N) are presented. The gray dashed line represents the NH4+ oxidation rate, which is the ratio between the introduced NO3 and the sum of the removed NH4+ and NO2 (%). The green dashed line represents the complete (100%) calculated mass balance between removed NH4+ and NO2 and introduced NO3. The sampling campaigns were sorted by feed values of NH4+. The first three values represent the control without H2O2 addition.
Cleantechnol 02 00005 g002
Figure 3. Accumulated inorganic and organic nitrogen concentrations (mg/L-N) before (BF) and after (AF) the biofilter and removal rates (%).
Cleantechnol 02 00005 g003
Figure 4. Log-transformed relative abundances of the marker genes of enzymes involved in nitrification, denitrification, and other metabolic pathways in the biofilter while H2O2 was added with various electron donors and acceptors (a). For each functional gene, the composition of classified genera is presented (b). Concentrations of ammonia and oxygen in the system outlet (c).
Cleantechnol 02 00005 g004aCleantechnol 02 00005 g004b
Figure 5. Suggested model for biokinetics of high-rate tertiary systems with the addition of H2O2. The arrows represent metabolic pathways with the relevant functional groups. Arrow thickness represents reaction rates relatively.
Cleantechnol 02 00005 g005

