Article

Assessment of the Accuracy of ISRIC and ESDAC Soil Texture Data Compared to the Soil Map of Greece: A Statistical and Spatial Approach to Identify Sources of Differences †

by
Stylianos Gerontidis
,
Konstantinos X. Soulis
*,
Alexandros Stavropoulos
,
Evangelos Nikitakis
,
Dionissios P. Kalivas
,
Orestis Kairis
,
Dimitrios Kopanelis
,
Xenofon K. Soulis
and
Stergia Palli-Gravani
GIS Research Unit, Laboratory of Soil Science and Agricultural Chemistry, Department of Natural Resources Development and Agricultural Engineering, Agricultural University of Athens, 11855 Athens, Greece
*
Author to whom correspondence should be addressed.
This article is a revised and expanded version of the following conference abstract: Palli Gravani, S.; Gerontidis, S.; Kopanelis, D.; Kairis, O.; Soulis, K.; Kalivas, D. Evaluation of digital maps of top-soil properties compared to large-scale laboratory soil data and synergies towards a better European soils’ delineation. In Proceedings of the EGU General Assembly 2025, Vienna, Austria, 27 April–2 May 2025; EGU25-15613. https://doi.org/10.5194/egusphere-egu25-15613.
Soil Syst. 2025, 9(4), 133; https://doi.org/10.3390/soilsystems9040133
Submission received: 7 September 2025 / Revised: 7 November 2025 / Accepted: 16 November 2025 / Published: 25 November 2025
(This article belongs to the Special Issue Use of Modern Statistical Methods in Soil Science)

Abstract

Soil maps are essential for managing Earth’s resources, but the accuracy of widely used global and pan-European digital soil maps in heterogeneous landscapes remains a critical concern. This study provides a comprehensive evaluation of two prominent datasets, ISRIC-SoilGrids and the European Soil Data Centre (ESDAC), by comparing their soil texture predictions against the detailed Greek National Soil Map, which is based on over 10,000 field samples. The results from statistical and spatial analyses reveal significant discrepancies and weak correlations, with a very low overall accuracy for soil texture class prediction (19–21%) and high Root Mean Square Error (RMSE) values ranging from 13% to 19%. The global models failed to capture local variability, showing very low explanatory power (R2 < 0.2) and systematically underrepresenting soils with extreme textures. Furthermore, these prediction errors are not entirely random but are significantly clustered in hot spots linked to distinct parent materials and geomorphological features. Our findings demonstrate that while invaluable for large-scale assessments, the direct application of global soil databases for regional policy or precision agriculture in a geologically complex country like Greece is subject to considerable uncertainty, highlighting the critical need for local calibration and the integration of national datasets to improve the reliability of soil information.

1. Introduction

Soil information serves as a fundamental resource for natural resource management, agriculture, environmental protection, and spatial planning [1]. Accurate knowledge of soil particle size distribution is crucial, as it directly influences key soil functions, including erodibility, water retention capacity, nutrient availability, and overall soil health [2,3,4].
The Soil Map of Greece, produced by Greek Payment and Control Agency for Guidance and Guarantee Community Aid—OPEKEPE [5], is considered as the most reliable soil dataset in the country, because it is based on field observations, systematic soil sampling, profile descriptions, and laboratory analyses [6,7,8]. The Soil Map of Greece is a georeferenced vector (point) dataset, created with conventional methods. Recording of sampling points was conducted with the use of Global Navigation Satellite System (GNSS) devices. However, this soil map covers only a fraction of the country’s surface as it mostly focuses on agricultural areas. This limits its use in many applications [9], necessitating the use of additional spatial datasets coming from international organizations like the EU Joint Research Center (JRC) and the International Soil Reference and Information Centre (ISRIC). Still, limited research has been conducted on the comparison of the datasets provided by international organizations and detailed datasets, like the Soil Map of Greece, even though discrepancies between these datasets could significantly impact the assessment of critical parameters such as soil erosion risk, runoff and flood risk, and soil health.
At both the European and international levels, organizations such as JRC and ISRIC provide raster-based soil datasets, including ESDAC (European Soil Database) and SoilGrids, with spatial resolutions of 250 m and 500 m, respectively [10,11]. These datasets constitute a critical foundation for advanced environmental and agricultural modeling and are instrumental in shaping evidence-based policy formulation [9,12,13,14].
The ESDAC raster data were derived based on point-based measurements conducted across Europe, with approximately 22,000 sampling locations collected between 2009 and 2012 for the Land Use/Cover Area Frame Statistical Survey (LUCAS) program. Additional spatial datasets representing geomorphology and vegetation were used as covariates. To this end, hybrid statistical methods that combine machine learning models with spatial interpolation techniques were used.
Another prominent dataset in the field of global soil property prediction is Soil Grids, developed using the WOSIS dataset [15] and machine learning techniques. Soil Grids provides high-resolution predictions of various soil properties, including organic carbon content, bulk density, pH, and soil texture, with a raster resolution of 250 m. Hengl [11] introduced SoilGrids250m, a system that uses a large number of soil profiles all over the world (around 150,000) and environmental covariates derived from remote sensing data, to make global soil property predictions. The system employs machine learning models, such as random forests and gradient boosting, to predict soil properties at various depths, demonstrating the potential of machine learning in soil property mapping. Furthermore, SoilGrids 2.0 [16] introduced quantified spatial uncertainty, providing more reliable confidence intervals for its predictions, which is critical for users who need to assess the suitability of these predictions for specific applications. This improvement represents a significant step forward in digital soil mapping.
The development of the above global soil datasets has facilitated the global mapping of soil properties, enabling widespread applications in agriculture, land management, hydrology, and environmental research. However, they are primarily derived from computational approaches, including machine learning, satellite data analysis, and spatial interpolation [10,16]. This raises concerns regarding their accuracy, particularly when compared to field-based datasets, as the number of soil sampling points used to train these models is relatively limited in proportion to the vast geographic areas they cover.
The comparison of predicted soil properties from the global datasets with localized ground truth data has been a crucial area of research in soil science, with particular emphasis on the reliability and accuracy of these predictions in different geographical contexts [17,18,19,20]. Despite the advancements in global soil data models, the accuracy of these predictions is not without limitations. Several studies have evaluated the performance of SoilGrids in various regions and found discrepancies when compared with ground truth data. For example, Radočaj et al. [17] validated SoilGrids predictions for soil texture components in Croatia, finding low correlations between predicted and actual values, particularly for silt and sand. The study highlighted that regional validation is essential for ensuring the accuracy and applicability of global models in specific geographic locations. Similarly, Dandabathula et al. [18] evaluated SoilGrids 2.0 in the arid regions of India and found significant discrepancies between predicted and observed soil properties, with Root Mean Square Error (RMSE) values of approximately 28% for sand content. These and other similar studies [21,22] emphasize the need for more localized and region-specific soil data to enhance the accuracy of global soil prediction models. Lilburne et al. [20] assessed the uncertainty estimates of SoilGrids 2.0 for soil texture predictions in the Netherlands and New Zealand. The results indicated that the uncertainty estimates provided by SoilGrids were not consistently reliable, with predictions tending to overestimate sand content and underestimate clay content.
In the context of Greece, comparing predicted soil properties from global databases such as ISRIC and ESDAC with extensive national datasets like the Soil Map of Greece can provide crucial insights into the applicability of global models in regional and local contexts [23]. Such comparative studies are essential for evaluating the capacity of global datasets to capture the spatial variability of soil characteristics at finer scales. Understanding their limitations and strengths is vital for developing more precise and practical soil property maps, supporting land management decisions and environmental policymaking.
This study seeks to address this research gap by systematically comparing soil data from ESDAC and ISRIC with the Greek Soil Map, employing GIS methodologies and spatial statistical analyses. Specifically, it examines soil grain size composition, identifying both deviations and potential local-scale convergences. To the best of our knowledge this is the first quantitative validation involving an extensive dataset for Greece, representing Mediterranean regions with complex lithology and topography, and one of the few studies combining statistical and geostatistical error analysis exploring spatial error clustering to identify spatial patterns of error to evaluate the potential causes of discrepancies. The findings of this study are of particular significance, given that datasets from international organizations are extensively used for the development of environmental policies and management strategies at both European and national levels. A thorough investigation of these differences is essential to ensure the reliability of soil data and, consequently, the accuracy of models and policy decisions based on them.

2. Materials and Methods

2.1. Study Area

The study area for the present work is the territory of Greece (Figure 1), with emphasis on cultivated lands, for which a comprehensive national soil map has been created. Greece is characterized by a highly rugged and mountainous terrain, exhibiting significant altitudinal variation. It is among the most mountainous countries in Europe, with elevations ranging from sea level up to nearly 3000 m, as exemplified by Mount Olympus, the highest peak in the country [24]. The landscape is dominated by numerous hilly and mountainous formations with steep slopes. Despite this pronounced topography, a considerable portion of the country is devoted to agriculture, even at high altitudes and on steep inclines. Approximately 44% of Greece’s cultivated area is located in mountainous or semi-mountainous zones [25]. Furthermore, Greece exhibits exceptional geological diversity, underlain by a wide range of parent materials and lithological formations. Almost all major rock types are represented, including igneous (both acidic and basic, e.g., granites, serpentinites), metamorphic (e.g., schists, gneisses), sedimentary (e.g., limestones, flysch), and volcanic rocks—resulting in a broad spectrum of soil types [26]. Finally, the country displays substantial spatial variability in climatic conditions, particularly in terms of precipitation [27]. Humid zones dominate the western regions (e.g., over 2000 mm annually in the Pindus Mountain range), whereas much drier conditions are found in the central and eastern island areas, such as the Cyclades, where annual precipitation may be as low as ~300 mm. This climatic and environmental heterogeneity underscores the complexity of the study area, making it a suitable case study area for the evaluation of globe soil datasets.

2.2. Data Description

2.2.1. Greek Soil Map

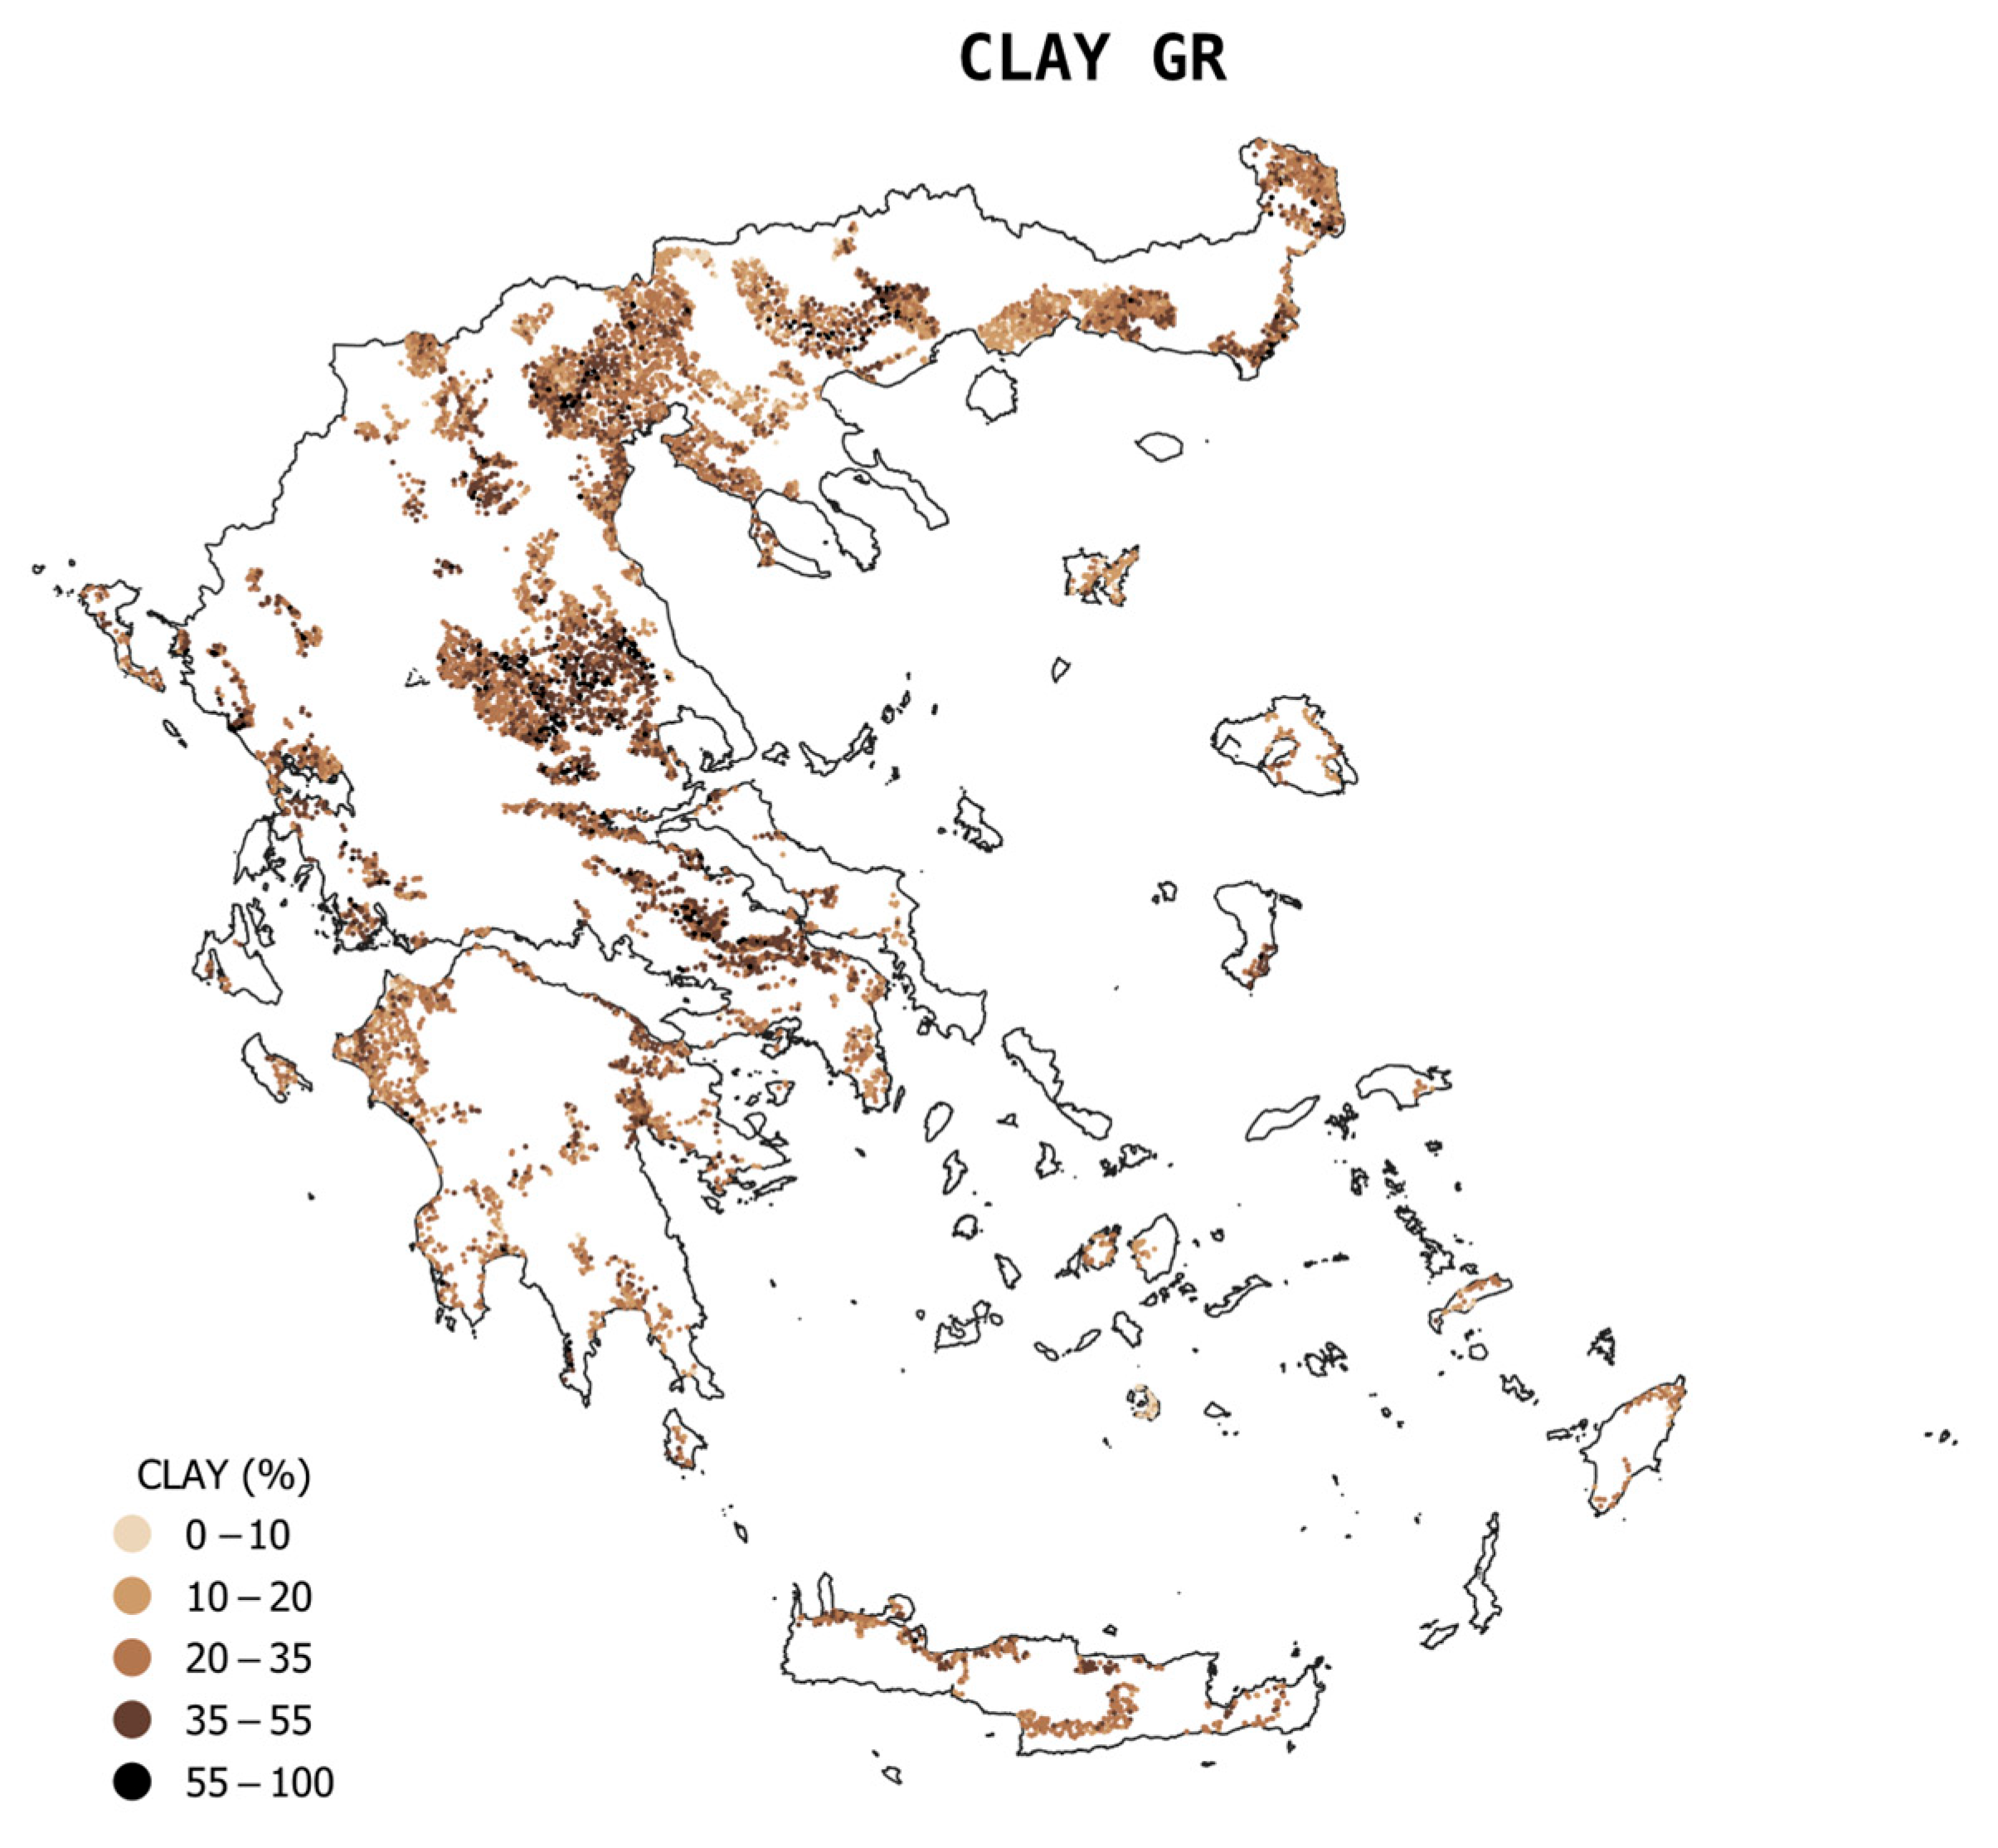
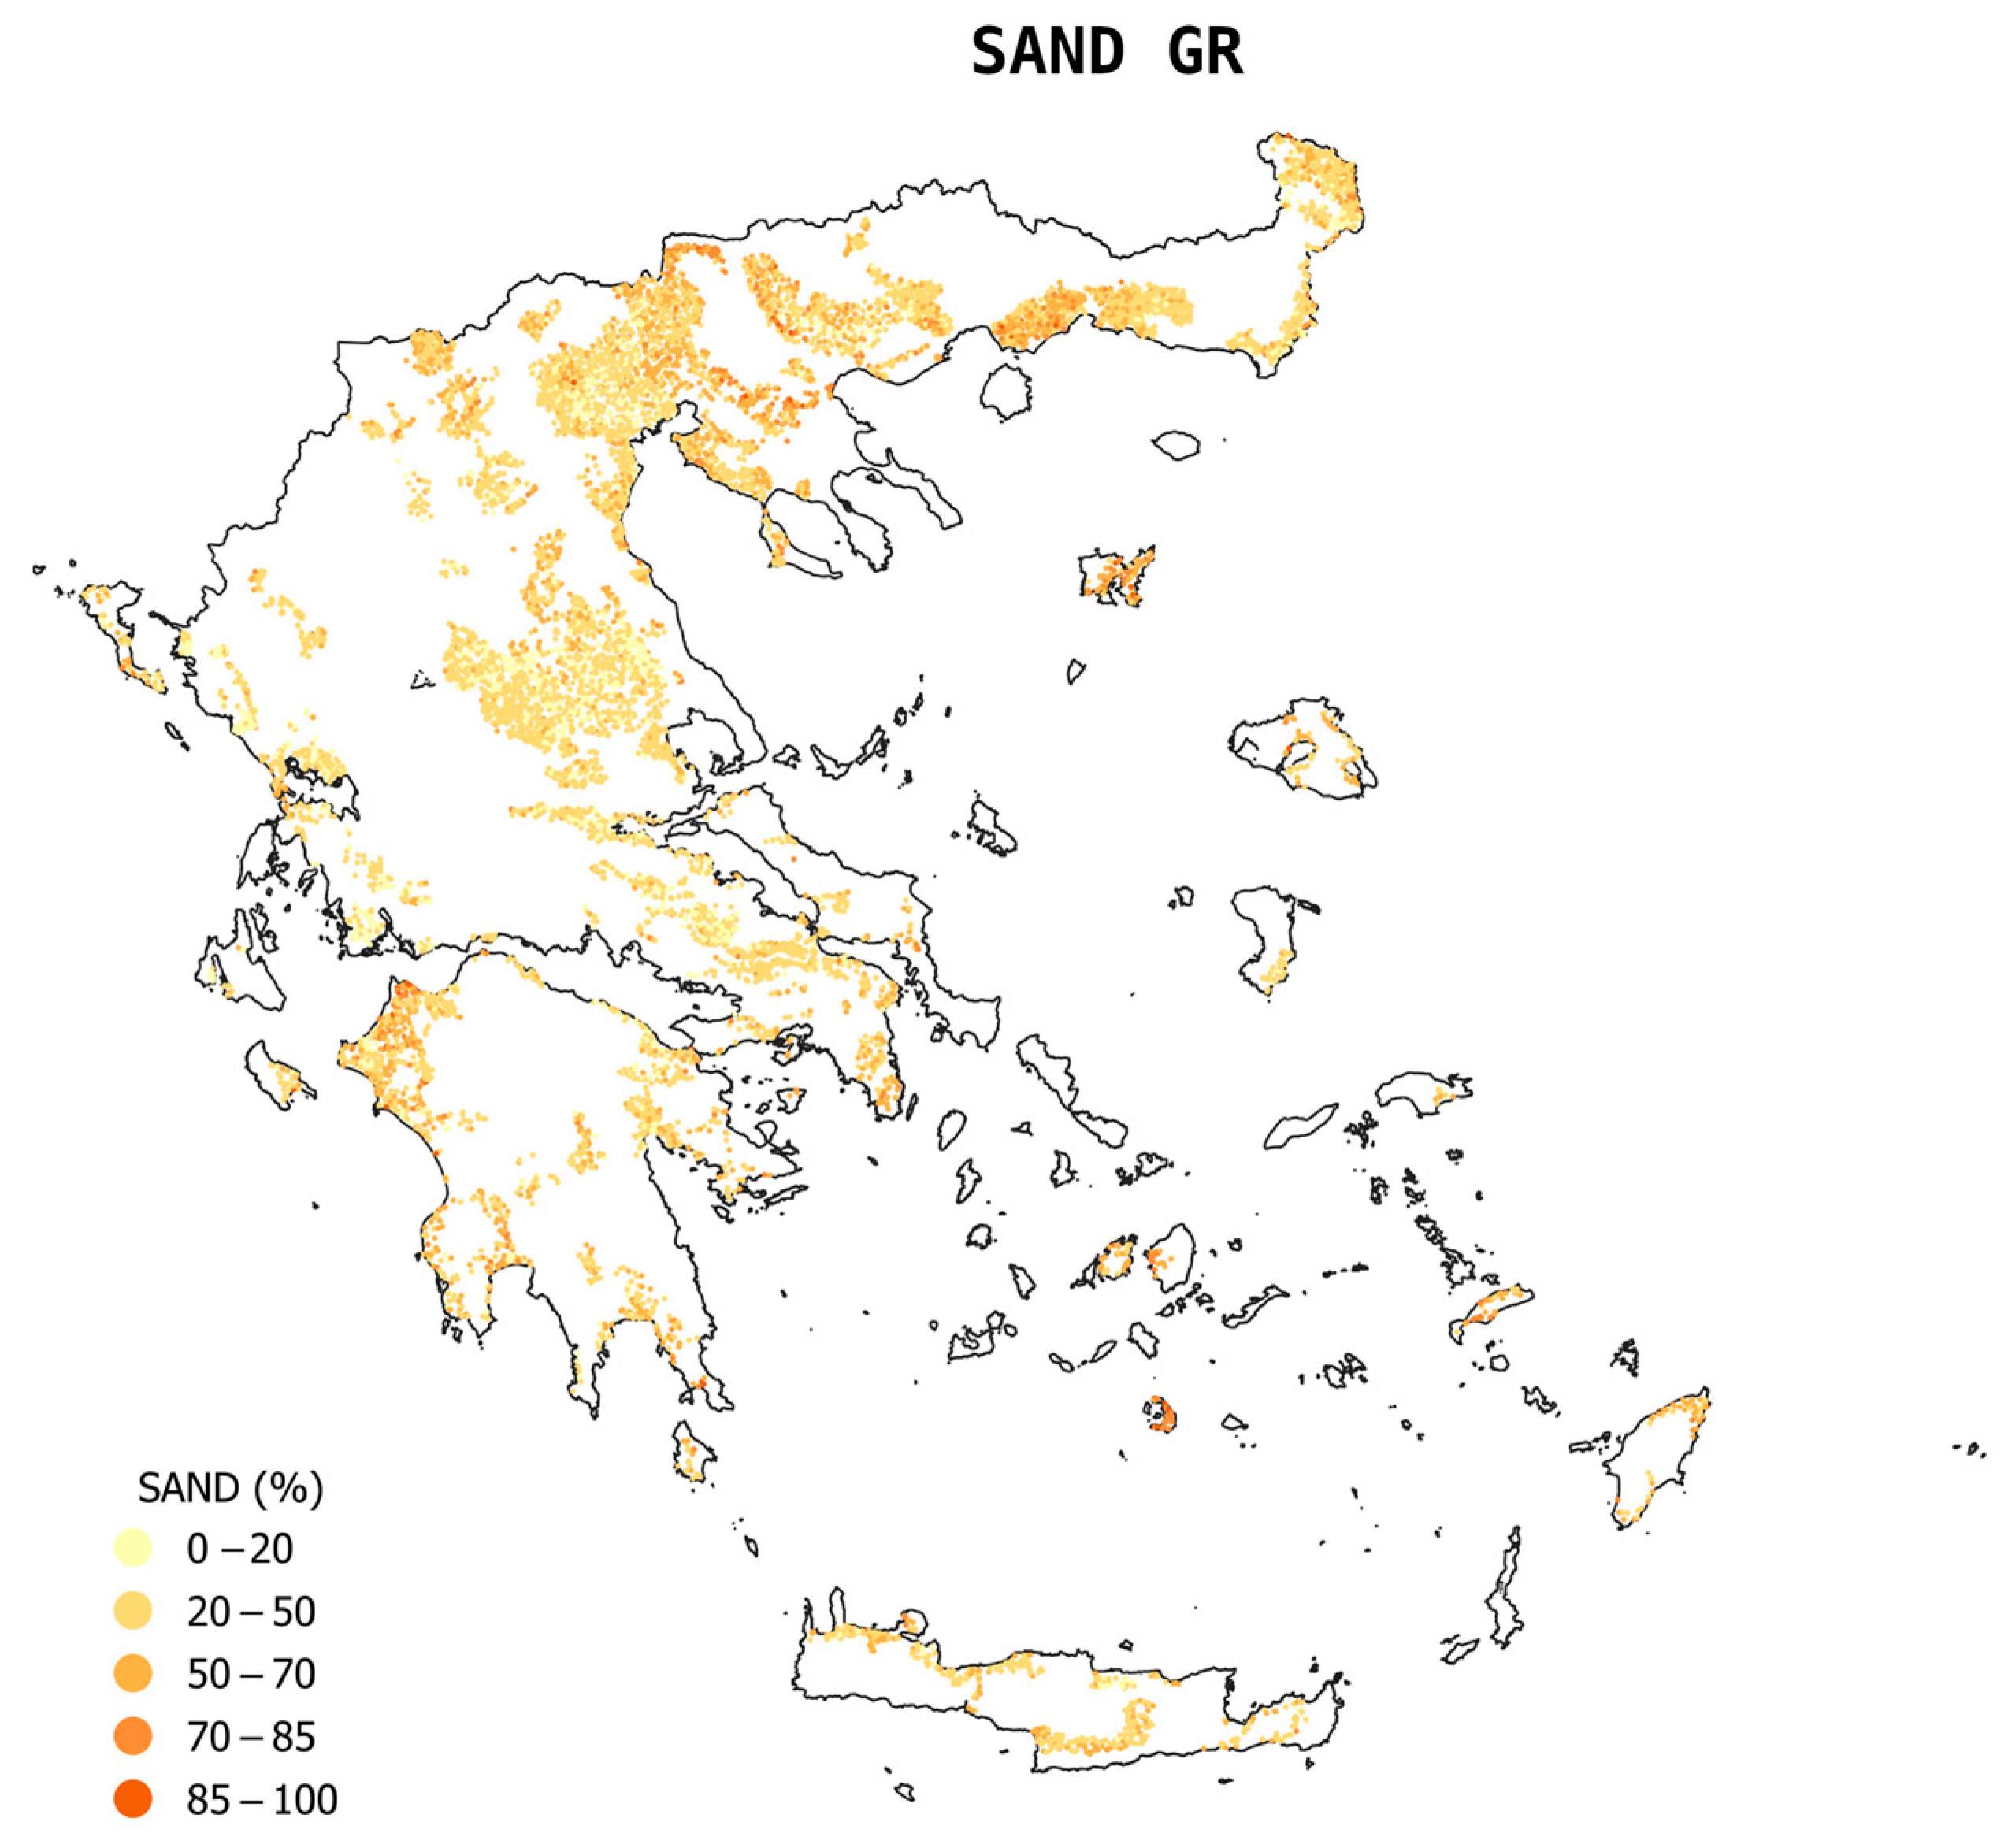
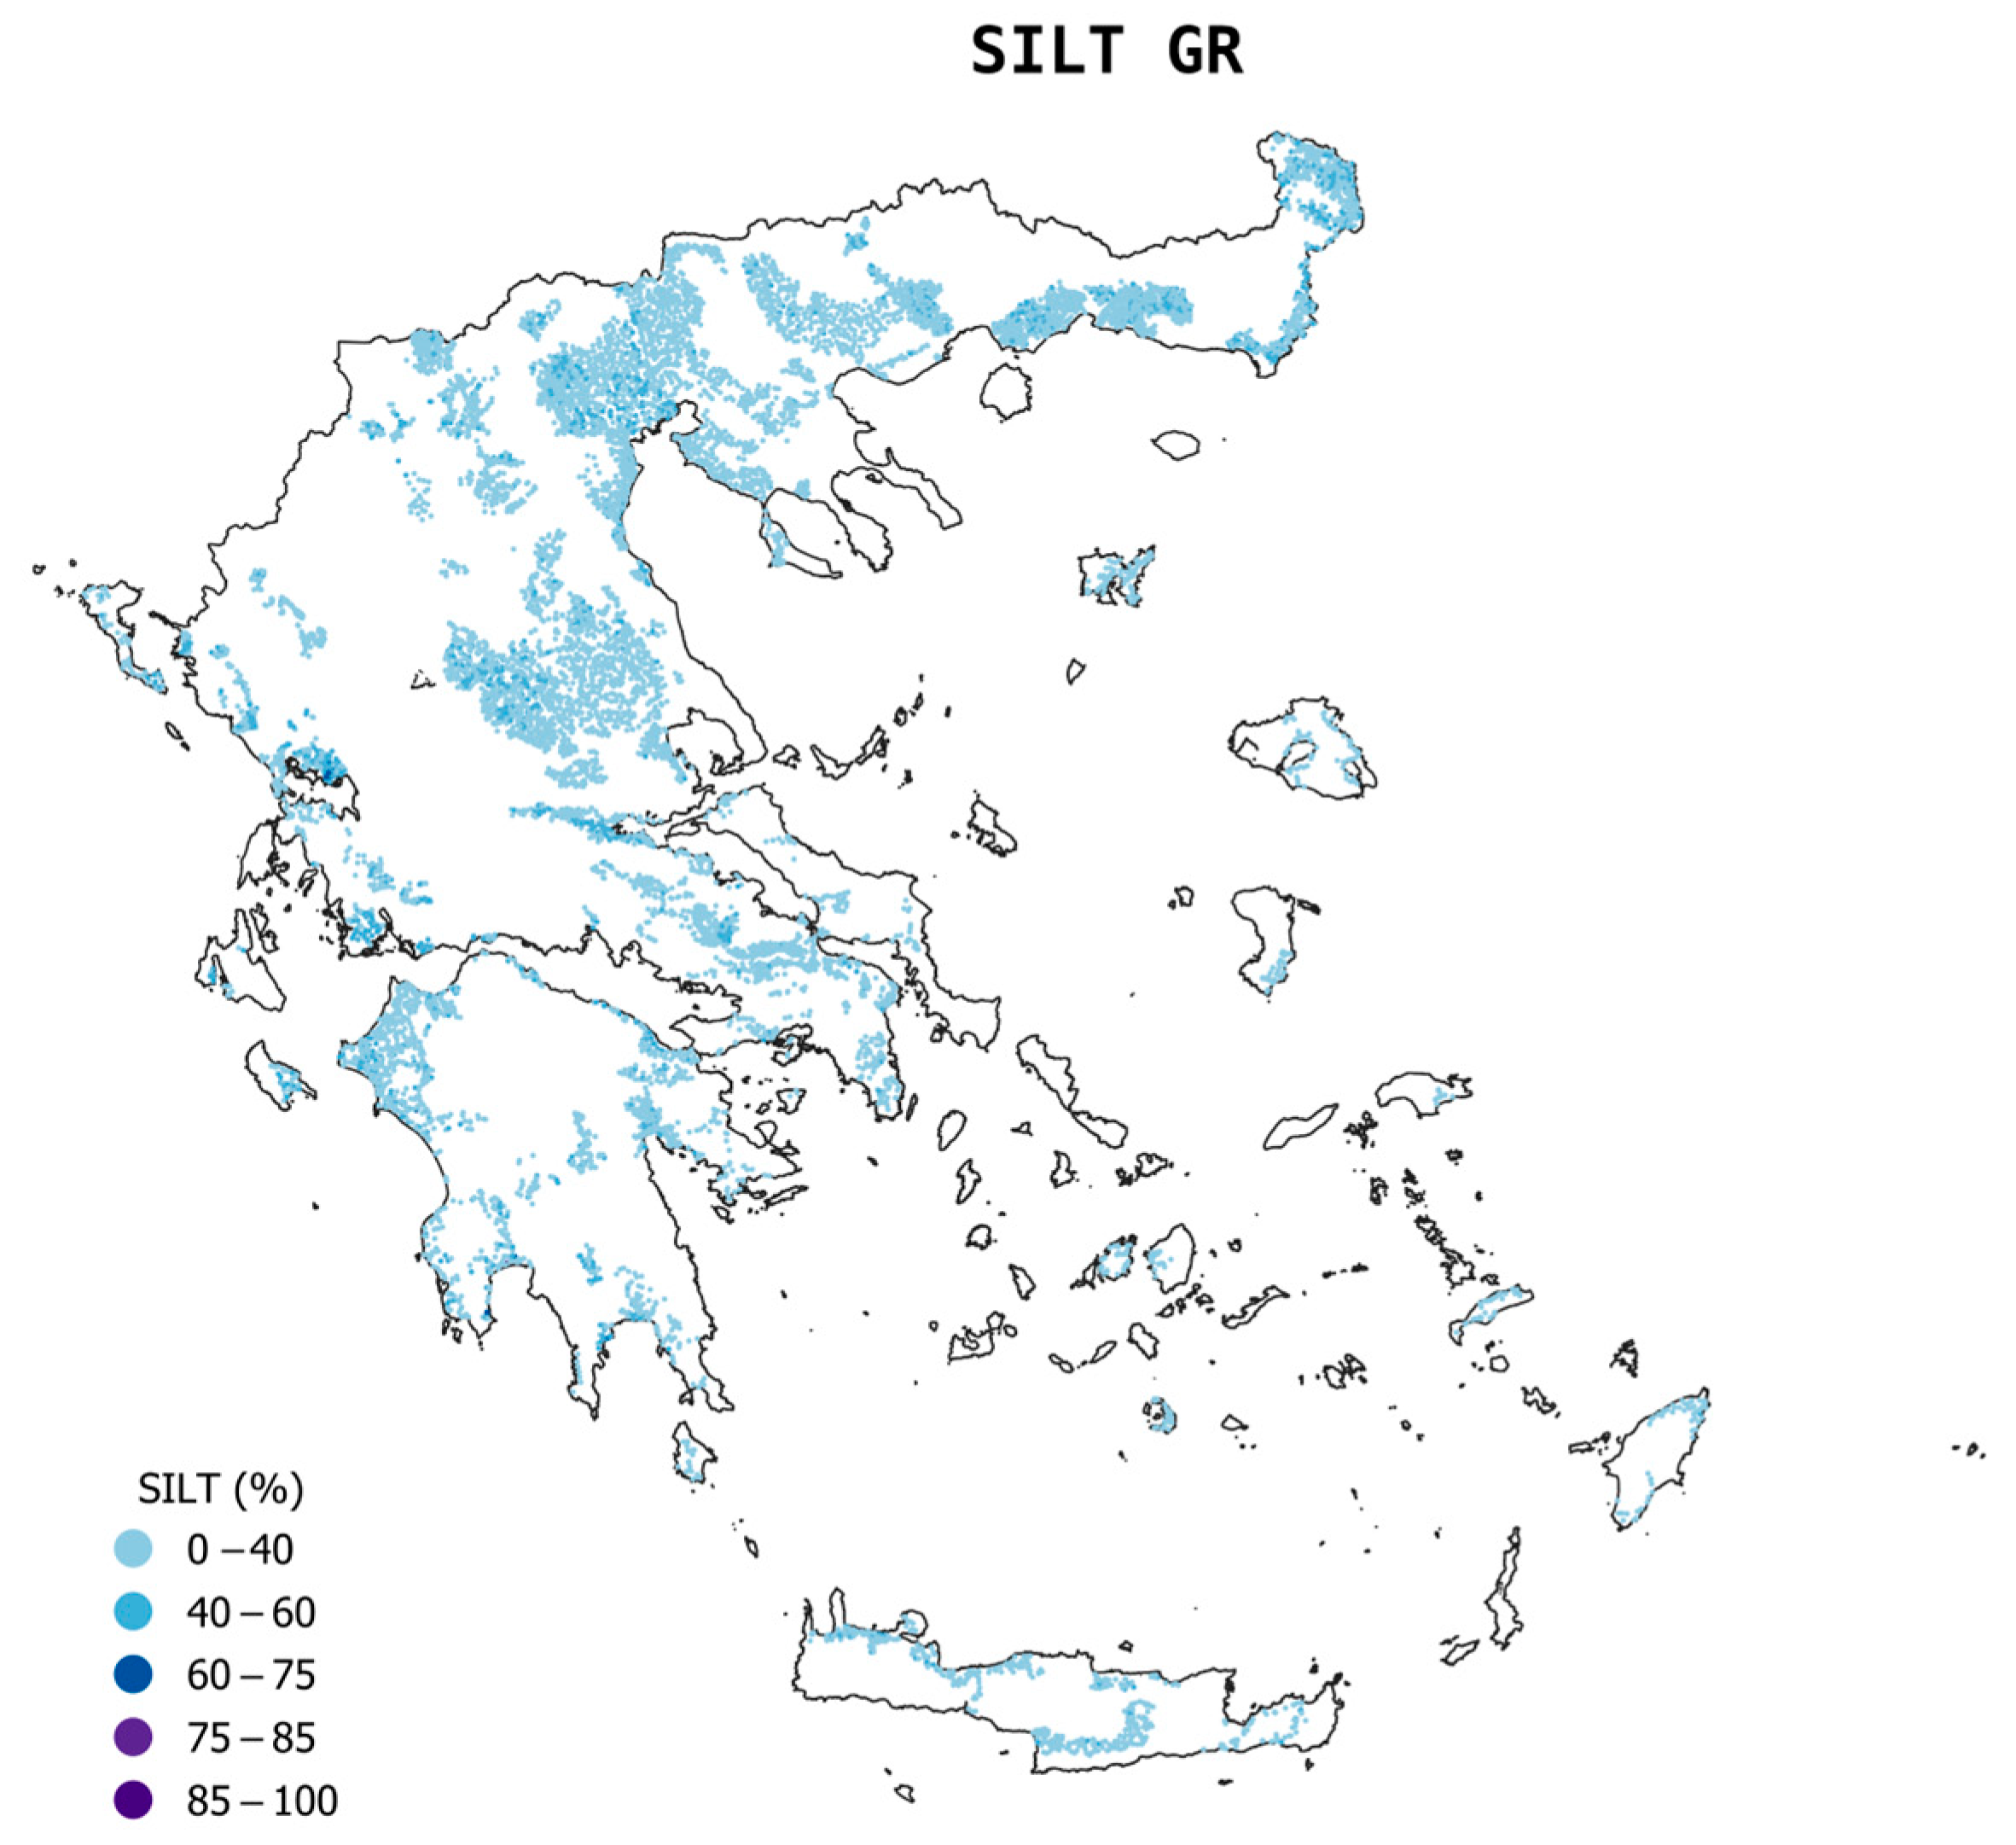
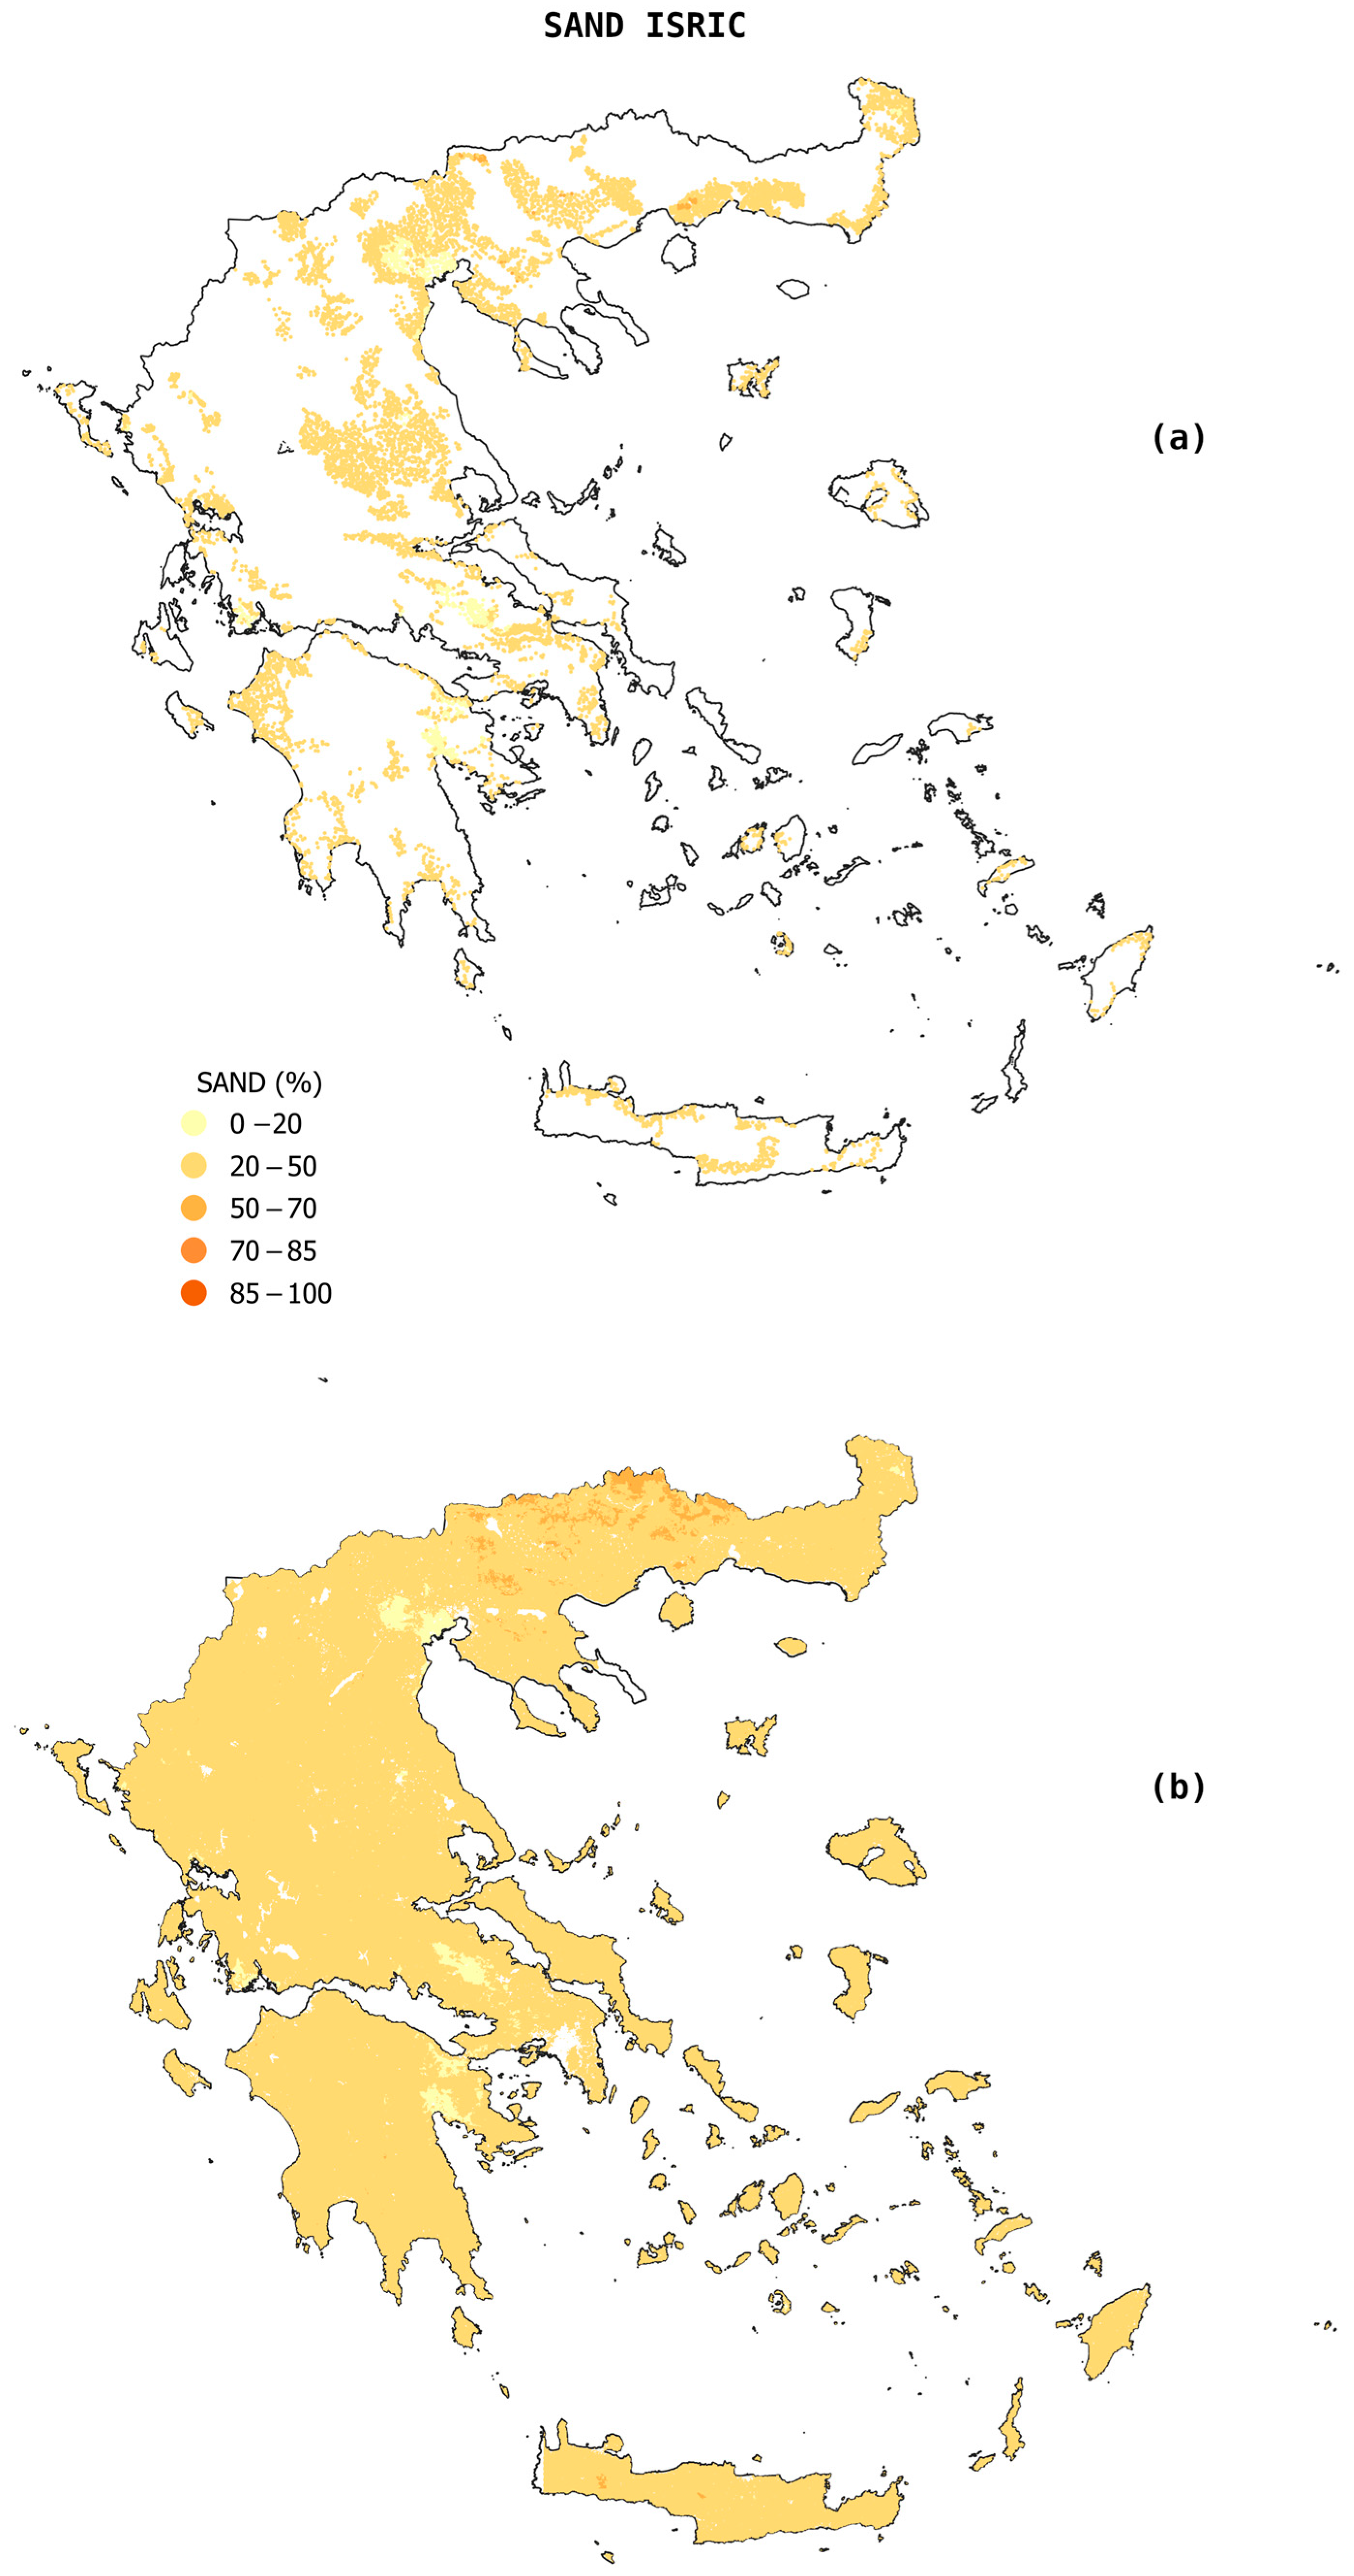
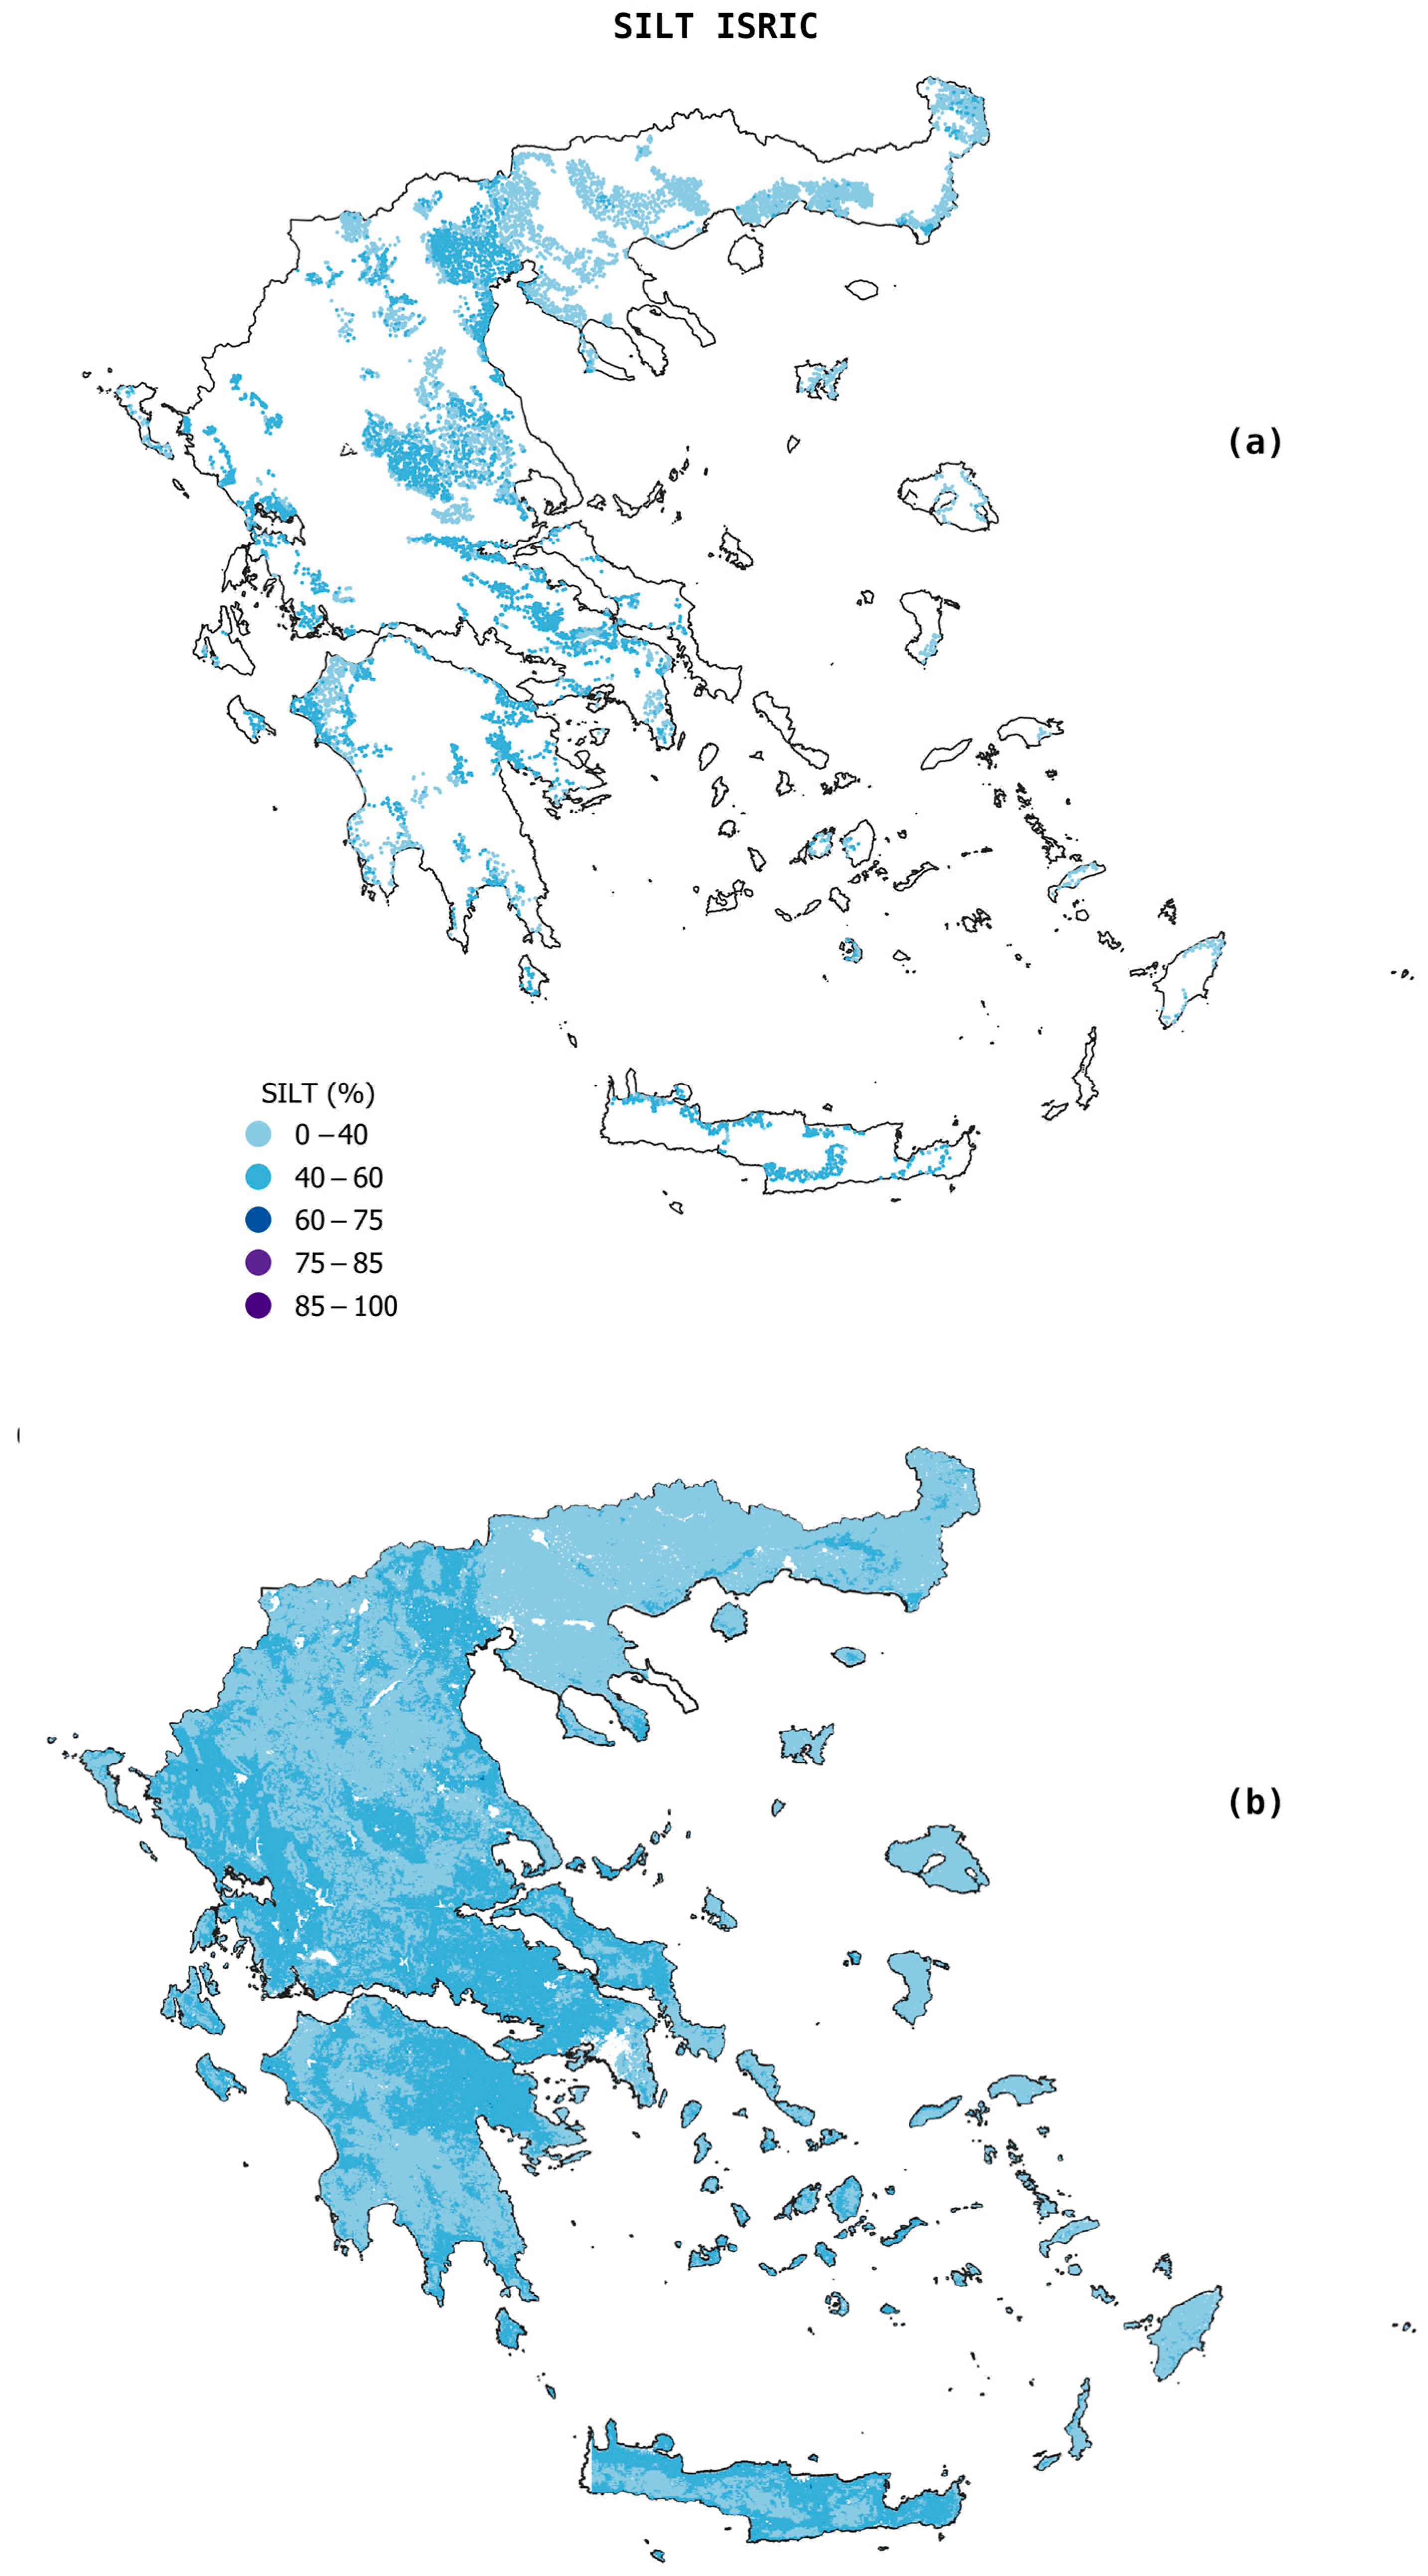
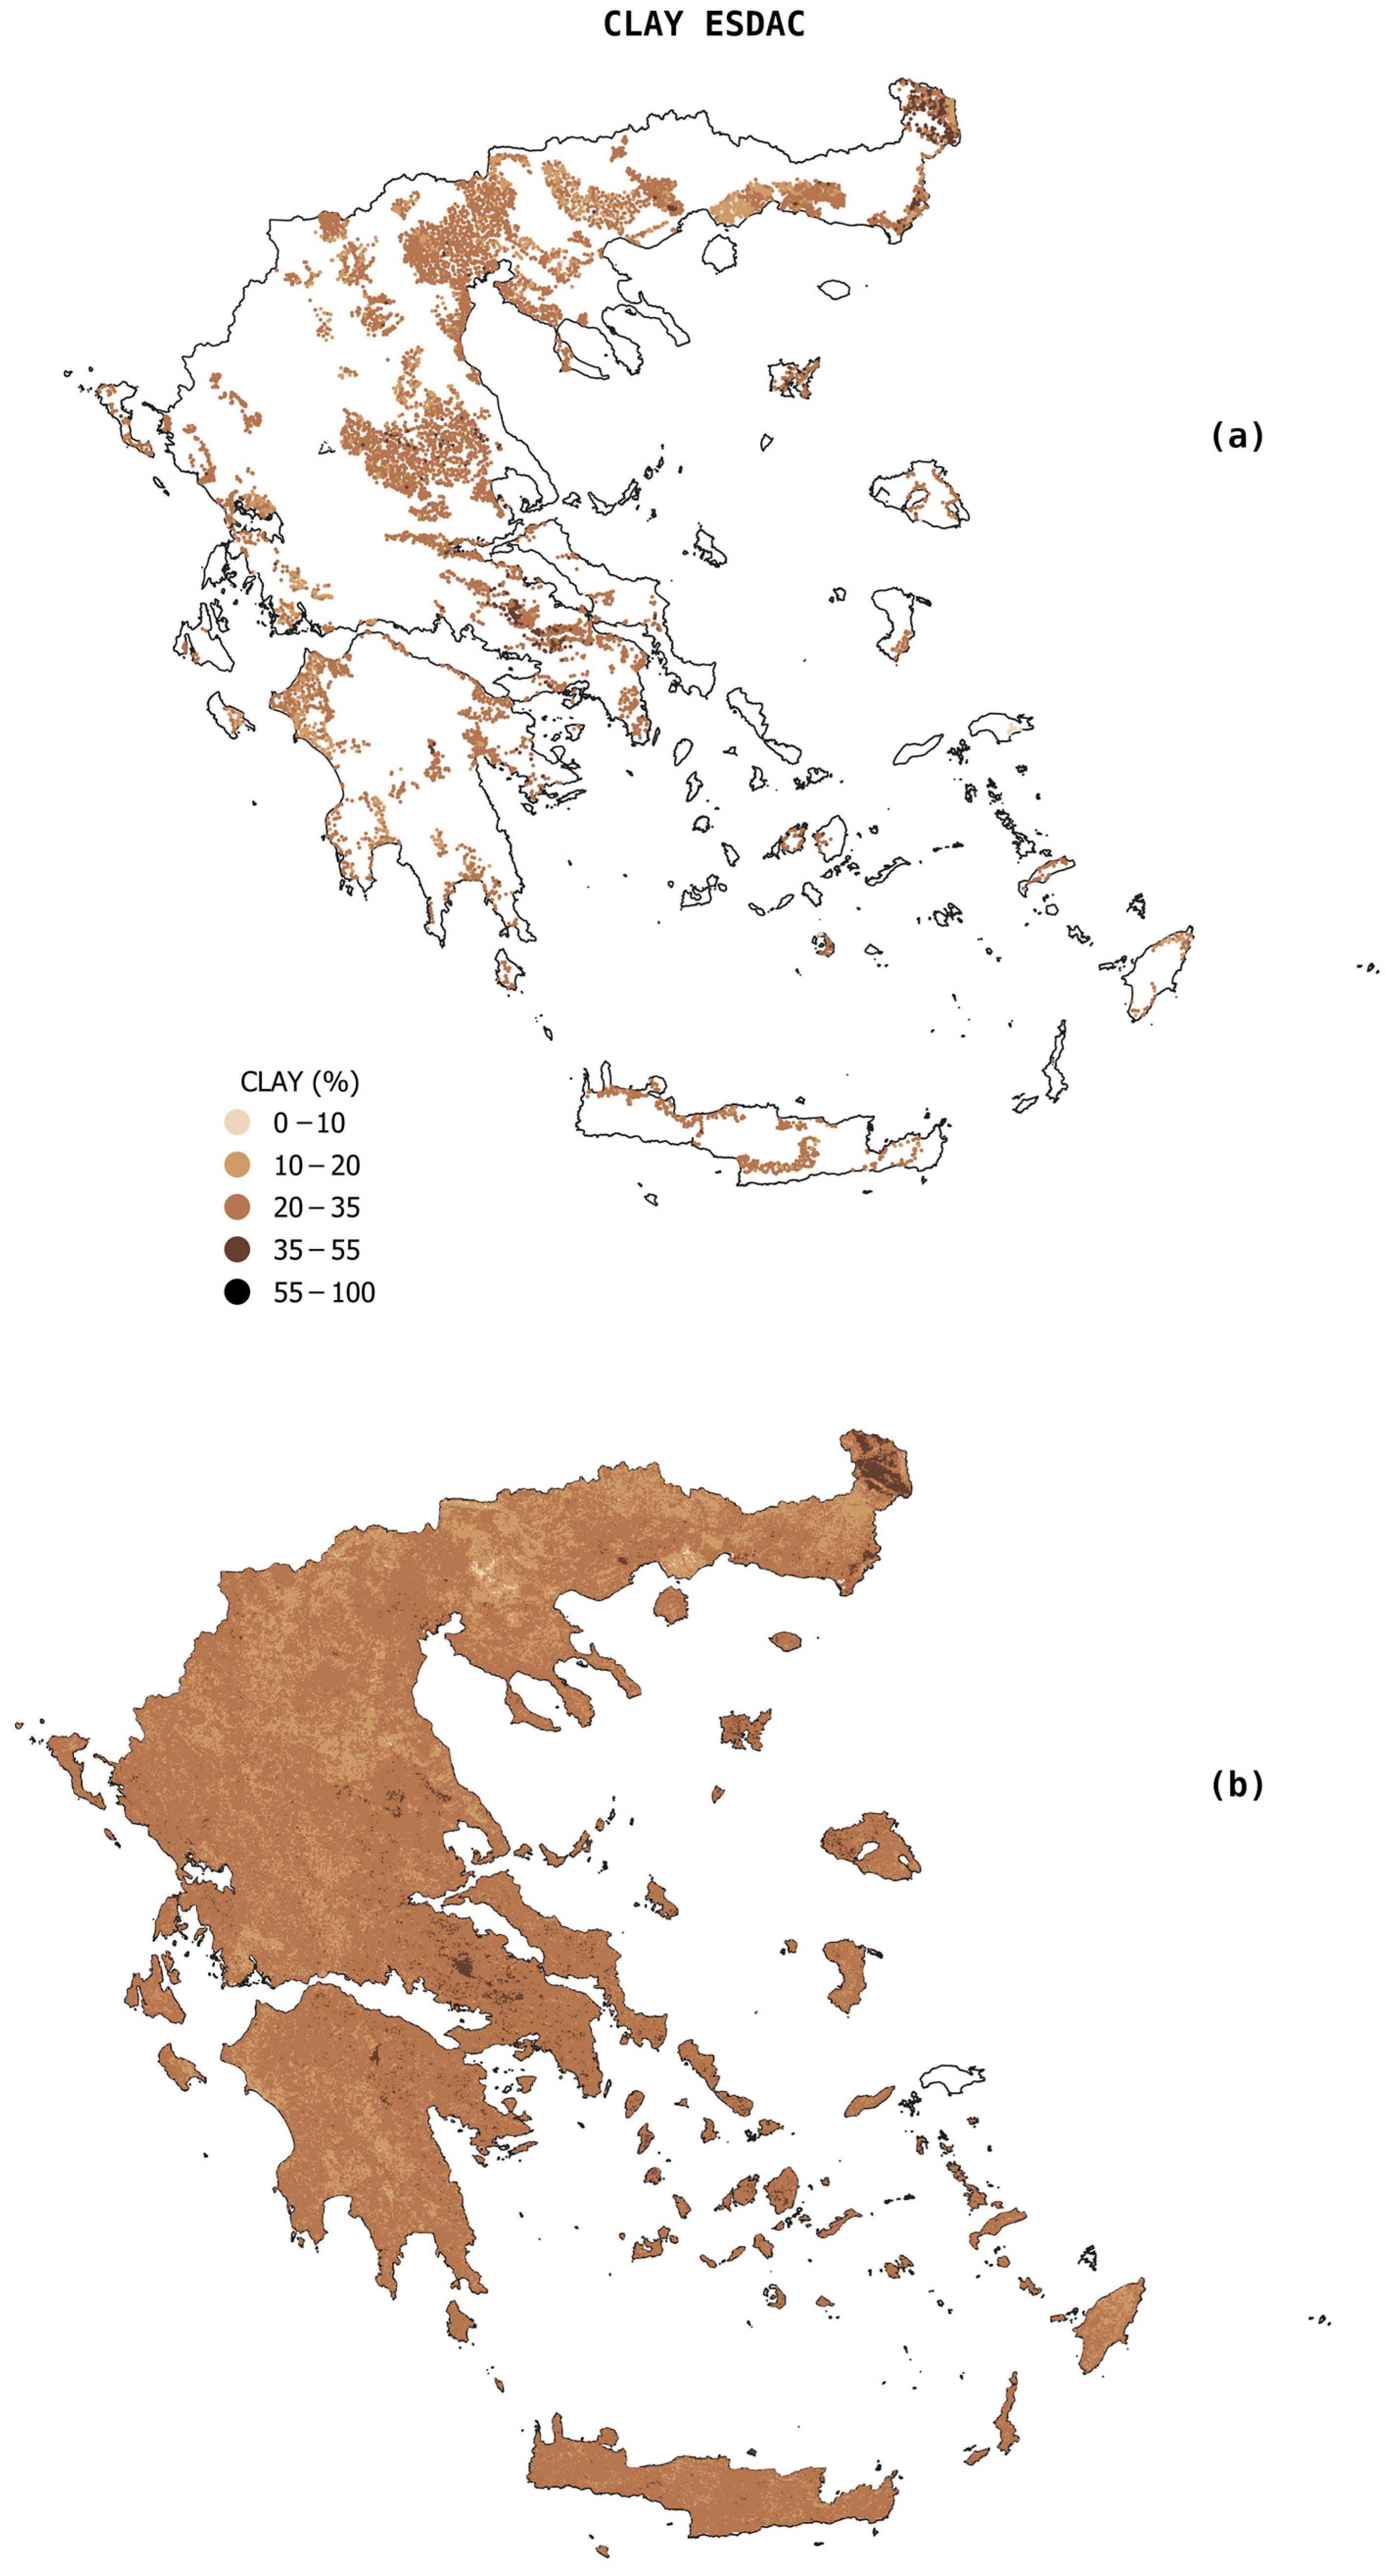
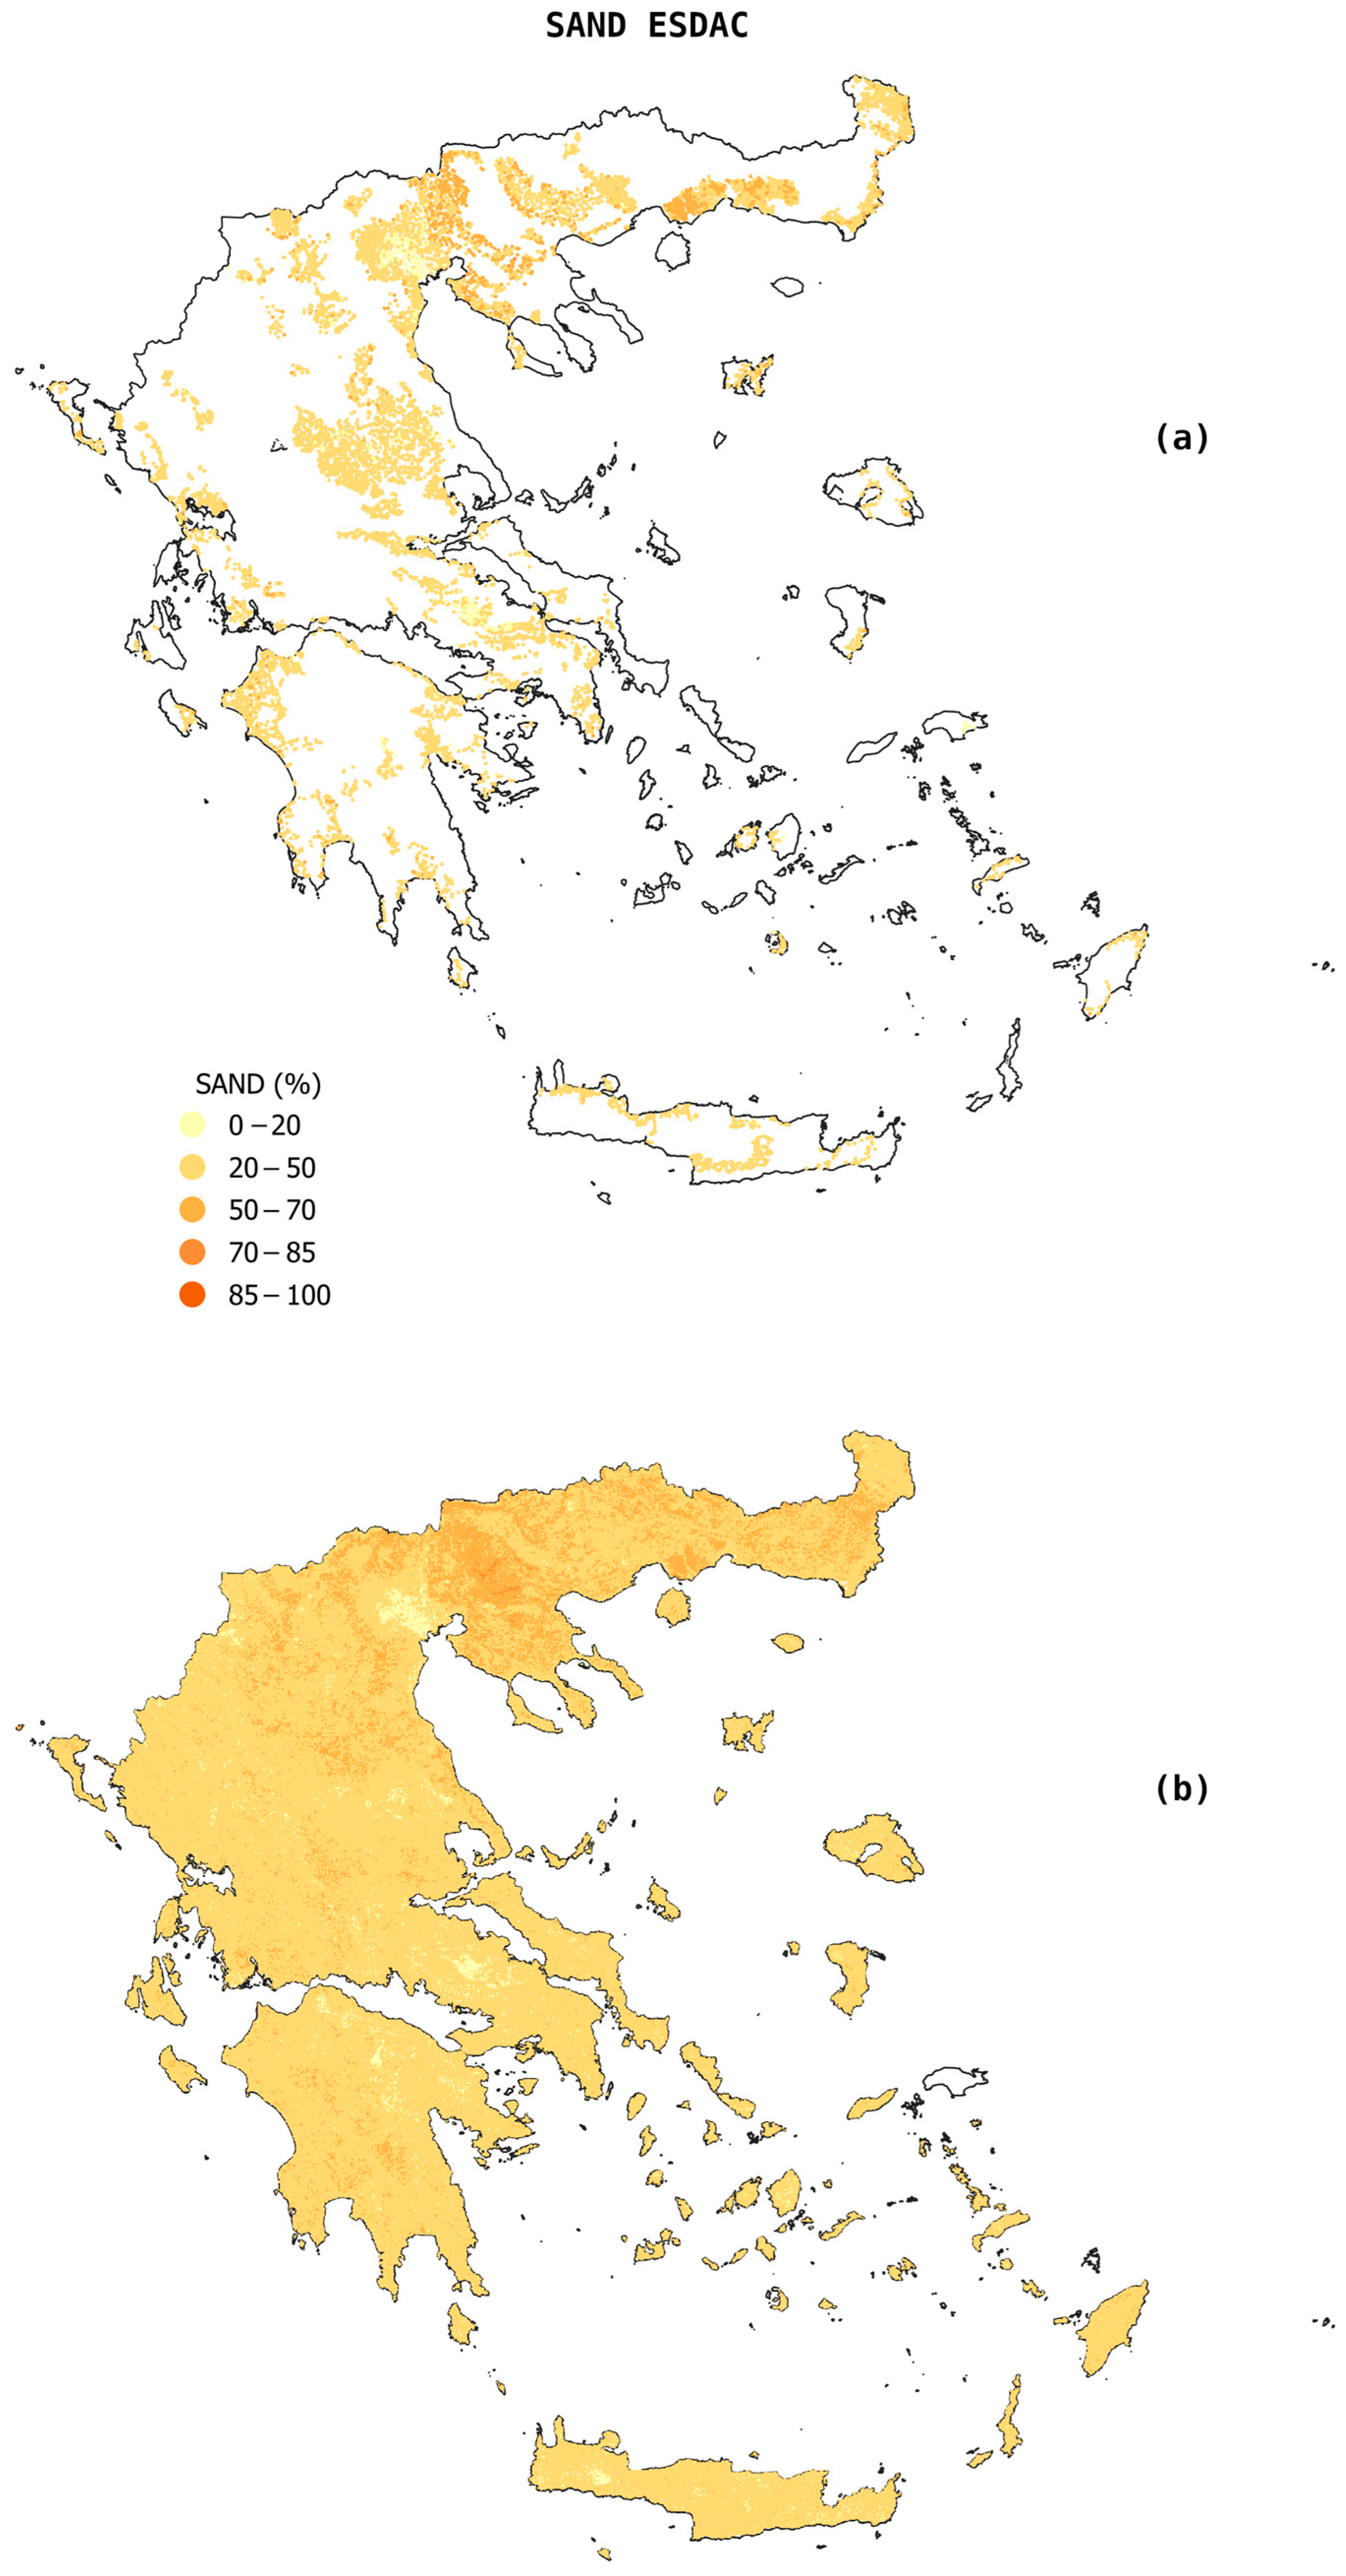
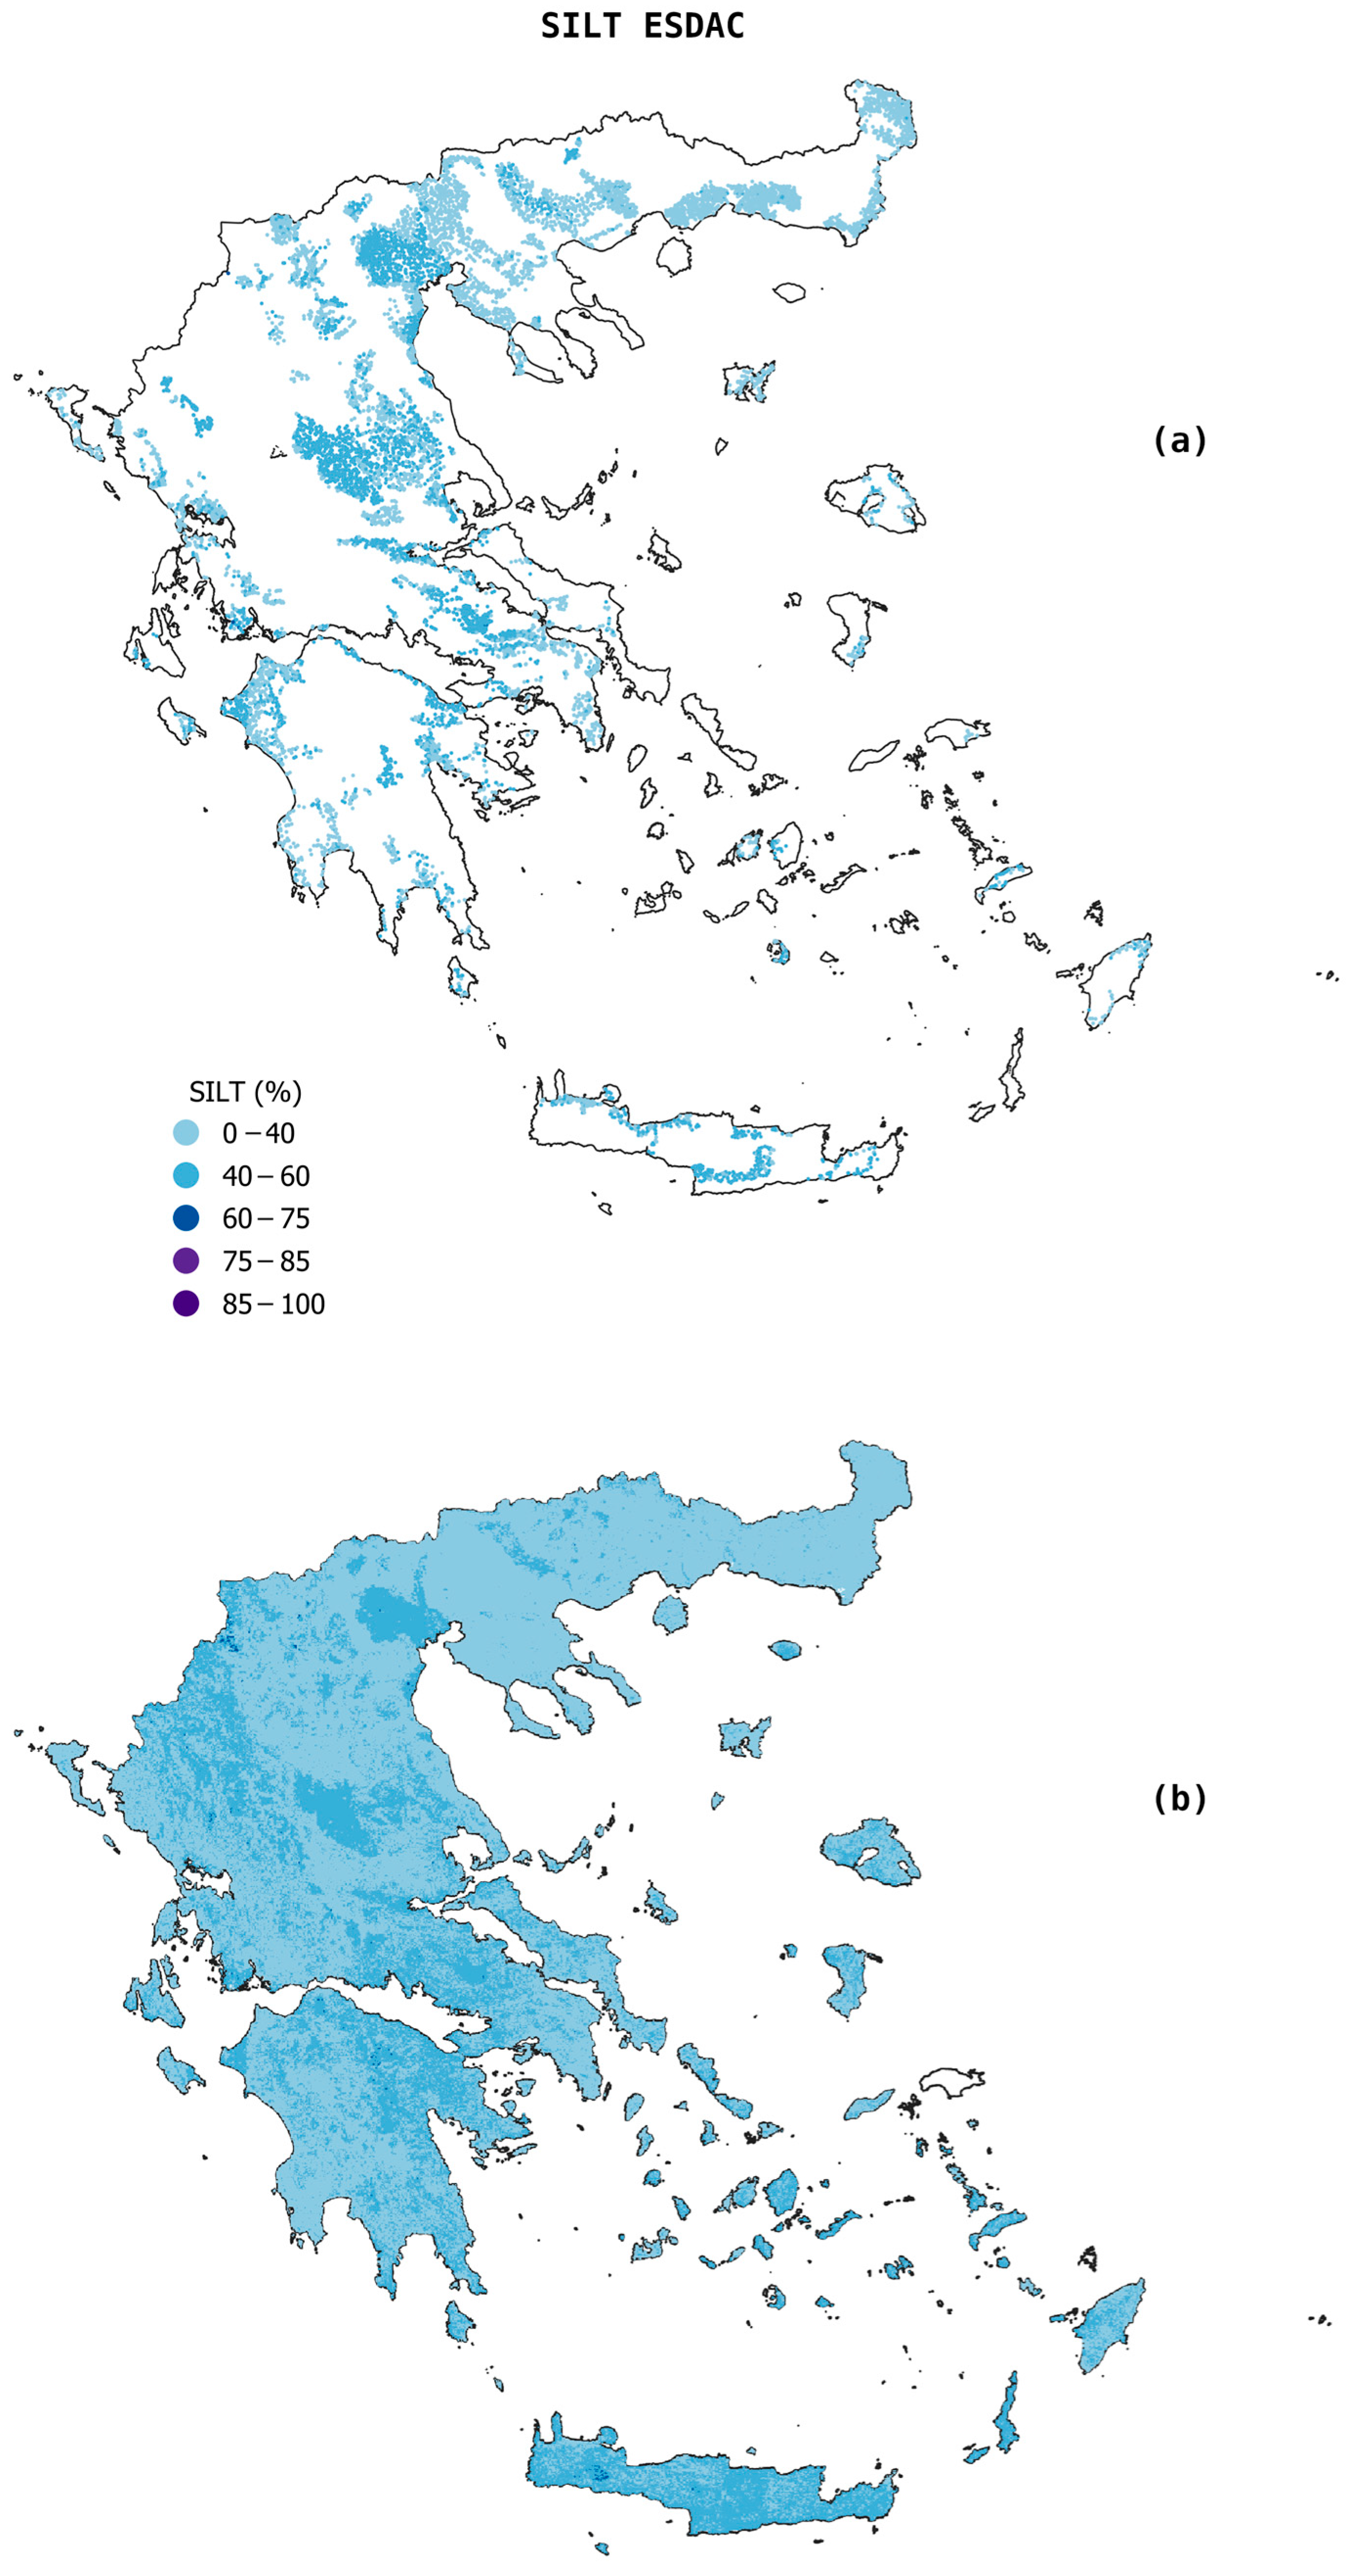
The Soil Map of Greece (published in 2015, presented in Figure A1, Figure A2 and Figure A3) is a comprehensive digital soil mapping product covering the entire Greek territory, developed by OPEKEPE [5] in collaboration with the Aristotle University of Thessaloniki [29]. The dataset was conventionally produced, with all sampling points manually geolocated with the use of GNSS devices.
Soil mapping was conducted at multiple scales, ensuring both detailed local data and a comprehensive national overview. The core field mapping was carried out at semi-detailed scale (typically around 1:50,000 or finer), allowing for sufficient resolution in identifying soil mapping units.
One of the major challenges in developing the Soil Map of Greece was the integration of historical soil surveys and data from various time periods and sources. Previous soil studies, including local maps produced by research institutes, the Ministry of Agriculture, or universities, provided valuable information but were heterogeneous in terms of scale, methodology, and classification systems. In this project, all available data were compiled and incorporated into a unified geospatial database.
The production of the soil map was supported by an extensive campaign of primary soil data collection across Greece in the period from 2012 to 2014. Intensive field soil investigations were conducted, including both full soil profile descriptions and incremental sampling using augers or pits. Specifically, 2000 soil profiles (pits) were described and sampled at three distinct depths: 0–30 cm, 30–60 cm, and >60 cm, covering the full range of soil horizons. Additionally, approximately 8000 auger-based samplings were conducted, collecting samples from the surface layer (0–30 cm) and subsoil (typically 30–60 cm). In total, over 22,000 soil samples were collected and analyzed in the laboratory—a substantial volume of data that underpinned the creation of the map.
For each soil sample, the main physicochemical parameters relevant to soil classification and fertility assessment were determined. These included particle size distribution (texture), organic matter content, soil reaction (pH), electrical conductivity (as an indicator of salinity), Calcium Carbonate content (CaCO3), Cation Exchange Capacity (CEC), and key nutrient elements (nitrogen, phosphorus, potassium), depending on the context.
Additionally, during field profile descriptions, qualitative characteristics were recorded, such as soil structure, consistency, color (according to Munsell), presence of rocks or gravels, stratification, and indicators of drainage (e.g., presence of mottling or hydromorphic features).
Specifically, For the Soil Map of Greece, the laboratory measurements of sand, silt, clay content in the collected samples, were performed using classical sedimentation procedures. For the particle size fraction determination, the hydrometer method was utilized [30]. A crucial aspect in soil genesis is the parent material from which the soil has developed. To this end, systematic correlation with geology was performed: geological maps (e.g., from IGME—the Institute of Geology and Mineral Exploration) and field observations were used to determine the rock or sedimentary material associated with each soil unit. This information was integrated into the soil mapping units and helped explain soil properties (e.g., soils derived from limestone parent materials are typically rich in calcium carbonate, etc.).

2.2.2. ISRIC Soil Grids

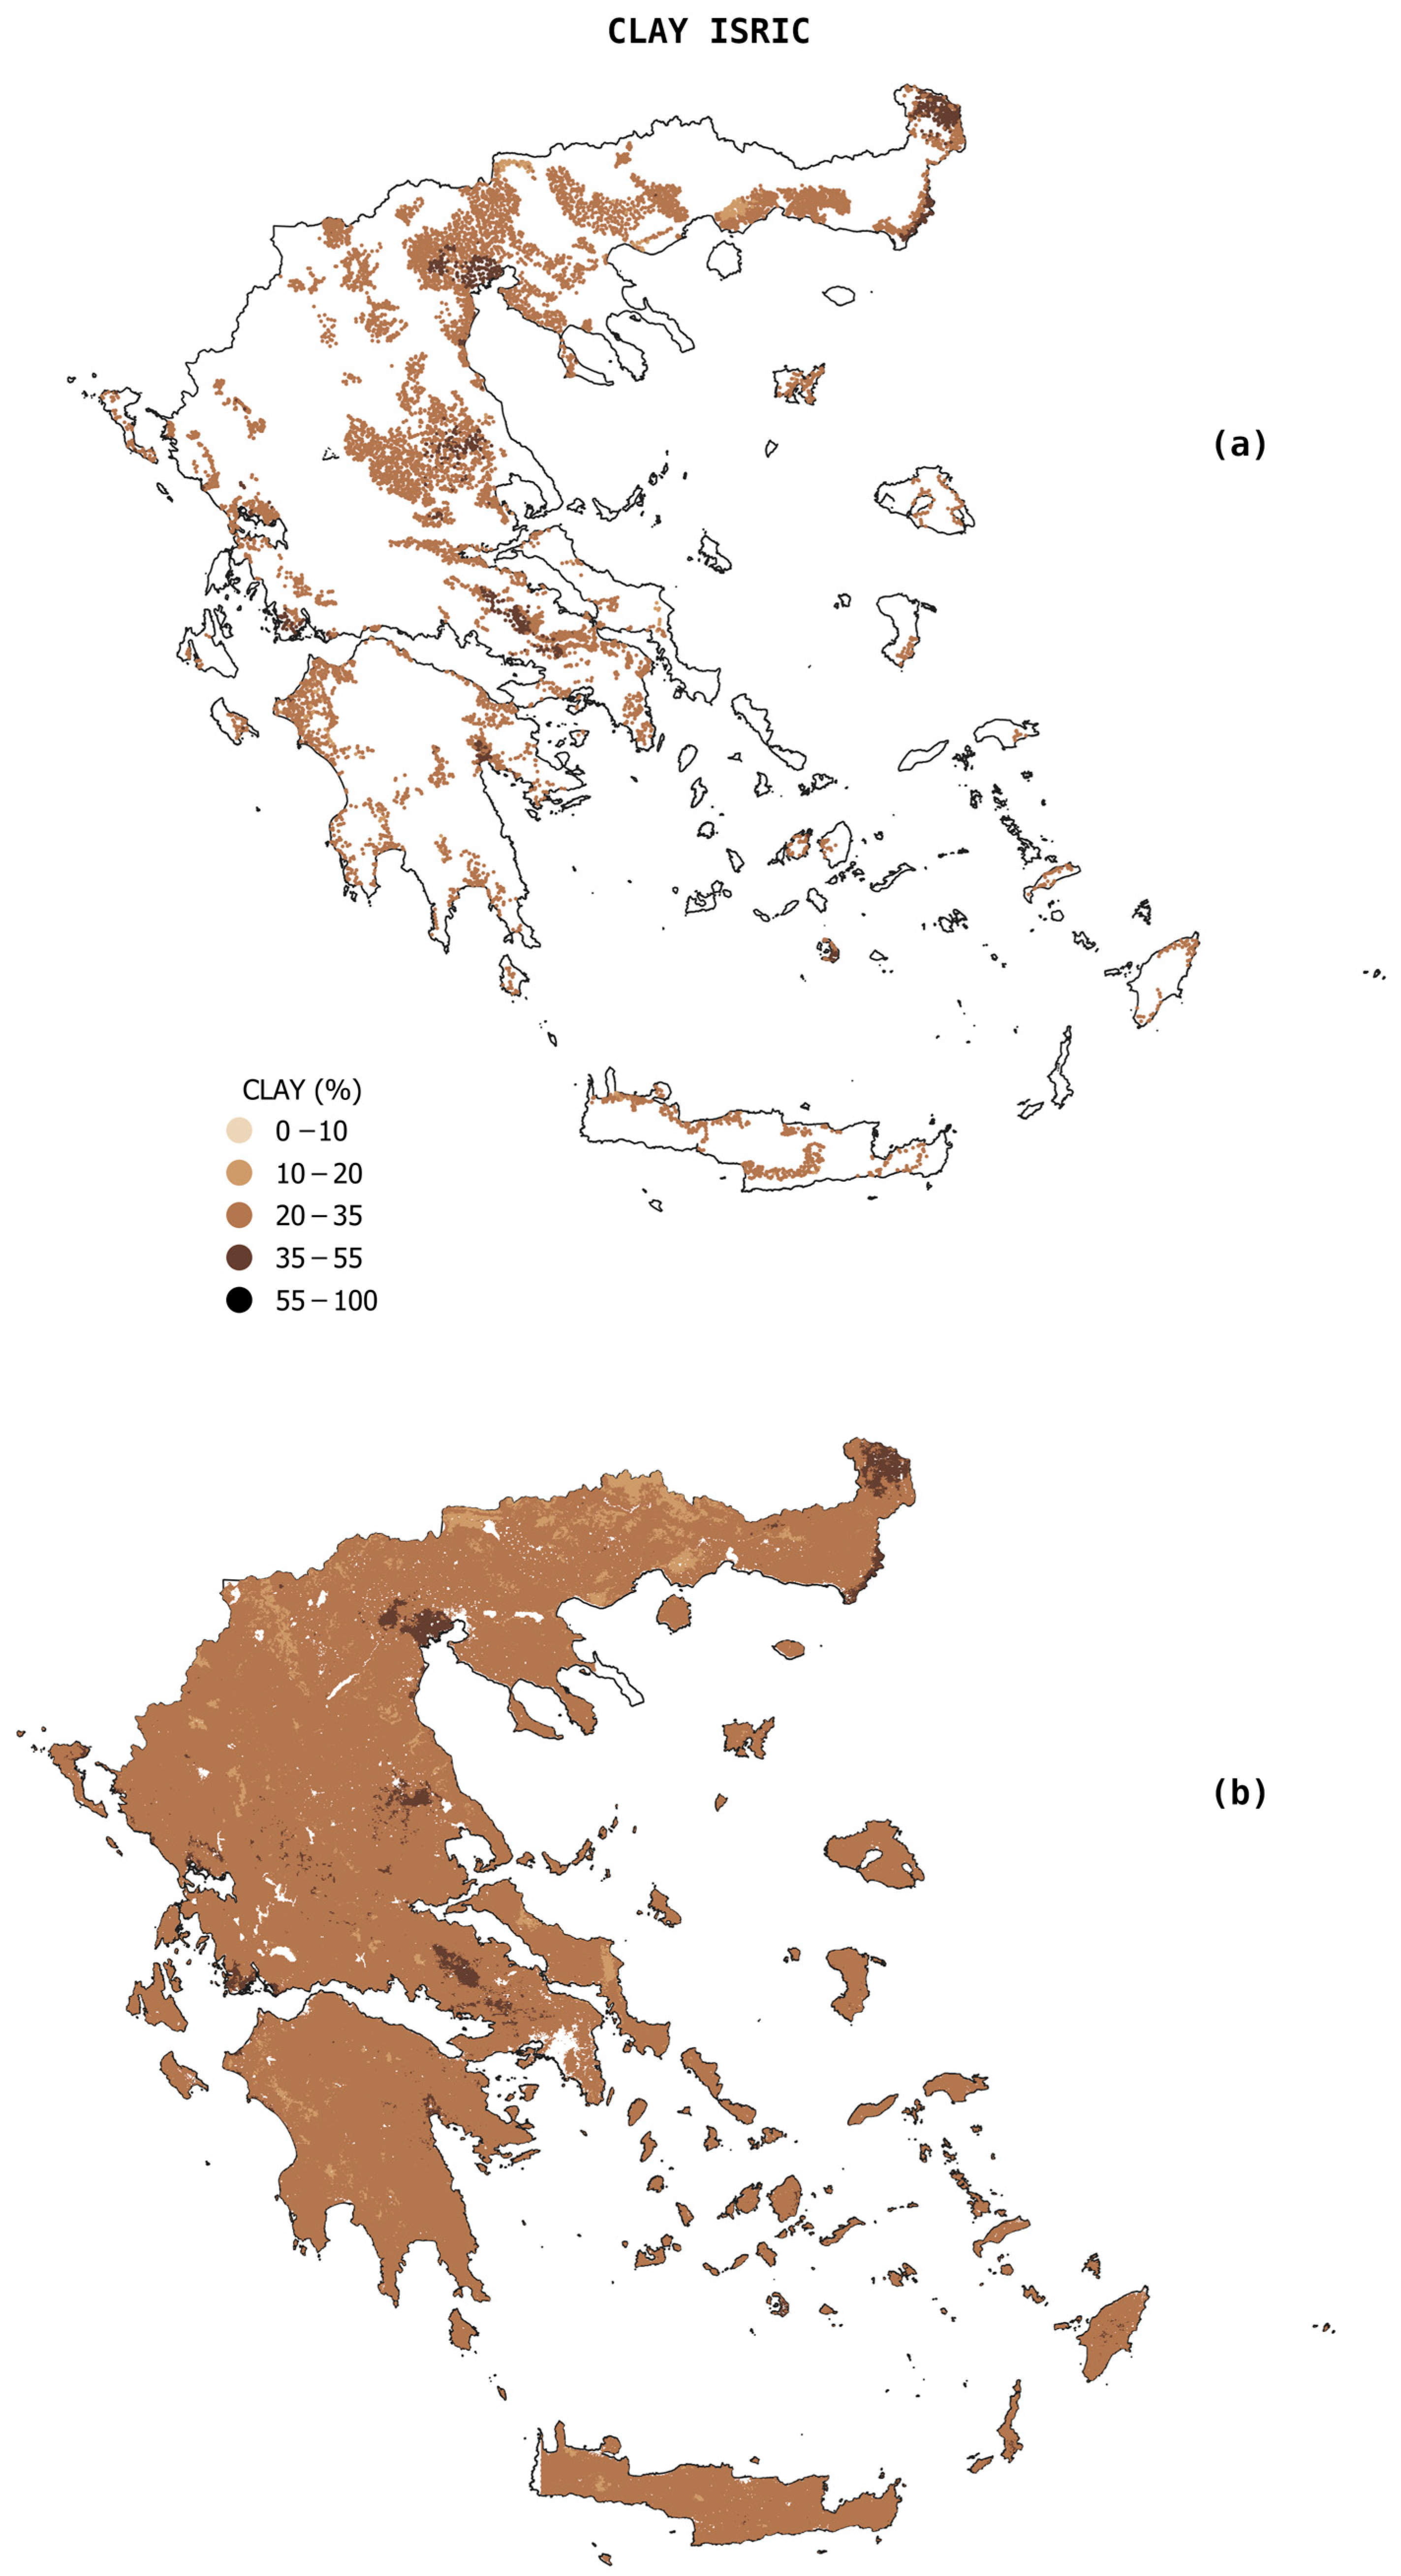
SoilGrids is an initiative by the international center ISRIC—World Soil Information, aiming to create a global digital soil mosaic (raster) with a spatial resolution of 250 m × 250 m [11,16] (presented in Figure A4, Figure A5 and Figure A6). SoilGrids version 2.0 was utilized which released in May 2020. The project was initially based on a relatively dense (by global standards) network of soil profiles, comprising approximately 240,000 points [31]. These data points originate from national databases and studies, which were integrated and quality-controlled [32,33]. The dataset includes information from 173 countries, containing over 830,000 individual soil horizons/layers. For Europe in particular, a significant portion of the data comes from the EU’s LUCAS Topsoil program [34,35]. The soil properties of these profiles included: texture (particle size distribution), pH, organic matter/organic carbon, total nitrogen (N), cation exchange capacity (CEC), bulk density, and coarse fragment content [11].
The production of the SoilGrids 2.0 maps relied on an extensive collection of high-quality, laboratory-verified measurements of soil texture from around the world. As mentioned above, these data were obtained from numerous countries and laboratories, where standard particle-size analysis methods were applied. The pipette and the hydrometer method (with appropriate sample pretreatment and dispersion) form the basis for many samples, while laser diffraction has also been employed in several modern measurements.
However, due to the vast number and diversity of samples included, it is not possible to determine with certainty which analytical method was used more frequently [36].
Each of the above soil properties was mapped by SoilGrids at multiple profile depths. Six standard depth intervals were used, in line with the GlobalSoilMap specification: 0–5 cm, 5–15 cm, 15–30 cm, 30–60 cm, 60–100 cm, and 100–200 cm. For each depth interval, a raster map was produced for each property (e.g., organic carbon at 0–5 cm, organic carbon at 5–15 cm, etc.). Apart from the soil profiles SoilGrids utilized a very large number of GIS-based thematic maps as environmental covariates. Specifically, over 400 candidate layers with global coverage were considered, from which an optimal subset was selected [16]. These covariates included: remotely sensed surface data (e.g., vegetation indices like NDVI and spectral reflectance from MODIS, Landsat, etc.), terrain attributes derived from digital elevation models (elevation, slope, curvature), climate data (mean temperature, precipitation, etc.), geological or parent material maps, land use/land cover maps (e.g., Corine or global land cover products), and hydrological/water-related data [32]. These variables serve as indirect indicators of soil processes—for example, vegetation and climate influence organic matter; topography is linked to erosion and soil depth; geology affects pH, texture, and nutrient content, etc. This multivariate approach allowed the model to capture soil-environment relationships at large scales [16].
To predict soil parameters, machine learning models such as Random Forests and other ensemble learners were used. In the 2017 version, an ensemble system was implemented, comprising Random Forest, XGBoost (gradient boosting of decision trees), and neural networks for certain soil property categories [11]. In the more recent version, the Quantile Random Forest (QRF) approach was adopted to directly estimate the distribution of possible values (quantiles), rather than just the mean value [16]. Each soil property (e.g., % clay) and each depth interval was modeled separately using the selected covariates as inputs and soil measurements as targets [16]. An exception was texture, where the three components (sand, silt, clay) were modeled jointly as a compositional vector, applying log-ratio transformation before regression to ensure the predictions remained consistent (i.e., summing to 100%). The training process involved hyperparameter tuning and thorough cross-validation to assess model performance [16].
The developers of SoilGrids conducted extensive internal accuracy evaluation through cross-validation. Overall, the explained variance (R2) of the models ranged from approximately 30% to 70%, depending on the property. This indicates that a significant portion of the spatial variability in soil characteristics is not captured by the model, especially in regions with sparse data. In the previous (2017) version, which employed a similar methodology, the average R2 for predictions was around R2 = 0.61 [11]. Physicochemical properties such as pH and organic carbon tend to be predicted with relatively higher accuracy (often R2 > 0.5 globally), whereas purely physical properties such as particle size distribution (sand/silt/clay) exhibit greater variability and error [11,16].

2.2.3. JRC ESDAC Raster Soil Map

The ESDAC raster data (presented in Figure A7, Figure A8 and Figure A9) were derived using point-based measurements Land Use/Cover Area Frame Statistical Survey (LUCAS) conducted across Europe, with approximately 22,000 sampling locations collected between 2009 and 2012. LUCAS soil database is one of the largest and most comprehensive soil datasets for Europe. As described by Orgiazzi et al. [37], the LUCAS Soil survey covers more than 45,000 soil samples across the European Union, with the primary goal of monitoring soil conditions and assessing the impact of land management practices on soil properties. The LUCAS database has been instrumental in mapping key soil properties, including soil texture and other physical attributes, at a European scale. Through ESDAC, LUCAS data are integrated with other thematic soil datasets, enabling comprehensive spatial analyses and supporting EU soil policy development, environmental monitoring, and sustainable land management initiatives [35]. At each LUCAS site, which captures the properties of soils in the top 20 cm, laboratory analyses were performed to determine various physicochemical properties: particle size distribution, coarse fragment content, bulk density, pH, organic matter content, CaCO3, CEC, N, total Phosphorus (P), exchangeable potassium (K), and the C:N ratio, as well as concentrations of heavy metals.
The LUCAS 2009 topsoil samples were air-dried and sieved to <2 mm before analysis. Particle-size distribution (sand, silt, clay) was determined by the conventional sieve-and-sedimentation (pipette) method.
The ESDAC raster products are modeled and spatially interpolated layers derived from these LUCAS point measurements, mapping key soil properties The aim of ESDAC application was to produce continuous surface maps (rasters) for the entire European territory. Spatial covariates were employed as predictive variables (input maps correlated with soil properties). These covariates include climatic data (e.g., precipitation, temperature), topographic information (e.g., the Shuttle Radar Topography Mission [SRTM] Digital Elevation Model and its derivatives such as slope and curvature), geological and geomorphological maps, land use/land cover data (e.g., CORINE), and particularly, remote sensing data. A pivotal role was played by remote sensing datasets comprising time series of satellite-based vegetation indices (e.g., NDVI/EVI from MODIS), which, due to their high temporal resolution, capture the influence of soil properties on vegetation dynamics. The underlying assumption is that variations in the spectral response of vegetation are attributable to differences in soil fertility or texture, thus providing useful correlative indicators for predictive modeling [10].
To predict soil properties at unsampled locations, hybrid statistical methods were adopted that combine machine learning models with spatial interpolation (kriging of residuals). Specifically, for physical soil properties (e.g., texture, coarse fragments, Available Water Capacity [AWC]), a Multivariate Adaptive Regression Splines (MARS) model was applied. This model is capable of handling correlated output variables (e.g., sand/silt/clay, which must sum to 100%). The MARS model learns non-linear relationships between the LUCAS observations and the covariates (e.g., satellite indices, topography) and produces predicted values for each 500 m × 500 m grid cell. Spatially structured residual errors are subsequently corrected using Residual Kriging, which leverages the spatial autocorrelation of model residuals. This approach resulted in the generation of soil texture maps, among others, with a high level of explanatory power. The methodology is thoroughly described in Ballabio et al. [10].

2.2.4. Forested Areas Soil Dataset of the NAGREF

NAGREF, in collaboration with the Greek Forest Service, has compiled a comprehensive soil dataset consisting of approximately 2260 georeferenced soil sampling points from forested and semi-natural areas across Greece [38,39,40]. These data were collected over the course of national soil surveys and land mapping programs primarily targeting the country’s hilly and mountainous regions (essentially the forest lands). The Forest Service’s mapping campaign, conducted at 1:50,000 scale, achieved nearly complete coverage of Greece’s upland terrains—roughly 10 million hectares (about 75% of the national territory). During this effort (spanning from the mid-20th century through the early 2000s), more than two thousand soil profiles in forest and rangeland environments were described, sampled, and analyzed, and their information stored in computerized databases. Each sampling point typically represents a soil profile pit or auger boring located in forest ecosystems (e.g., various oak, pine, fir and other Greek forest types), providing a broad coverage of the country’s diverse geology, topography and ecological zones. The dataset thus offers a representative baseline of soil characteristics in Greek forests, intended to support sustainable land use planning, forestry management, and national soil mapping efforts [38].
Each soil profile in the NAGREF/Forest Service dataset is documented with a range of morphological, physical, and chemical properties. Standard field descriptions include horizon definitions, depths, and site information (e.g., landscape position, vegetation, slope, erosion signs), following international soil survey protocols. Samples from both the topsoil and subsoil horizons were collected and laboratory-analyzed under national and international standard methods to ensure consistency [40]. Key soil properties measured encompass particle size distribution (texture fractions of sand, silt, clay), soil pH (in water or CaCl2), organic matter/carbon content, total nitrogen, and presence of carbonates (CaCO3). In addition, the analyses include CEC and exchangeable base cations, electrical conductivity and soluble salts (for salinity), and available macronutrients such as phosphorus and potassium. Other parameters recorded for many profiles are bulk density and soil moisture characteristics, while a subset of samples have data on micronutrients or trace elements (e.g., heavy metals) depending on survey objectives. All soil profiles were taxonomically classified according to the USDA Soil Taxonomy system (and correlated with FAO/UNESCO classifications), providing consistent soil type names [40].

2.2.5. Regional Data Sources

An additional dataset was used for the validation of the results obtained. This dataset comes from the Regional Laboratory of Agricultural Applications and Fertilizer Analysis of Epirus and Western Macedonia (PEGEAL) [28], which is a regional governmental laboratory responsible for analyzing soil, water, and plant tissues to provide guidance on the proper use of fertilizers and other agricultural applications in the regions of Epirus and Western Macedonia in Greece. The dataset includes 774 sampling points for Epirus and Western Macedonia regions in Greece, providing information on various physicochemical properties of the topsoil including particle size distribution Electrical Conductivity (EC), organic matter content, pH, Calcium Carbonate content (CaCO3), Cation Exchange Capacity (CEC), and key nutrient elements.

2.3. Overall Methodology

The methodology followed was based on the processing, comparison, and evaluation of spatial and laboratory data related to soil texture. Initially, multidimensional raster datasets from the international databases ISRIC and ESDAC were processed to extract values solely for the topsoil layer (0–30 cm). These rasters were subsequently clipped to the study area (Greece) and projected into the official Greek geodetic coordinate system (EGSA87, ESPG: 2100).
For each sampling point included in the Greek Soil Map, the corresponding predicted percentages of sand, clay, and silt were extracted. These predicted values were then compared with observed laboratory measurements through the calculation of deviations. Univariate statistical analyses were conducted, alongside spatial error analysis, to detect geographic patterns of deviation.
Subsequently, the soil texture class was determined for each sampling point based on the USDA soil texture classification system, using the computed values of sand, clay, and silt. These classes were then compared with those derived from the predicted values of the international datasets (ISRIC and ESDAC) using producer’s accuracy, user’s accuracy, and overall accuracy metrics, which are well-suited for evaluating agreement between categorical datasets.
To further investigate whether variability in parent material contributes to observed discrepancies, a targeted analysis was performed on selected locations known (through literature [38]) to be situated on soils derived from parent materials that typically produce extreme textural properties. To this end, a spatial join was implemented between the Soil Mapping Units (SMUs), which contain parent material information, and the corresponding raster value extraction points.
To assess the robustness and potential raster value extraction process bias of based on the Soil Map of Greece points, an alternative raster value extraction process was applied. This process considered not only the raster cell directly intersecting each sampling point but also adjacent cells, selecting the one that minimized the difference between observed and predicted values for sand, clay, and silt.
As a final step, comparative analysis was made using two additional datasets, coming from dissimilar sources and having different scopes to validate the accuracy of results obtained. The analysis was also conducted in top soil samples of 0 to 30 cm
The steps of the applied methodology are summarized in Table 1.

2.3.1. Data Acquisition

The primary soil data for Greece were obtained from the Digital Soil Map of Greece, which is accessible via the official web portal of OPEKEPE. This database contains detailed laboratory analyses of the physicochemical properties of soils, including sand, clay, and silt content, collected from over 10,000 sampling locations across the entire country. The dataset was extracted in the form of a geospatial point shapefile, comprising both the precise geographic coordinates of each sampling point and the corresponding measured soil properties.
In parallel, spatially continuous predictions of soil properties at the continental and global scales were acquired from the ISRIC SoilGrids and ESDAC databases. The ISRIC (International Soil Reference and Information Centre) data were retrieved through the SoilGrids platform [41], while the ESDAC (European Soil Data Centre) data were accessed via the official website of the European Commission [42]. Both sources provide predicted values for key soil attributes—such as sand, clay, and silt fractions—at various standard soil depths. Specifically, ISRIC data offers a spatial resolution of 250 m, whereas ESDAC provides data at a resolution of 500 m. For the purposes of this study, the rasters corresponding to the topsoil layer (0–30 cm) [42] were selected, as these values are directly comparable in all the datasets used in the study. All raster data are derived from machine learning models trained on global soil profiles and environmental covariates [42]. The datasets were downloaded under open data licenses for research use and served as the basis for the comparative analysis undertaken in this work.

2.3.2. Raster Processing

The ISRIC (SoilGrids) data have a cell size of 250 m and provide soil property estimates for depths of 0–5 cm, 5–15 cm, and 15–30 cm. To generate a single representation for the 0–30 cm depth range, a weighted average was calculated following the methodology outlined in the ISRIC data user manual.
The JRC (ESDAC) data are provided in raster format with a 500 m resolution and represent the soil particle size distribution for a depth of 0–20 cm using three separate raster layers (sand %, clay %, and silt %).
For the processing of the raster datasets, a clipping operation was performed using an appropriate polygon shapefile delineating the Area of Interest (AOI), corresponding to the territory of Greece. This procedure was carried out using the “Clip Raster by Mask Layer” tool within the QGIS environment, ensuring the preservation of the original pixel characteristics. Following the clipping process, the resulting raster files were reprojected from the WGS 84 geodetic reference system (EPSG:4326) to the Hellenic Geodetic Reference System 1987 (EGSA ’87, EPSG:2100). This reprojection was necessary to ensure spatial consistency and to enable the integration of the data with the national soil map of Greece.

2.3.3. Raster Value Extraction Process

To extract the soil properties information from the raster datasets corresponding to the sampling points, a raster value extraction process was applied within the QGIS environment. This was implemented using the “Sample Raster Values” tool, based on a point shapefile containing georeferenced soil sampling locations derived from the Soil Map of Greece. During the execution of the tool, the raster values were extracted at each point location and appended as new attribute fields, corresponding to the predicted soil properties derived from international soil databases. This method enabled the spatial integration of raster-derived predictions with in situ soil measurements, thereby facilitating subsequent statistical and spatial analyses of the relationships between predicted and observed soil physicochemical characteristics.
In addition to the transfer of soil properties information from the ESDAC and SoilGrids raster datasets to the point vector layer, supplementary environmental variables were extracted from associated raster layers. The raster datasets utilized in this process included the 30 m resolution Digital Elevation Model (DEM) of Greece from Copernicus Data Space Ecosystem [43], along with its derived products: Slope (%), Curvature, Aspect, Flow Accumulation, and the Topographic Wetness Index (TWI). These additional variables were incorporated to investigate potential correlations between measurement discrepancies and geomorphological factors. In addition to geomorphological factors, information of the parent material upon which the soils have developed was also integrated into the point vector dataset. This information was transferred via a spatial join operation from the polygon vector layer of the Greek Soil Map.
Upon completing this process, the attribute table of the point shapefile contained all the necessary data for: (a) Comparing soil property measurements and estimates across the three datasets, and (b) Exploring possible correlations between measurement discrepancies and topographic, hydrological, and geological factors.

2.3.4. Error Calculation

Following the integration of all predicted values into the attribute table of the point shapefile, new fields were generated to calculate the prediction errors for sand, clay, and silt content. These calculations were performed for both international soil databases (ISRIC and ESDAC) by comparing the predicted values to the corresponding laboratory analysis values available for each point of the Soil Map of Greece. Subsequently these calculations were used to produce the following metrics.
Root Mean Square Error (RMSE) is a statistical measure of the average magnitude of errors between predicted and actual values in a dataset expressed in the same units as the predicted variable. Since it squares the errors, it disregards their direction but gives more weight to lager errors and outliers. It is calculated as:
R M S E =   i = 1 n ( O b s e r v e d   V a l u e     P r e d i c t e d   V a l u e ) 2 S a m p l e   S i z e 2
Mean Bias Error (MBE) is a measure indicating a model’s tendency to over- or under-estimate. It provides valuable insights into systematic errors but should be used in tandem with other metrics as positive and negative errors can cancel each other out. It is calculated as:
M B E =   i = 1 n ( P r e d i c t e d   V a l u e O b s e r v e d   V a l u e ) S a m p l e   S i z e
The coefficient of determination (R2) is the proportion of the variation in the dependent variable that is explained by the independent variables. It ranges from 0 to 1, with higher values indicating better predictive performance.
R 2 = 1 S u m   o f   S q u a r e d   E r r o r s T o t a l   S u m   o f   S q u a r e s
The sand, silt and clay contents of soil samples are compositional data and therefore carry only relative information, meaning that the components are inherently dependent on one another as they always sum to a constant. This makes the use of solely standard statistical metrics misleading because distances and correlations are treated as Euclidean in a fundamentally non-Euclidean space. To counteract this, the values of sand, silt and clay for all data points and for all datasets were transformed using ILR (Isometric Log Ratio) [44] transformation into ILR coordinates. The ILR transformation provides a theoretically rigorous method for interpreting prediction errors in compositional data. Unlike the original compositional space, ILR space is Euclidean, meaning standard statistical operations like addition and distance calculations are valid [44]. Taking the GR dataset as the ground truth, the Aitchison MAE (MAEA) and RMSE (RMSEA) were computed for the ESDAC and ISRIC datasets in ILR space. This process was achieved using the R package “compositions” version 2.0-9 [45] in the RStudio (v2025.09.2 Build 418) environment (R version 4.4.3).
The formula for the ILR transformation is as follows [44]:
i l r j ( x ) = j j + 1 l n ( Π i = 1 j x i ) 1 / j x j + 1
The ILR space is Euclidian, and therefore the relevant Aitchison metrics can be derived from the following formulas:
R M S E A = 1 N n d A ( x n ,   x ^ n ) 2
M A E A = 1 N n d A ( x n ,   x ^ n )
where x n is the observed composition for sample n , x ^ n is the predicted composition for sample n , N is the number of samples in the dataset, ilr j ( x n ) is the j -th coordinate of the Isometric Log-Ratio transform and d A ( x n , x ^ n ) is the Aitchison distance between observed and predicted compositions in ILR space for sample n .
However, this approach alone does not offer human-readable metrics. To counteract this, the Aitchison center of the observed (GR) compositions was perturbed by adding and subtracting the respective ILR error vectors (for ESDAC or ISRIC), creating compositions of ±1 RMSEA/MAEA from the center of the Aitchison geometry. These compositions were then back-transformed to compositional space [46], where it is possible to quantify the value change of each individual component per 1 unit of ILR error, thus extracting statistically valid human-interpretable error metrics per component.

2.3.5. Statistical Analysis

Subsequently, using the IBM SPSS Statistics 25 software [47], basic statistical analyses were conducted on the sand, clay, and silt percentages across the three datasets, including minimum, maximum, range, mean, median, variance, standard deviation, kurtosis, skewness, and other statistical measures, which were accompanied by frequency histograms for each soil property across all three datasets in order to test the normality of their distribution. Additionally, the Aitchison center compositions for each dataset were calculated through back-transformation from ILR space to compositional space. Finally, regression plots were generated to investigate the correlation between the values in the Soil Map of Greece and those from each of the international databases.

2.3.6. Spatial Variability Analysis

To investigate the spatial variability of prediction errors in soil particle size distribution derived from the two spatial soil databases, two types of spatial analysis were conducted:
(i)
A statistical correlation analysis was performed between the geomorphological variables previously integrated into the attribute table and the prediction errors, aiming to assess the influence of terrain factors on estimation accuracy.
(ii)
A clustering analysis of the prediction errors was conducted to identify spatial patterns and areas exhibiting systematic deviations, potentially indicating the influence of localized environmental conditions or limitations in the predictive modeling frameworks.
As part of the analysis of the relationship between geomorphological variables and prediction errors in soil particle size distribution, a linear regression analysis was performed. Within this framework, the regression coefficient was calculated to determine the direction and strength of the relationship between independent and dependent variables. In addition, the t-statistics were computed to assess the statistical significance of the regression coefficient. Finally, the p-value was obtained, representing the probability that the observed relationship occurred by chance. A significance threshold of p < 0.05 was adopted, with p < 0.05 considered indicative of strong statistical significance. The evaluation of these parameters enabled the investigation of whether geomorphological characteristics influence the prediction errors of soil physicochemical properties.
Beyond accuracy assessment, the spatial distribution and clustering of soil properties’ prediction error explored using the local spatial statistics index Getis-Ord Gi* index [48,49]. This index is frequently used in studies investigating spatial autocorrelation and clustering of soil properties [8,50,51,52]. Accordingly, to highlight the spatial variability of small or large differences between each dataset (ESDAC–ISRIC) and the data from the Soil Map of Greece, the point shapefile containing all datasets was imported into the ArcGIS Pro 3.2.0 software. The Hot Spot Analysis (Getis-Ord Gi*) tool was then applied to the error values for the two evaluated datasets. This tool identifies statistically significant spatial clusters of high values (hot spots) and low values (cold spots). It generates an output feature class with a z-score, p-value, and confidence level bin field (Gi_Bin) for each feature in the input dataset.
The Getis-Ord Gi* index was operationalized within the ArcGIS Pro 3.2.0 environment. Spatial relationships were defined by a K-Nearest Neighbors (KNN) conceptualization with K = 15 (i.e., each sample point’s 15 closest neighbors were included in the analysis). This choice of K = 15 reflects the heterogeneous soil sampling; it provides a consistent neighborhood size that captures local variability without over-smoothing sparse areas [53]. Because KNN fixes the number of neighbors, no fixed distance band was applied. For significance testing, no False Discovery Rate (FDR) correction was used: the reported z-scores and p-values thus reflect standard (uncorrected) significance levels [54]. We omitted FDR (which would otherwise tighten p-value thresholds to correct for multiple testing and spatial dependence) [54] in order to preserve sensitivity and straightforward interpretability of the hot-spot results.

2.3.7. Soil Texture Classification

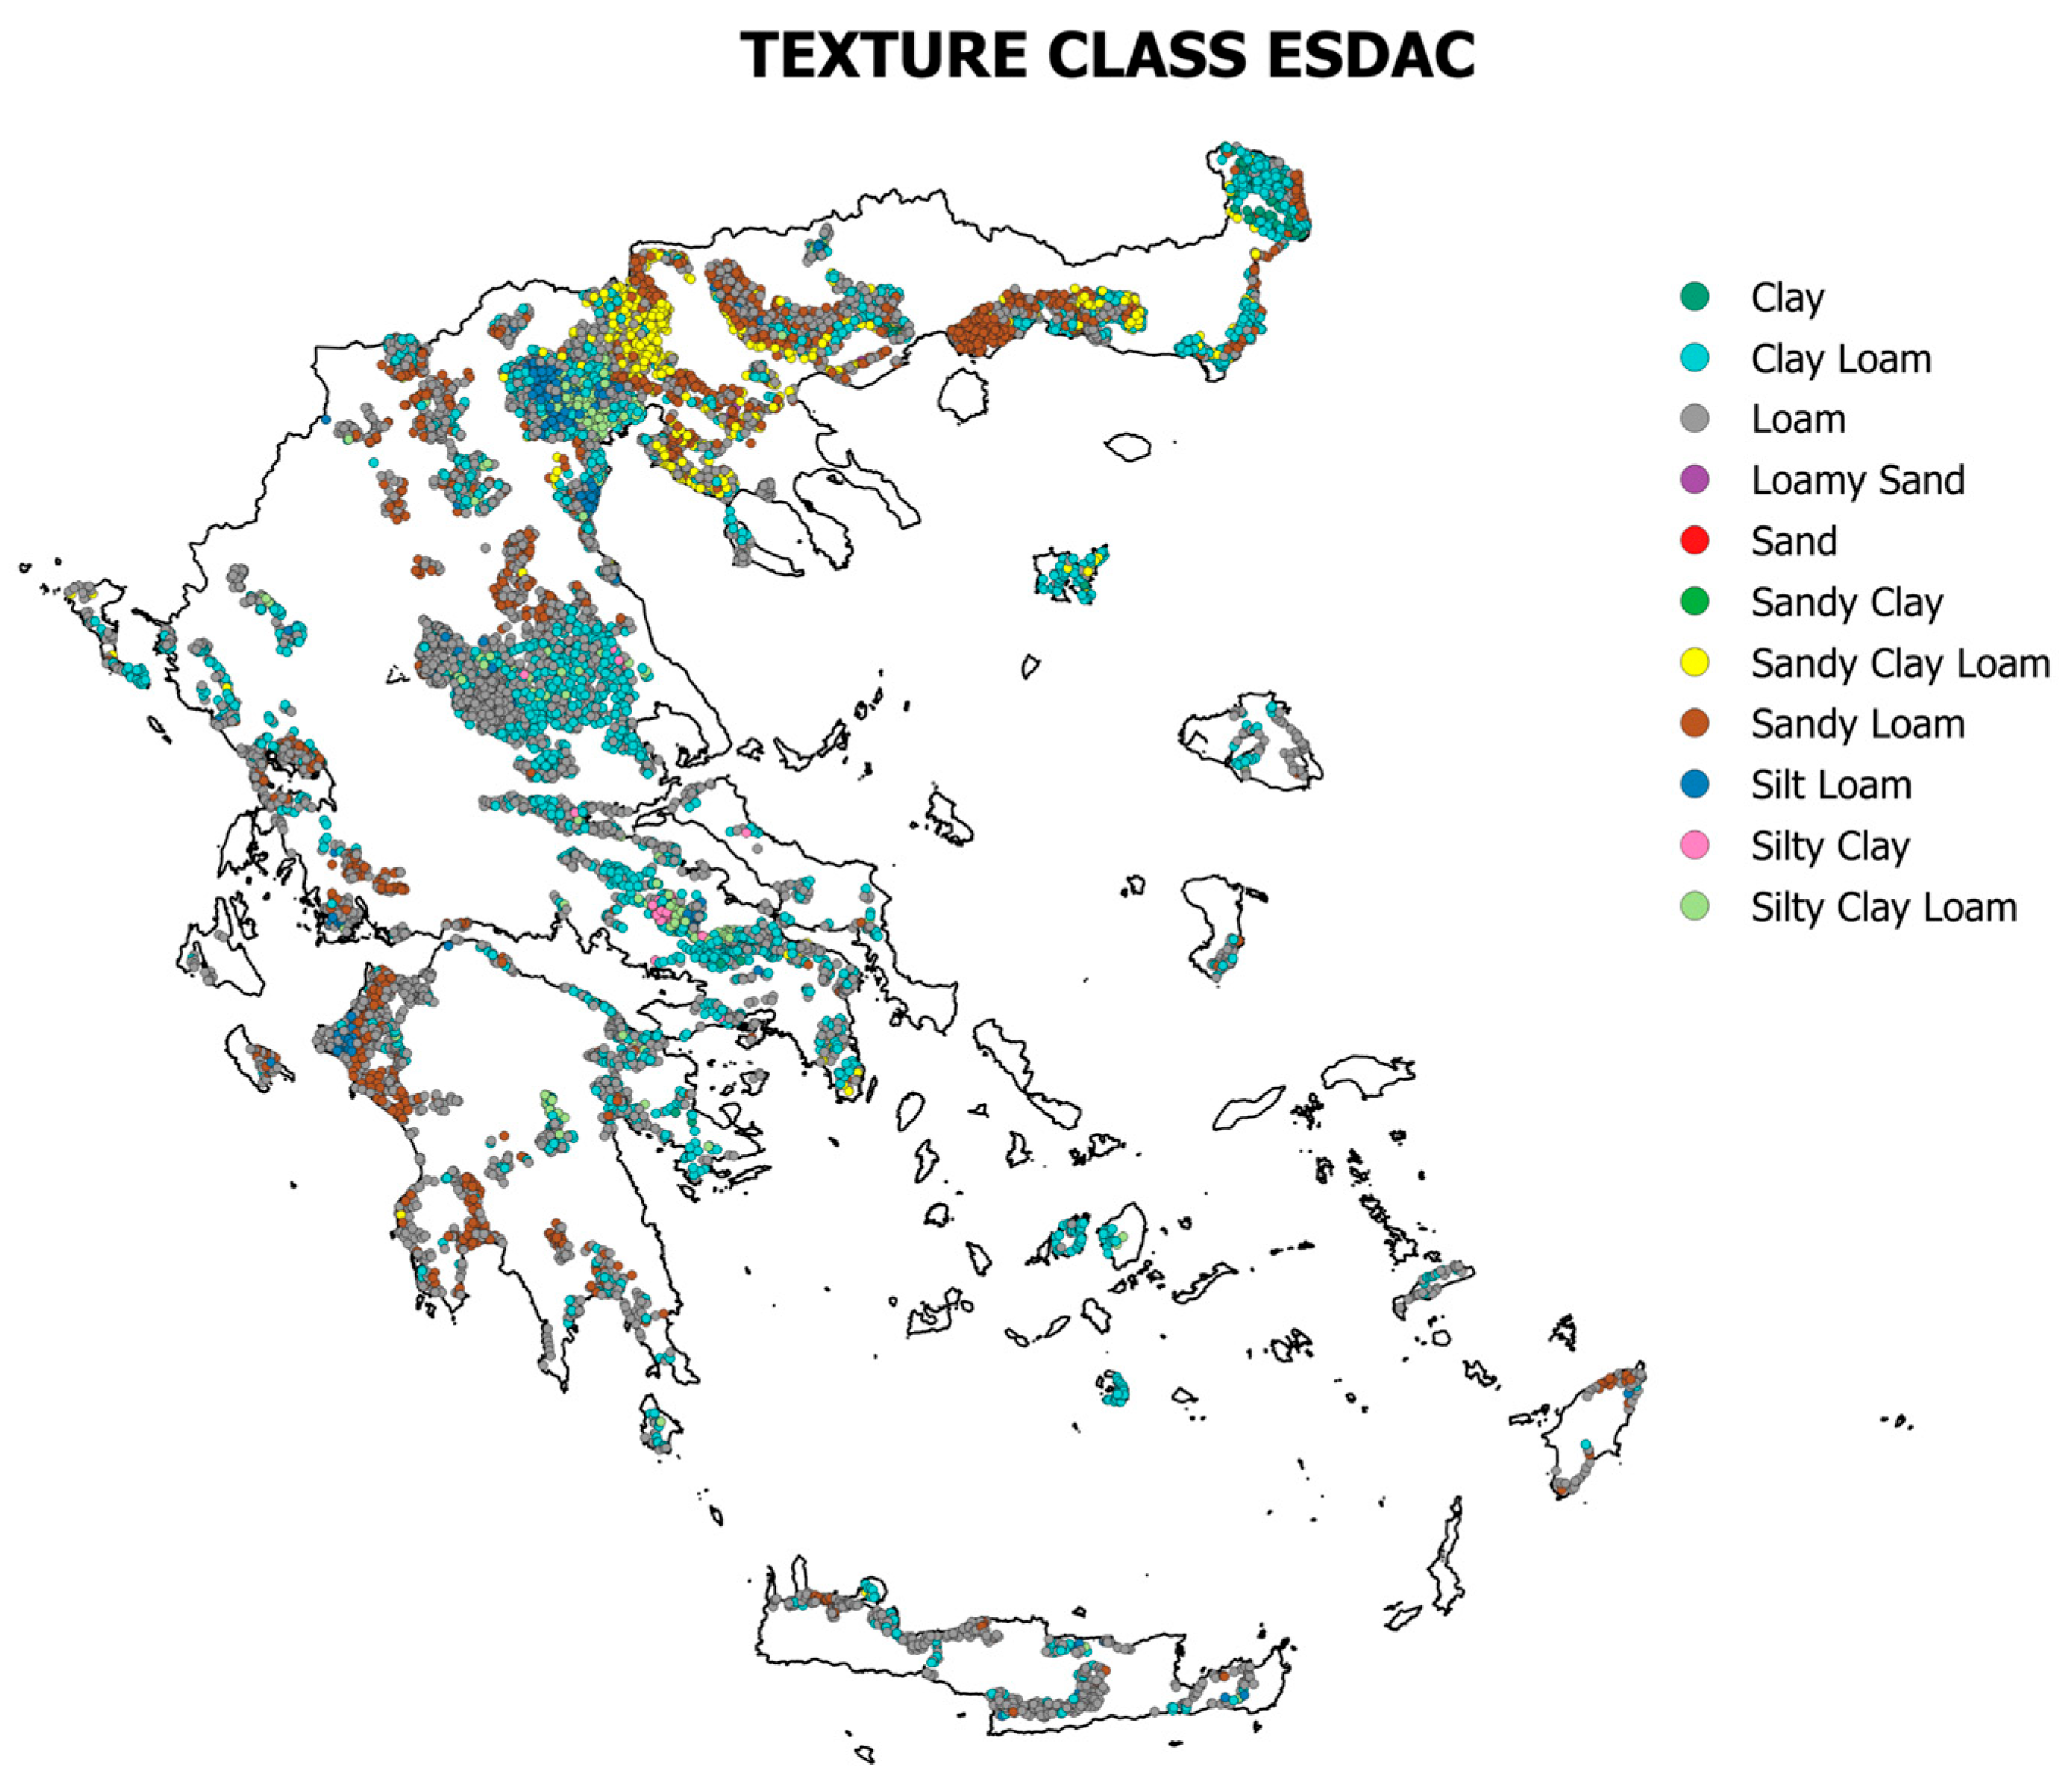
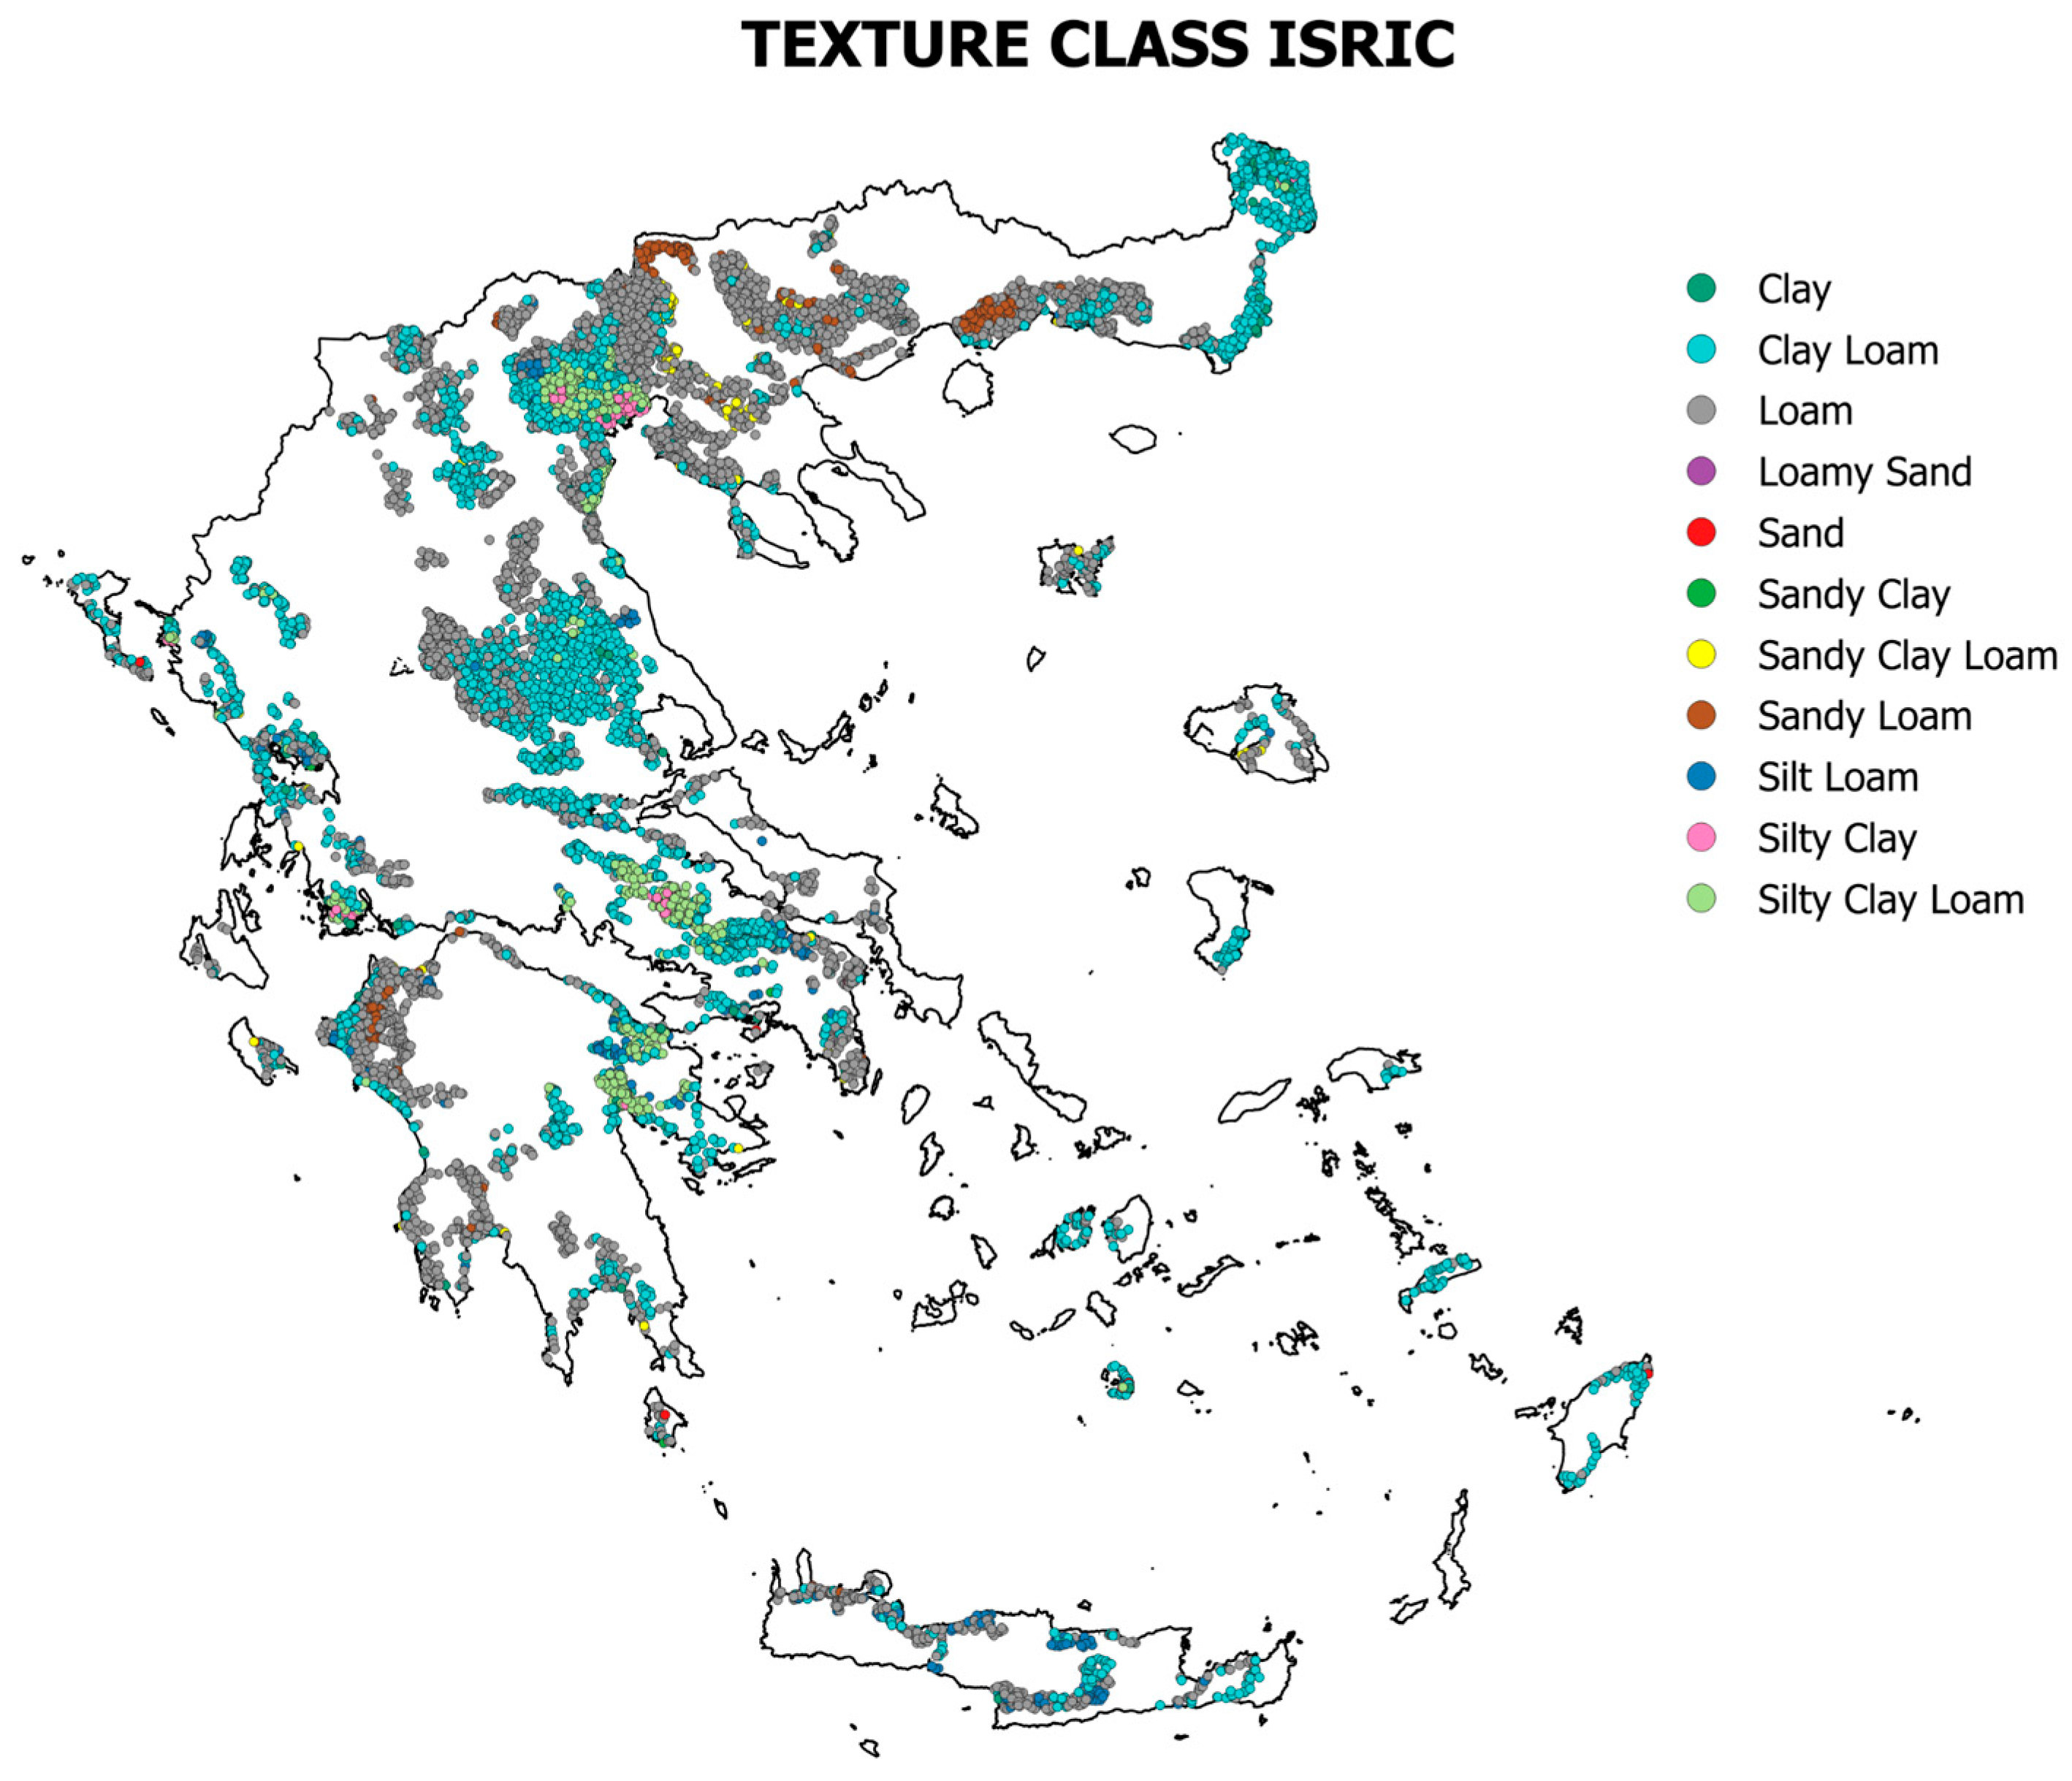
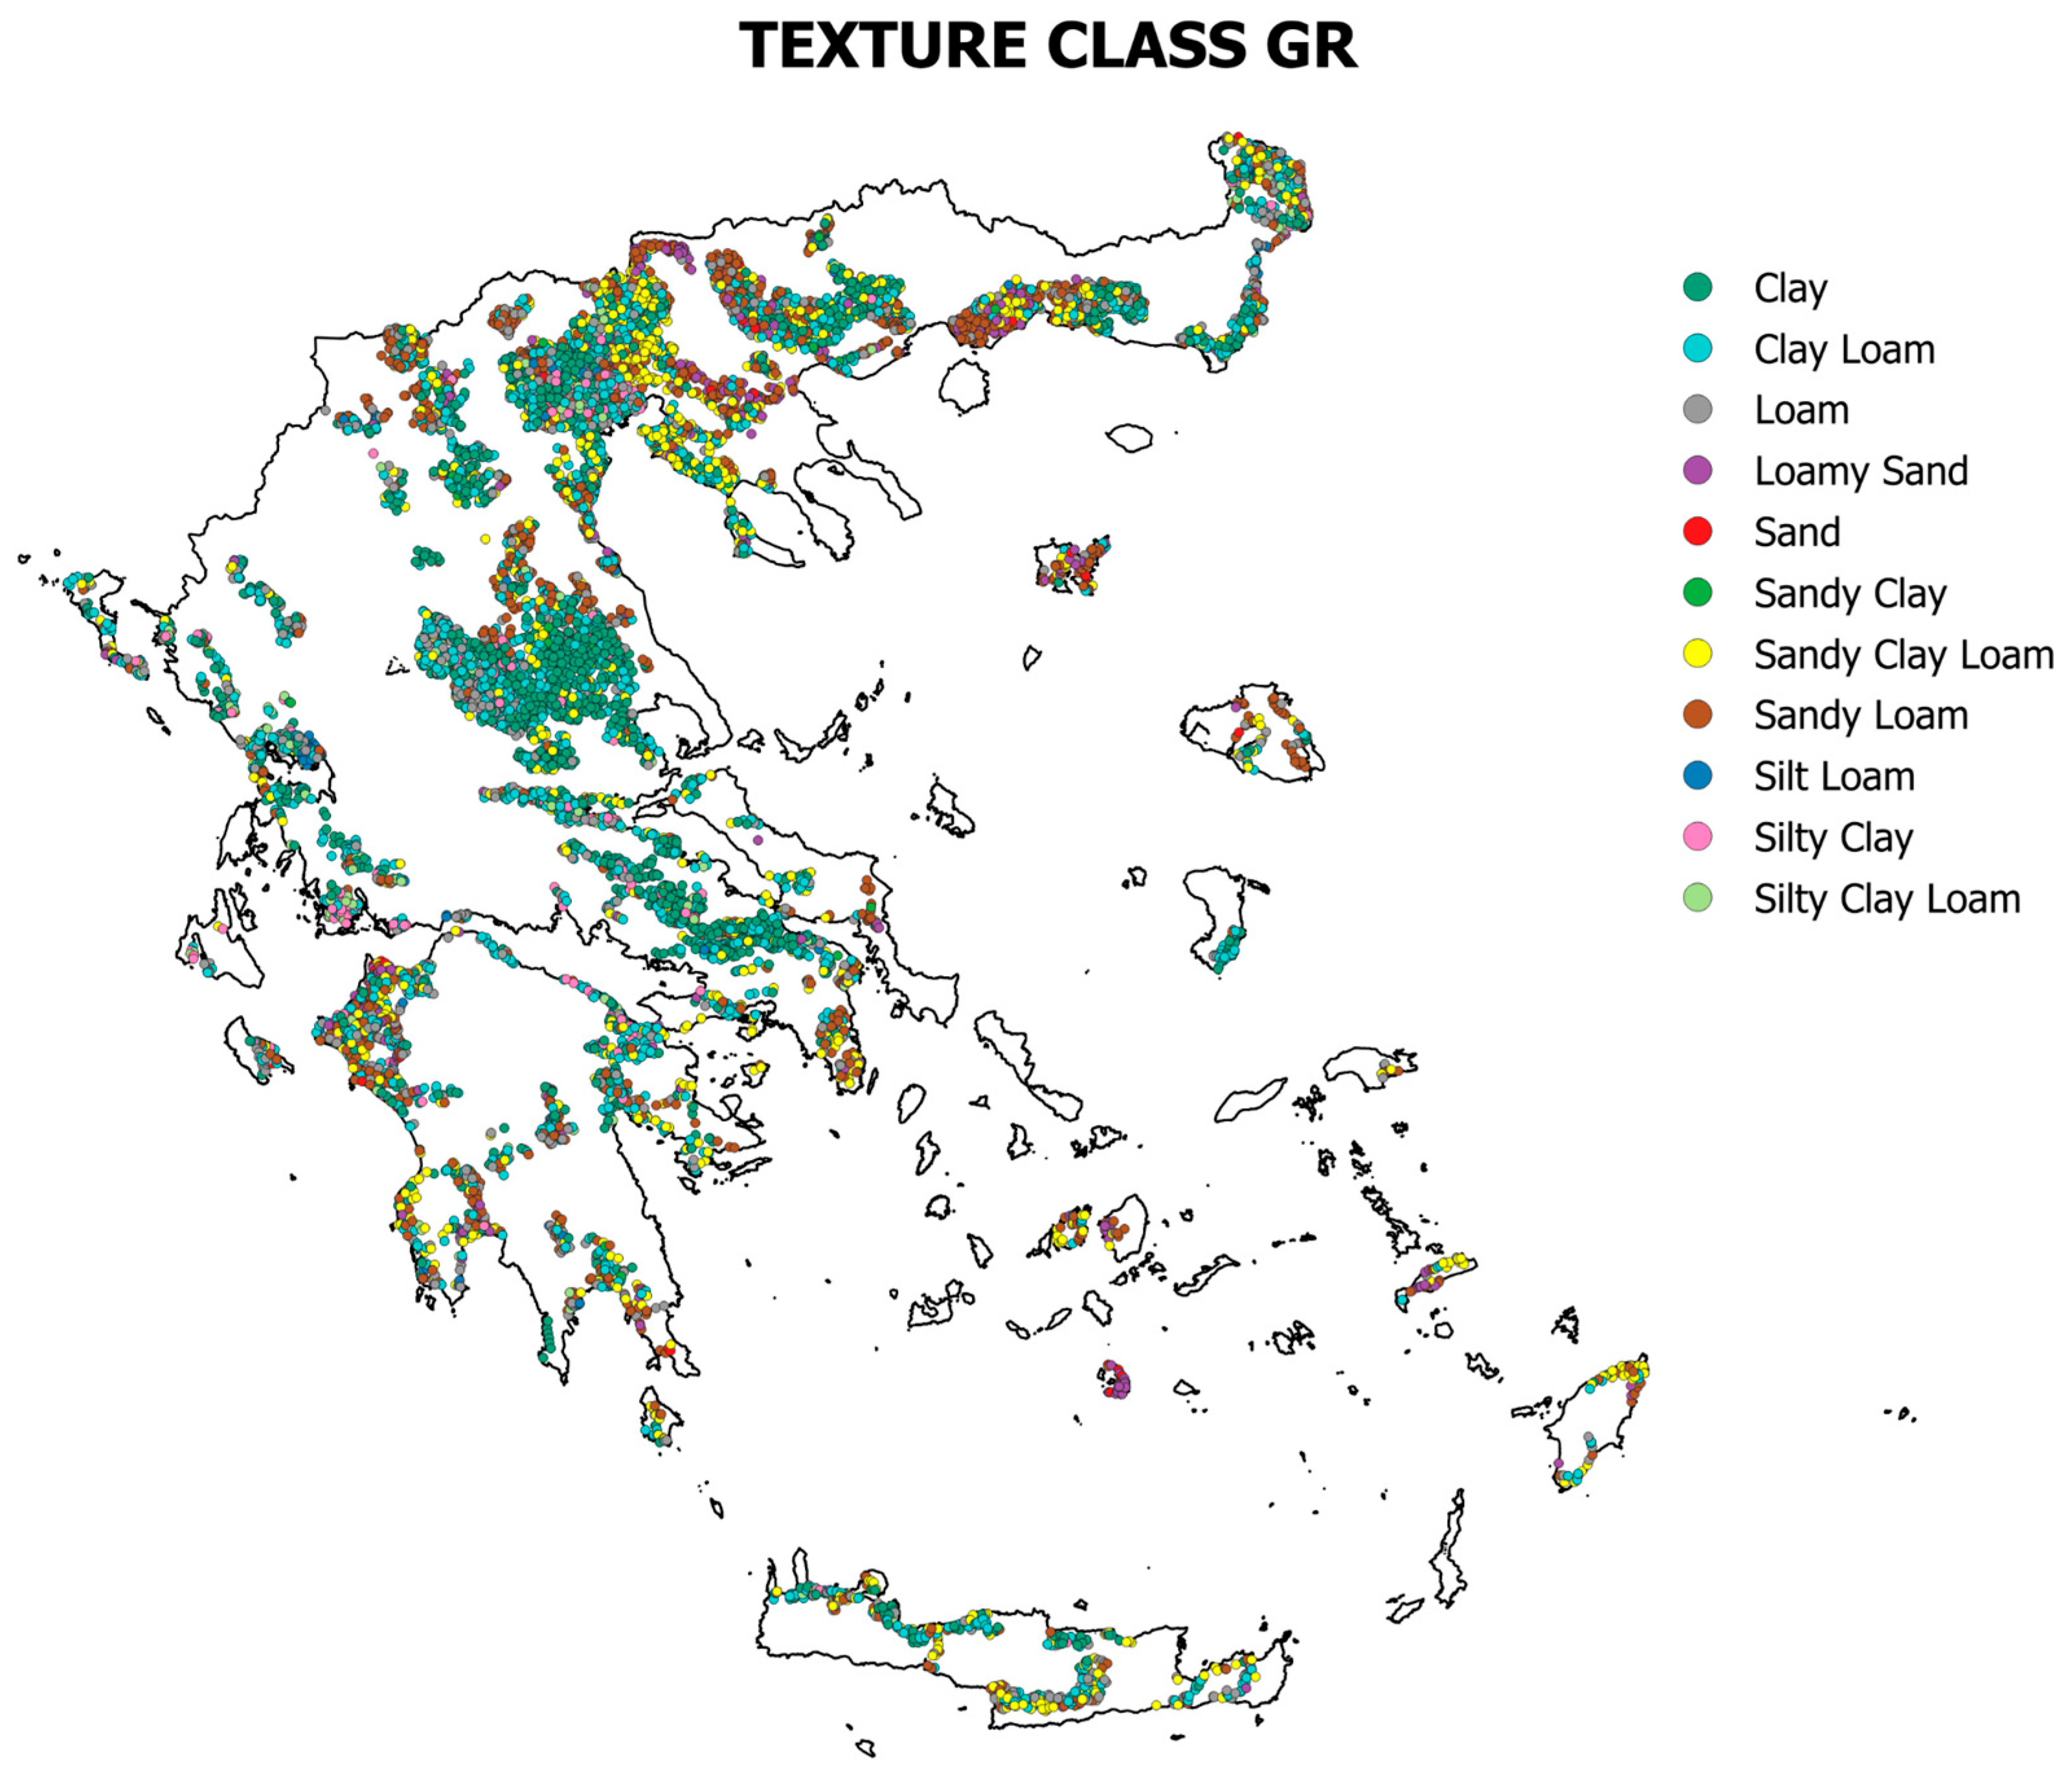
The next step in our research was to determine the soil texture class according to the USDA classification system at each point, based on the proportions of soil texture fractions in each of the three datasets. To achieve this, a semi-autonomous VBA algorithm was developed in MS Excel, assigning one of the 12 USDA soil texture classes to each of the 10,058 points, based on the ESDAC dataset, the ISRIC dataset, and the Soil Map of Greece data. Using this approach, three texture classes were assigned to each point (one for each dataset, the results are presented in Figure A10, Figure A11 and Figure A12).

2.3.8. Categorical Comparison of Soil Texture Classes

The accuracy of soil texture classes prediction by the international datasets the Producer’s Accuracy and User’s Accuracy metrics were used. These metrics are instrumental in assessing the performance of classification-based soil predictions. These metrics reflect both omission and commission errors, providing a more nuanced understanding of classification reliability.
This analysis was performed in the Crosstabulations test in SPSS software. The Crosstabulation analysis is employed to examine the relationship between two categorical variables, providing insights into the frequency distribution of their category combinations. In the present study, the test was applied twice:
(a) Between the variables “Texture ISRIC”-“Texture GR”, and (b) between the variables “Texture ESDAC”-“Texture GR”. In each case, the first variable represents the soil texture classification derived from a global dataset, while the second corresponds to the same category as defined by the Greek dataset (ground truth data).
The outcome of the procedure is a contingency table displaying the frequency of each category combination, accompanied by statistical measures that assess the association between the two datasets. This enables the evaluation of agreement between the two sources and supports conclusions regarding the accuracy and compatibility of soil texture classifications.
Subsequently, true positives (TPs), false negatives (FNs) and false positives (FPs) were identified to evaluate the predictive performance of the international datasets in estimating the soil texture classes of the Greek dataset. True Positive (TP) represents cases in which the model correctly predicts the presence of a category. In other words, the predicted outcome is positive, and the actual condition is also positive. True Negative (TN) represents cases in which the model correctly predicts the absence of a condition or category. The predicted outcome is negative, and the actual condition is likewise negative. False Positive (FP) represents cases in which the model incorrectly predicts the presence of a condition. The prediction is positive, but the actual condition is negative. Following this, in order to evaluate the predictive performance of the two international soil databases in correctly classifying soil texture classes, the following accuracy metrics were employed: User’s Accuracy, Producer’s Accuracy, and Overall Accuracy [55,56,57].
Producer’s Accuracy reflects the proportion of correctly predicted observations for each class relative to the total number of actual observations in that class. It is calculated as:
Producer s   Accuracy = T r u e   P o s ι t i v e s T r u e   P o s i t i v e s + F a l s e   N e g a t i v e s
User’s Accuracy represents the proportion of correctly predicted observations within a class relative to the total number of predictions made for that class. It is given by:
User s   Accuracy = T r u e   P o s i t i v e s T r u e   P o s ι t i v e s + F a l s e   P o s i t i v e s
Overall Accuracy refers to the total proportion of correctly classified instances across all classes, and is defined as:
Overall   Accuracy = Correct   Predictions Total   Samples
These accuracy metrics are widely used in land cover classification and digital soil mapping to assess classification reliability and performance.

2.3.9. Targeted Analysis Based on Parent Material

In addition to methodological approaches, a growing body of literature emphasizes the influence of parent material on the texture and composition of soils [26,58,59]. Soils formed on clay-rich deposits typically exhibit fine textures due to the sedimentary environment in which these materials accumulate—low-energy settings like lakebeds or floodplains that allow for deposition of fine particles [60]. Conversely, sandy soils often develop on dunes, where aeolian processes favor the accumulation of coarse materials, resulting in highly permeable and well-drained soil profiles [61]. Lacustrine deposits, due to their origin in calm aquatic environments, are also characterized by high clay content, leading to soils with limited drainage and increased water retention [62].
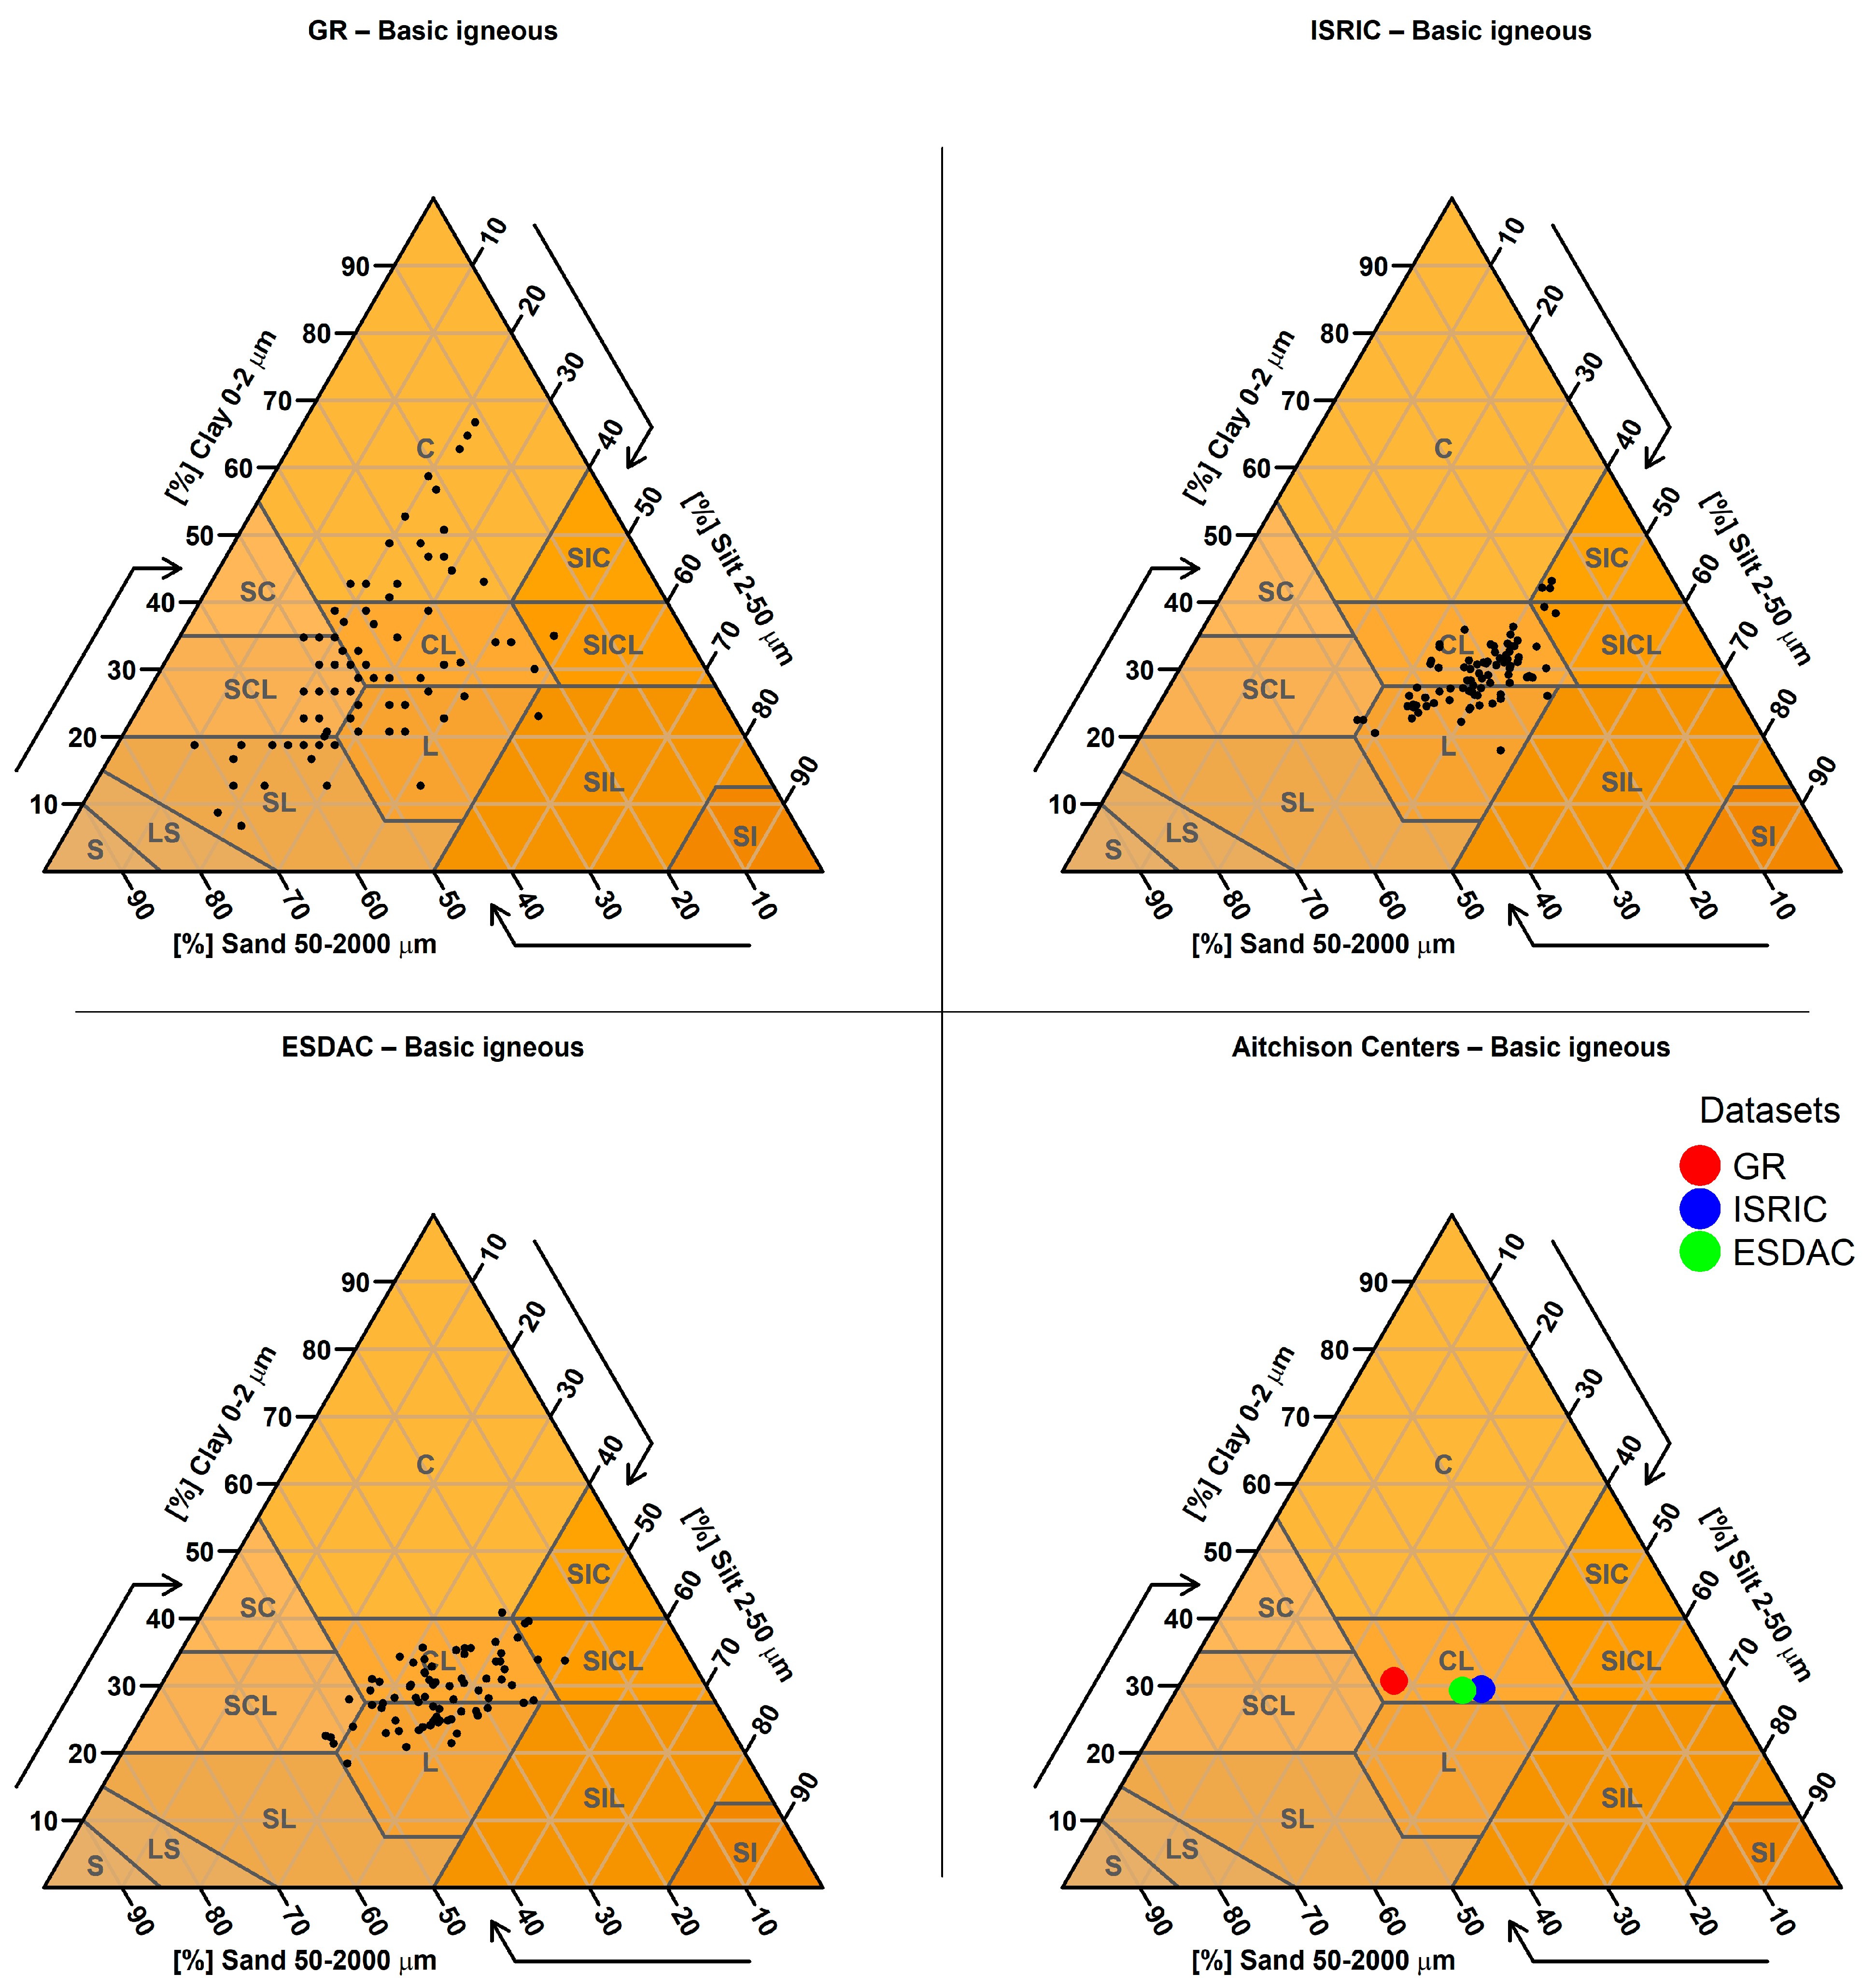
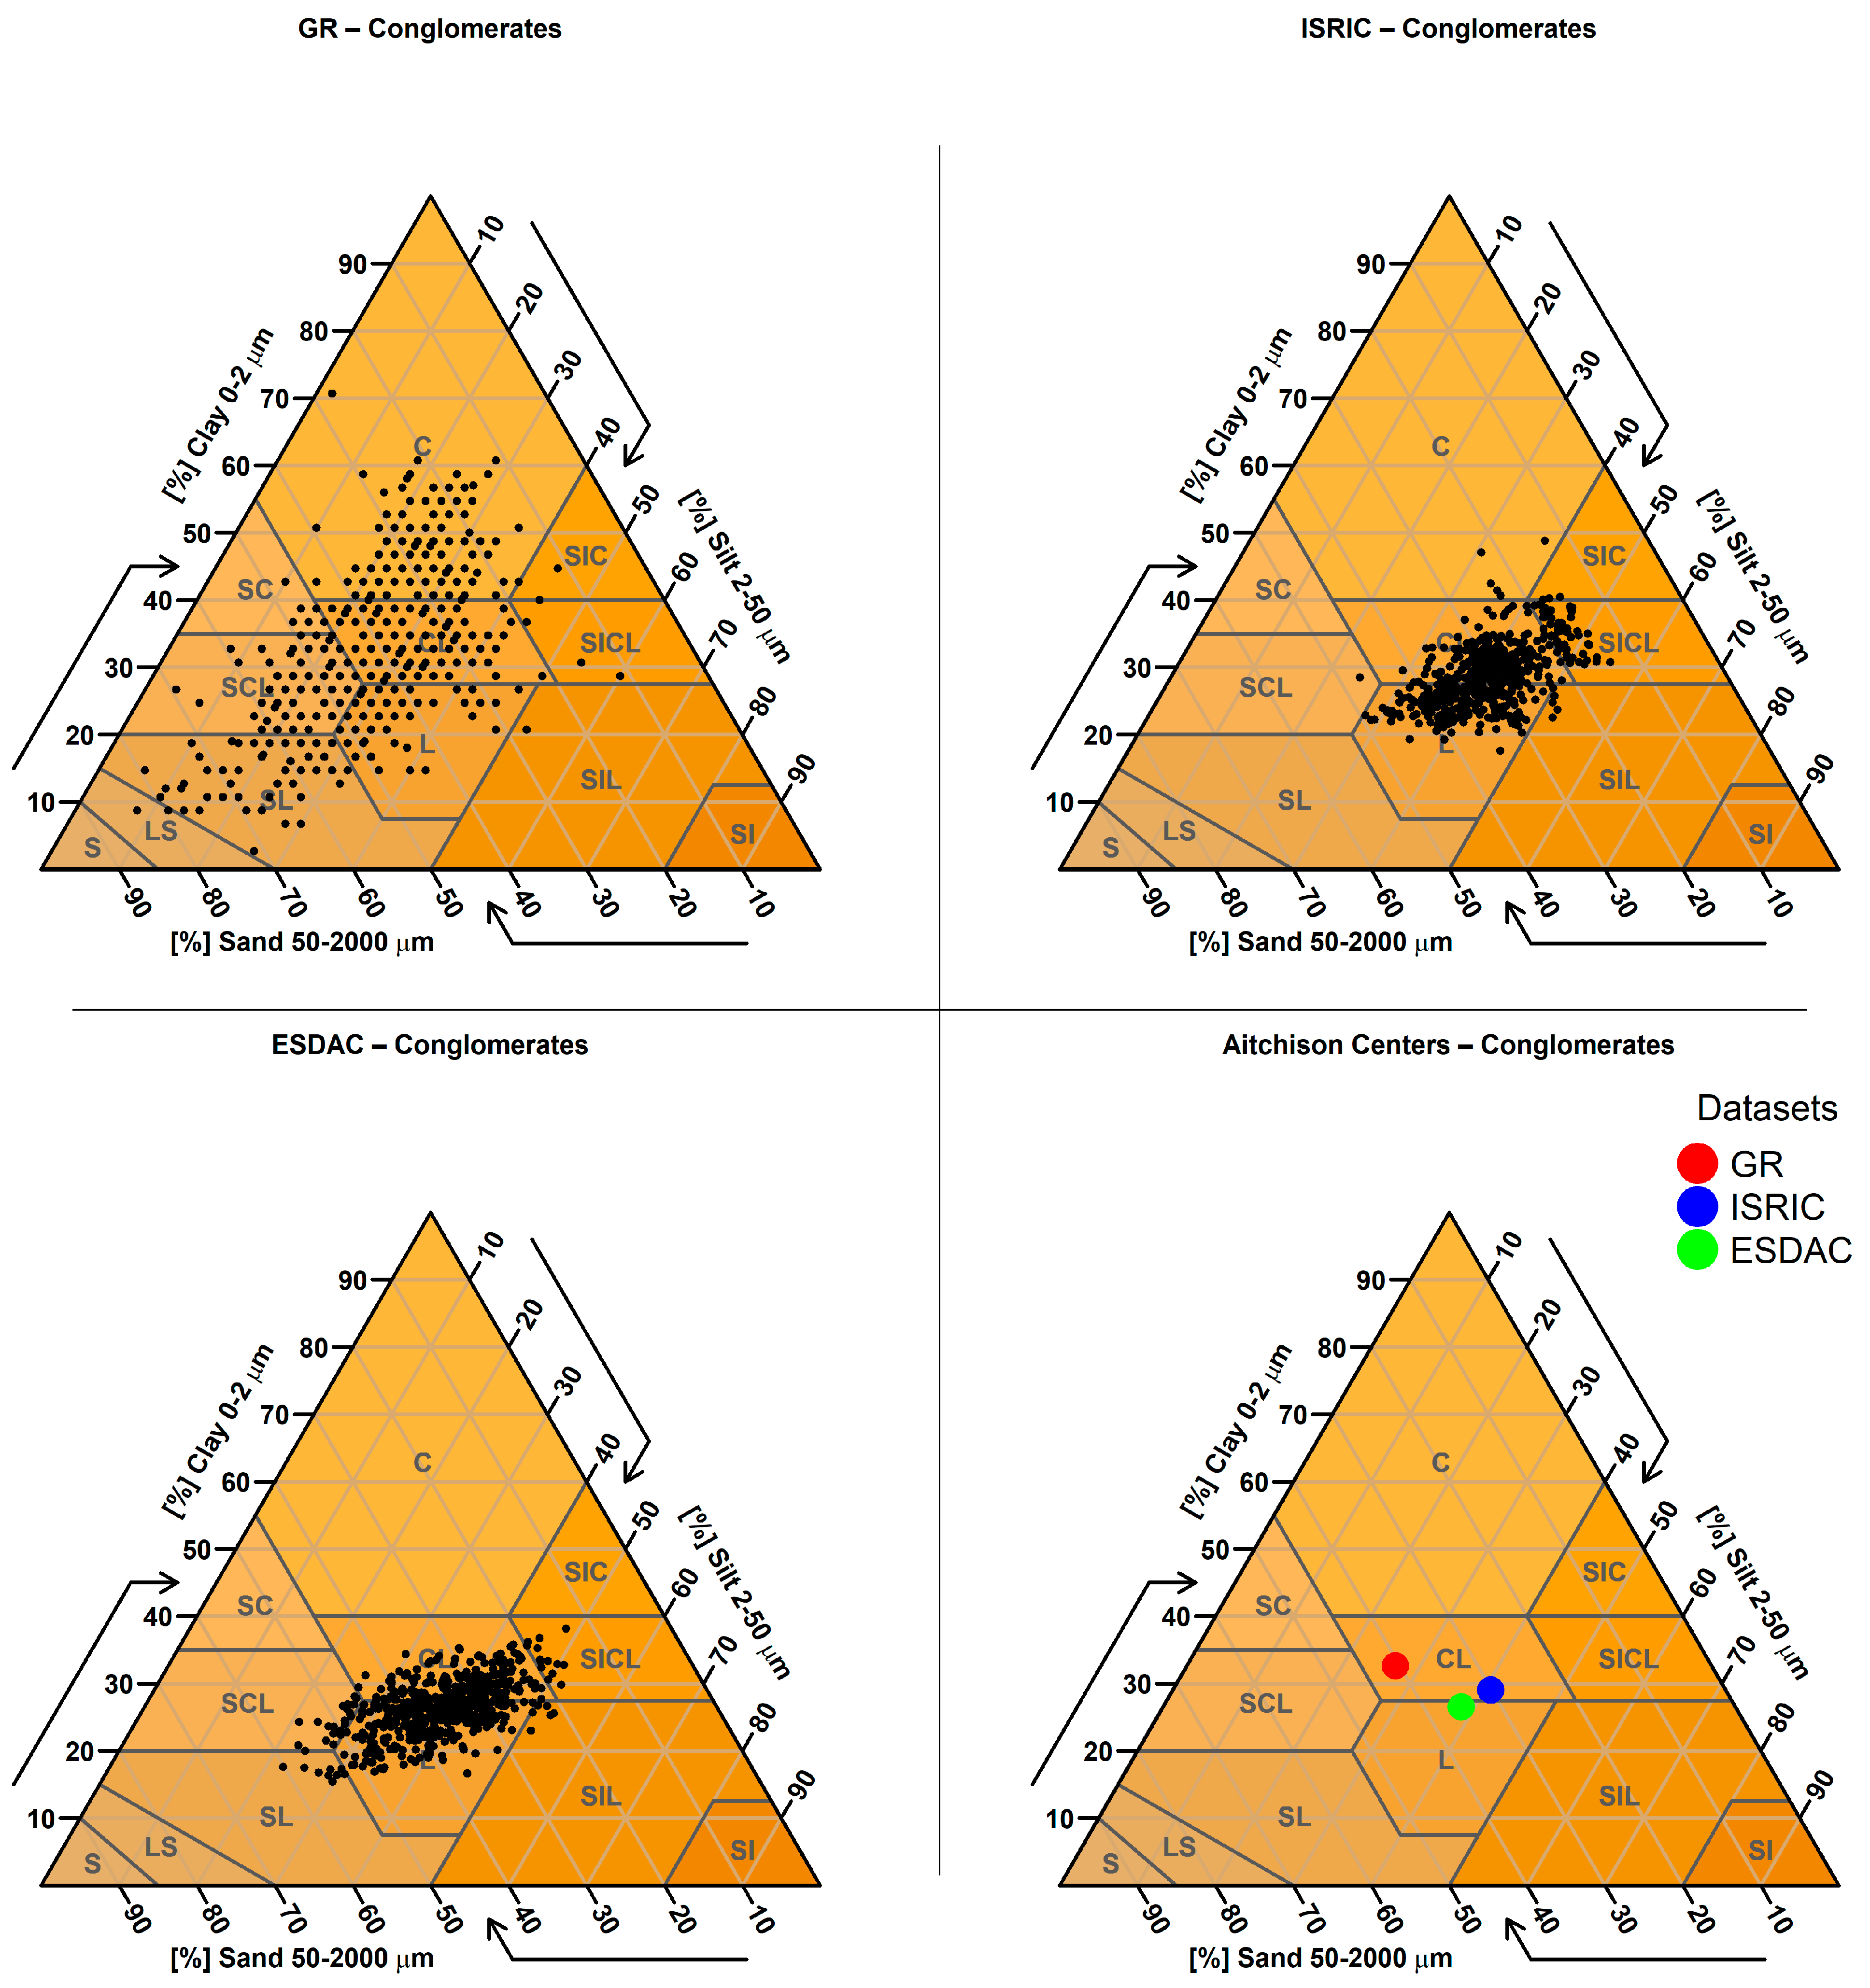
Conglomerate-based soils tend to contain more sand than clay, as these sedimentary rocks are composed mainly of gravel and sand, which dominate the resulting soil upon weathering. In contrast, basic igneous rocks such as basalt or gabbro often produce soils with higher clay content. This is due to the mineral composition of these rocks, rich in iron- and magnesium-bearing minerals like olivine and pyroxene, which weather into clay minerals such as smectite. Studies from various regions (e.g., Turkey, Nigeria) confirm the clay-enriched textures of soils derived from such parent materials [59,63,64]. These relationships between geology and soil properties are critical for refining digital soil mapping, especially when adapting global models to specific geological and climatic contexts such as those in Greece.
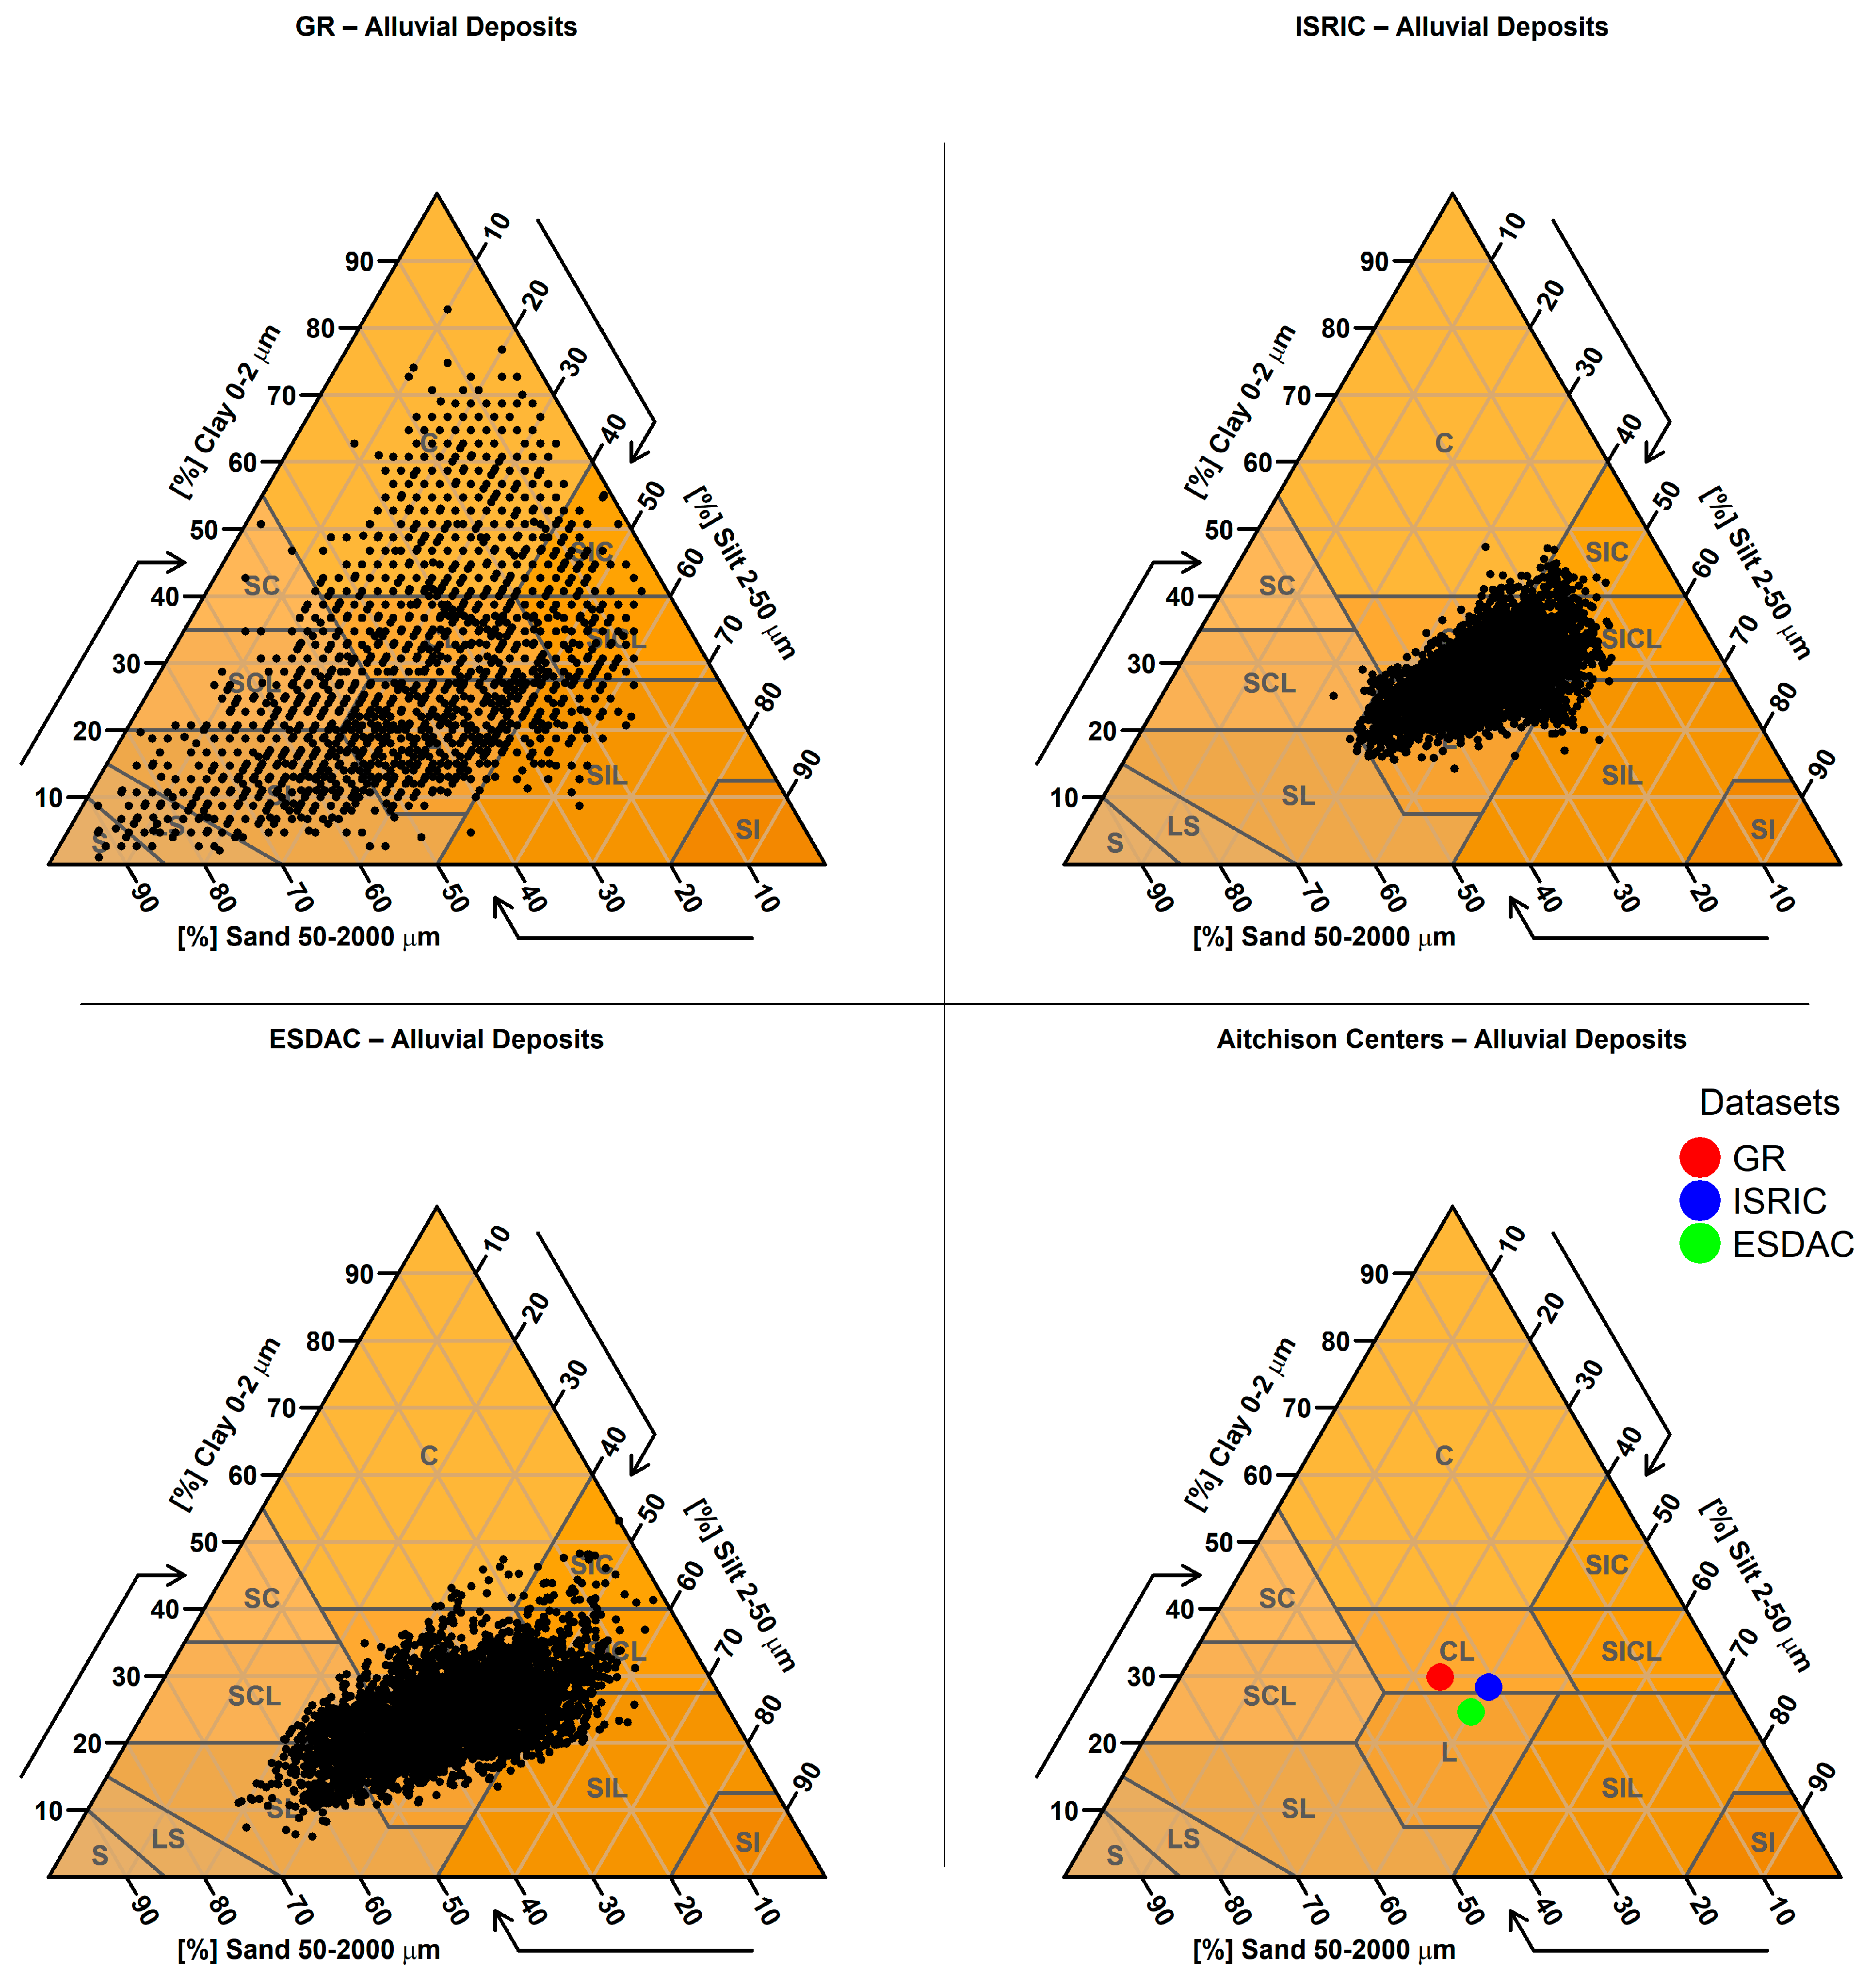
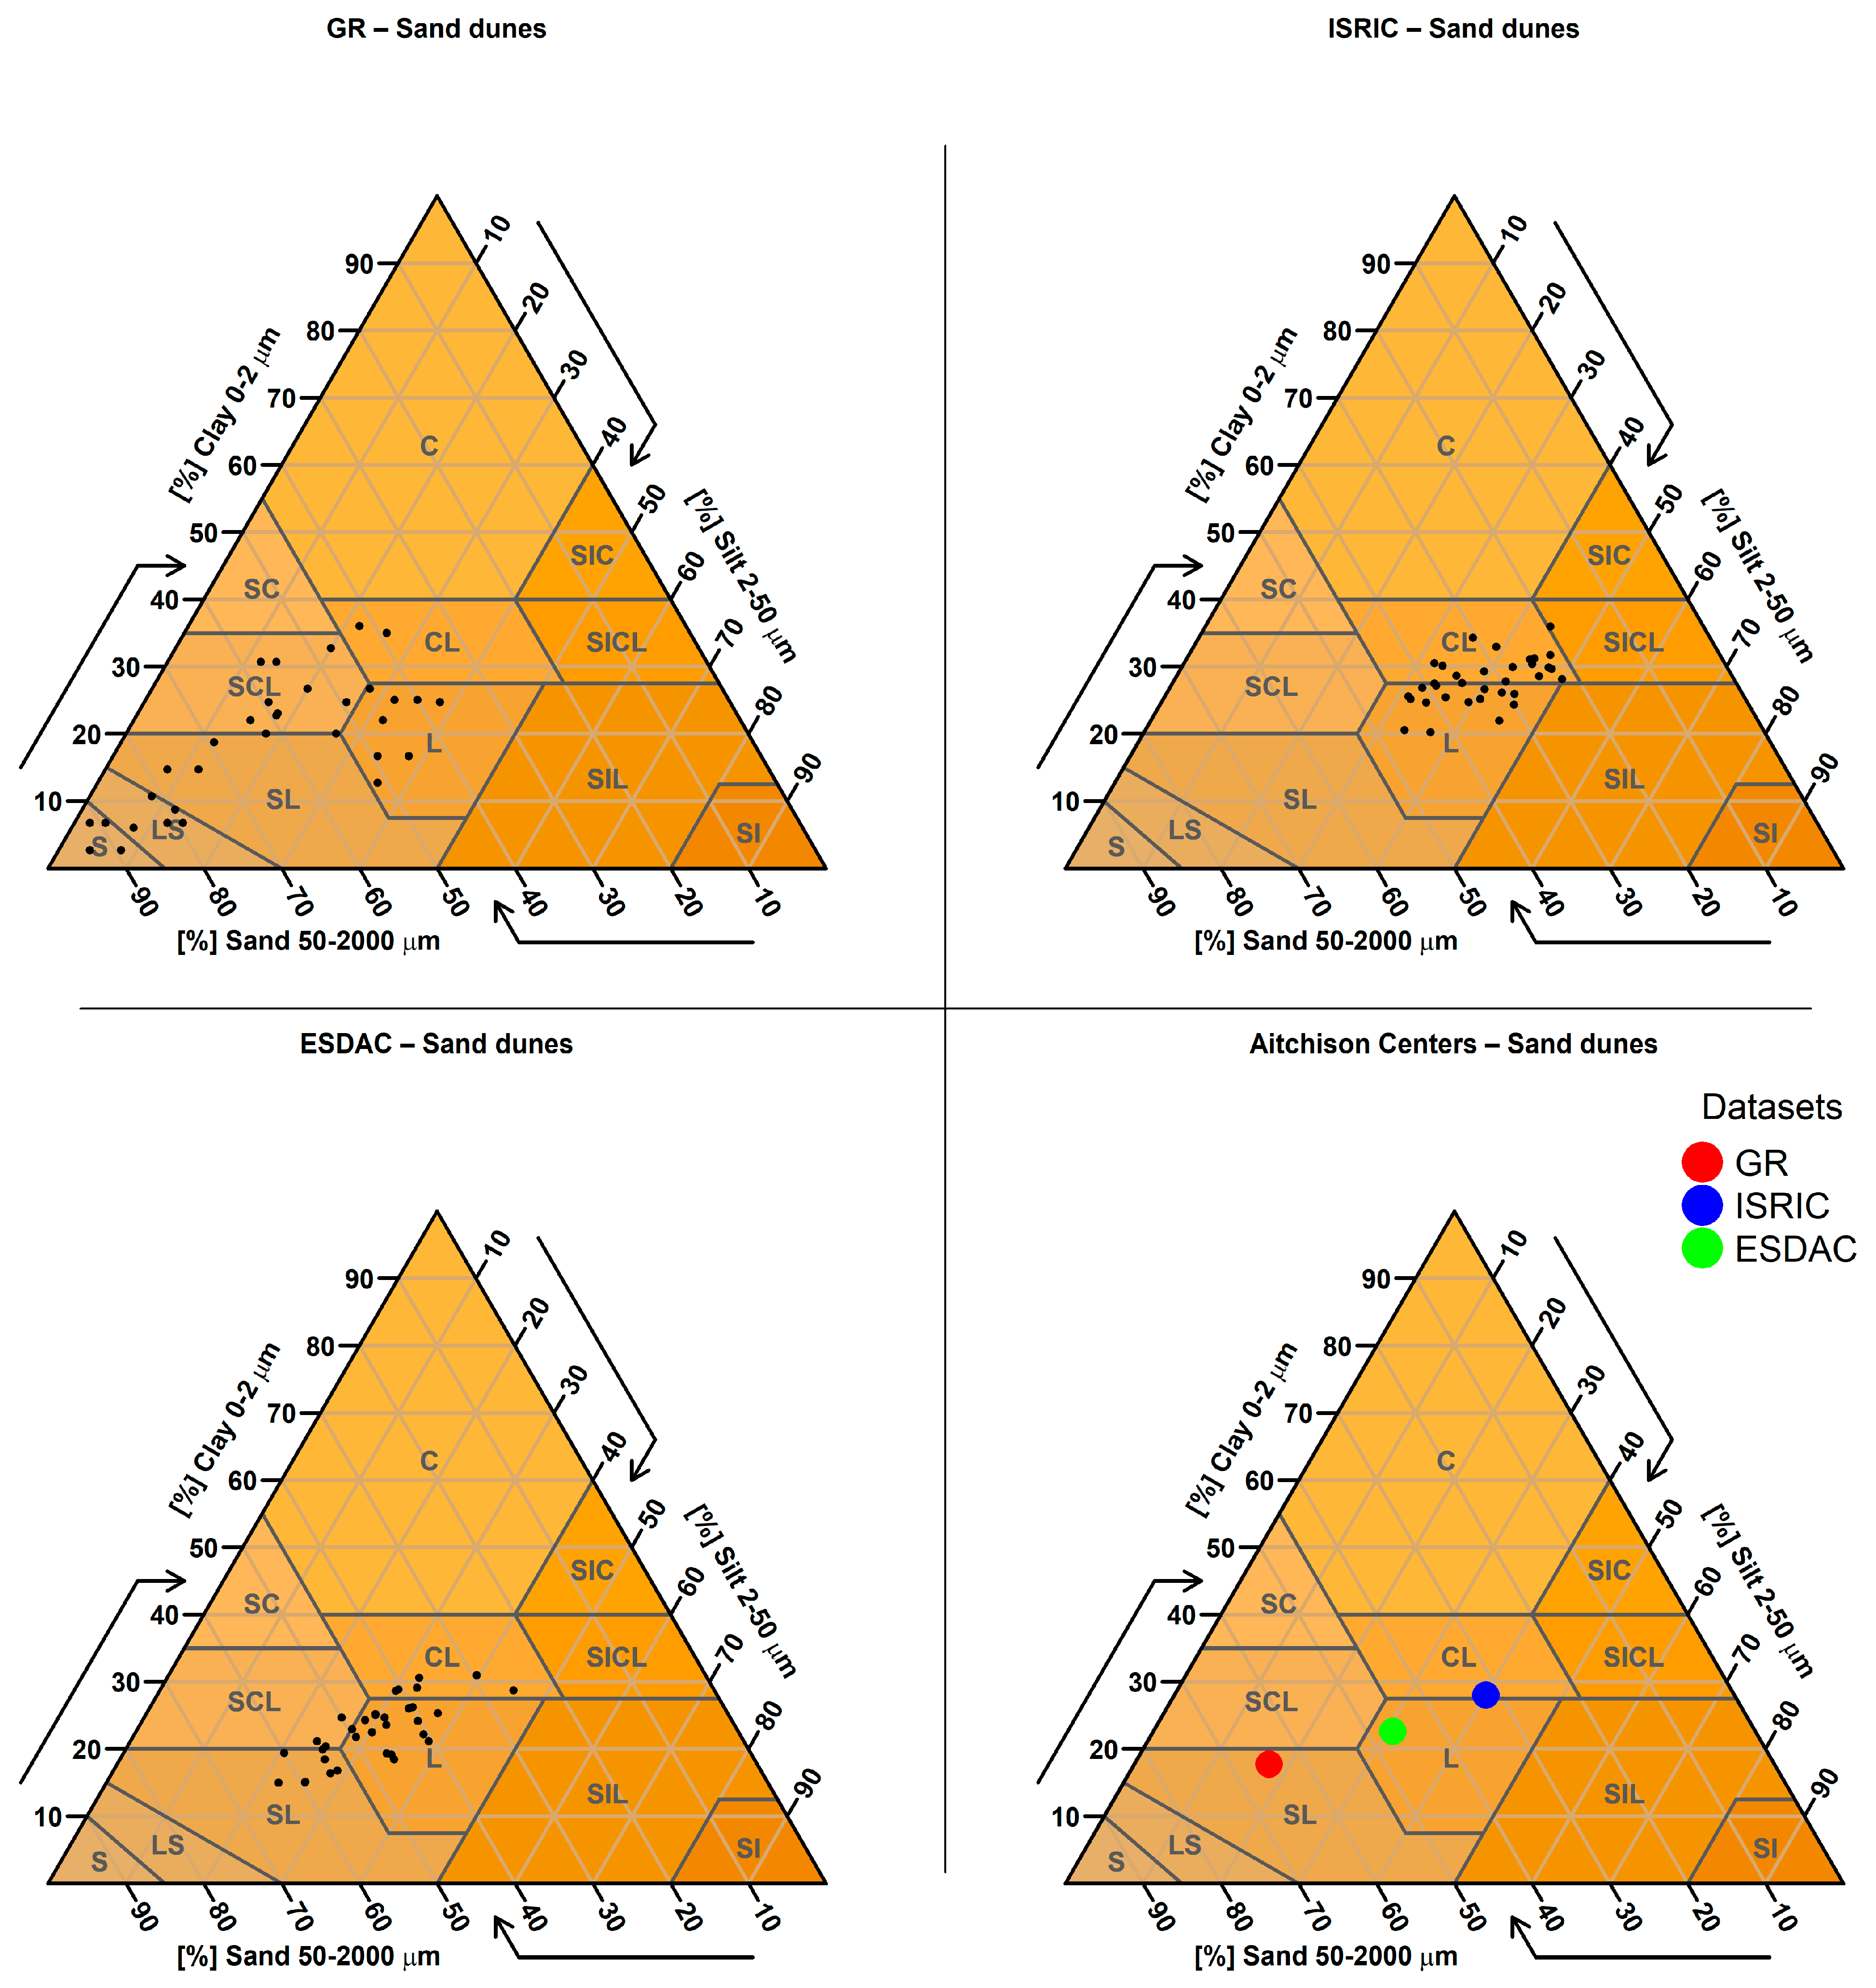
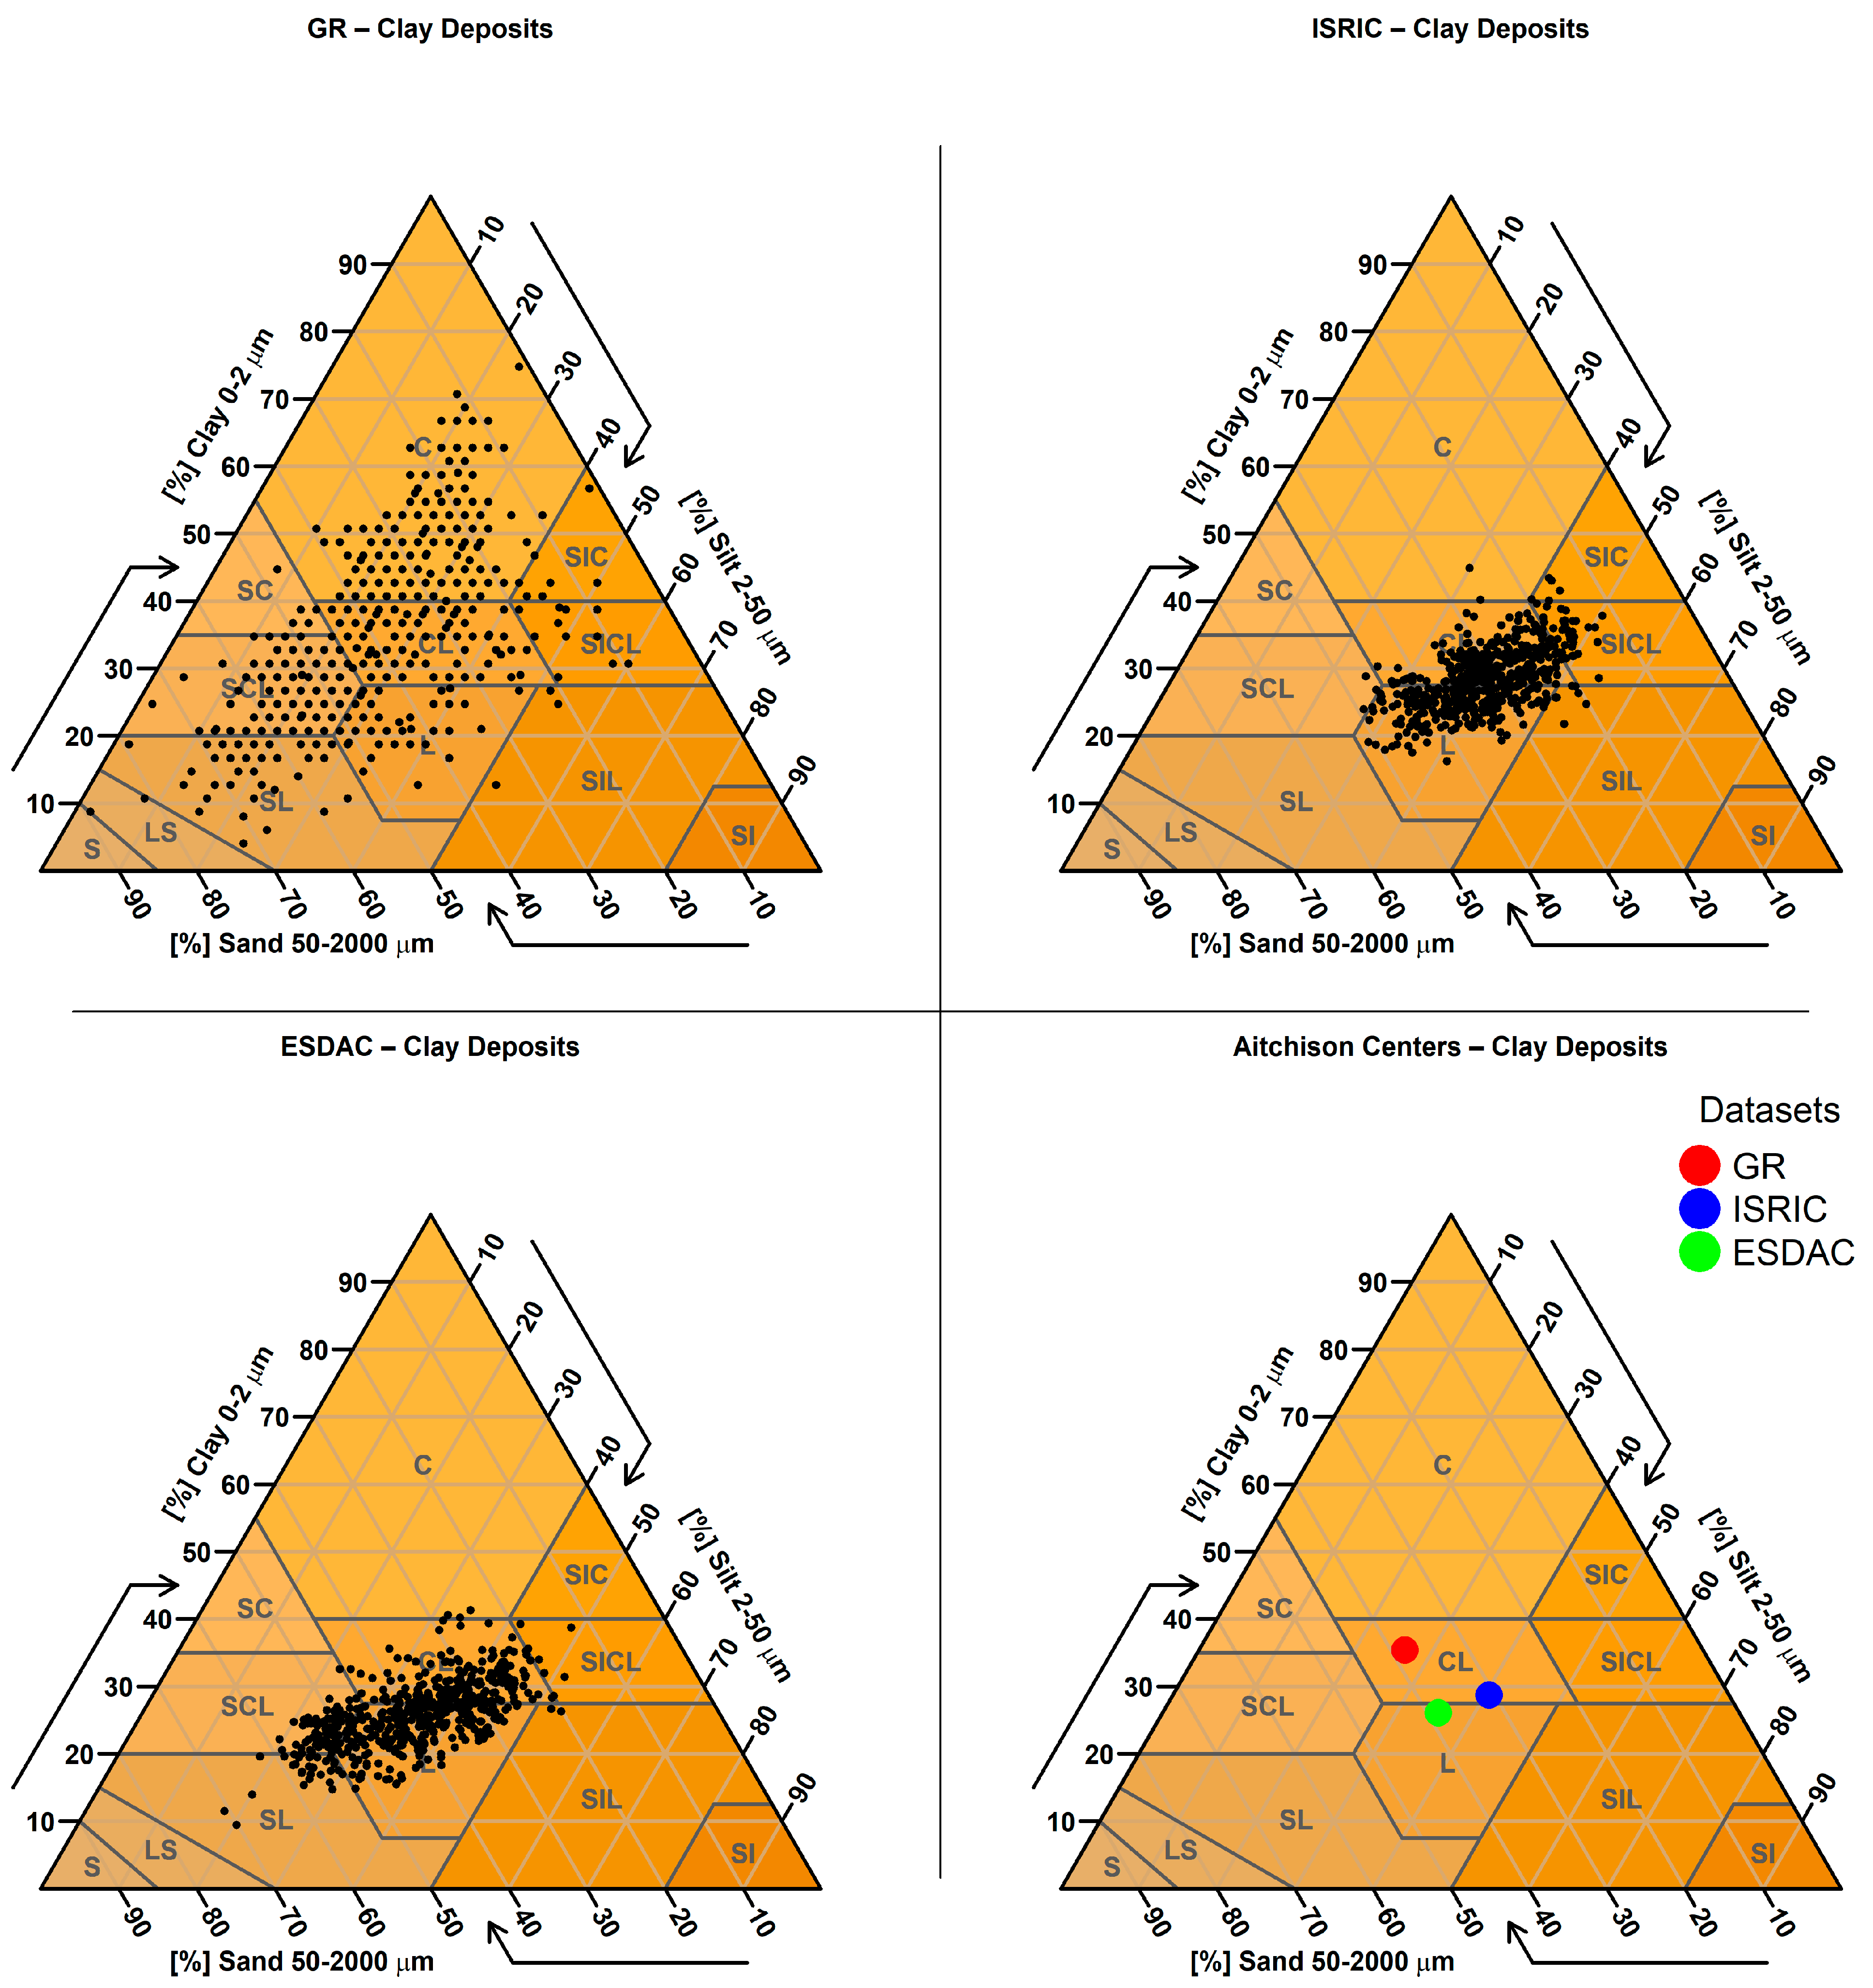
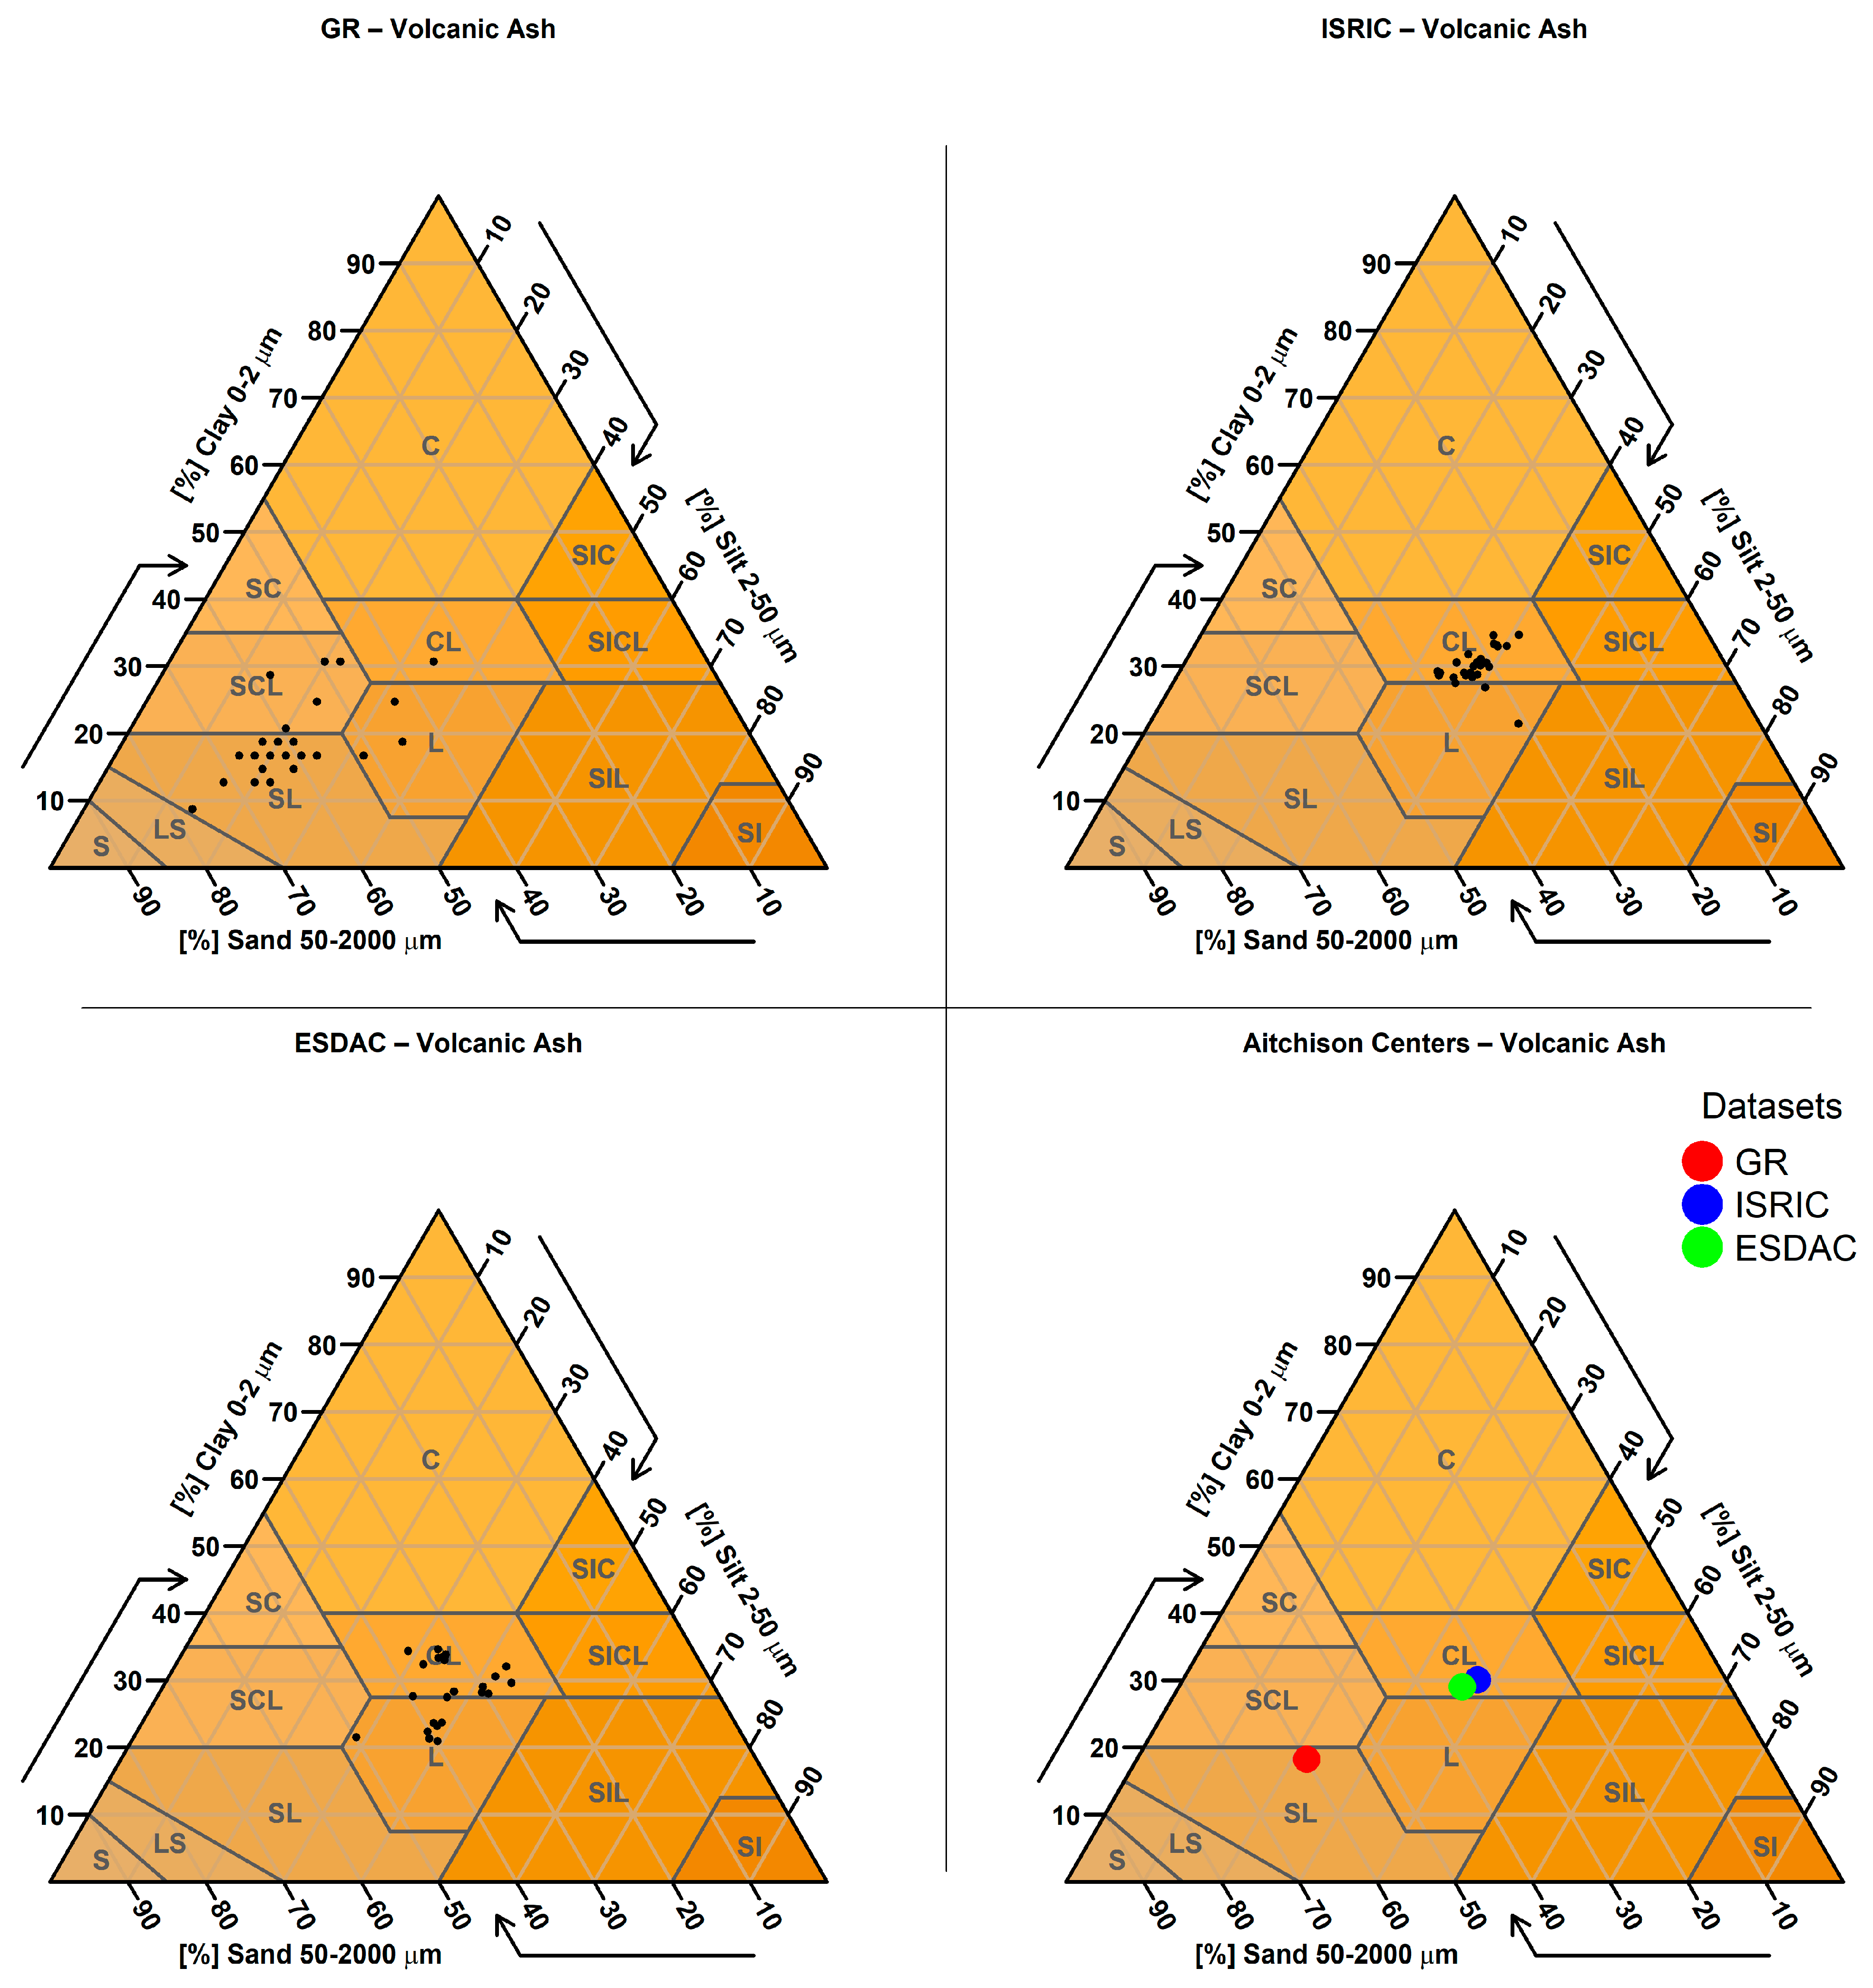
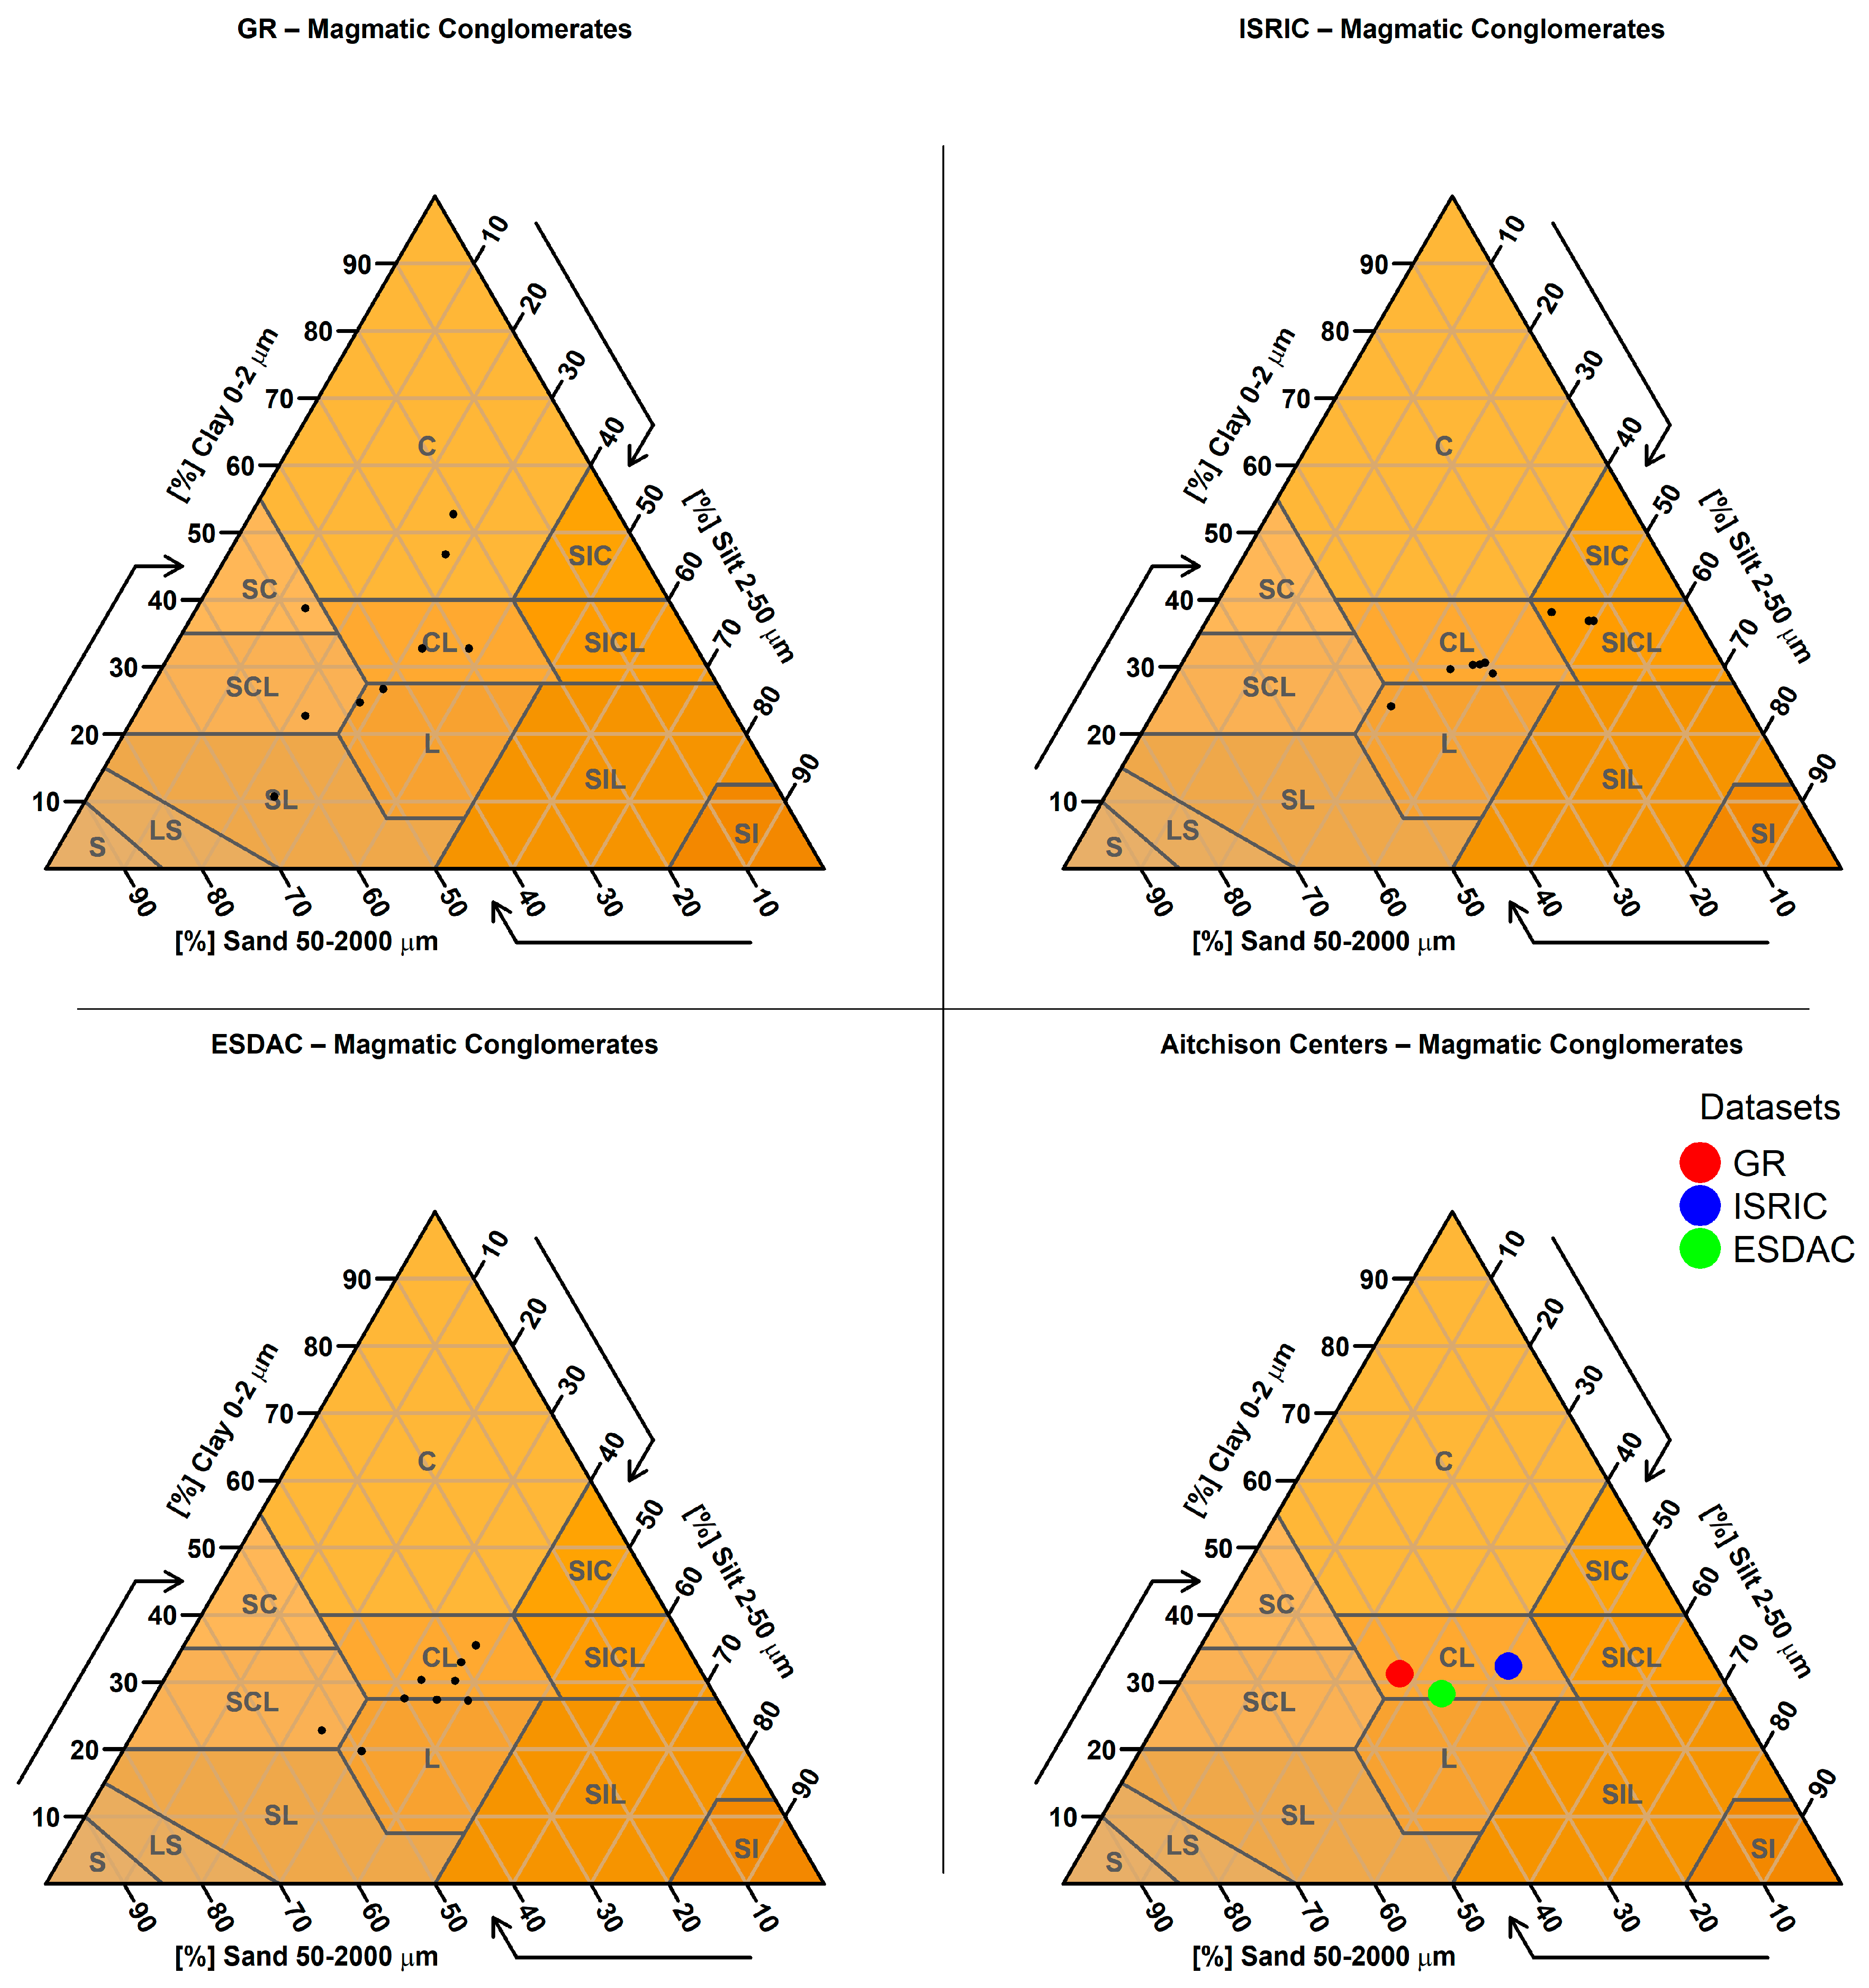
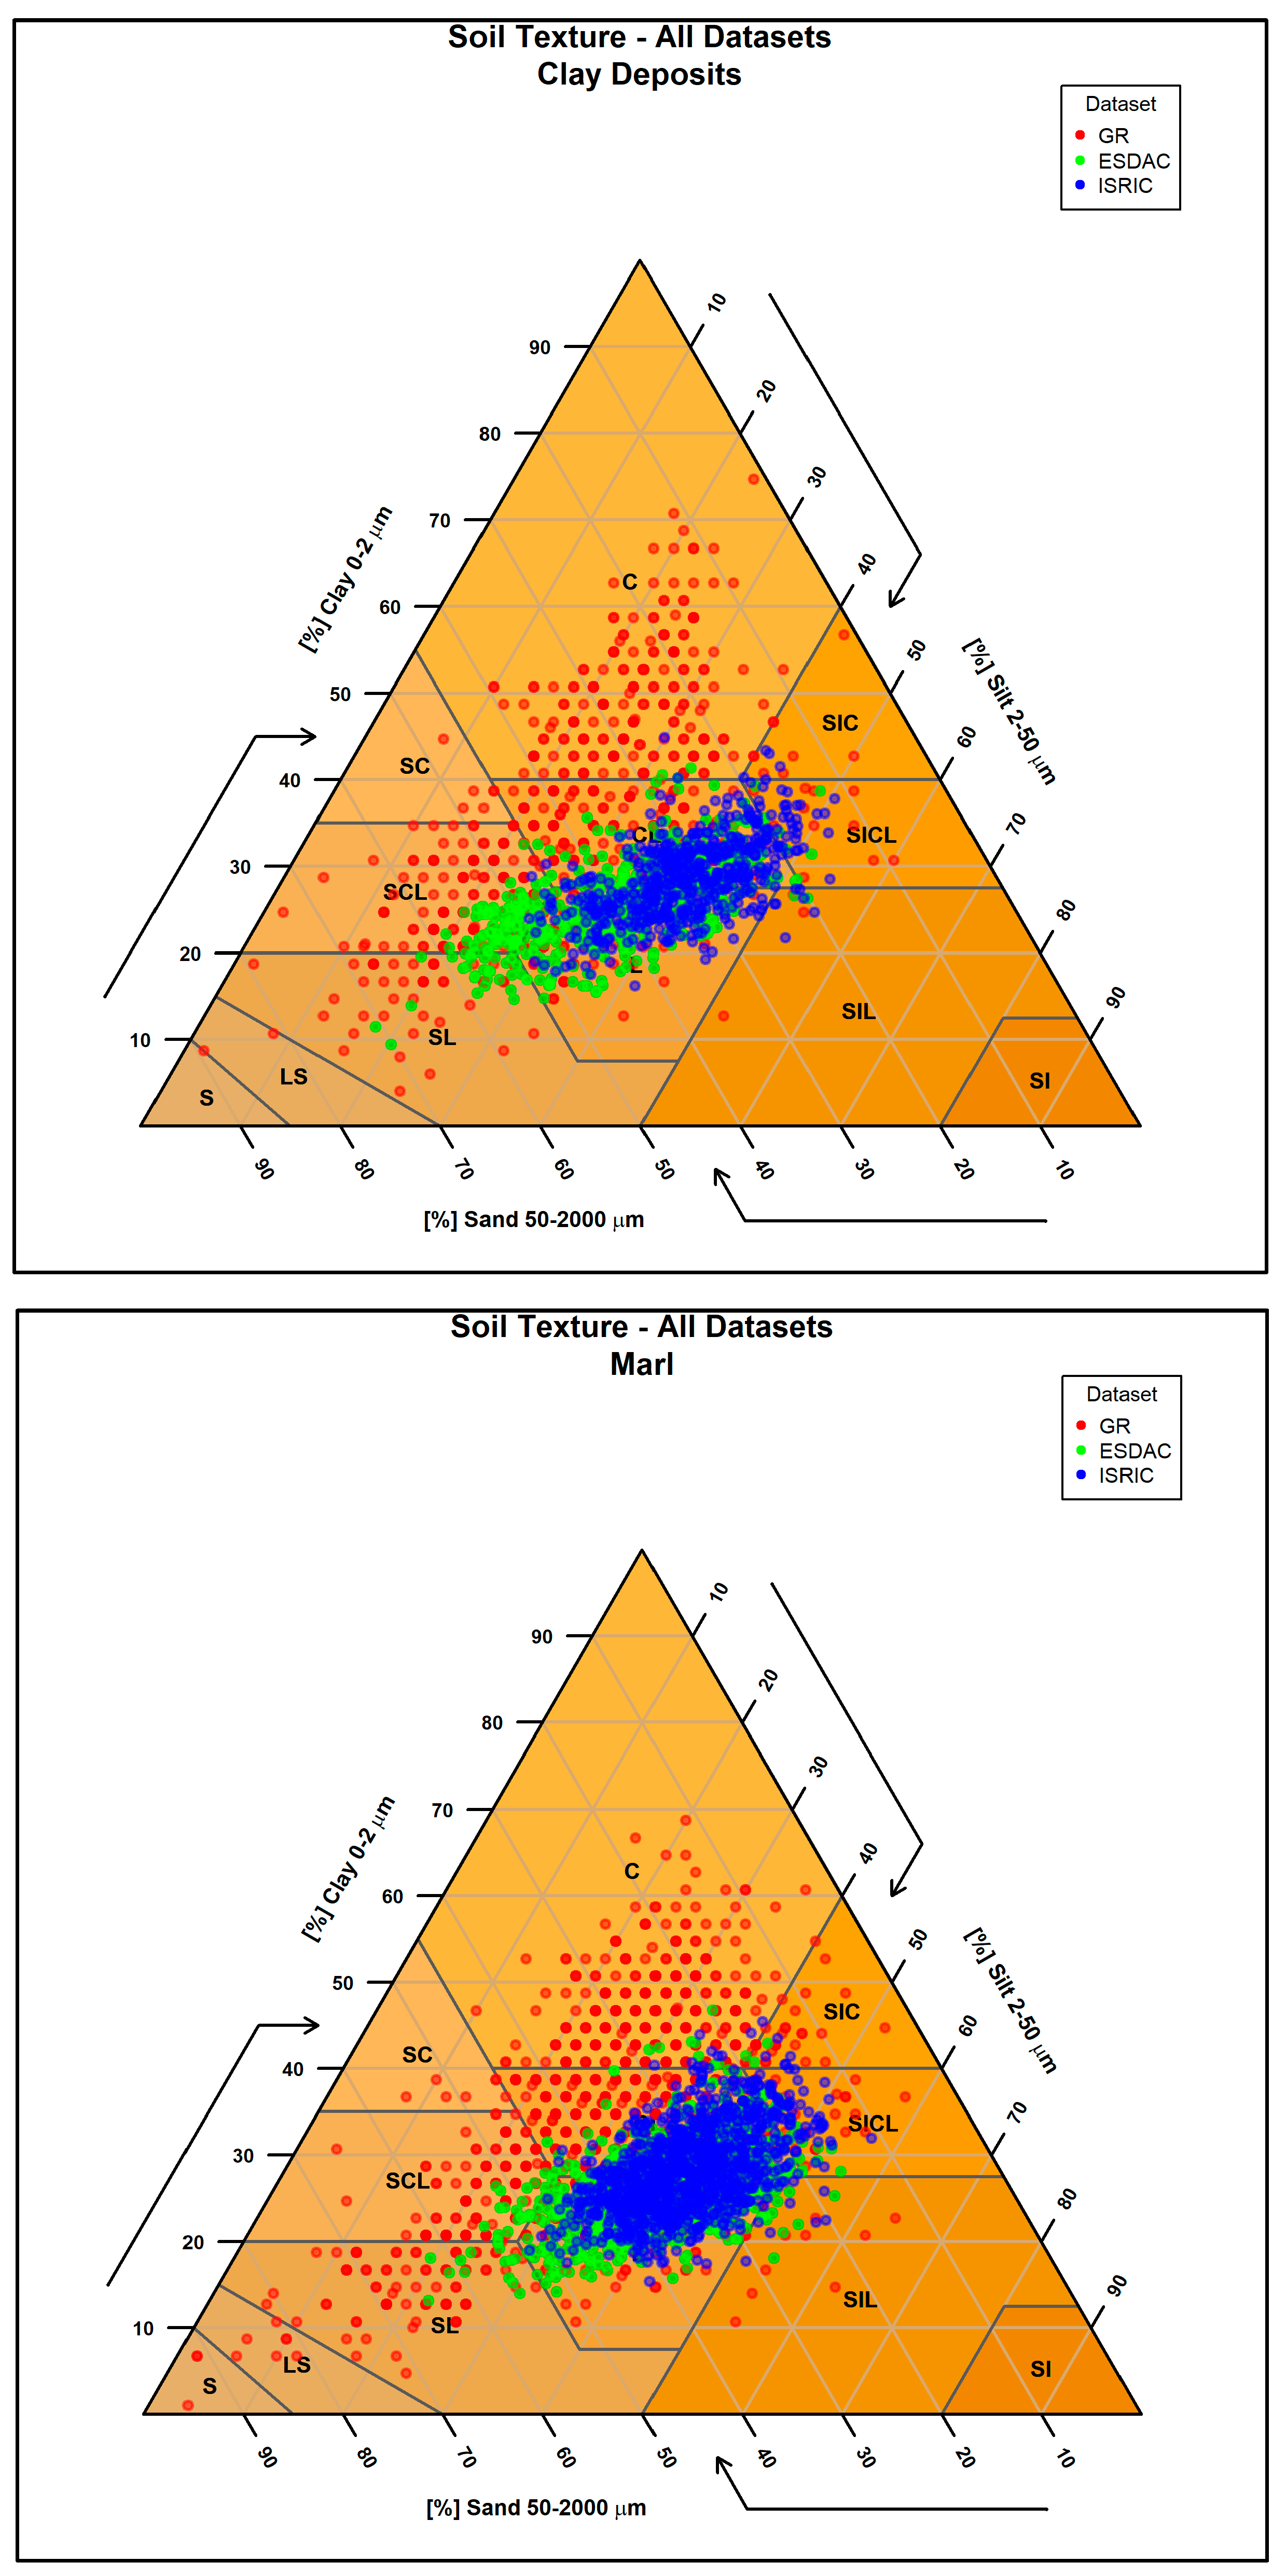
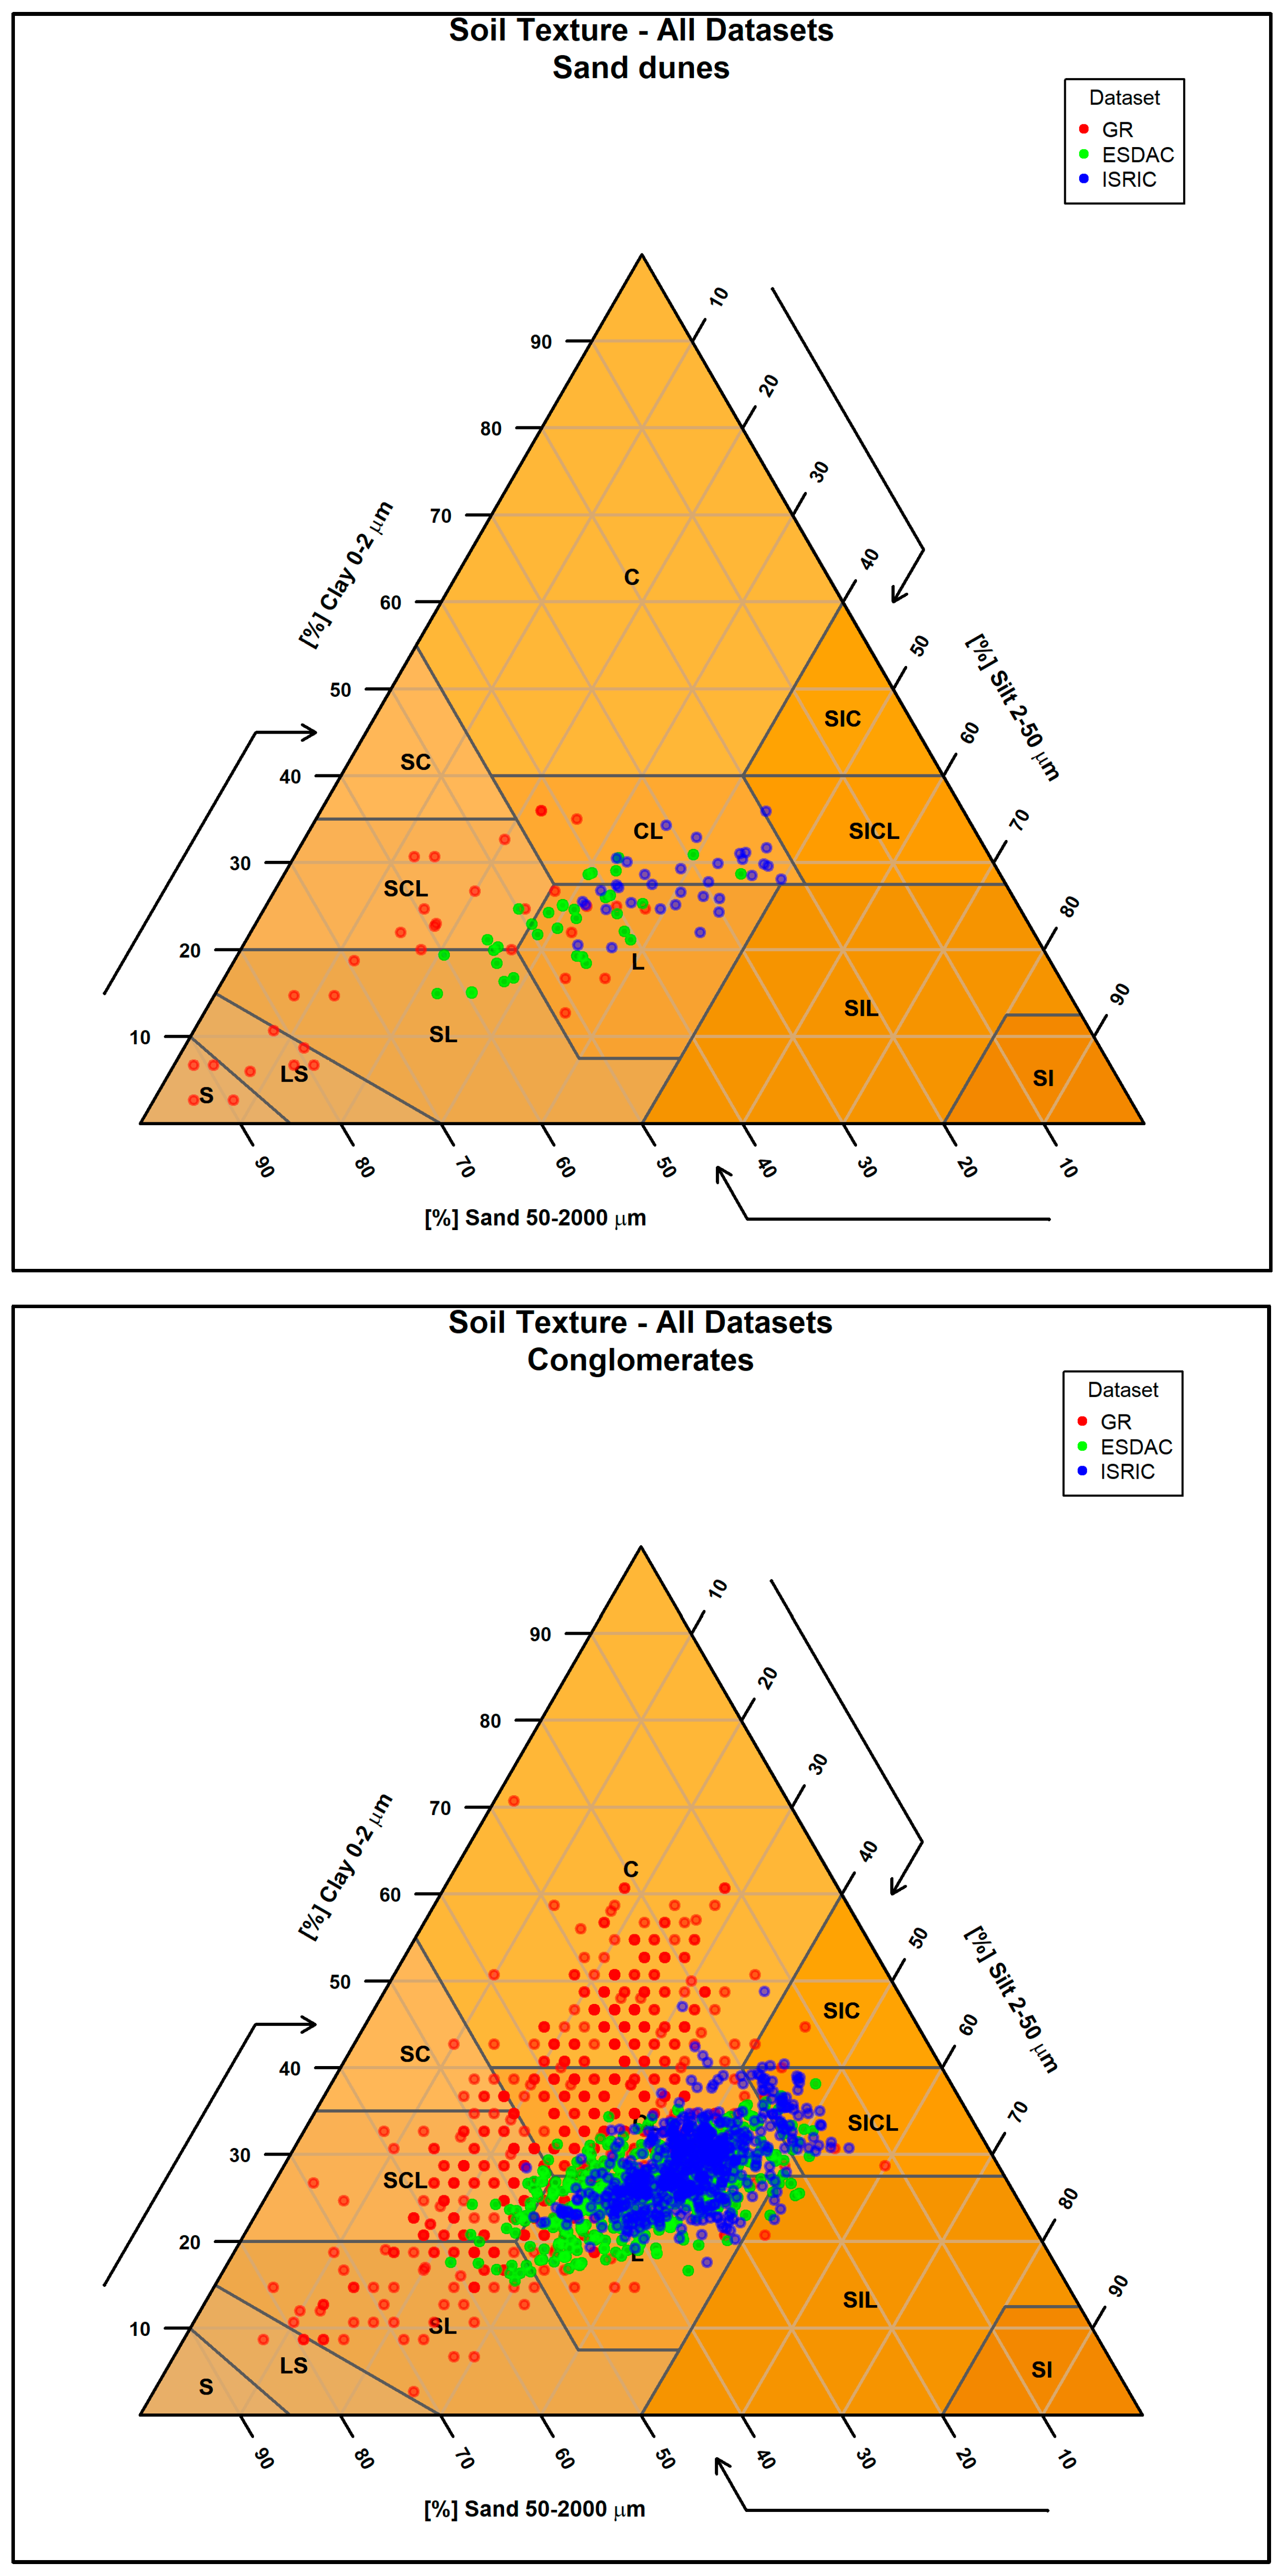
According to the above, an analysis was also undertaken to evaluate the predictive accuracy of soil property estimates derived from international datasets at locations where soils have developed on specific parent materials known to be associated with extreme values of sand, clay, or silt content. The parent material categories included in the analysis were: dunes, clay deposits, lacustrine sediments, conglomerates, and basic igneous rocks.
Τhe predicted percentages of sand, clay, and silt provided by each of the three soil databases were analyzed for soils developed on these specific lithological substrates, to assess potential biases or systematic differences in particle size estimations among the datasets.

2.3.10. Analysis of Sensitivity Due to Spatial Misalignment

The process of raster value extraction to the sampling points of the Soil Map of Greece may introduce two potential sources of spatial error. The first relates to the possibility that the geographic coordinates of the sampling points may lack high positional accuracy, particularly considering the original map scale at which the soil mapping project was conducted. The second pertains to potential geolocation errors of the raster datasets themselves, arising from: (i) the clipping procedure used to extract from the global raster dataset the subtotal raster inside the boundaries of Greece, and (ii) the transformation of the global coordinate reference system (WGS 84) into the Greek National Geodetic Reference System (Greek Grid 1987).
So, in order to avoid the aforementioned sources of error and to assess whether the raster value extraction process introduces bias by selecting only the pixel located directly beneath each point of the Greek Soil Map—regardless of the point’s proximity to neighboring pixels—a Python-based algorithm was developed. This algorithm extracts the values of the eight neighboring pixels to each point, as well as the overlapping pixel value, and the value closest to the actual measurement of the Soil Map of Greece was selected and assigned to the point dataset. Subsequently, the script identifies the relative position of each point on the Soil Map of Greece in relation to the center of the selected pixel (e.g., North, Southwest, Southeast, etc.) and calculates the distance from the pixel center.
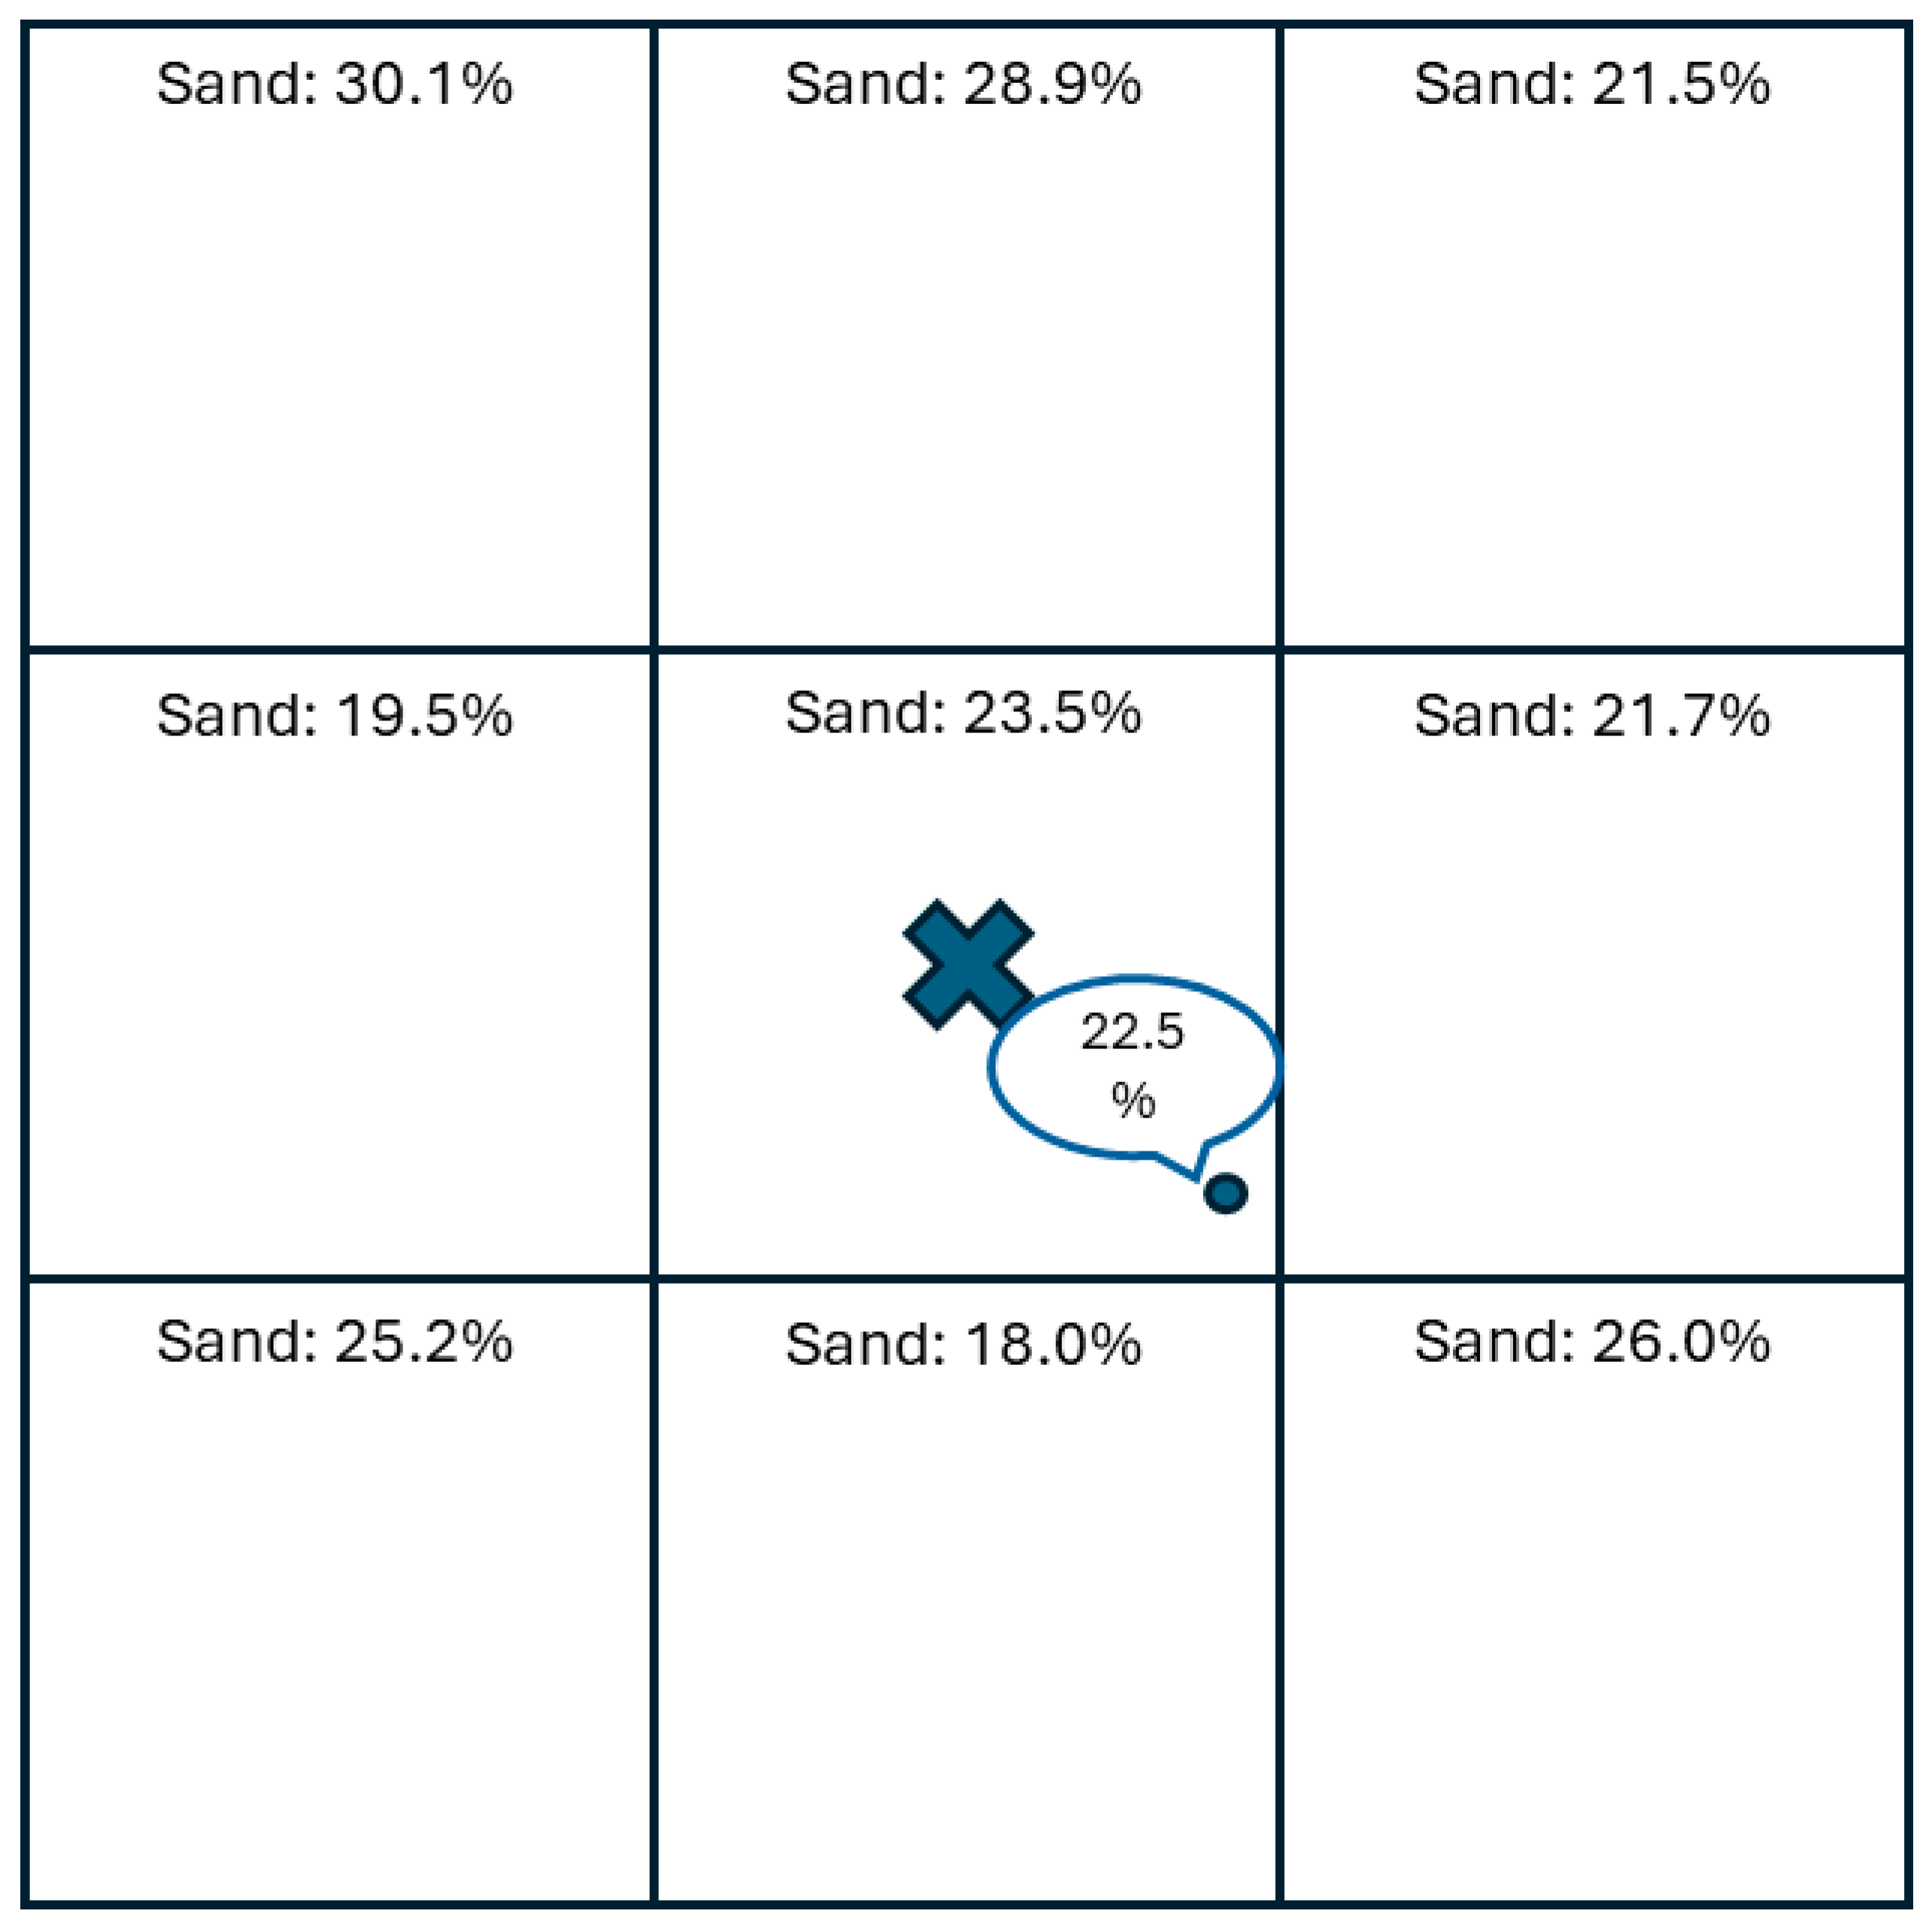
Figure 2 illustrates an example of the functionality of the Python script developed to enhance the representativeness of the raster value extraction process. In this example, a point from the Soil Map of Greece is located southwest of the center of its corresponding raster pixel. The measured sand content at this point is 22.5%, while the estimated sand content for the corresponding raster pixel is 23.5%. The script evaluates the neighboring values and selects the pixel closest in value to the point measurement. In this case (Figure 2), the western pixel (21.7%) is the closest to 22.5%, so this value is transferred to the point dataset and used for further soil data comparisons. Following, in addition to the detailed analysis with the overlapping pixel described above, at a second stage, a similar analysis with the best pixel was performed. Then, the positioning of the best pixels and the best pixel’s location in comparison with the distance and direction of point from the cell center were statistically analyzed to check for systematic deviations.

2.3.11. Validation of Results Using Diverse Greek Soil Studies

To evaluate the reliability and generality of the discrepancies identified between the measurements of the Soil Map of Greece and the predictions provided by the two international soil databases, a comparative analysis was conducted using two additional extensive sets of Greek soil data. Specifically, data from NAGREF covering forested and natural vegetation areas, and Epirus and Western Macedonia [28] were used. The main steps of the methodology applied to the Soil Map of Greece was employed for the above-mentioned datasets and the obtained results were compared with those of the main analysis.

3. Results

3.1. Descriptive Statistics of the Three Datasets

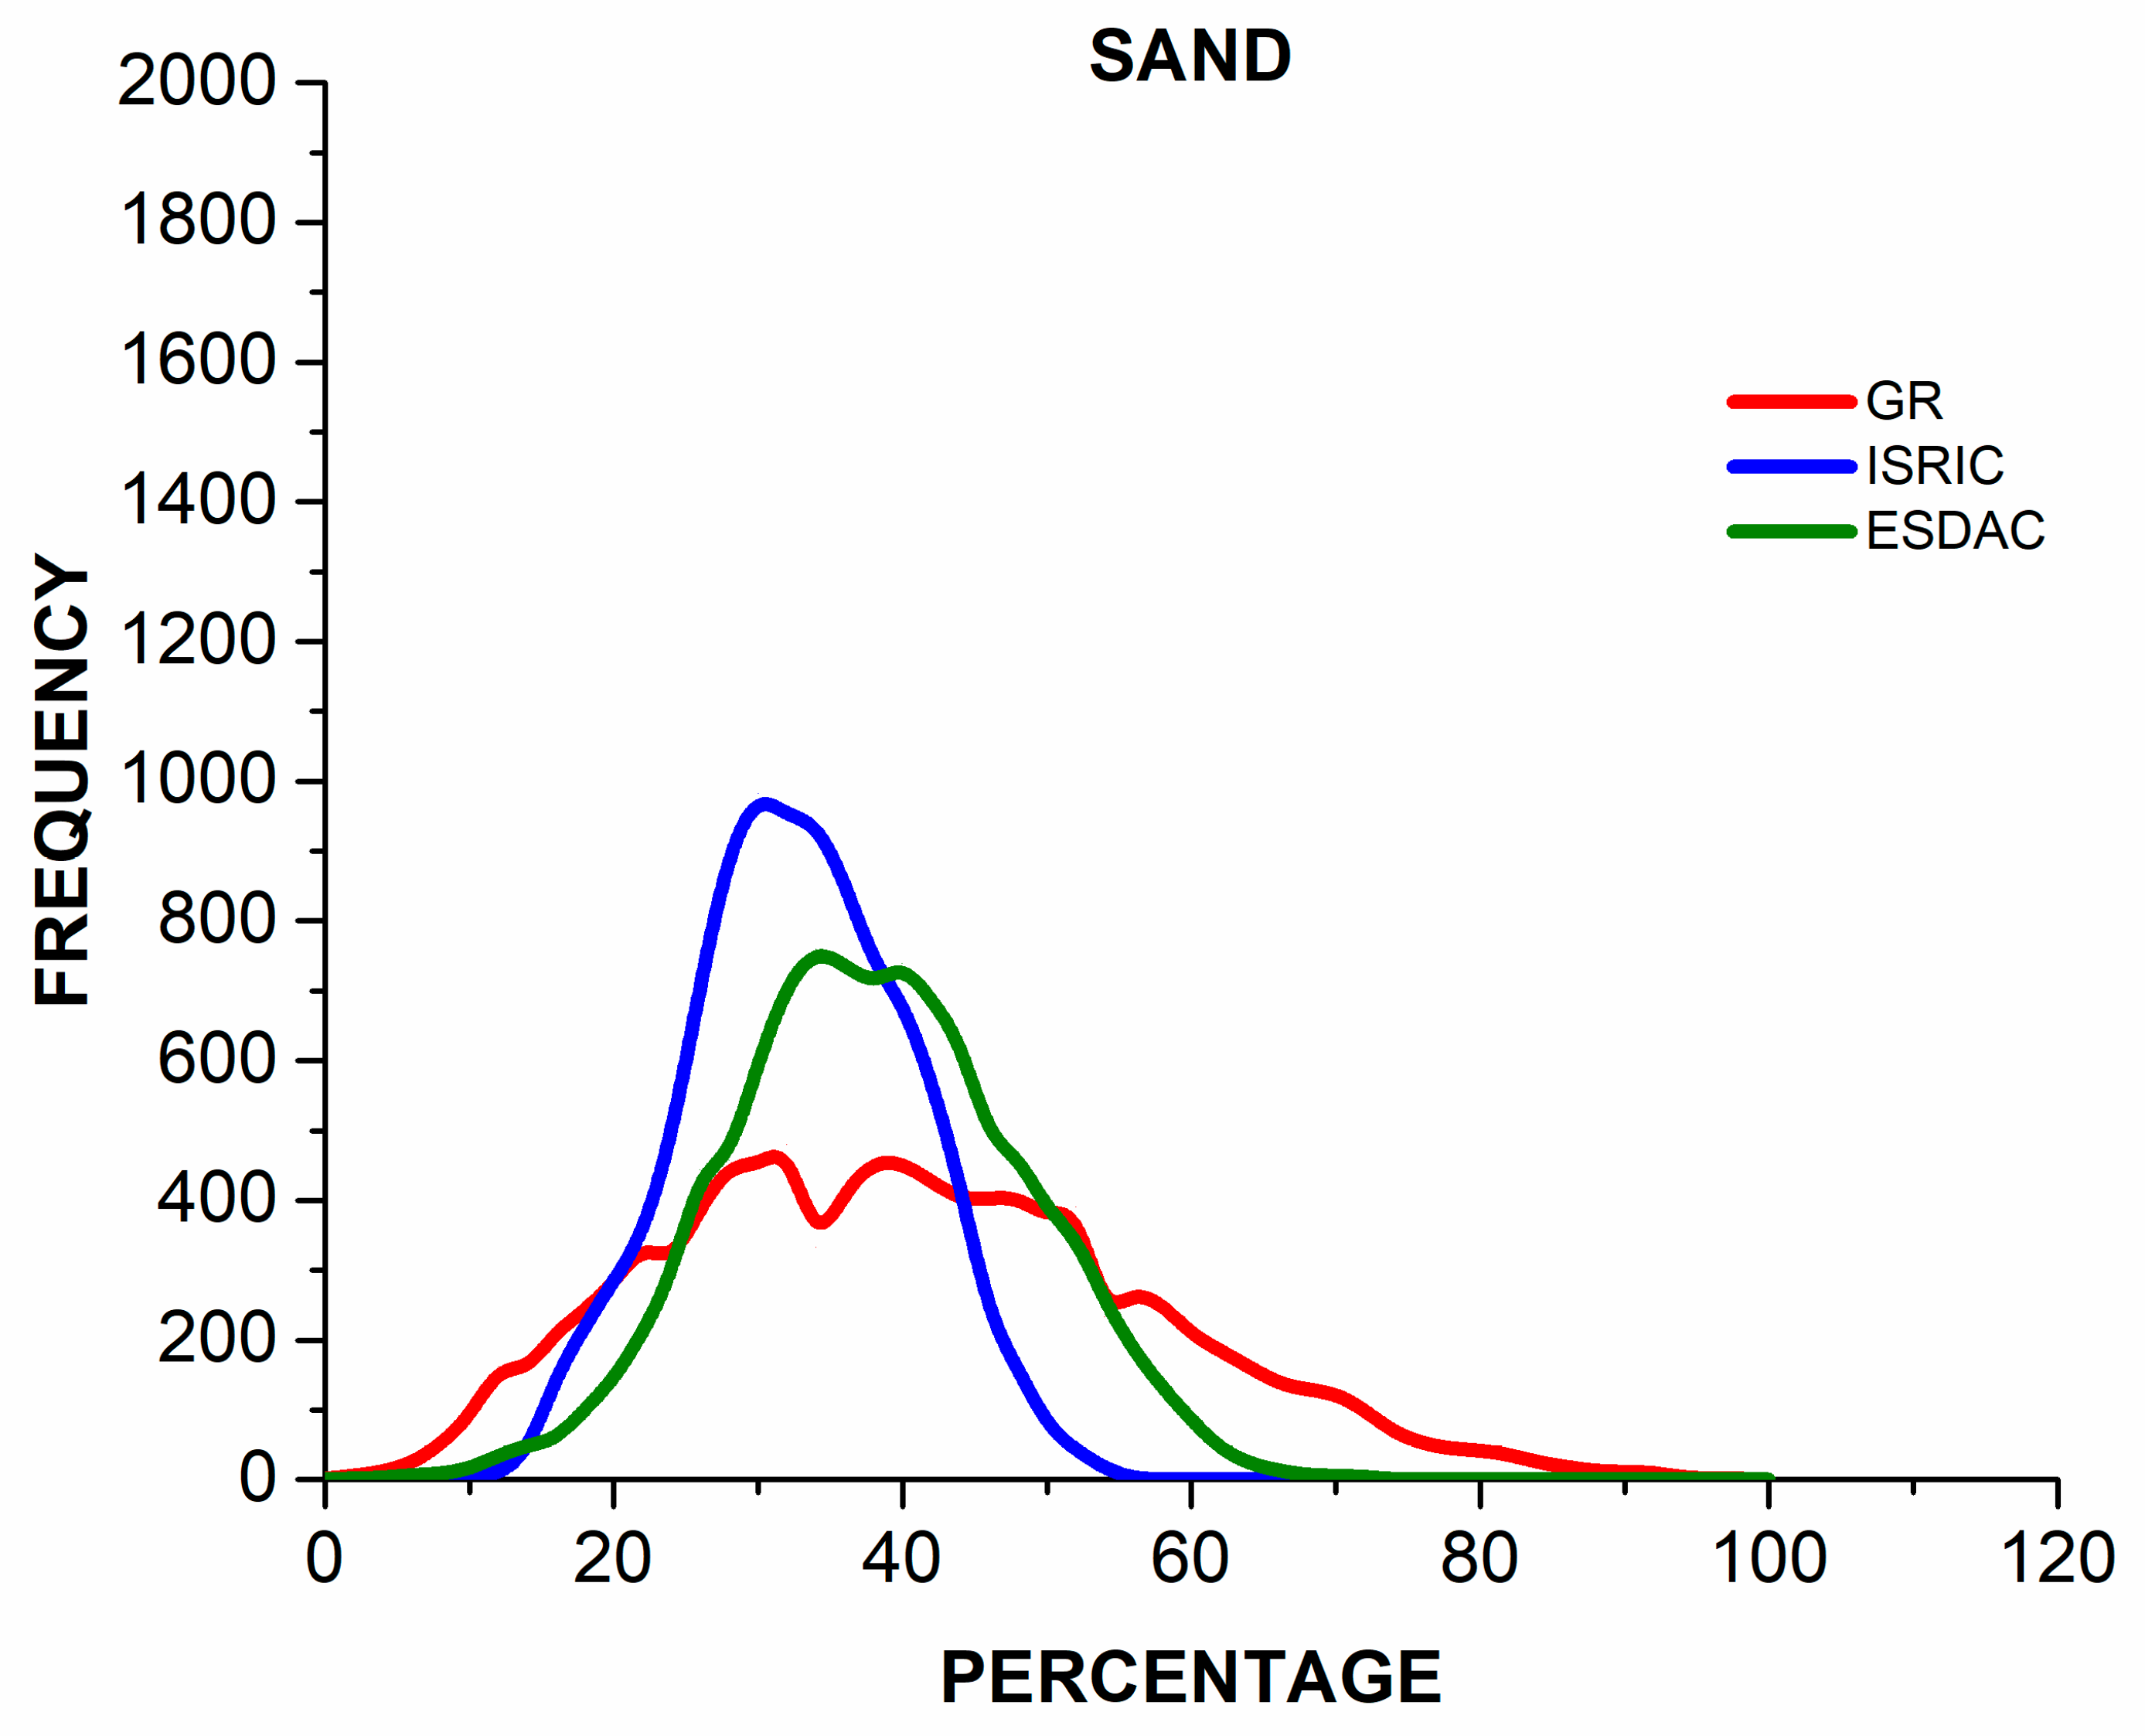
The storage of all soil property data—specifically sand, clay, and silt percentages—from the three datasets in a common attribute table enabled the statistical analysis of value distributions and facilitated their direct comparison. Figure 3 presents the smoothed frequency distribution of sand percentage values at the sampled locations across these three datasets. All distribution curves exhibit a unimodal pattern apart from some minor secondary peaks, reflecting the inherent soil heterogeneity within the study area. The datasets collectively cover a wide range of sand content values, from approximately 0% to over 80%, although the frequency distributions vary among them.
The Soil Map of Greece (Figure 3, red line) displays the broadest range of sand content values, extending from near 0% to beyond 90%. Notably, it features secondary peaks around 15%, 20%, and 55%, which are absent in the other datasets. These peaks may reflect localized geomorphological influences, such as alluvial deposits. In addition, two primary peaks occur between 35% and 40%, aligning with patterns seen in the other datasets. However, the tail of the distribution extends considerably further toward higher sand contents, suggesting that the Greek dataset may better capture soil variability. This may be attributed to its higher spatial resolution or the fact that it is based on locally derived observations.
In contrast, the ISRIC database exhibits a narrower distribution (Figure 3, blue line), with a strong concentration of values between 25% and 30% and a distinct peak near 27%. The distribution declines sharply beyond 45% and lacks a significant presence of samples with sand content over 50%. This compression of values and absence of extremes may reflect the effects of a global prediction model with lower spatial resolution, potentially limiting the dataset’s ability to capture finer-scale heterogeneity.
The ESDAC dataset shows a broadly similar distribution (Figure 3, green line) to that of ISRIC, but with the main peak slightly shifted toward higher values, around 35% to 40%. Like ISRIC, values above 55% are absent. However, ESDAC presents a somewhat wider spread within the mid-range domain, suggesting improved representation of intermediate sand content levels. While it aligns more closely with the Greek dataset in this central range, it still does not capture the full range of extreme values observed in the Soil Map of Greece.
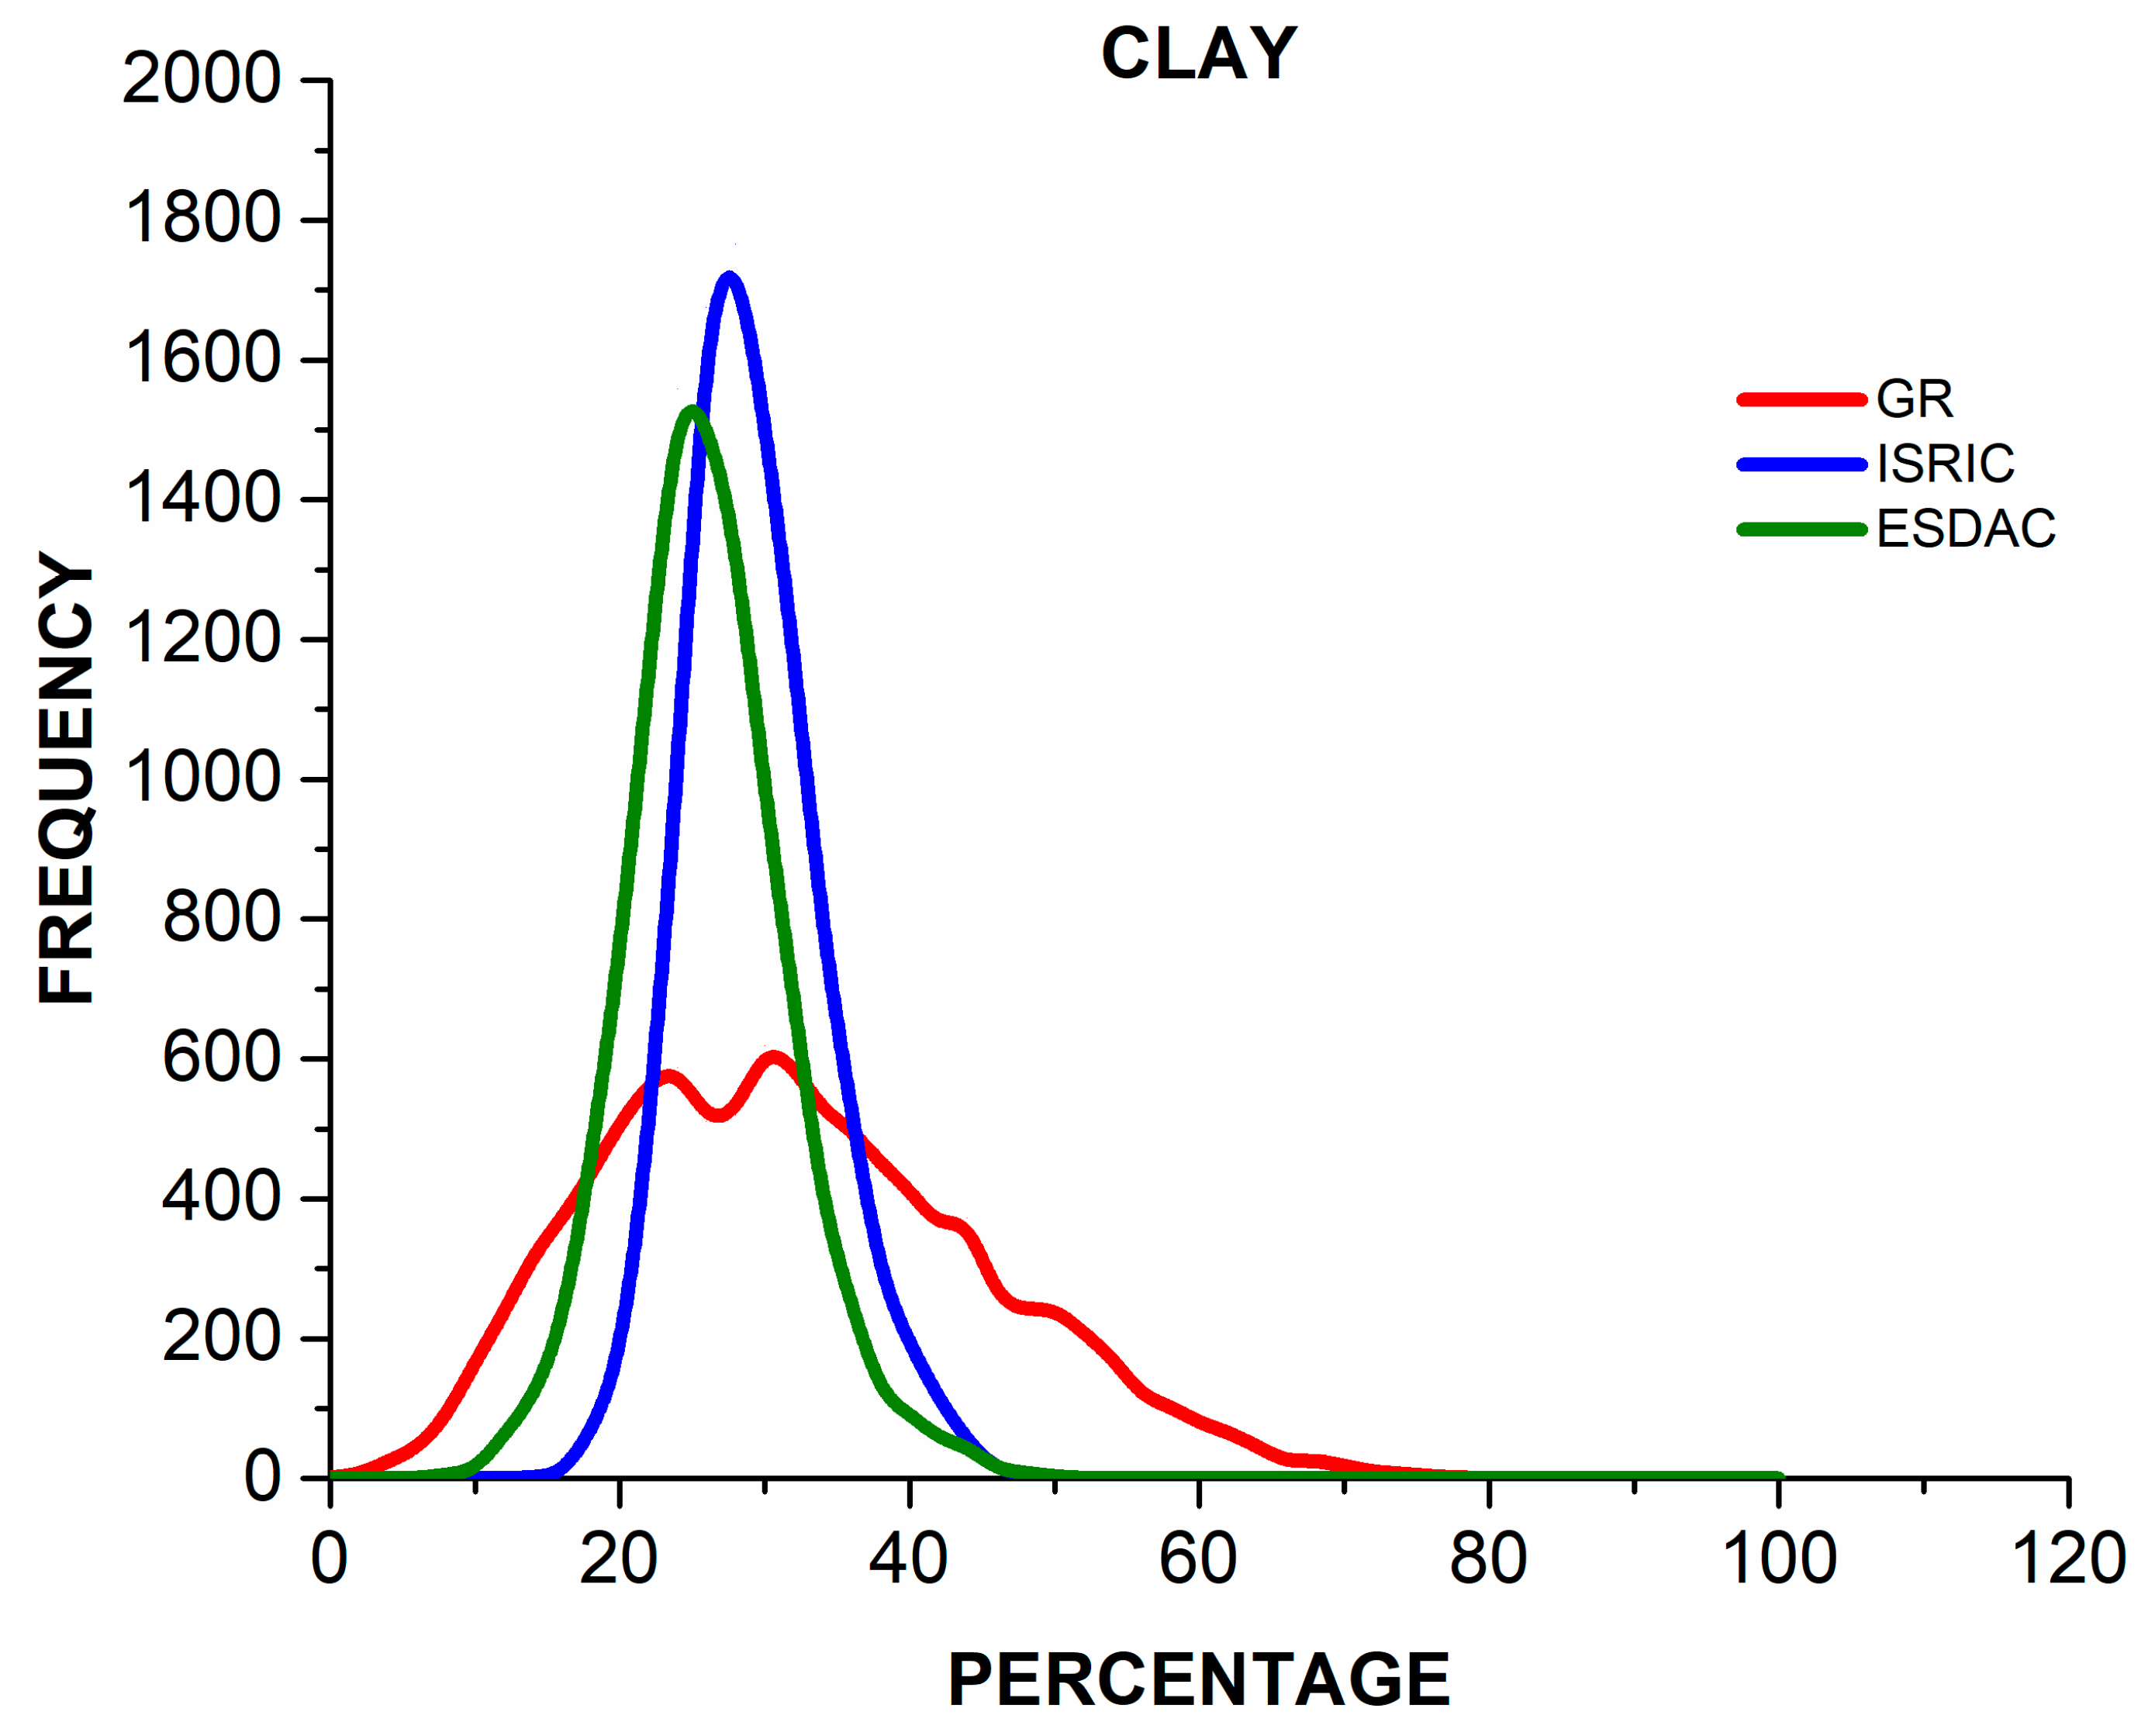
Similarly, Figure 4 presents the smoothed frequency distribution of clay percentage for the three datasets under study, allowing a comparative analysis of their clay content distributions. All datasets exhibit a unimodal distribution, with the majority of values concentrated between 20% and 35%, a typical range for soils in the Mediterranean region. However, significant divergence is observed in the presence of extreme values, particularly toward the right tail of the distribution (i.e., high clay content).
The Soil Map of Greece displays the broadest and most polymorphic distribution (red line) with values ranging from below 5% to nearly 75%, and a distinct secondary peaks around 22% and 30%. This dataset offers a relatively more realistic representation of the natural clay content range, encompassing both sandy and heavy clay soils. Notably, the presence of high clay values (>50%) may be associated with specific geological zones, such as red earth (terra rossa) or marl deposits. These characteristics suggest that the Greek dataset captures the spatial heterogeneity of the study area with greater detail.
In contrast, the ISRIC dataset shows a much narrower range (blue line), with most values clustering tightly between 20% and 35%, peaking around 27–28%, and a steep drop-off beyond this range. Clay content values exceeding 40% are rare or entirely absent. This limited variability likely results from the global-scale geostatistical modeling approach employed by ISRIC, which may lead to the underrepresentation of soils with high clay content.
The ESDAC dataset follows a similar pattern, although it is slightly shifted toward lower values, with its main peak between 25% and 27%. As with ISRIC, values above 50% are absent. While ESDAC appears marginally more detailed than ISRIC, it still underrepresents soils with high clay content, limiting its ability to reflect the full range of textural variability in the region.
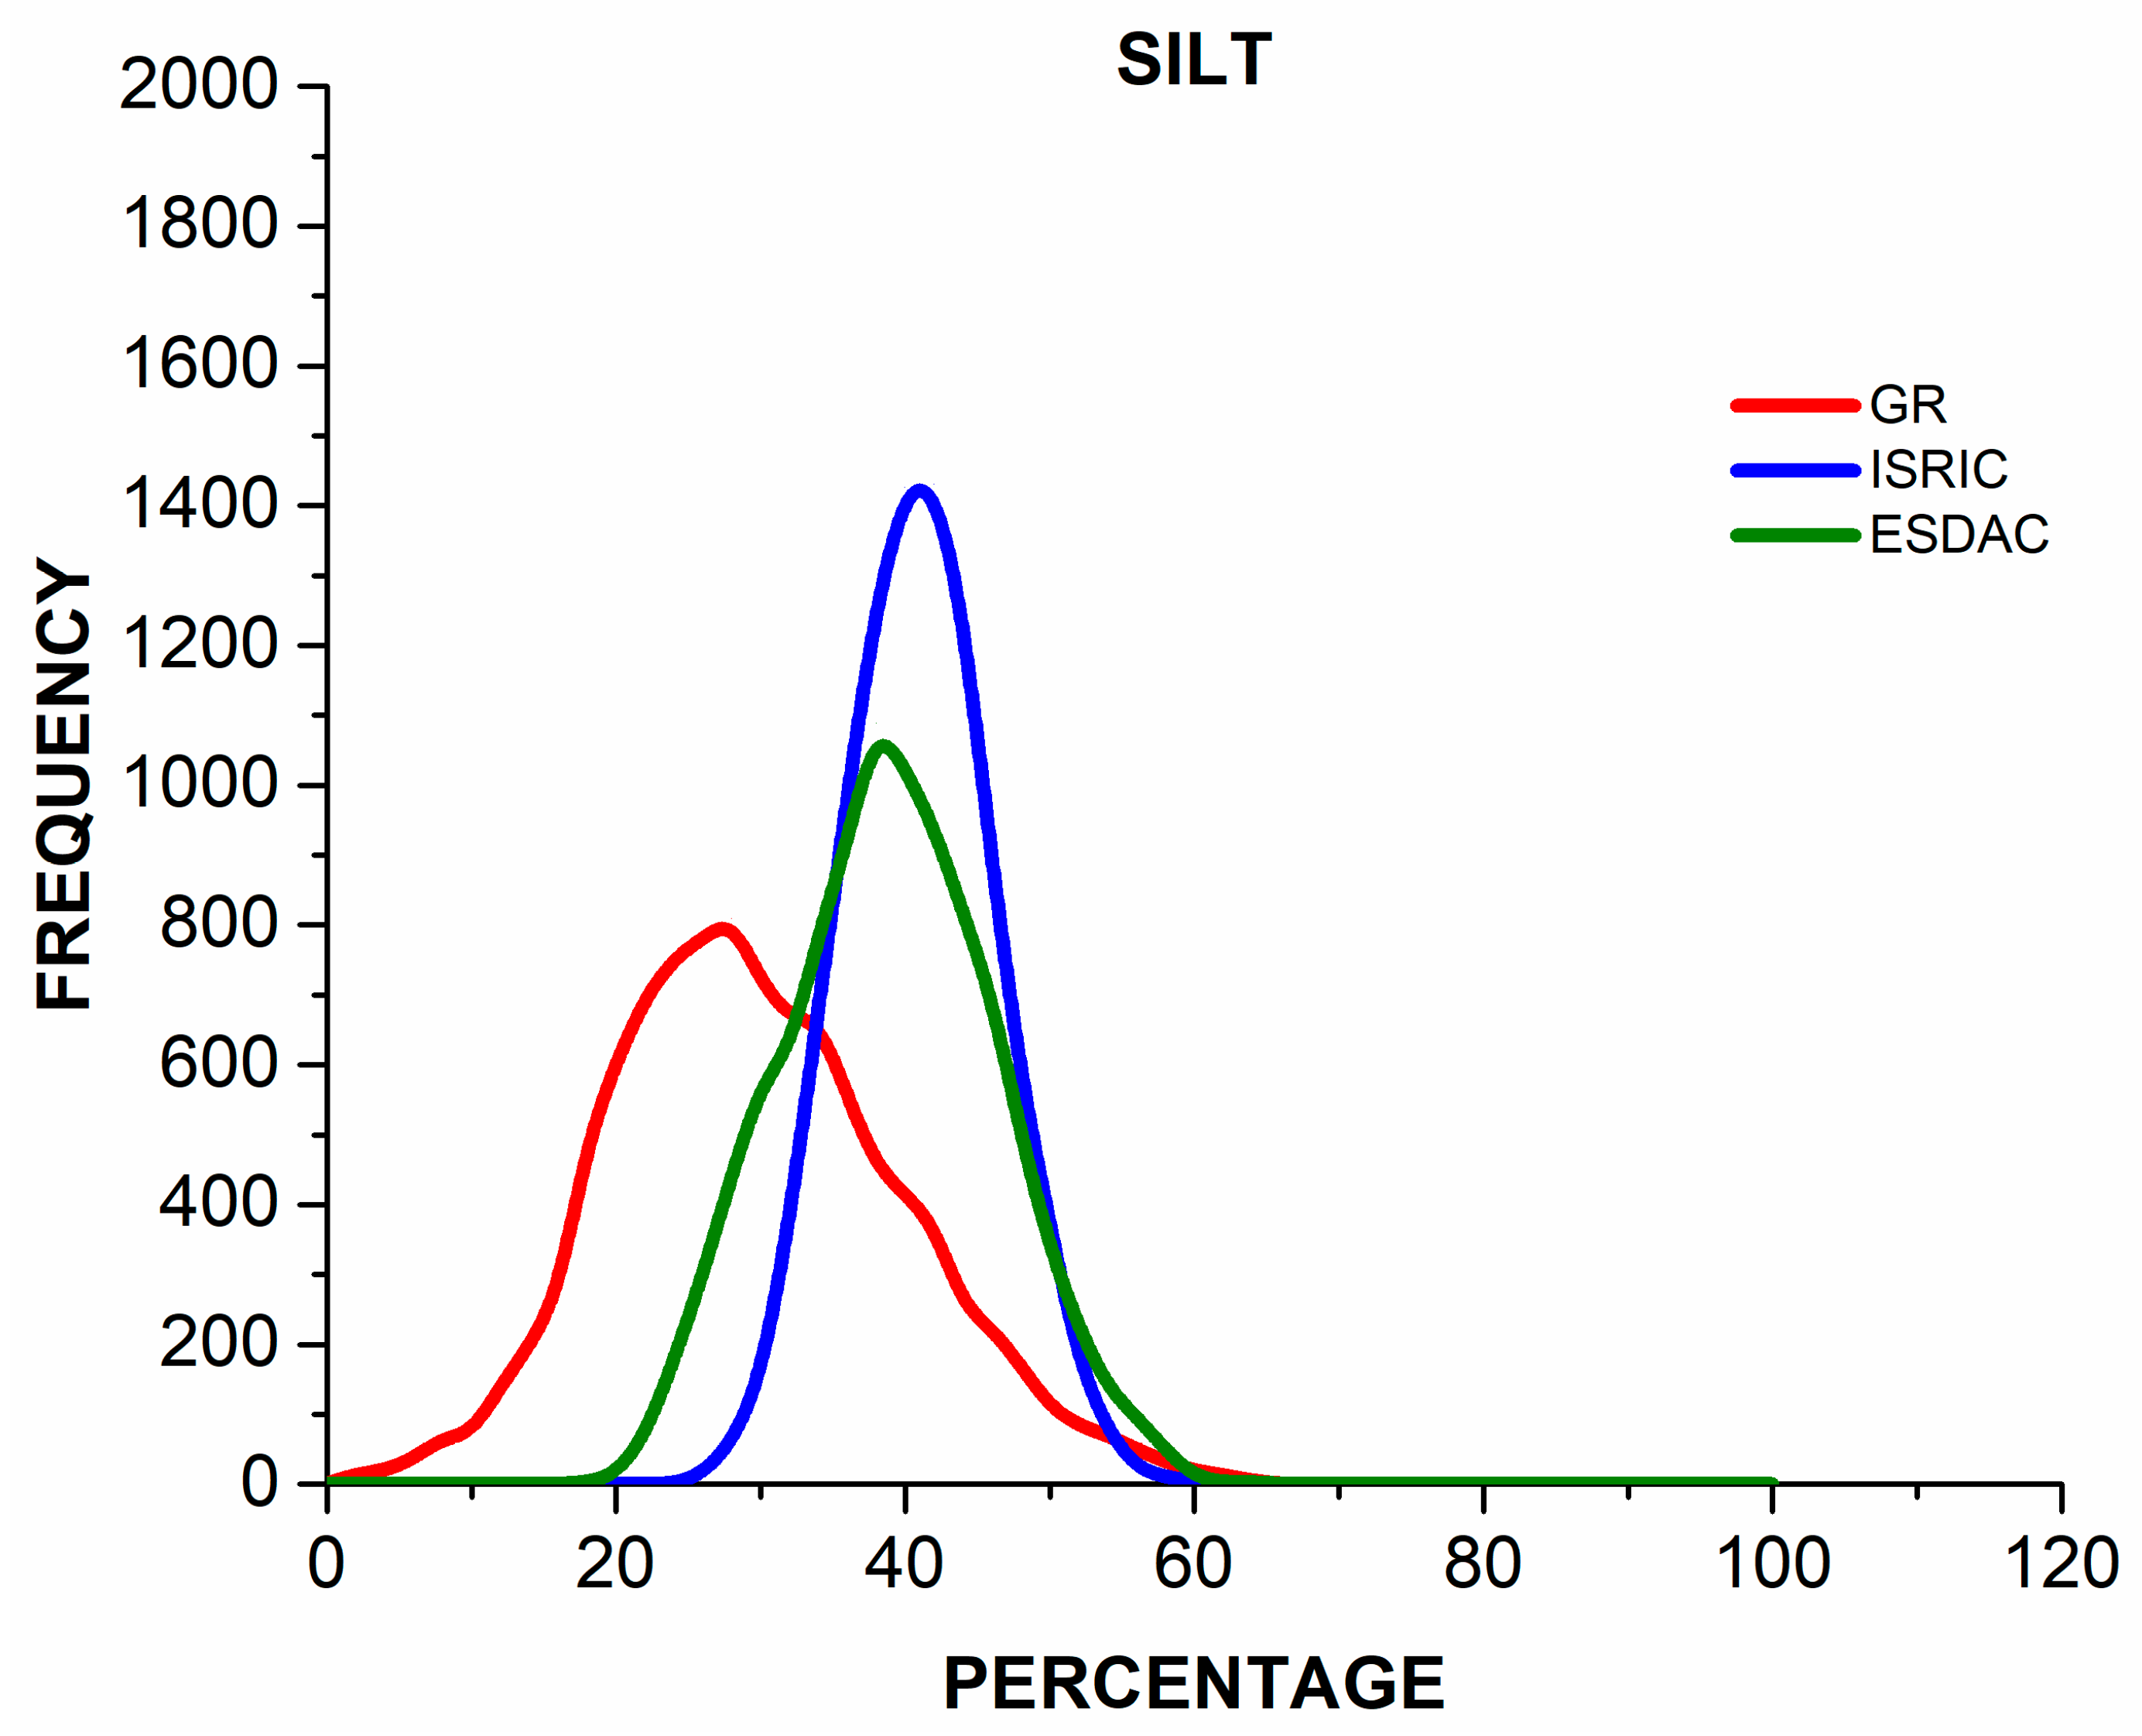
Finally, Figure 5 presents the smoothed frequency distribution of silt content derived from the three datasets, enabling a comparative assessment of their representation of silt content. Silt content generally falls between 20% and 50% across all datasets, but notable discrepancies emerge in the position of the primary mode, the overall spread, and the distribution shape.
The Soil Map of Greece demonstrates a broad and nearly symmetrical distribution (Figure 5, red line) with a peak around 25%, extending from approximately 10% to 65%. A slight skew toward lower values, along with the presence of multiple minor peaks in the distribution tails, indicates a diverse pedological landscape that includes both silt-rich and silt-poor areas. This reflects a more accurate depiction of natural soil diversity, critical for understanding hydrological and agronomic properties such as water retention and soil workability.
In contrast, the ISRIC dataset (blue line) displays a highly compressed distribution, with a narrow peak centered around 41%. Values below 30% or above 50% occur infrequently.
This smoothing effect suggests a generalized model output, likely stemming from geostatistical or machine learning-based global prediction frameworks that average out local extremes. As a result, ISRIC may underrepresent the true variability of silt content in specific areas.
The ESDAC dataset (green line) displays a similar shape to ISRIC but with its peak slightly shifted leftward, to around 38%. It exhibits a slightly broader spread, though still lacking representation at the extremes of the silt spectrum. While offering a moderate level of detail and being more regionally focused—thus more suitable for European-scale assessments—it still falls short in accurately depicting localized soil conditions compared to the Greek dataset.
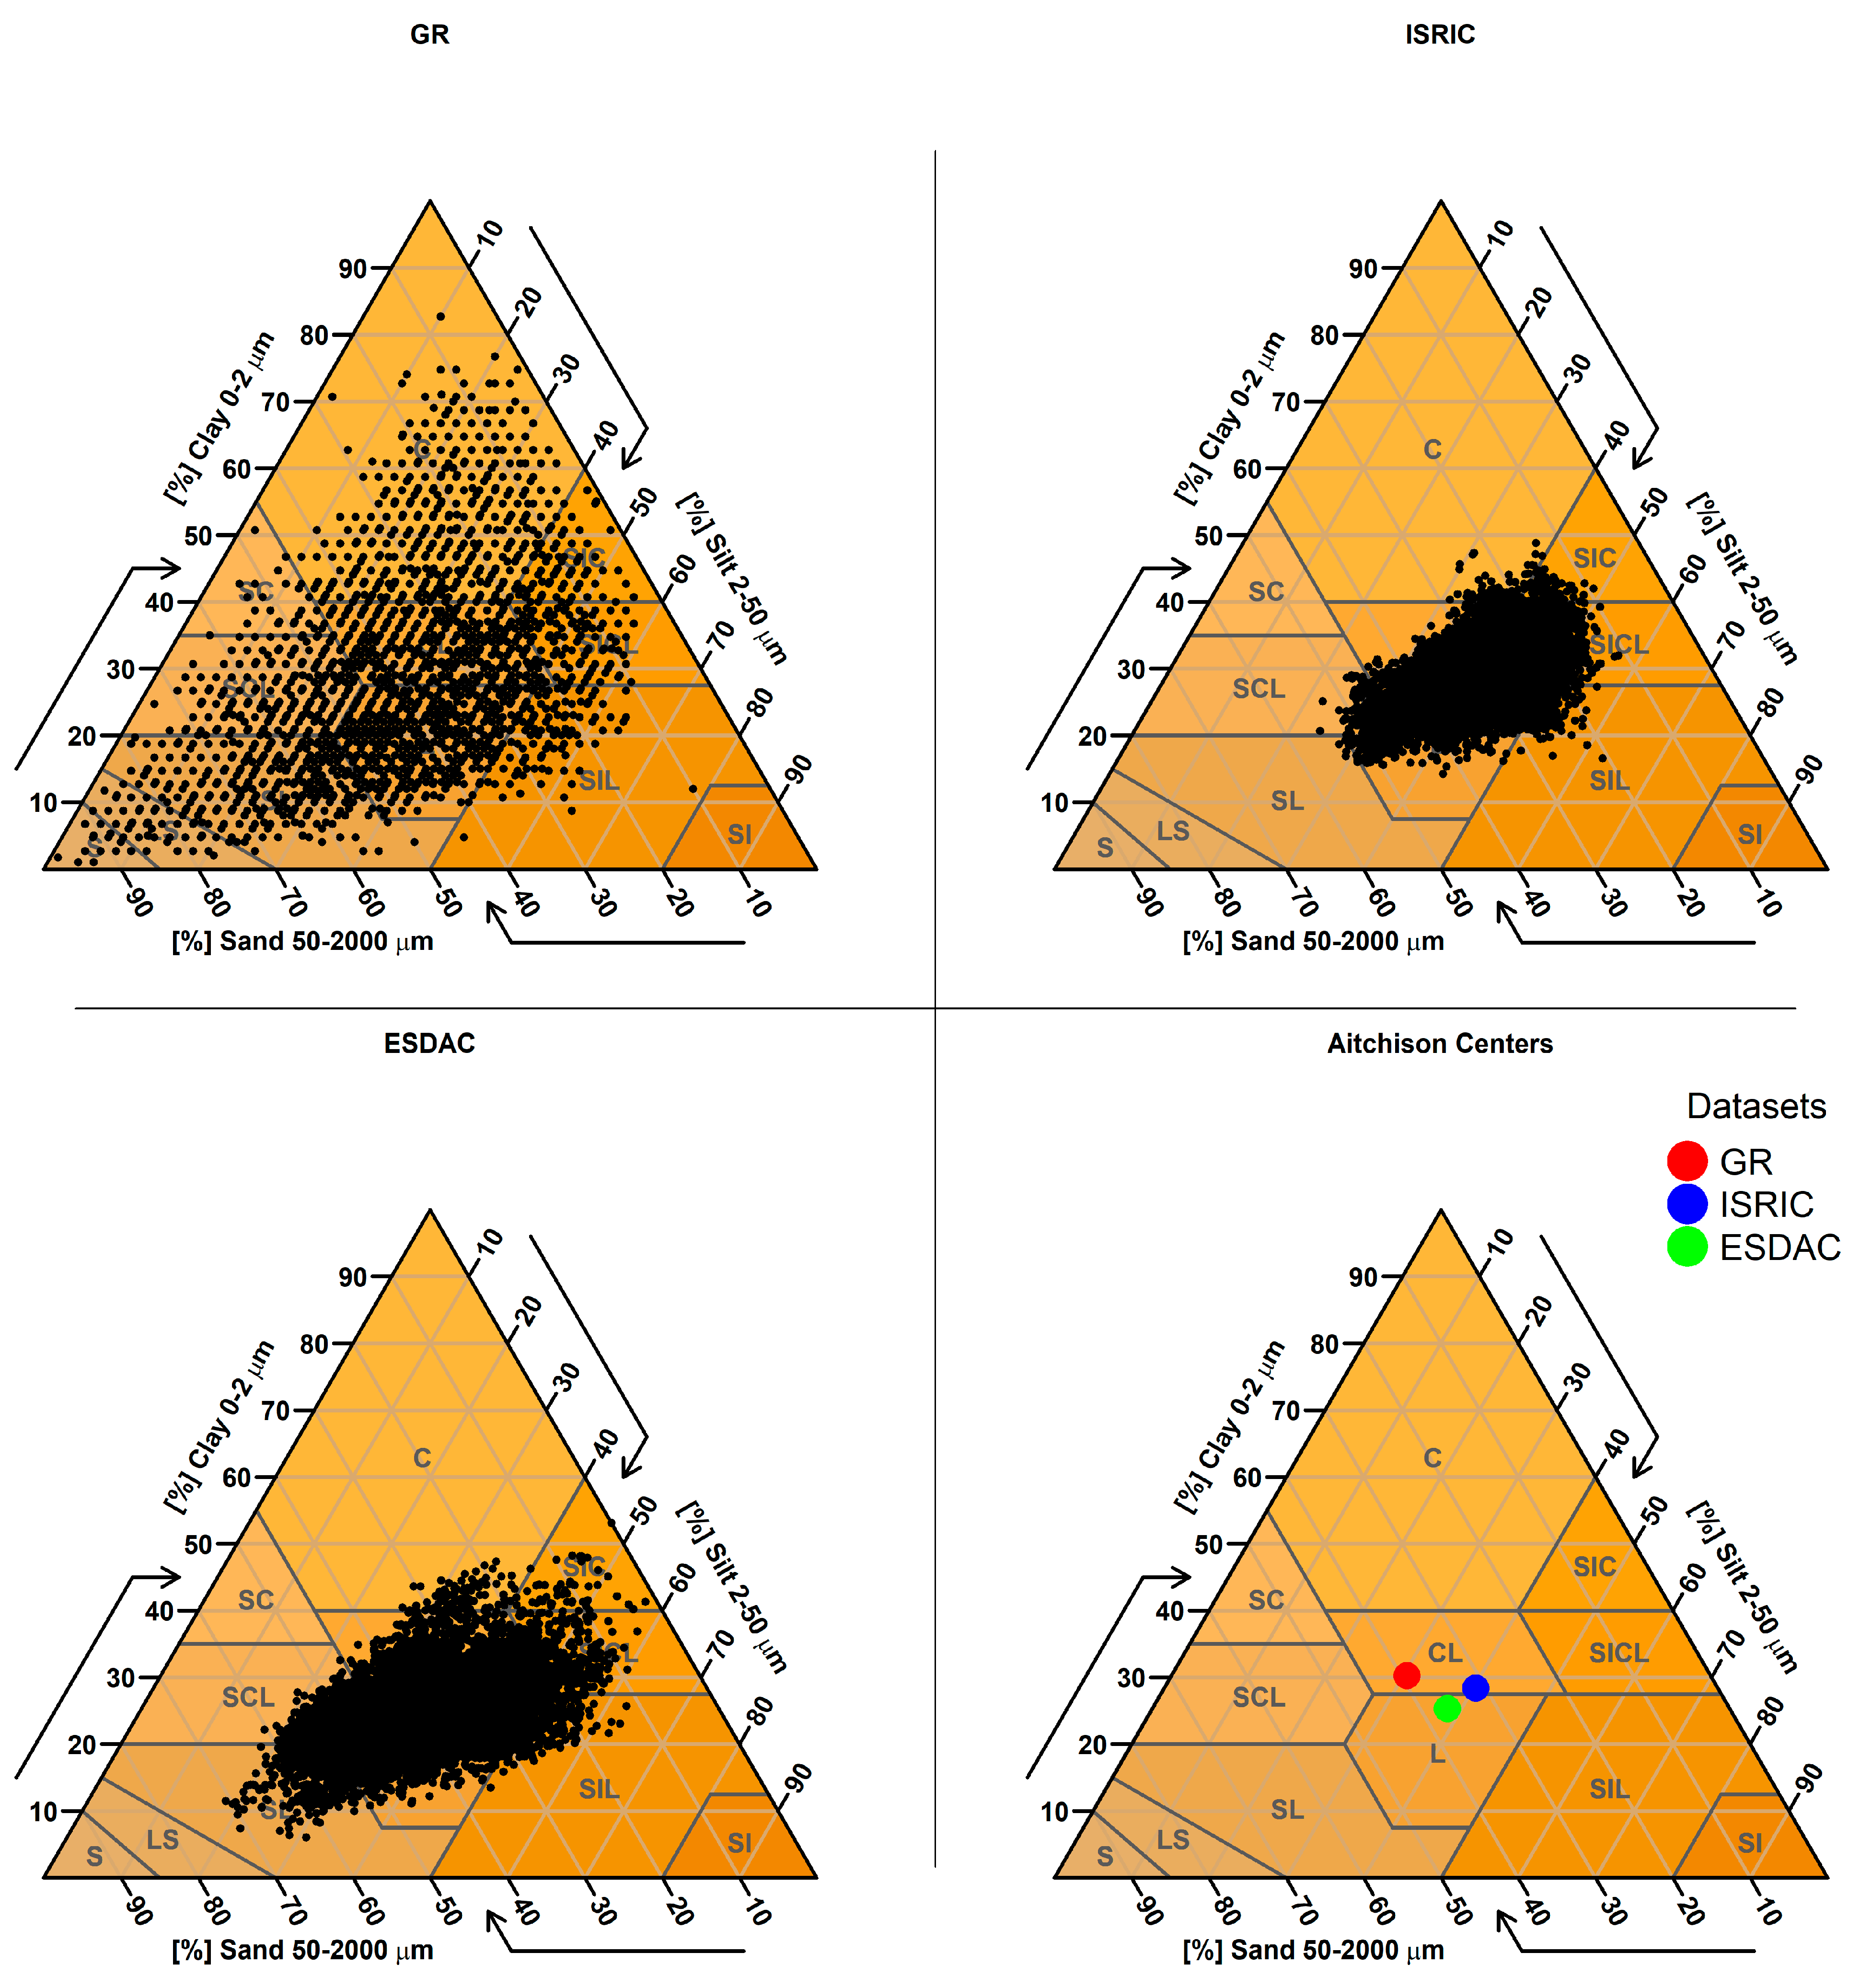
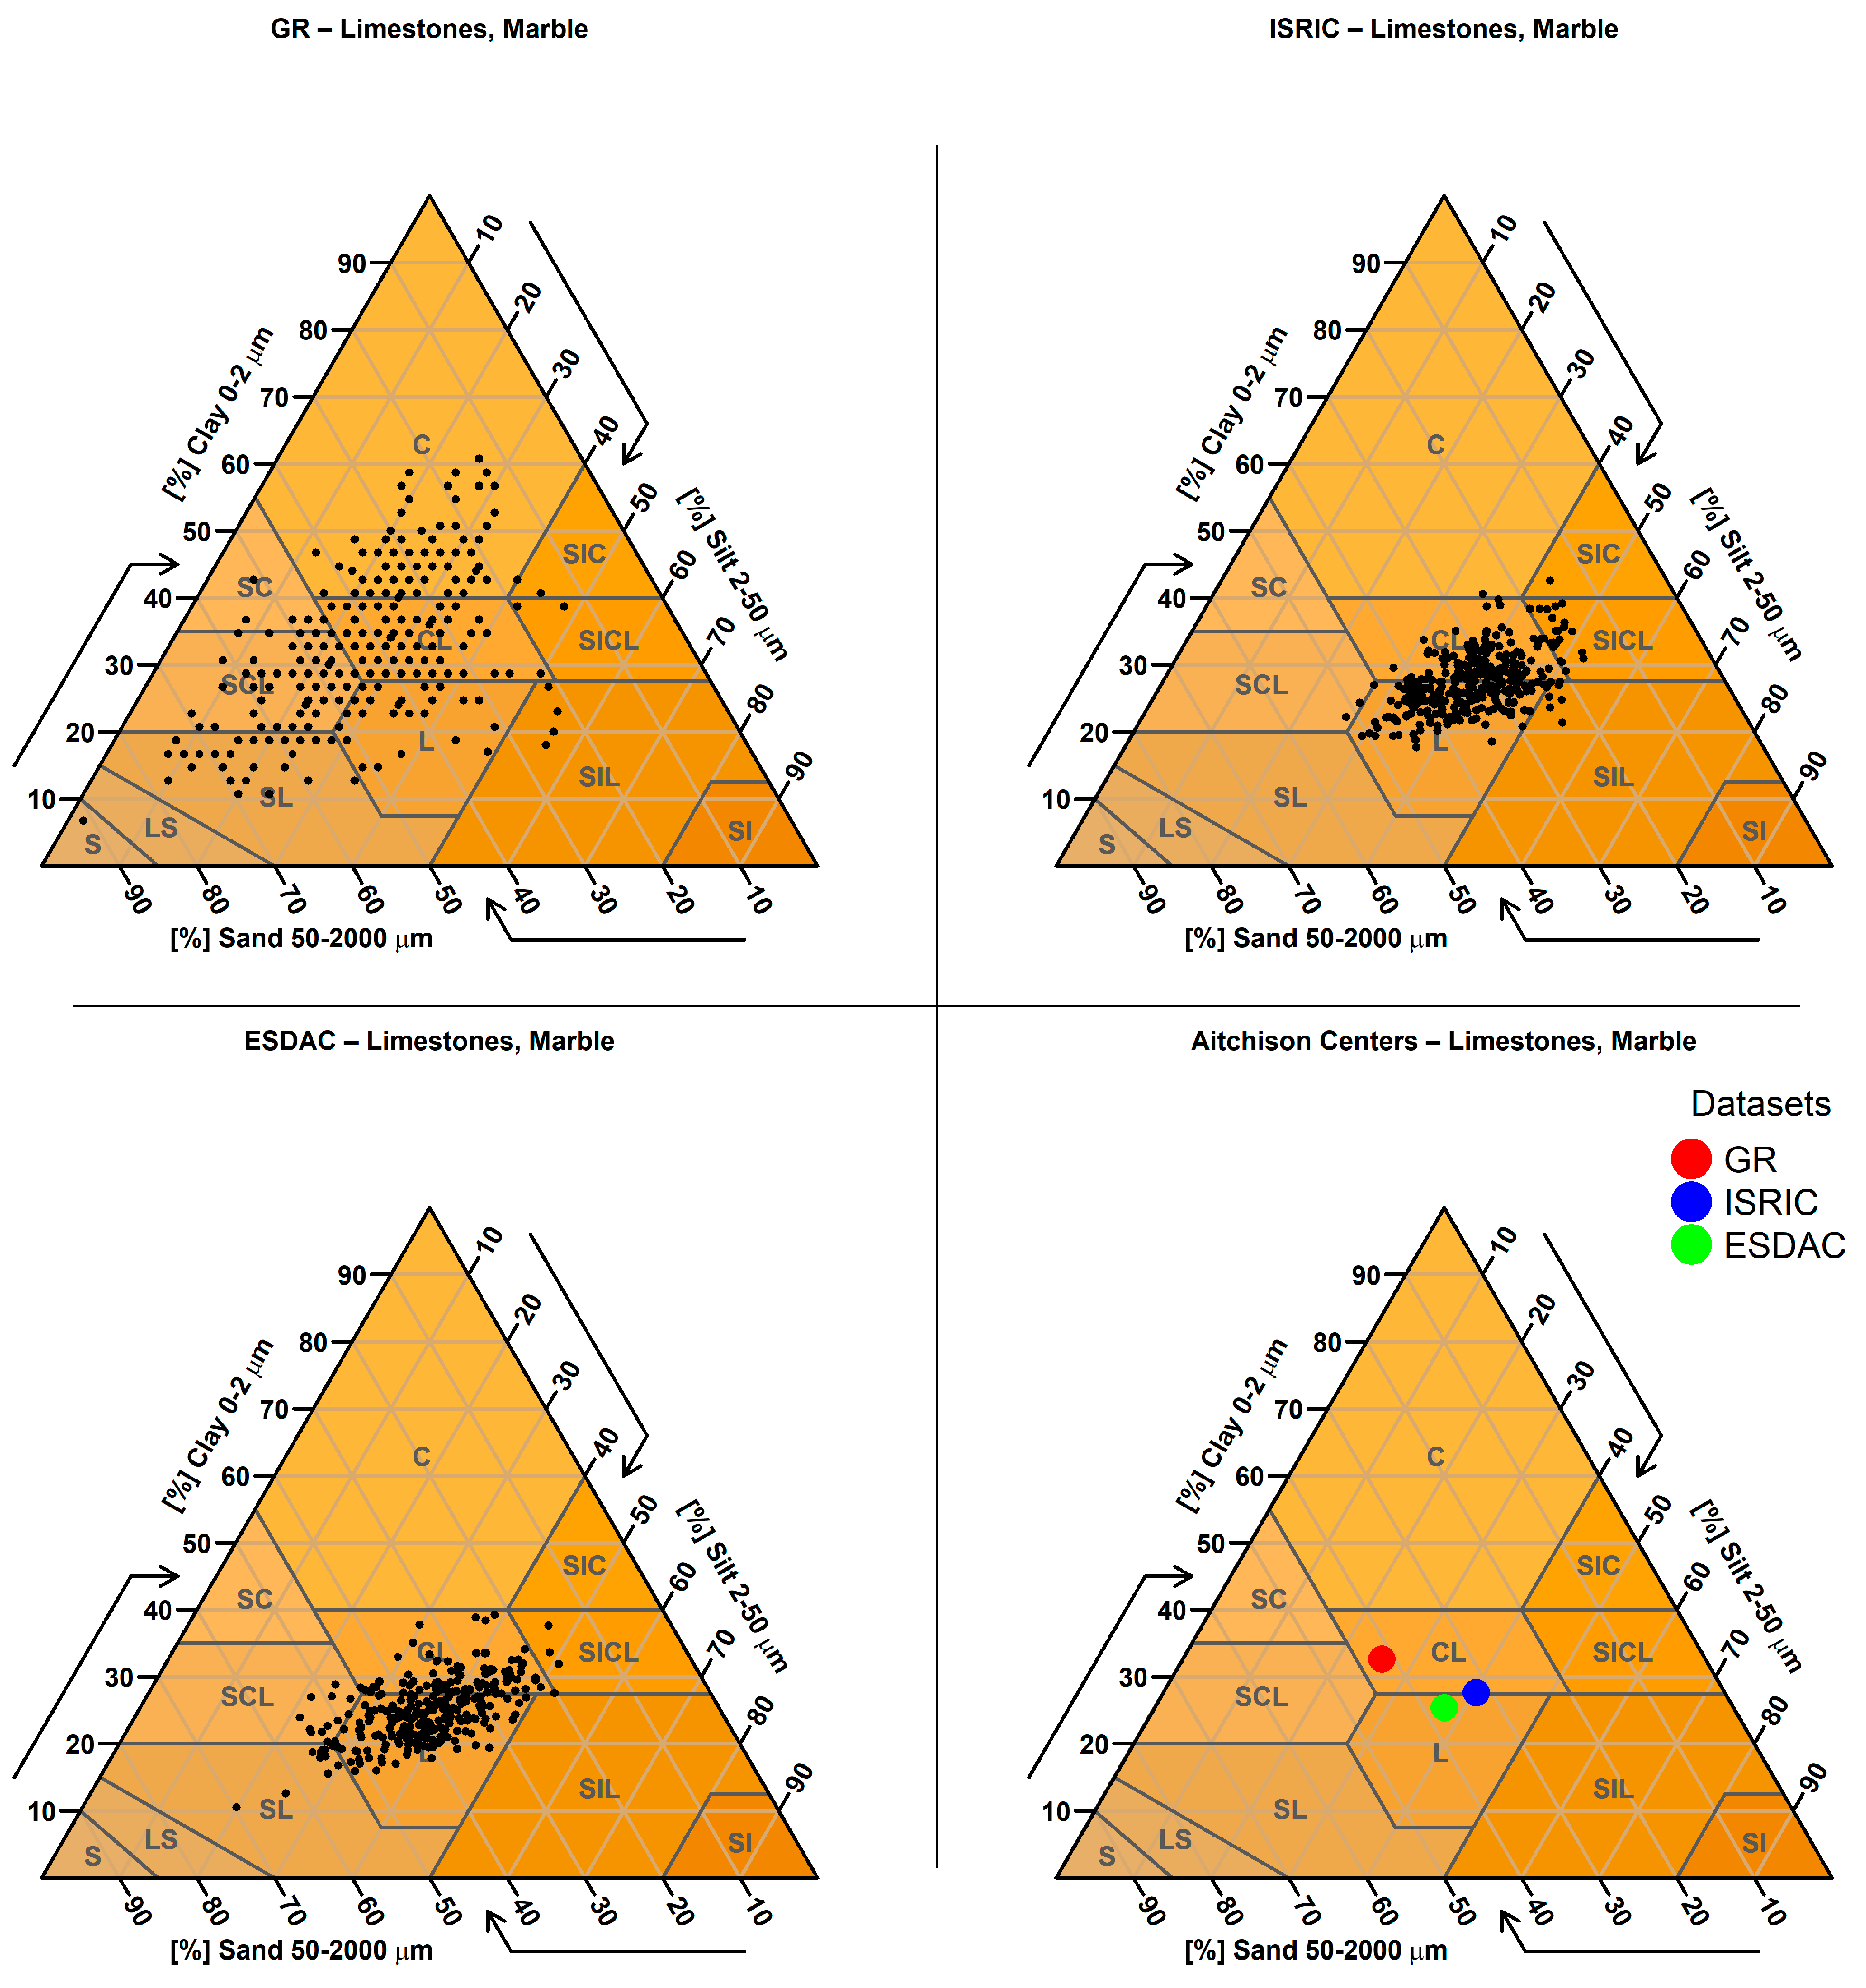
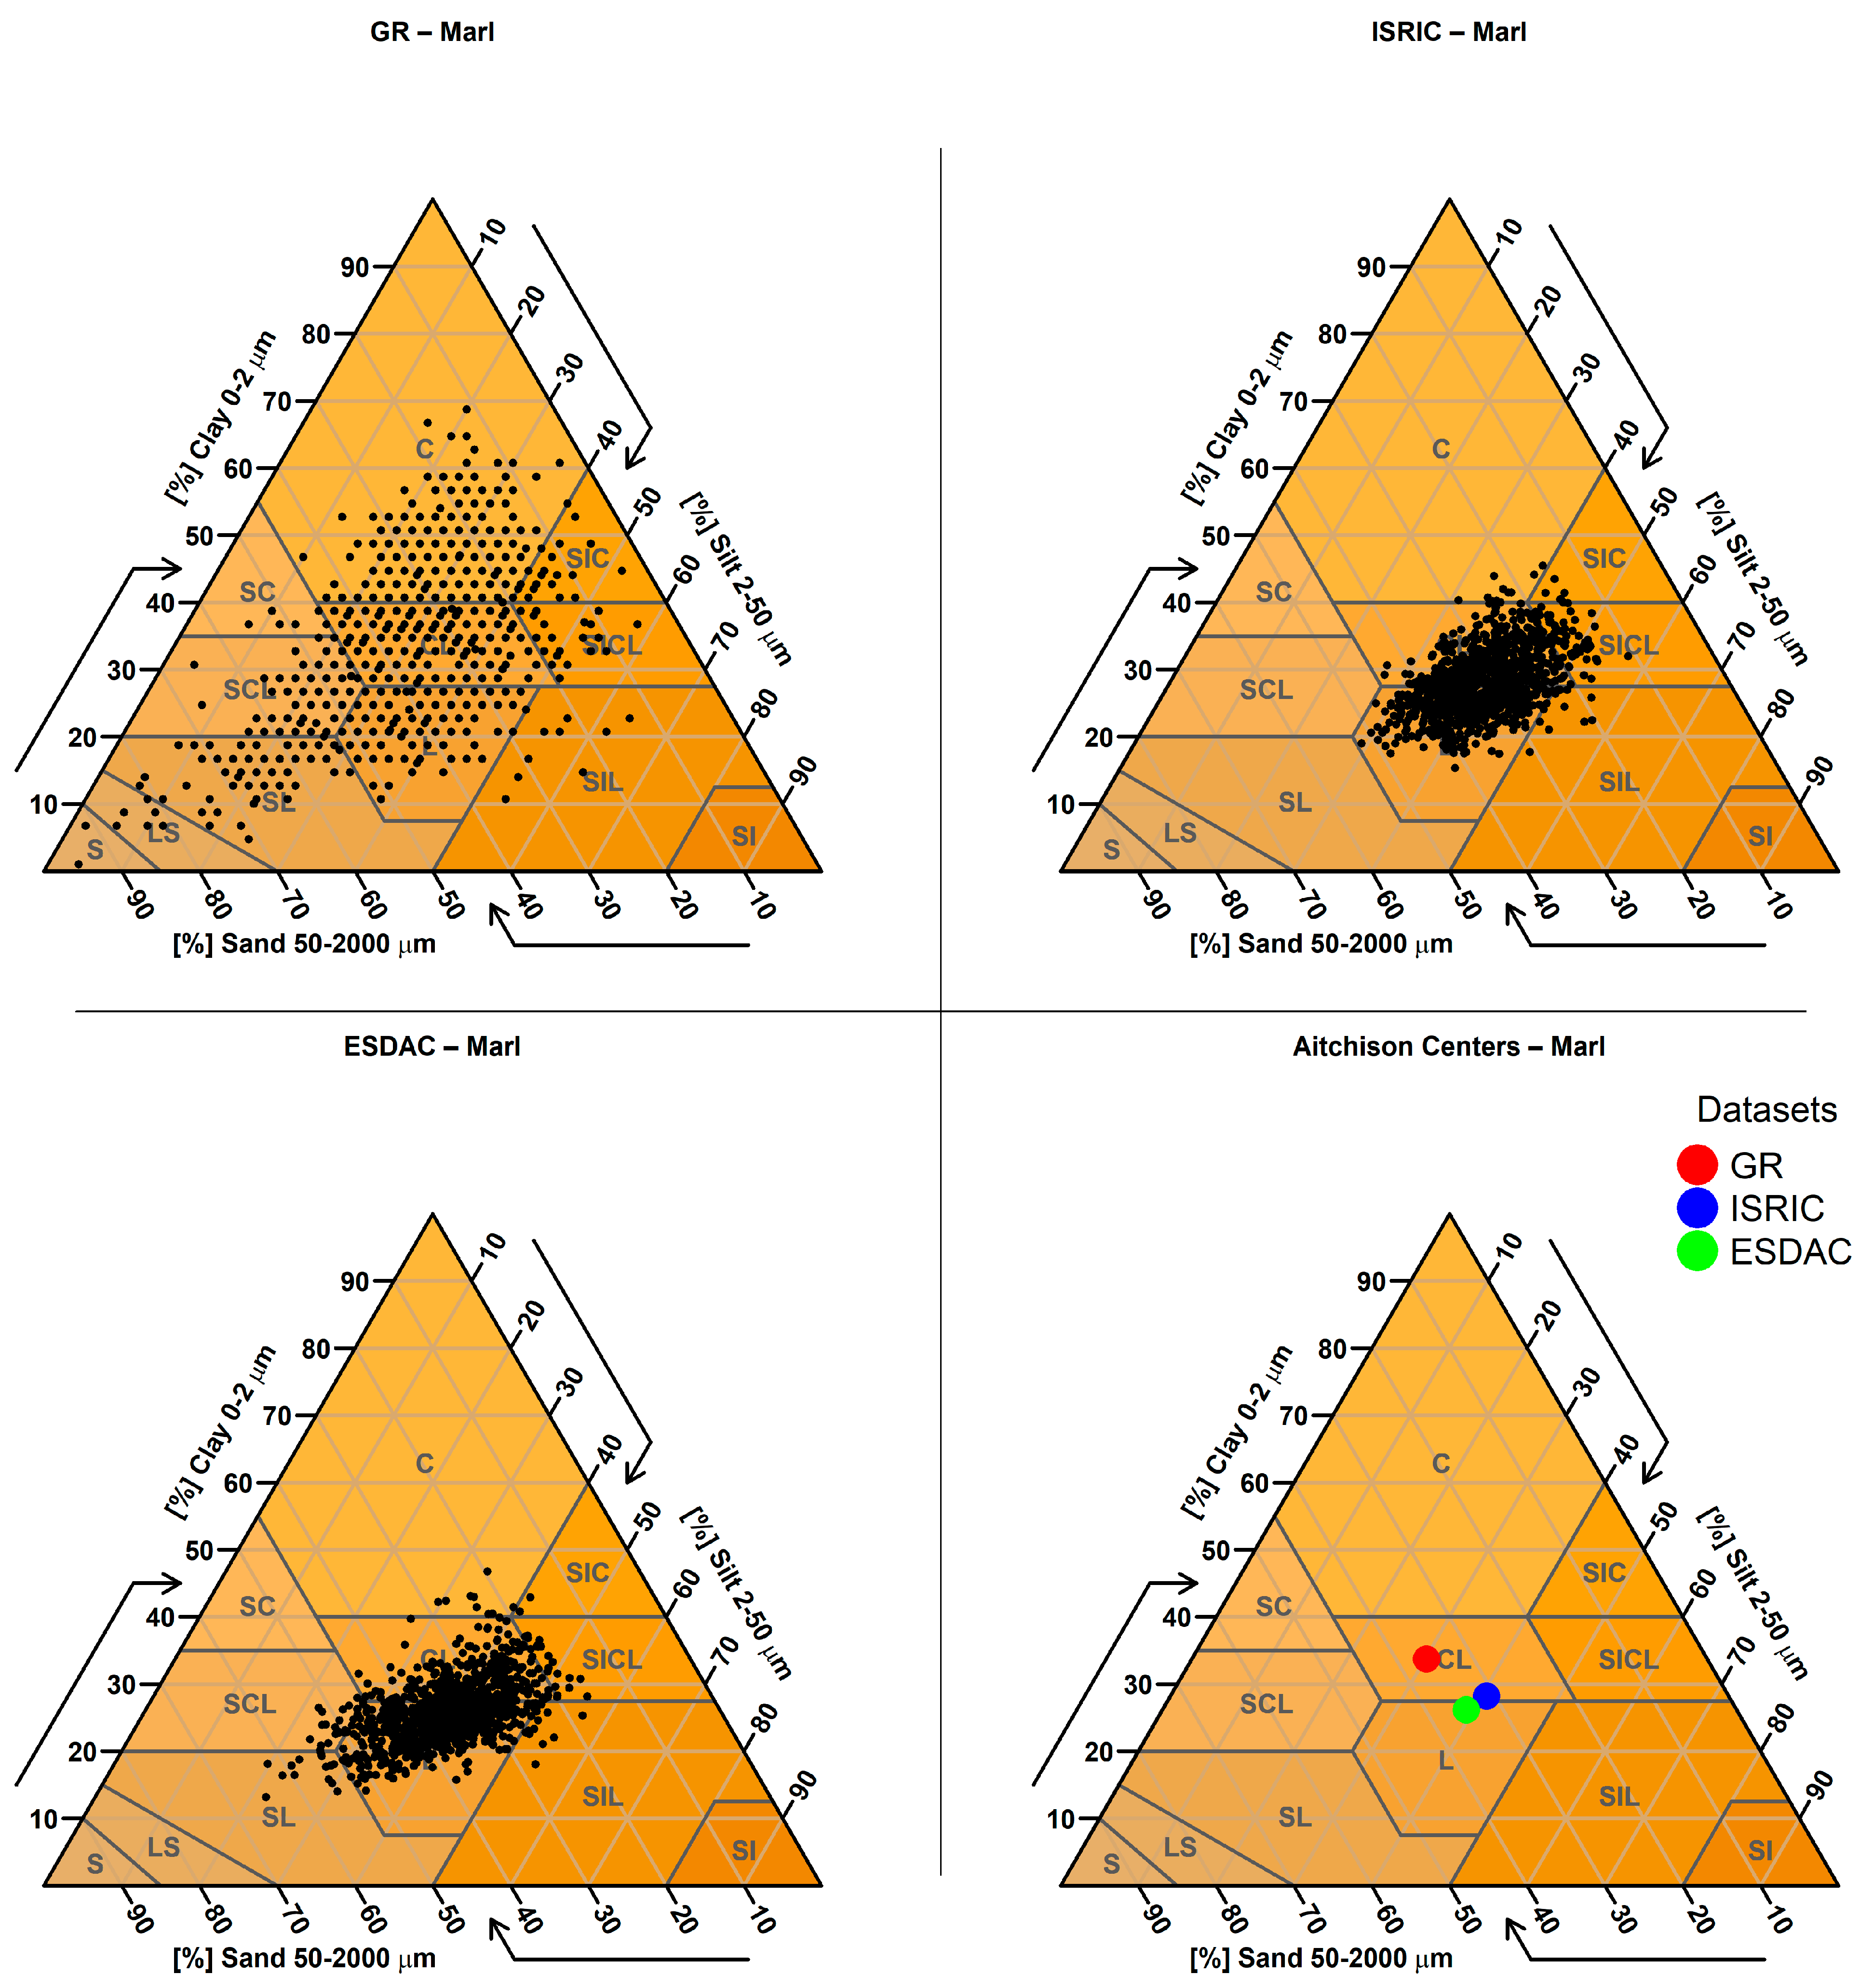
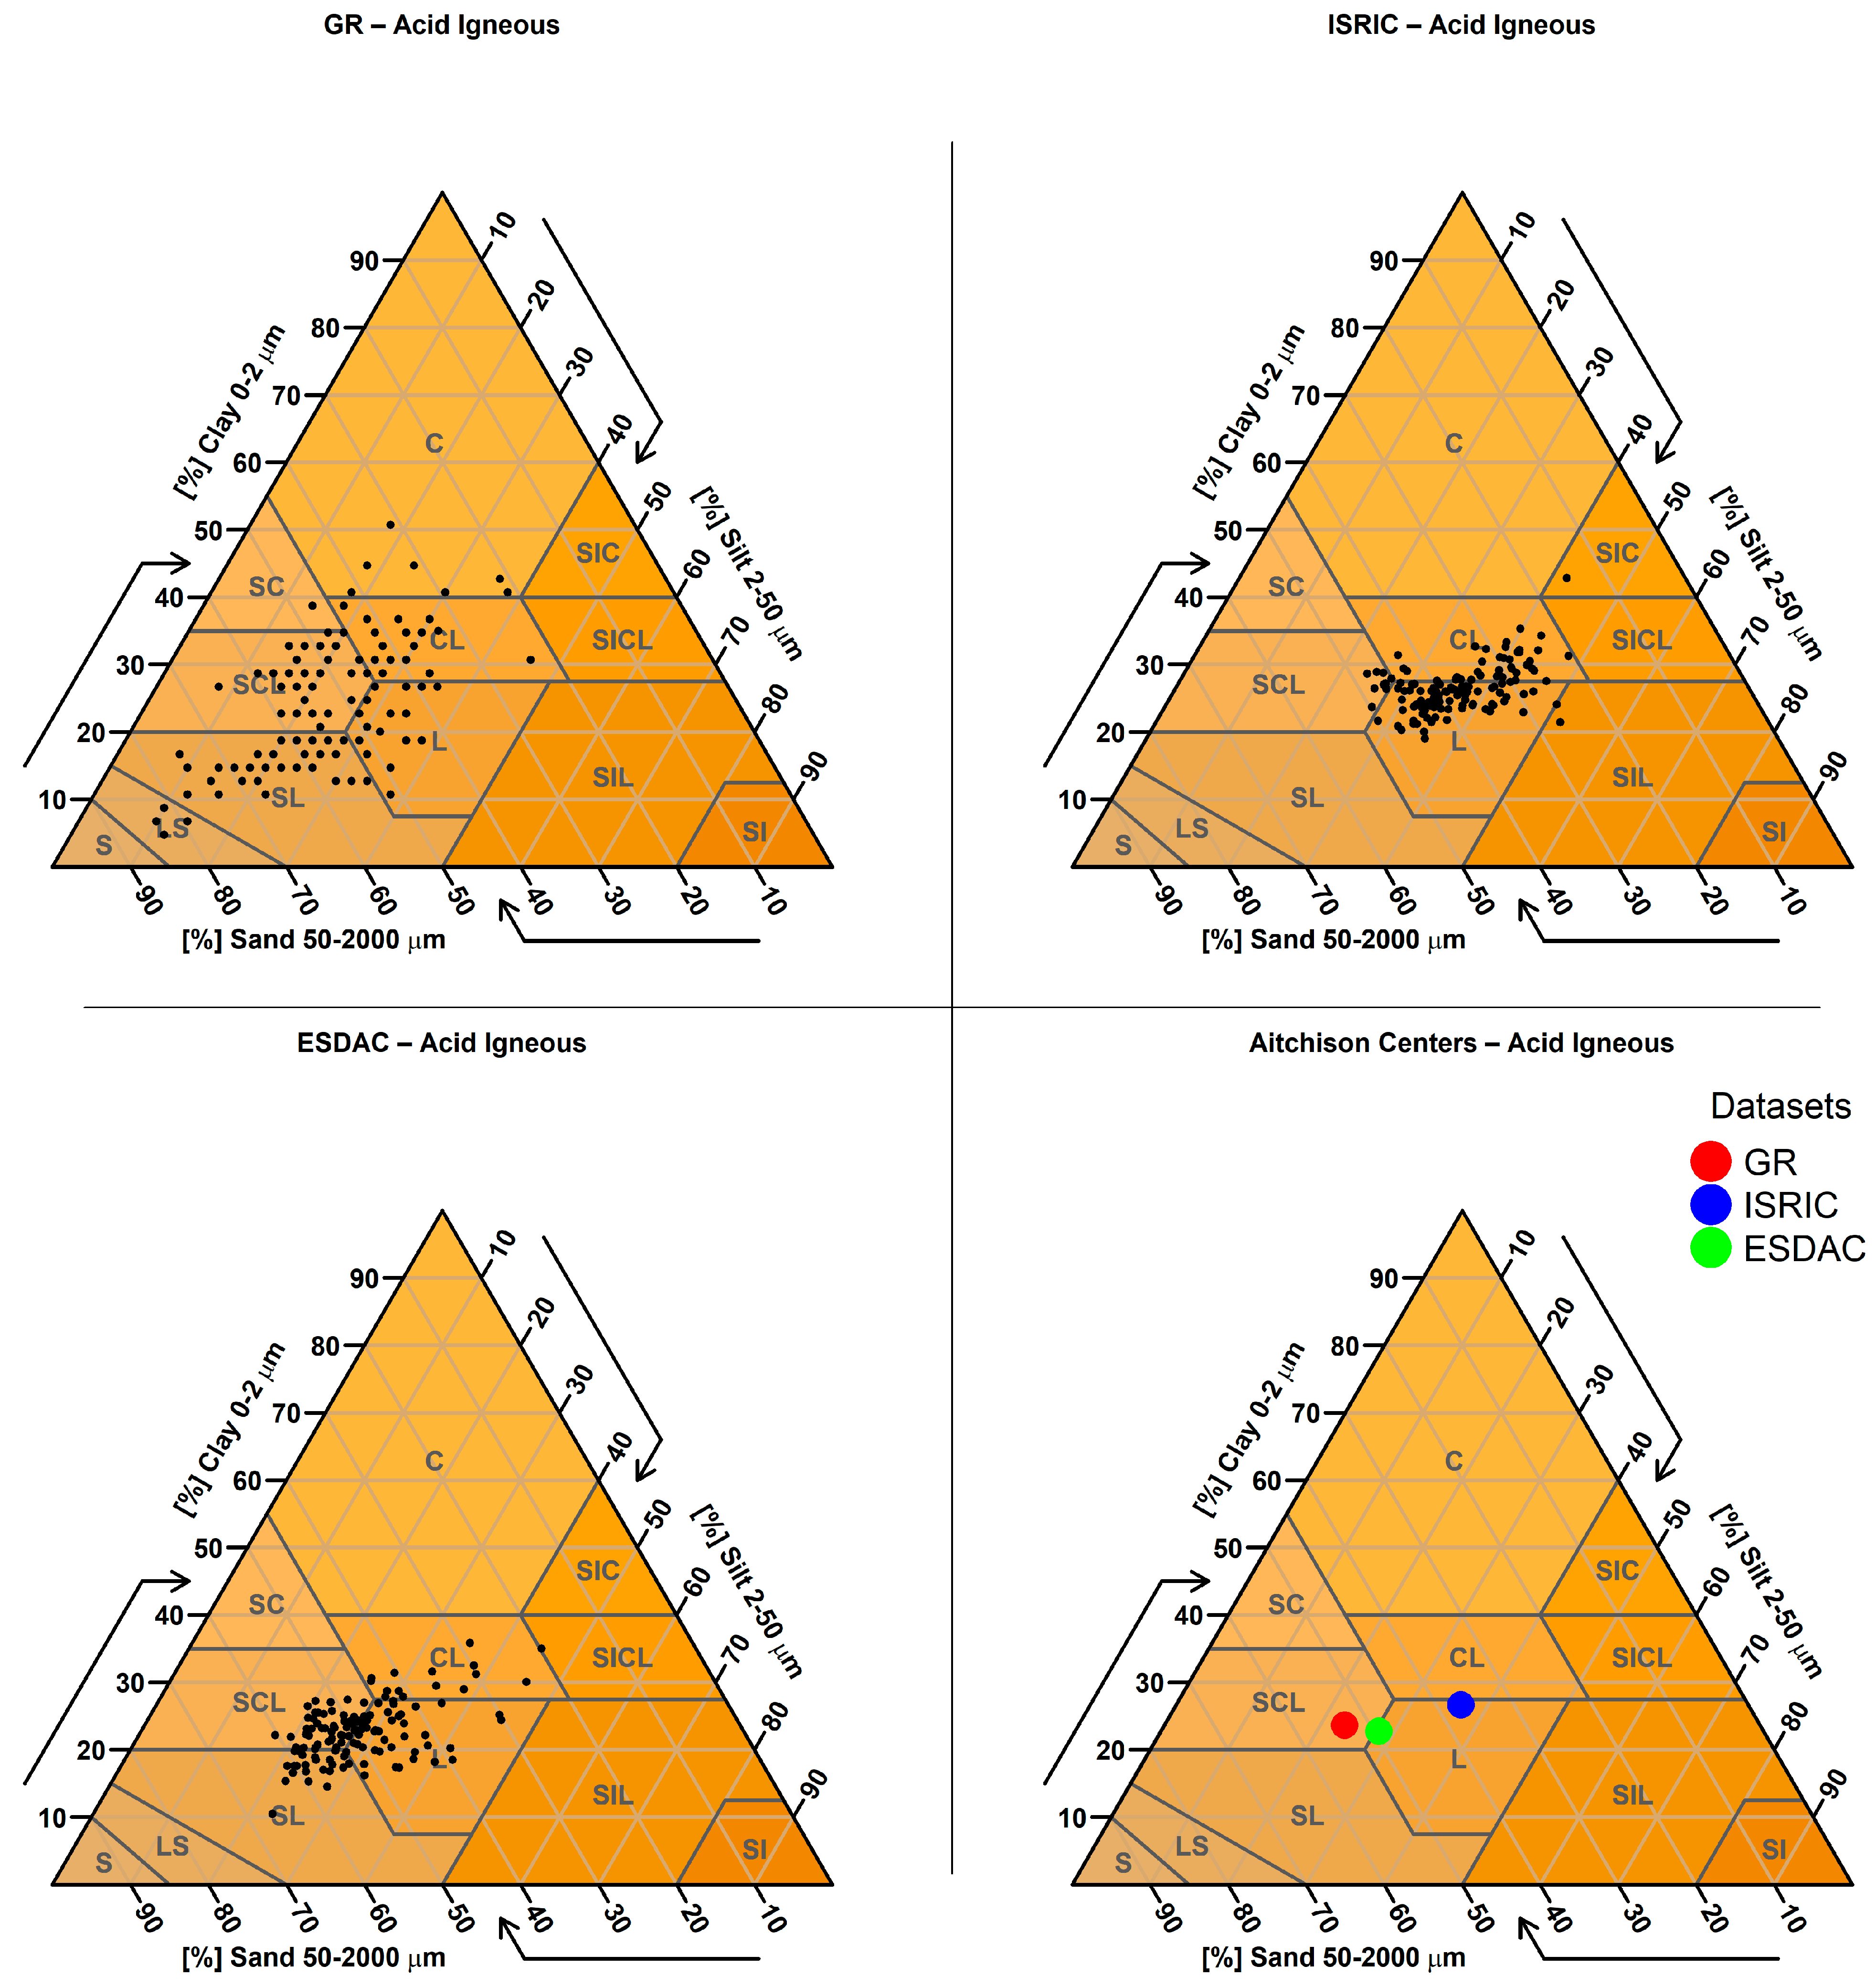
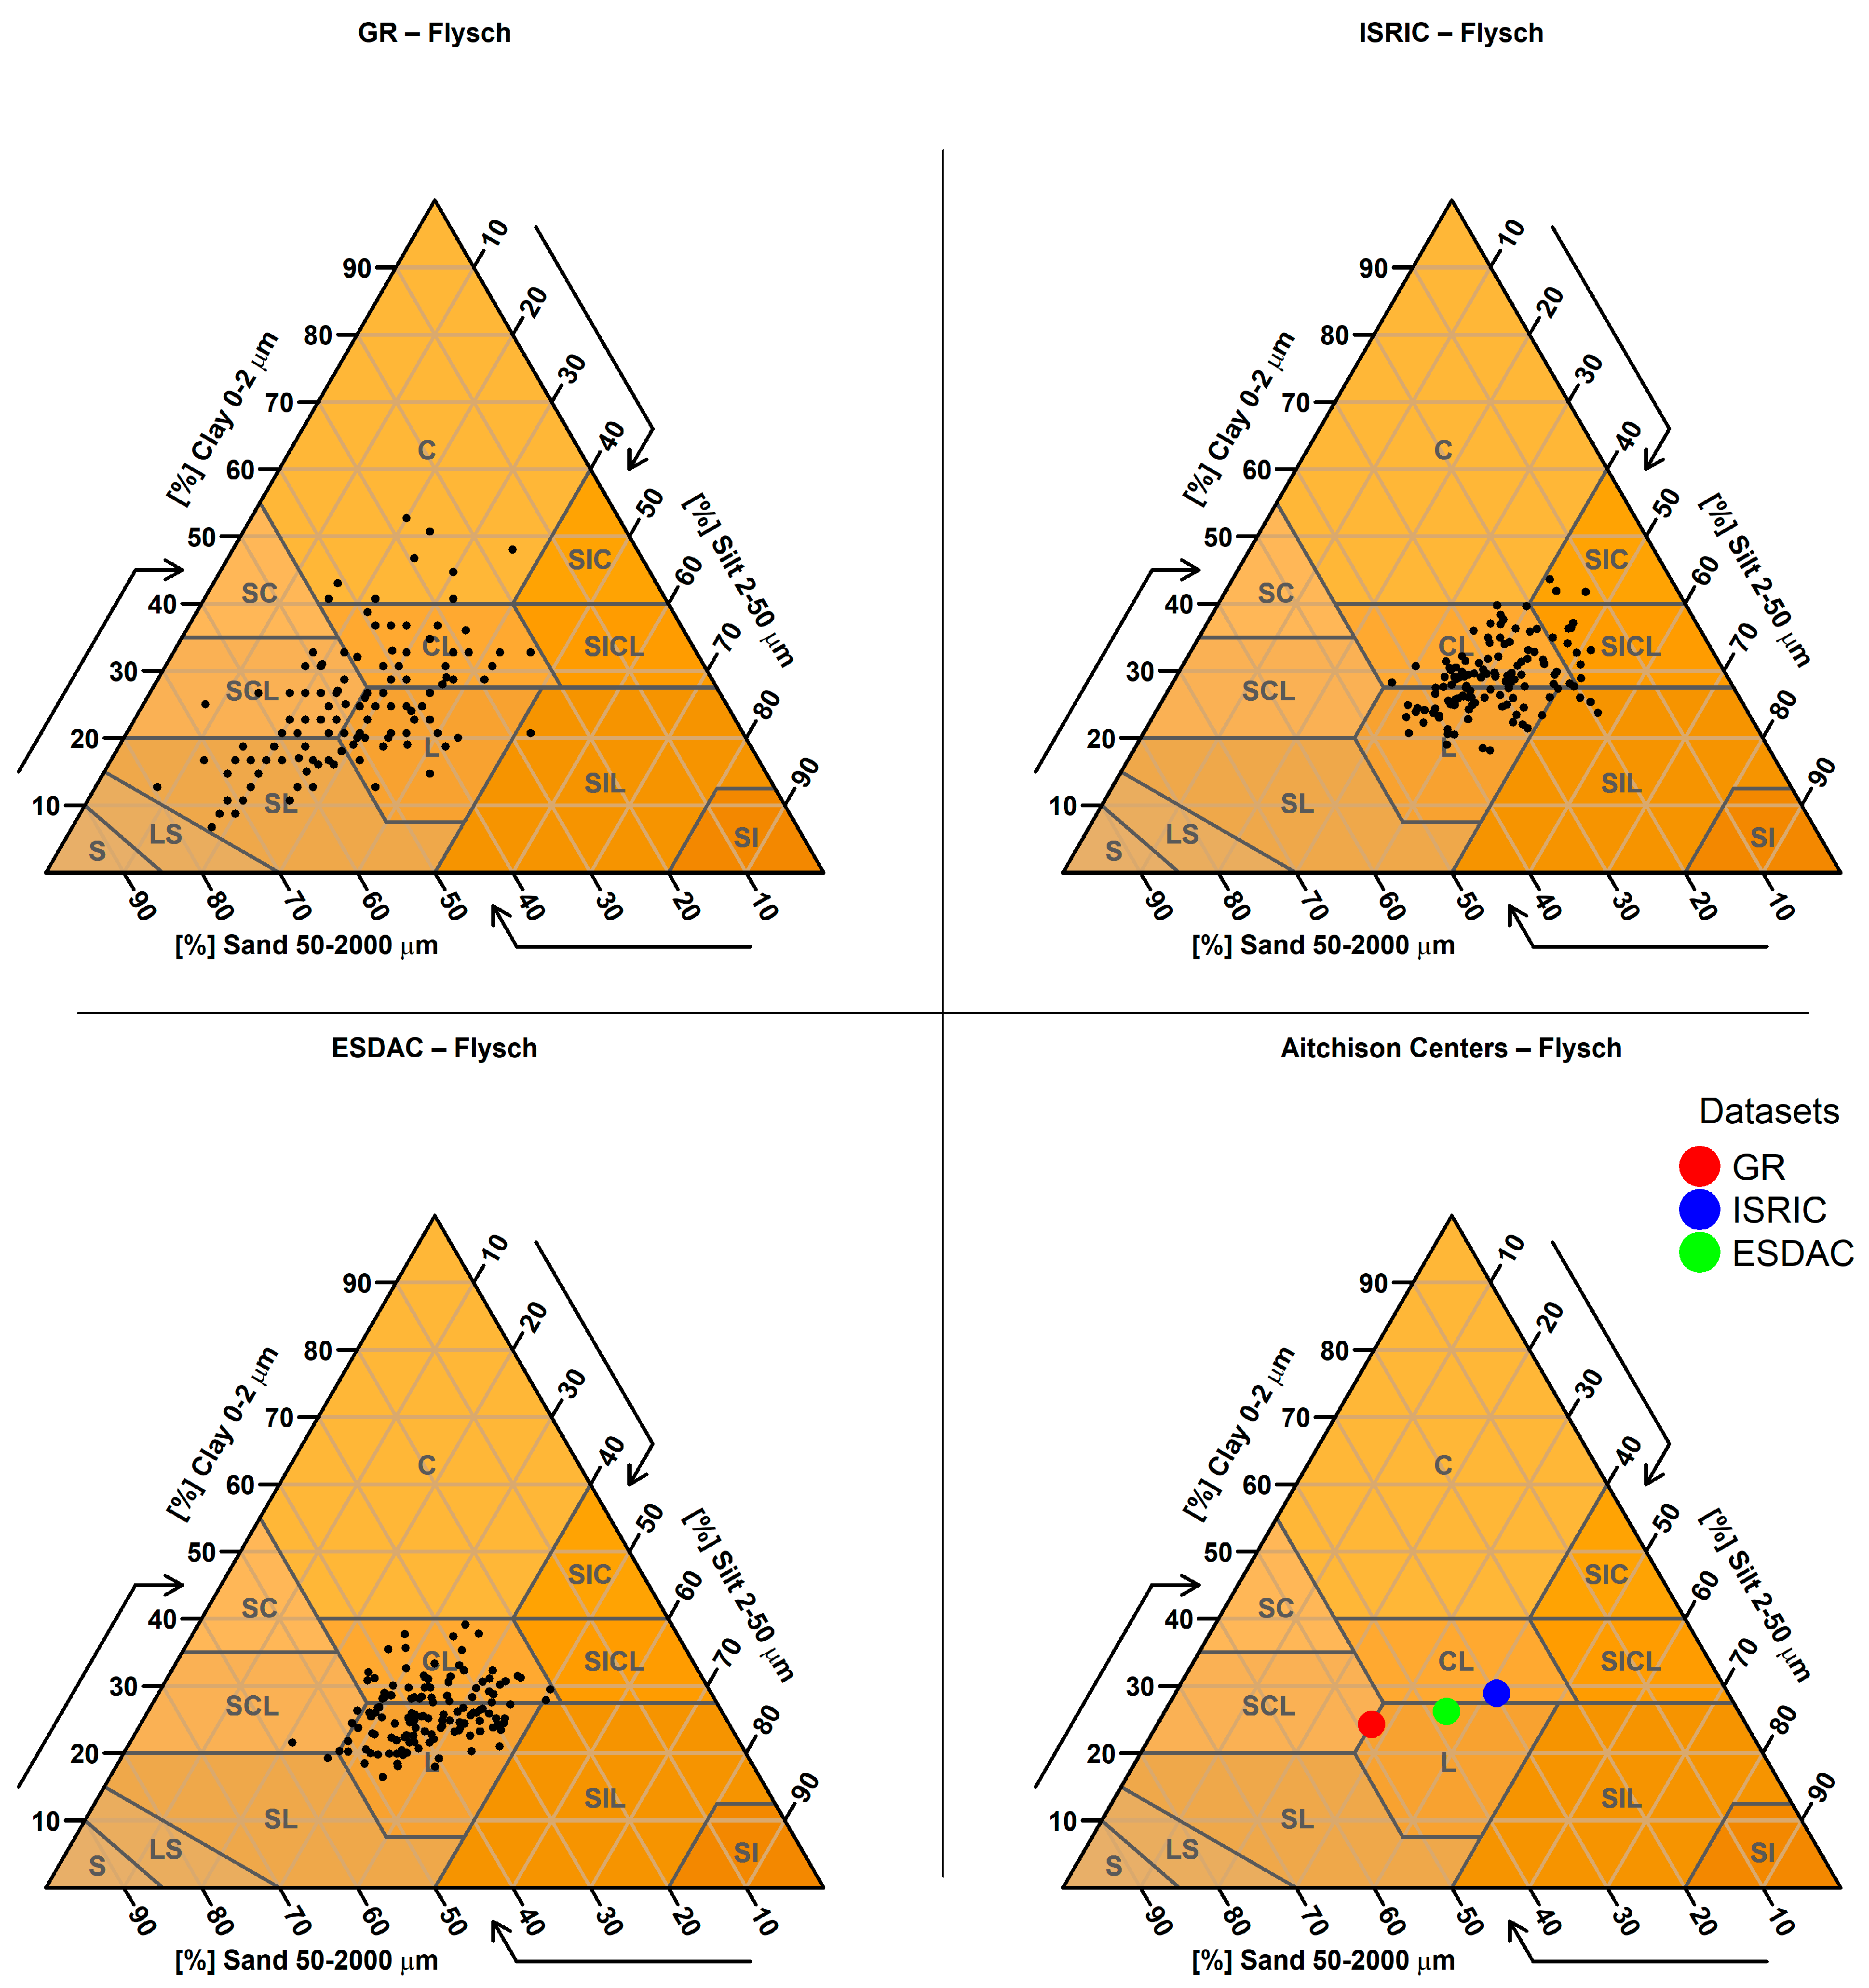
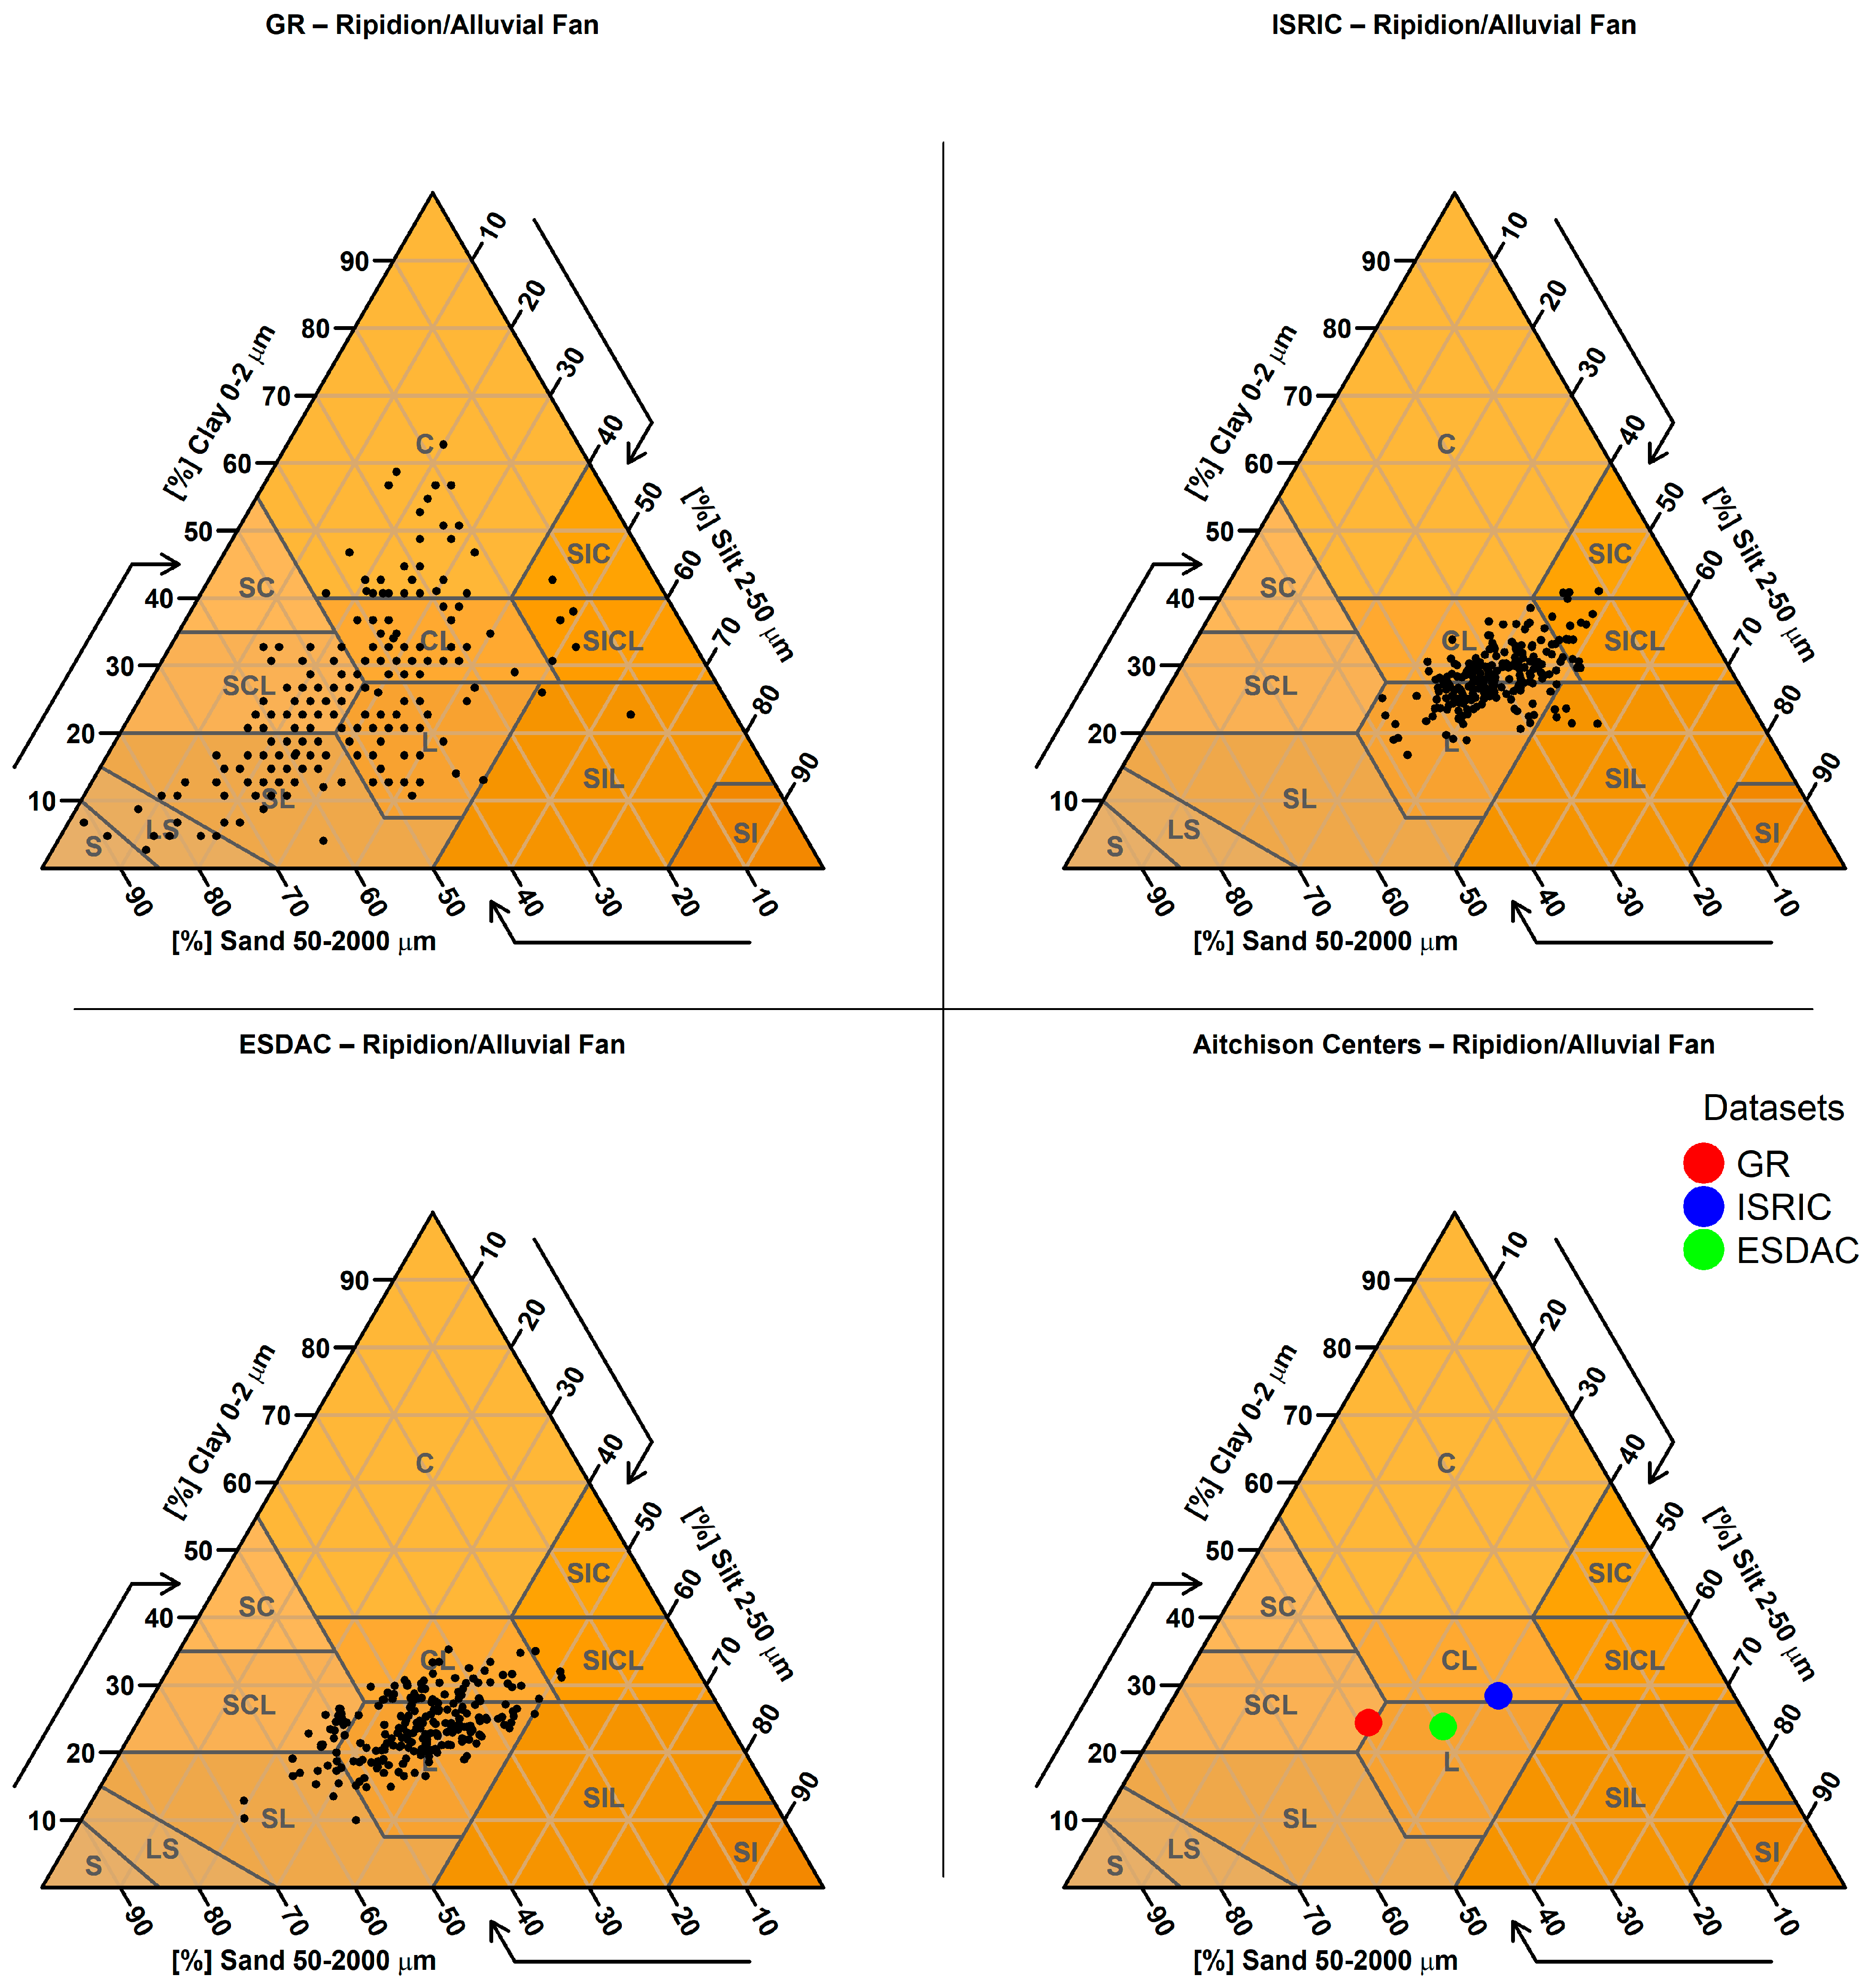
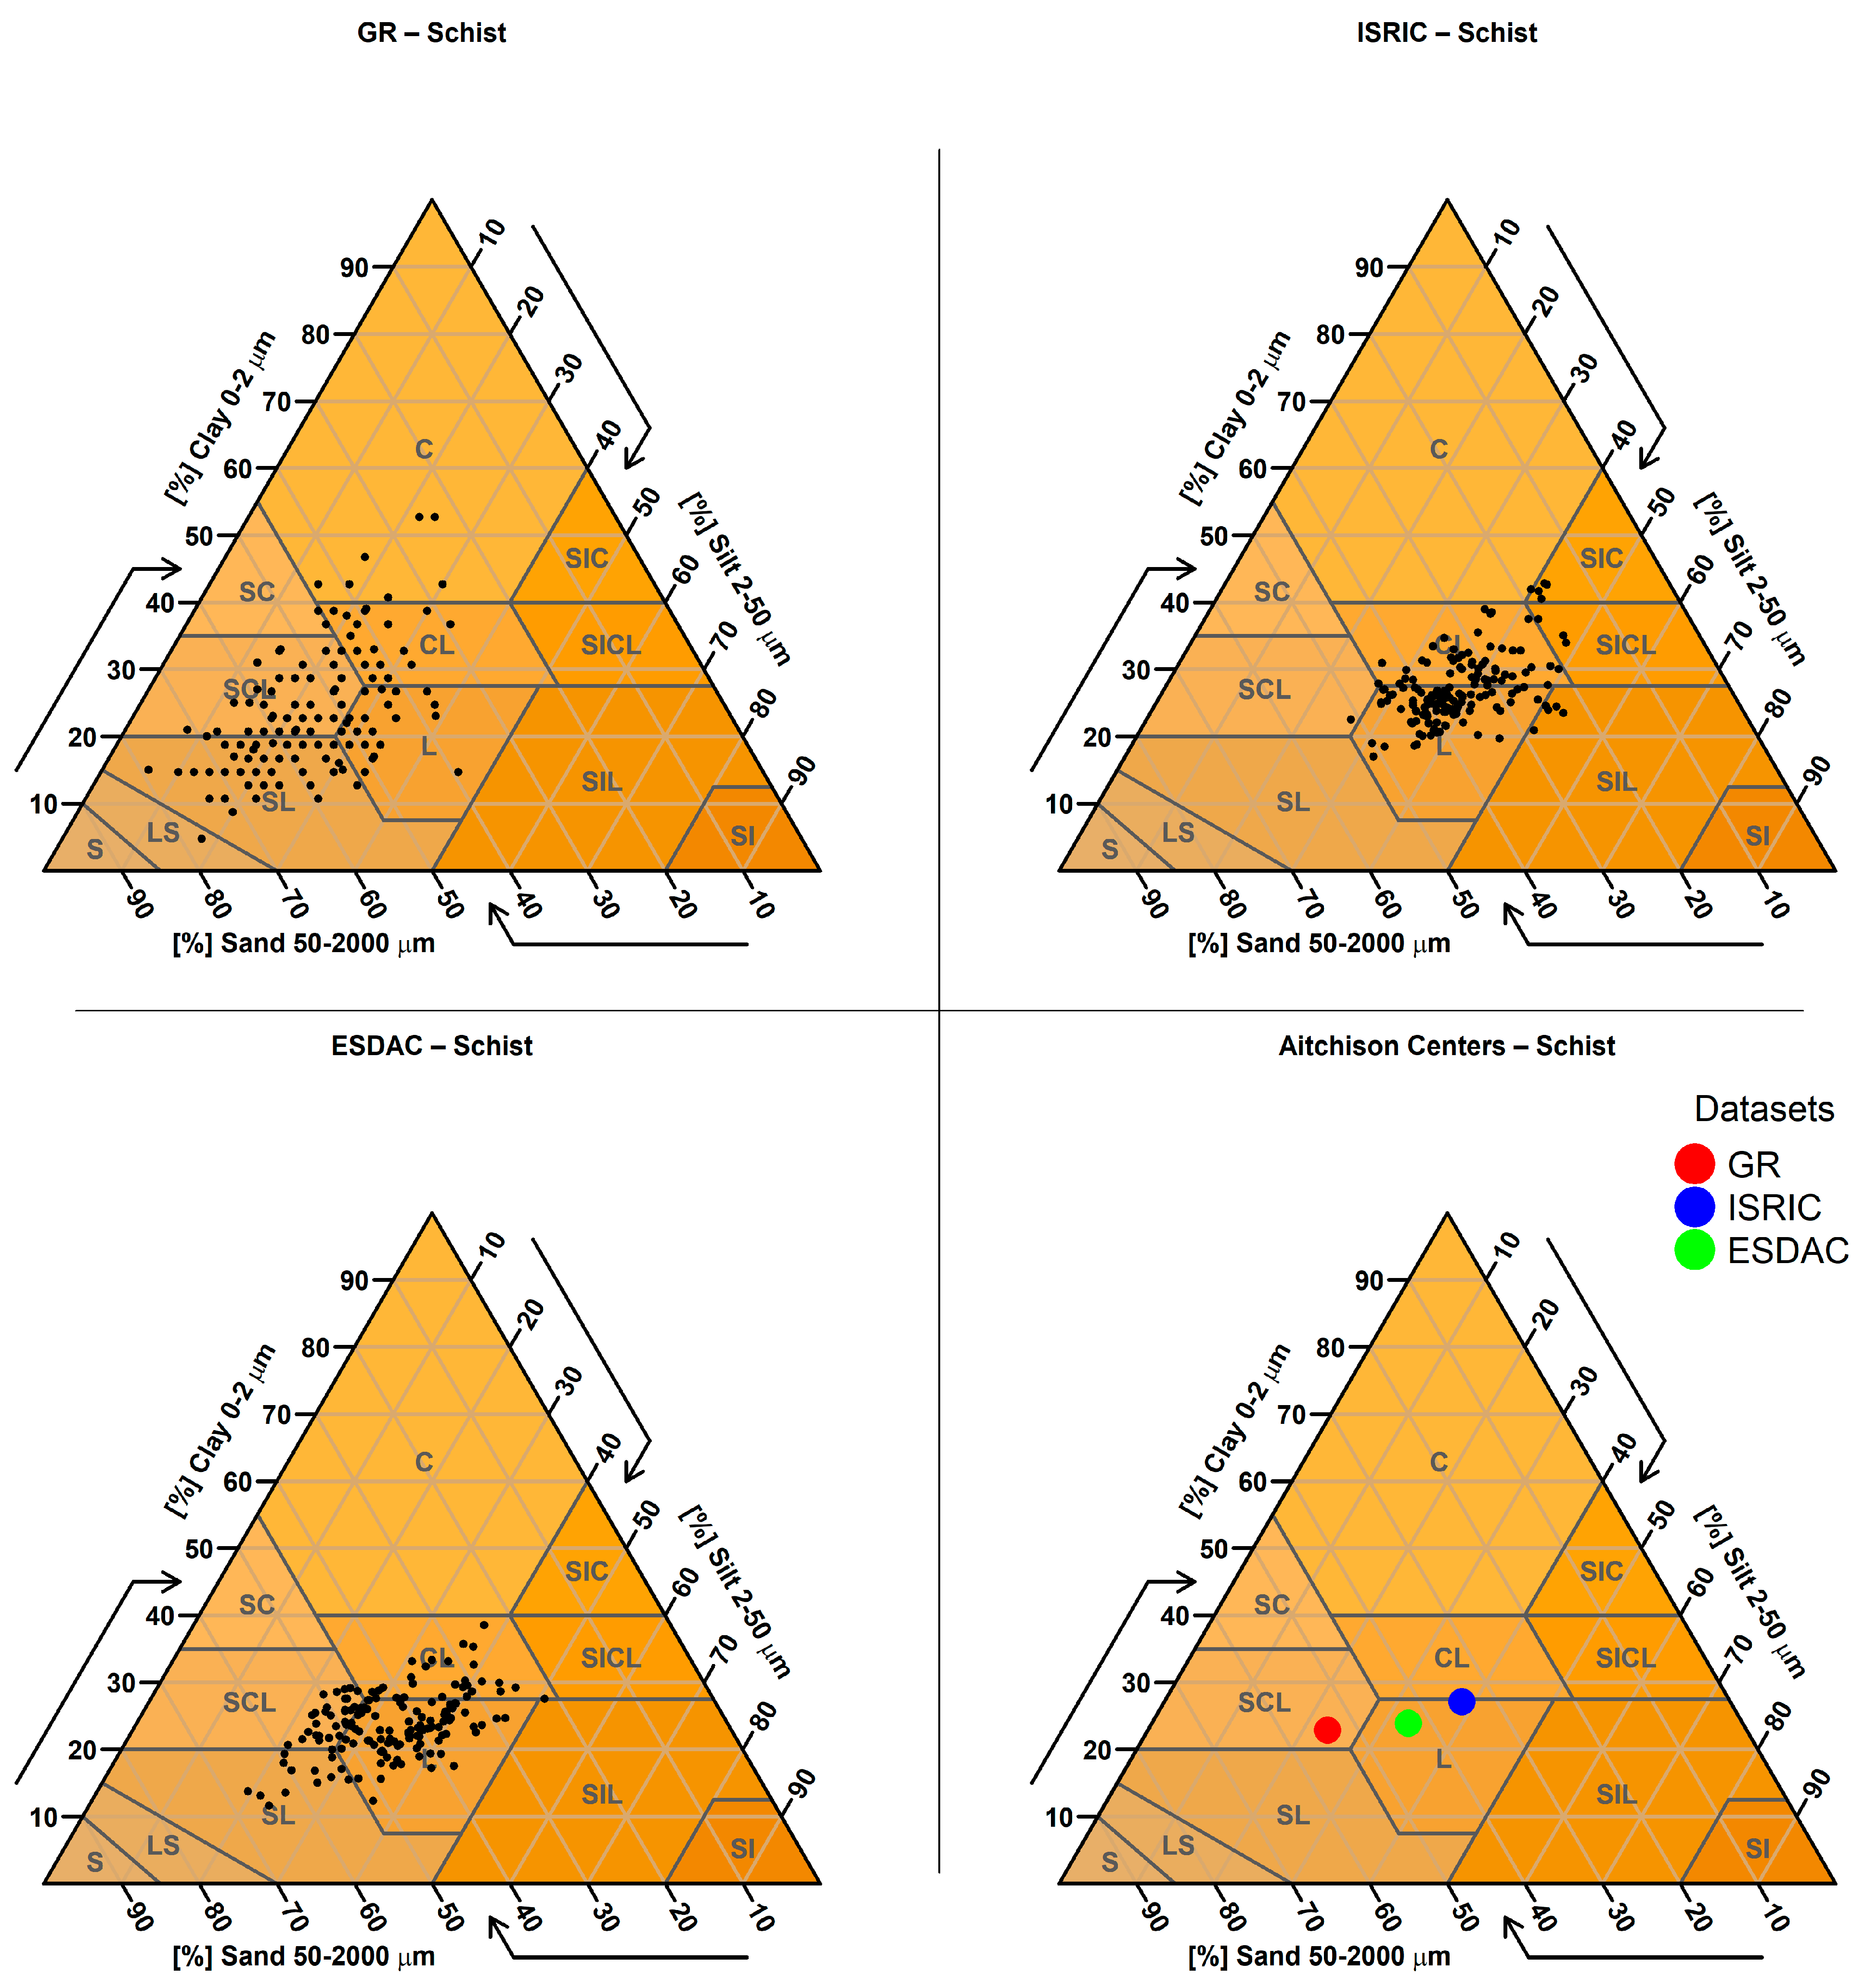
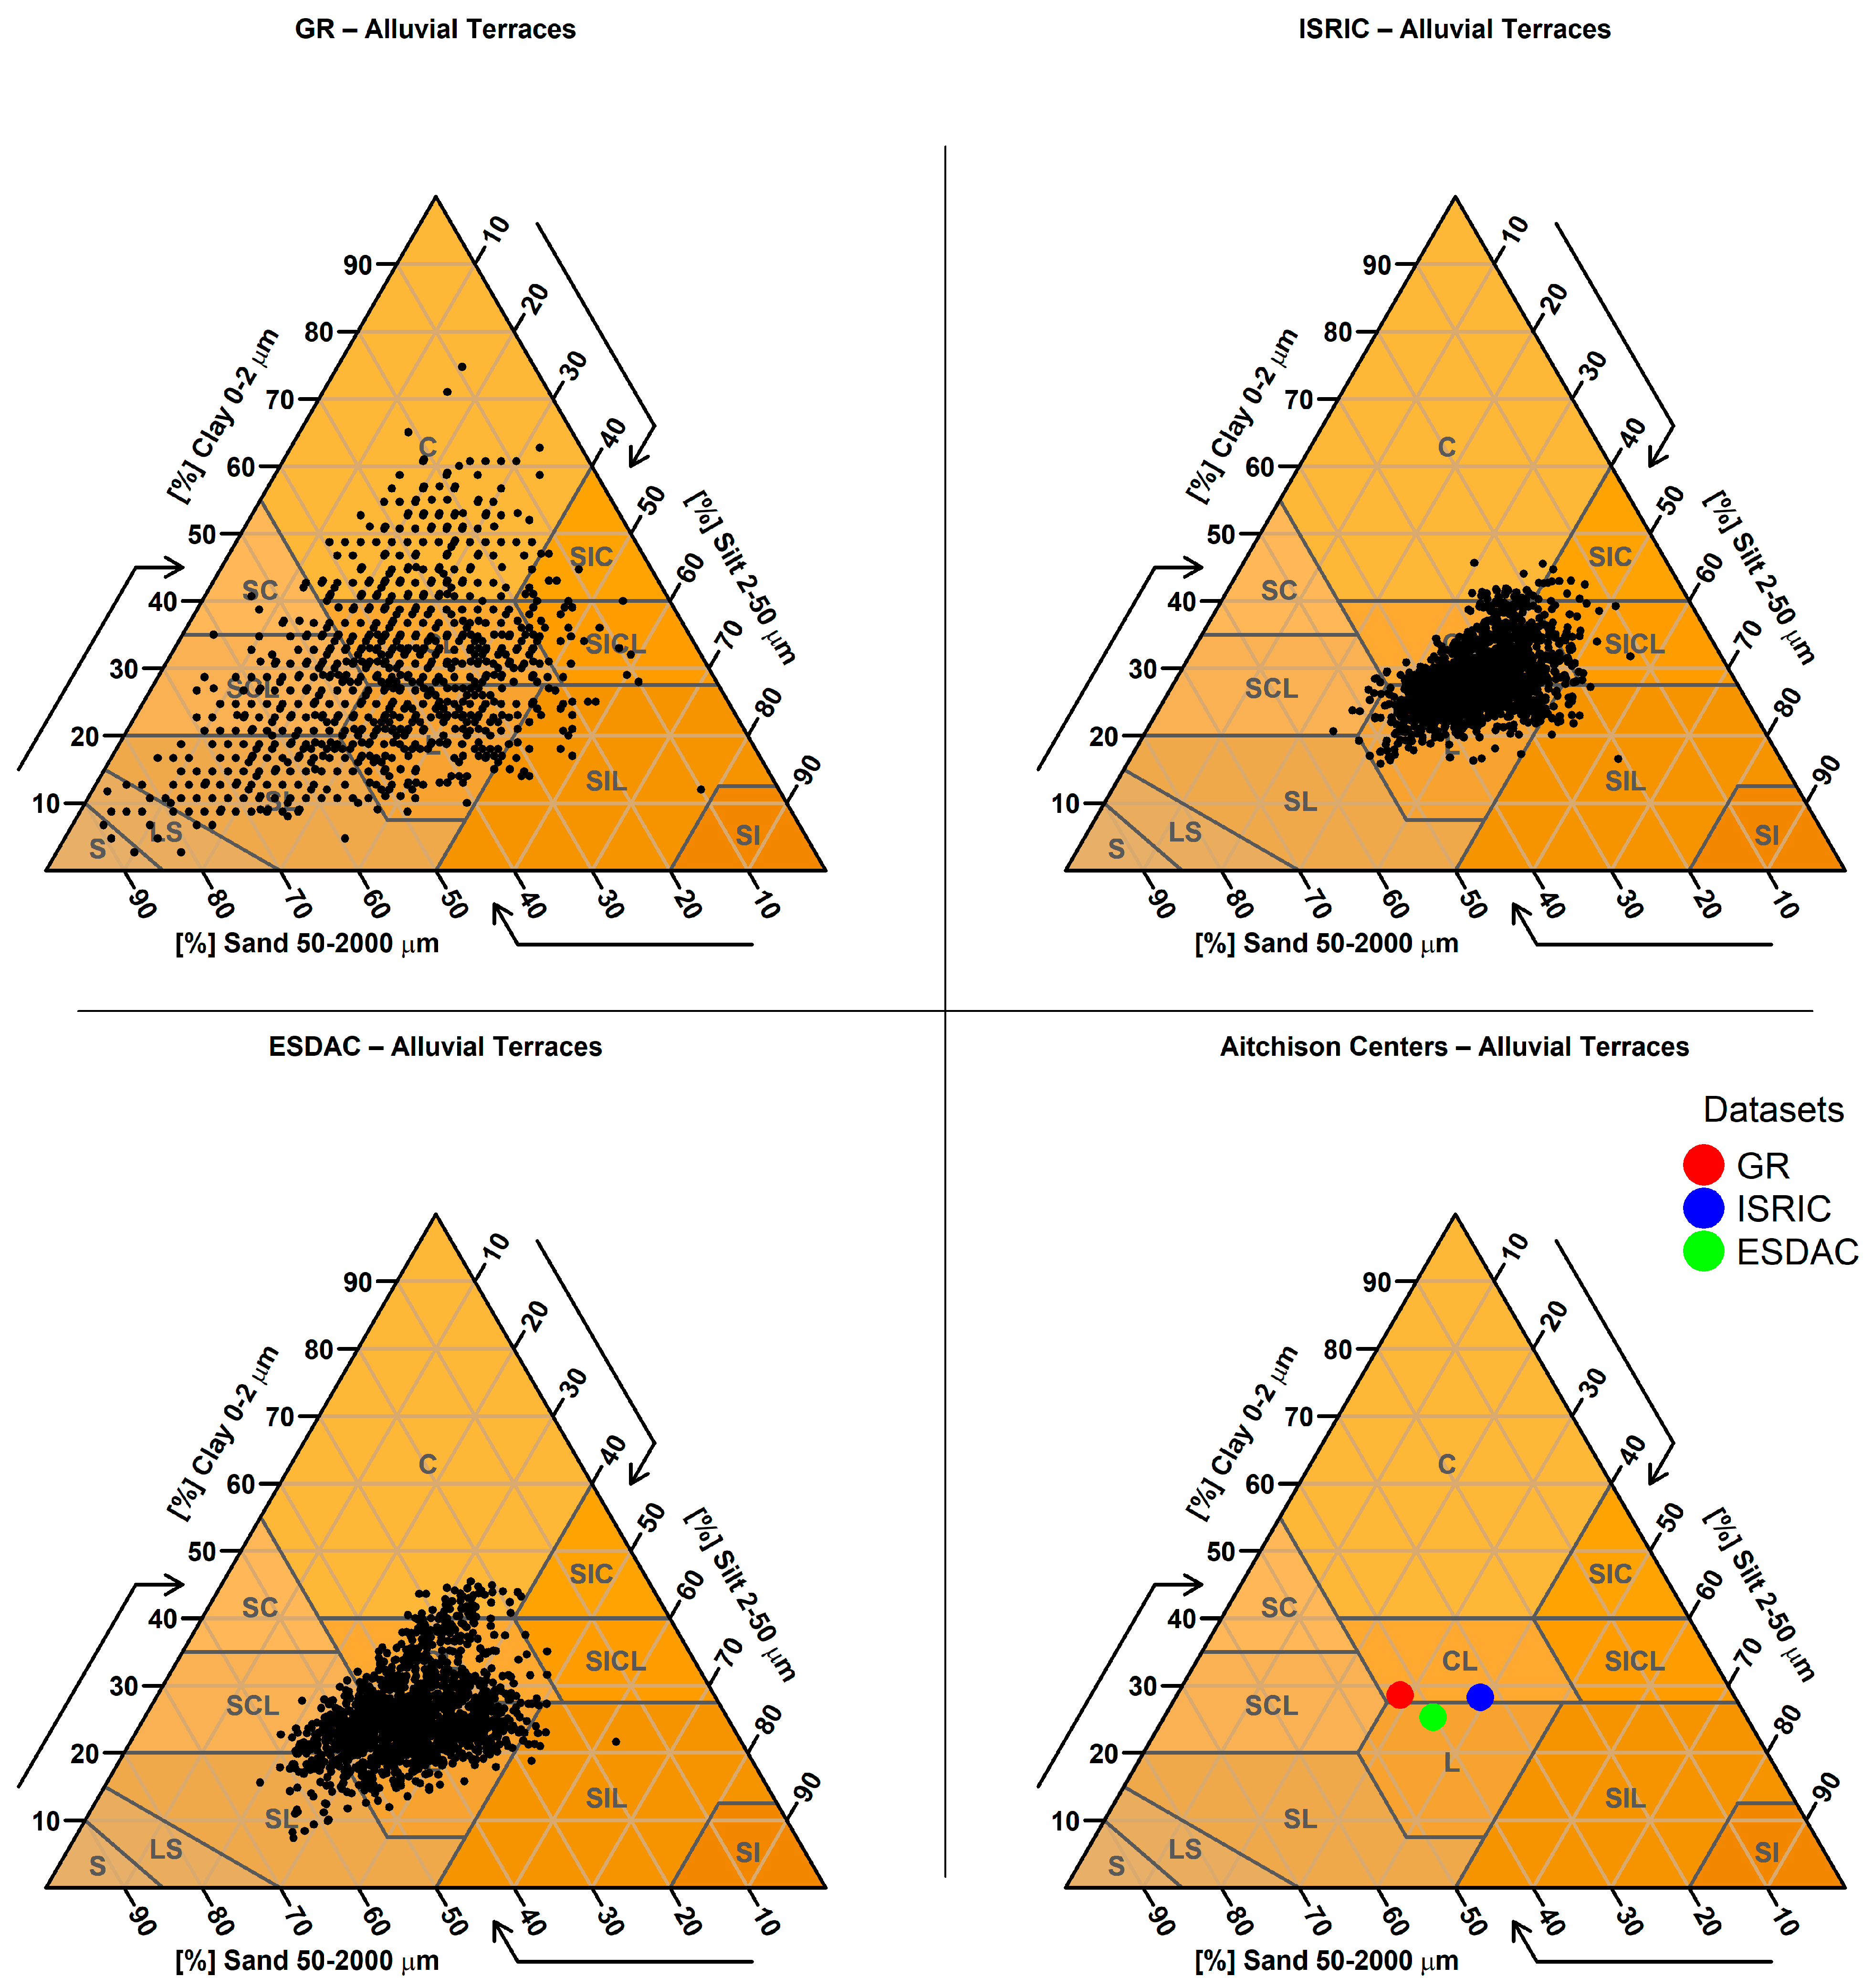
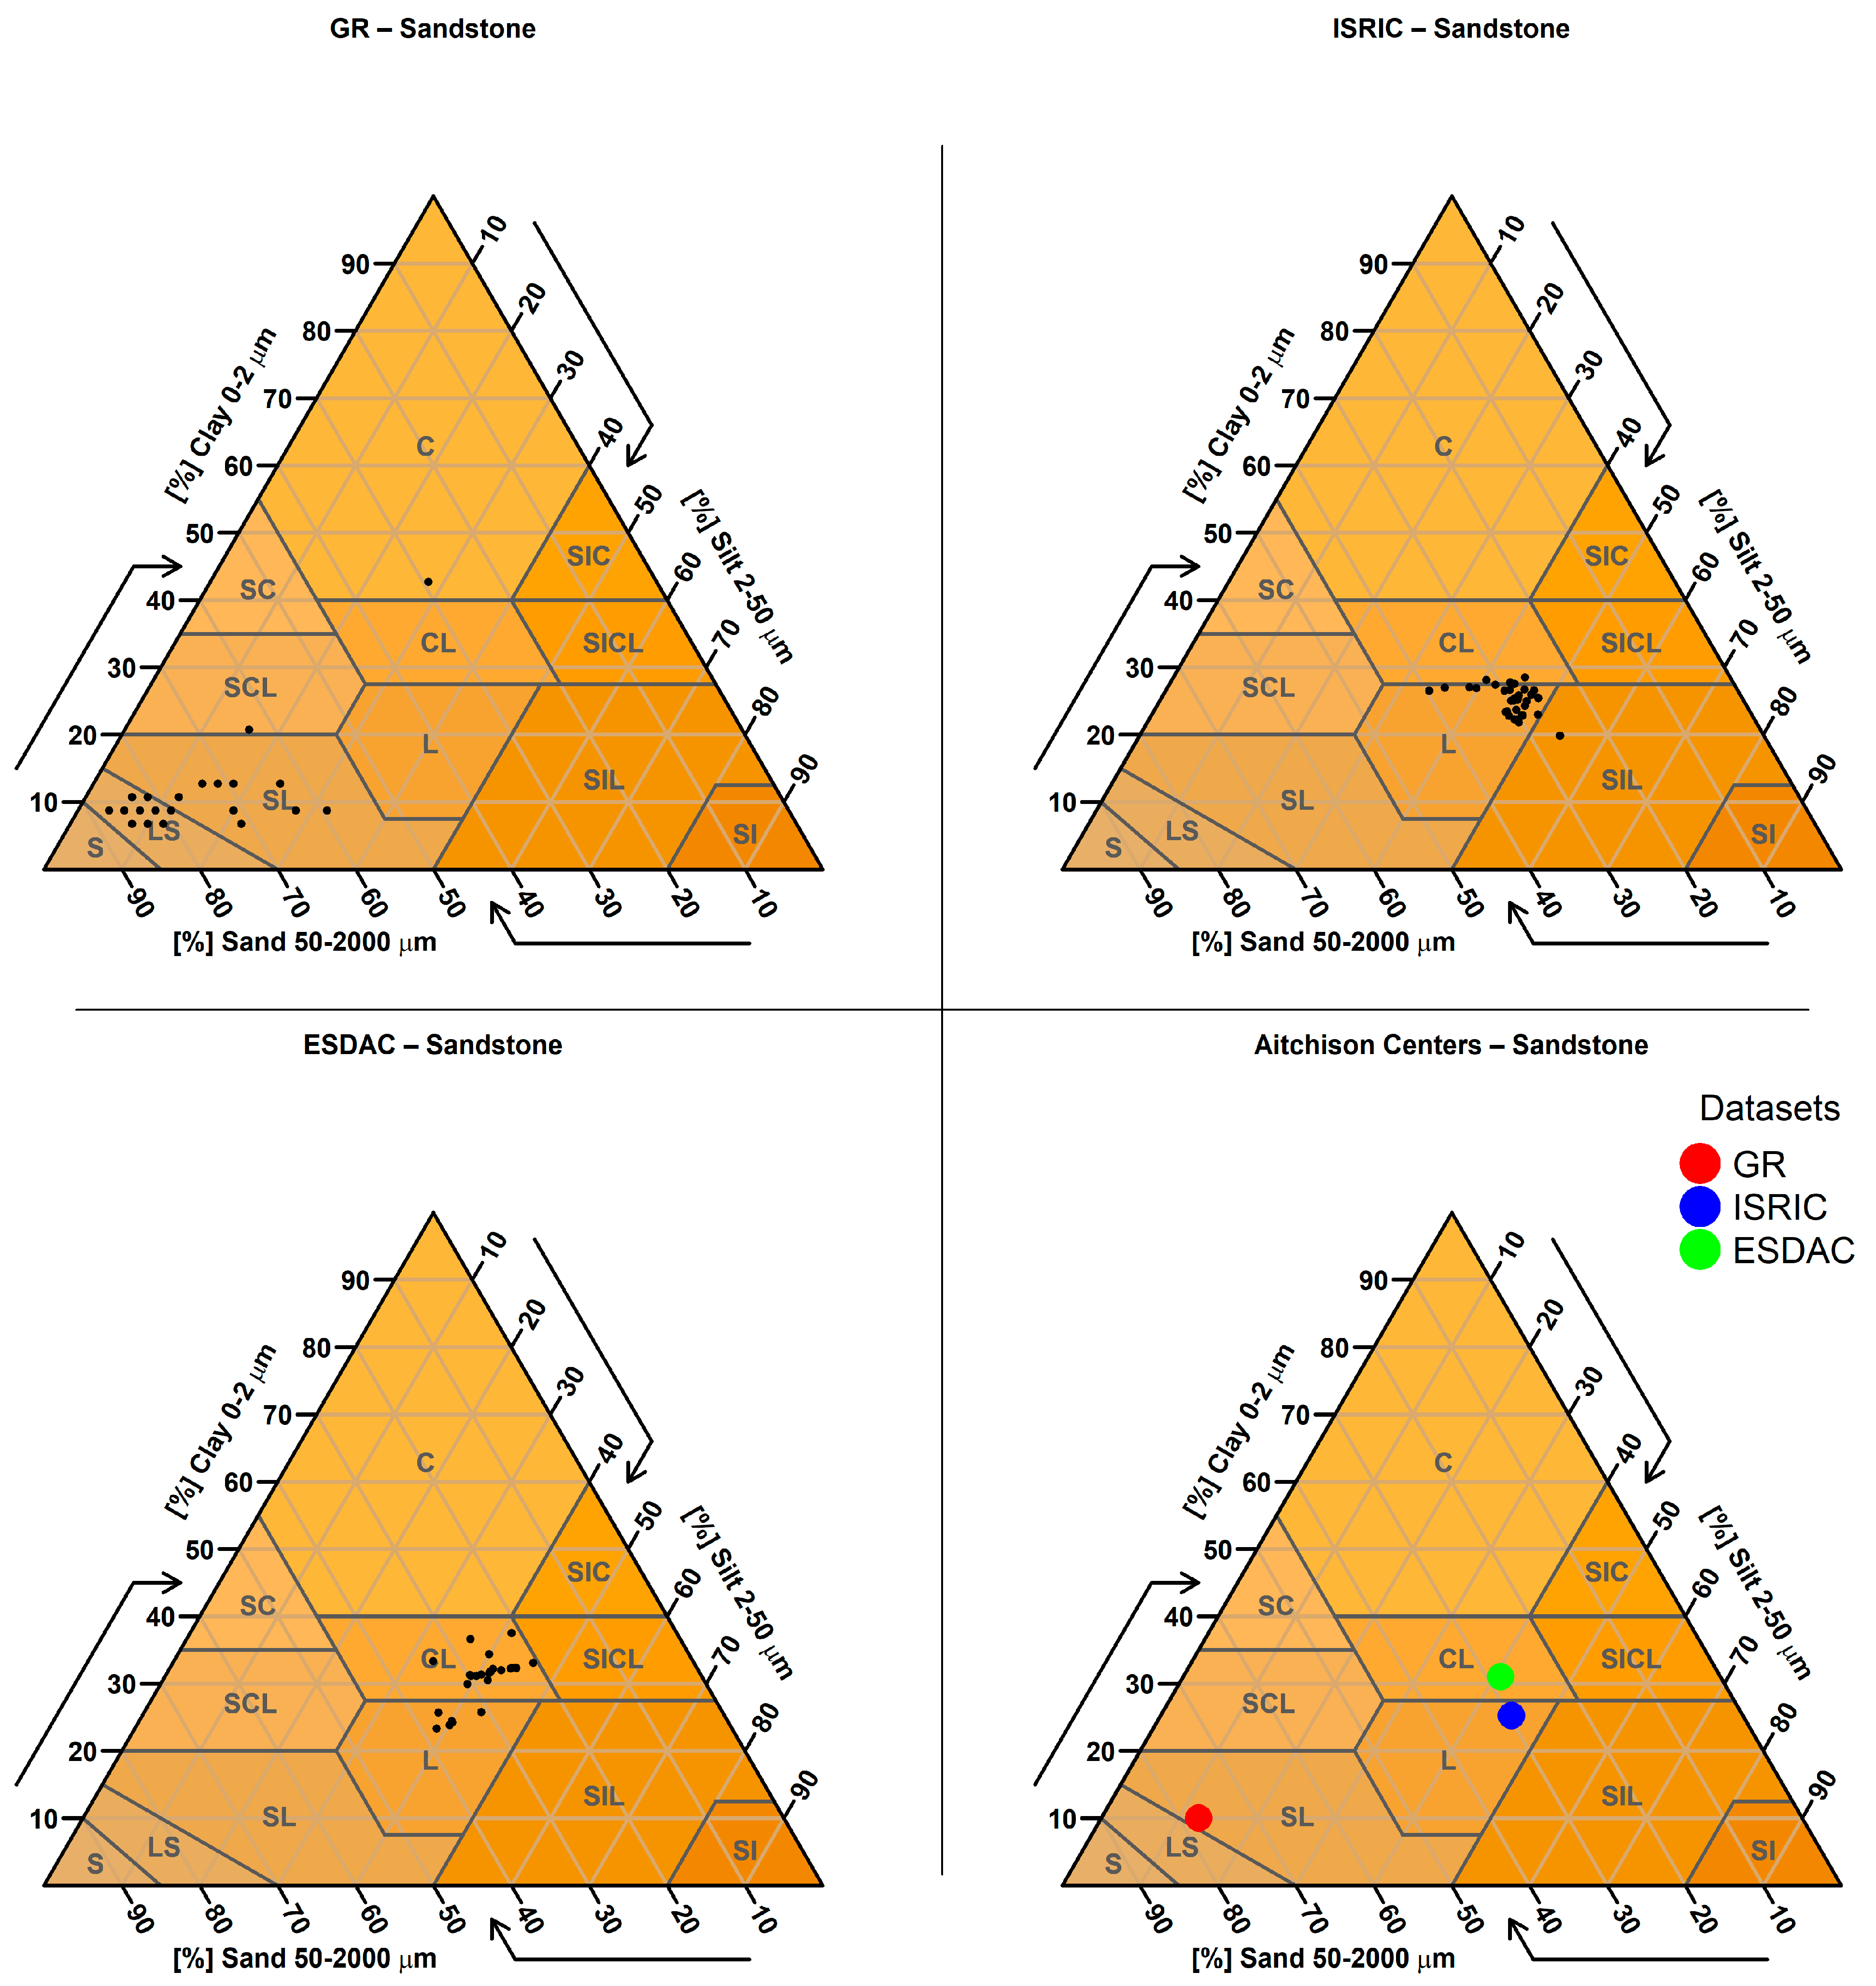
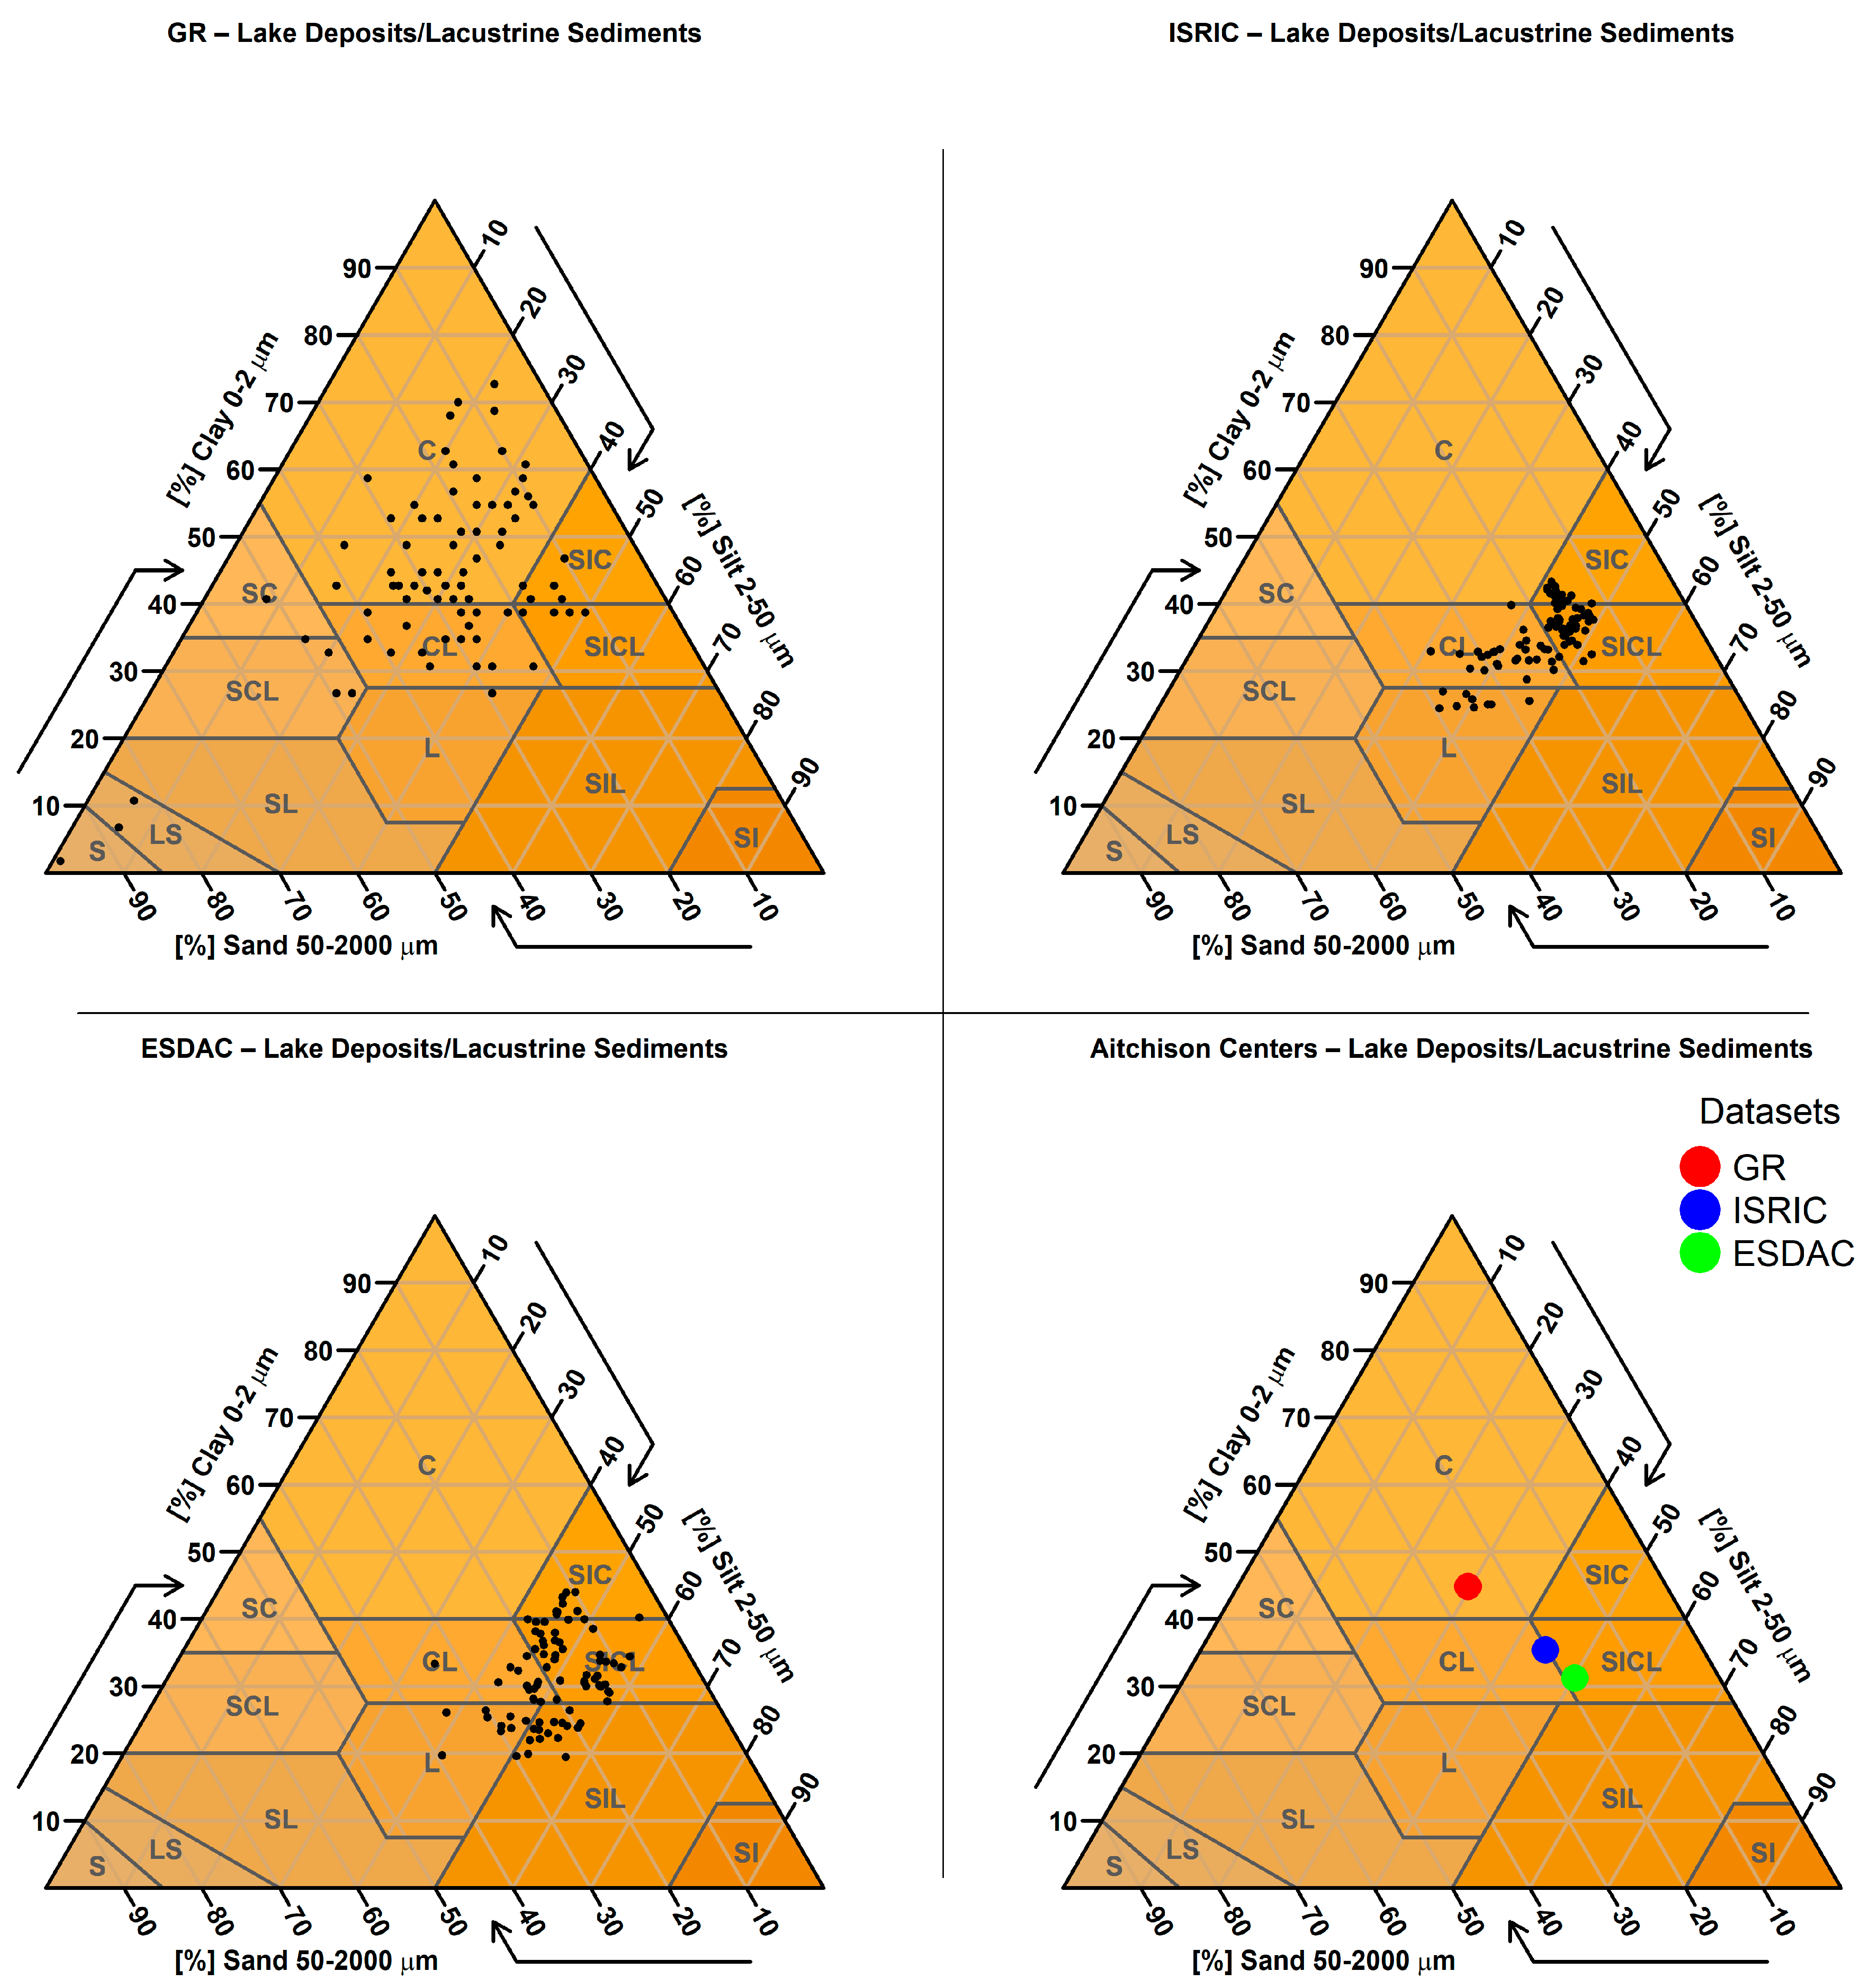
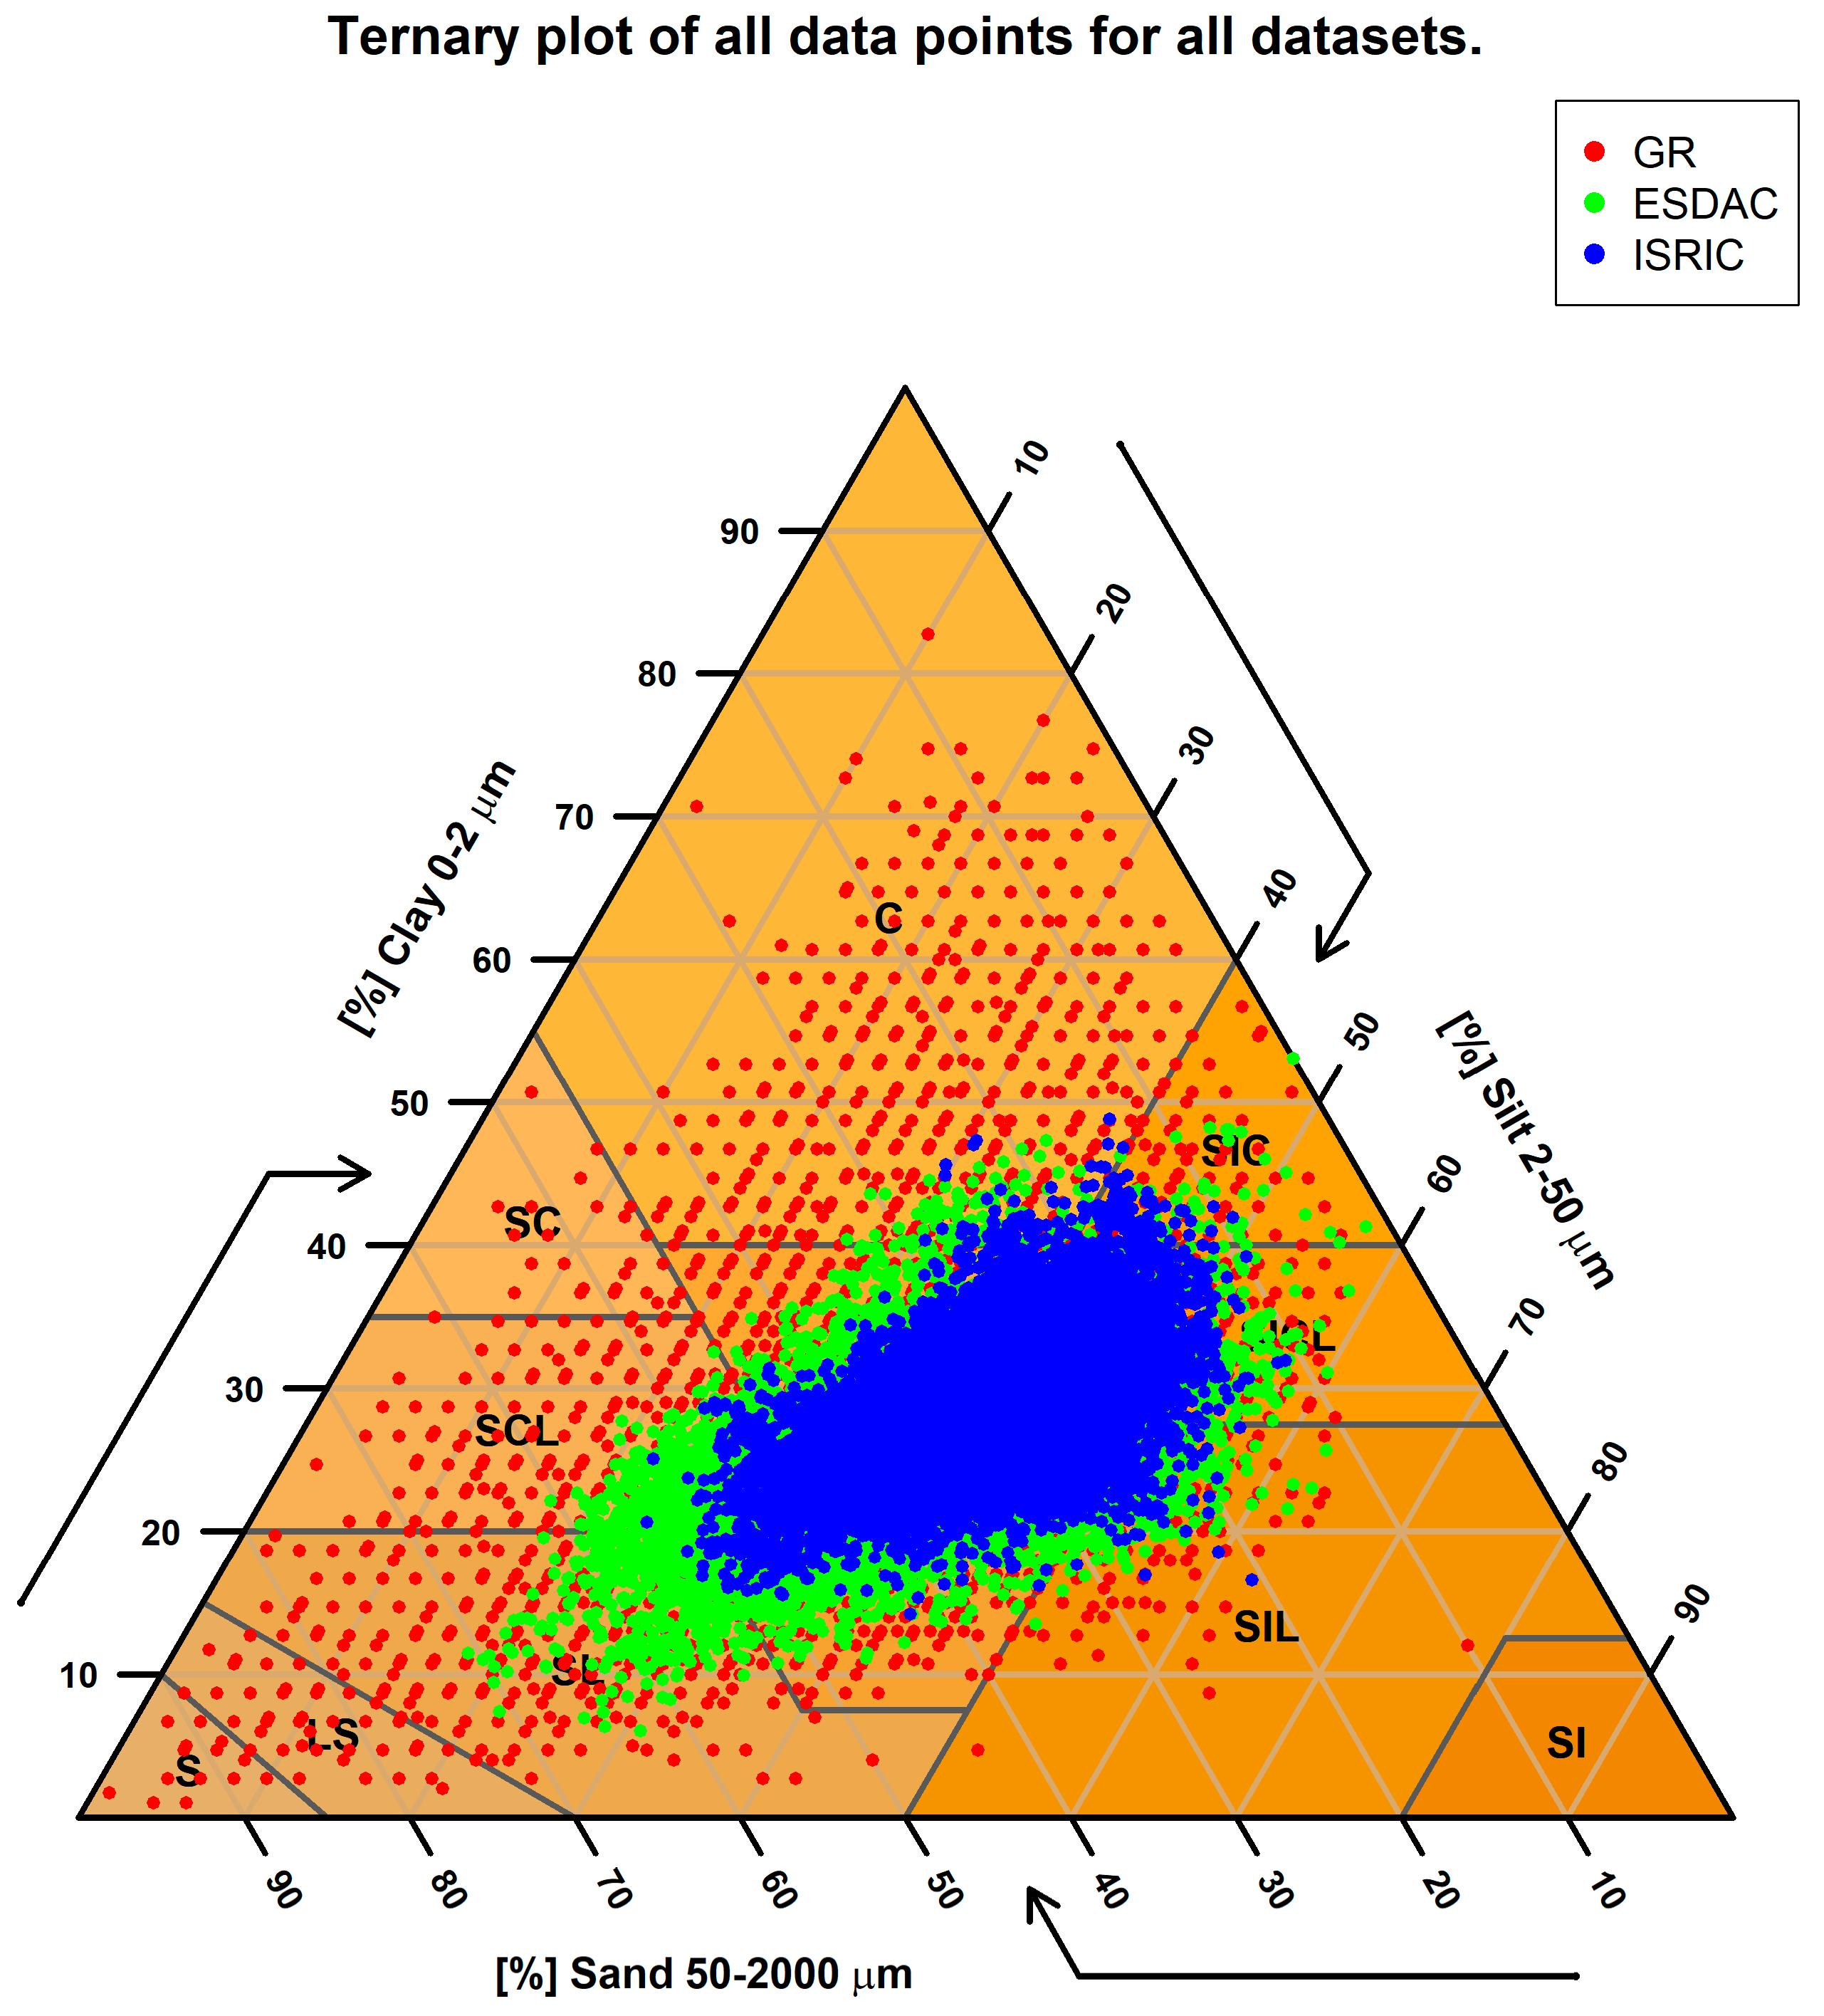
Additionally, to compare how the three datasets are presented on the simplex, a ternary plot where the cloud spread for each dataset was superimposed on one another (Figure 6) was constructed. The results are very telling, as the GR dataset clearly exhibits the highest degree of spread by a major margin and having representatives for every soil class except for Silt (SI). ESDAC follows with a significantly more restricted spread while also seeming to completely ignore the classifications Sand (S), Loamy Sand (LS) and Sandy Clay (SC), in addition to SI. ISRIC exhibits the smallest degree of spread, with fewer points being assigned the more extreme classifications like Sandy Clay Loam (SCL) when compared to ISRIC. It is also important to point out that both predictive datasets seem to tend to the center of the ternary plot, while the GR dataset seems more equally spread out over the majority of the plot’s surface.
Table 2 summarizes the statistical characteristics of the three datasets, highlighting substantial differences in their representation of soil texture components. The descriptive analysis reveals that the Soil Map of Greece dataset (GR) consistently exhibits higher variability across all texture fractions, indicative of greater spatial heterogeneity and a finer resolution in capturing local soil conditions. In contrast, the ISRIC and ESDAC datasets display more constrained variability, likely a consequence of their reliance on geostatistical interpolation or model-based predictions at broader spatial scales. Examining the frequency distributions of sand, clay, and silt, clear distinctions emerge in terms of skewness and kurtosis. For sand, the GR dataset shows a positively skewed distribution (skewness = 0.346), with a tail extending toward high values above 70%, suggesting the presence of sandy soils in specific regions. On the other hand, the ESDAC and ISRIC datasets yield nearly symmetrical or only slightly skewed distributions, effectively excluding such extremes. In the case of clay, all three datasets are positively skewed, with ISRIC presenting the highest skewness (0.544), reflecting a concentration of values around 25–30% and a limited presence of samples with elevated clay content. The GR dataset also displays a right-tailed distribution, extending to values as high as 83%, capturing the occurrence of highly clay-rich soils in certain areas. Regarding silt, the distributions are generally more balanced. The GR dataset maintains positive skewness (0.325) and greater spread, while ISRIC and ESDAC show more symmetrical profiles with mean values near 38–40%. Although ISRIC presents a relatively low skewness value (0.112), the distribution remains compressed, underrepresenting soils with very low silt content. Overall, the Greek dataset provides a more detailed and variable depiction of soil texture, whereas the international sources offer generalized summaries with limited representation of local extremes.
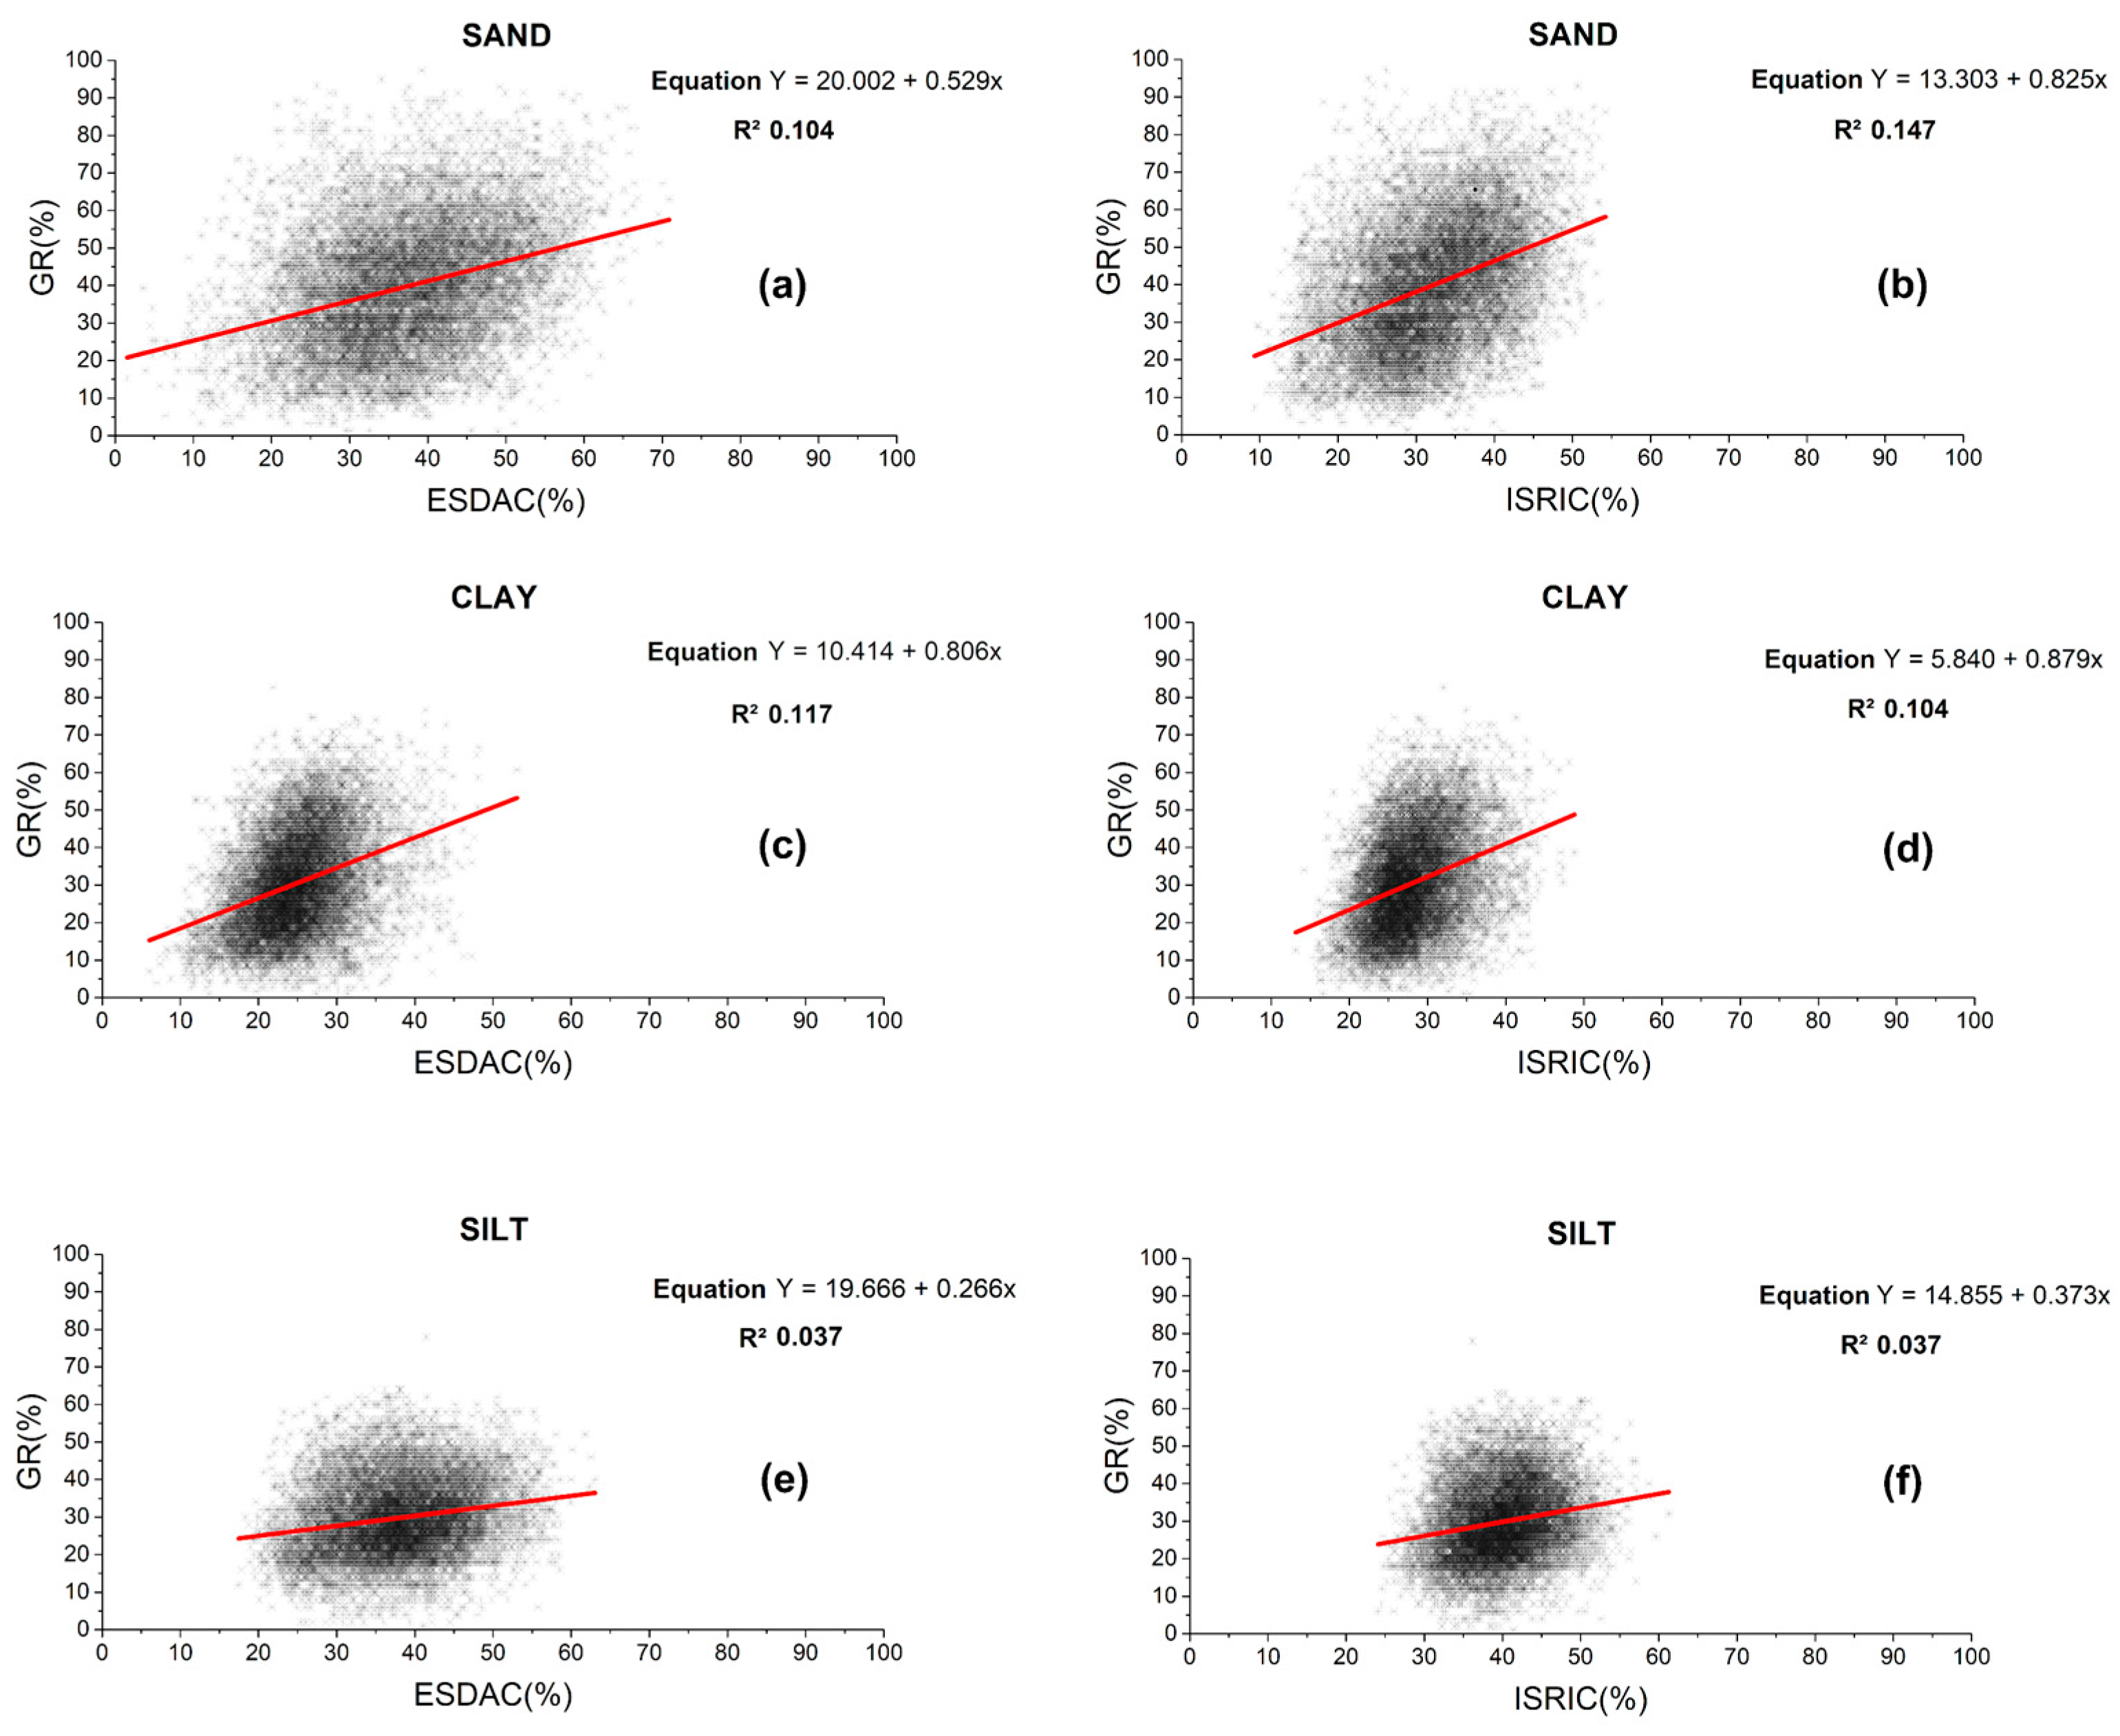
The six scatter plots in Figure 7 illustrate the relationship between the Soil Map of Greece (GR, y-axis) and the global datasets ISRIC and ESDAC (x-axis) for the percentages of sand, clay, and silt.
Among all comparisons, sand content exhibits the strongest correlation for both global datasets. For ISRIC (Figure 7b), the linear relationship is described by the equation y = 0.8259x + 13.30 with a coefficient of determination R2 = 0.1474. While a slope value close to one is observed, the considerable dispersion of data points and the relatively low R2 indicate limited agreement. High sand values recorded in the Soil Map of Greece are not captured effectively by ISRIC, highlighting the dataset’s limited ability to represent sandy regions in Greece, particularly in areas with complex geomorphological characteristics. Similarly, the ESDAC dataset (Figure 7a), shows a low R2 = 0.1044 and the equation y = 0.5295x + 20.00 indicating a higher bias. The correlation is not improved, the substantial scatter persists, and high sand content values remain underrepresented. These findings suggest that neither global dataset adequately reflects the heterogeneity and extremes in sand distribution documented by the Greek Soil Map.
For clay, both ISRIC and ESDAC datasets show moderate but limited correlations with the Greek Soil Map. The ISRIC comparison yields the equation y = 0.8797x + 5.8403, with R2 = 0.104 (Figure 7d). The ISRIC dataset tends to underestimate high clay content values, in contrast to the Greek map, which reflects broader variability and higher maximums, likely due to its finer spatial and thematic resolution. The ESDAC dataset performs similarly, with a regression equation of y = 0.8064x + 10.414 and R2 = 0.1178 (Figure 7c). The correlation remains weak, and high clay content is again underestimated. These systematic deviations suggest that global models lack the resolution needed to capture localized pedogenic processes that influence clay accumulation in Greek soils.
The weakest correlations are observed in silt content. For ISRIC, the regression yields y = 0.3738x + 14.855, with a very low R2 = 0.037 (Figure 7f), indicating that only 0.37% of the variability in the Greek dataset is explained. The slope, which is close to zero, and the wide scatter of data points indicate a poor representation of regional silt variability. Likewise, ESDAC exhibits nearly identical behavior, with similar regression equation and R2 value (Figure 7e). The high bias and the low explanatory power reflect the global datasets’ limited capacity to represent silt distribution in Greece, likely due to simplifications in modeling or insufficient integration of local data inputs.

3.2. Differences Between Observed and Estimated Soil Properties Values

A comparative evaluation of soil texture data between the Soil Map of Greece and the two global soil databases (ESDAC and ISRIC) reveals notable differences overall (Table 3) and across all particle size fractions (Table 4). This assessment employed a range of statistical indicators to examine both the predictive accuracy and spatial consistency of the international datasets relative to laboratory-based measurements conducted during the development of the Soil Map of Greece.
Initially, when examining the overall differences between the two datasets in ILR space, both datasets seem to have almost identical accuracy, with ESDAC being slightly more prone to outliers (RMSEA = 0.8132, MAEA = 0.7071) but reporting slightly better overall accuracy than ISRIC (RMSEA = 0.8108, MAEA = 0.7104). Nevertheless, the differences (<0.005) are negligible in both categories, and it can be safely assumed that both datasets have equivalent compositional accuracy.
For the sand fraction, the mean value of the differences (MBE) between the Greek dataset and ISRIC and ESDAC are 7.78% and 2.55%, respectively, with ISRIC consistently underestimating sand content. Raw RMSE values are the highest among all fractions (18.55 for ISRIC and 17.18 for ESDAC), underscoring substantial local-scale mismatches. The elevated variance (GR–ISRIC: 235.48; GR–ESDAC: 269.13) and standard deviations exceeding 15 confirm a wide dispersion of residuals. Back-transformed RMSE and MAE are the highest, and the former is also higher than raw RMSE, indicating that both datasets have lower accuracy when it comes to sand and that this lower accuracy affects predictions for clay and silt due to their compositional nature.
In the case of clay, the mean value of the differences amounts to 5.56% for GR-ESDAC and 2.44% for GR–ISRIC, with raw RMSE values in a moderate range (13.69 and 13.20, respectively). While the predictive performance for clay is superior to that observed for sand, the magnitude of differences remains non-negligible, particularly for applications requiring high precision. Variance (approximately 152) and standard deviation (around 12.3) are comparatively lower, indicating a more compact residual distribution. Back-transformed error metrics are comparable to their raw counterparts, which suggests that erroneous sand predictions have little effect on clay predictions despite compositionality.
The silt fraction is the only case where negative mean values of differences are observed, with values of −8.12% for ESDAC and −1.88% for ISRIC, indicating a systematic overestimation of silt content by both global datasets. Raw RMSE values remain relatively high (14.04 and 14.45), and variance and standard deviation levels are comparable to those found in the other fractions. The pattern becomes clear when examining the back-transformed error metrics, which are considerably lower than their raw counterparts, indicating that part of the raw error attributed to silt content is in fact transferred to silt from discrepancies in sand content prediction due to compositional constraints.

3.3. Correlation of Differences with Topographic and Hydrological Factors

The next step of the analysis was to examine the influence of key topographic factors on the differences between observed soil texture values (sand, clay, and silt) derived from the Soil Map of Greece and those predicted by the global databases ESDAC and ISRIC. For this purpose, a separate univariate GLR was fitted for each predictor–target pair (i.e., one predictor and one response per model) to conduct an exploratory assessment of the relative strength and direction of individual bivariate relationships, with the prediction difference for each component separately (i.e., GR_CLAY-ESDAC_CLAY or GR_SAND-ISRIC_SAND) of each data point being the dependent variable while each topographic or hydrological factor was the independent variable. While elevation and slope showed statistically significant associations with prediction errors, their explanatory power was negligible, as indicated by extremely low R2 values (Table 5).
Elevation was the most consistently influential factor with relatively high R2 values and high significance, particularly for silt content differences, suggesting that both databases exhibit systematic deviations at higher altitudes. A very low p-value was detected for the differences from ESDAC Sand content and for ISRIC Clay content predictions, possibly reflecting differences between the two datasets’ construction methodologies. Nevertheless, R2 values are consistently low to the point of irrelevance.
Slope was found to be significant for all categories but with extremely low R2 values, except for ISRIC Silt content differences, where we detect the highest R2 value recorded in this analysis. Still, the value itself is miniscule, and its counterparts are reduced by at least one degree of magnitude, meaning that no substantial connection exists between slope and the datasets’ errors.
Regarding the remaining variables, none of the constructed univariate GLRs allowed for the rejection of the null hypothesis at the 0.01 level, and only one could meet the threshold for significance at the 0.05 level, so there is little evidence to suggest that these variables influence the datasets’ predictions.
Overall, although elevation and slope seem to affect the accuracy of global soil texture predictions, their impact appears negligible. These findings highlight the importance of integrating local soil data and context-specific information to improve the reliability of global soil databases in complex terrains such as those in Greece.

3.4. Hot Spot Analysis

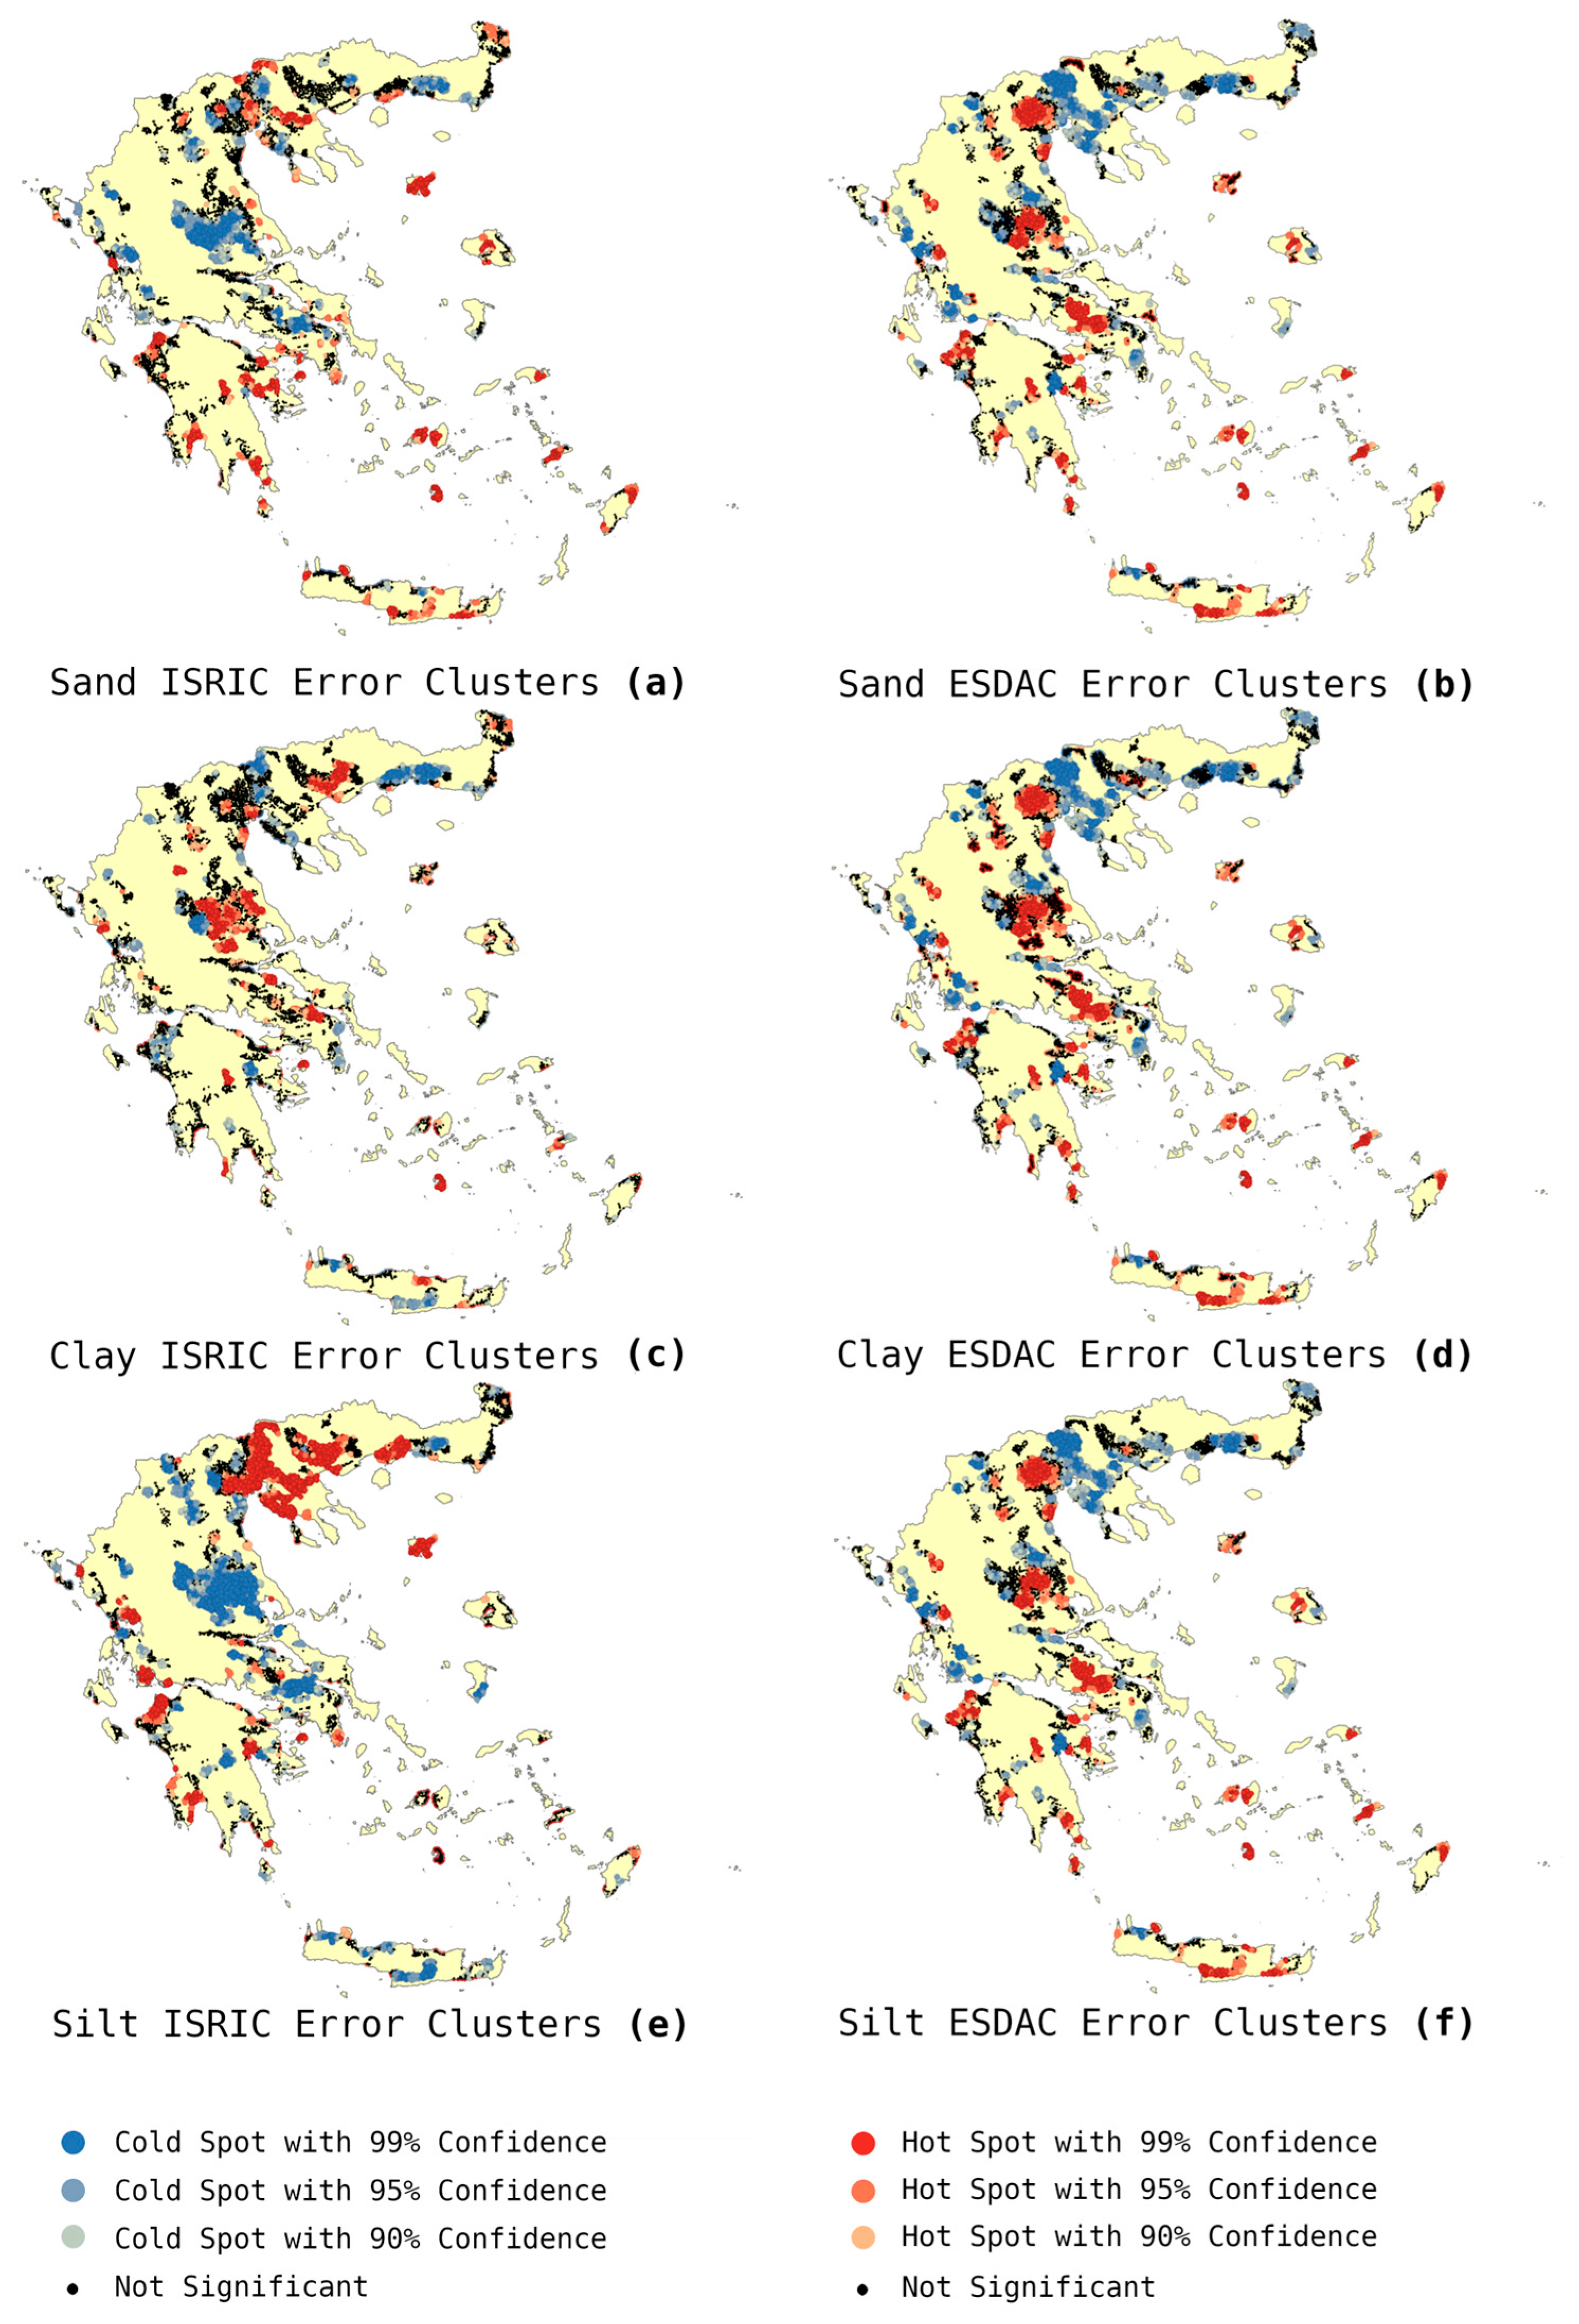
Hot Spot Analysis using the Getis-Ord Gi* statistic was employed to identify spatial clustering of significant differences between the Soil Map of Greece and the two global soil databases, ISRIC and ESDAC. The resulting spatial patterns of prediction errors for soil texture components reveal distinct regional tendencies that highlight the limitations of global datasets when applied to heterogeneous landscapes such as Greece.
For the sand fraction, both ISRIC (Figure 8a) and ESDAC (Figure 8b) exhibit a clear concentration of hot spots—areas of systematically high prediction errors—in insular and coastal regions, including Crete, and many Aegean islands. These areas are characterized by naturally sandy soils, which appear to be underrepresented or mischaracterized in the global models, likely due to coarse spatial resolution and insufficient local calibration. The ISRIC dataset also shows cold spots in the northern and central mainland, particularly in regions dominated by finer-textured soils, such as clay and silt, suggesting better alignment with national data in these areas. ESDAC, in contrast, shows a more dispersed pattern of cold spots across the mainland, although it similarly struggles to capture the variability in sandy soils in southern and insular regions, as indicated by persistent hot spots.
Regarding clay content (Figure 8c,d), both international datasets show extensive clusters of hot spots in central Greece, notably in Thessaly, eastern Sterea Ellada, and parts of the Peloponnese. These regions are known for complex soil profiles with elevated clay content, which neither ISRIC nor ESDAC appears to model effectively. The ISRIC dataset (Figure 8c) further displays hot spots in western Macedonia and areas of the southern Aegean, indicating additional inconsistencies in clay content predictions. In the ESDAC dataset (Figure 8d), hot spots are more pronounced and form larger, denser clusters across central Greece, pointing to an even greater systematic bias in this region compared to ISRIC. Cold spots—suggesting closer agreement with national data—are sporadically found in northern coastal and island areas, such as parts of the northern Aegean and Crete, yet their limited extent emphasizes the broader inadequacy of global models in accurately representing clay content across most of the Greece territory.
In the case of silt, ISRIC (Figure 8e) displays a widespread presence of hot spots in northern and western Greece, especially in Macedonia and parts of Epirus. These areas are characterized by complex depositional settings and variable alluvial soils, which likely contribute to poor silt estimation by global datasets. Cold spots in ISRIC are more confined, appearing in central Greece—particularly in Thessaly, Sterea Ellada, and the Peloponnese—as well as in limited parts of Crete and the northern Aegean, suggesting somewhat improved but spatially restricted predictive performance. ESDAC (Figure 8f) presents a more fragmented distribution of hot spots, with elevated error zones found in the Peloponnese, southern islands such as the Dodecanese and Crete, and certain areas of central mainland Greece. These differences likely stem from regional under- or overestimations in silt content, influenced by the degree of calibration in specific zones. Notably, ESDAC shows a broader and more consistent pattern of cold spots in northern Greece, particularly in Thrace and northern Macedonia, indicating relatively better alignment in silt estimation compared to ISRIC, though limitations remain.

3.5. Soil Texture Class Estimation Errors

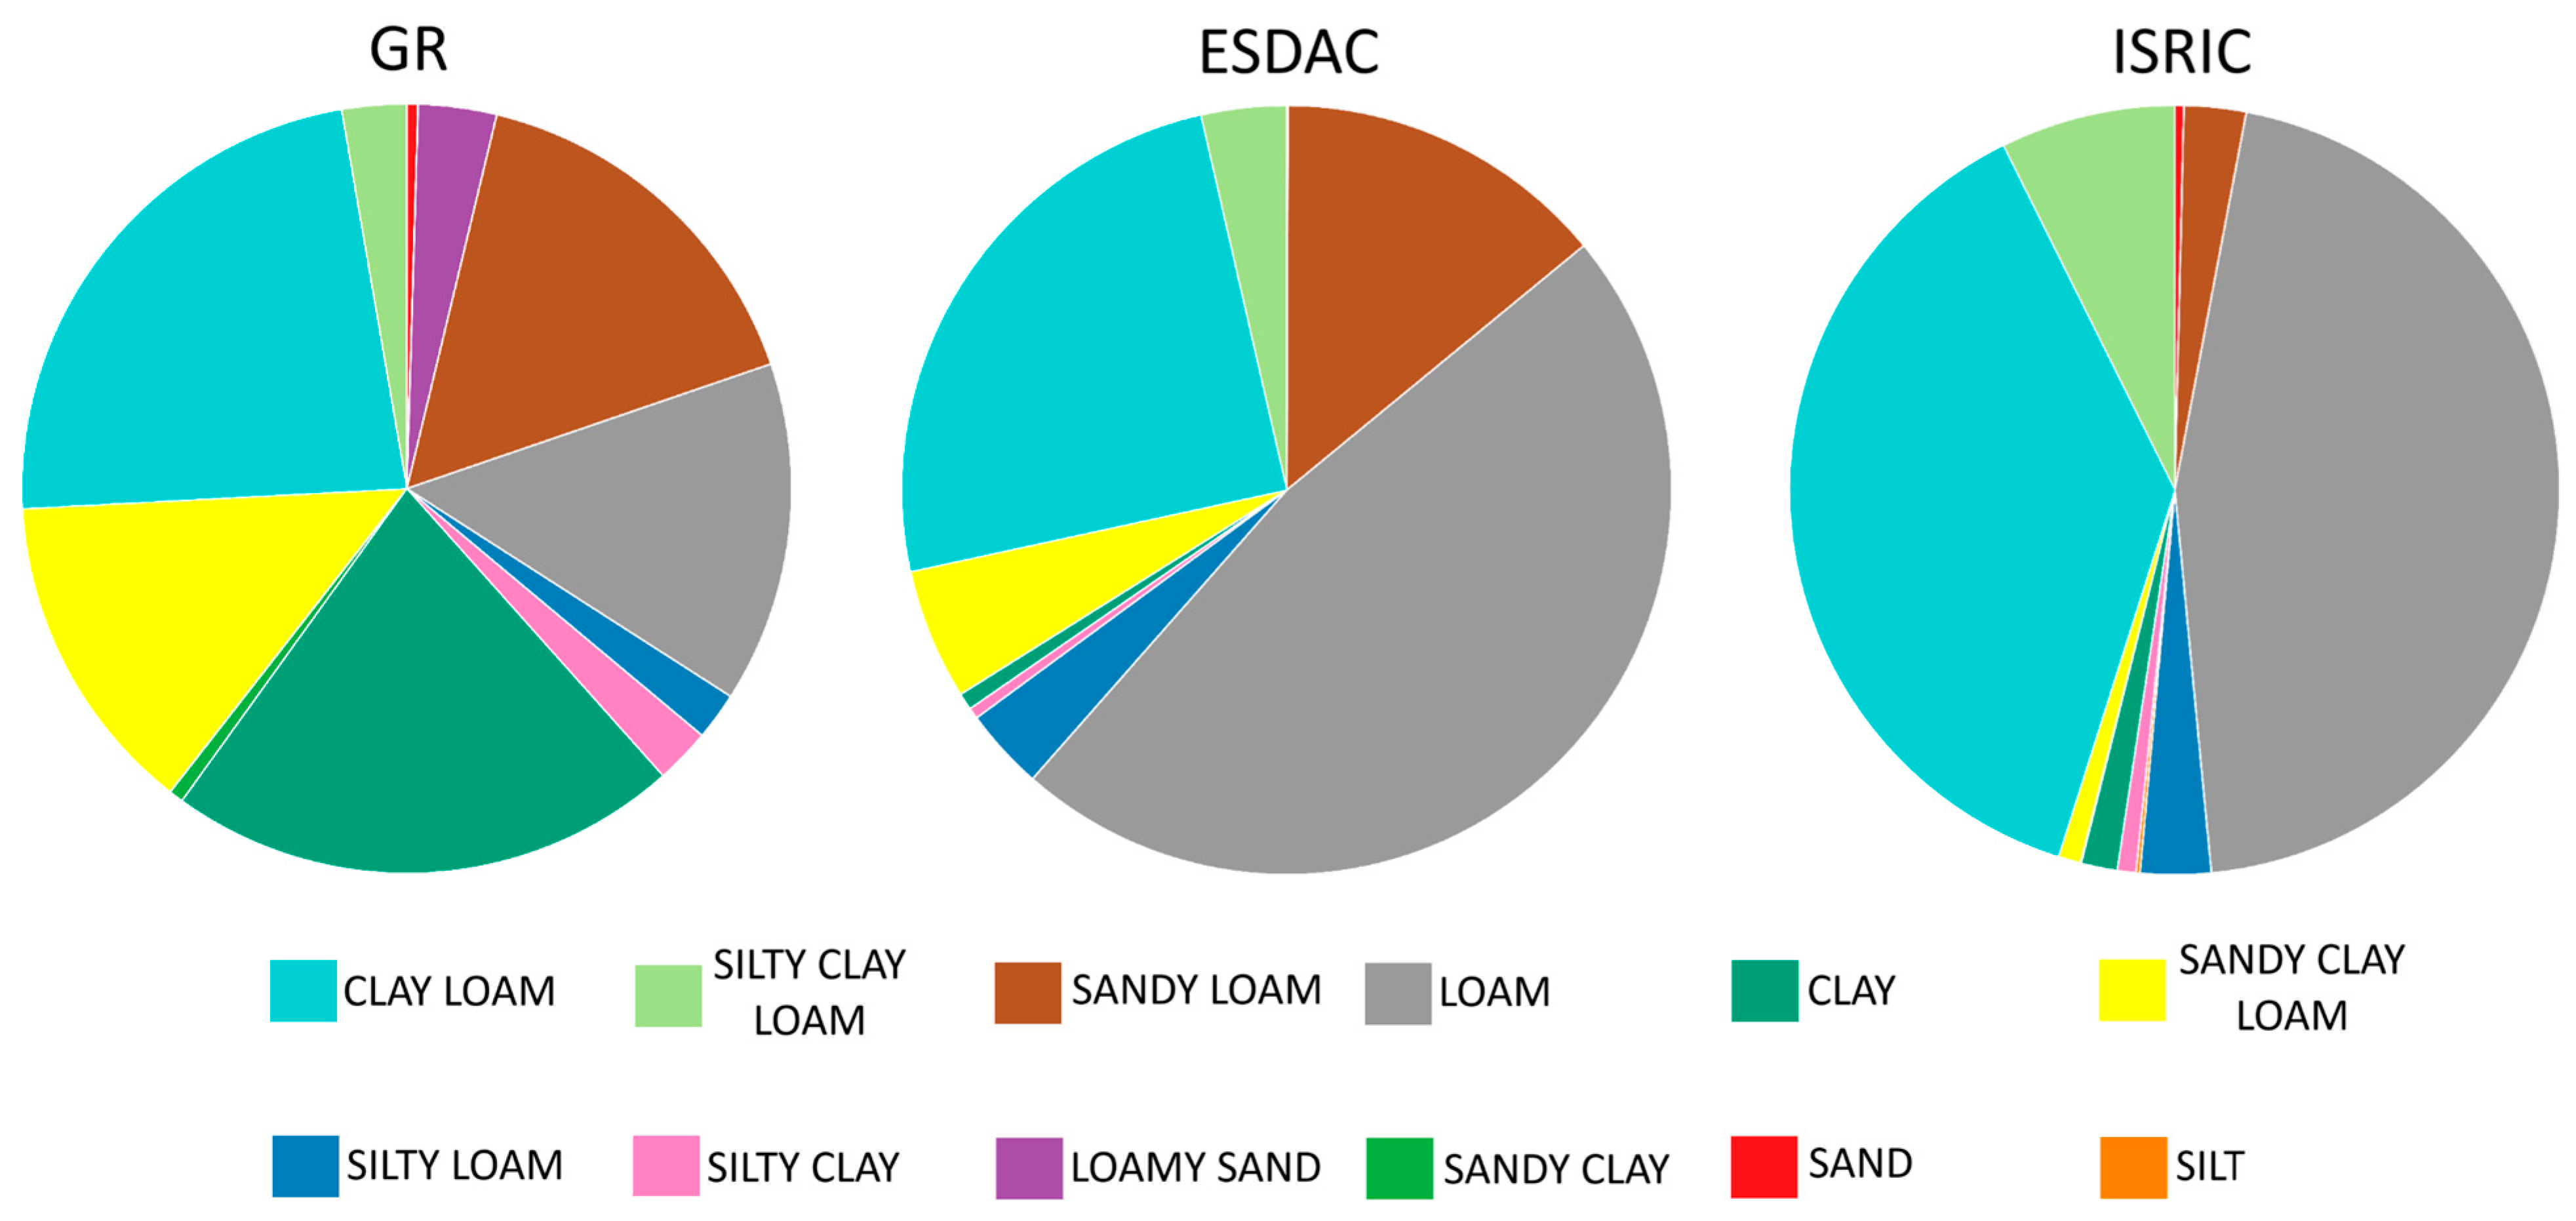
Based on the estimated percentages of sand, silt, and clay, soil texture classification (according to the USDA classification system) was determined for each point, according to the values of all the three datasets. The distribution of soil texture classes is illustrated in Figure 9.
Based on data from the three data sets, the following observations were made. According to the measured data from the Greek Soil Map, there is a broad distribution of soils across several texture classes, with five classes exhibiting relatively high proportions, each exceeding 10% of the total: Clay Loam (23%), Clay (22%), Sandy Loam (16%), Loam (14%), and Sandy Clay Loam (14%). Collectively, these five classes represent 89% of all sampled locations. In contrast, the ESDAC dataset estimation shows that only three soil texture classes surpass the 10% threshold: Loam (47%), Clay Loam (25%), and Sandy Loam (14%). Notably, the proportion of Loam soils is exceptionally high, accounting for nearly half of all soil sampling points (47%). Using the ISRIC dataset estimation, the number of texture classes with a share above 10% is even more limited, with only two classes—Loam (46%) and Clay Loam (38%)—meeting this criterion.
Although soils from nearly all existing USDA texture classes are present in both the ESDAC and ISRIC datasets, their representation in the total dataset is minimal, indicating that most classes occur only in very small proportions.
In the next stage of the study, the ability of the two international databases to accurately predict the soil textural class at each sampling point of the Soil Map of Greece was evaluated. For this purpose, the metrics of user’s accuracy, producer’s accuracy, and overall accuracy were calculated.
Table 6 presents the performance evaluation of the soil texture classification prediction model for both ISRIC and ESDAC datasets, based on the above-mentioned metrics.
Producer’s Accuracy reflects the proportion of correctly predicted observations for each class relative to the total number of actual observations in that class. In the case of ISRIC the highest Producer’s Accuracy was observed for the Loam class, with a value of 0.5053, indicating that the model successfully identifies more than half of the true Loam observations. This is followed by the Clay Loam class, with a value of 0.4102, also demonstrating a satisfactory level of performance. However, the remaining classes exhibit significantly lower accuracy values. For example, the Silt Loam class recorded a value of 0.0867, while Sandy Loam had an even lower accuracy of 0.0660. Several classes, such as Loamy Sand and Sandy Clay, reported zero Producer’s Accuracy, indicating the model’s complete inability to correctly identify these classes.
User’s Accuracy represents the proportion of correctly predicted observations within a class relative to the total number of points predicted to be in that class. The Sandy Loam class had the highest User’s Accuracy, with a value of 0.4031, suggesting that a big part of predictions assigned to this class were correct. The Clay class followed with a User’s Accuracy of 0.3119, although the discrepancy between this and its corresponding Producer’s Accuracy implies that the model often misclassifies other classes as Clay. Sandy Clay Loam displayed moderately low performance, with a User’s Accuracy of 0.2660, while all other classes recorded very low or even zero values.
Overall Accuracy and Overall User’s Accuracy (calculated for all textural classes) further confirm the limited effectiveness of the ISRIC dataset in accurately predicting soil texture classifications (as defined by the Soil Map of Greece). The Overall Accuracy value of 0.1889 indicates that only 18.89% of ISRIC’s total predictions matched the actual classifications. This exceptionally low figure highlights the model’s inadequacy in categorizing soils with acceptable accuracy. Similarly, the Overall User’s Accuracy is reported at 0.1889, reinforcing the conclusion that the ISRIC dataset is neither effective in recognizing soil texture classes nor reliable in its predictions.
In the case of ESDAC, the results indicate that the Loam class exhibits the highest Producer’s Accuracy, with a value of 0.530, suggesting that the ESDAC dataset correctly identifies more than half of the true Loam observations. This is followed by Sandy Loam with a score of 0.283, reflecting a relatively low performance. Clay Loam also demonstrates a low level of prediction accuracy, with a Producer’s Accuracy of 0.2602. In contrast, the classes Silt Loam (0.085), Sandy Clay Loam (0.132), and Silty Clay Loam (0.0403) show very low accuracy scores, indicating the limited ability of ESDAC data to correctly identify them. Sand and Sandy Clay classes register a Producer’s Accuracy of 0, highlighting the dataset’s inability to recognize these texture classes at all.
Regarding User’s Accuracy the Loamy Sand class has the highest User’s Accuracy, with a value of 0.4, despite an extremely low Producer’s Accuracy (0.005), implying that while few actual instances are detected, many predictions classified as Loamy Sand are accurate. The Sandy Loam class also demonstrates high User’s Accuracy (0.3259), indicating that a substantial proportion of its predicted labels are correct. Sandy Clay Loam follows with a moderately low value of 0.332, while other classes exhibit very low or zero values. For instance, Clay records a User’s Accuracy of 0.228, and Clay Loam displays a similar value at 0.243. These findings reveal that the ESDAC dataset often misclassifies samples, assigning observations to incorrect texture classes.
The overall performance of the model is summarized by the Overall Accuracy and Overall User’s Accuracy metrics. The Overall Accuracy is 0.204, indicating that only 20.41% of the total predictions made by the ESDAC dataset match the actual soil texture classifications of the Greek dataset. This low value points to a general lack of predictive precision. Similarly, the Overall User’s Accuracy stands at 0.205, confirming the limited effectiveness of the ESDAC data in both class recognition and prediction reliability. Overall, ESDAC performance seems to be slightly better than ISRIC.

3.6. Correlation of Errors with Parent Material

In the subsequent stage of the analysis, the proportions of sand and clay predicted by the two international soil databases (ESDAC and ISRIC) were examined at sampling locations where soils have developed over parent materials that are, according to the literature, known to produce extreme values of sand or clay content. Within the boundaries of these specific parent material units, the mean sand and clay percentage content derived from the measurements of the Soil Map of Greece were calculated, along with the corresponding sand and clay values predicted by the ESDAC and ISRIC datasets at the same sampling points.
The parent materials associated with the development of soils exhibiting elevated clay content include marl, clay-rich deposits, lacustrine sediments, flysch formations, colluvial materials (ripidion), and schist, as well as, in certain instances, limestone.
Table 7 summarizes the mean values and standard deviations of clay content across the three datasets, as stratified by the parent material underlying each soil unit.
It is observed that in clay-rich deposits, there are substantial discrepancies in the mean clay content (43% and 45%), with both ESDAC and ISRIC significantly underestimating these values. A similar underestimation is also evident in soils developed over marl and lacustrine sediments, although the differences are less pronounced, averaging around 10%.
Pairwise t-tests (Table 8) of the aforementioned parent material classes shed more light on this phenomenon. Namely, it provides more evidence to uphold the position that both datasets failed to capture the extreme clay contents associated with clay-rich deposits, marl and lacustrine sediments. In the case of colluvium, ESDAC seems to underestimate while ISRIC seems to overestimate with small standardized differences for both datasets. In the case of ISRIC, a small degree of clay content overestimation is evident for flysch and schist, but there is little evidence to suggest that there are significant differences between ESDAC and GR clay contents for those two parent materials.
Following the findings of Table 7 and Table 8 the samples classed as having the parent materials clay-rich deposits or marl were plotted for all datasets on the same tertiary plot to compare the respective cloud spread of each dataset on the simplex (Figure 10). It was discovered that in both cases the GR dataset exhibits far greater variance than either ISRIC or ESDAC, with ESDAC being comparatively more prone to predicting higher sand contents. In fact, the cloud spread for either dataset appears very similar regardless of selected parent material class and seems to tend toward the mean composition.
The soils formed on various parent materials, such as dunes, conglomerates, alluvium, basic igneous rocks, and alluvial terraces, are expected to exhibit higher sand content in their textural composition. Table 9 presents the mean values and standard deviations of the sand percentage across the three data sets, depending on the parent material from which the soils originate.
It is observed that in soils developed on dunes, there is a significant underestimation of sand content by both ESDAC and ISRIC, with differences of 14% and 24%, respectively. In soils formed over the other examined parent materials, the degree of underestimation is generally lower, ranging from minimal (2%) to moderate (up to 11%).
Table 10 presents the output of pairwise t-tests for the three datasets regarding parent materials associated with extreme sand content. In every case there is strong evidence to suggest that significant differences exist between the tested groups with very low p-values (>0.001). ISRIC exhibits higher standardized differences and lower p-values than ESDAC in every category, suggesting that while both datasets failed to account for the extreme sand contents of these parent materials, ISRIC is much more prone to predicting lower sand content than ESDAC.
According to the findings of Table 9 and Table 10 the samples classed as having the parent materials sand dunes or conglomerates were plotted for all datasets on the same tertiary plot to compare the respective cloud spread of each dataset on the simplex (Figure 11). This evaluation produced the same results, with ESDAC and ISRIC samples showing similar cloud spread as the samples belonging the “Marl” or “Clay-rich deposit” parent material classes, which further cements the idea that soil parent material was not a significant factor in the models’ predictions.
The contents of Table 7, Table 8, Table 9 and Table 10 seem to suggest that the ISRIC and ESDAC datasets failed to properly account for soils that formed from some parent materials associated with extreme texture classes. A possible cause for this could be the mobility of these parent materials, as most of them are not directly associated with the underlying geology of their current location. Another possible cause could be their somewhat limited surface area compared to other dominating parent materials, especially when considering the resolution of the raster datasets, leading to their effects being underestimated. Further research is needed to ascertain the exact reason behind this.
According to the literature describing the methodology used for the development of the ESDAC and ISRIC raster datasets, generalized global lithological and geological maps were included as input variables. It is evident that the models employed in generating these rasters did not incorporate detailed geological maps (scale 1/50,000), which were utilized in the creation of the Soil Map of Greece and were used for this analysis. This omission is particularly significant given the high diversity of parent materials in Greece and their pronounced spatial variability, often occurring over very small geographic extents.

3.7. Sensitivity Due to Spatial Misalignment

To assess the sensitivity of the obtained results to the potential effect of possible spatial misalignment errors in raster value extraction to the sampling points of the Soil Map of Greece, a custom Python-based algorithm was developed to allow the evaluation of this bias. This approach addresses two key sources of error: (i) positional inaccuracies of the sampling points themselves and (ii) potential geolocation shifts in the raster datasets due to clipping and coordinate system transformations. The algorithm determines the relative position and distance of each point from the center of the corresponding raster pixel, then compares values from neighboring pixels to select the one most closely matching the Soil Map of Greece measurement. This method reduces the possible bias introduced by relying solely on the underlying pixel value.
As mentioned above, the obtained results of this custom methodology were compared with the conventional approach of assigning overlapping raster values directly to the point-based soil sampling dataset. The RMSE values calculated for the comparison between the measured values from the Soil Map of Greece and the corresponding predictions from the raster datasets of the two international databases are presented in Table 11 for each soil property and for each value assignment methodology. It is observed that while the RMSE values obtained with the custom values assignment methodology for each property are somehow lower, they are still very high in both datasets (ESDAC and ISRIC). Furthermore, the statistical analysis of the direction and the distance of the best pixel location in relation to the overlapping pixel and the measurement point did not provide any hints of systematic shift of the best pixel location or any link between the magnitude of the observed errors and distance of each observation point from the center of the corresponding raster pixel.

3.8. Validation of Obtained Differences Using Diverse Greek Soil Datasets

To assess the robustness of the obtained results regarding the discrepancies observed between the Soil Map of Greece and the international databases (ESDAC and ISRIC), a comparative analysis was extended to two additional Greek soil datasets. These included nationwide data from NAGREF (2263 sampling points) and a regional dataset from the Regional Laboratory of Agricultural Applications and Fertilizer Analysis of Epirus and Western Macedonia (PEGEAL) [28], (724 sampling points). We used the main steps of the methodology for the Soil Map of Greece.
It is important to emphasize that the two soil datasets used in this step of the analysis were developed by public agencies independent of the organizations that developed the Soil Map of Greece. Further, the first dataset (NAGREF) primarily focused on mountainous, forested, and naturally vegetated areas, whereas the Soil Map of Greece covers almost exclusively cultivated land. Another important element is that NAGREF dataset samplings were carried out between 1979 and 1997, about 30 years prior to the Soil Map of Greece development, while the regional dataset from the Regions of Epirus and Western Macedonia was progressively developed over the last decade.
Table 12 presents the Aitchison metrics for the comparison of ESDAC and ISRIC with the observed values from the GR, NAGREF and PEGEAL datasets. The highest degree of disagreement is observed between NAGREF and ISRIC, while the lowest is found between PEGEAL and ISRIC. In all cases but the latter, Aitchison performance metrics are comparable to their GR counterparts (within −0.06 error units) and can be safely attributed to the scale and geographic/land use context of each dataset. The difference between RMSEA and MAEA continues to suggest that both ISRIC and ESDAC datasets are prone to outliers, however the smallest value of difference can be found between PEGEAl and ESDAC/ISRIC, suggesting that the PEGEAL dataset holds fewer outliers which, in conjunction with the previous explanations, could explain ISRIC’s improved performance on the PEGEAL dataset.
Table 13 presents the RMSE values for sand, clay, and silt when comparing the international databases (ESDAC/ISRIC) against two national datasets: the Soil Map of Greece (GR) and the sampling points from the NAGREF soil map. The results indicate that the RMSE values remain broadly comparable across the two national datasets, with only minor differences observed. For clay, raw RMSE values range between 11.0% and 13.7%, while for sand they vary from 17.2% to 19.3%, and for silt from 11.6% to 14.5%. The discrepancies do not exceed 2–3%. The same holds true when examining the back-transformed metrics, though they suggest lower accuracy in silt predictions for the NAGREF dataset compared to the raw metrics which suggest the opposite. This indicates that the phenomenon of sand prediction inaccuracies being transferred to silt predictions is lessened in the NAGREF dataset compared to the GR.
Table 14 shows the comparison of RMSE values for sand, clay, and silt between the Soil Map of Greece (GR) and the PEGEAL dataset, against the international databases (ESDAC/ISRIC). When it comes to ESDAC, similarly to the findings from Table 13, the raw RMSE values do not diverge substantially between the two national datasets. For clay, values range between 12.9% and 13.7%, while for sand they span 14.3% to 18.6%, and for silt 15.9% to 17.2%. The observed differences are relatively minor, typically within 1–3%, confirming that the choice of Greek dataset (GR or PEGEAL) does not materially affect the error levels when compared with the ESDAC dataset. The same is obvious for the back-transformed metrics when it comes to ESDAC. However, as reported on Table 12, PEGEAL-ISRIC exhibits a substantial improvement compared to GR-ISRIC, with raw RMSE showing an improvement of over 1% to over 4% for all fractions, while back-transformed metrics suggest an even higher improvement that reaches 5.36 units of improvement. As suggested before, the limited geographical extent of the PEGEAL dataset as well as its inclusion of fewer outliers could explain ISRIC’s comparatively higher accuracy, which presumably comes from more accurate sand content predictions, as in every metric reported it exhibits the highest value of improvement over the GR-ISRIC evaluation.
The above-mentioned findings indicate that the differences between the measured soil data and the predicted values from the international databases remain consistent, regardless of which set of Greek soil data is used for comparison.

3.9. Quantification of ISRIC Uncertainty Calibration

SoilGrids 2.0 provides, alongside the predicted value rasters, prediction uncertainty rasters for each unique variable. The rasters for sand, silt and clay content uncertainty were extracted and treated as prescribed in the ISRIC user manual. Using the same sampling methodology (Section 2.3.3) these interval values were extracted for each examined point and compared to the absolute error calculated for each sampling point. If the absolute error value is numerically equal or smaller than the respective uncertainty range value, the prediction was deemed consistent with reported uncertainty.
Following the above procedure, 1962 (20%) clay predictions, 895 (9.12%) sand predictions and 827 (8.43%) silt predictions were deemed consistent. This suggests that ISRIC is overconfident in its reported uncertainty, especially for sand and silt. This could be further proof that lack of accuracy in sand predictions is transferred to silt.

4. Discussion

Global soil datasets are critical for many applications [11,16,32,33,34,35]. Soil texture predictions in Greece show notably higher errors and lower correlations than the original global models reported. For example, the assessment of sand content predictions of the global datasets, using as a base the Soil Map of Greece, resulted in RMSE values on the order of 17% to 19% and very low R2 values (~0.15 to 0.19) when comparing SoilGrids 2.0 and ESDAC predictions correspondingly to measured values [5]. Clay and silt exhibited similarly large errors (RMSE ~13% to 14%) with even weaker correlations (clay R2 ~0.12; silt R2 ~0.037). These error levels far exceed the performance reported in the original development research article [10]. As an example, in this paper R2 values of ~0.60–0.65 for clay, silt, and sand across Europe, with corresponding RMSE values around 8% to 17% were obtained during cross-validation. The global ISRIC, SoilGrids 2.0 model similarly reported moderate accuracy. For example, SoilGrids 2.0 cross validation resulted in R2 values in the order of 0.4 to 0.6 for texture fractions, with RMSE values ranging between ~10% and 20% [11,16].
In Greece, however, both global datasets displayed systematic bias, underestimating sand and clay and overestimating silt on average, and large site-specific deviations. This pattern is consistent with independent validations from other regions. In Croatia, SoilGrids predictions for sand and silt explained virtually no correlation (R2 ≈ 0.04) and even for clay R2 value was only ~0.27, with normalized RMSE values up to ~2.5% (i.e., 250% of the observed range) for sand [17]. It should be noted that in contrast to our study, Radocaj et al. [17] assessment involved a very small dataset of observed values involving very low total variance. In an arid region of India, SoilGrids 2.0 was found to severely misestimate texture fractions, under-predicting sand by ~28% and over-predicting silt and clay by ~14% [18]. In Norway, independent evaluations of SoilGrids [21] have likewise found that predicted texture fractions bear almost no relationship to field observations. In one analysis using Norwegian forest soil profiles, the coefficient of determination for SoilGrids sand, silt and clay was essentially zero (R2 on the order of 0.01–0.06). Similarly, continental-scale assessments in Africa [22] report comparable magnitude errors for texture. For instance, the AfSoilGrids250m maps (a 250 m-resolution soil map for Africa) show RMSE values on the order of 8–16% for texture fractions (≈13.7% for clay, 8.3% for silt, 15.9% for sand). In all of these regions (Croatia, Norway, India, Africa), SoilGrids tended to misestimate texture in a systematic way. Likewise, studies in the Netherlands and New Zealand show that SoilGrids can significantly diverge from national data: for New Zealand, for example, a detailed evaluation of SoilGrids texture uncertainty highlights substantial local departures from national information [20]. Overall, the Greek case, with high RMSE, low R2, and clear bias in sand, silt, and clay predictions, mirrors these international findings, underlining that the originally reported accuracy of ESDAC and SoilGrids (e.g., ~60% variance explained in cross-validation) can drop markedly in local validations [10,16].
One factor influencing the magnitude of the observed errors is the density of sampling points across the Greek territory, both in the LUCAS database (used for ESDAC) and in the SoilGrids database. The number—and consequently the spatial density—of these points is significantly lower than that of the sampling locations included in the Soil Map of Greece [5,32,33,34,37].
Additionally, the use of generalized (global scale) geological maps in the development of both ESDAC and ISRIC rasters is another contributing factor to the substantial errors observed between predicted and measured values of sand, clay, and silt. In Greece, geological parent materials, which are key determinants of soil texture, exhibit high spatial variability, often even across short distances. Since this variability was not accounted for in enough detail in the global models, the resulting prediction errors are a logical outcome [11,16,58,61,64].
Despite the robustness of our comparative approach, several limitations should be acknowledged. First, all datasets used—whether national or international—are subject to their own inherent uncertainties. The Soil Map of Greece, while based on extensive field and laboratory work, may contain measurement errors or inconsistencies related to methodological variations because many field work and laboratory analysis teams participated to the project [26,29,35,38]. Similarly, the ESDAC and ISRIC (SoilGrids) datasets are based on predictive modeling that integrates diverse input sources, including global-scale lithological maps and interpolated climate variables, which may not reflect the local soil variability in Greece [11,16,34,35].
Furthermore, geolocation errors, both in the positioning of sampling points and in the alignment of raster datasets, pose an additional potential source of uncertainty, particularly in cases where coordinate transformations were necessary [55,56,57]. We also recognize that certain land uses, particularly forested and mountainous regions, may be underrepresented in the Greek Soil Map, as its coverage is largely focused on cultivated land [24,39]. To mitigate these limitations, we implemented a dual raster extraction method that compares direct pixel assignment with a proximity-based alternative. We also incorporated two independent soil datasets collected by different institutions in non-overlapping regions to validate further the findings and ensure broader representativeness across different landscape types [5,28].
Building on the insights of this study, several avenues for future research can be identified. First, additional soil properties, such as organic carbon content, pH, and cation exchange capacity, should be included in comparative evaluations to further assess the predictive reliability of global databases [34,37]. Moreover, future work should explore the impact of prediction errors on practical applications such as hydrological modeling, precision agriculture, land suitability assessment, and carbon stock estimation, where small deviations in texture values can have disproportionate effects [1,9,12,13,14]. Finally, the findings of this study suggest a need to recalibrate or locally adapt global prediction models for use in regions with high geological complexity like Greece. Integrating high-resolution geological and land use maps, along with national datasets, into machine learning frameworks could significantly enhance the spatial accuracy of soil property predictions and improve the applicability of global soil information products in local decision-making [5,11,16,58].

5. Conclusions

This study systematically evaluated the accuracy of two prominent international soil datasets, ISRIC-SoilGrids and ESDAC, against the Soil Map of Greece sampling point repository. This assessment revealed significant discrepancies and highlighted the challenges of applying global models to complex, heterogeneous landscapes. The findings demonstrate that while global datasets are invaluable for continental- and global-scale applications, their direct use for regional- and national-level assessments in a geologically diverse country like Greece can lead to substantial inaccuracies.
The primary conclusions drawn from this research are the following. Both assessed international datasets, ISRIC and ESDAC, fail to capture the full range of soil texture variability present in Greece. Their predictions exhibit compressed value distributions that omit the extreme sand, clay, and silt contents documented in the national dataset, which is based on extensive field sampling and laboratory analysis. The statistical comparison revealed very weak correlations and high errors between the global predictions and the measured ground-truth data. For all texture fractions, R2 was low (e.g., ~0.15–0.19 for sand, ~0.12 for clay, and <0.04 for silt). The RMSE values were substantial, reaching up to 18.6% for sand, figures that are considerably higher than those reported in the original cross-validation studies for these global products.
Furthermore, the incorporation of ILR-based compositional error metrics (RMSEA = 0.8132 and 0.8108; MAEA = 0.7071 and 0.7104 for ESDAC and ISRIC, respectively) provided a statistically consistent framework for evaluating discrepancies between datasets, overcoming the limitations of conventional Euclidean statistics and allowing a more rigorous quantification of prediction uncertainty.
The ability of the international datasets to predict the correct USDA soil texture class was poor, with an overall accuracy of only 19 to 21%. The global models tend to oversimplify the soil variability, predominantly classifying soils as ‘Loam’ or ‘Clay Loam’, whereas the Greek Soil Map shows a more diverse distribution across five major classes.
The prediction errors are not entirely random but are spatially clustered in distinct hot and cold spots. Hot spots of high error were identified in specific regions, such as sandy coastal and island areas and clay-rich plains in central Greece. These discrepancies are strongly linked to parent material, as the global models, which utilize generalized geological maps, failed to accurately predict textures in soils derived from materials like dunes or clay deposits that produce extreme textural properties.
In summary, this research underscores that the accuracy of global soil datasets can decline substantially when applied at local scales characterized by high environmental complexity. The findings highlight the importance of integrating high-resolution national data for the calibration and validation of global models, enabling their downscaling to spatial resolutions relevant for local decision-making, hydrological modeling, and land management. Future research should focus on systematically investigating the influence of topographic, geologic, and climatic factors on prediction errors and on developing hybrid modeling frameworks that combine the strengths of global models with detailed local soil information. Such approaches would improve the spatial accuracy and practical applicability of global soil datasets, supporting more robust assessments of soil and land resources.

Author Contributions

Conceptualization, K.X.S. and D.P.K.; methodology, S.G., K.X.S. and D.P.K.; software, X.K.S.; validation, S.G., K.X.S., A.S., E.N., O.K., D.K. and S.P.-G.; formal analysis, S.G., K.X.S., A.S., E.N., O.K., D.K. and S.P.-G.; investigation, S.G., K.X.S., A.S., E.N., O.K., D.K. and S.P.-G.; resources, S.G., K.X.S., O.K. and D.P.K.; data curation, S.G., A.S., E.N., D.K., X.K.S. and S.P.-G.; writing—original draft preparation, S.G., K.X.S., A.S., E.N., O.K., D.K. and X.K.S.; writing—review and editing, S.G., K.X.S., A.S., E.N., D.P.K., O.K., D.K., X.K.S. and S.P.-G.; visualization, S.G. and A.S.; supervision, S.G., K.X.S. and D.P.K.; project administration, K.X.S.; funding acquisition, K.X.S. All authors have read and agreed to the published version of the manuscript.

Funding

This research was co-funded by the European Union under the project Path4Med (grant number 101156867), https://www.path4med.eu/ (accessed on 10 November 2025), https://cordis.europa.eu/project/id/101156867 (accessed on 10 November 2025) and the Hellenic Foundation for Research and Innovation (H.F.R.I.; ELIDEK) through the project “DT-AGRO–Spatially Explicit Digital Twin of the Greek Agro-Hydro-System” (grant number 014815), under Sub-Action 1: Funding New Researchers—RRF: Basic Research Financing (Horizontal support for all Sciences).

Data Availability Statement

All data used are available in the cited sources.

Acknowledgments

We gratefully acknowledge Regional Laboratory of Agricultural Applications and Fertilizer Analysis of Epirus and Western Macedonia (PEGEAL) and its personnel for making the PEGEAL soil data available and for the valuable assistance with metadata and data access.

Conflicts of Interest

The authors declare no conflicts of interest.

Appendix A
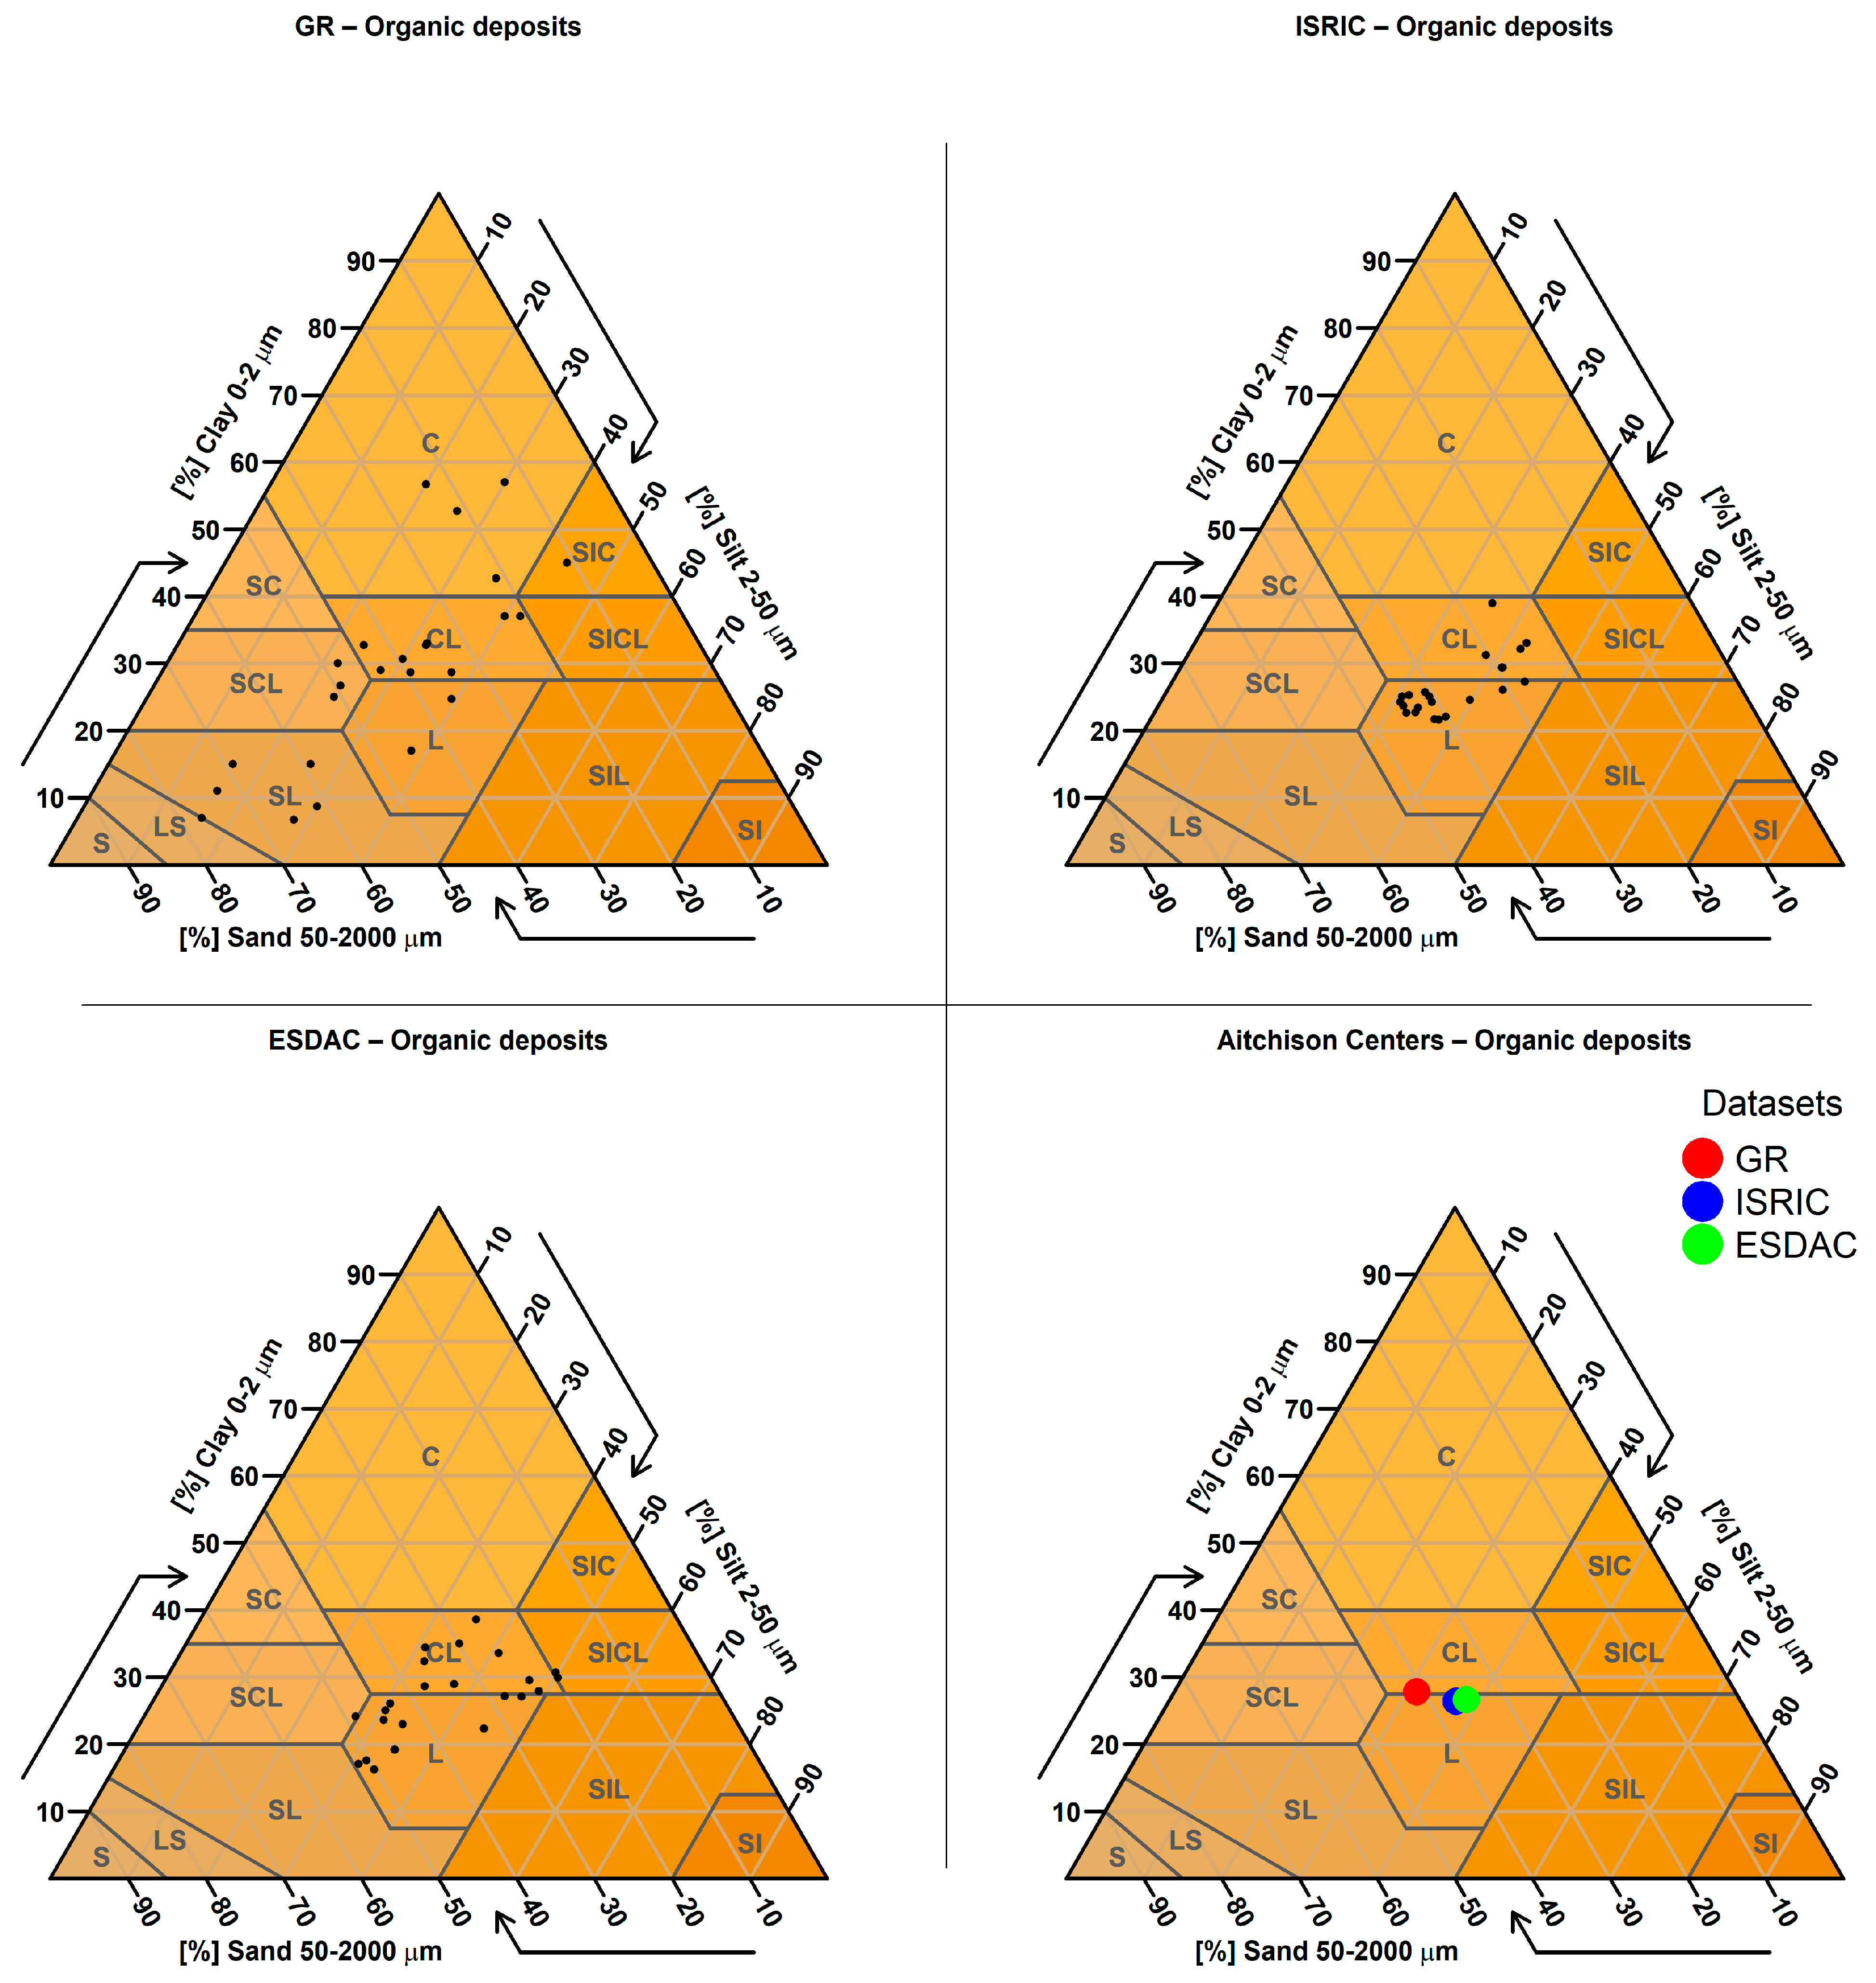
Figure A1. Clay content (%) based on Lab analysis samples for the Greek Soil Map.
Soilsystems 09 00133 g0a1
Figure A2. Sand content (%) based on Lab analysis samples for the Greek Soil Map.
Soilsystems 09 00133 g0a2
Figure A3. Silt content (%) based on Lab analysis samples for the Greek Soil Map.
Soilsystems 09 00133 g0a3
Figure A4. Clay content (%) based on (a) the sampled raster values and (b) the whole raster dataset for ISRIC.
Soilsystems 09 00133 g0a4
Figure A5. Sand content (%) based on (a) the sampled raster values and (b) the whole raster dataset for ISRIC.
Soilsystems 09 00133 g0a5
Figure A6. Silt content (%) based on (a) the sampled raster values and (b) the whole raster dataset for ISRIC.
Soilsystems 09 00133 g0a6
Figure A7. Clay content (%) based on (a) the sampled raster values and (b) the whole raster dataset for ESDAC.
Soilsystems 09 00133 g0a7
Figure A8. Sand content (%) based on (a) the sampled raster values and (b) the whole raster dataset for ESDAC.
Soilsystems 09 00133 g0a8
Figure A9. Silt content (%) based on (a) the sampled raster values and (b) the whole raster dataset for ESDAC.
Soilsystems 09 00133 g0a9
Figure A10. Soil texture Classification of examined soil samples based on the predicted ESDAC compositions.
Soilsystems 09 00133 g0a10
Figure A11. Soil texture Classification of examined soil samples based on the predicted ISRIC compositions.
Soilsystems 09 00133 g0a11
Figure A12. Soil texture Classification of examined soil samples based on the Greek Soil Map compositions.
Soilsystems 09 00133 g0a12
Figure A13. Comparison of soil texture compositions for samples assigned to the alluvial deposits parent material category from three datasets (ESDAC, GR, and ISRIC) displayed on the ternary plot. The bottom-right panel shows back-transformed Aitchison center compositions for each dataset, indicating overall textural differences and clustering.
Soilsystems 09 00133 g0a13
Figure A14. Comparison of soil texture compositions for all samples from three datasets (ESDAC, GR, and ISRIC) displayed on the ternary plot. The bottom-right panel shows back-transformed Aitchison center compositions for each dataset, indicating overall textural differences and clustering.
Soilsystems 09 00133 g0a14
Figure A15. Comparison of soil texture compositions for samples assigned to the Basic igneous parent material category from three datasets (ESDAC, GR, and ISRIC) displayed on the ternary plot. The bottom-right panel shows back-transformed Aitchison center compositions for each dataset, indicating overall textural differences and clustering.
Soilsystems 09 00133 g0a15
Figure A16. Comparison of soil texture compositions for samples assigned to the Conglomerates parent material category from three datasets (ESDAC, GR, and ISRIC) displayed on the ternary plot. The bottom-right panel shows back-transformed Aitchison center compositions for each dataset, indicating overall textural differences and clustering.
Soilsystems 09 00133 g0a16
Figure A17. Comparison of soil texture compositions for samples assigned to the Sand dunes parent material category from three datasets (ESDAC, GR, and ISRIC) displayed on the ternary plot. The bottom-right panel shows back-transformed Aitchison center compositions for each dataset, indicating overall textural differences and clustering.
Soilsystems 09 00133 g0a17
Figure A18. Comparison of soil texture compositions for samples assigned to the Clay deposits parent material category from three datasets (ESDAC, GR, and ISRIC) displayed on the ternary plot. The bottom-right panel shows back-transformed Aitchison center compositions for each dataset, indicating overall textural differences and clustering.
Soilsystems 09 00133 g0a18
Figure A19. Comparison of soil texture compositions for samples assigned to the Volcanic Ash parent material category from three datasets (ESDAC, GR, and ISRIC) displayed on the ternary plot. The bottom-right panel shows back-transformed Aitchison center compositions for each dataset, indicating overall textural differences and clustering.
Soilsystems 09 00133 g0a19
Figure A20. Comparison of soil texture compositions for samples assigned to the Magmatic Conglomerates parent material category from three datasets (ESDAC, GR, and ISRIC) displayed on the ternary plot. The bottom-right panel shows back-transformed Aitchison center compositions for each dataset, indicating overall textural differences and clustering.
Soilsystems 09 00133 g0a20
Figure A21. Comparison of soil texture compositions for samples assigned to the Limestones, Marble parent material category from three datasets (ESDAC, GR, and ISRIC) displayed on the ternary plot. The bottom-right panel shows back-transformed Aitchison center compositions for each dataset, indicating overall textural differences and clustering.
Soilsystems 09 00133 g0a21
Figure A22. Comparison of soil texture compositions for samples assigned to the Marl parent material category from three datasets (ESDAC, GR, and ISRIC) displayed on the ternary plot. The bottom-right panel shows back-transformed Aitchison center compositions for each dataset, indicating overall textural differences and clustering.
Soilsystems 09 00133 g0a22
Figure A23. Comparison of soil texture compositions for samples assigned to the Acid igneous parent material category from three datasets (ESDAC, GR, and ISRIC) displayed on the ternary plot. The bottom-right panel shows back-transformed Aitchison center compositions for each dataset, indicating overall textural differences and clustering.
Soilsystems 09 00133 g0a23
Figure A24. Comparison of soil texture compositions for samples assigned to the Flysch parent material category from three datasets (ESDAC, GR, and ISRIC) displayed on the ternary plot. The bottom-right panel shows back-transformed Aitchison center compositions for each dataset, indicating overall textural differences and clustering.
Soilsystems 09 00133 g0a24
Figure A25. Comparison of soil texture compositions for samples assigned to the Ripidion/alluvial fan parent material category from three datasets (ESDAC, GR, and ISRIC) displayed on the ternary plot. The bottom-right panel shows back-transformed Aitchison center compositions for each dataset, indicating overall textural differences and clustering.
Soilsystems 09 00133 g0a25
Figure A26. Comparison of soil texture compositions for samples assigned to the Schist parent material category from three datasets (ESDAC, GR, and ISRIC) displayed on the ternary plot. The bottom-right panel shows back-transformed Aitchison center compositions for each dataset, indicating overall textural differences and clustering.
Soilsystems 09 00133 g0a26
Figure A27. Comparison of soil texture compositions for samples assigned to the Alluvial Terraces parent material category from three datasets (ESDAC, GR, and ISRIC) displayed on the ternary plot. The bottom-right panel shows back-transformed Aitchison center compositions for each dataset, indicating overall textural differences and clustering.
Soilsystems 09 00133 g0a27
Figure A28. Comparison of soil texture compositions for samples assigned to the Sandstone parent material category from three datasets (ESDAC, GR, and ISRIC) displayed on the ternary plot. The bottom-right panel shows back-transformed Aitchison center compositions for each dataset, indicating overall textural differences and clustering.
Soilsystems 09 00133 g0a28
Figure A29. Comparison of soil texture compositions for samples assigned to the Organic deposits parent material category from three datasets (ESDAC, GR, and ISRIC) displayed on the ternary plot. The bottom-right panel shows back-transformed Aitchison center compositions for each dataset, indicating overall textural differences and clustering.
Soilsystems 09 00133 g0a29
Figure A30. Comparison of soil texture compositions for samples assigned to the Lake deposits/lacustrine sediments parent material category from three datasets (ESDAC, GR, and ISRIC) displayed on the ternary plot. The bottom-right panel shows back-transformed Aitchison center compositions for each dataset, indicating overall textural differences and clustering.
Soilsystems 09 00133 g0a30

References

  1. Ghodrati, M.; Dariane, A.B. Enhancing Hydrological Model Efficiency through Satellite Image Classification. Hydrol. Sci. J. 2024, 69, 2057–2070. [Google Scholar] [CrossRef]
  2. Isaboke, J.; Osano, O.; Humphrey, O.S.; Dowell, S.M.; Njoroge, R.; Watts, M.J. Influence of Agricultural Land Use Management on Soil Particle Size Distribution and Nutrient Adsorption in Western Kenya. Chem. Afr. 2025, 8, 1599–1610. [Google Scholar] [CrossRef]
  3. Wang, X.; Sun, L.; Zhao, N.; Li, W.; Wei, X.; Niu, B. Multifractal Dimensions of Soil Particle Size Distribution Reveal the Erodibility and Fertility of Alpine Grassland Soils in the Northern Tibet Plateau. J. Environ. Manag. 2022, 315, 115145. [Google Scholar] [CrossRef] [PubMed]
  4. Qi, F.; Zhang, R.; Liu, X.; Niu, Y.; Zhang, H.; Li, H.; Li, J.; Wang, B.; Zhang, G. Soil Particle Size Distribution Characteristics of Different Land-Use Types in the Funiu Mountainous Region. Soil Tillage Res. 2018, 184, 45–51. [Google Scholar] [CrossRef]
  5. OPEKEPE Greek Payment and Control Agency for Guidance and Guarantee Community Aid. Available online: https://www.opekepe.gr/opekepe-organisation-gr/opekepe-e-services-gr/pliroforiaka-systimata/gewpliroforiako-systima-edafologikwn-dedomenwn (accessed on 10 August 2025).
  6. Karamesouti, M.; Kairis, O.; Gasparatos, D.; Lakes, T. Map-Based Soil Crusting Susceptibility Assessment Using Pedotransfer Rules, CORINE and NDVI: A Preliminary Study in Greece. Ecol. Indic. 2023, 154, 110668. [Google Scholar] [CrossRef]
  7. Kairis, O.; Karamanos, A.; Voloudakis, D.; Kapsomenakis, J.; Aratzioglou, C.; Zerefos, C.; Kosmas, C. Identifying Degraded and Sensitive to Desertification Agricultural Soils in Thessaly, Greece, under Simulated Future Climate Scenarios. Land 2022, 11, 395. [Google Scholar] [CrossRef]
  8. Lekka, C.; Petropoulos, G.P.; Triantakonstantis, D.; Detsikas, S.E.; Chalkias, C. Exploring the Spatial Patterns of Soil Salinity and Organic Carbon in Agricultural Areas of Lesvos Island, Greece, Using Geoinformation Technologies. Environ. Monit. Assess 2023, 195, 391. [Google Scholar] [CrossRef]
  9. Soulis, K.X.; Psomiadis, E.; Londra, P.; Skuras, D. A New Model-Based Approach for the Evaluation of the Net Contribution of the European Union Rural Development Program to the Reduction of Water Abstractions in Agriculture. Sustainability 2020, 12, 7137. [Google Scholar] [CrossRef]
  10. Ballabio, C.; Panagos, P.; Monatanarella, L. Mapping Topsoil Physical Properties at European Scale Using the LUCAS Database. Geoderma 2016, 261, 110–123. [Google Scholar] [CrossRef]
  11. Hengl, T.; Mendes De Jesus, J.; Heuvelink, G.B.M.; Ruiperez Gonzalez, M.; Kilibarda, M.; Blagotić, A.; Shangguan, W.; Wright, M.N.; Geng, X.; Bauer-Marschallinger, B.; et al. SoilGrids250m: Global Gridded Soil Information Based on Machine Learning. PLoS ONE 2017, 12, e0169748. [Google Scholar] [CrossRef]
  12. Kaffas, K.; Pisaturo, G.R.; Premstaller, G.; Hrissanthou, V.; Penna, D.; Righetti, M. Event-Based Soil Erosion and Sediment Yield Modelling for Calculating Long-Term Reservoir Sedimentation in the Alps. Hydrol. Sci. J. 2024, 69, 321–336. [Google Scholar] [CrossRef]
  13. Kis, A.; Pongrácz, R.; Bartholy, J.; Szabó, J.A. Projection of Runoff Characteristics as a Response to Regional Climate Change in a Central/Eastern European Catchment. Hydrol. Sci. J. 2020, 65, 2256–2273. [Google Scholar] [CrossRef]
  14. Soulis, K.X. Estimation of SCS Curve Number Variation Following Forest Fires. Hydrol. Sci. J. 2018, 63, 1332–1346. [Google Scholar] [CrossRef]
  15. Batjes, N.H.; Ribeiro, E.; van Oostrum, A.; Leenaars, J.; Hengl, T.; Mendes de Jesus, J. WoSIS: Providing standardized soil profile data for the world. Earth Syst. Sci. Data 2017, 9, 1–14. [Google Scholar] [CrossRef]
  16. Poggio, L.; De Sousa, L.M.; Batjes, N.H.; Heuvelink, G.B.M.; Kempen, B.; Ribeiro, E.; Rossiter, D. SoilGrids 2.0: Producing Soil Information for the Globe with Quantified Spatial Uncertainty. Soil 2021, 7, 217–240. [Google Scholar] [CrossRef]
  17. Radočaj, D.; Jurišić, M.; Rapčan, I.; Domazetović, F.; Milošević, R.; Plaščak, I. An Independent Validation of SoilGrids Accuracy for Soil Texture Components in Croatia. Land 2023, 12, 1034. [Google Scholar] [CrossRef]
  18. Dandabathula, G.; Salunkhe, S.S.; Bera, A.K.; Ghosh, K.; Hari, R.; Biradar, P.; Chirala, K.R.; Gaur, M.K. Validation of SoilGrids 2.0 in an Arid Region of India Using In Situ Measurements. Eur. J. Environ. Earth Sci. 2022, 3, 49–58. [Google Scholar] [CrossRef]
  19. Balla, D.; Varga, O.; Zichar, M. Accuracy Assessment of Different Soil Databases Concerning WRB Reference Soil Groups. Landsc. Environ. 2016, 10, 1–12. [Google Scholar] [CrossRef]
  20. Lilburne, L.; Helfenstein, A.; Heuvelink, G.B.M.; Eger, A. Interpreting and Evaluating Digital Soil Mapping Prediction Uncertainty: A Case Study Using Texture from SoilGrids. Geoderma 2024, 450, 117052. [Google Scholar] [CrossRef]
  21. Huang, S.; Eisner, S.; Haddeland, I.; Mengistu, Z.T. Evaluation of two new-generation global soil databases for macro-scale hydrological modelling in Norway. J. Hydrol. 2022, 610, 127895. [Google Scholar] [CrossRef]
  22. Bodenstein, D.; Clarke, C.; Watson, A.; Miller, J.; van der Westhuizen, S.; Rozanov, A. Evaluation of global and continental scale soil maps for southern Africa using selected soil properties. Catena 2022, 216, 106381. [Google Scholar] [CrossRef]
  23. Palli Gravani, S.; Gerontidis, S.; Kopanelis, D.; Kairis, O.; Soulis, K.; Kalivas, D. Evaluation of Digital Maps of Top-Soil Properties Compared to Large-Scale Laboratory Soil Data and Synergies towards a Better European Soils’ Delineation. In Proceedings of the EGU General Assembly 2025, Vienna, Austria, 27 April–2 May 2025. [Google Scholar]
  24. Willoughby, I.; Balandier, P.; Bentsen, N.S.; McCarthy, N.; Claridge, J. Forest Vegetation Management in Europe: Current Practice and Future Requirements; COST Office: Brussels, Belgium, 2009. [Google Scholar]
  25. Kagkou, E. Agricultural, Fishery, Food and Sustainable Rural Development in Greece. In Les Agricultures Méditerranéennes: Analyses Par Pays; Options Méditerranéennes; Série B. Études et Recherches; CIHEAM: Montpellier, France, 2008; pp. 207–240. [Google Scholar]
  26. Yassoglou, N.; Tsadilas, C.; Kosmas, C. The Soils of Greece; World Soils Book Series; Springer International Publishing: Cham, Switzerland, 2017; ISBN 978-3-319-53332-2. [Google Scholar]
  27. Kostopoulou, E.; Giannakopoulos, C. Projected Changes in Extreme Wet and Dry Conditions in Greece. Climate 2023, 11, 49. [Google Scholar] [CrossRef]
  28. Regional Laboratory of Agricultural Applications and Fertilizer Analysis of Epirus and Western Macedonia (PEGEAL), Ministry of Rural Development and Food, Greece. Available online: https://www.minagric.gr/xrisimewplirofories-2/syndesmoi/915-p-e-g-e-a-l (accessed on 3 November 2025).
  29. Bilas, G.; Dionysiou, N.; Karapetsas, N.; Silleos, N.; Kosmas, K.; Misopollinos, N. Development of a National Geodatabase (Greece) for Soil Surveys and Land Evaluation Using Space Technology and GIS. In Proceedings of the EGU General Assembly Conference Abstracts, Vienna, Austria, 1 April 2016; p. EPSC2016-12889. [Google Scholar]
  30. Alexakis, D.E.; Bathrellos, G.D.; Skilodimou, H.D.; Gamvroula, D.E. Spatial Distribution and Evaluation of Arsenic and Zinc Content in the Soil of a Karst Landscape. Sustainability 2021, 13, 6976. [Google Scholar] [CrossRef]
  31. Eloi Ribeiro, N.H.B. World Soil Information Service (WoSIS)—Towards the Standardization and Harmonization of World Soil Data. In Procedures Manual 2018; ISRIC—World Soil Information: Wageningen, The Netherlands, 2018. [Google Scholar]
  32. Batjes, N.H.; Ribeiro, E.; Van Oostrum, A. Standardised Soil Profile Data to Support Global Mapping and Modelling (WoSIS Snapshot 2019). Earth Syst. Sci. Data 2020, 12, 299–320. [Google Scholar] [CrossRef]
  33. Batjes, N.H.; Calisto, L.; De Sousa, L.M. Providing Quality-Assessed and Standardised Soil Data to Support Global Mapping and Modelling (WoSIS Snapshot 2023). Earth Syst. Sci. Data 2024, 16, 4735–4765. [Google Scholar] [CrossRef]
  34. Panagos, P.; Van Liedekerke, M.; Jones, A.; Montanarella, L. European Soil Data Centre: Overview; European Commission, Joint Research Centre: Brussels, Belgium, 2013. [Google Scholar]
  35. Panagos, P.; Van Liedekerke, M.; Jones, A.; Montanarella, L. European Soil Data Centre: Response to European Policy Support and Public Data Requirements. Land Use Policy 2012, 29, 329–338. [Google Scholar] [CrossRef]
  36. ISRIC User Manual. Available online: https://files.isric.org/public/documents/2025_WoSIS_coding_analytical_method_descriptions.pdf (accessed on 3 November 2025).
  37. Orgiazzi, A.; Ballabio, C.; Panagos, P.; Jones, A.; Fernández-Ugalde, O. LUCAS Soil, the Largest Expandable Soil Dataset for Europe: A Review. Eur. J Soil Sci. 2018, 69, 140–153. [Google Scholar] [CrossRef]
  38. Yassoglou, N. Soil Survey in Greece. In Soil Resources of Europe; European Soil Bureau Research Report; Office for Official Publications of the European Communities: Luxembourg, 2005. [Google Scholar]
  39. Spanos, K.A.; Skouteri, A.; Gaitanis, D.; Petrakis, P.V.; Meliadis, I.; Michopoulos, P.; Solomou, A.; Koulelis, P.; Avramidou, E.V. Forests of Greece, Their Multiple Functions and Uses, Sustainable Management and Biodiversity Conservation in the Face of Climate Change. OJE 2021, 11, 374–406. [Google Scholar] [CrossRef]
  40. Nakos, G. Classification, Mapping and Evaluation of Soils: Technical Specifications; Ministry of Agriculture, Institute of Mediterranean Forest Ecosystems and Forest Products Technology: Athens, Greece, 1991. [Google Scholar]
  41. ISRIC—World Soil Information SoilGrids Platform. Available online: https://soilgrids.org (accessed on 10 August 2025).
  42. European Commission, Joint Research Centre European Soil Data Centre. Available online: https://esdac.jrc.ec.europa.eu (accessed on 8 October 2025).
  43. Copernicus Data Space Ecosystem Digital Elevation Model (DEM) of Greece from Copernicus Data Space Ecosystem. Available online: https://dataspace.copernicus.eu/explore-data/data-collections/copernicus-contributing-missions/collections-description/COP-DEM (accessed on 10 August 2025).
  44. Aitchison, J. The Statistical Analysis of Compositional Data; Blackburn Press: Surrey, UK, 2003; ISBN 978-1930665781. [Google Scholar]
  45. van den Boogaart, K.G.; Tolosana-Delgado, R.; Bren, M. Compositions: Compositional Data Analysis, R package version 2.0-9; 2025. Available online: https://CRAN.R-project.org/package=compositions (accessed on 3 November 2025).
  46. Pawlowsky-Glahn, V.; Buccianti, A. Compositional Data Analysis: Theory and Applications; John Wiley & Sons: Hoboken, NJ, USA, 2011. [Google Scholar] [CrossRef]
  47. IBM SPSS Statistics for Windows; Version 25.0 2017; IBM: Armonk, NY, USA, 2017.
  48. Getis, A.; Ord, J.K. The Analysis of Spatial Association by Use of Distance Statistics. Geogr. Anal. 1992, 24, 189–206. [Google Scholar] [CrossRef]
  49. Ord, J.K.; Getis, A. Local Spatial Autocorrelation Statistics: Distributional Issues and an Application. Geogr. Anal. 1995, 27, 286–306. [Google Scholar] [CrossRef]
  50. Liu, W.; Ma, L.; Smanov, Z.; Samarkhanov, K.; Abuduwaili, J. Clarifying Soil Texture and Salinity Using Local Spatial Statistics (Getis-Ord Gi* and Moran’s I) in Kazakh–Uzbekistan Border Area, Central Asia. Agronomy 2022, 12, 332. [Google Scholar] [CrossRef]
  51. Jiang, L.; Qiu, G.; Yu, X. Identification and Spatial Analysis of Land Salinity in China’s Yellow River Delta Using a Land Salinity Monitoring Index from Harmonized UAV-Landsat Imagery. Sensors 2023, 23, 7584. [Google Scholar] [CrossRef]
  52. Oxoli, D.; Molinari, M.E.; Brovelli, M.A. Hotspot Analysis, an Open Source GIS Tool for Exploratory Spatial Data Analysis: Application to the Study of Soil Consumption in Italy. Rend. Online Della Soc. Geol. Ital. 2018, 46, 82–87. [Google Scholar] [CrossRef]
  53. Radočaj, D.; Jug, I.; Jurišić, M.; Gašparovic, M. The Effect of Soil Sampling Density and Spatial Autocorrelation on Interpolation Accuracy of Chemical Soil Properties in Arable Cropland. Agronomy 2021, 11, 2430. [Google Scholar] [CrossRef]
  54. ESRI. Hot Spot Analysis (Getis-Ord Gi*) (Spatial Statistics). Tool reference. Available online: https://pro.arcgis.com/en/pro-app/latest/tool-reference/spatial-statistics/hot-spot-analysis.htm (accessed on 3 November 2025).
  55. Congalton, R.G. A Review of Assessing the Accuracy of Classifications of Remotely Sensed Data. Remote Sens. Environ. 1991, 37, 35–46. [Google Scholar] [CrossRef]
  56. Foody, G.M. Status of Land Cover Classification Accuracy Assessment. Remote Sens. Environ. 2002, 80, 185–201. [Google Scholar] [CrossRef]
  57. Olofsson, P.; Foody, G.M.; Herold, M.; Stehman, S.V.; Woodcock, C.E.; Wulder, M.A. Good Practices for Estimating Area and Assessing Accuracy of Land Change. Remote Sens. Environ. 2014, 148, 42–57. [Google Scholar] [CrossRef]
  58. Wilson, M.J. The Importance of Parent Material in Soil Classification: A Review in a Historical Context. CATENA 2019, 182, 104131. [Google Scholar] [CrossRef]
  59. Zhang, Y.; Wu, T.; Lei, L.; Jie, Y. Effects of Parent Material on Soil Hydraulic Properties in Subtropical Hilly Area of Southern China. CATENA 2024, 243, 108210. [Google Scholar] [CrossRef]
  60. Acosta, J.A.; Martínez-Martínez, S.; Faz, A.; Arocena, J. Accumulations of Major and Trace Elements in Particle Size Fractions of Soils on Eight Different Parent Materials. Geoderma 2011, 161, 30–42. [Google Scholar] [CrossRef]
  61. Kooijman, A.M.; Jongejans, J.; Sevink, J. Parent Material Effects on Mediterranean Woodland Ecosystems in NE Spain. CATENA 2005, 59, 55–68. [Google Scholar] [CrossRef]
  62. Gökbulak, F.; Özcan, M. Hydro-Physical Properties of Soils Developed from Different Parent Materials. Geoderma 2008, 145, 376–380. [Google Scholar] [CrossRef]
  63. Olowolafe, E.A. Soil Parent Materials and Soil Properties in Two Separate Catchment Areas on the Jos Plateau, Nigeria. GeoJournal 2002, 56, 201–212. [Google Scholar] [CrossRef]
  64. De Kimpe, C.R.; Laverdiere, M.R.; Dejou, J.; Lasalle, P. Effects of Acidic and Basic Parent Materials on Formation of Some Soils in Quebec (Canada). Geoderma 1984, 33, 101–118. [Google Scholar] [CrossRef]
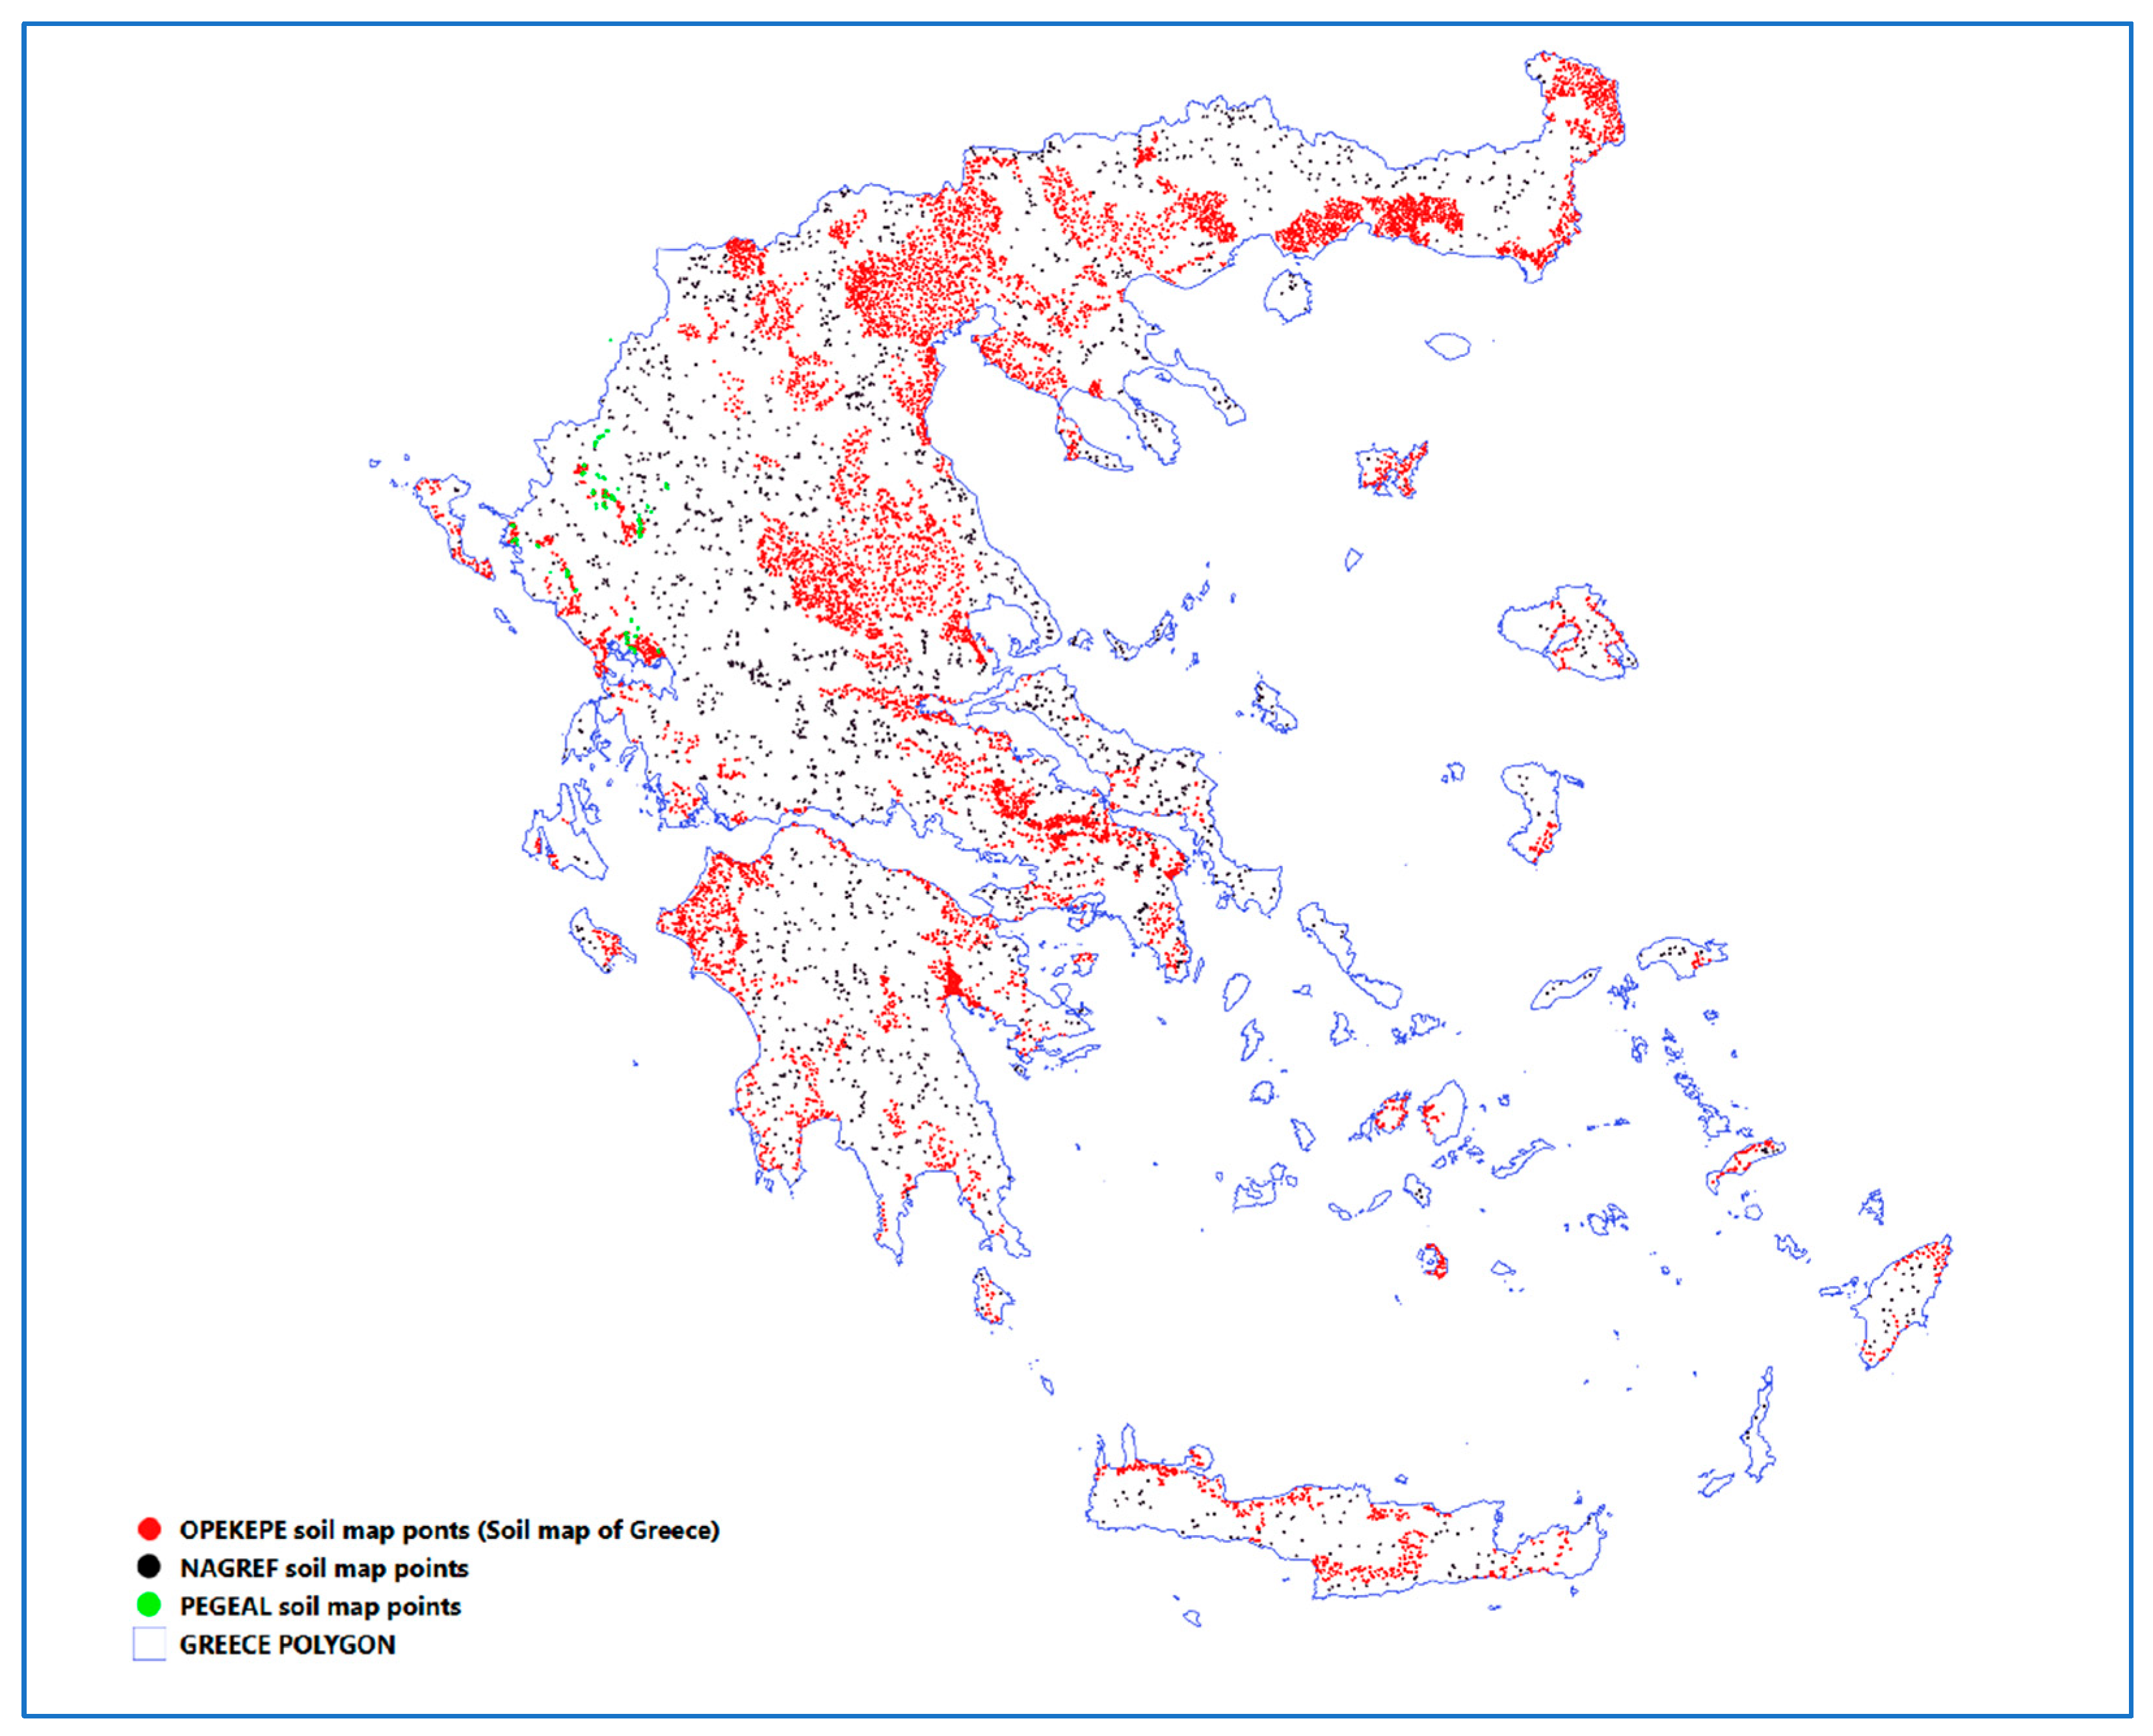
Figure 1. The study area (Greece). Red points represent Greek Soil map sampling points. Black points represent National Agricultural Research Foundation–NAGREF’s soil map sampling points. Green points represent the PEGEAL’s [28] soil map points.
Soilsystems 09 00133 g001
Figure 2. Explanation of the use of the modified methodology for assigning raster values to the sampling points of the Soil Map of Greece. The image illustrates selected raster grid cells, the center of the overlapping grid cell (blue x), the corresponding sand content values (%) in each cell, the location of a sampling point (blue dot), and the measured sand content (%) at that point.
Soilsystems 09 00133 g002
Figure 3. Smoothed frequency distribution (kernel density plot) of SAND content values (%) for the observed point values coming from the Soil Map of Greece (GR) (red line), and the corresponding values at the same positions sampled (using the “raster sampling” GIS function) from ISRIC (blue line) and ESDAC (green line) raster datasets.
Soilsystems 09 00133 g003
Figure 4. Smoothed frequency distribution (kernel density plot) of CLAY content values (%) for the observed point values coming from the Soil Map of Greece (GR) (red line), and the corresponding values at the same positions sampled (using the “raster sampling” GIS function) from ISRIC (blue line) and ESDAC (green line) raster datasets.
Soilsystems 09 00133 g004
Figure 5. Smoothed frequency distribution (kernel density plot) of SILT content values (%) for the observed point values coming from the Soil Map of Greece (GR) (red line), and the corresponding values at the same positions sampled (using the “raster sampling” GIS function) from ISRIC (blue line) and ESDAC (green line) raster datasets.
Soilsystems 09 00133 g005
Figure 6. Ternary plot of the distribution of sand, silt and clay (%) of all data points for GR (red), ESDAC (green) and ISRIC (blue) datasets.
Soilsystems 09 00133 g006
Figure 7. Scatterplots illustrating the correlation between the values of soil properties calculated in the Soil Map of Greece and the corresponding predictions from the ISRIC and ESDAC database. (a) Correlation of ESDAC sand content (%), (b) ISRIC sand content (%), (c) ESDAC clay content (%), (d) ISRIC clay content (%), (e) ESDAC silt content (%) and (f) ISRIC silt content (%). Red lines indicate the linear regression fit, accompanied by the regression equations and coefficients of determination.
Soilsystems 09 00133 g007
Figure 8. Spatial clustering of high-error (hot spot) and low-error (cold spot) areas in the prediction of soil properties by international datasets: (a) sand ISRIC, (b) sand ESDAC, (c) clay ISRIC, (d) clay ESDAC, (e) silt ISRIC, and (f) silt ESDAC.
Soilsystems 09 00133 g008
Figure 9. Distribution of soil texture classes based on the values of sand, clay, and silt fractions for each of the three datasets (GR, ESDAC, ISRIC).
Soilsystems 09 00133 g009
Figure 10. Ternary plots for the distribution of sand, silt and clay content (%) for GR (red points), ESDAC (green points) and ISRIC (blue points) datasets. Only the samples classed as belonging the “Marl” or “Clay-rich deposit” parent material classes were selected. Additional plots regarding the remaining parent material classes are presented in Figure A13, Figure A14, Figure A15, Figure A16, Figure A17, Figure A18, Figure A19, Figure A20, Figure A21, Figure A22, Figure A23, Figure A24, Figure A25, Figure A26, Figure A27, Figure A28, Figure A29 and Figure A30).
Soilsystems 09 00133 g010
Figure 11. Ternary plots for the distribution of sand, silt and clay content (%) for GR (red points), ESDAC (green points) and ISRIC (blue points) datasets. Only the samples classed as belonging the “Sand dune” or “Conglomerates” parent material classes were selected. Additional plots regarding the remaining parent material classes are presented in Figure A13, Figure A14, Figure A15, Figure A16, Figure A17, Figure A18, Figure A19, Figure A20, Figure A21, Figure A22, Figure A23, Figure A24, Figure A25, Figure A26, Figure A27, Figure A28, Figure A29 and Figure A30).
Soilsystems 09 00133 g011
Table 1. The summary workflow of the procedures undertaken for the implementation of the methodology employed in the present study.
StepDescription
1. Data AcquisitionCollect raster datasets from ISRIC and ESDAC, and the Greek national soil database.
2. Raster ProcessingSubset rasters to topsoil layer (0–30 cm) and clip them to the Greek territory. Project to Greek Grid (EGSA87, ESPG: 2100).
3. Raster value extraction processExtract values of sand, clay, and silt from raster datasets for each sampling point.
4. Error CalculationCompute differences between observed (Soil Map of Greece) and predicted (ISRIC and ESDAC) values for each soil property.
5. Statistical AnalysisPerform univariate statistics for each property (sand, clay, silt).
6 Spatial Variability AnalysisAnalyze spatial distribution of absolute errors to identify error clustering.
7. Soil Texture ClassificationFor each sampling point from the Greek Soil Map, the soil texture class was determined based on the calculated sand, clay, and silt percentages using the USDA soil texture classification system.
8. Categorical Comparison of Soil Texture ClassesPredicted soil texture classes from international datasets were compared with the USDA-based classes derived from the Greek Soil Map. Accuracy assessment was performed using producer’s accuracy, user’s accuracy, and overall accuracy—metrics suitable for evaluating agreement between categorical datasets.
9. Targeted Analysis Based on Parent MaterialPredicted sand, clay, and silt values were examined for sampling points located on soils derived from parent materials known to produce extreme textural values (e.g., very sandy or clayey soils). A spatial join was performed between the SMUs (containing parent material information) and the sampling points to identify relevant cases.
10. Evaluating the Unbiasedness of the Raster Value Extraction ProcessAlternative raster value extraction process method (Step 3) implemented, and the error residuals compared.
11. Validation of Results Using Diverse Greek Soil StudiesData from diverse datasets were utilized to assess the validity of the results obtained. To this end, steps 1 to 5 were repeated for the additional datasets.
Table 2. Descriptive statistics of the three soil texture classes for the three datasets (Soil Map of Greece (GR), ESDAC and ISRIC). Aitchison center compositions for each dataset were derived from back-transforming the centers of the respective Aitchison geometries in ILR space. The GR center composition was calculated independently for each dataset due to the discrepancy between valid ESDAC and valid ISRIC samples. The corresponding values are marked with the relevant dataset name in superscript.
SAND (%)CLAY (%)SILT (%)
GRESDACISRICGRESDACISRICGRESDACISRIC
Mean (%)39.6937.0631.7630.625.0828.2629.737.8639.98
Aitchison Center Composition (%)(39.27) ESDAC, (39.05) ISRIC36.5831.30(30.23) ESDAC, (30.32) ISRIC25.1928.37(30.50) ESDAC, (30.62) ISRIC38.2340.33
Median (%)39.3036.8031.5728.724.7927.7328.0037.8639.93
Variance (%)276.25102.5059.19170.1830.8622.95102.1454.4427.25
Min (%)129061301724
Max (%)977154835349786361
Std (%)16.6210.127.69413.045.554.7910.107.375.22
Kurtosis−0.28−0.16−0.391−0.230.830.420.05−0.32−0.15
Skewness0.340.040.000.420.400.540.320.070.11
Table 3. Predictive performance metrics for ESDAC and ISRIC using the GR dataset as ground truth. RMSEA is the Root Mean Squared Error in ILR space, and MAEA is the Mean Absolute Error in ILR space and is equal to the mean Aitchison distance. Lower values indicate better agreement with observed compositions.
MetricGR-ESDACGR-ISRIC
RMSEA0.81320.8108
MAEA0.70710.7104
Table 4. Descriptive statistical data of the differences between the measured values of soil particle size distribution (sand, clay, silt) and the corresponding predictions from the two international databases (ESDAC and ISRIC) at the locations where laboratory analyses were conducted during the development of the Soil Map of Greece.
SANDCLAYSILT
Residuals StatisticsGR–ESDACGR–ISRICGR–ESDACGR–ISRICGR–ESDACGR–ISRIC
Mean2.557.785.562.44−8.12−1.88
Median2.007.005.002.00−9.00−2.00
RMSE (raw)17.1818.5513.6913.2014.0414.45
Variance269.13235.48151.63153.22127.00193.96
RMSE (backtransformed)21.6821.8114.4413.587.248.22
MAE (backtransformed)17.3517.7711.6911.045.666.73
Min−48.00−40.00−36.00−35.00−50.00−47.00
Max67.0071.00061.0051.0037.0058.00
Std16.4015.3412.3112.3811.2713.92
Table 5. Statistical data from the investigation of the relationship between key geomorphological characteristics of the soil surface and the differences between soil particle size distribution measurements from the Soil Map of Greece and the corresponding predicted values at the same locations from the international databases ESDAC and ISRIC.
CharacteristicParameters and MetricsSandClaySilt
GR–ESDAC GR–ISRICGR–ESDACGR–ISRICGR–ESDACGR–ISRIC
ElevationSlope0.000240.002210.003600.000270.010610.01020
Intercept1.59197.49765.50591.9932−7.0984−0.8241
p-value0.0000.1080.1310.0000.0000.000
R2 0.003600.000270.000240.002210.010610.01020
SlopeSlope0.176500.15670−0.084200.0596 −0.09130−0.28000
Intercept1.58436.98616.04622.1992 −7.6318−0.6909
p-value0.0000.0000.0000.0030.0000.000
R2 0.004490.003970.001760.000900.002500.01563
Sin (Aspect)Slope−0.309 −0.20770−0.01560−0.111800.322400.30720
Intercept2.39727.7066 5.66152.4742−8.0557−1.9771
p-value0.1300.2780.9190.4710.0220.077
R2 0.000240.000120.000000.000050.000530.00032
Cos (Aspect)Slope0.214400.27490−0.15900−0.24670−0.056500.02950
Intercept2.3889 7.69995.66252.474−8.0486−1.9711
p-value0.2860.1450.2960.1070.6840.863
R20.000120.000220.000110.000270.000020.00000
CurvatureSlope0.031 −0.49120−0.289400.275800.24910−0.9092
Intercept2.3908 7.70325.66162.4714−8.0495−1.9693
p-value0.9660.4680.5960.6150.6170.138
R20.000000.000050.000030.000030.000030.00023
TWISlope−0.14780−0.05960.02700−0.047000.118900.04370
Intercept2.57117.7755.62822.5292−8.194−2.0241
p-value0.1420.5290.7230.5400.0870.610
R20.000220.000040.000010.000040.000300.00003
Flow AccumulationSlope0.000600.00100−0.00040−0.00050−0.00010−0.00030
Intercept2.371 7.67025.67582.4883−8.044−1.9624
p-value0.2830.0640.2930.2420.6930.590
R20.000120.000350.000110.000140.000020.00003
Table 6. User’s accuracy, Producer’s Accuracy, Overall accuracy and User’s Overall accuracy for the evaluation of ISRIC and ESDAC dataset performance regarding the ability to estimate the soil texture class.
ClassProducer’s
Accuracy
User’s AccuracyOverall AccuracyOverall User’s
Accuracy
ISRICESDACISRICESDACISRICESDACISRICESDAC
Clay0.0160.0070.3110.2280.1880.2040.1880.205
Clay Loam0.4100.2600.2480.243-
Loam0.5050.5300.1580.161
Loamy Sand0.0000.0050.0000.400
Sand0.0210.0000.0270.000
Sandy Clay0.0000.0000.0000.000
Sandy Clay Loam0.0180.1320.2650.332
Sandy Loam0.0660.2830.4030.325
Silt Loam0.0860.0850.0590.049
Silty Clay0.0430.0080.1280.042
Silty Clay Loam0.0930.0400.0340.030
Table 7. The average clay content measured in the soil samples (within the boundaries of specific parent materials) as part of the Greek Soil Map, along with the corresponding average clay contents predicted at the same locations by the ESDAC and ISRIC datasets.
Parent Material
(Number of Points)
GR
Mean Clay % (Std)
ISRIC
Mean Clay % (Std)
ESDAC
Mean Clay % (Std)
marl (1105)33.6 (11.0)26.7 (6.5)25.8 (5.2)
clay-rich deposits (572)70.0 (12.9)27.0 (4.9)25.0 (5.0)
lacustrine sediments (91)43.7 (12.5)33.1 (6.2)30.4 (7.8)
flysch formations (138)24.7 (8.7)24.8 (5.9)25.5 (5.9)
colluvial materials (ripidion) (236)25.6 (11.8)25.2 (6.7)23.7 (4.9)
schist (161)23.6 (8.8)24.6(5.0)23.7 (5.0)
Table 8. Results of pairwise t-tests comparing clay content between datasets (GR vs. ESDAC and GR vs. ISRIC) across different parent material categories. Reported values include the t-statistic, associated p-value, and sample size for each comparison. Positive t-values indicate higher values in the GR dataset relative to the comparison dataset.
Parent MaterialMetricGR vs. ESDACGR vs. ISRIC
clay-rich depositst-Statistic17.64111.797
p-Value0.0000.000
Sample Size572557
marlt-Statistic23.70015.450
p-Value0.0000.000
Sample Size11051083
flysch formationst-Statistic−0.757−4.291
p-Value0.4500.000
Sample Size138133
colluvial materials (ripidion)t-Statistic2.493−3.328
p-Value0.0130.001
Sample Size236231
schistt-Statistic−0.124−4.326
p-Value0.9020.000
Sample Size161160
lacustrine sedimentst-Statistic11.2066.286
p-Value0.0000.000
Sample Size9191
Table 9. The average sand content measured in the soil samples (within the boundaries of specific parent materials) as part of the Greek Soil Map, along with the corresponding average sand contents predicted at the same locations by the ESDAC and ISRIC datasets.
Parent Material
(Number of Points)
GR
Mean Sand % (Std)
ISRIC
Mean Sand % (Std)
ESDAC
Mean Sand % (Std)
dunes (34)61.0 (17.5)36.0 (10.6)46.0 (8.6)
conglomerates (607)40.5 (13.6)29.7 (8.6)35.3 (8.4)
alluvium (4815)37.5 (17.4)30.0 (9.1)35.8 (11.2)
basic igneous rocks (85)42.0 (14.1)32.7 (8.4)34.4 (8.4)
alluvial terraces (1649)42.6 (14.9)34.0 (7.6)40.0 (8.9)
Table 10. Results of pairwise t-tests comparing sand content between datasets (GR vs. ESDAC and GR vs. ISRIC) across different parent material categories. Reported values include the t-statistic, associated p-value, and sample size for each comparison. Positive t-values indicate higher values in the GR dataset relative to the comparison dataset.
Parent MaterialMetricGR vs. ESDACGR vs. ISRIC
alluviumt-Statistic6.72222.501
p-Value0.0000.000
Sample Size48154699
basic igneous rockst-Statistic4.3216.238
p-Value0.0000.000
Sample Size8585
conglomeratest-Statistic9.13215.534
p-Value0.0000.000
Sample Size607567
dunest-Statistic3.6879.049
p-Value0.0010.000
Sample Size3434
alluvial terracest-Statistic6.51824.056
p-Value0.0000.000
Sample Size16491622
Table 11. Presentation of the RMSE values of the comparison between the predicted values (ESDAC and ISRIC) and the measured values (Soil Map of Greece), using the two different methods of assigning raster values to the sampling points, i.e., the standard method through overlapping cells (QGIS Values Assign) and the custom method to reduce bias (Custom Method Values Assign).
ESDACISRIC
QGIS Values AssignCustom Method
Values Assign
QGIS Values AssignCustom Method
Values Assign
Sand17.1811.7218.5516.17
Clay13.6910.5913.2011.69
Silt14.0410.3414.4513.42
Table 12. Comparison of predictive performance metrics in ILR space for ESDAC and ISRIC using the GR, NAGREF and PEGEAL datasets as ground truth.
MetricGR-ESDACGR-ISRICNAGREF–ESDACNAGREF–ISRICPEGEAL–ESDACPEGEAL-ISRIC
RMSEA0.81320.81080.78830.83110.75120.6503
MAEA0.70710.71040.67930.73670.68090.5703
Table 13. Comparison of the RMSE (raw), RMSE (back-transformed) and MAE (back-transformed) values derived between the predicted soil properties (sand, clay, silt) from ESDAC/ISRIC and the actual measured values from: (i) the Greek Soil Map, and (ii) the sampling points from NAGREF soil map.
GR–ISRICNAGREF–ISRIC+/−GR–ESDACNAGREF–ESDAC+/−
RMSE (Raw) (%)
Clay13.211.71.513.711.02.7
Sand18.619.3−0.717.217.3−0.1
Silt14.512.22.314.011.62.4
RMSE (back-transformed) (%)
Clay13.5812.331.2514.4411.812.63
Sand21.8121.590.2221.6820.541.14
Silt8.229.26−1.047.248.72−1.48
MAE (back-transformed) (%)
Clay11.0410.050.9911.699.392.3
Sand17.7718.24−0.4717.3516.690.66
Silt6.738.19−1.465.667.31−1.65
Table 14. Comparison of the RMSE (raw), RMSE (back-transformed) and MAE (back-transformed) values derived between the predicted soil properties (sand, clay, silt) from ESDAC/ISRIC and the actual measured values from: (i) the Greek Soil Map, and (ii) the sampling points from PEGEAL soil map.
GR–ISRICPEGEAL–ISRIC+/−GR–ESDACPEGEAL–ESDAC+/−
RMSE (Raw) (%)
Clay13.210.52.713.712.90.8
Sand18.614.34.317.215.91.3
Silt14.513.21.314.012.71.3
RMSE (back-transformed) (%)
Clay13.589.93.6814.4412.781.66
Sand21.8116.455.3621.6818.333.35
Silt8.226.551.677.245.551.69
MAE (back-transformed) (%)
Clay11.048.062.9811.6910.710.98
Sand17.7713.254.5217.3515.332.02
Silt6.735.191.545.664.611.05
Disclaimer/Publisher’s Note: The statements, opinions and data contained in all publications are solely those of the individual author(s) and contributor(s) and not of MDPI and/or the editor(s). MDPI and/or the editor(s) disclaim responsibility for any injury to people or property resulting from any ideas, methods, instructions or products referred to in the content.