Article

Soil Management and Machine Learning Abandonment Detection in Mediterranean Olive Groves Under Drought: A Case Study from Central Spain

by
Giovanni Marchese
1,*,
Juan E. Herranz-Luque
2,
Sohail Anwar
3,
Valentina Vaglia
1,
Chiara Toffanin
3,
Ana Moreno-Delafuente
4,5,
Blanca Sastre
4 and
María José Marqués Pérez
2
1
Department of Earth and Environmental Sciences, University of Pavia, Via S. Epifanio 14, 27100 Pavia, Italy
2
Department of Geology and Geochemistry, Universidad Autónoma de Madrid, C. Francisco Tomás y Valiente, 7, 28049 Madrid, Spain
3
Department of Electrical, Computer and Biomedical Engineering, University of Pavia, Via Ferrata 5, 27100 Pavia, Italy
4
Madrid Institute for Rural, Agricultural and Food Research and Development (IMIDRA), Finca El Encín, Carretera A-2, km 38.2, 28805 Alcalá de Henares, Spain
5
Departamento de Producción Agraria, Universidad Politécnica de Madrid, Avenida Puerta de Hierro 2, 28040 Madrid, Spain
*
Author to whom correspondence should be addressed.
Soil Syst. 2025, 9(4), 118; https://doi.org/10.3390/soilsystems9040118
Submission received: 30 July 2025 / Revised: 24 October 2025 / Accepted: 27 October 2025 / Published: 31 October 2025
(This article belongs to the Special Issue Research on Soil Management and Conservation: 2nd Edition)

Abstract

In Mediterranean semi-arid regions, rainfed olive groves are increasingly being abandoned due to drought, low profitability, and rural depopulation. The long-term impact of abandonment on soil conditions is debated, as it may promote vegetation recovery or lead to degradation. In contrast, some farmers are adopting low-disturbance management practices that allow spontaneous vegetation to establish. These contrasting scenarios offer valuable opportunities for comparison. This study aims to develop a framework to assess the impact of different management regimes on soil health and to investigate (1) the impact of spontaneous vegetation cover (SVC) and tillage regimes on soil organic carbon (SOC), and (2) the long-term ecological dynamics of abandoned groves, through a combination of field surveys, remote sensing, and object detection. SOC was assessed using both ground-based and remote sensing-derived indicators. Vegetation cover was quantified via a grid point intercept method. Field data were integrated with a land-use monitoring framework that includes abandonment assessment through historical orthophotos and a deep learning model (YOLOv12) to detect active and abandoned olive groves. Results show that abandoned zones are richer in SOC than active ones. In particular, the active groves with SVC exhibit a mean SOC of 1%, which is higher than that of tilled groves, where SOC is 0.45%, with no apparent moisture loss. Abandoned groves can be reliably identified from aerial imagery, achieving a recall of 0.833 for abandoned patches. Our results demonstrate the potential of YOLOv12 as an innovative and accessible tool for detecting zones undergoing ecological regeneration or degradation. The study underscores the ecological and agronomic potential of spontaneous vegetation in olive agroecosystems.

Graphical Abstract

1. Introduction

Climate change is increasingly affecting agricultural systems [1], threatening both wild plant species and cultivated crops due to global warming and the rising frequency of extreme meteorological events [2,3,4]. The global average temperature has increased by 1.1 °C over the past century [5], leading to more frequent and intense events such as heatwaves and heavy rainfall.
Global warming introduces a multitude of environmental, economic, and social challenges, particularly related to food security and accessibility [5]. As the primary source of food, agriculture plays a central role in this context [6], and its capacity to adapt to changing climate scenarios will directly influence food quantity, quality, and cost [1]. Rising temperatures and increased aridity are shifting the phenology of crops, with different magnitudes and directions depending on vegetation type [7].
Within this adaptive context, the integration of spontaneous vegetation cover (SVC) and cover crops (CCs) in olive groves, an example of planned biodiversity, has gained attention for its potential to deliver a range of ecosystem services, including the reduction in soil erosion and plant stress. Previous studies have demonstrated that CCs can mitigate the adverse impacts of conventional agricultural practices, such as tillage, by reducing nutrient leaching and preventing erosion [8]. They also contribute to essential supporting services such as soil formation, nutrient cycling, and biological pest control [9]. Moreover, CCs effectively suppress spontaneous weed growth through niche overlap [10].
Incorporating CCs or encouraging wild vegetation in agroecosystems increases both plant and arthropod diversity [11,12], thereby enhancing ecological functions such as pollination, decomposition of organic matter, and pest regulation via predation and parasitism [13,14]. At the same time, SVC may also arise in the context of land abandonment, especially in regions facing economic hardship or demographic decline, making it difficult to differentiate between sustainable management and neglect.
This ambiguity presents a significant challenge for remote monitoring and policy enforcement, particularly in Mediterranean olive groves, where both abandoned and SVC groves can exhibit dense and irregular vegetation. Remote sensing and high-resolution aerial imagery can be used to distinguish between the irregular, unmanaged vegetation typical of abandoned olive groves and the more structured, homogeneous patterns characteristic of actively managed ones. Abandoned groves frequently exhibit spontaneous vegetation growth and, over time, may transition into early successional forest stages. In contrast, managed groves display consistent spatial organization and reduced undergrowth, reflecting ongoing agricultural activity and adherence to best management practices. These differences can be identified through the application of machine learning techniques, which have proven effective in remote sensing and precision agriculture.
Convolutional neural networks (CNNs) and vision transformers (ViTs) can be employed to classify abandoned and active plots in aerial imagery, as demonstrated in studies on vineyard abandonment [15,16]. However, these approaches are limited to distinguishing between abandoned and active parcels in pre-selected, isolated areas, which restricts their broader applicability. As a result, they cannot precisely locate and map individual plots within images containing multiple fields and are unsuitable for real-time detection, since human-driven pre-processing is required to isolate the areas of interest.
In contrast, object detection models such as YOLO are better suited for identifying areas of interest and have been applied in agricultural studies for various purposes, particularly when real-time detection is needed [17].
The study area, like many interior provinces of Spain—including Guadalajara—has experienced sustained rural outmigration toward metropolitan areas such as Madrid (Spain) since the 1950s, a process intensifying the demographic decline of small villages and shrinking the agricultural labor pool [18]. This migration has undermined generational renewal and left marginal plots without caretakers, especially in marginal terrain with poor soils and steep slopes, such as the study area of this research. Over time, abandoned fields have been overtaken by shrubs and trees, as documented in depopulation-driven land-use change studies in Mediterranean Spain [19]. The resulting landscape consists of mosaic patches of successional vegetation, isolated intensively managed groves, and remnants of traditional farmland, reflecting how demographic, social, and environmental processes intertwine to drive agricultural abandonment and land rewilding [20]. The abandonment processes documented in the province of Guadalajara, and particularly in the Alcarria region [21], reflect structural demographic and socioeconomic dynamics that have reduced the agricultural workforce since the mid-20th century. Olive groves are especially significant in this context, as the Denominación de Origen (DO) “Aceite de la Alcarria” covers roughly 6000 km2 and hosts nearly four million olive trees, making them a defining element of the regional landscape and cultural identity heavily influenced by human activity [22]. Yet, despite their importance, reliable historical data on the evolution of olive grove area in this region remain scarce, which underscores the need for site-specific studies such as ours. While many groves have been progressively abandoned, others persist under traditional or organic management, providing a key lens through which to understand the ecological and social consequences of land-use change.
In this study, we propose an integrated approach to detect and interpret land abandonment and sustainable management in olive groves by combining two complementary strategies. We apply the YOLOv12 deep learning model to classify and detect active and abandoned olive groves using high-resolution orthophotos, rather than simply classifying land cover categories. The novelty of this methodology lies in the application of a real-time detection algorithm to abandonment detection; this allows for a more precise and scalable assessment of land-use transitions and their ecological implications.
In parallel, we evaluate the ecological impact of SVC on soil organic carbon (SOC) by linking remote sensing indices, specifically the Brightness Index (BI), with field-validated measurements of SOC. The BI [23,24] is influenced by both SOC levels and vegetation cover [25], where SOC is an indicator of long-term soil conservation, and vegetation cover serves as an indirect proxy for SOC itself [26].
The overarching aim of this work is to develop a scalable framework for distinguishing abandoned olive groves from those actively managed, tilled or not, and to investigate the impact of SVC and tillage regimes on SOC. By integrating visual classification models and soil condition data, we seek to improve the detection of abandonment and promote the recognition of sustainable practices in remote sensing-based monitoring. This approach is particularly relevant for agri-environmental policy and subsidy schemes, where misclassification could lead to perverse incentives or missed opportunities to support regenerative agriculture.

2. Materials and Methods

2.1. Study Area

The study area (Figure 1) is under a typical continental Mediterranean climate, with marked thermal seasonality and summer drought. The average annual temperature is approximately 13.6 °C, and the mean annual precipitation is approximately 416 mm [27]. Therefore, the area is near the threshold between semi-arid and dry sub-humid regimes. Rainfall is concentrated in spring and autumn, with a pronounced dry season during summer. Based on the Köppen–Geiger classification, the area can be categorized as a transition zone between Csa (dry-summer Mediterranean) and BSk (cold semi-arid) climates. This combination of low rainfall and high summer evapotranspiration underscores the importance of soil management practices, such as SVC, to reduce erosion, enhance water retention, and maintain long-term soil health.
Geologically, the region forms part of the transition zone between the Sistema Central and the Tagus Basin, encompassing diverse lithologies including Paleozoic metamorphic rocks (slates and quartzites), Mesozoic limestones and dolomites, and Quaternary alluvial deposits. The study area is situated in a semi-arid, calcareous landscape where soil chemical and physical properties reflect both the underlying lithology and the long-term influence of management practices.
Figure 1 shows the two adjacent olive groves studied (~2 ha each) planted to cv. Arbequina at 7 × 6 m spacing in a continental semi-arid Mediterranean landscape (average slope ~5%). The trees are >100 years old but show limited canopy development due to shallow, stony, nutrient-poor soils, scarce rainfall, and marked thermal extremes. The groves are managed by different private farmers. One grove has been under organic management for >15 years with spontaneous ground cover (low herbaceous species such as Poa/Festuca and scattered shrubs Thymus, Erinacea, Salvia), whereas the other is managed with frequent tillage (3–4× yr), maintaining bare alleys with abundant surface rock and gravel. Nearby patches of natural vegetation include south-facing stands of Mediterranean holm oak (Quercus ilex ssp. ballota). For soil sampling, we used a stratified composite design (rows and inter-rows) with three composites per plot to capture within-plot variability while addressing our main objective—contrasting SOC between managements—following standard guidance for agricultural soils (e.g., ISO 18400-102; [28]).
The olive groves under study are located at elevations ranging between 880 and 890 m above sea level, within the gently undulating terrain of the La Alcarria plateau, a landscape typical of the central part of the province of Guadalajara. Soils are classified as Leptic Cambisol [29]. These soils are very shallow, usually less than 25 cm before reaching bedrock or stony layers, with weak horizon development (A–Bw–R sequence). They are typically loamy and calcareous, contain abundant coarse fragments, and have low water holding capacity and neutral to alkaline pH [29]. These properties strongly restrict agricultural potential, yet in Mediterranean landscapes, Cambisols are widely used for perennial crops, particularly olives and vines [30].
The studied olive groves represent varying abandonment conditions (active vs. abandoned). Two of the actively managed fields, one under SVC and the other under conventional tillage (TILL), were selected as case studies to assess the influence of management practices on soil and vegetation parameters.

2.2. Ground and Vegetation Data

At each olive grove, three soil samples were randomly collected from the surface layer (0–10 cm; the most relevant layer for comparison with remote sensing data), with approximately 1 kg of soil obtained per sample. Each sample comprised six subsamples (approximately 150 g each, spaced 2 m apart): four collected from the inter-row spaces between olive trees and two from beneath the tree canopy. The FAO GSOC-MRV Protocol (Global Soil Partnership) provides formal guidance for MRV and recommends stratifying composite sampling designs based on management or heterogeneity. In this study, the strata were defined as ‘intra-row’ and ‘inter-row’, which were then proportionally mixed [31] to obtain a representative plot-level SOC stock measurement. Three composite samples were collected per 2 ha plot to balance representativeness and feasibility. Each composite integrated subsamples from rows and inter-rows, reducing small-scale heterogeneity. This sampling intensity is consistent with our rationale of evaluating management effects on SOC at the plot scale, and the low within-plot variability that will be observed in SOC values confirms that this number of samples was sufficient for our objective.
Composite soil samples were gently disaggregated, air-dried at room temperature to constant mass, and sieved to 2 mm. The coarse (>2 mm) and fine (<2 mm; ‘fine earth’) fractions were weighed separately to quantify coarse fragments. The <2 mm fraction was homogenized and sub-sampled, and all chemical determinations were performed in duplicate on this fine-earth material.
Soil pH and electrical conductivity (EC) were measured in a 1:2.5 and 1:5 soil-to-water suspension, respectively, using electrodes WTW CRISON 2002 pH meter, and EC CRISON 35 cell 5060. Calcium carbonate content was determined using the standard volumetric method with a Bernard calcimeter [32].
Soil texture (<2 mm fraction) was analyzed using the densimetry method [33], and soil organic carbon was measured via wet oxidation [34]. Bulk density was measured at 0–10 cm layer, from three undisturbed cores using the FAO cylinder method [35] (ring size: 5 cm height × 2.5 cm radius). Water retention capacity was assessed using the pressure plate method [36] and calculated as the difference between field capacity (2.54 pF) and permanent wilting point (4.2 pF).
Vegetation biomass at each site was estimated by harvesting all aboveground material within a 25 × 25 cm quadrat, with three replicates per site; this included spontaneous vegetation, olive leaves, and any woody debris from olive trees, together with all live and dead plant material, litter, and residues. The samples were oven-dried to a constant weight to determine aboveground biomass. The percentage of soil surface covered by vegetation ground cover was estimated using the grid-point intercept (GPI) method described by Cagney et al. [37], applied to nadir digital photographs. For each 2 ha plot, we acquired nine 50 × 50 cm photoquadrats in the inter-row alleys, randomly distributed across the plot. Images were analyzed manually with SamplePoint software, 1.60 release [38,39,40] using a pixel-based approach with 100 points per sample.
With three composite samples per management, we used rank-based tests (Kruskal–Wallis; for two groups, Mann–Whitney U). Formal normality/outlier tests were omitted because they are low-power and assume normality at such small n; instead, distributions were checked with dot/box plots and all observations retained. Significance was set at α = 0.05\alpha = 0.05α = 0.05; we report effect sizes with 95% confidence intervals.

2.3. Remote Sensing Data

Satellite imagery was acquired by selecting images from the months of July or August of each year to avoid soil moisture interference. Acquisition dates were chosen to avoid rainfall and minimize cloud cover. Sentinel-2 scenes with cloud cover exceeding 1% were excluded. Meteorological data from 2015 to 2024 were consulted to confirm the absence of precipitation on the acquisition date and during the preceding three days. Remote sensing data from the Copernicus B3 and B4 spectral bands were used to calculate the BI, according to the following equation [23,24]:
B I = B 4 × B 4 + B 3 × B 3 2 ,
To estimate SOC at unsampled locations, 10 m resolution raster data were used to develop a regression model. In contrast, 30 m resolution rasters were produced to estimate SOC across the study area. Sentinel-2 Level-2 imagery was post-processed using QGIS 3.38.3 [41]. For statistical comparisons, a point grid was generated, placing each point at the center of a 30 m pixel. Only points within the defined study areas were retained. Points located on the edge of the study fields were manually excluded to minimize boundary effects. Because of the dimensions of the plot level (≈2 ha), differences in native resolution do not affect the results: each plot contains approximately 200 pixels at 10 m resolution or 22 pixels at 30 m resolution, yielding stable plot averages. A large dataset of sampling points from an independent field was first used to validate the capacity of the BI to predict SOC, yielding Equation (2). The relationship between BI and SOC was calibrated and verified using ground-truth data from the Bergonza vineyards, which included 40 samples for model training and 20 for validation. This calibration resulted in the following regression equation (p = 0.000428):
S O C = 5.032 30.791 × B I ,
Subsequently, site-specific calibration was conducted using six ground-truth samples: three under long-term SVC (10–15 years of no tillage) and three under conventional tillage. This analysis allowed for the evaluation of the correlation between image-derived brightness and SOC content, resulting in a localized regression equation:
S O C = 2.17 5.81 × B I ,
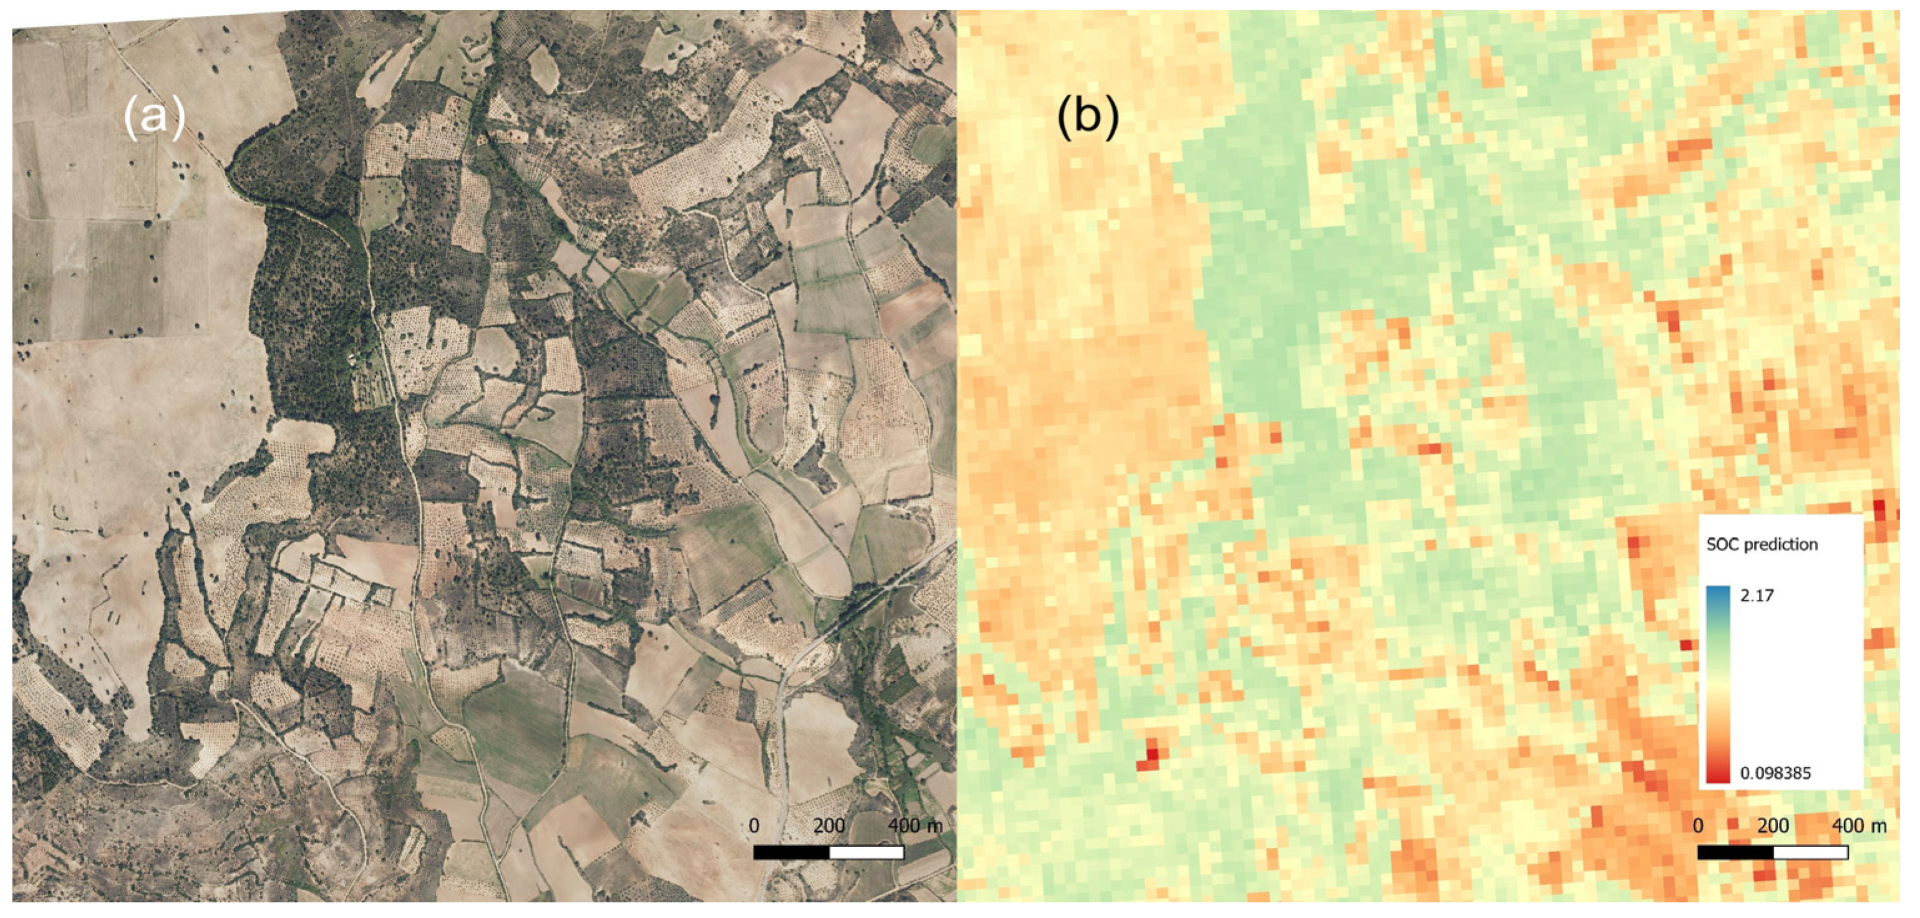
Equation (3) was computed to estimate SOC for the years 2015, 2018, 2021, and 2024, generating four predictive SOC rasters (Figure 2b) and a corresponding summary table; then, raster values were extracted at each point for subsequent analysis.
Statistical analysis was conducted using Statistica 8.0 [44] and R 4.4 [45] through the Jamovi 2.6 interface [46]. The dataset included 3096 entries corresponding to 774 points sampled across the study area for the years 2015, 2018, 2021, and 2024 (1132 entries from abandoned groves and 1964 from active groves). Among the active groves, 20 points were from the field with SVC and 28 points from the field under traditional tillage. Data were first tested for normality using the Shapiro–Wilk test. Since the assumption of normality was not met, the non-parametric Kruskal–Wallis test was applied to assess differences between groups.

2.4. Abandonment Identification

Land abandonment was assessed using orthophotos of the Guadalajara region (sheet 0562), obtained from the national center for geographic information, “Centro Nacional de Información Geográfica” (CNIG) [42]. Although no formal survey of abandoned plots was carried out, abandonment was evident during field inspections, in line with published reports documenting widespread agricultural land abandonment in the Alcarria and the province of Guadalajara [18,19].
A methodology previously applied in Italy [47] was applied: A custom dataset was constructed using orthophotos from the La Alcarria region in Spain, including 1420 instances of abandoned and 1801 instances of active olive groves, spanning from 2006 to the present. Aerial imagery was cropped using polygon masks and exported through automated repetition, producing individual images for each shapefile polygon. Images were annotated via Roboflow [48] into “abandoned” and “not abandoned” classes. The annotated dataset was used to train the YOLOv12 object detection model [49] to distinguish between abandoned and active olive groves using high-resolution orthophotos. Annotated datasets created in Roboflow were split into training (70%), validation (20%), and test (10%) sets. Data augmentation techniques, such as random rotation, flipping, and brightness adjustment, were applied to improve model generalizability. Multiple versions of the YOLO architecture (i.e, YOLOv5, YOLOv8, YOLOv11, and YOLOv12) were tested using their nano (n), small (s), and medium (m) variants. Each model was initialized with pretrained weights and fine-tuned on a custom dataset over 100 epochs, using a batch size of 32 and an input resolution of 640 × 640 pixels. Training was carried out using the Ultralytics framework, with a confidence threshold of 0.25 and non-maximum suppression (NMS) set to 0.5 to reduce false positives. Model performance was evaluated using standard metrics, including mean average precision at IoU 0.5 (mAP@0.5), precision, recall, and F1 score.
Precision measures the proportion of correctly identified classes (true positives; TPs) out of all instances predicted as olive groves. Higher precision indicates fewer false positives (FPs) and greater classification accuracy:
P r e c i s i o n = T P T P + F P ,
Recall quantifies the proportion of correctly identified classes out of all actual olive grove instances. High recall indicates that most areas were successfully detected, minimizing false negatives (FNs):
R e c a l l = T P T P + F N ,
In line with the study’s objective to maximize detection coverage, recall was prioritized over other metrics to ensure the highest possible identification of abandonment instances.
Generative artificial intelligence has been used in this paper for text editing and generation.

3. Results

3.1. Ground Data

Baseline characterization revealed a mean pH of 8.39 and an average CaCO3 content of 57%. In addition, electrical conductivity values remain low (mean EC = 0.11 dS/m), indicating an absence of salinity-related stress in all plots (Table 1).
The soils have a loam texture (<2 mm fraction), with an average composition of 44% sand, 24% clay, and 31% silt. Only the silt fraction is significantly lower in soils covered by spontaneous vegetation. Coarse fragments average 28% and are similar between management practices, as is the bulk density, which averages 1.38 Mg/m3.
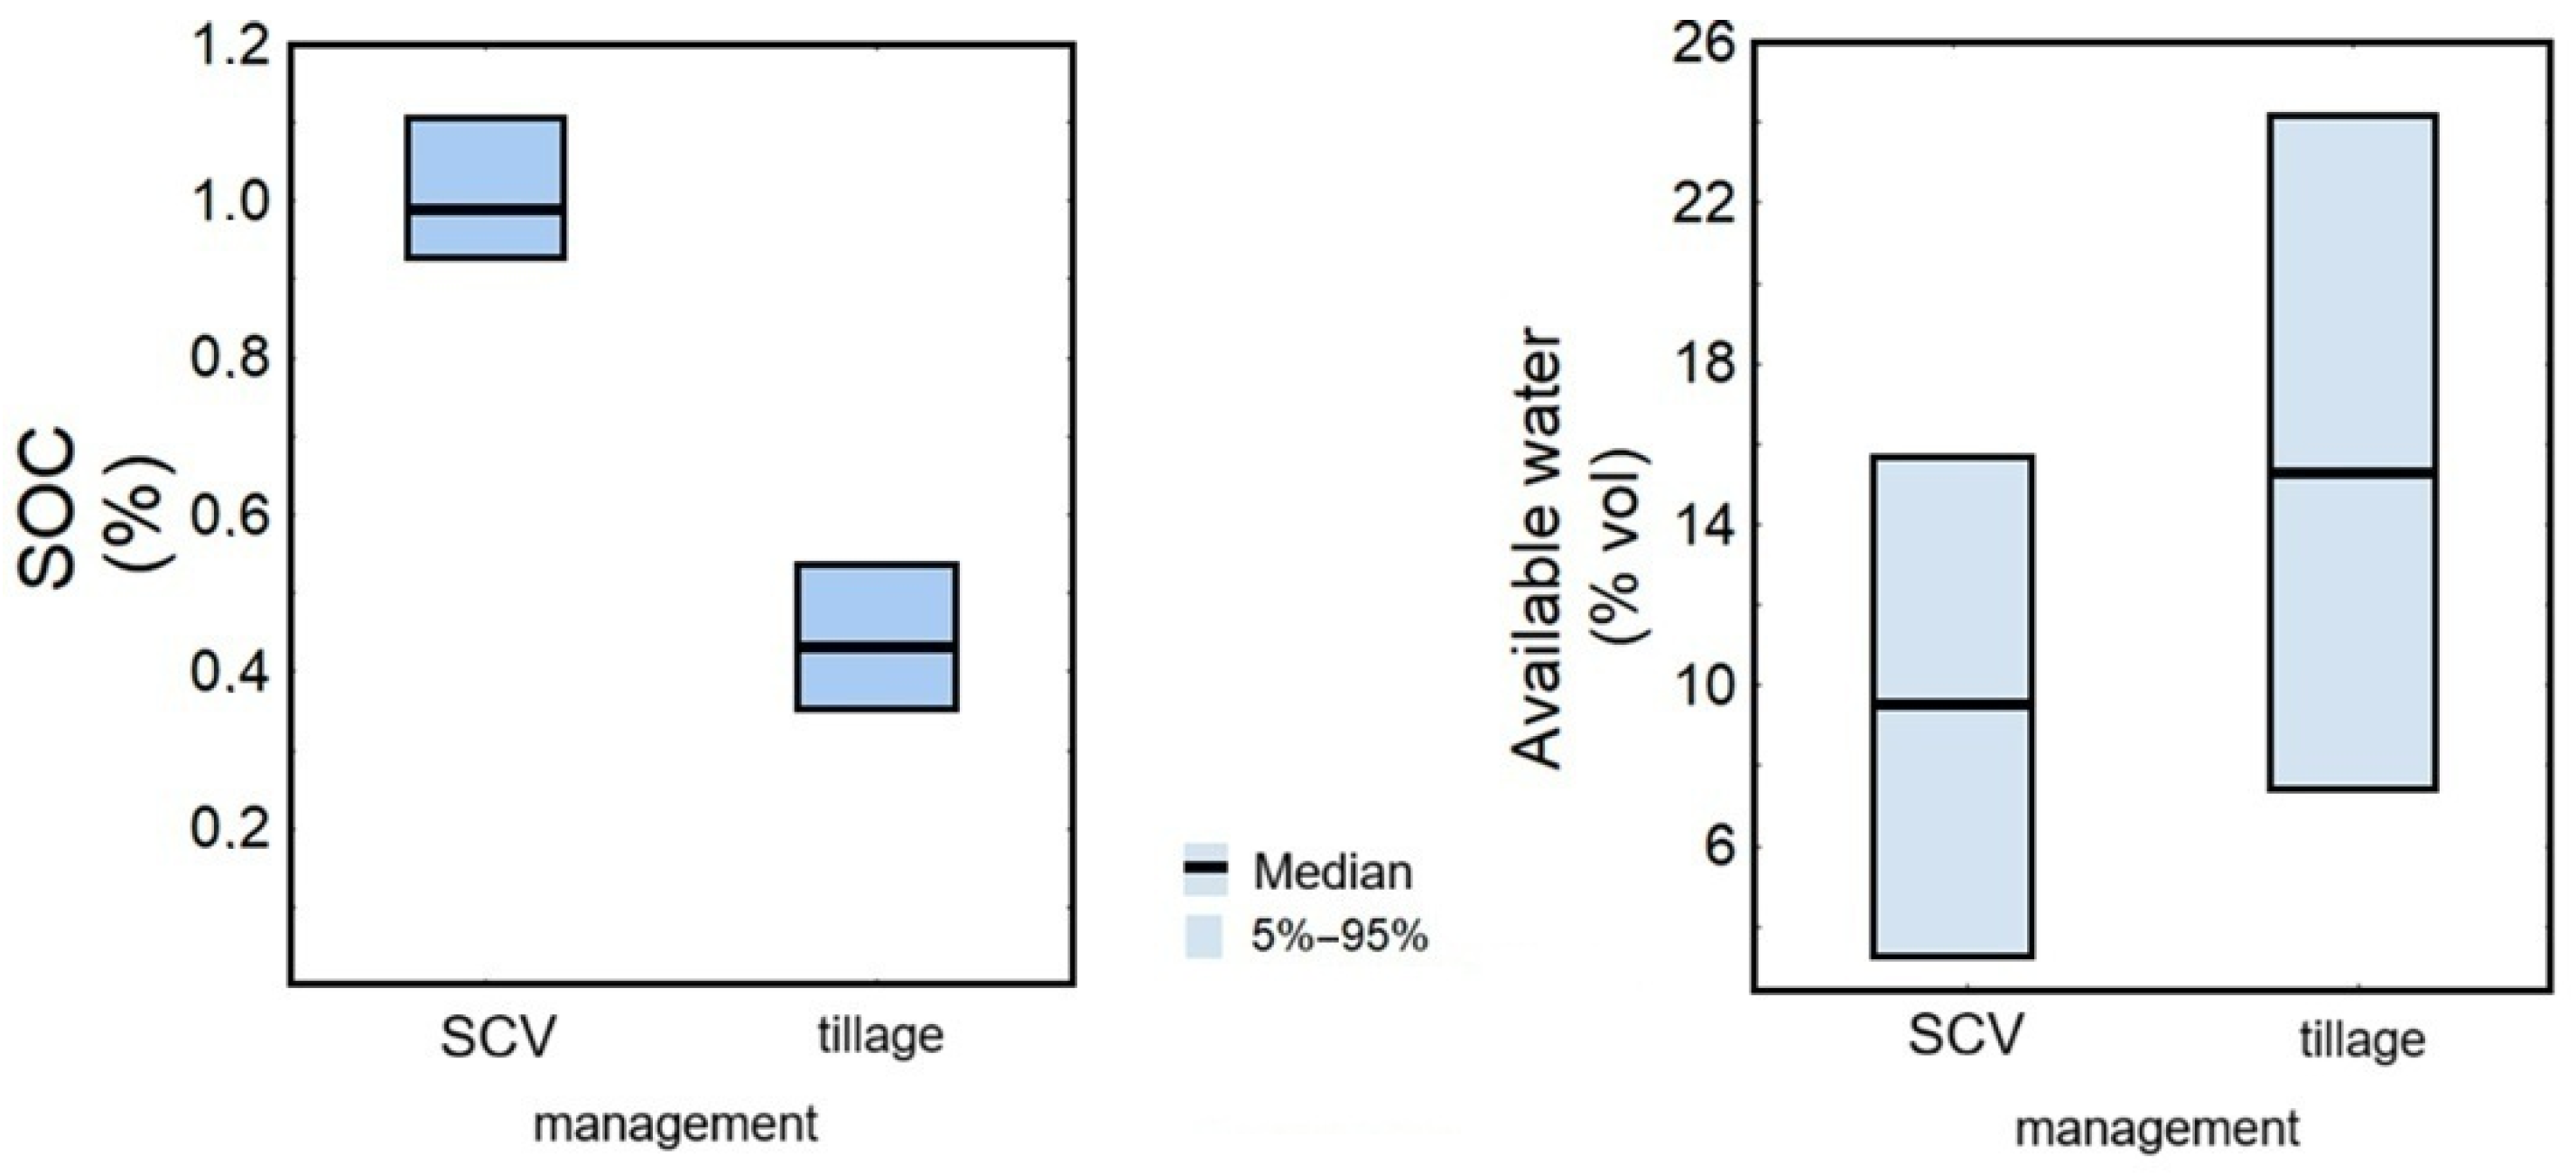
SOC in the surface layer (Figure 3) is low (typical for this type of soil) at this site (≈1.0% under cover crop; ≈0.5% under tillage), i.e., below commonly proposed thresholds for maintaining soil quality: 1.1–1.5% SOC in the root zone [50] and ~2% SOC reported as a critical limit for temperate/southern European croplands. These low values are consistent with the combination of shallow, stony soils and low inputs/erosion typical of semi-arid Mediterranean orchards [51].
Figure 3 displays SOC and available water content at a 10 cm depth in soil samples of two active olive groves under two different management practices: spontaneous vegetation cover (CC) and conventional tillage (TILL). SOC is significantly higher under SVC, averaging just above 1.0%, while TILL exhibits significantly lower values, around 0.45% (Kruskal–Wallis test, H = 3.857, p = 0.0495).
In contrast, available water content shows a different pattern: while TILL exhibits a tendency toward a higher mean and a broader range (extending above 22% vol), the difference between SCV and TILL is not statistically significant (Kruskal–Wallis test, H = 0.429, p = 0.5127). Overall, while SVC enhances SOC, its effect on water availability at 10 cm depth is less clear and more variable.

3.2. Remote Sensing Results

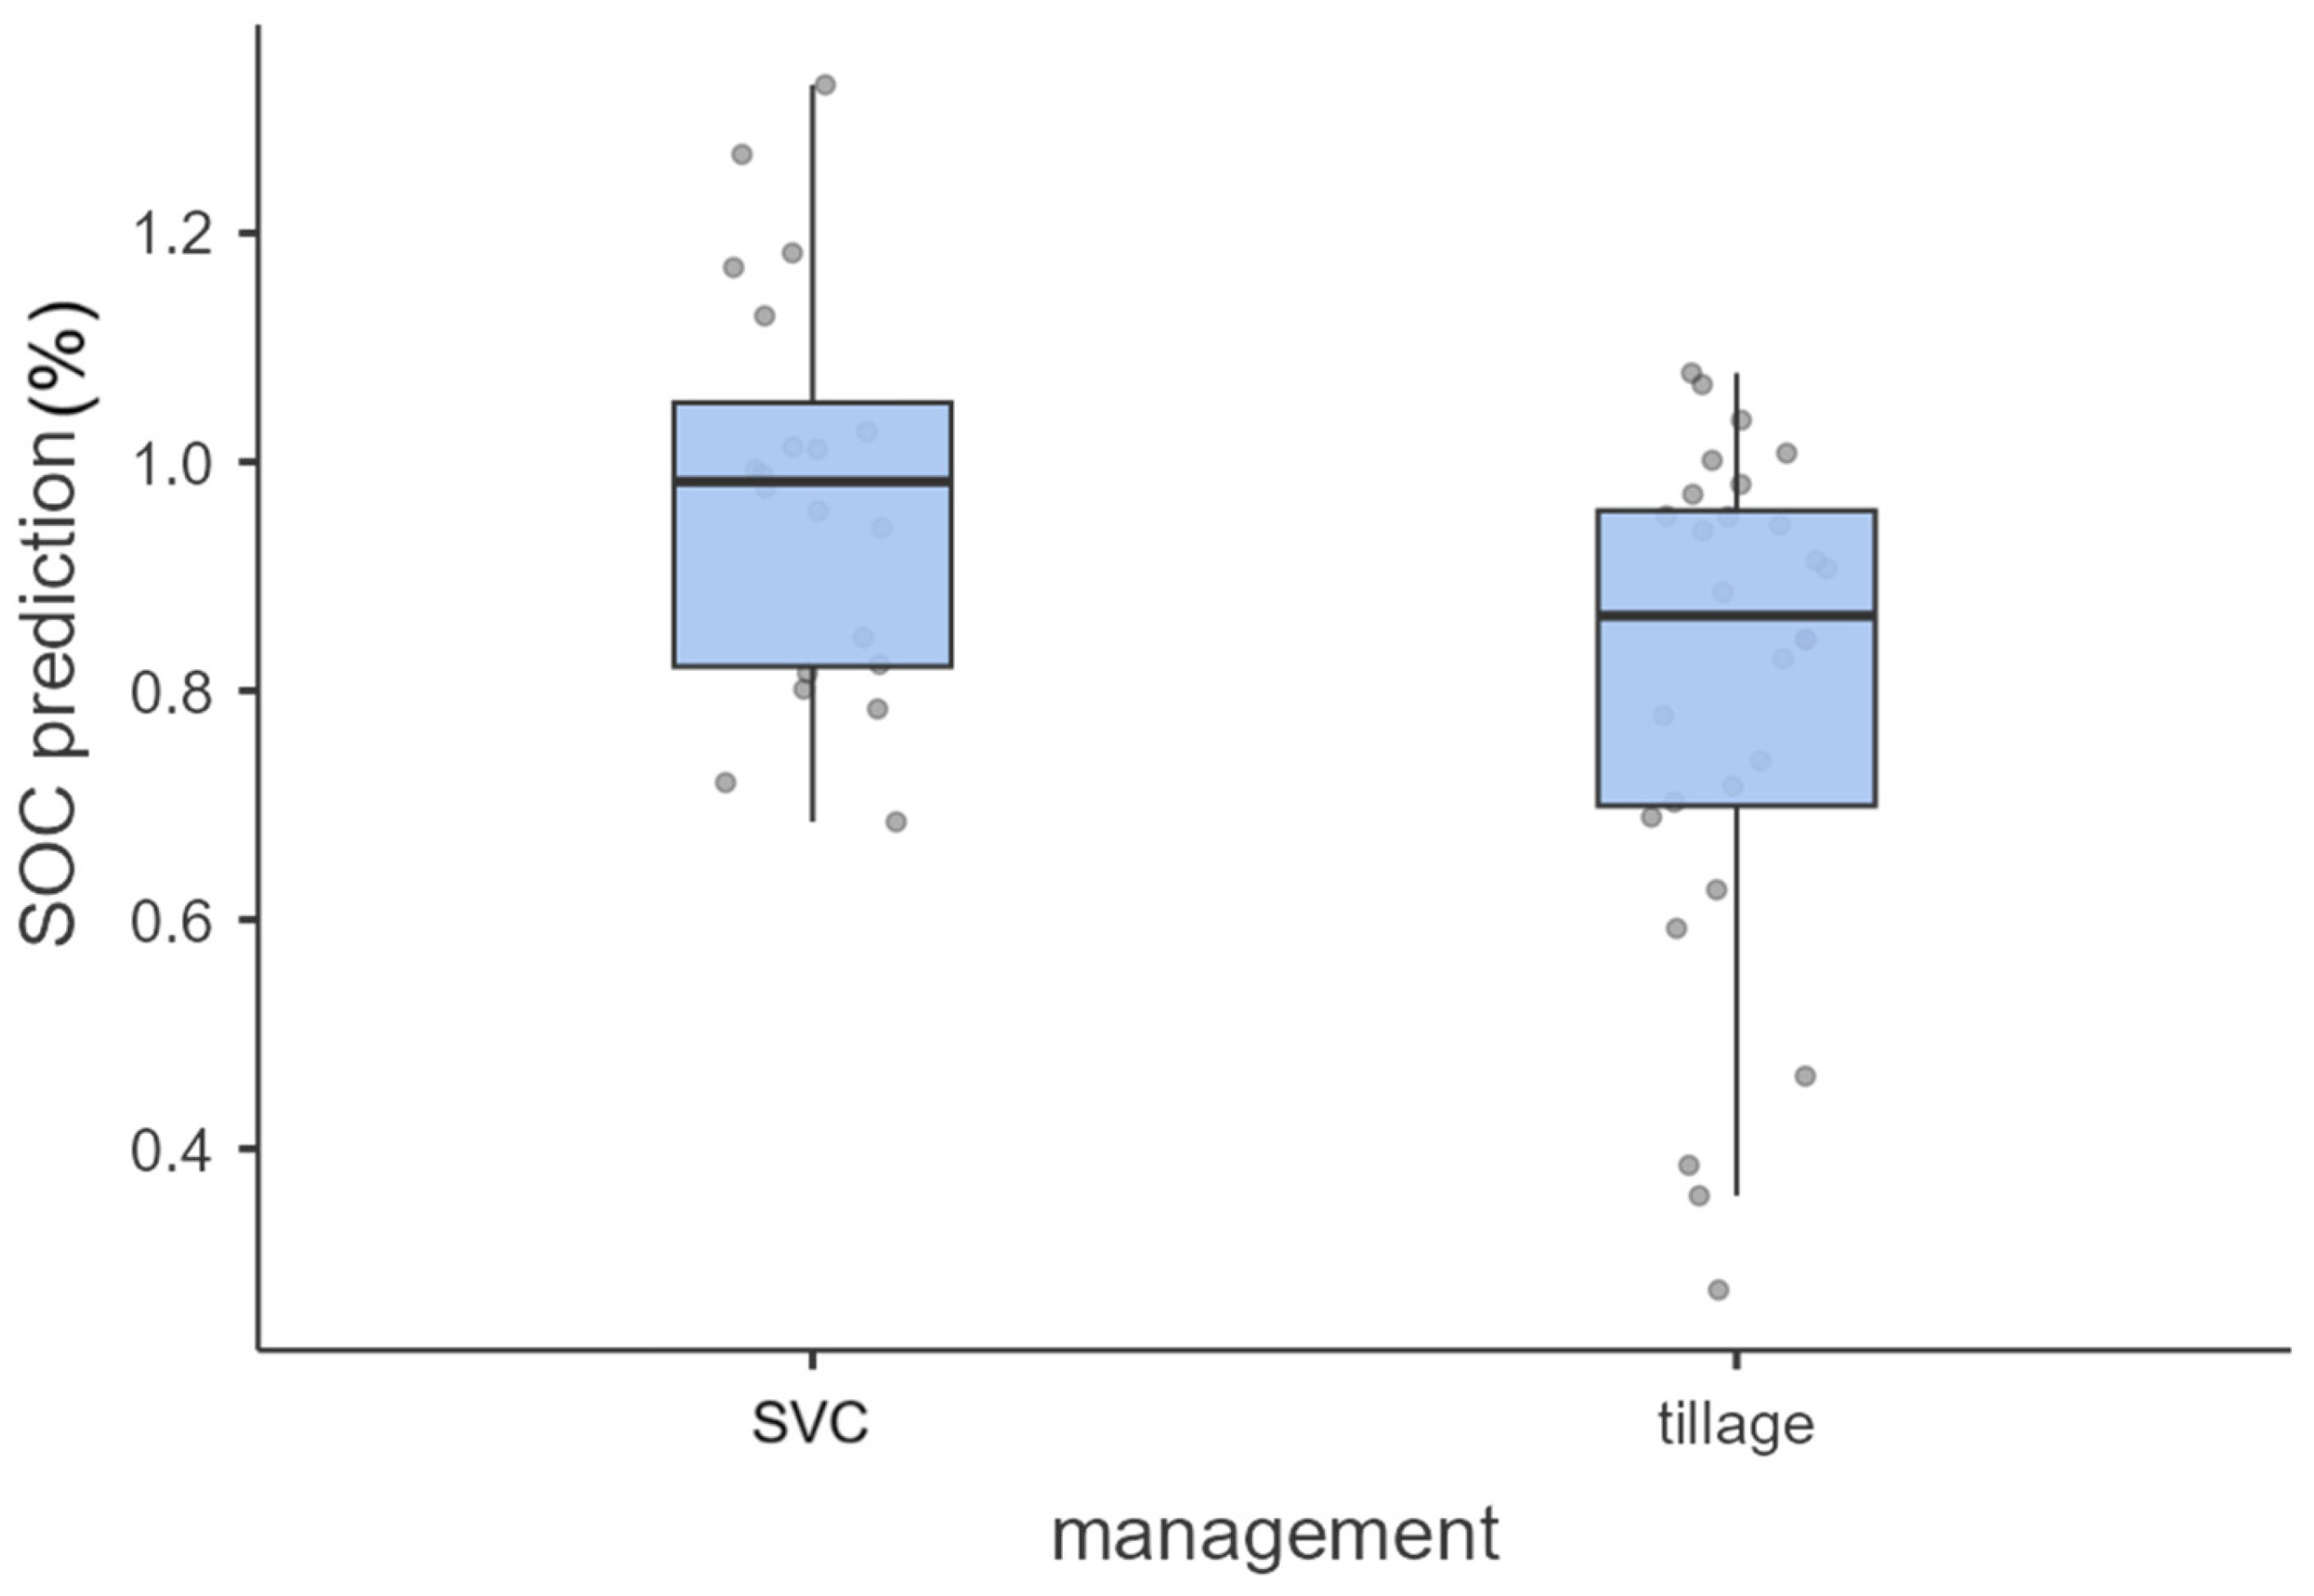
Topsoil SOC values are suitable for comparison with satellite-derived indices. SOC predictions based on Equation (3) reflected a similar trend (Figure 4), with a median SOC of 0.983% in the SVC plot and 0.865% in the tilled plot.
The BI functioned effectively as a proxy for SOC prediction in olive groves (Table 2).
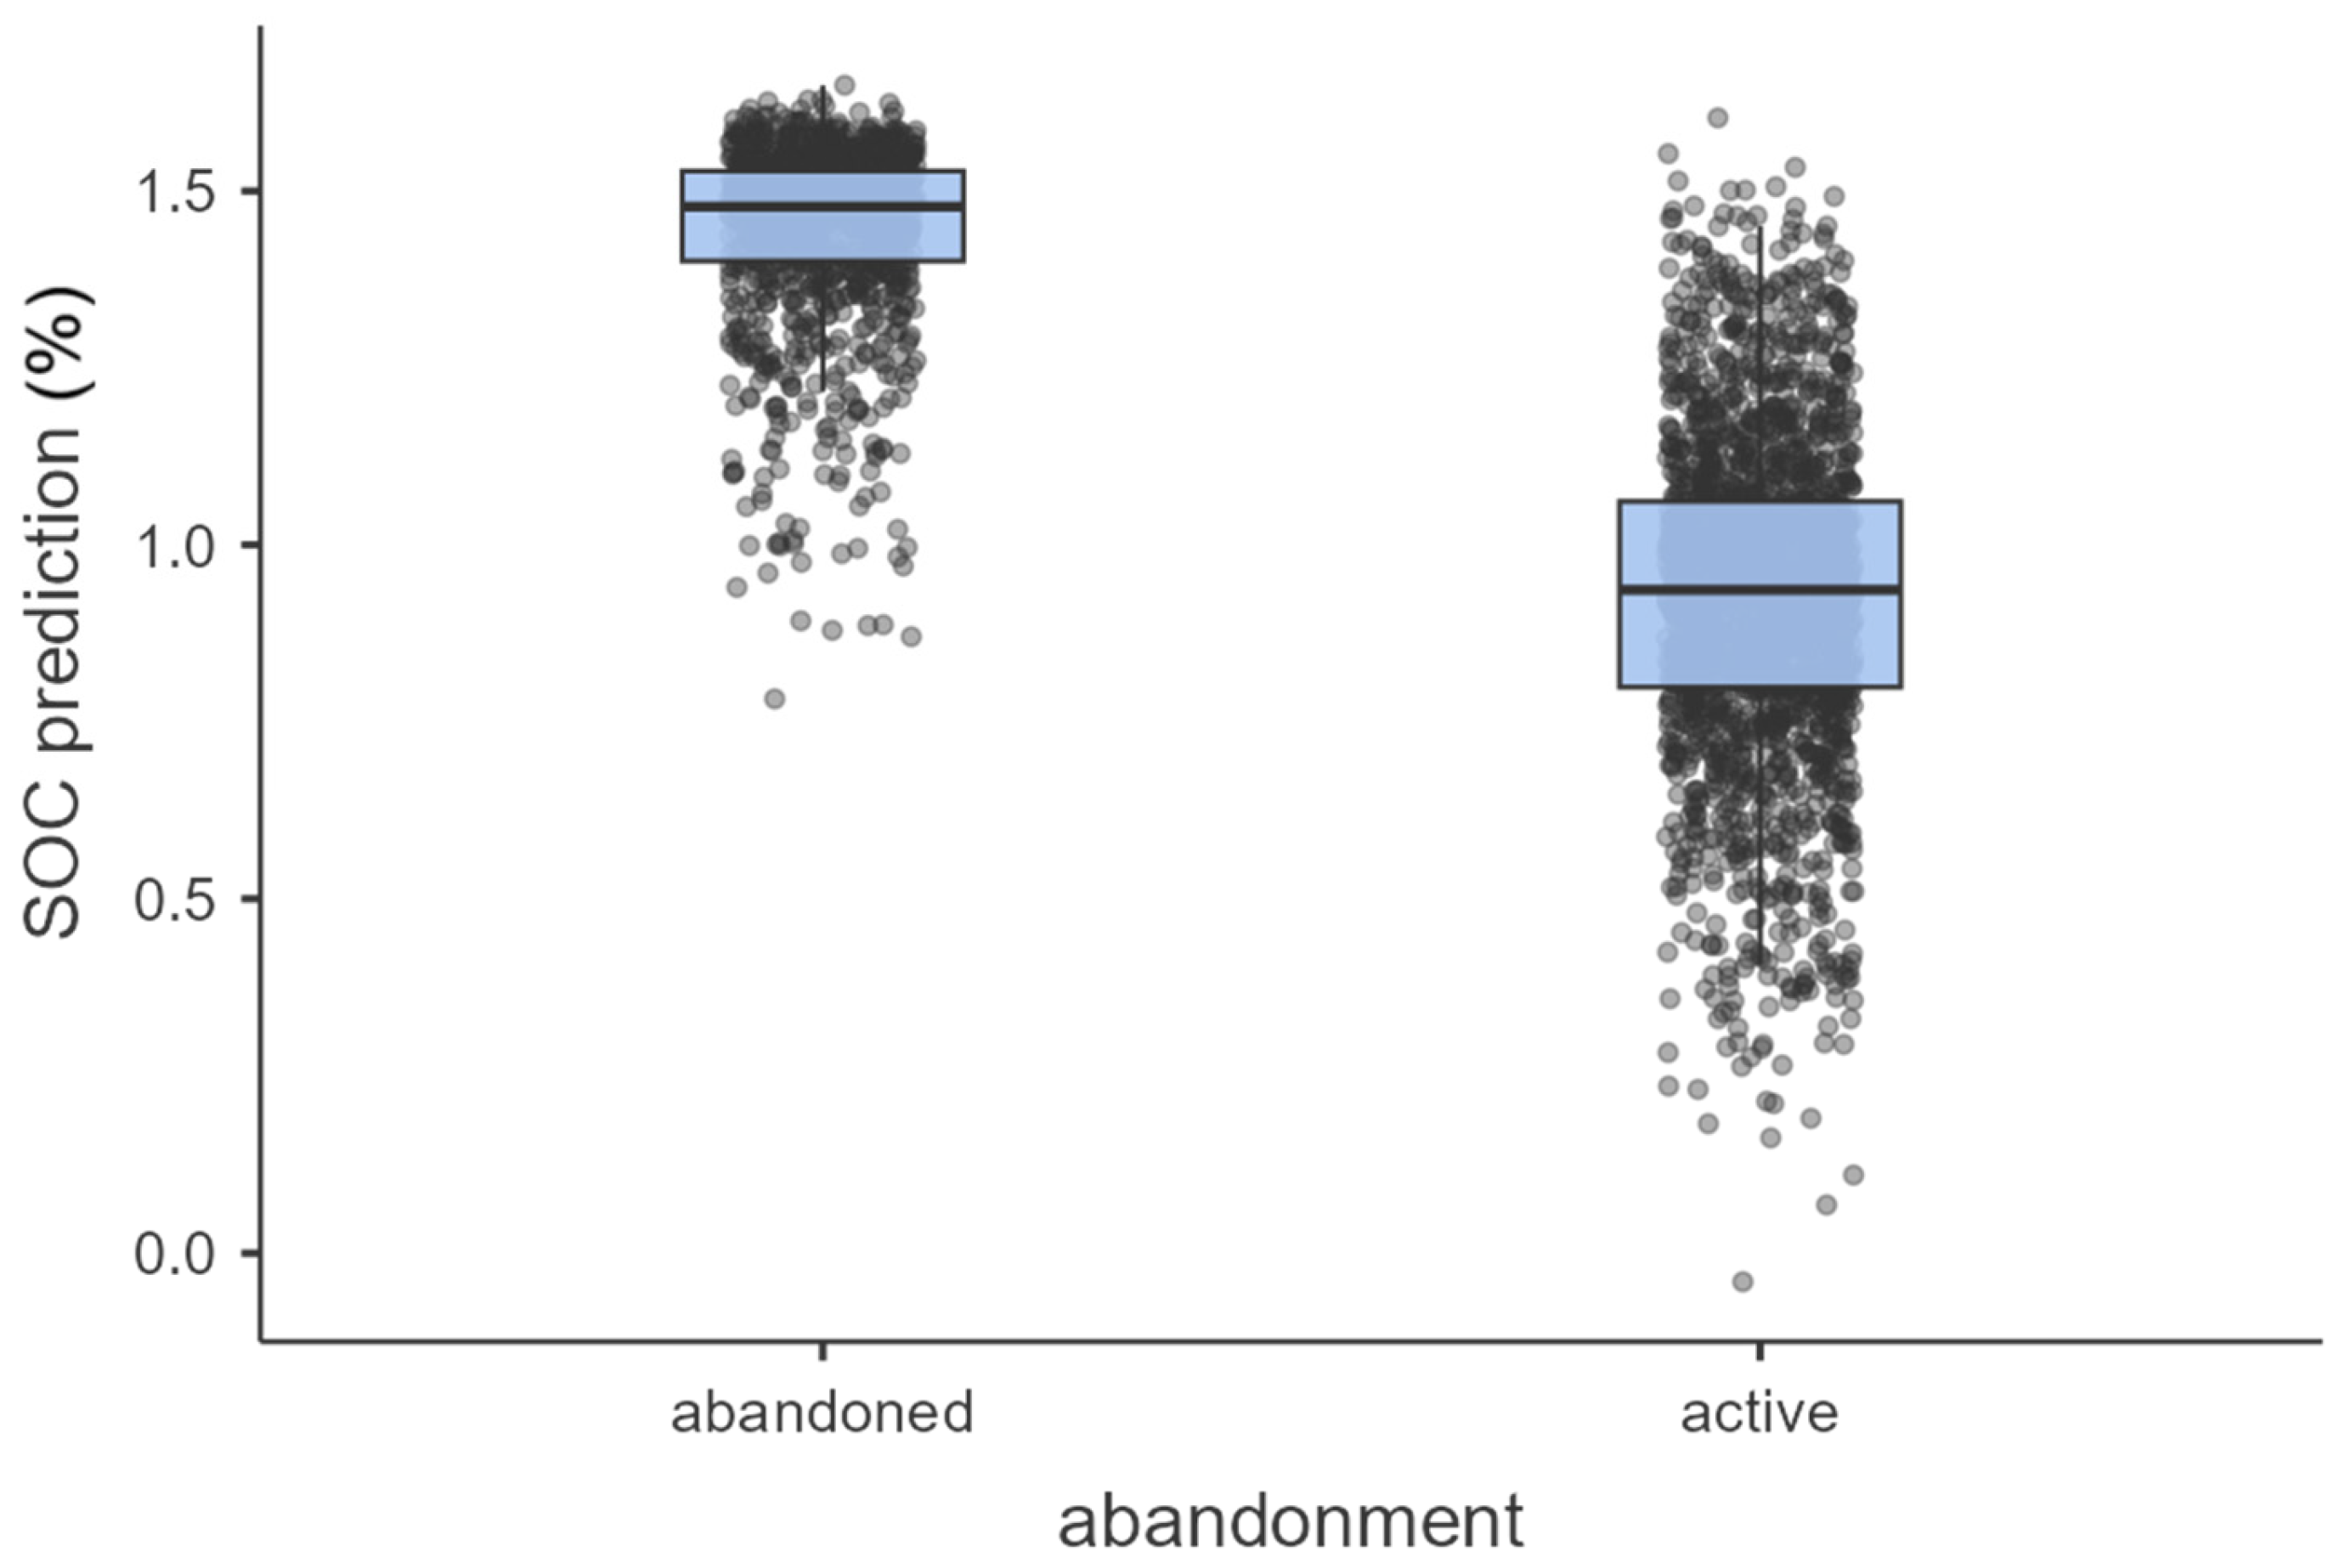
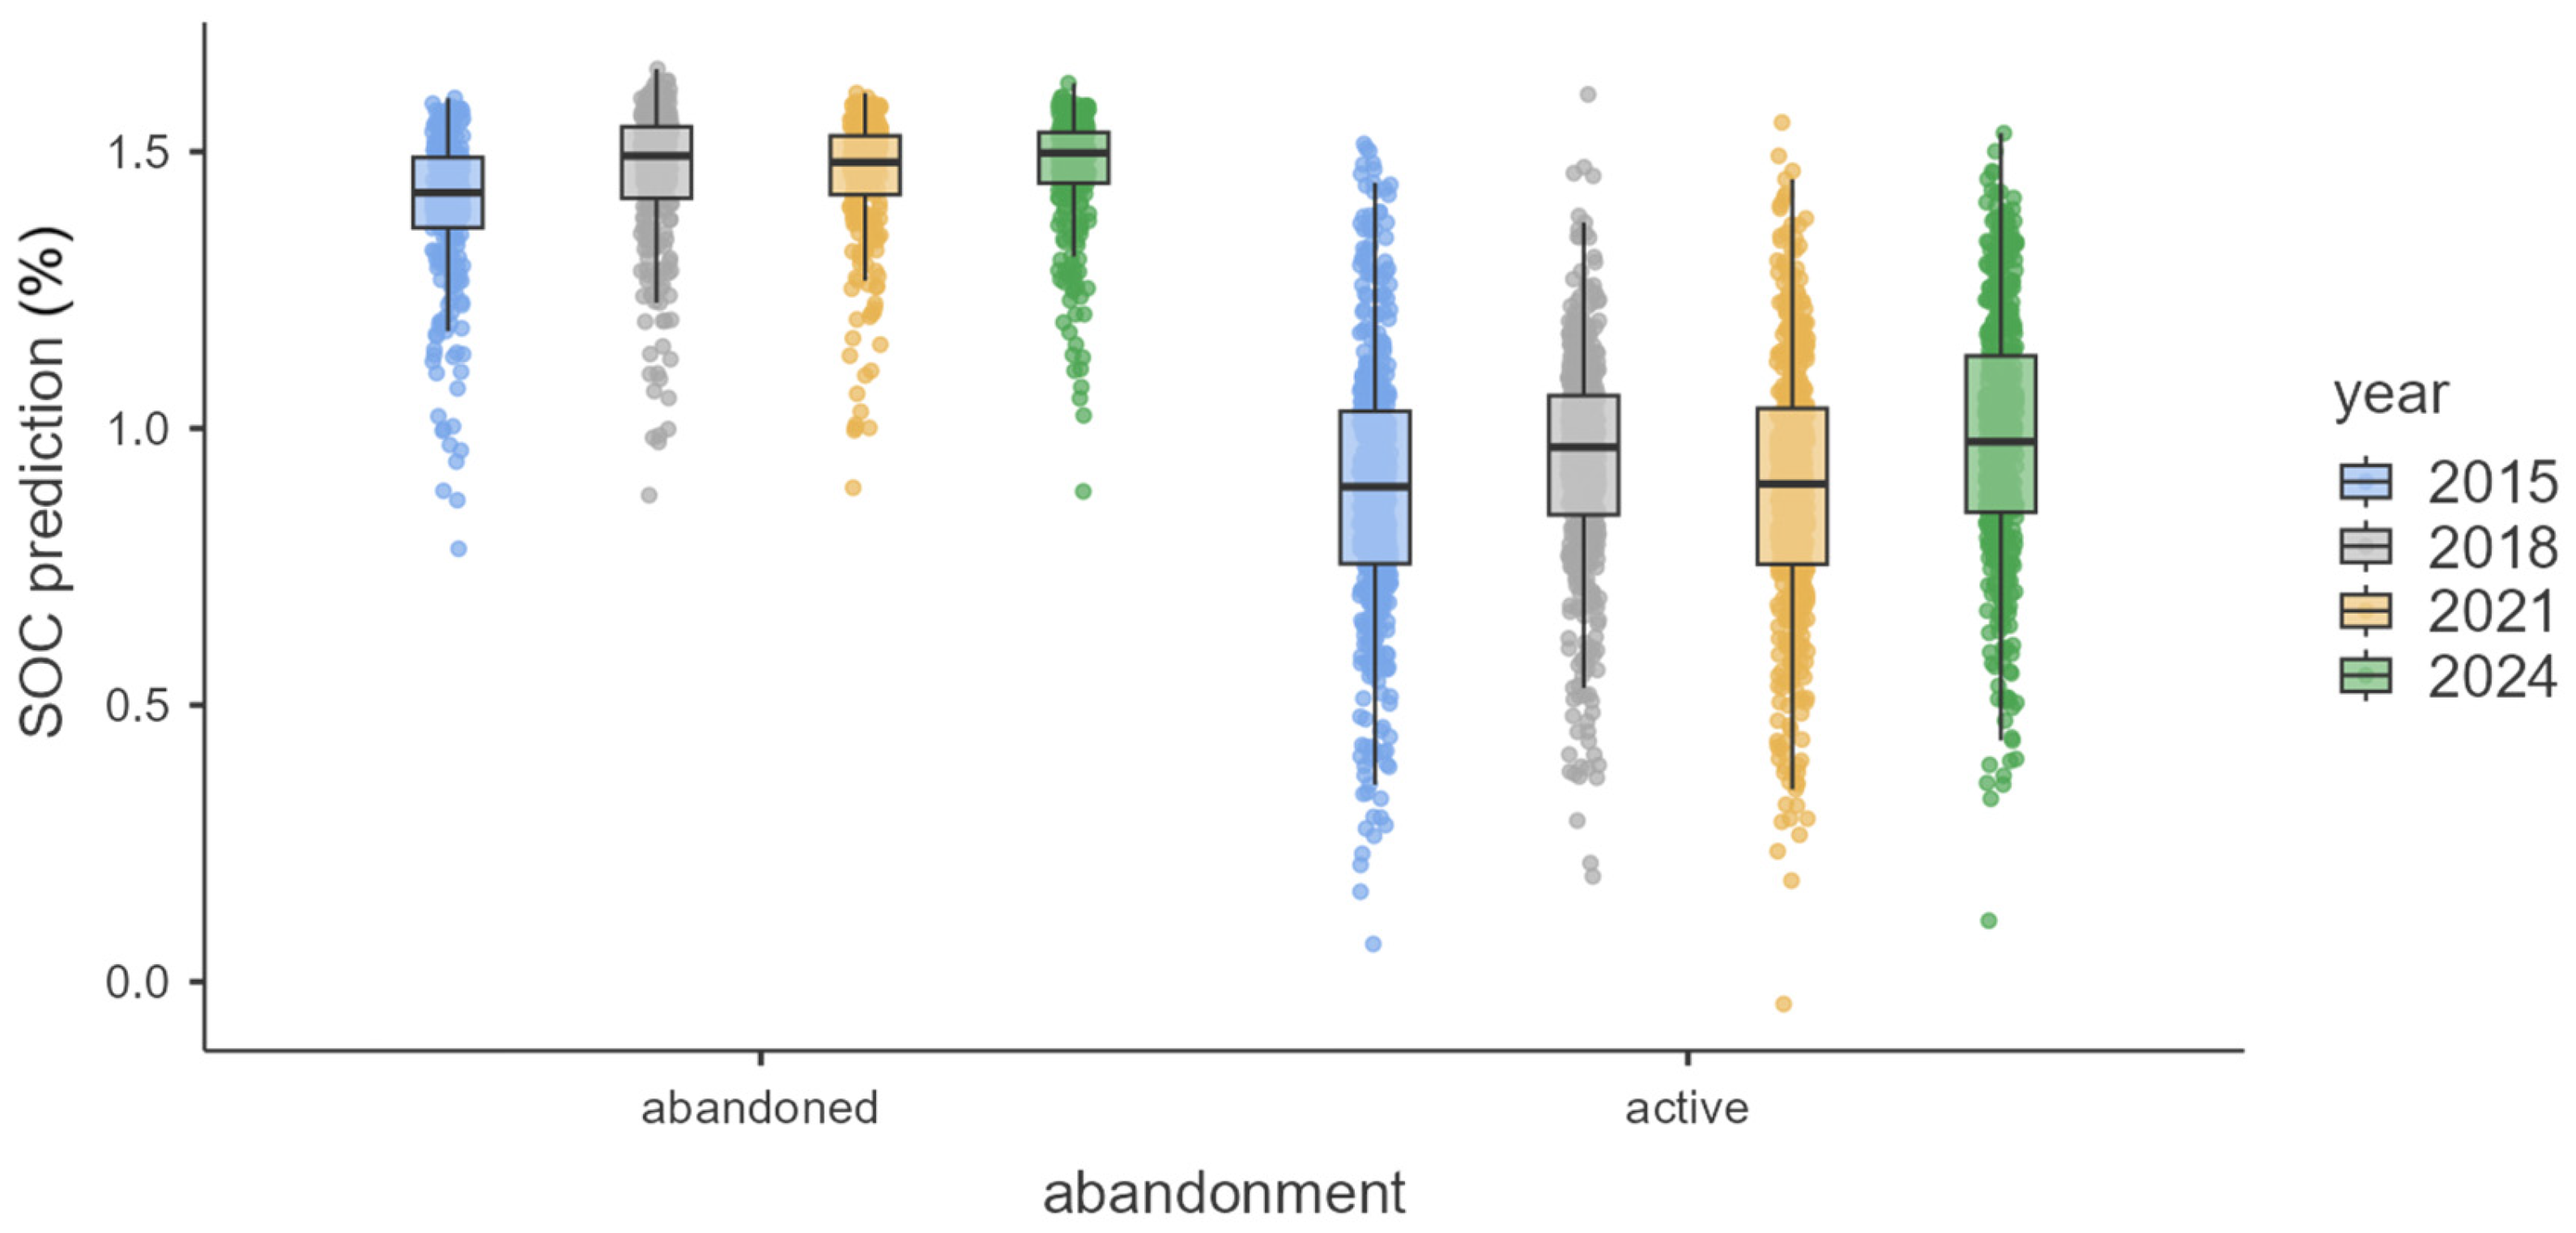
The Shapiro–Wilk test indicated that the data were not normally distributed (p < 0.05); therefore, the Kruskal–Wallis test was used for group comparisons. While abandoned areas consistently exhibited higher median SOC values overall (Figure 5), temporal analysis (Figure 6) revealed, despite minor year-to-year fluctuation, an overall increase in predicted SOC over time in actively managed olive groves.
BI and measured SOC showed the same between-plot ranking (SVC: lower BI, higher SOC; TILL: higher BI, lower SOC), supporting the interpretation that BI predominantly captures soil rather than canopy effects in these orchards under the same-date imagery. However, while BI can be sensitive to vegetative interference, its signal in these contexts remains ecologically meaningful, as plant cover itself contributes to carbon inputs and serves as a practical proxy for soil regeneration. The temporal trend further reinforces this: actively managed groves under SVC showed year-over-year increases in BI-predicted SOC, indicating effective carbon build-up in a context of increasing diffusion of low-disturbance practices.

3.3. Abandonment Identification Results

To evaluate the classification of abandoned versus active olive groves, we trained and validated three model variants (nano, small, medium) for each of four YOLO versions (v5, v8, v11, v12) with model variants from nano, small, and medium (Table 3). These variants differ in parameter count and computational complexity, allowing for a comparative analysis of detection performance. To validate the model, we used recall and precision metrics. The recall metric is important in our case as it shows the model’s efficacy in detecting as many instances as possible without missing them, whereas the precision metric shows how correctly the model is predicting instances. Among all the tested models, YOLOv12m achieved the highest recall for the “Abandoned” class (Table 3) and was therefore selected as the best model for this study. The differences in precision across the evaluated YOLO models and variants are due to their distinct architectural designs and varying parameter counts, which affect their ability to classify olive groves accurately. Furthermore, it also depends on the characteristics of the dataset, such as the visual distinctiveness of abandonment indicators, which may influence how well each model generalizes, contributing to the observed variations in precision. The results of validation are summarized in Table 3.
In this study, recall is the most critical evaluation metric, as the primary objective is to detect all instances of abandoned groves. Consequently, model performance is assessed with a focus on maximizing recall to minimize the risk of missing any abandoned areas. Among all tested models, YOLOv12m achieved the highest recall for the “Abandoned” class and was therefore selected as the optimal model for this study. An example of the algorithm output during the test phase is presented in Figure 7.

4. Discussion

The soil analysis results demonstrate the effectiveness of SVC in enhancing SOC without negatively impacting water availability, an especially critical parameter in semi-arid climates. The higher mean and broader range observed under TILL suggest a more heterogeneous soil water retention behavior, which may be influenced by structural changes or variable pore distribution due to tillage. The magnitude of this difference is noteworthy when placed in the context of Spanish dryland systems. According to Calvo de Anta et al. [52], the average SOC content in the top 30 cm of soils under woody crops (e.g., olive, almond, vineyard) across peninsular Spain is typically <1.0%, and even lower in semi-arid calcareous regions, with values ranging between 0.4% and 1.1%, depending on parent material, climate, and land-use intensity. This condition places the tilled SOC values from our study at the low end of the national average, while the SVC-treated plots are at or above the national mean, despite their location in semi-arid conditions. This finding also indicates that SVC contributes to increased organic carbon accumulation in the upper soil layer.
Conservation management generally raises SOC in Mediterranean/dryland croplands—including soils classified as Cambisols (≈Inceptisols, USDA)—and remote sensing now helps detect and monitor these changes. A Mediterranean meta-review of SOC estimation by remote sensing summarizes robust links between field SOC and optical/spectral predictors, enabling plot to regional-scale mapping and trend detection [53]. Recent continental efforts combine Earth observation with ground data to predict topsoil SOC at regional scales, underscoring the utility of satellite data for monitoring management outcomes [54]. In dryland olive and arable systems across Spain and Italy, conservation practices (cover crops, reduced/no till) consistently report higher SOC or reduced SOC losses relative to tilled/bare management, providing quantitative context for our observed SOC contrast [55].
The soils are strongly alkaline, with a mean pH of 8.39, and highly calcareous, averaging 57% CaCO3. These conditions are known to affect nutrient dynamics, microbial activity, and surface reflectance—a relevant factor for remote sensing applications.
The BI, derived from Sentinel-2 imagery, performed effectively as a spatial proxy for estimating SOC at the landscape scale. The calibration models, both external (Bergonza) and local (Alcocer), showed consistent predictive capacity, with the localized regression (Equation (3)) allowing for estimation of SOC across this landscape with abandoned areas and olive groves with different management histories. SOC predictions based on the BI are closely aligned with field measurements, although remote sensing primarily captures information from the uppermost soil layer, typically the richest in organic carbon [56]. Nevertheless, remote sensing enables SOC estimation across larger spatial extents and allows for temporal monitoring. This capability revealed a positive trend in SOC accumulation within actively managed olive groves over time. However, abandoned groves exhibited generally higher SOC levels, supported by the substantial presence of spontaneous vegetation. Our findings align with this model: even in dry and alkaline soils, SVC was sufficient to double SOC levels, suggesting that such interventions can shift these systems toward a more favorable carbon balance. The difference also supports the idea that SOC accumulation in semi-arid woody systems is highly management-dependent, and that the potential for carbon sequestration is undervalued if only land cover type is considered.
Although dense vegetation can sometimes obscure soil reflectance in remote sensing imagery, potentially reducing the direct sensitivity of BI to underlying soil properties, this limitation does not compromise its utility in SOC estimation. Because the selected plots share the olive canopy structure, the canopy signal of trees acts as a common-mode component; hence, plot-level BI differences are interpreted as arising primarily from inter-row ground conditions and soil, consistent with the well-documented inverse relation between soil brightness and SOC [57]. Furthermore, vegetation cover itself is a key ecological indicator of SOC [58,59], as stable, productive plant communities contribute significantly to organic matter accumulation [50]. Thus, even when BI primarily reflects vegetative signals, it remains a reliable proxy for SOC. Using BI during the growing season is therefore justified when the goal is to assess SOC under ecologically active and realistic land-use conditions, rather than under bare-soil scenarios.
It is well known that uncertainties may arise from the calibration of the band index used for abandonment detection, as sensor resolution, atmospheric corrections, and ground-truth density can influence reflectance accuracy [60]. In addition, the composition and phenology of cover crops may affect both spectral indices and SOC dynamics [61], while local heterogeneity in soil depth, slope, and microclimate [62,63] may further contribute to variability. These uncertainties, however, are unlikely to mask the clear spectral distinction observed between abandoned and managed groves. Regarding temporal dynamics, SOC changes are generally slow to emerge, often requiring years to decades to become statistically detectable [64], whereas vegetation structure responds within much shorter timescales (2–5 years), enabling earlier detection of abandonment through remote sensing [65]. Vegetation cover provides an early signal of abandonment within a few years, whereas measurable increases in SOC usually require much longer periods. This difference in response time means that monitoring results should be interpreted with the understanding that vegetation changes precede SOC accumulation.
Agricultural abandonment also alters SOC and can be tracked with remote sensing. A broader Mediterranean synthesis likewise found heterogeneous SOC outcomes after abandonment (gains, losses, or no change) driven by climate, parent material, and post-abandonment land cover [66]. Remote sensing methods to identify abandonment have matured: multi-year optical and SAR approaches can distinguish abandoned fields from temporary fallows and recultivation, enabling spatially explicit attribution of SOC trends to land-use trajectories [67]. Emerging attention-centric detectors such as YOLOv12 (incl. the medium variant YOLOv12m) are now being applied to high-resolution remote-sensing imagery to extract parcel- and object-level land-use signals.
The YOLOv12m model demonstrated strong performance in distinguishing abandoned from active olive groves, despite the absence of structured planting patterns [17]. This approach indicates that features such as canopy shape, vegetation texture, and spatial disorder provide enough visual clues for reliable detection. The performance of various YOLO architectures in detecting abandoned versus actively managed olive groves was evaluated through precision and recall metrics (Table 3). In this context, recall was prioritized to ensure maximum detection coverage of truly abandoned groves, acknowledging that omission errors (false negatives) could undermine ecological and policy analyses. Among all tested models, YOLOv12m (medium variant) emerged as the most balanced, achieving a recall of 0.559 and precision of 0.562 for the “Abandoned” class [68]. These values are considered moderate-to-strong within the constraints of visually ambiguous Mediterranean agroecosystems, where abandoned and regeneratively managed plots can appear similar in orthophotos. Models with slightly lower recall, such as YOLOv11n (recall = 0.524, precision = 0.602), still performed acceptably but were outpaced by YOLOv12m in overall detection efficiency. In contrast, some versions—particularly YOLOv8m—showed critically poor performance (precision = 0.018, recall = 0.403), likely due to overfitting or failure to generalize to heterogeneous vegetation structures. Across all models, detection of “Not Abandoned” groves yielded consistently higher recall values (ranging from 0.80 to 0.88), reflecting the relative ease of identifying visually ordered, managed systems.
Given the need to identify abandonment even in complex or transitional stages, YOLOv12m provides an effective compromise between detection sensitivity and false positive control. However, it is important to note that dense SVC in irregularly planted olive groves may visually mimic abandonment, potentially leading to misclassification. This condition reinforces the recommendation for future studies to combine object detection models with spectral proxies (e.g., BI-based SOC maps) and, where possible, temporal vegetation profiles to avoid misinterpretation of ecologically beneficial practices as land abandonment.

5. Conclusions

Abandoned traditional agricultural fields can trigger ecological regeneration through spontaneous vegetation growth, leading to improved SOC. The integrated framework combining deep learning and remote sensing can detect abandonment and assess its ecological implications. The YOLOv12 object detection model accurately distinguished abandoned from actively managed groves based on canopy structure and spatial vegetation patterns. Concurrently, SOC estimated by remotely sensed BI served as a reliable proxy for topsoil carbon content in this study. Field surveys confirmed that both abandoned and low-disturbance managed groves exhibit significantly higher SOC than conventionally tilled systems. These findings demonstrate that in Mediterranean semiarid olive agroecosystems, the spectral brightness of soils (BI) and vegetation structure detected via deep learning models (YOLO) can jointly serve as reliable proxies to detect abandonment and track ecological regeneration, as evidenced by increasing SOC. The integrated framework offers a dual-function monitoring tool, enabling identification of land abandonment while quantifying soil regeneration, with direct implications for agri-environmental policies, carbon accounting, and climate adaptation in dryland agriculture.

Author Contributions

Conceptualization, G.M. and M.J.M.P.; methodology, G.M., J.E.H.-L., M.J.M.P. and S.A.; software, S.A.; validation, M.J.M.P. and C.T.; formal analysis, J.E.H.-L., A.M.-D. and B.S.; investigation, J.E.H.-L. and G.M.; data curation, J.E.H.-L., G.M. and S.A.; writing—original draft preparation, G.M., M.J.M.P. and S.A.; writing—review and editing, G.M. and M.J.M.P.; project administration and funding acquisition, B.S., M.J.M.P. and V.V. All authors have read and agreed to the published version of the manuscript.

Funding

This research was funded by EJP Soil (Grant Agreement No.862695 SANCHOSTHIRST), by the European Union—NextGenerationEU, Mission 4 Component 1.5—ECS00000036-CUP F17G22000190007, and Confagricoltura Pavia, Sezione Vino, and PNRR’s NODES Spoke6VINO.

Institutional Review Board Statement

Not applicable.

Informed Consent Statement

Not applicable.

Data Availability Statement

The original data presented in the study are openly available in Zenodo [69] “16607599”. The archive includes raster predictions of Soil Organic Carbon (SOC), Brightness Index (BI) layers, ground-truth field data, and object detection datasets used for the YOLO models. A README file provides the description of each file.

Acknowledgments

The authors gratefully acknowledge the collaboration of the owners of Olivares La Común (Guadalajara). During the preparation of this manuscript, the authors used ChatGPT (GPT-4-turbo, OpenAI, San Francisco, CA, USA, 2025) for the purposes of text editing and generation. The authors have reviewed and edited the output and take full responsibility for the content of this publication.

Conflicts of Interest

The authors declare no conflicts of interest. The funders had no role in the design of the study; in the collection, analyses, or interpretation of data; in the writing of the manuscript; or in the decision to publish the results.

References

  1. Bonfante, A.; Monaco, E.; Langella, G.; Mercogliano, P.; Bucchignani, E.; Manna, P.; Terribile, F. A Dynamic Viticultural Zoning to Explore the Resilience of Terroir Concept under Climate Change. Sci. Total Environ. 2018, 624, 294–308. [Google Scholar] [CrossRef] [PubMed]
  2. Caubel, J.; García De Cortázar-Atauri, I.; Launay, M.; De Noblet-Ducoudré, N.; Huard, F.; Bertuzzi, P.; Graux, A.-I. Broadening the Scope for Ecoclimatic Indicators to Assess Crop Climate Suitability According to Ecophysiological, Technical and Quality Criteria. Agric. For. Meteorol. 2015, 207, 94–106. [Google Scholar] [CrossRef]
  3. Malanson, G.P.; Nelson, E.L.; Zimmerman, D.L.; Fagre, D.B. Alpine Plant Community Diversity in Species–Area Relations at Fine Scale. Arct. Antarct. Alp. Res. 2020, 52, 41–46. [Google Scholar] [CrossRef]
  4. White, F.J. Two Decades of Climate Change Alters Seed Longevity in an Alpine Herb: Implications for Ex Situ Seed Conservation. Alp. Bot. 2023, 133, 11–20. [Google Scholar] [CrossRef]
  5. Kikstra, J.S.; Nicholls, Z.R.J.; Smith, C.J.; Lewis, J.; Lamboll, R.D.; Byers, E.; Sandstad, M.; Meinshausen, M.; Gidden, M.J.; Rogelj, J.; et al. The IPCC Sixth Assessment Report WGIII Climate Assessment of Mitigation Pathways: From Emissions to Global Temperatures. Geosci. Model Dev. 2022, 15, 9075–9109. [Google Scholar] [CrossRef]
  6. Rocourt, J.; BenEmbarek, P.; Toyofuku, H.; Schlundt, J. Quantitative Risk Assessment of Listeria monocytogenes in Ready-to-eat Foods: The FAO/WHO Approach. FEMS Immunol. Med. Microbiol. 2003, 35, 263–267. [Google Scholar] [CrossRef]
  7. Zhang, R.; Qi, J.; Leng, S.; Wang, Q. Long-Term Vegetation Phenology Changes and Responses to Preseason Temperature and Precipitation in Northern China. Remote Sens. 2022, 14, 1396. [Google Scholar] [CrossRef]
  8. Ruiz-Colmenero, M.; Bienes, R.; Marques, M.J. Soil and Water Conservation Dilemmas Associated with the Use of Green Cover in Steep Vineyards. Soil Tillage Res. 2011, 117, 211–223. [Google Scholar] [CrossRef]
  9. Bommarco, R.; Kleijn, D.; Potts, S.G. Ecological Intensification: Harnessing Ecosystem Services for Food Security. Trends Ecol. Evol. 2013, 28, 230–238. [Google Scholar] [CrossRef]
  10. Kruidhof, H.M.; Bastiaans, L.; Kropff, M.J. Ecological Weed Management by Cover Cropping: Effects on Weed Growth in Autumn and Weed Establishment in Spring. Weed Res. 2008, 48, 492–502. [Google Scholar] [CrossRef]
  11. Kopta, T.; Pokluda, R.; Psota, V. Attractiveness of Flowering Plants for Natural Enemies. Hortic. Sci. 2012, 39, 89–96. [Google Scholar] [CrossRef]
  12. Thomson, L.J.; Hoffmann, A.A. Spatial Scale of Benefits from Adjacent Woody Vegetation on Natural Enemies within Vineyards. Biol. Control 2013, 64, 57–65. [Google Scholar] [CrossRef]
  13. Miles, A.; Wilson, H.; Altieri, M.; Nicholls, C. Habitat Diversity at the Field and Landscape Level: Conservation Biological Control Research in California Viticulture. In Arthropod Management in Vineyards; Bostanian, N.J., Vincent, C., Isaacs, R., Eds.; Springer: Dordrecht, The Netherlands, 2012; pp. 159–189. ISBN 978-94-007-4031-0. [Google Scholar]
  14. Fiera, C.; Ulrich, W.; Popescu, D.; Bunea, C.-I.; Manu, M.; Nae, I.; Stan, M.; Markó, B.; Urák, I.; Giurginca, A.; et al. Effects of Vineyard Inter-Row Management on the Diversity and Abundance of Plants and Surface-Dwelling Invertebrates in Central Romania. J. Insect Conserv. 2020, 24, 175–185. [Google Scholar] [CrossRef]
  15. Leite, D.; Teixeira, I.; Morais, R.; Sousa, J.J.; Cunha, A. Comparative Analysis of CNNs and Vision Transformers for Automatic Classification of Abandonment in Douro’s Vineyard Parcels. Remote Sens. 2024, 16, 4581. [Google Scholar] [CrossRef]
  16. Teixeira, I.; Sousa, J.J.; Cunha, A. Automatic Classification of Abandonment in Douro’s Vineyard Parcels. Procedia Comput. Sci. 2024, 239, 2038–2047. [Google Scholar] [CrossRef]
  17. Badgujar, C.M.; Poulose, A.; Gan, H. Agricultural Object Detection with You Only Look Once (YOLO) Algorithm: A Bibliometric and Systematic Literature Review. Comput. Electron. Agric. 2024, 223, 109090. [Google Scholar] [CrossRef]
  18. González-Leonardo, M.; López-Gay, A.; Recaño, J. Brain Drain and the Second Wave of Depopulation; Centre d’Estudis Demogràfics: Bellaterra, Spain, 2019. [Google Scholar]
  19. Gallardo, M.; Fernández-Portela, J.; Cocero, D.; Vilar, L. Land Use and Land Cover Changes in Depopulated Areas of Mediterranean Europe: A Case Study in Two Inland Provinces of Spain. Land 2023, 12, 1967. [Google Scholar] [CrossRef]
  20. Lloret, F.; Escudero, A.; Lloret, J.; Valladares, F. An Ecological Perspective for Analysing Rural Depopulation and Abandonment. People Nat. 2024, 6, 490–506. [Google Scholar] [CrossRef]
  21. Santos, J.L. Desploblación y periurbanización en la Alcarria. In Anales de Geografía de la Universidad Complutense; Ediciones Complutense: Madrid, Spain, 2024. [Google Scholar]
  22. Alonso, J.-J.G.-A.; Martínez, E.-D.G. Vegetation/Land Cover of a UTM-Hectad in Utande (La Alcarria, Central Spain). J. Maps 2023, 19, 2139202. [Google Scholar] [CrossRef]
  23. Gholizadeh, A.; Žižala, D.; Saberioon, M.; Borůvka, L. Soil Organic Carbon and Texture Retrieving and Mapping Using Proximal, Airborne and Sentinel-2 Spectral Imaging. Remote Sens. Environ. 2018, 218, 89–103. [Google Scholar] [CrossRef]
  24. Escadafal, R. Remote Sensing of Arid Soil Surface Color with Landsat Thematic Mapper. Adv. Space Res. 1989, 9, 159–163. [Google Scholar] [CrossRef]
  25. Todd, S.W.; Hoffer, R.M. Responses of Spectral Indices to Variations in Vegetation Cover and Soil Background. Photogramm. Eng. Remote Sens. 1998, 64, 915–922. [Google Scholar]
  26. Kunkel, V.R.; Wells, T.; Hancock, G.R. Modelling Soil Organic Carbon Using Vegetation Indices across Large Catchments in Eastern Australia. Sci. Total Environ. 2022, 817, 152690. [Google Scholar] [CrossRef]
  27. AEMET (Agencia Estatal de Meteorología). Valores Climatológicos Normales. Estación El Serranillo (3168C), Periodo 1981–2010. Available online: https://www.aemet.es/es/serviciosclimaticos/datosclimatologicos/valoresclimatologicos (accessed on 17 July 2025).
  28. Carter, M.R.; Gregorich, E.G. Soil Sampling and Methods of Analysis, 2nd ed.; CRC Press: Boca Raton, FL, USA, 2008; ISBN 978-0-8493-3586-0. [Google Scholar]
  29. IUSS. Working Group WRB World Reference Base for Soil Resources. International Soil Classification System for Naming Soils and Creating Legends for Soil Maps, 4th ed.; International Union of Soil Sciences (IUSS): Vienna, Austria, 2022. [Google Scholar]
  30. Ballesta, R.J.; Pérez-de-los-Reyes, C.; Amorós, A.; Bravo, S.; Navarro, F.J.G. Edafodiversidad en viñedos de Castilla-La Mancha, España. E3S Web Conf. 2018, 50, 01026. [Google Scholar] [CrossRef]
  31. A Protocol for Measurement, Monitoring, Reporting and Verification of Soil Organic Carbon in Agricultural Landscapes: GSOC MRV Protocol; Food and Agriculture Organization of the United Nations: Rome, Italy, 2020; ISBN 978-92-5-133126-2.
  32. Gowing, C. Standard Operating Procedure for Soil Calcium Carbonate Equivalent—Volumetric Calcimeter Method; Food and Agriculture Organization: Rome, Italy, 2021. [Google Scholar]
  33. Bouyoucos, G.J. Hydrometer Method Improved for Making Particle Size Analyses of Soils. Agron. J. 1962, 54, 464–465. [Google Scholar] [CrossRef]
  34. Walkley, A.; Black, I.A. An Examination of the Degtjareff Method for Determining Soil Organic Matter, and a Proposed Modification of the Chromic Acid Titration Method. Soil Sci. 1934, 37, 29–38. [Google Scholar] [CrossRef]
  35. Standard Operating Procedure for Soil Bulk Density, Cylinder Method; FAO: Rome, Italy, 2023.
  36. Richards, L.A. A Pressure-Membrane Extraction Apparatus for Soil Solution. Soil Sci. 1941, 51, 377–386. [Google Scholar] [CrossRef]
  37. Cagney, J.; Cox, S.E.; Booth, D.T. Comparison of Point Intercept and Image Analysis for Monitoring Rangeland Transects. Rangel. Ecol. Manag. 2011, 64, 309–315. [Google Scholar] [CrossRef]
  38. Booth, D.T.; Cox, S.E.; Berryman, R.D. Point Sampling Digital Imagery with ‘Samplepoint’. Environ. Monit. Assess. 2006, 123, 97–108. [Google Scholar] [CrossRef]
  39. Hulvey, K.B.; Thomas, K.; Thacker, E. A Comparison of Two Herbaceous Cover Sampling Methods to Assess Ecosystem Services in High-Shrub Rangelands: Photography-Based Grid Point Intercept (GPI) Versus Quadrat Sampling. Rangelands 2018, 40, 152–159. [Google Scholar] [CrossRef]
  40. USDA Agricultural Research Service products and services. SamplePoint; USDA Agricultural Research Service: Washington, DC, USA, 2009. [Google Scholar]
  41. QGIS Association. QGIS Geographic Information System; QGIS Association: Gruthe, Switzerland, 2024. [Google Scholar]
  42. O.A. Centro Nacional de Información Geográfica; Fondo Español de Garantía Agraria; Principado de Asturias, Comunidad Autónoma de Cantabría; Comunidad de Madrid; Comunidad Autónoma de Galicia; Comunidad Foral de Navarra; Comunidad Autónoma de La Rioja y Eusko Jaurltaritza/Gobierno Vasco PNOA 2023 CC-BY 4.0 Instituto Geográfico Nacional 2023. Available online: https://centrodedescargas.cnig.es/ (accessed on 2 April 2025).
  43. Copernicus Sentinel Data. Available online: https://browser.dataspace.copernicus.eu/ (accessed on 2 April 2025).
  44. StatSoft, Inc. STATISTICA; Data Analysis Software System; StatSoft, Inc.: Tulsa, OK, USA, 2011. [Google Scholar]
  45. R Core Team. R: A Language and Environment for Statistical Computing; R Core Team: Vienna, Austria, 2024. [Google Scholar]
  46. The jamovi project Jamovi; Jamovi Team: Sydney, Austria, 2024.
  47. Anwar, S.; Marchese, G.; Toffanin, C.; Vaglia, V. Vineyard condition detection method using Google Earth Images and the YOLOv8 model in Northern Italy. In Proceedings of the EGU General Assembly 2025, Vienna, Austria, 27 April–2 May 2025. EGU25-981. [Google Scholar] [CrossRef]
  48. Roboflow: Computer Vision and Dataset Management Platform; Roboflow Inc.: Des Moines, IA, USA, 2024; Available online: https://roboflow.com/ (accessed on 6 June 2025).
  49. Ultralytics. YOLOv12: Real-Time Object Detection; Ultralytics: London, UK, 2024; Available online: https://github.com/ultralytics/ (accessed on 23 June 2025).
  50. Lal, R. Soil Carbon Sequestration to Mitigate Climate Change. Geoderma 2004, 123, 1–22. [Google Scholar] [CrossRef]
  51. Grilli, E. Critical Range of Soil Organic Carbon in Southern Europe Lands under Desertification Risk. J. Environ. Manag. 2021, 287, 112285. [Google Scholar] [CrossRef] [PubMed]
  52. Calvo De Anta, R.; Luís, E.; Febrero-Bande, M.; Galiñanes, J.; Macías, F.; Ortíz, R.; Casás, F. Soil Organic Carbon in Peninsular Spain: Influence of Environmental Factors and Spatial Distribution. Geoderma 2020, 370, 114365. [Google Scholar] [CrossRef]
  53. Angelopoulou, T.; Tziolas, N.; Balafoutis, A.; Zalidis, G.; Bochtis, D. Remote Sensing Techniques for Soil Organic Carbon Estimation: A Review. Remote Sens. 2019, 11, 676. [Google Scholar] [CrossRef]
  54. van Wesemael, B.; Abdelbaki, A.; Ben-Dor, E.; Chabrillat, S. A European Soil Organic Carbon Monitoring System Leveraging Sentinel 2 Imagery and the LUCAS Soil Data Base. Geoderma 2024, 452, 117113. [Google Scholar] [CrossRef]
  55. Muñoz-Rojas, M.; Jordán, A.; Zavala, L.M.; De la Rosa, D.; Abd-Elmabod, S.K.; Anaya-Romero, M. Organic Carbon Stocks in Mediterranean Soil Types under Different Land Uses (Southern Spain). Solid Earth 2012, 3, 375–386. [Google Scholar] [CrossRef]
  56. Wang, L.; Li, Z.; Wang, D.; Liao, S.; Nie, X.; Liu, Y. Factors Controlling Soil Organic Carbon with Depth at the Basin Scale. Catena 2022, 217, 106478. [Google Scholar] [CrossRef]
  57. Stoner, E.R.; Baumgardner, M.F. Characteristic Variations in Reflectance of Surface Soils. Soil Sci. Soc. Am. J. 1981, 45, 1161–1165. [Google Scholar] [CrossRef]
  58. Li, T.; Cui, L.; Kuhnert, M.; McLaren, T.I.; Pandey, R.; Liu, H.; Wang, W.; Xu, Z.; Xia, A.; Dalal, R.C.; et al. A Comprehensive Review of Soil Organic Carbon Estimates: Integrating Remote Sensing and Machine Learning Technologies. J. Soils Sediments 2024, 24, 3556–3571. [Google Scholar] [CrossRef]
  59. Van Wesemael, B.; Chabrillat, S.; Sanz Dias, A.; Berger, M.; Szantoi, Z. Remote Sensing for Soil Organic Carbon Mapping and Monitoring. Remote Sens. 2023, 15, 3464. [Google Scholar] [CrossRef]
  60. Forkuor, G. Landsat-8 vs. Sentinel-2: Examining the Added Value of Sentinel-2′s Red-Edge Bands to Land-Use and l. GIScience Remote Sens. 2018, 55, 331–354. [Google Scholar] [CrossRef]
  61. Yang, L. Improving Prediction of Soil Organic Carbon Content in Croplands Using Phenological Parameters Extracted from NDVI Time Series Data. Soil Tillage Res. 2020, 196, 104465. [Google Scholar] [CrossRef]
  62. Fan, B. Soil Micro-Climate Variation in Relation to Slope Aspect, Position, and Curvature in a Forested Catchment. Agric. For. Meteorol. 2020, 290, 107999. [Google Scholar] [CrossRef]
  63. Seyfried, M.; Flerchinger, G.; Bryden, S.; Link, T.; Marks, D.; McNamara, J. Slope and Aspect Controls on Soil Climate: Field Documentation and Implications for Large-scale Simulation of Critical Zone Processes. Vadose Zone J. 2021, 20, e20158. [Google Scholar] [CrossRef]
  64. Poeplau, C.; Don, A. Sensitivity of Soil Organic Carbon Stocks and Fractions to Different Land-Use Changes across Europe. Geoderma 2013, 192, 189–201. [Google Scholar] [CrossRef]
  65. Estel, S.; Kuemmerle, T.; Alcántara, C.; Levers, C.; Prishchepov, A.; Hostert, P. Mapping Farmland Abandonment and Recultivation across Europe Using MODIS NDVI Time Series. Remote Sens. Environ. 2015, 163, 312–325. [Google Scholar] [CrossRef]
  66. Bell, S.M. Soil Organic Carbon Accumulation Rates on Mediterranean Abandoned Agricultural Lands. Sci. Total Environ. 2021, 759, 143535. [Google Scholar] [CrossRef]
  67. Yin, H. Mapping Agricultural Land Abandonment from Spatial and Temporal Segmentation of Landsat Time Series. Remote Sens. Environ. 2018, 210, 12–24. [Google Scholar] [CrossRef]
  68. Sapkota, R.; Meng, Z.; Churuvija, M.; Du, X.; Ma, Z.; Karkee, M. Comprehensive Performance Evaluation of YOLOv12, YOLO11, YOLOv10, YOLOv9 and YOLOv8 on Detecting and Counting Fruitlet in Complex Orchard Environments. arXiv 2025, arXiv:2407.12040. [Google Scholar]
  69. Marchese, G.; Herranz-Luque, J.E.; Anwar, S.; Vaglia, V.; Toffanin, C.; Moreno-Delafuente, A.; Sastre, B.; Marques, M.J. Data deposit and Images Article Title “Soil Management and Abandonment Detection in Mediterranean Olive Groves under Climate Stress: A Case Study from Central Spain”; Zenodo: Geneva, Switzerland, 2025. [Google Scholar] [CrossRef]
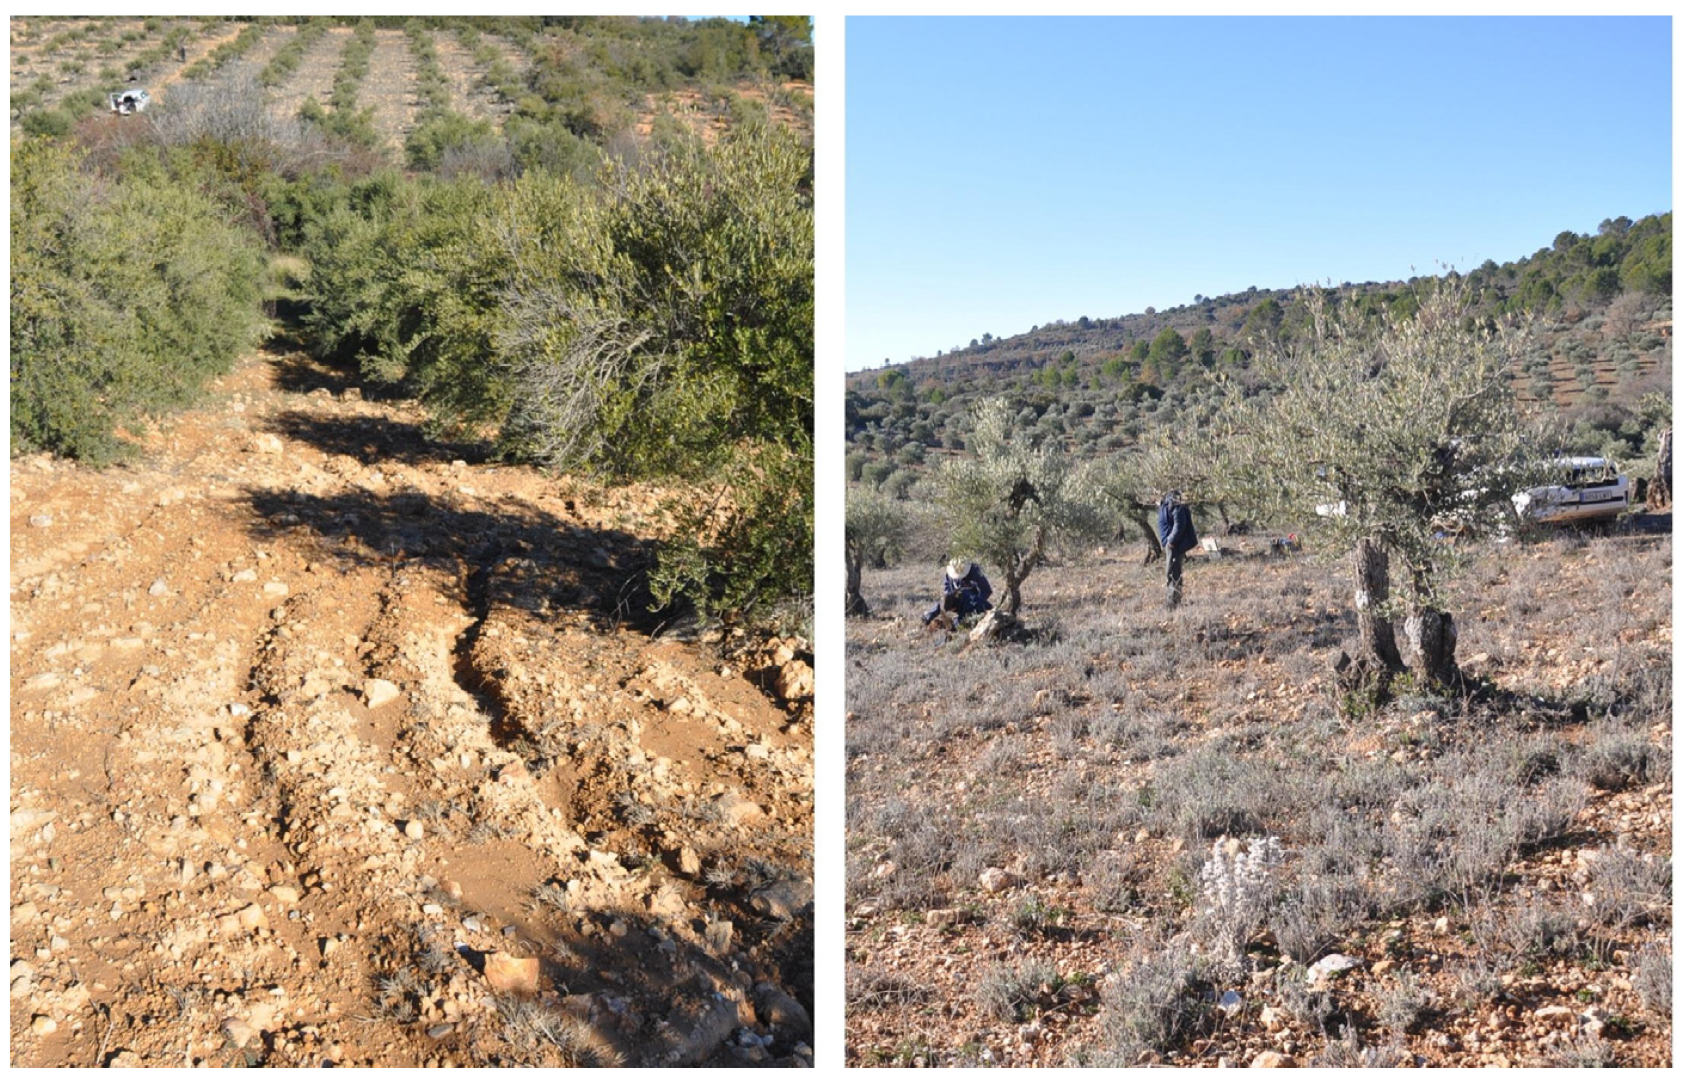
Figure 1. Adjacent olive groves under contrasting management. (Left) An overview of both plots: foreground = tilled (TILL) grove with a bare, gravel-rich surface and wheel-track microrelief on shallow, stony soil; background = neighboring grove managed with spontaneous vegetation cover (SVC). (Right) Detail of the SVC plot showing a continuous low-stature understory between tree rows.
Soilsystems 09 00118 g001
Figure 2. (a) Study area; Ortophotos from Centro Nacional de Información Geográfica (CNIG) [42]; (b) Derived SOC prediction raster of the study area. Modified Copernicus Sentinel data 2024 processed in Copernicus Browser [43].
Soilsystems 09 00118 g002
Figure 3. Soil organic carbon (SOC, %) and plant-available water (% vol) under contrasting management. Left: SOC in the 0–10 cm layer. Right: plant-available water (field capacity − wilting point). Management: SCV = spontaneous vegetation cover; tillage = frequently tilled alleys. Boxes show the non-outlier range with the median as the central line; whiskers indicate the 5th–95th percentiles; outliers and extremes (if present) are marked by open circles and asterisks. n = 3 composite samples per plot (two 2 ha plots). Differences were evaluated with Kruskal–Wallis/Mann–Whitney tests (α = 0.05).
Soilsystems 09 00118 g003
Figure 4. Comparison of the SOC prediction from two active groves with a different management (SVC vs. tillage); Kruskal–Wallis: H=5.78; p = 0.016. Points represent values predicted using Equation (3).
Soilsystems 09 00118 g004
Figure 5. Comparison of the SOC prediction from abandoned and active groves (H = 1914; p < 0.001). Points represent values predicted using Equation (3).
Soilsystems 09 00118 g005
Figure 6. Temporal evolution of predicted SOC in Alcocer: while the abandoned groves show higher and stable values, the active groves are increasing their SOC year by year (H = 32.6; p < 0.001). Points represent values predicted using Equation (3).
Soilsystems 09 00118 g006
Figure 7. Results of the YOLO algorithm test. Bounding boxes indicate the detected olive groves, classified by the model as either abandoned or actively managed. The bounding boxes are overlaid on the images, each annotated with a class label and a confidence score. The results are shown without any post-processing.
Soilsystems 09 00118 g007
Table 1. Ground-truth data from the Alcocer area. Soil depth 0 to 10 cm (n = 3). Summary statistics of soil properties of two active olive groves under different management practices. Values are presented as mean (standard deviation), along with the median and interquartile range (25th and 75th percentiles). Significant differences between managements (p < 0.05) established through the Kruskal–Wallis test, are marked with “*”.
VariablesManagementMean (Std)Q-25MedianQ-75K-W Test
Soil pHCC8.24 (0.03)8.228.248.27*
TILL8.47 (0.04)8.448.468.52
CaCO3 (%)CC49.9 (3.1)47.748.553.4*
TILL62.1 (2.8)58.963.663.8
Bulk density (Mg/m3)CC1.44 (0.16)1.251.531.54
TILL1.31 (0.18)1.141.311.49
Sand (%)CC48 (13)404264
TILL41 (3)394045
Silt (%)CC25 (5)202530*
TILL36 (5)323542
Clay (%)CC26 (10)162835
TILL22 (4)182326
>2 mm (%)CC32 (2)293234
TILL25 (5)202430
E.C. (dS/m)CC0.12 (0.01)0.1160.1180.13*
TILL0.10 (0.00)0.0960.0970.10
Veg. Biomass (Mg/ha)CC4.95 (0.78)4.174.945.74*
TILL0.54 (0.24)0.310.500.79
Soil cover (%)CC41.0 (11.5)34.334.354.3*
TILL1 (0)1.01.01.0
Field capacity (% vol)CC36.33 (2.99)32.9237.5538.50
TILL36.69 (2.31)34.6136.2939.18
Perm. Wilting p. (% vol)CC26.83 (3.46)22.9428.0129.54
TILL21.03 (6.07)14.9621.0527.09
Note: CC = spontaneous vegetation cover; TILL: tilled soils; E.C. = electrical conductivity; Perm. Wilting p. = Permanent wilting point.
Table 2. Equation (3) coefficients; model fit measures: R = 0.979, R2 = 0.958; N = 6.
Model Coefficients—SOC Prediction
PredictorEstimateSEtp
Intercept2.170.15414.03<0.001
BI−5.810.609−9.54<0.001
Note: SE = standard error; t = t-value; p = p-value.
Table 3. Comparison of the YOLO models for the detection of abandoned and active olive groves in terms of precision and recall metrics on the validation set.
ModelVariantClassPrecision
(Validation)
Recall
(Validation)
YOLOv5n (nano)Abandoned0.5270.557
Not Abandoned0.7010.844
s (small)Abandoned0.5770.518
Not Abandoned0.7360.852
m (medium)Abandoned0.5890.540
Not Abandoned0.7820.805
YOLOv8n (nano)Abandoned0.5340.536
Not Abandoned0.7210.844
s (small)Abandoned0.5910.515
Not Abandoned0.7720.816
m (medium)Abandoned0.01820.403
Not Abandoned0.01800.474
YOLOv11n (nano)Abandoned0.6020.524
Not Abandoned0.7210.863
s (small)Abandoned0.6000.479
Not Abandoned0.7780.844
m (medium)Abandoned0.5770.544
Not Abandoned0.7700.803
YOLOv12n (nano)Abandoned0.5740.521
Not Abandoned0.7830.875
s (small)Abandoned0.5360.526
Not Abandoned0.7610.842
m (medium)Abandoned0.5620.559
Not Abandoned0.7540.833
Disclaimer/Publisher’s Note: The statements, opinions and data contained in all publications are solely those of the individual author(s) and contributor(s) and not of MDPI and/or the editor(s). MDPI and/or the editor(s) disclaim responsibility for any injury to people or property resulting from any ideas, methods, instructions or products referred to in the content.